sentara healthcare - becker's hospital review · sentara healthcare 130 year not-for-profit...
TRANSCRIPT

Sentara HealthcareJourney to Top System Performance
Howard P. Kern, FACHE
President & CEO
Sentara Healthcare
1

Overview
I. Organizational Overview
II. Guiding Principles
III. 5 Keys to Success
IV. Performance Improvement
2
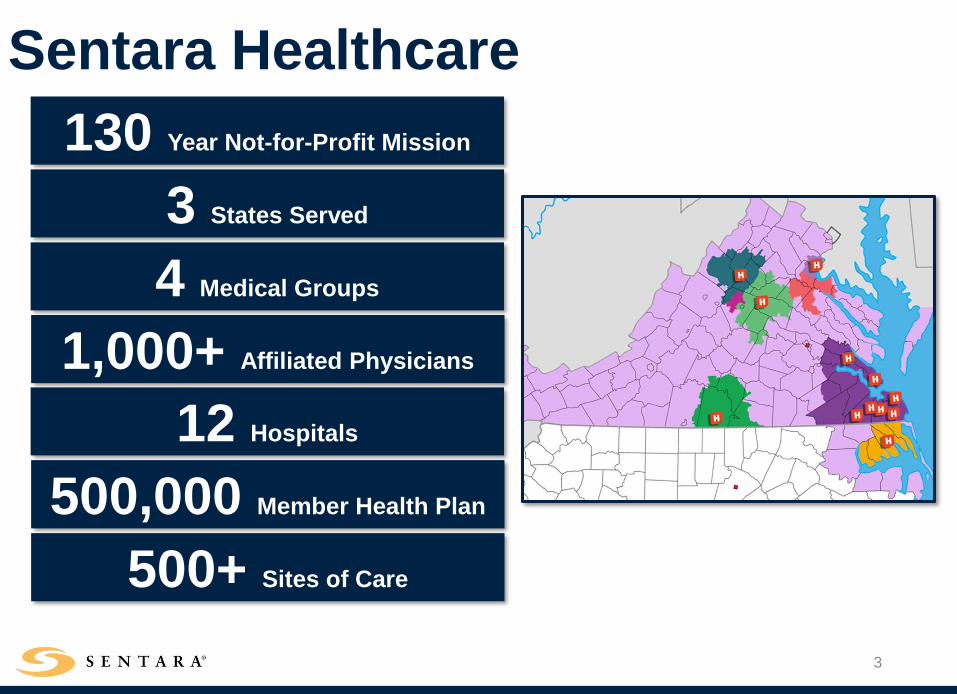
Sentara Healthcare
130 Year Not-for-Profit Mission
3 States Served
4 Medical Groups
1,000+ Affiliated Physicians
12 Hospitals
500,000 Member Health Plan
500+ Sites of Care
3

In 2013…
4
If we are not improving at a rate equal to or better than our
peers, we are getting worse.
Our patients deserved more.
We were falling behind

..due to:
5
Fragmented Implementation

..due to:
6
Siloed Organization Structure

..due to:
7
Focusing on Too Many Things
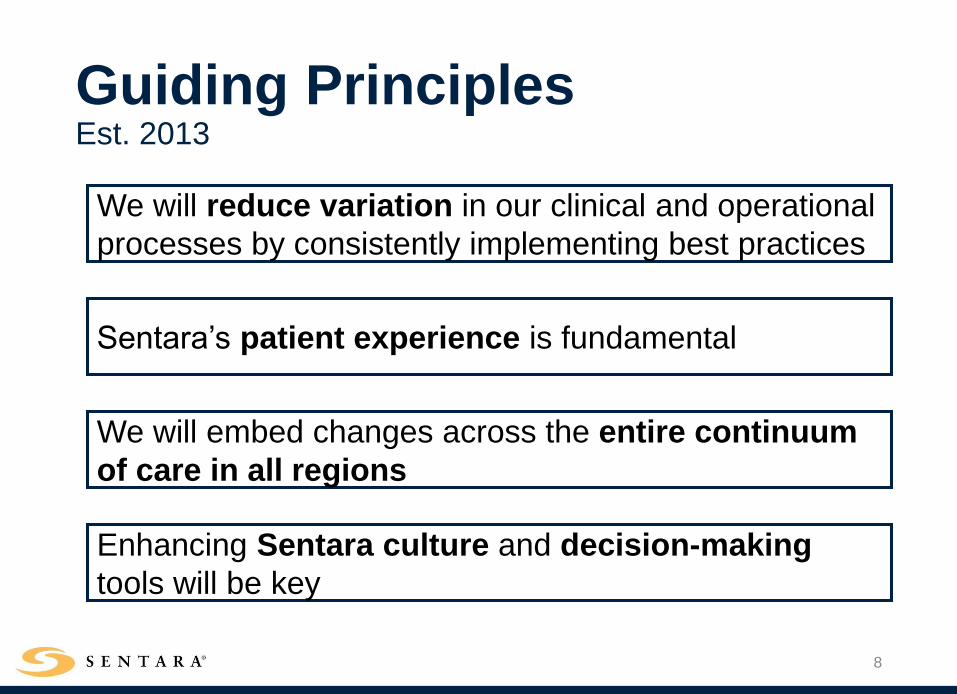
Guiding PrinciplesEst. 2013
8
We will reduce variation in our clinical and operational
processes by consistently implementing best practices
Sentara’s patient experience is fundamental
We will embed changes across the entire continuum
of care in all regions
Enhancing Sentara culture and decision-making
tools will be key
High Performance Design Structure
9

10
High Performance Design StructureClassic Three-Legged Stool
MEDICAL GROUPS
LONG-TERM CARE
HOME HEALTH/ HOSPICE
Sentara BOD
CEOCEO Workgroup
Medical Staffs
HOSPITALS
CVPs
COO
CMO SQCN

11
High Performance Design StructureClinical Leadership Council
MEDICAL GROUPS
LONG-TERM CARE
HOME HEALTH/ HOSPICE
Sentara BOD
CEOCEO Workgroup
Medical Staffs
HOSPITALS
ClinicalLeadership
Council CVPs
COO
CMO
SQCN

12
High Performance Design StructureClinical Leadership Council
MEDICAL GROUPS
LONG-TERM CARE
HOME HEALTH/ HOSPICE
Sentara BOD
CEOCEO Workgroup
Medical Staffs
HOSPITALS
ClinicalLeadership
Council CVPs
COO
CMO
SQCN
System Executives, 9, 16%
Service Line Physician Leaders,
13, 24%
Hospital Presidents,
14, 25%
Medical Staff Representatives,
19, 35%
Interdisciplinary Structure Voting Members (n=55)

13
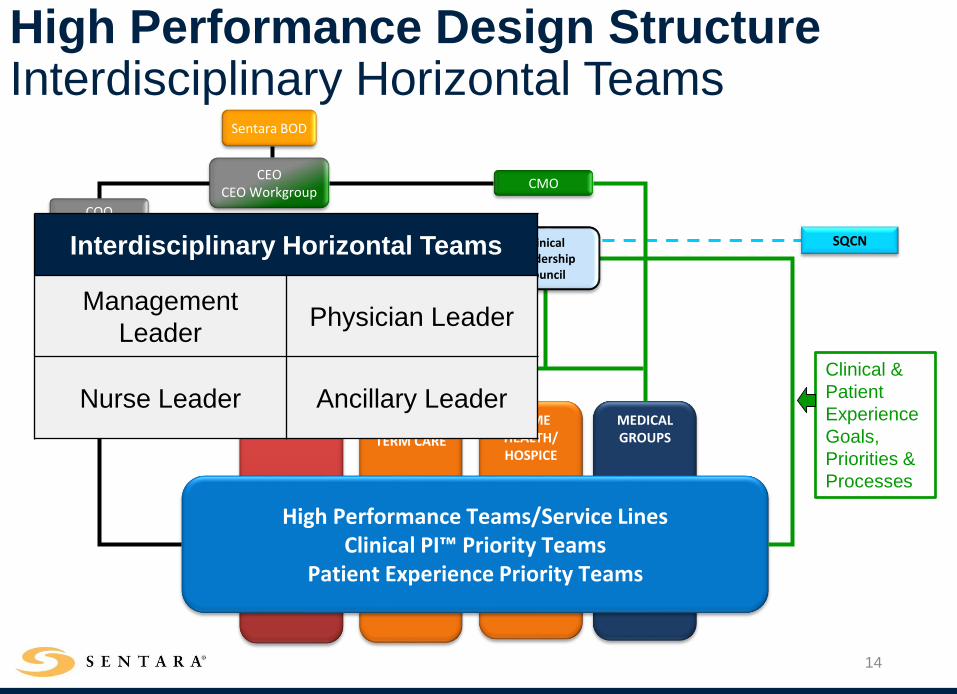
High Performance Design StructureInterdisciplinary Horizontal Teams
MEDICAL GROUPS
LONG-TERM CARE
HOME HEALTH/ HOSPICE
Sentara BOD
CEOCEO Workgroup
Medical Staffs
HOSPITALS
High Performance Teams/Service LinesClinical PI™ Priority Teams
Patient Experience Priority Teams
Clinical Leadership
Council CVPs
COO
CMO
Clinical &
Patient
Experience
Goals,
Priorities &
Processes
SQCN
14
High Performance Design StructureInterdisciplinary Horizontal Teams
MEDICAL GROUPS
LONG-TERM CARE
HOME HEALTH/ HOSPICE
Sentara BOD
CEOCEO Workgroup
Medical Staffs
HOSPITALS
High Performance Teams/Service LinesClinical PI™ Priority Teams
Patient Experience Priority Teams
Clinical Leadership
Council CVPs
COO
CMO
Clinical &
Patient
Experience
Goals,
Priorities &
Processes
SQCNInterdisciplinary Horizontal Teams
Management
LeaderPhysician Leader
Nurse Leader Ancillary Leader

Keys to Success
15

5 Keys to Success
16
1. Performance excellence
2. Accountability for results
3. Leadership execution & alignment
4. Learning enabled across the organization
5. Values-driven affiliations

1. Performance Excellence | Reducing Variation
17
Focus on reducing unnecessary variation

18
Monitoring for sustained improvement.
2012 2013 2014 2015 2016 2017 2018
CLABSI RATE
MAMMO TAT
HEART FAILURE, SEPSIS, PNEUMONIA
CDI RATE
2. Accountability for Results | SustainingImprovement

19
Effective execution of best practices by interdisciplinary teams
Horizontal Leadership
Vertical Leadership
High Performance Team
Management Leader
(Hospital President)
Nurse Leader (VP of Nursing)
Physician Leader
Ancillary Leader
Hospital Team
Hospital President
Hospital Nurse Executive
Hospital VP of Medical Affairs
Medical Staff President
3. Leadership Execution | Horizontal Leadership

20
2018 Clinical Performance Priorities
Readmissions 30-Day Inpatient Mortality
Appointment Availability ED Flow: Treat and Release
Hospital Flow: Treat and Admit Order Cycle Time
• Patient Experience
• Patient Impact
• Financial Impact
• Benchmarking
• Goal Alignment
• Simplicity of Scope
• Public Reporting
Identified Opportunities
3. Leadership Execution | System Prioritization

21
Reinforcement of a culture that supports performance
excellence and learning.
Aligned and working
toward the same results
Commitment to both
learning and sharing
best practices
4. Learning Enabled Across the Organization

22
5. Values-driven Affiliations

Performance Improvement
23

24
Profiled Health System
2011 Comparison group n=100
2007-2011 Comparison group: n=100
Profiled Health System
2016 Comparison group n=113
2012-2016 Comparison group: n=112
2011 2016Data Points
1 Overall
2 Inpatient
Mortality
3 Complications
4 ALOS
5 HCAHPS
Watson Health © IBM Corporation 2018
2011 2016
Performance Improvement

25
Profiled Health System
2011 Comparison group n=100
2007-2011 Comparison group: n=100
Profiled Health System
2016 Comparison group n=113
2012-2016 Comparison group: n=112
2011 2016Data Points
1 Overall
2 Inpatient
Mortality
3 Complications
4 ALOS
5 HCAHPS
Watson Health © IBM Corporation 2018
2011 2016
Stair step.
Then consistent
Performance Improvement

Inpatient Mortality Complications
23
Hospital Key
H1: Sentara Bayside
H2: Sentara Careplex
H3: Sentara Leigh
H4: Sentara Norfolk Gen
H5: Sentara Obici
H6: Sentara Virginia Beach
H7: Sentara Williamsburg
Performance Improvement | System-wide Alignment
2008 Inpatient Mortality & Complications
Watson Health © IBM Corporation 2018

Inpatient Mortality Complications
Hospital Key
1: Sentara Halifax Regional
2: Sentara Martha Jefferson
3: Sentara CarePlex
4: Sentara Leigh
5: Sentara Norfolk Gen
6: Sentara Northern VA
7: Sentara Obici
8: Sentara Princess Anne
9: Sentara RMH
10: Sentara Virginia Beach
11: Sentara Williamsburg
24
Performance Improvement | System-wide Alignment
2013 Inpatient Mortality & Complications
Watson Health © IBM Corporation 2018

Inpatient Mortality Complications
Hospital Key
1: Sentara Martha Jefferson
2: Sentara Albemarle NC
3: Sentara CarePlex
4: Sentara Halifax
5: Sentara Leigh
6: Sentara Norfolk Gen
7: Sentara Northern VA
8: Sentara Obici
9: Sentara Princess Anne
10: Sentara RMH
11: Sentara Virginia Beach
12: Sentara Williamsburg
Performance Improvement | System-wide Alignment
2016 Inpatient Mortality & Complications
25Watson Health © IBM Corporation 2018

Horizontal
leadership
Highly reliable
goal-setting
Accountability across
all levels of leadership
SentaraSystem A
26Watson Health © IBM Corporation 2018
Performance Improvement | System-wide Alignment

SIR = Standardized Infection Ratio
2016 Healthcare-Associated Infections:
Standardized Infection Rate Detail
2016 Mean HAI SIR
27Watson Health © IBM Corporation 2018
Performance Improvement | Constant Opportunity

31
> 80 to 100
> 60 to 80
> 40 to 60
> 20 to 40
> 0 to 20
National Quintile Key
Performance Improvement | Statewide Impact
Watson Health © IBM Corporation 2018
Sentara
Sentara
Sentara
Sentara
Sentara Sentara
Sentara Sentara
Sentara Sentara Sentara
33% (24) 19% (14) 14% (10) 17% (12) 17% (12)
28% (17) 18% (11) 16% (10) 18% (11) 20% (12)
64% (7) 27% (3) 0% (0) 9% (1) 0% (0)
VA Hospitals (W/o Sentara)
Sentara VA Hospitals
VA Hospitals
Virginia Hospitals
IBM Watson Performance(n=72)

32
Performance Improvement | National Recognition
Watson Health © IBM Corporation 2018

1. Journey to becoming a highly predictable organization.
2. Pursuit of higher quality and lower total cost of care across the continuum.
3. Continue to scale High Performance as the organization continues to grow and evolve.
“The true finish line is always
the one yet to come.” -
Sergio Marchionne
33
What’s next for Sentara?

5 Keys to Success
34
1. Performance excellence
2. Accountability for results
3. Leadership execution & alignment
4. Learning enabled across the organization
5. Values-driven affiliations