seasonal variation in water quality parameters of …
TRANSCRIPT
ISSN 2350-1030
International Journal of Recent Research in Physics and Chemical Sciences (IJRRPCS)
Vol. 5, Issue 1, pp: (42-62), Month: April 2018 – September 2018, Available at: www.paperpublications.org
Page | 42 Paper Publications
SEASONAL VARIATION IN WATER
QUALITY PARAMETERS OF RIVER
MKOMON KWANDE LOCAL
GOVERNMENT AREA, NIGERIA
1IORYUE IJAH SILAS,
2WUANA R.A,
3AUGUSTINE A. U
1Department of Chemistry University of Agriculture, Makurdi, Nigeria
2Department of Chemistry University of Agriculture, Makurdi, Nigeria
3Department of Chemistry Federal University Lafia, Nigeria
Abstract: The indiscriminate dumping and release of wastes containing hazardous substances into Rivers might
lead to environmental disturbance which could be considered as a potential source of stress to biotic community.
River Mkomon which is one of the tributaries of River Benue serve as an excellent disposal agent by some of the
communities at the river bank and farmers. The objective of the study was to investigate the seasonal variation in
physico-chemical and bacteriological characteristics of River Mkomon water at four different sampling stations of
the River. Analyses of river water quality containing 16 parameters were done during dry and rainy seasons in the
year 2015. Results revealed deterioration in water quality with seasonal changes between the sites. The data have
been compared with the norms for River water of World Health Organization (WHO), National Environmental
Standards and Regulations Enforcement Agency (NESREA) and standard organization of Nigeria (SON). The
results obtained revealed enhanced level of water temperature (28.8±0.08)oC, turbidity (8.5±0.15) NTU, cadmium
(0.087±0.00) mg/L, lead (0.299±0.00) mg/L, chromium (0.521±0.00) mg/L, total coliform (159.1±24.9) CFU and
decrease or normal levels in phosphate (3.7±0.05) mg/L, chloride (55.2±1.35) mg/L, electrical conductivity
(56.2±0.49) µS/cm, biological oxygen demand (3.3±0.08)mg/L, suspended solid(48.9±0.31) mg/L, pH(6.5±0.07),
dissolved oxygen(4.0±0.09) mg/L, total dissolved solids(47.7±0.15) mg/L and total hardness (83.2±1.13) mg/L.
Moreover, increase of pollution load during rainy season indicated the increase in organic matter in River water
during the season due to increase in anthropogenic interferences of the surrounding areas.
Keywords: Anthropogenic, Mkomon, Seasonal, Variation, parameters, Water.
1. INTRODUCTION
The increasing vulnerability of natural resources and the environment to pollution is one of the great challenges to
humanity in recent times. Water, which is essential to all forms of life and makes about 50–97 percent of the weight of all
plants and animals, is the most poorly managed resource in the world( Fakayode, 2005). About 20 percent of the world’s
population lack access to safe drinking water (UNEP, 2000). The quality of surface water which depends on the
equilibrium between the physical, chemical, and biological characteristics of the surrounding environment is constantly
changing in response to daily, seasonal, and climatic rhythms. The proportion of available but polluted water is
continuously increasing as a result of changes in the modes of industrial activities, agricultural production, and increasing
urbanization (Pestle, 2000). Although statistics vary, the World Health Organization, (WHO, 2006) reported that
approximately 36 percent of urban and 65 percent of rural Nigerian’s were without access to safe drinking water.
Normally, water is often used for domestic purposes especially for drinking, and is the source of all biological lives and
their sustenance too. For different purposes, water has its own requirements for the composition and purity and each body
ISSN 2350-1030
International Journal of Recent Research in Physics and Chemical Sciences (IJRRPCS)
Vol. 5, Issue 1, pp: (42-62), Month: April 2018 – September 2018, Available at: www.paperpublications.org
Page | 43 Paper Publications
of water has to be analyzed on a regular basis to confirm the suitability. Drinking contaminated water can cause diarrhea,
cholera, dysentery, and various other diseases like typhoid, amoebiasis, jaundice, enterobacteriaceae, etc. (Mishra, 2010).
Many infectious diseases are transmitted by water through the feacal-oral route.
In Nigeria, many researchers constantly undertake work on assessment of physiochemical and microbiological quality of
water bodies (Eneji, 2010; Fakayode, 2005) however, in Mkomon District in Kwande Local Government Area of Benue
State; physico-chemical and bacteriological examination of water for drinking purposes has not been carried out. The
probability of ingesting infective dose of disease causing microorganism is very high considering the fact that water borne
pathogens generally have low infective dose. The bacterial growth is also regulated by physico-chemical quality of water.
2. METHODS
River Mkomon:
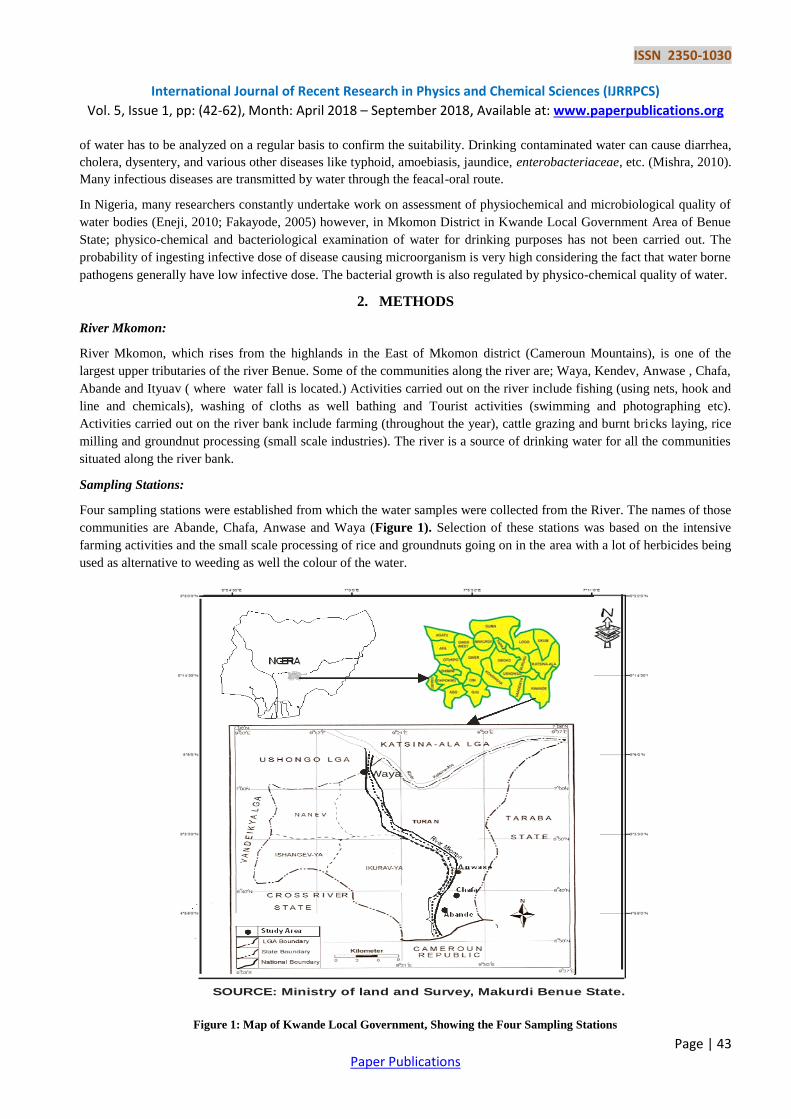
River Mkomon, which rises from the highlands in the East of Mkomon district (Cameroun Mountains), is one of the
largest upper tributaries of the river Benue. Some of the communities along the river are; Waya, Kendev, Anwase , Chafa,
Abande and Ityuav ( where water fall is located.) Activities carried out on the river include fishing (using nets, hook and
line and chemicals), washing of cloths as well bathing and Tourist activities (swimming and photographing etc).
Activities carried out on the river bank include farming (throughout the year), cattle grazing and burnt bricks laying, rice
milling and groundnut processing (small scale industries). The river is a source of drinking water for all the communities
situated along the river bank.
Sampling Stations:
Four sampling stations were established from which the water samples were collected from the River. The names of those
communities are Abande, Chafa, Anwase and Waya (Figure 1). Selection of these stations was based on the intensive
farming activities and the small scale processing of rice and groundnuts going on in the area with a lot of herbicides being
used as alternative to weeding as well the colour of the water.
SOURCE: Ministry of land and Survey, Makurdi Benue State.
Waya
Figure 1: Map of Kwande Local Government, Showing the Four Sampling Stations

ISSN 2350-1030
International Journal of Recent Research in Physics and Chemical Sciences (IJRRPCS)
Vol. 5, Issue 1, pp: (42-62), Month: April 2018 – September 2018, Available at: www.paperpublications.org
Page | 44 Paper Publications
Collection of Water Samples:
At each sampling station, three water samples were collected along a North-South transect across the river in the four
sample sites ( Abande, Chafa, Anwase and Waya).
Water samples were collected in two different seasons: January, 2015 for dry season and October, 2015 for rainy season,
during morning hours, between 8.30 a.m. to 11.30 a.m. A total number of eighteen water samples were collected, the
samples were taken five centimeter below the water surface (to minimize the contamination of the water sample by
surface films) five times with 500 mL white glass bottles and transferred into 2 litres brown borosilicate bottle. All the
samples were collected with 2 L polyethylene cans which were leached with a 1:1 HCl and rinsed with distilled-de-
ionized water. At the point of collection, the cans were rinsed with the water samples before collection. The water
samples meant for metal analysis were treated with 3 mL of concentrated HN03 for 1 litre of water to bring the pH to 2-3
and stored (Ademoroti, 1996).
The pH metre was standardized with two standard buffer solutions of different pH values 4 and 9, the calibrated pH
metre was used to measure the pH of the water by inserting the probe in the water sample and allow it to stabilized before
the pH is taken to the nearest one decimal place unit with HANNA pH metre (model Hi 9610).
Digestion of Water Samples:
The water samples were digested by acidifying with 1mL conc.HN03 per 100 mL sample and autocleaved at 121 oC to
solubilized particulate matter content. This was later made up to mark with distilled water in a 25 mL standard flask and
later transferred into an acid-leached polyethylene bottle prior to analysis (okoye et al., 2010).
General Water Quality Parameters Determination:
Table 1: List of Physicochemical Parameters and their test methods
Source: Patel and Parikh (2013).
Water pH:
The pH, TDS and Temperature were determined by a portable digital pH, TDS Meter and thermometer, respectively, at
the collection site immediately after sampling, since the biological and chemical reactions between the atmosphere and
the sample could readily alter the pH.
Temperature (T):
The surface temperature of the river was determined by inserting the thermometer probe in the water samples below the
water surface for about 5 minutes until it stabilized. The temperature was recorded in degree Celsius.
S/N PARAMETER UNIT METHOD
1 pH pH meter
2 Dissolve Oxygen mg/L Winkler method
3 Biochemical Oxygen Demand mg/L 5 days incubation at 20oC and titration of initial and final DO
titration of initial and final DO
4 Chemical oxygen demand mg/L Open Reflux method
5 Alkalinity mg/L Titration
6 Total dissolve solid mg/L Digital conductivity meter
7 Chloride mg/L Argentometric titration
8 Sulphate mg/L Gravimetric method
9 Turbidity NTU Nephelometric method
10 Ammonia-Nitrogen (NH3-N) mg/L Spectrophotometric
11 Total hardness as CaCO3 mg/L EDTA Titration
12 Conductivity µS/cm Conductivity meter
13 Temperature oC Thermometric method
14 Heavy metals mg/L
Spectrophotometry Atomic absorption
15 Phosphate mg/L Stannous chloride method
ISSN 2350-1030
International Journal of Recent Research in Physics and Chemical Sciences (IJRRPCS)
Vol. 5, Issue 1, pp: (42-62), Month: April 2018 – September 2018, Available at: www.paperpublications.org
Page | 45 Paper Publications
Electrical conductivity (EC):
This was done using a multipurpose HANNA digital model conductivity/TDS metre to determine the conductivity of the
water samples on the field. About 250 mL water samples were taken using 500 mL white glass bottle, the electrical
conductivity was recorded immediately by dipping the probe of the conductivity metre inside the water samples for about
two minutes. The values obtained were expressed in micro-siemens per centimeter (µs/cm).
Total dissolved solids (TDS):
This was done using a multipurpose HANNA digital portable model conductivity metre /TDS to determine the TDS of
water samples on the field. About 250 mL water samples were taken using 500 mL white glass and the TDS was recorded
immediately by dipping the probe inside the water samples for about two minutes. The values obtained were expressed in
milligram per litre (mg/L).
Dissolved oxygen (DO):
About 100 mL of five percent (5%) sodium sulphite solution was stired constantly with electric stirrer for about five
minutes and the DO probe was dipped into it and the metre was set to zero mark; after the setting, the probe was dipped
into 100 mL water sample, and the DO was recorded in mg/L using DO 150, model 50150.
Biochemical oxygen demand (BOD):
Diluted water was prepared by aerating the BOD free distilled water adequetly.In 1mL each of 0.01 M phosphate buffer
solution, 0.02 M MgSO4 solution, 0.03 M calcium chloride solution, and 0.03 M iron chloride solution was added. The
pH of the sample was adjusted to 7.0. Two sets of BOD bottles were filled with the water sample, the dissolved oxygen
content (DO) in one set was determined immediately and the remaining set of BOD bottles were incubated at 20 oC for
five days in a BOD incubator. The bottles were taken out after five days to determine immediately their dissolved oxygen
content (DO5) Ademoroti (1996).
Calculation:
Where: D0=dissolved oxygen (DO) of the diluted solution after preparation (mg/L)
D05 = dissolved oxygen of the diluted solution after five days incubation (mg/L)
P =decimal dilution factor = 1/f
f = dilution factor.
Total hardness (Ca2+,
Mg2+
)
Twenty milliliters (20 mL) of the water sample was diluted to about 50 mL with distilled water in an Erlenmeyer flask
and one milliliter (1 mL) of ammonia buffer solution and about 5 drops of Erichrome Black-T indicator was added. The
diluted water sample was titrated with 0.01 M ethylenediamine tetra acetic acid (EDTA) to wine red colour.
Calculation:
)2(1000
)/(
V
TLmgHardnessTotal
Where T = Volume of EDTA used (mL)
V = Volume of sample (ML)
Chloride:
Ten milliliters (10 mL) of the water sample was taken into an Erlenmeyer flask. 5 to 6 drops of 1.0 mL potassium
chromate indicator was added. The color of the sample became yellow and the sample was titrated against 0.03 M silver
nitrate solution until the colour changed to brick red. Chloride was calculated as:
)1(5
5
P
DODOBOD
ISSN 2350-1030
International Journal of Recent Research in Physics and Chemical Sciences (IJRRPCS)
Vol. 5, Issue 1, pp: (42-62), Month: April 2018 – September 2018, Available at: www.paperpublications.org
Page | 46 Paper Publications
)3(10004.35
)/(
S
NVLmgChloride
where V= mL AgNO3 used for titrating sample, N = Molarity of AgNO3
S = Volume of water sample (mL)
Inorganic phosphate:
Twenty five milliliters (25 mL) of the sample was taken in a flask and 1 mL of 0.01 M ammonia molybdate solution was
added. The flask was stoppered and vigorously shaken, then 3 drops of freshly prepared 0.01 M stannous chloride (SnCl2)
solution, was also added. After 10 minutes, the water samples were run on a spectrophotometer at a wavelength of 690
nm. All the measurements for water quality parameters were carried out in triplicate.
Bacteriological Analysis:
Microbial analysis was performed in terms of most probable number (MPN)
Most probable number analysis is a statistical method based on the random dispersion of microorganisms per volume in a
given water sample.
Most probable number (MPN) was performed sequentially in three stages: presumptive, confirmed and completed test.
Presumptive coliform test:
MacConkey purple media of single and double strength were prepared in a test tube (lactose- 5.0 g, peptone- 5.0 g, beef
extract- 3.0 g and one litre of distilled water) with Durham’s tube and autoclaved for 15 minutes at 121 oC. Three sets of
test tubes containing five tubes in each was used to prepared macConkey media of single and double strength. One set
with 10 mL of double strength and the remaining two sets with 10 mL of single strength. 10 mL of the water sample was
transferred to each of the double strength broth tubes using sterile pipettes. 1 mL of the water sample was also transferred
to each of the 5 tubes of one set of single strength broth and 0.1mL of the water sample was as well transferred to the five
tubes of the remaining last set of single strength broth tubes.
The tubes were incubated at 37 oC for 24 hours. After incubation, the tubes were observed for the production of gas in
Durham’s tubes and colour change (yellow) of the media.
The number of positive results from each set was recorded and compared with standard chart to give presumptive
coliform count per 100 mL water samples.
Confirmed coliform test:
Here, all the positive presumptive test results were inoculated in a selective media; Eosine methylene blue (EMB) agar
and was incubated at 37 oC. The presence of typical colonies at 37
oC confirmed positive coliform test. This test
determined MPN.
)4(1000
usedsampleofvolume
countcolonypercoliformsofNumberMPN
Completed test:
At this stage,the colony in a tube of lactose broth with Durham’s tube was inoculated . The broth cultures were then
incubated at 37 oC with the Nutrient agar at same temperature. The production of gas and acid was examined in the
Lactose broth.
Statistical Analysis:
Data collected were analyzed using One-way analysis of variance (ANOVA) and t-test. ANOVA was used to measure
the variance between quality of water between sampling sites, and between seasons while t-test was used to test the
formulated hypothesis. Descriptive statistics were also presented using charts and comparing the mean values with WHO,
ISSN 2350-1030
International Journal of Recent Research in Physics and Chemical Sciences (IJRRPCS)
Vol. 5, Issue 1, pp: (42-62), Month: April 2018 – September 2018, Available at: www.paperpublications.org
Page | 47 Paper Publications
SON, and NESREA Drinking Water Guidelines. All analyses were performed on Statistical Package for Social Sciences
(SPSS) 17.0
3. RESULTS
The mean and standard deviation values of all variables investigated in the three sampling stations for dry season and four
sampling stations for rainy seasons were presented in Tables 4-6 and comparative charts from Figures 2-7.
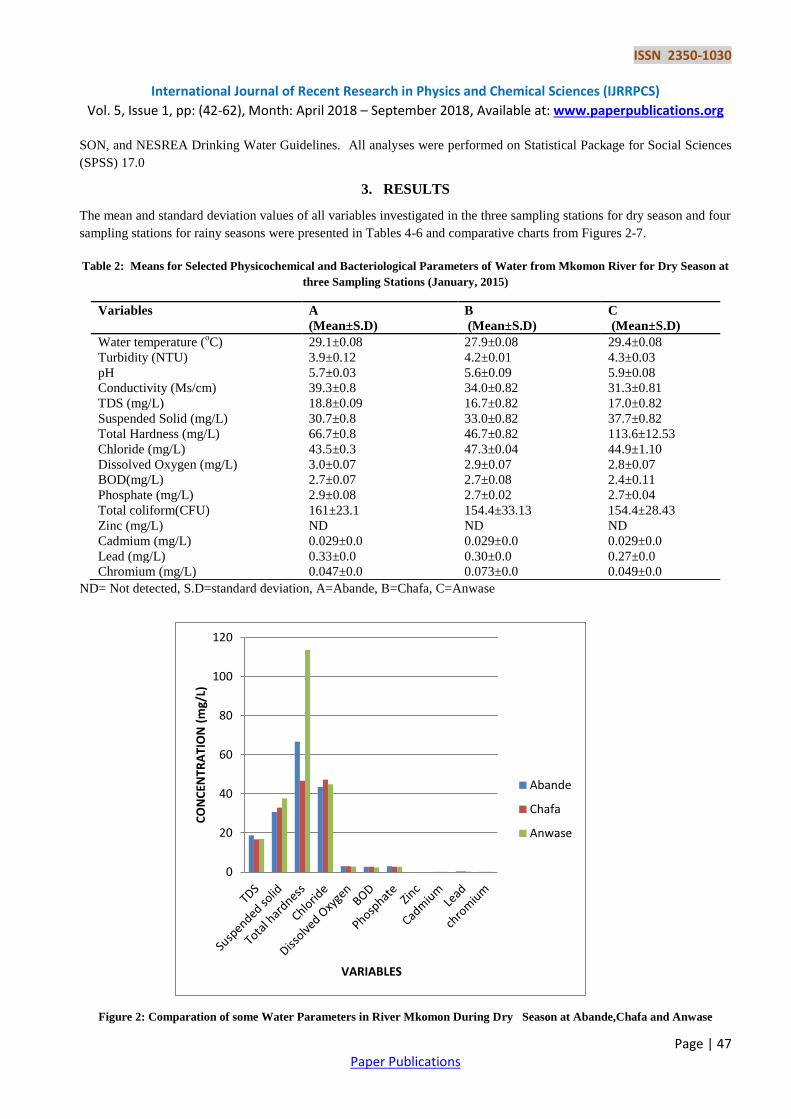
Table 2: Means for Selected Physicochemical and Bacteriological Parameters of Water from Mkomon River for Dry Season at
three Sampling Stations (January, 2015)
ND= Not detected, S.D=standard deviation, A=Abande, B=Chafa, C=Anwase
Figure 2: Comparation of some Water Parameters in River Mkomon During Dry Season at Abande,Chafa and Anwase
Variables A
(Mean±S.D)
B
(Mean±S.D)
C
(Mean±S.D)
Water temperature (oC) 29.1±0.08 27.9±0.08 29.4±0.08
Turbidity (NTU) 3.9±0.12 4.2±0.01 4.3±0.03
pH 5.7±0.03 5.6±0.09 5.9±0.08
Conductivity (Ms/cm) 39.3±0.8 34.0±0.82 31.3±0.81
TDS (mg/L) 18.8±0.09 16.7±0.82 17.0±0.82
Suspended Solid (mg/L) 30.7±0.8 33.0±0.82 37.7±0.82
Total Hardness (mg/L) 66.7±0.8 46.7±0.82 113.6±12.53
Chloride (mg/L) 43.5±0.3 47.3±0.04 44.9±1.10
Dissolved Oxygen (mg/L) 3.0±0.07 2.9±0.07 2.8±0.07
BOD(mg/L) 2.7±0.07 2.7±0.08 2.4±0.11
Phosphate (mg/L) 2.9±0.08 2.7±0.02 2.7±0.04
Total coliform(CFU) 161±23.1 154.4±33.13 154.4±28.43
Zinc (mg/L) ND ND ND
Cadmium (mg/L) 0.029±0.0 0.029±0.0 0.029±0.0
Lead (mg/L) 0.33±0.0 0.30±0.0 0.27±0.0
Chromium (mg/L) 0.047±0.0 0.073±0.0 0.049±0.0
0
20
40
60
80
100
120
CO
NC
ENTR
ATI
ON
(m
g/L)
VARIABLES
Abande
Chafa
Anwase

ISSN 2350-1030
International Journal of Recent Research in Physics and Chemical Sciences (IJRRPCS)
Vol. 5, Issue 1, pp: (42-62), Month: April 2018 – September 2018, Available at: www.paperpublications.org
Page | 48 Paper Publications
Units: Temperature (Oc), Turbidity (NTU), pH, Conductivity (Ms/cm), Total Coliform (CFU).
Figure 3: Comparation of some Water Parameters at Abande, Chafa and Anwase in River Mkomon During Dry Season
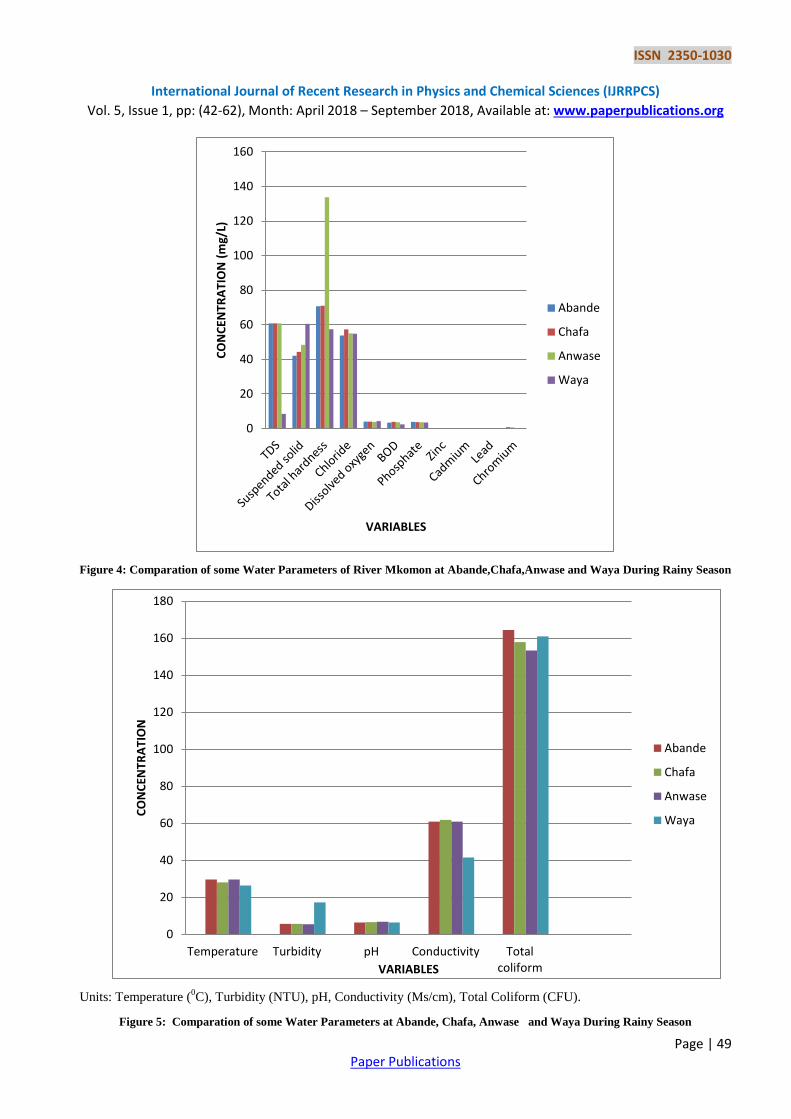
Table 3: Means of Selected Physicochemical and Bacteriological Parameters of Water from Mkomon River for Rainy Season at
Four Sampling Stations (October, 2015)
ND=Not detected, S.D=standard deviation, A=Abande,B=Chafa,C=Anwase, D=waya
0
20
40
60
80
100
120
140
160
180
CO
NC
ENTR
ATI
ON
VARIABLES
Abande
Chafa
Anwase
Variables A
(Mean ±S.D)
B
(Mean ±S.D)
C
(Mean ±S.D)
D
(Mean ±S.D)
Water Temperature (0C) 29.5±0.08 28.0±0.08 29.5±0.07 26.3±0.08
Turbidity (NTU) 5.6±0.08 5.6±0.08 5.4±0.08 17.2±0.34
pH 6.3±0.09 6.5±0.08 6.8±0.07 6.3±0.02
Conductivity (Ms/cm) 60.8±0.08 61.8±1.49 60.8±0.07 41.4±0.31
TDS (mg/L) 60.8±0.06 60.8±0.08 60.8±0.07 8.5±0.37
Suspended Solid (mg/L) 42.1±0.05 44.3±0.54 48.4±0.55 60.6±0.09
Total Hardness (mg/L) 70.7±0.35 71.0±0.82 133.7±3.01 57.4±0.32
Chloride (mg/L) 53.8±0.05 57.3±4.03 55.0±0.15 54.8±1.17
Dissolved Oxygen (mg/L) 4.0±0.05 4.0±0.14 3.8±0.08 4.3±0.07
(BOD) (mg/L) 3.4±0.06 3.9±0.13 3.6±0.08 2.4±0.04
Phosphate (mg/L) 3.9±0.07 3.7±0.04 3.6±0.05 3.5±0.04
Total coliform(CFU) 164.4±22.1 157.8±35.03 153.3±29.0 160.9±13.47
Zinc (mg/L) ND ND ND ND
Cadmium (mg/L) 0.145±0.0 0.065±0.0 0.052±0.0 ND
Lead (mg/L) 0.123±0.0 0.132±0.0 0.123±0.0 0.303±0.02
Chromium (mg/L) 0.87±0.0 0.54±0.0 0.153±0.0 ND
ISSN 2350-1030
International Journal of Recent Research in Physics and Chemical Sciences (IJRRPCS)
Vol. 5, Issue 1, pp: (42-62), Month: April 2018 – September 2018, Available at: www.paperpublications.org
Page | 49 Paper Publications
Figure 4: Comparation of some Water Parameters of River Mkomon at Abande,Chafa,Anwase and Waya During Rainy Season
Units: Temperature (0C), Turbidity (NTU), pH, Conductivity (Ms/cm), Total Coliform (CFU).
Figure 5: Comparation of some Water Parameters at Abande, Chafa, Anwase and Waya During Rainy Season
0
20
40
60
80
100
120
140
160
CO
NC
ENTR
ATI
ON
(m
g/L)
VARIABLES
Abande
Chafa
Anwase
Waya
0
20
40
60
80
100
120
140
160
180
Temperature Turbidity pH Conductivity Totalcoliform
CO
NC
ENTR
ATI
ON
VARIABLES
Abande
Chafa
Anwase
Waya
ISSN 2350-1030
International Journal of Recent Research in Physics and Chemical Sciences (IJRRPCS)
Vol. 5, Issue 1, pp: (42-62), Month: April 2018 – September 2018, Available at: www.paperpublications.org
Page | 50 Paper Publications
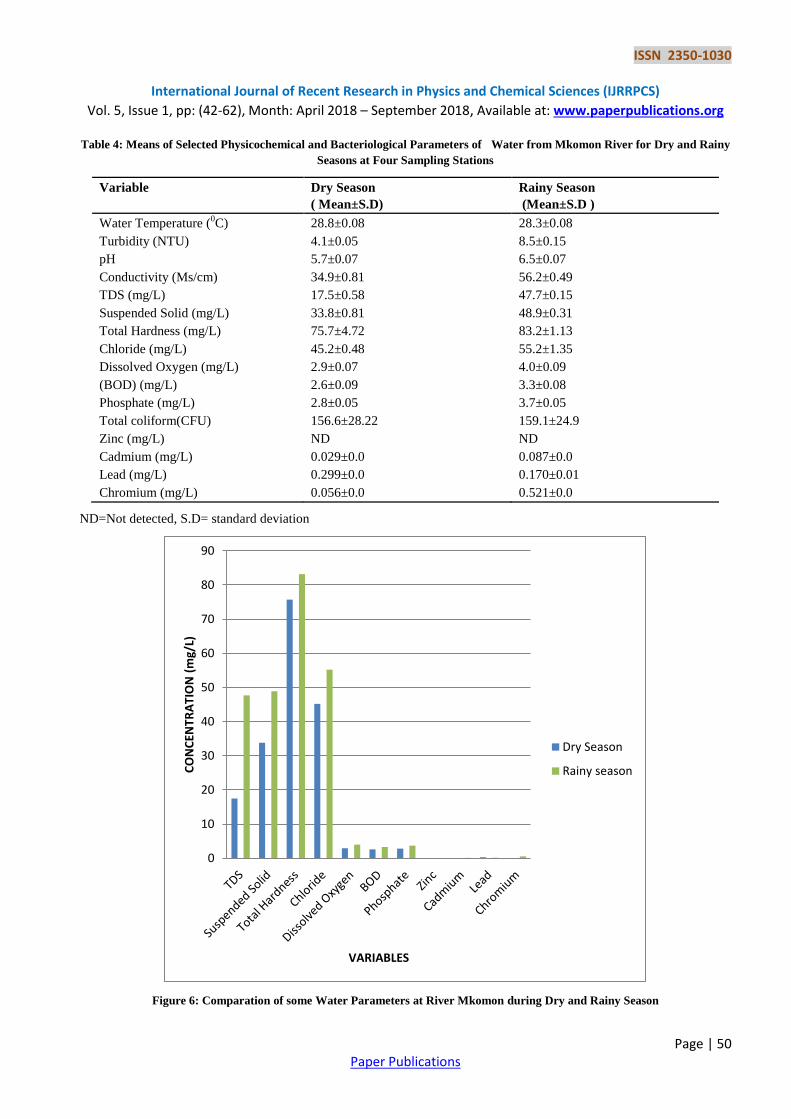
Table 4: Means of Selected Physicochemical and Bacteriological Parameters of Water from Mkomon River for Dry and Rainy
Seasons at Four Sampling Stations
Variable Dry Season
( Mean±S.D)
Rainy Season
(Mean±S.D )
Water Temperature (0C) 28.8±0.08 28.3±0.08
Turbidity (NTU) 4.1±0.05 8.5±0.15
pH 5.7±0.07 6.5±0.07
Conductivity (Ms/cm) 34.9±0.81 56.2±0.49
TDS (mg/L) 17.5±0.58 47.7±0.15
Suspended Solid (mg/L) 33.8±0.81 48.9±0.31
Total Hardness (mg/L) 75.7±4.72 83.2±1.13
Chloride (mg/L) 45.2±0.48 55.2±1.35
Dissolved Oxygen (mg/L) 2.9±0.07 4.0±0.09
(BOD) (mg/L) 2.6±0.09 3.3±0.08
Phosphate (mg/L) 2.8±0.05 3.7±0.05
Total coliform(CFU) 156.6±28.22 159.1±24.9
Zinc (mg/L) ND ND
Cadmium (mg/L) 0.029±0.0 0.087±0.0
Lead (mg/L) 0.299±0.0 0.170±0.01
Chromium (mg/L) 0.056±0.0 0.521±0.0
ND=Not detected, S.D= standard deviation
Figure 6: Comparation of some Water Parameters at River Mkomon during Dry and Rainy Season
0
10
20
30
40
50
60
70
80
90
CO
NC
ENTR
ATI
ON
(m
g/L)
VARIABLES
Dry Season
Rainy season
ISSN 2350-1030
International Journal of Recent Research in Physics and Chemical Sciences (IJRRPCS)
Vol. 5, Issue 1, pp: (42-62), Month: April 2018 – September 2018, Available at: www.paperpublications.org
Page | 51 Paper Publications
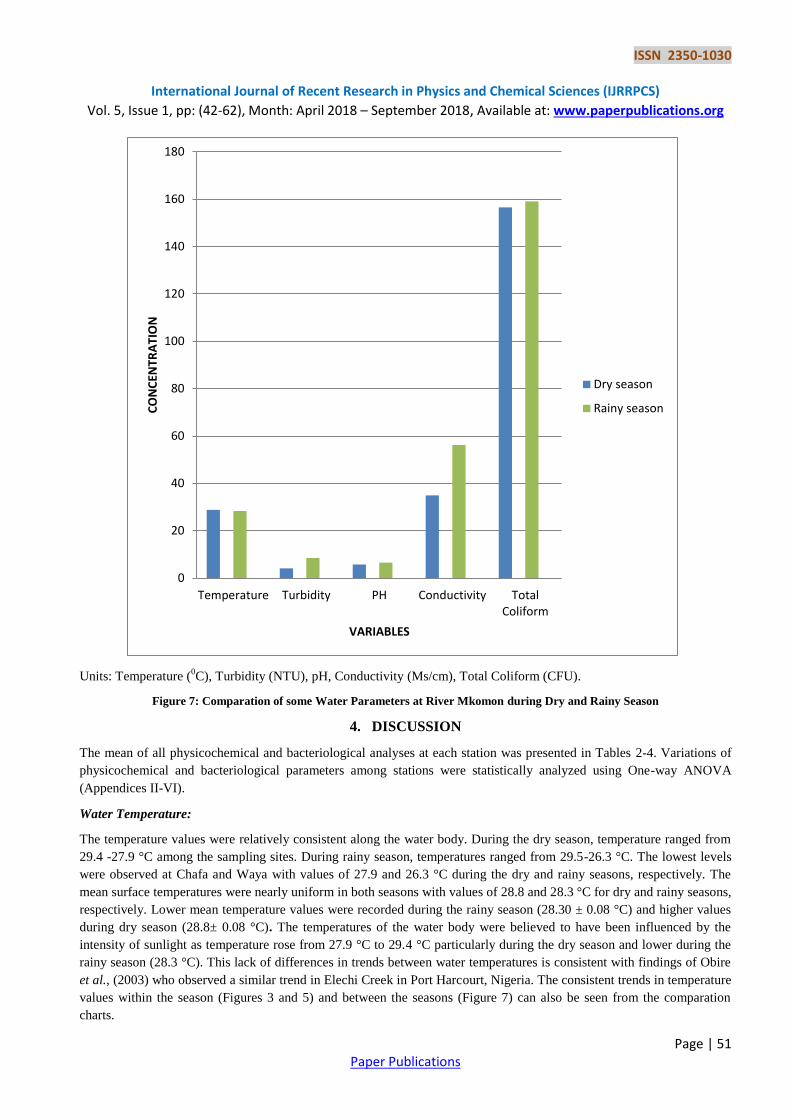
Units: Temperature (0C), Turbidity (NTU), pH, Conductivity (Ms/cm), Total Coliform (CFU).
Figure 7: Comparation of some Water Parameters at River Mkomon during Dry and Rainy Season
4. DISCUSSION
The mean of all physicochemical and bacteriological analyses at each station was presented in Tables 2-4. Variations of
physicochemical and bacteriological parameters among stations were statistically analyzed using One-way ANOVA
(Appendices II-VI).
Water Temperature:
The temperature values were relatively consistent along the water body. During the dry season, temperature ranged from
29.4 -27.9 °C among the sampling sites. During rainy season, temperatures ranged from 29.5-26.3 °C. The lowest levels
were observed at Chafa and Waya with values of 27.9 and 26.3 °C during the dry and rainy seasons, respectively. The
mean surface temperatures were nearly uniform in both seasons with values of 28.8 and 28.3 °C for dry and rainy seasons,
respectively. Lower mean temperature values were recorded during the rainy season (28.30 ± 0.08 °C) and higher values
during dry season (28.8± 0.08 °C). The temperatures of the water body were believed to have been influenced by the
intensity of sunlight as temperature rose from 27.9 °C to 29.4 °C particularly during the dry season and lower during the
rainy season (28.3 °C). This lack of differences in trends between water temperatures is consistent with findings of Obire
et al., (2003) who observed a similar trend in Elechi Creek in Port Harcourt, Nigeria. The consistent trends in temperature
values within the season (Figures 3 and 5) and between the seasons (Figure 7) can also be seen from the comparation
charts.
0
20
40
60
80
100
120
140
160
180
Temperature Turbidity PH Conductivity TotalColiform
CO
NC
ENTR
ATI
ON
VARIABLES
Dry season
Rainy season
ISSN 2350-1030
International Journal of Recent Research in Physics and Chemical Sciences (IJRRPCS)
Vol. 5, Issue 1, pp: (42-62), Month: April 2018 – September 2018, Available at: www.paperpublications.org
Page | 52 Paper Publications
Akpan (2004) worked on tropical fresh water bodies in Uyo. He also noted the minima seasonal difference in temperature
which he attributed to the effect of the prevailing air-masses. This is particularly so in the study area as it was greatly
influenced by rainfall and cloud cover as noted especially during the rainy season. The high temperature values during the
dry season indicate the high rate of metabolic processes or activities in the water. The result of temperature from the study
for both dry and rainy seasons was above the recommended standard value by WHO, NESREA and SON. Considering
the ANOVA values for dry and rainy seasons, there was no significant variation as can be seen from Appendices II-VI.
Turbidity:
Measurement of turbidity reflects the transparency in water. It is caused by the substances present in water in suspension.
In natural waters it is caused by clay, silt, organic matter, phytoplankton and other microscopic organisms.
In the present study water turbidity values ranged from 4.3 to 3.9 NTU during the dry season to 17.2 to 5.4 NTU
during rainy season. There were similarities between the values during the dry season from stations Chafa and Anwase
(Table 4 and Figure 3). Similar trend was observed during the rainy season from all the stations except Waya station that
had the highest value of 17.2 NTU. There was a variation between dry season and rainy season values. The relatively high
mean turbidity in the rainy season can be adduced to run-offs that carried dissolved fertilizer, pesticides, herbicides and
other particles from cultivated fields into the river. The high turbidity of the river samples from Waya (station D) may
have been caused by higher flow rates during rainfalls that might have carried sediments and other materials into the river.
The low mean turbidity of the river samples may be due to the absence of run-offs and the recession in flow level during
the dry season (Table 4 and Figure 3). Results of experiment carried out on river Etsu by Garg et al., (2010) also showed
high turbidity during rainy season. During rainy season silt, clay and other suspended particles contribute to the
turbidity values, while during dry season settlement of silt and clay results to low turbidity values. The turbidity value
was high at Waya station (station D) as a result of the cumulative effect due to the distance of Waya (downstream
location) from the river source. Turbidity was found above the WHO, NESREA and SON prescribed limit in all the water
samples. This can also be seen from the various charts (Figures 3 and 6).
Phosphate (PO43-
):
Phosphate is considered to be the most significant among nutrients responsible for eutrophication of lakes as it is the
primary initiating factor. In this study, the trend was similar in both dry and rainy seasons with close values in all the
sampling sites, that is from Abande, Chafa and Anwase during the dry season and Abande,Chafa, Anwase and Waya
during the rainy season, respectively. The phosphate concentration was high during the rainy season (3.9 mg/L) at Abande
compared to the highest value recorded during the dry season (2.9 mg/L) at Abande. This could be attributed to domestic
waste waters, particularly those containing detergents and fertilizer runoff from various sources to the river during the
rainy season, while the mean values recorded in the dry season could be due to evaporation. The value of phosphate
decreases from Abande to Waya (Table 5) during the rainy season as a result of dilution factor or as a result of increase in
distance away from the phosphate sources. The farther away from the source the lesser the concentration of phosphate at
that point. The mean values (2.8 and 3.7 mg/L) for dry and rainy seasons were within the WHO, SON and NESREA
recommended limit for drinking water (Appendices I).
To the contrary, findings in Cross River, Eastern Nigeria by Akpan (2004) showed phosphate concentration in the water
was above the 5.0 mg/L of World Health Organization (WHO) standard. Excess phosphate concentration in water give
rise to algal bloom and causes risk to human beings as algae produce toxins, which damage neurological system and as
well causes oxygen depletion in the water (Akpan, 2004). From the ANOVA (Appendix III) result there was no variation
between the sampling points as well as between the seasons. The recommended maximum level of phosphate for rivers
and streams had been reported as 5.0 mg/L, while 0.025 mg/L is found to accelerate eutrophication process in rivers and
lakes (Chapman, 1996).
Chloride:
Chloride occurs naturally in all types of water with a very low concentration.
Chlorides are important in detecting the contamination of water. In this study, the chloride ion concentration fluctuated at
the various sampling stations (A, B and C) during the dry season (43.5, 47.3 and 44.9 mg/L) with mean value of 45.2
mg/L and there was a consistent value during the rainy season with a mean value of 55.2 mg/L. The mean value of

ISSN 2350-1030
International Journal of Recent Research in Physics and Chemical Sciences (IJRRPCS)
Vol. 5, Issue 1, pp: (42-62), Month: April 2018 – September 2018, Available at: www.paperpublications.org
Page | 53 Paper Publications
chloride was higher during the rainy season (55.2 mg/L) than the dry season(45.2 mg/L).This may be as a result of water
runoff during the rainy season from chloride sources (domestic sewage which contains a good amount of chloride.) into
the river. The result of the study is within the WHO, SON and NESREA permissible limit of 200 and 250 mg/L.
Rajkumar (2004) showed that higher concentration of chloride was associated with high domestic sewage disposal in
the river which increased the level of pollution especially during the rainy season.
Conductivity:
Result of conductivity (Table 5) was found to be 60.8, 61.8, 60.8, and 41.4 (μScm-1
) for Abande, Chafa, Anwase, and
Waya stations, respectively, during rainy season. During dry season, the values of conductivity (Table 4) obtained at
Abande, Chafa, and Anwase were: 39.3, 34.0 and 31.3 (μScm-1
), respectively. There was no significant difference among
locations and seasons in conductivity as shown by the ANOVA analysis (Appendices II-VI).
Results of the analysis indicated decrease in conductivity values during the dry season and increase during the rainy
season. Reasons for the increase during rainy season were due to increase in concentration of salts, organic and inorganic
materials in the river as a result of discharged by the feeder streams and runoff from domestic and other human activities
into the river during rainy season. The lower conductivity values during dry season may be due to the utilization of these
organic and inorganic materials by phytoplankton and other aquatic organisms. High conductivity reflects the pollution
load as well as tropic levels of aquatic body. Conductivity values below 50 (μScm-1
) are regarded as low, while those
between 50 – 600 (μScm-1
) are said to be medium and values above 600 (μScm-1
) are considered to be high (Abida and
Harikrishna, 2008).For the study the conductivity was low because the values for both dry and rainy seasons were below
50 μScm-1
.
For most Nigerian inland water bodies, conductivity values have been found to be below 500 (μScm-1
) at the peak of dry
season and less than 100 (μScm-1
) during the rainy season. All the sampling stations are purely rural agricultural
communities and the high conductivity could be due to fertilizer and herbicide applications in the farmlands. High
conductivity values have been reported to be indicative of pollution load of a river (Abida and Harikrishna, 2008).
Biochemical oxygen demand (BOD):
Biochemical Oxygen Demand is a measure of the oxygen in the water that is required by the aerobic organisms. The
biodegradation of organic materials exerts oxygen tension in the water and increases the biochemical oxygen demand
(Abida and Harikrishna, 2008). Rivers with low BOD have low nutrient levels; therefore, much of the oxygen remains in
the water. Unpolluted, natural waters will have a BOD of 5 mg/L or less. BOD directly affects the amount of dissolved
oxygen in rivers and streams. The greater the BOD, the more rapidly oxygen is depleted in the stream. This means less
oxygen is available to higher forms of aquatic life.
The consequences of high BOD are the same as those for low dissolved oxygen: aquatic Organisms become stressed,
suffocate, and die. Sources of BOD include leaves and woody debris; dead plants and animals; animal manure; effluents
from pulp and paper mills,Wastewater treatment plants, feedlots, and food-processing plants; failing septic systems; and
urban storm water runoff (USEPA, 1997).The average concentration of BOD in the study was 2.6 mg/L in dry season.
During rainy season, BOD level increased to 3.9 mg/L which was below the permissible limit of NESREA (Appendix I).
It varied from 2.4 to 2.7mg/L during the dry season and 2.4 to 3.9 mg/L during the rainy season where as the permissible
limit for BOD is 5 mg/L prescribed by WHO and NESREA (Appendix I).
Biochemical oxygen demand indicated low values in the downstream waters (Anwase and Waya) during dry and rainy
season with values of 2.4 and 2.4 mg/L, respectively. This is expected because only the downstream water receives high
organic pollutants through the effluents. The low BOD value in all the sample stations (Abande, Chafa, Anwase and
Waya) showed good sanitary condition of the water. Seasonal analysis reveals that BOD values are more during rainy
season (3.9 mg/L than dry season (2.6 mg/L). The trend of seasonality in BOD followed that of dissolved oxygen
concentration with higher values during the rainy season than in the dry season. Similar trend was also reported by
Ahipathi and puttaiah (2006). Open defecation nearby the river and discharging of Sewage waste water generated by the
sampling towns during rainy season results to higher BOD value of 3.9 mg/L as well the presence of major organic
pollution sources in the study area. BOD shows no variation within the seasons and between the seasons as shown from
the ANOVA values (Appendices I1-VI).

ISSN 2350-1030
International Journal of Recent Research in Physics and Chemical Sciences (IJRRPCS)
Vol. 5, Issue 1, pp: (42-62), Month: April 2018 – September 2018, Available at: www.paperpublications.org
Page | 54 Paper Publications
Suspended Solid:
The seasonality profile of total suspended solids in Mkomon River indicated that rainy season levels were higher than dry
season values. Higher rainy season values were due to the influx of allochthonous materials into the river through surface
run-of. The greater rainy season values of coefficient of variations for the four stations than the dry season values indicate
a strong influence of rainfall on total suspended solids. During the dry season it increased from 30.7 mg/L to 37.7 mg/L
while during the rainy season it was from 42.1 to 60.6 mg/L. This is consistent with the work carried out by Akpan (2004)
for Qua Iboe River.
The dry season decrease in the level of total suspended solids was probably due to sedimentation when the current
velocity and water level was reduced, and low tributary inputs.
Comparatively, higher values were considerably observed for all the stations in the rainy than dry season. However, the
seasonal variation was not significant.
pH:
Aquatic organisms are affected by pH because most of their metabolic activities are pH dependent. Optimal pH range for
sustainable aquatic life is pH 6.5-8.2. pH of an aquatic system is an important indicator of the water quality and the extent
of pollution in the watershed areas (Kumar et al.,2000). The pH values were within the permissible level set by WHO
and SON that is 6.5 to 8.5, varying between 6.3 to 6.8 during rainy season. The lowering of pH in dry season was due to
less input of waste from different types of sources. Higher pH values during rainy season revealed the aerobic conditions
and lesser anthropogenic sources as compared to the dry season. The pH of water affects the solubility of many toxic and
nutritive chemicals; therefore, the availability of these substances to aquatic organisms is affected. As acidity increases,
most metals become more water soluble and more toxic. Toxicity of cyanides and sulfides also increases with a decrease
in pH (increase in acidity). Ammonia, however, becomes more toxic with only a slight increase in pH. The lower pH
recorded in all the stations during dry season, is probably due to the concentration of dissolved substances as a result of
evapotranspiration. Likewise, the pH increased during the rains as a result of dilution effect. This was consistent with the
report of Akpan (2004) for Qua Iboe River. pH range of 5.6 – 6.8 reported for Mkomon River could be considered to be
within the range considered as normal for unpolluted fresh water (Fakayode, 2005). The slight acidity values of the
sampling stations especially during the dry season could be attributed to the fact that Mkomon River drains a catchment
area with thick tropical rain forest. The seasonality pattern in the pH of Mkomon River is similar to that reported by
Akpan (2004) for Qua Iboe River.
Dissolved oxygen (DO):
Dissolved oxygen is one of the most important factors in stream health. Its deficiency directly affects the ecosystem of a
river due to bioaccumulation and biomagnifications. The oxygen content in water samples depends on a number of
physical, chemical, biological and microbiological processes. DO values also show lateral, spatial and seasonal changes
depending on industrial, human and thermal activity. Oxygen is the single most important gas for most aquatic organisms;
free oxygen (O2) or DO is needed for respiration. DO levels below 1 ppm will not support fish; levels of 5 to 6 ppm are
usually required for most of the fish population. The mean value of DO levels (6.5 mg/L) indicates the mean quality of
river water (APHA 2005).
Dissolved oxygen levels were higher in the rainy season than in the dry season due to the increased current flow that
enables the diffusion and mixing of atmospheric oxygen into the water (Table 3). Higher levels of dissolved oxygen
observed in the rainy season in all the stations in Mkomon River is consistent with the work of Izonfuo and Bariweni
(2001), in Niger Delta, while working in Epie Creek. Their observed average DO levels of 4.45 mg/L in the rainy season
was higher than 3.35 mg/L obtained in the dry season. They attributed this seasonal fluctuation to the effect of
temperature on the solubility of oxygen in water. At high temperatures, the solubility of oxygen decreases while at lower
temperatures, it increases. The dry season decline in dissolved oxygen concentration was due to increased input of organic
load into the water (mainly as leaf litter), whose decomposition increases oxygen depletion and stream stagnation
(Izonfuo and Bariweni, 2001).
ISSN 2350-1030
International Journal of Recent Research in Physics and Chemical Sciences (IJRRPCS)
Vol. 5, Issue 1, pp: (42-62), Month: April 2018 – September 2018, Available at: www.paperpublications.org
Page | 55 Paper Publications
Total dissolved solids (TDS):
In water, total dissolved solids are composed mainly of carbonates, bicarbonates, chlorides, phosphates and nitrates of
calcium, magnesium, sodium, potassium and manganese; as well as organic matter, salt and other particles (Mahananda,
2010). At high flows, the TDS values tend to be diluted by surface runoff and for most rivers there are an inverse
correlation between discharge rate and TDS (Charkhabi and Sakizadeh, 2006). As expected, the maximum total dissolved
solids were observed during the rainy season (60.8 mg/L) at stations Abande, Chafa and Anwase than the dry season (18.8
mg/L ) at stations Abande,Chafa and Anwase, as a large amount of sediment load was transported from the watershed
during the rainy season. Higher level of TDS during rainy season is more likely due to the influence of small industrial
activities such as rice mill, groundnut processing and burnt bricks effluent addition to the river. ANOVA analysis
(Appendices II-VII) showed no seasonal variation. Some but not the entire dissolved solids act as conductors and
contribute to conductance. Waters with high total dissolved solids (TDS) are unpalatable and potentially unhealthy. The
results of analysis on the River showed that the total dissolved solids value was below the maximum recommended limit
by the WHO, SON and NESREA (Appendix I).Similar findings have been reported by Garg et al., (2010), Kirubavathy et
al., (2005).
Zinc, Cadmium, Lead and Chromium:
The metal analysis gave values (mg/L) with ranged as follows during the dry season: Cd (0.029-0.029); Pb (0.33-0.27); Cr
(0.073.0.047) and Zinc was not detected in all sampling stations while the range for rainy season was : Cd (0.145-0.052);
Pb (0.303-0.123); Cr (0.87-.0.153); Zinc was also not detected in all the sampling stations. WHO limits are 0.01 mg/L Pb
, 0.07 mg/L Cr and 0.003 mg/L,Cd. The concentration values of the heavy metals were higher during the rainy season
than the dry season. The values were above the recommended limits in both seasons by the WHO, NESREA and SON
(Appendix I).
Sources of these toxic metals in the water bodies are attributed to waste dumps in the river and agricultural lands.
Cadmium is a common impurity in phosphate fertilizer and with increasing use of fertilizers in agriculture, cadmium
dispersion from this source would increase. Other probable sources include leachates from nickel-cadmium based
batteries which are so carelessly discarded by battery chargers, and cadmium plated items that are disposed at the refuse
dumps both in urban and rural communities. Also, these water bodies are very soft (<50 mg/L) and very soft waters are
known to have plumbo-solvency (liability to take lead into solution) (Porteous, 2000).
The most significant zinc ores include sphalerite (ZnS) and smithsonite (ZnCO3). These compounds end up in water on
locations where zinc ores are found. About three-quarters of the total zinc supply is used in metal form. The remainder is
applied as various zinc compounds in various industries. Industrial wastewaters containing zinc stem from galvanic
industries, battery production, etc. (Porteous, 2000).
The absence of zinc in both dry and rainy seasons in River Mkomon is a clear indication that there was no zinc ores,
galvanic industries and battery production sites near the river bank where they can be transported during rain into the
river.
Total Coliforms:
The Total coliforms numbers increased uniformly at the upstream water (at station A, both in dry and rainy seasons). The
Total coliform numbers per 100 milliliters of water varied from 154 to 161 CFU during the dry season and 153.3 to 164.4
CFU during rainy season. The total coliform values decreased linearly uniformly during rainy season (Table 4 and Figure
5) and for rainy season the values fluctuated. The difference in total coliform densities between the dry and rainy season’s
waters was not significant as can be seen from ANOVA analysis.
The total coliform count (TCC) for all samples were exceedingly higher than the WHO, NESREA and SON standard for
coliform bacteria in water which is zero total coliform per 100 milliliters of water (Appendice 1). Tables 4 and 5 showed
the total coliform counts (TCC) for the various points of sampling. The least TCC was observed during dry season and it
was 154.4 MPN per 100 mililitres while the highest TCC was recorded during the rainy season with a value of 164.4
MPN per 100 milliliters of water samples. This is contrary to Olayemi (1994), who work on River Osun where higher
total coliform count was recorded during the dry season. The high total coliform count during the rainy season (than the
dry season) was in lined with Venkatesharaju et al., (2010) who investigated the physico-chemical and bacteriological
ISSN 2350-1030
International Journal of Recent Research in Physics and Chemical Sciences (IJRRPCS)
Vol. 5, Issue 1, pp: (42-62), Month: April 2018 – September 2018, Available at: www.paperpublications.org
Page | 56 Paper Publications
parameters of River Cauvery kollegal stretch in Karnataka. Their results revealed that rainy season exhibited more counts
than the dry season. This high coliform count during rainy season was attributed to discharging of domestic wastes
containing faecal matters to the river body and open defecation along the sides of river bank. None of the sampling points
of the water sources complied with WHO, NESREA and SON standard for coliform in water (Appendice I). According to
WHO standard, every water sample that has coliform must be analyzed for total/feacal coliforms with a view to
ascertaining contamination with human or animal waste and possibly pathogenic bacteria (Venkatesharaju et al., 2010).
Total Hardness:
Total hardness is due to the presence of bicarbonate, sulphate, chlorides and nitrates of calcium and magnesium. Hard
water requires more soap and synthetic detergents for home laundry and washing, and contributes to scaling in boilers and
industrial equipments (ASAE and WQA, 2016). The WHO maximum permissible limit of total hardness for drinking
water is 600 mg/L (Appendix I).
Mean value of total hardness was found to be 70.7, 71.0, 133.7, 57.4 (mg/L) for Abande, Chafa, Anwase and Waya
stations, respectively, during the rainy season (Table 5) and 66.7, 46.7 and 113.6, (mg/L) as mean values for stations
Abande, Chafa and Anwase, respectively, during the dry season (Table 4). There was significant difference among
sampling sites, but no significant difference was observed in seasons (ANOVA, Appendices II-VI).
The result of hardness indicated low hardness values during dry season (75.7 mg/L) and high values during rainy season
(83.2 mg/L) which may probably be due to high rate of inflow during rainy season and low value during dry season due to
reduced inflow rate.
Results of One-way ANOVA and T-test:
There was no significant difference between physicochemical and bacteriological variables of water from the three
sampling points (stations A, B and C) during the dry season .This can be justified from the ANOVA results.
The ANOVA table for dry season sampled at stations A, B and C has an F (2, 132) = 0.133 and a significant value of
0.875 which was greater than 0.05 the critical alpha value. Therefore the null hypotheses that; there was no significant
difference between physicochemical and bacteriological variables of water from stations A, B and C, Kwande LGA
during dry season was accepted (Appendices II-VII).
Similar trend was observed during the rainy season with stations A,B,C and D sampling points having F (3, 170) = 0.074
and a significant value of 0.974 which was greater than 0.05 the critical alpha value. Therefore the null hypothesis that:
there was no significant difference between physicochemical and bacteriological parameters of water from Mkomon
River sampled at stations A, B, C, and D, Kwande LGA during the rainy season was accepted.
The t- test was used to test for the significant difference between physicochemical and bacteriological variables of water
from Mkomon river sampled at stations A, B, C and D, Kwande LGA during the dry and rainy seasons. A mean value of
9.132 for dry season and 8.744 for rainy season, standard deviation of 13.937 and 11.134 for dry and rainy seasons,
respectively, were derived. At a value of 0.272, degree of freedom (df) of 307, and a significant value of 0.785 which is
greater than 0.05, the critical alpha value, therefore the null hypotheses was accepted: that there was no significance
difference between the dry and rainy season physicochemical and bacteriological variables of water from Mkomon River
sampled at stations; A, B, C and D, Kwande LGA during both seasons (Appendices II-VI).
5. CONCLUSION AND RECOMMENDATIONS
Conclusion:
The bacteriological quality of the water of River Mkomon sampled at Abande,Chafa Anwase and Waya was
unacceptable, and would pose serious health risks to consumers who use them without treatment.
The bacterial counts detected were above the permissible limits for drinking water in all the sampled stations. Data
suggested the importance of greater attention for household contamination, environmental sanitation control and
awareness about water contamination. Improvement in water quality and availability will aid hygienic practices and
interrupt the transmission of enteric pathogens through contaminated water in the studied areas. Provision of sewerage
systems and public health education aimed at improving personal, household and community hygiene is imperative.

ISSN 2350-1030
International Journal of Recent Research in Physics and Chemical Sciences (IJRRPCS)
Vol. 5, Issue 1, pp: (42-62), Month: April 2018 – September 2018, Available at: www.paperpublications.org
Page | 57 Paper Publications
6. RECOMMENDATIONS
River Mkomon is a source of drinking and domestic water to its host communities and the study carried out on the river
revealed some level of pollution of the water. Therefore recommend that;
(i) The use of chemicals such as herbicides and pesticides by farmers around the bank of river Mkomon should be
monitored and applied appropriately.
(ii) More studies should be conducted on the river to know the level of pollution and to check people’s activities on the
river.
(iii) River Mkomon should be frequently monitored to ascertain the seasonal variation in the chemical, physical and
bacteriological parameters of the river, since we are faced with the problem of flooding in Benue state in which river
mkomon is not an exception. In the process increase in level of pollution of the river could be detected early and
mitigation measures could be put in place early enough to prevent an epidemic.
ACKNOWLEDGEMENT
I would like to express my very great appreciation to my supervisors Prof. R.A Wuana for his valuable and constructive
suggestions, comments, remarks and engagement during the planning and development of this research work. His
willingness to give his time so generously has been very much appreciated.
My appreciation also goes to Augustine Abel of the Department of Chemistry, Federal University, Lafia for his
Contributions towards the development and analysis of this research work. Kudus to you.
REFERENCES
[1] Abbasi, S.A (2002).Water quality indices, state of the art report, National Institute of Hydrology, scientific
contribution no.INCOH/SAR-25/2002, Roorkee: INCOH. p: 73.
[2] Abida, B. and Harikrishna, (2008), Study on the Quality of Water in Some Streams of Cauvery River, Journal of
Chemistry, 5(2): 377-384.
[3] Abowei, J.F.N (2010). Salinity dissolved oxygen, pH and surface water temperature conditions in Nkoro River,
Niger Delta, Nigeria. Advanced Journal of Food Science and Technology 2(1): 36-40.
[4] Adejuwon, J. O. and Adelakun M. A (2012).Physiochemical and bacteriological analysis of surface water in
Ewekoro Local Government Area of Ogun State, Nigeria: Case study of Lala, Yobo and Agodo Rivers.
International Journal of Water Resources and Environmental Engineering 4(3), 66-72,
[5] Ademoroti, C. M. (1996) Environmental Issues and Management in Nigerian Development. Ibadan. Evans
Publisher. pp. 67-75. 2nd
Edition.
[6] Ahipathi, M.V., and Puttaiah, E.T., (2006). Ecological Characteristics of Vrishabhavathi River in Bangalore
(India), Environmental Geology, 49: 1217-1222.
[7] Ahmed, A., Dilek, D. and Fatih, D. (2005) Bioaccumulation, detection and analyses Of heavy metal pollution in
sultan marsh and environment. Water, Air and Soil Pollution, 164: 241-255.
[8] Akoachere, J.F., Oben, P.M., Mbivnjo, B.S., Nkwelang, G and Ndip, R.N. (2008). Bacterial indicators of pollution
of the Douala Lagoon Cameroon: Public health implication. African journal of Health Science 8 (2): 85–89.
[9] Akpan, A.W. (2004): The water quality of some tropical fresh water bodies in Uyo(Nigeria) receiving municipal
effluents, slaughterhouse washings and agricultural land drainage. The Environmentalist, 24:49-50.
[10] American Society For Agricultural Engineers (ASAE) And Water Quality Association (WQA) (2016).Standard
Methods for The Examination of Water And Wastewater 19th Edition p: 345-407
[11] APHA (2005). Standard methods for examination of water and wastewater (21st edn). American Public Health
Association, Washington D.C., USA p: 201-250
[12] Ashraj, W. (2005) Accumulation of Heavy Metals in Kidney and Heart Tissues of Epinephelus Microdon Fish
from the Arabian Gulf. Environmental Monitoring Assessment 101(1-3): 311-316.
ISSN 2350-1030
International Journal of Recent Research in Physics and Chemical Sciences (IJRRPCS)
Vol. 5, Issue 1, pp: (42-62), Month: April 2018 – September 2018, Available at: www.paperpublications.org
Page | 58 Paper Publications
[13] Atekwanna,Eliot A.;Estella.A; Rebecca S.; D. Dale,Legalld;Franklyn D.(2004). The relationship of total dissolved
solids measurements to bulk electrical conductivity in an aquifer contaminated with hydrocarbons. Journal of
applied Geophysics, 56(4):281-294.
[14] Belay T. and Eshete A.(2014).Determination of copper and zinc(heavy metals) in water of Lake Chamo,
Arbaminch Ethiopia. World journal of chemical Education, 2 (3):42-47
[15] Bordalo A.A, Teixeira R, Wiebe WJ (2006). A water quality index applied to an international shared river basin:
The case of the Douro River. Environmental journal of Management. 38:910–920.
[16] Brian, O. (2012) PA Guide to drinking water, 2nd edition, Edwin publisher. Journal of applied science, 64(2) 45-
60
[17] Burton G.A, Baudo R.,Beltrami M., and Rowland C.(2001). Assessing Sediment Contamination using six toxicity
assays.Journal of Limnology, 60(2):263- 267
[18] Caddy, J.F (2000). Marine catchment basins effects versus impact of fisheries on semi-enclosed seas. International
council for the Exploration of the sea, Journal of Marine science, 57:628-640
[19] Censi,P.,Spoto,S.E, Saiano, F.,Sprovicri,M., Mazzola, B., Nardone,G., Digeronimo,S.I, Puntu,R and Ottonello,D
(2006). Heavy metals in coastal water system. A case study from the north western Gulf of Thailand. Journal of
Environmental science,64:1167-1176.
[20] Charkhabi, A.H and Sakizadeh, M.(2006).Physico-chemical Analysis of Yamuna River. Journal of environmental
science, 19(19)117-127
[21] Chapman, D. (1996).Water quality assessment. In Guide to the used of biota, sediments and water in
environmental monitoring (2nd Edn.). Edited by E.F.N. Spon. London publishers, 2(3):45-74
[22] Chatterjee C, Raziuddin M (2002). Determination of water quality index of a degraded river in Asansol industrial
area, West Bengal. Journal of Environmental Pollution, (2):181-189.
[23] Chatterjee, S.N., Das, D.1., Roy, M.1., Banerjee, S.1., Dey, P.1., Bhattacharya, T. and Chandra, G. (2007).
Bacteriological examination of drinking water in Burdwan, India with reference to coliforms. African Journal of
Biotechnology,6 (22): 2601-2602.
[24] Chisty. N., (2002), Studies on Biodiversity of Freshwater Zooplankton in Relation to Toxicity of selected Heavy
Metals. Ph. D. Thesis submitted to the Department of Biology, M.L Sukhadia Univeristy Udaipur.p:80
[25] Dey, Kallol, Mohapatra, S. C., Misra, Bidyabati,A. (2005), Assessment of water quality parameters of the river
Brahmani at Rourkela. Journal of Industrial Pollution Control, 21(2): 265-270.
[26] Djuikom, E., Njine, T., Nola, M., Sikati, V. and Jugnia, B. (2006). Microbiological water quality engineers. (2nd
Ed.) New York: E and FN Spon Publisher. Environmental Monitoring Assessment, 122: 171 - 183.
[27] Diersing.N(2009).” Water quality. Frequently Asked questions” PDA, NOAA. Published on the internet: http://
floridakeys.Noaa.Gov/pdfs/wq.pdf (accessed 22 June, 2003).
[28] Dupler,D.(2001). Heavy metal poisoning. Gale Encyclopedia of Alternative medicine Farmington Hills,M.I. Gale
Group,3:234256.
[29] El Bouraie, M.M., El Barbary, A.A., Yehia, M.M. & Motawea, E.A. (2010) Heavy metal concentrations in surface
river water and bed sediments at Nile Delta in Egypt. Journal of Environmental Science, 61(1): 1–12.
[30] Eneji, I.S.(2010).Spatial and temporal Variation in the heavy metals loading of River Benue in makurdi
metropolitan area, PhD. Thesis, Department of chemistry university of Agriculture makurdi, Nigeria.p:105
[31] Environmental Protection Agency (EPA) (2001).Parameters of water quality interpretation and standards.www.
epa.ie/pubs/advice/water/quality/water-quality.pdf
[32] Faisal K, Tahir H, Ashok L (2003). Water quality evaluation and trend analysis in selected watersheds of the
Atlantic region of Canada. Journal of Environmental Monitoring Assessment, 88:221-248.

ISSN 2350-1030
International Journal of Recent Research in Physics and Chemical Sciences (IJRRPCS)
Vol. 5, Issue 1, pp: (42-62), Month: April 2018 – September 2018, Available at: www.paperpublications.org
Page | 59 Paper Publications
[33] Fakayode, S.O. ( 2005). Impact of industrial effluents on water quality of the receiving Alaro River in Ibadan,
Nigeria. African Journal of Environmental Assessment and Management, 10: 1 - 13.
[34] National Environmental Standards and Regulation Enforcement Agency (2009) Federal Republic of Nigeria
Official Gazette: 68 Edition, Abuja,Federal Government Printer,Abuja.Vol.96
[35] Fewtrell, L. and Bartram, J. (2001). Water quality: Guidelines, standards and health. London, UK.
[36] Fischeder, R. and Gebel, J. (2002). Microbial load of drinking water reservoir tributaries during extreme rainfall
and runoff. Journal of Applied Environmental Microbiolog,65 (5): 251 - 264.
[37] Galadima,A., Muhammed,N.U.and Garta, Z.N.(2010). Spectroscopic investigation of heavy metals in wastewater
from university students halls of residence Usman Danfodiyo University Sokoto, Nigeria. African Scientific and
Research Journal, 11: 23-245.
[38] Garg R. K., Rao R. J., Uchchariya D., Shukla G., Saksena D. N.(2010). Seasonal variations in water quality and
major threats to Ramsagar reservoir,India. African Journal of Environmental Science and Technology, 4(2): 061-
076,
[39] George, W.W (1991).Reviews of Environmental Contamination and Toxicology. Journal of Ecotoxicology and
Environmental Monitiring, 122:50-60
[40] Gwimbi P. (2011).The microbial quality of drinking water in manonyane community:Maseru District. Journal of
African Health Science, 11 (3):474-80
[41] Hasalam, S.M., (1991). River Pollution – An ecological Perspective, Belhaven Press, Great Britain.6th
Edition:70-
90
[42] Hujare, M.S.(2008).Seasonal Variation of physic-chemical parameters in the perennial Tank of Talsande,
Maharashtra. Journal of Ecotoxicology and Environmental Monitiring, 18:233-242.
[43] Hoko Z. (2008). An assessment of quality of water from boreholes in Bindura District, Zimbabwe. Journal of
Physics and Chemistry of the Earth, 33: 824–828.
[44] Ibandarisuk L. and Highland K. (2012). Physico-Chemical and Bacteriological Characteristics of Umiam Lake,
Meghalaya, India. International Journal of Advanced Life Sciences, 3(2):67-80
[45] Izonfuo, L. W.A. and Bariweni, A. P (2001): The Effect of Urban Runoff Water and Human Activities on some
physico-chemical parameters of the Epie Creek in the Niger Delta. Journal of Appied Sciences and Environmental
Management, 5(1) 47-55
[46] Jonasson L, Hansen JLS, Wan Z, She J (2012). The impacts of physical processes on oxygen variations in the
North Sea-Baltic Sea transition zone. Ocean Science Journal, 8: 37–48.
[47] Kannel, P R, Lee S, Lee YS, Kanel SR, Khan SP (2007). Application of water indices and dissolved oxygen as
indicators for river water classification and urban impact assessment. Journal of Environmental Monitoring
Assessment,
[48] 132:93–110.
[49] Karafistan A, Arik-Colakoglu F (2005).Physical, chemical and microbiological water quality of the Manyas lake,
Turkey. Migration and Adaptation Strategies for Global Change, 10:127-143.
[50] Karikari, A.Y and Ansa-Asare O.D (2005). Physico-Chemical and Microbial Water Quality Assessment of Densu
River of Ghana. West African Journal of Applied Ecology, 10: 87-100.
[51] Kazi, T.G, Arain, M.B, Jamali, M.K, Jalbani, N., Afridi, H.I, ,Sarfraz ,R.A, Baig, J.A, Shah, A.Q (2009).
Assessment of water quality of polluted lake using multivariate statistical techniques: A case study,Journal of
Ecotoxicology and Environmental Safety, 72(20): 301-309.
[52] Khan, F., Husain, T., Lumb, A. (2003). Water quality evaluation and trend analysis in selected watersheds of the
Atlantic region of Canada. Environmental Monitoring Assessment Journal, 88:221–242.
ISSN 2350-1030
International Journal of Recent Research in Physics and Chemical Sciences (IJRRPCS)
Vol. 5, Issue 1, pp: (42-62), Month: April 2018 – September 2018, Available at: www.paperpublications.org
Page | 60 Paper Publications
[53] Kirubavathy A.K, Binukumari S., Mariamma N., Rajammal T., (2005).Assessement of water quality of
Orthupalayam reservoir, Erode District, TamilNadu. Journal of Ecophysiology and Occupational Health, 5:53-54
[54] Kistemann, T., Classen, T., Koch, C., Dangendorf, F., Fischeder, R. and Gebel, J. (2002). Microbial load of
drinking water reservoir tributaries during extreme rainfall and runoff.Application Environmental Microbiology, 65
(5): 251 - 264.
[55] Kotas J. and Stasicka Z.(2000).Chromium occurrence in the environment and methods of its speciation.
Environmental pollution, 107(3):263-283.
[56] Kumar, J, Singh, S., Pal, A. (2008). Water quality of Turamdih,Jaduguda at uranium mines sites and adjacent
areas, East Singhbhum. Journal of Ecophysical Occupation and Health, 8: 7-14
[57] Kumar, V., Arya, S., Dhaka, A., Minakshi and Chanchal,A. (2000). A study on
[58] physico-chemical characteristics of Yamuna River around Hamirpur (UP), Bundelkhand region central India,
International Multidisciplinary Research Journal, 1(5): 14-16.18.
[59] Mahananda, M.R., (2010), Physico-Chemical analysis of surface water and ground water of Bargarh District,
Orissa, India, International Journal of Research and Review in Applied Sciences, 2 (3): 284- 295.
[60] Manju, D. (2015). A Comparative Study of Physico-Chemical Properties and Bacteriological Analysis of Narmada
River at Mandla Town, Near Jabalpur City Madhya Pradesh, India. Asian Resonance Journal, 60(2): 2349 – 9443
[61] Medudhula N.D. ,Thirupathaiah A.A, Samatha C.H, Chintha S. (2012). Analysis of water quality using physico-
chemical parameters in lower manair reservoir of Karimnagar district, Andhra Pradesh. International Journal of
Environmental Sciences, 3(1):80-90
[62] Mishra, A. (2010) Assessment of Water Quality Using Principal Component Analysis: A Case Study of the River
Ganges. Journal of Water Chemical Technology, 32 (4): 227 - 234.
[63] Mishra, A. and Bhatt, V. (2008). Physico-Chemical and Microbiological Analysis of underground Water in V.V
Nagar and Nearby Places of Anand District, Gujarat, India. Electronic Journal of Chemistry, 5 (3): 487- 492.
[64] Mishra, A., Mukherjee, A. and Tripathi, B.D, (2009). Seasonal and Temporal Variations in physicochemical and
Bacteriological Characteristics of River Ganga in Varanasi. International Journal of Environment Research, 3(3):
395-402.
[65] Mmom, P.C. and Chukwu-Okeah, G.O. (2011); Factors and Processes of Coastal Zone Development in Nigeria: A
Review Research Journal of Environmental and Earth Sciences, 3(6): 625-632.
[66] Mondol, M.N., Chamon, A.S., Faiz, V. and Elahi, S.F. (2011) Seasonal variation of heavy metal concentrations in
water and plant samples around Tejgaon Industrial area of Bangladesh. Journal of Bangladesh Academy of
Sciences, 35 (1): 19-41.
[67] Morrissey J.H, Choi S.H, and Smith S.A (2012).Polyphosphate: an ancient molecule that links platelets,
coagulation and inflammation. Blood, 119:5972-5979.
[68] Mustafa, S. and Nilgun, D.E. (2006) Copper(II)-rubeanic acid coprecipitation system for
separationpreconcentration of trace metal ions in environmental samples for their flame atomic absorption
spectrometric determinations. Journal of Hazardous Materials, 137: 1035-1041.
[69] National Population Commission (2006).Census Report and population of Nigeria. 5th
Edition, 45:67
[70] Nogueira, G., Nakamura, V.C., Tognim, C.B.M., Filho, A.A.B., Filho, P.D.B, (2003). Microbiological quality of
drinking water of urban and rural communities, Brazil. Rev. Saude Publication, 37(2):232-236.
[71] Obire A., Izonfuo, L. W.A. and Bariweni, A. P (2003): The Effect of Urban RunoffWater and Human Activities on
some physico-chemical parameters of the Elechi Creek in port Harcourt,Nigeria. Journal of Applied Sciences and
Environmental Management, 5(1) 47-55
[72] Okoye C.O.B. , Ugwu J.N., Ibeto C.N.(2010). Characterization of Rural Water Resources for Potable Water
Supply in Some Parts of South-Eastern Nigeria. Journal of Chemical Society of Nigeria, 35(1):83-88
ISSN 2350-1030
International Journal of Recent Research in Physics and Chemical Sciences (IJRRPCS)
Vol. 5, Issue 1, pp: (42-62), Month: April 2018 – September 2018, Available at: www.paperpublications.org
Page | 61 Paper Publications
[73] Olayemi, A. B. (1994). Bacteriological water assessment of urban river in Nigeria. International Journal of
Environmental Health Resources, 4:156-164.
[74] Oluyemi A.A., Comfort N. O., Okon A. E., Tokunbo O. , Sammy U. U. , Edet U. H.,(2014).Seasonal variation in
the physico-chemical Characteristics of Surface Water in Etche River, Niger Delta Area of Nigeria. IOSR Journal
of Environmental Science, Toxicology and Food Technology, 8(7): 01-07
[75] Osuinde. M.I. and Eneuzie, N.R. (1999). “Bacteriological analysis of ground water.” Nigeria Journal of
Microbiology, 13:47-54
[76] Padmanabha B, Belagali S.L, (2007). Water quality index of Kabini river in the kallahally village of Nanjangud
Taluka of Mysore District, Karnataka. Journal of Environmental Science, 49(1):48-50.
[77] Pandit, A.K, Rathore S.A, Bhat S.A (2001). Limnological features of freshwater of Uri, Kashmir. Journal of
Research Development, 1: 22-29.
[78] Patel, V. and Parikh P(2013). Assessment of seasonal variation in water quality of River Mini, at Sindhrot,
Vadodara. International Journal of EnvironmentalSciences, 3(5): 20-133.
[79] Pejman A.H, Bidhendi N.G.R, Karbassi A.R, Mehrdadi N, Bidhendi EM (2009). Evaluation of spatial and seasonal
variations in surface water quality using multivariate statistical techniques. Journal of Environmental Science
Technology, 6(3):467-476.
[80] Perlman,H.(2014).sediment and suspended sediment. In the USGS water science school.Retrieved from
http://water.usgs.gov/edu/sediment.html
[81] Pestle, S. (2000). Physico-Chemical Characteristics of river Ngu. Resource Journal of Chemistry and
Environment, 10 (3): 62 - 66.
[82] Porteous, A. (2000) Dictionary of Environmental Science and Technology, 3rd edition
[83] Premlata, N. and Vikal, K. (2009), Multivariant analysis of drinking water quality parameters of lake Pichhola in
Udaipur, India. An International Journal of Biological Forum, 1(2): 97-102.
[84] Raji O. R., Oluduro A.O and Ofoezie E.(2014). Physico-chemical and Bacteriologicalcharacterization of Oke-Afa
canal water in Lagos State, Nigeria. Journal of Nature and Science, 12(11):20-2
[85] Rajurkar, N.S., Nongbri, B and Patwardhan, A.M. (2003). Physicochemical and Microbial analysis. Journal of
Nature and Science, 34 (2)24-53
[86] Rajkumar, S., Velmurugan, P., Shanthi, K., Ayyasamy, P.M.( 2004). Water Quality of Kodaikanal lake, Tamilnadu
in Relation to Physico-Chemical and Bacteriological Characteristics, Capital Publishing Company, 8(20):339-346.
[87] Ranu (2001), Studies on toxicity of textile effluents to fresh water Zooplankton. Ph.D. Thesis submitted to
the Department of Zoology, M.LSukhadia University Udaipur : 90
[88] Robin A. and Bernhoft(2012).mercury toxicity and treatment: A review of the literature. Journal of Environmental
public Health, 20(10):45-60
[89] Rucinski, D.K, Beletsky .D, DePinto J.V, Schwab D.J, Scavia D (2010). A simple-dimensional, climate based
dissolved oxygen model for the central basin of lake Erie. Journal of Great Lakes Reserves, 36: 465-476.
[90] Rustum, R., Adeloye, A.J, Scholz M (2008). Applying Kohonen Self organising map as a software sensor to
predict the BOD. Water Environment Resources, 80(1): 32-40
[91] Sanderson, M.W., Sargeant, J.M., Renter, D.G., Griffin, D.D and Smith, R.A. (2005). Factors associated with the
presence of coliforms in the feed and water of feedlot cattle. Journal of Environment and. Microbiology, 71 (10):
6026 - 6032.
[92] Scoullos, M.J.(2001).Mercury,Cadmium and Lead:Handbook for sustainable Heavy metals policy and regulations.
Springer.pp.104-116,4th
Edition,USA.

ISSN 2350-1030
International Journal of Recent Research in Physics and Chemical Sciences (IJRRPCS)
Vol. 5, Issue 1, pp: (42-62), Month: April 2018 – September 2018, Available at: www.paperpublications.org
Page | 62 Paper Publications
[93] Singh, V.K (2006). Assessment of the Quality of Drinking Water in Outer Rural Delhi. Physico-chemical
characteristics. Research Journal of Chemistry and Environment, 10 (3): 62 - 66.
[94] Singh, V.K. and Singh, J. (2006) Toxicity of industrial wastewater to the aquatic plant Lemna minor L. Journalof
Environmental Biology, 27:385-390.
[95] Singh, J., Upadhyay, S.K., Pathak, R.K. and Gupta, V. (2011) Accumulation of heavy metals in soil and paddy
crop (Oryza
[96] sativa), irrigated with water of Ramgarh Lake, Gorakhpur, UP, India. Journal of Toxicology and Environmental
Chemistry, 93(3): 462-473.
[97] Smitha, Ajay D. and Shivashankar P.(2013).Physico Chemical Analysis of the Freshwater at River Kapila,
Nanjangudu Industrial Area, Mysore, India. International Research Journal of Environment Sciences, 2(8):59-65,
[98] Srivastava, P.K., Mukherjee, S., Gupta, M. and Singh, S.K., (2011), Characterizing Monsoonal Variation on
Water Quality Index of River Mahi in India using Geographical Information System. Water Quality Expo Health,
2:193–203.
[99] Stream-keepers Field Guide,(1991). Watershed inventory and stream monitoring methods.www.amazon.com/
thestreamkeepers-field-Guide monitoring/dp/0965210901.p:56-60
[100] UNEP.(2000) Global Environmental Outlook, United Nations Environment Programme Global State of the
Environment Report.p:510-600
[101] USEPA (1997). Manual on Monitoring Water Quality. EPA 841-B-97-003.P:78-85 United state Geological Survey
(USGS)
[102] (2016). Water-Quality Information: Water Hardness and Alkalinity www.water.usgs.gov/owq/hardness-alkalinity
[103] United state Geological Survey (2009). Mineral Information:cadmium,62(3):23-28 Velez D. and Montoro
R.(1998).Arsenic speciation in manufactured seafood products: a review Journal of Food Protection, 61(9):1240-
1245
[104] Venkatesharaju K., Ravikumar. P., Somashekar. R. K., Prakash. K. L. (2010). Physico-chemical and
Bacteriological Investigation on the River Cauvery of Kollegal Stretch in Karnataka. Kathmandu University
Journal of Science, Engineering and Technology, 6 (1): 50-59
[105] Voegborlo, R.B, Methanani,A.M.E and Abedin,M.Z.(1999). Mercury, Cadmium and Lead Content of Canned
Tuna Fish.Food Chemistry, 67(4):341-345.
[106] Wang, X., Lu, Y., Han, J., He, G. & Wang, T., (2007), Identification of anthropogenic influences on water quality
of Rivers in Taihu watershed. Journal of Environmental Science (China), 19:475–481.
[107] Warhate, S.R, Yenkie M.K.N, Chaudhari M.D, Pokale, W.K, (2006). Impacts of MiningActivities on Water and
Soil. Journal of Environmental Science, 48(2):81 - 88. White W.M (2011). Aquatic Chemistry textbook, 1(5):460-
780, white publishers.
[108] WHO,(2002). The world health report” Reducing Risks”. Promoting Healthy Life Worldwide.
[109] WHO,(2004). Guideline for Drinking Water Quality. 3rd
Edition. World Health Organization, Geneva, p: 104.
[110] WHO. (2003). Background document for preparation of WHO Guidelines for drinking-water quality. Geneva,
World Health Organization. WHO /SDE /WSH/ 03.0 p: 345
[111] WHO. (2006). Guidelines for Drinking–Water Quality. Geneva, WHO. Vol.1.77 – 758X p: 120-342
[112] Zarazua G., Ávila-Pérez P., Tejeda S., Barcelo-Quintal, I. and Martínez T.(2006) Analysis of total and dissolved
heavy metals in surface water of a Mexican polluted river by Total Reflection X-ray Fluorescence Spectrometry,
Spectrochimica Acta Part B: Atomic Spectroscopy, 61:1180-1184.