regional and seasonal variation of polycyclic aromatic
TRANSCRIPT

Journal of Natural Sciences Research www.iiste.org
ISSN 2224-3186 (Paper) ISSN 2225-0921 (Online) DOI: 10.7176/JNSR
Vol.9, No.14, 2019
31
Regional and Seasonal Variation of Polycyclic Aromatic
Hydrocarbons in Water and Mollusca at Quarna North of Shatt
AL-Arab River
Eman A.AL-Talal Amar.A.Talal Hamid T. AL-Saad*
Department of Ecology-College of Science-Basrah University,Iraq.
*College of Marine Scince-Basrah university,Iraq
Abstract
Distribution and seasonal variations and sources of of the sixteen polycyclic aromatic hydrocarbons (PAHs) was
studied in surface water and and fuor species of molluscs (Theodoxus Jordani, Melanoides taberculata
Melanopsis nodosa, Bellamya bengalensis ) from three stations at Al-Quarna in Shatt Al Arab river during the low
tide period from September, 2018 to March, 2019 . Liquid-liquid extraction was used for water samples, while
PAHs in molluscs were extracted using Soxhlet Extraction and finally analyzed by means of gas chromatography.
physical and chemical parameter were measured such as . Water Temperature range from (13°C to 39°C),
Dissolved oxygen range from (6.5 mg/l to 3.84 mg/l),PH range from (8.15-7.17) and Electrical conductivity (2.59
ms/cm- 4.75 ms/cm). Results of PAHs in water samples was ranged from (1.4754ng / l) during summer in the first
station to (3.4215ng / l) during winter at the third station. While the total PAHs in molluscs range from 0.876 ng/g
dry weight in the T.jordani in station 1during summer to 9.093 ng/g dry weight in the B.bengalensis during winter .
The Highest concentration of PAHs in the four species were arranged as fellow :Bellamya bengalensis ˃
Melanopsis nodosa ˃ Melanoides taberculata ˃ Theodoxus Jordani. When we compares the concentration TPHs
in water and molluscs with other study it allies within these concentration.
Keywords: PAH, water, Mollusca, Pollution,Qurna,ShattAL-Arab River,Basrah,Iraq
DOI: 10.7176/JNSR/9-14-05
Publication date:July 31st 2019
Introduction
The condition and health of the aquatic environment is constantly being monitored so that the effects of pollution
can be better understood and its impact reduced (1). The extent of contamination can be assessed by measuring
pollutant concentrations in water, sediments and organic tissue samples. Although easier to process ,water samples
are difficult to interpret since the water is constantly flowing, transporting pollutants from one place to another
while diluting them, often to concentrations below detection limits (2). One of the most dangerous pollutant for
water environment is petroleum hydrocarbons and it's derivatives (3).only limited information is available on the
fate of hydrocarbons in the Shatt Al-Arab river. An important route is the uptake and assimilation of these
compounds by aquatic organisms in general and mollusca in particular(4). Molluscs are well known for their ability
to accumulate hydrocarbons (and other pollutants) and have been employed as indicators of petroleum
contamination in many parts of the world (5). Among petroleum hydrocarbon pollutants sixteen polycyclic
aromatic hydrocarbons (PAHs) are listed as priority pollutants due to high stability in the environment (6,7).
Polycyclic aromatic hydrocarbons (PAHs),having two or more fused benzene rings, are a group of organic
pollutants that occur widely in the environment (8) .
There are two origins of PAHs in the environment, natural and anthropogenic.The natural origin attributes
to forest fires and volcanic activity, etc. (PAH background values). The anthropogenic one includes incomplete
combustion of fossil fuels, and industrial emissions (PAH contamination levels) (9, 10). Aquatic environments are
also polluted with PAHs through anthropogenic activities such as accidental oil spills, discharge from routine
tanker operations, and municipal and urban runoff. Additionally they tend to accumulate preferentially in river and
marine sediments rather than in air or water, due to their high hydrophobicity (11). Generally, PAHs are
hydrophobic with very little solubility in water which decreases with increasing molecular weight or the number
of fused aromatic rings. The high molecular weight (HMW) PAHs (≥ 4 fused aromatic rings) are less water-soluble,
less volatile and more lipophilic than lower molecular weight (LMW) PAHs (≤ 3 fused aromatic rings) (12, 13,14)
Due to their carcinogenic and mutagenic effects to both terrestrial and aquatic organisms, PAHs have attracted
much attention (15).
Shatt Al-Arab River is the most important river in Iraq, because of its economical , social and ecological
values. It is the main source of surface water in Basrah City, southern of Iraq. It's water has been used for various
purposes including potable water supply, irrigation, fisheries, navigation, and industrial uses. Moreover, Shatt Al-
Arab River is the prime fresh water source and pours about 5x10⁹ m3 nutrient rich water into the Arabian Gulf
each year (16).The Shatt Al-Arab river are known to be severely polluted due to entry of both domestic sewage
and industrial wastewater. The industrial effluents are derived from paper and fertilizer mills, electrical power
brought to you by COREView metadata, citation and similar papers at core.ac.uk
provided by International Institute for Science, Technology and Education (IISTE): E-Journals

Journal of Natural Sciences Research www.iiste.org
ISSN 2224-3186 (Paper) ISSN 2225-0921 (Online) DOI: 10.7176/JNSR
Vol.9, No.14, 2019
32
stations, refined oil plants, petrochemical manufacture and other industries (17).
The aims of the present study are to determine the concentrations and source of Polycyclic Aromatic
hydrocarbon fractions in water and mollusca, to give baseline data for further work.
Materials and Methods:
Study area and sampling sites:
The confluence of the Tigris and Euphrates rivers at the town of Qurna, north of Basra city forms the Shatt Al-
Arab River, which flows to the south west to the Arabian Gulf. The Shatt Al-Arab River has a length of 200 km,
a width range between 400 m at Basra and up to more than 2 km at the estuary and a depth of between 8-15 m,
considering tides (18 , 19). This study was conducted during the period Spt. 2018 to Mar.,2019. Samples of water
and four species of molluscs, (Theodoxus Jordani, Melanoides taberculata Melanopsis nodosa, Bellamya
bengalensis ) were collected from the three stations at Quarna in the northern of Shatt al-Arab(Figure 1). Water
samples were collected at least 20 -30 cm under the water surface and whenever it was possible at the middle of
the river using dark glass bottles and preserved in situ with 25 ml. CCl4. Samples were never taken when it was
raining, molluscs Samples were collected at least 350 adult individuals of uniform size of each species.
The tissues of the animals were pooled and macerated in a food liquidizer from which at least 3 replicates of 15g
each were freeze-dried, grounded and sieved through a 63 μ metal sieve.
(Figure 1) Map of Shatt al-Arab River showing the three sampling stations.
Environmental measurements:
Water physical and chemical parameters including Dissolved oxygen (DO) and Water Temperature (WT),
Electrical Conductivity (EC), and pH were measured insitu using the Multimeter type (Multi 350 i SET 5 ).
Extraction of PAHs from water:
Hydrocarbons in water sample (about 5L) were extracted according to (20) by mixing with another (25 ml ) CCl4
for 20 min. using Water Mixer, the liquid fraction was drained , and the residual ( about 1L) was transferred into
separator funnel . The organic (lower) phase was carefully poured into a glass column containing (5g) of anhydrous
sodium sulfate (Na2SO4) ,collected and dried . The residual was dissolved with n-hexane (25 ml ) , and passed
through a 20 cm glass column ( packed with glass wool at the bottom , about 10 g deactivated silica gel (100-200
mesh), 10 g deactivated alumina ( 100-200 mesh) , and 5g anhydrous sodium sulfate (Na2SO4) at the top ). The
aromatics were eluted with benzene (25 ml) .The samples dried and stored until detection with Gas-liquid
chromatography (for Polycyclic aromatic hydrocarbons (PAHs) .
Helium used as carrier gas in liquid Gas Chromatography with linear velocity of 1 ml./min and Flam
Ionization Detector(FID) the operating temperatures for injector and detector were 300ᵒC and 320ᵒC , respectively ,
and the column temperature was held at 50ᵒC as initial temperature for 8 min. then 8ᵒC/min to350ᵒ C.
Extraction of PAHs from molluscs tissues:
The procedure of (21) was used in the extraction of hydrocarbons from molluscs tissues. Ten grams of dried

Journal of Natural Sciences Research www.iiste.org
ISSN 2224-3186 (Paper) ISSN 2225-0921 (Online) DOI: 10.7176/JNSR
Vol.9, No.14, 2019
33
molluscs tissues were placed in a pre-extracted cellulose thimble and soxhlet extracted with 150 ml methanol :
benzene (1 : 1 ratio) for 24 - hours. The extract was then transferred into a storage flask. The sample was further
extracted with a fresh solvent. The combined extracts were reduced in volume to ca 10 ml in a rotary vacuum
evaporator. They were then saponified for 2 - hours with a solution of 4 N KOH in 1: 1 methanol: benzene. After
extraction of the unsaponified matter with hexane, The sample is taken from the rotator and then placed on a
chromatography column that contains the activated silicagel (2% deactivated alumina) to remove the fatty acid
residue and a layer of anhydrous sodium sulphate to absorb the water, if any, (50) ml of benzene to obtain the
aromatic fraction that evaporates to the extent of dehydration and then dissolved in (5) ml of hexane for the purpose
of measuring the total concentration of aromatic hydrocarbons.
The procedure used by (22) was employed to determine the fat content of molluscs samples. Three grams of
each freeze- dried sample was soxhlet extracted with a 2 : 1 mixture of petroleum ether and acetone for 24-hours.
The extracts were reduced in volume in a rotary vacuum evaporator, and subsequently reduced to exactly 1 ml.
Ten µl of the concentrated extracts were taken by a Hamilton syringe and weighted after evaporation of the solvent.
Results and Discussion:
Environmental parameters
The hydrological condition of the Shatt Al-Arab River basin is affected by several factors including conditions at
the upper reaches of the Tigris and Euphrates rivers, the status of advancing flood tides from the Arabian Gulf,
seepage of saline ground water into the basin, as well as the impact of climate conditions prevailing in the region
on discharge rates and the payload of the river (23).
The basic statistical seasonal variations for the water quality parameters are summarized in Table 1 and
illustrated in Figure 2,3 ,4 and 5. Temperature is a high-fluctuations environmental factor, which consider
important parameter which regulated the biogeochemical processes in ecosystem (24).Temperature affects the
solubility and, consequently, the availability of gases such as oxygen in water (25). it also affects the toxicity of
some chemicals in water systems as well as the sensitivity of living organisms to toxic substances(26). In this
study, the variability in temperature values at the study locations may have resulted from the weather condition at
the time of study (13°C to 39°C).
Shatt Al-Arab river has high values of dissolved oxygen due to continuous diffusion , mixing , and the role
of phytoplankton , and occurrence of different aquatic plants,The dissolved oxygen is essential for aquatic life, as
it is needed to keep organisms alive.The DO content of water is influenced by the sources, raw water temperature
and chemical or biological processes taking place in the aquatic system (27) .Our results showed that the DO
concentrations range from (6.5 mg/l to 3.84 mg/l).
pH is an important factor to describing the chemical processes state in water, PH mean is a measure the
concentration of hydrogen ion (H+ ) in water(28) The pH results show seasonal differences but for all. Stations
fall within the acceptable range of (8.15-7.17); the average values tend to be slightly alkaline during the study
period which is consistent with previous studies made on aquatic ecosystems in Southern Iraq(27, 29). The pH is
an important parameter that determines the suitability of water for different purposes.
EC estimates the amount of total solids or amount of total dissolved ions in water. The EC of water generally
increases as the levels of dissolved pollutants and salinity increases(30). In this study, EC showed clear seasonal
differences (4.75 ms/cm -2.59 ms/cm).
(Fig.2) Water temperatures (ᵒC) at the studied stations

Journal of Natural Sciences Research www.iiste.org
ISSN 2224-3186 (Paper) ISSN 2225-0921 (Online) DOI: 10.7176/JNSR
Vol.9, No.14, 2019
34
(Fig.3) Dissolved Oxygen (DO) concentrations (mg/l) at the studied stations
(Fig.4) Seasonal variation of (pH) at the studied stations
(Fig.5) Electrical Conductivity(EC ms/cm) at the studied stations
0
2
4
6
8
1 2 3
DO
mg
/l
winter
spring
summer
autumn
6
6.5
7
7.5
8
8.5
1 2 3
pH
winter
Spring
summer
Autumn
0
1
2
3
4
5
6
1 2 3
EC
m
s/cm
winter
Spring
Summer
Autumn

Journal of Natural Sciences Research www.iiste.org
ISSN 2224-3186 (Paper) ISSN 2225-0921 (Online) DOI: 10.7176/JNSR
Vol.9, No.14, 2019
35
Table (1) Environmental measurements of the three stations during different seasons. Station
1
Station 2 Station 3 Season
Parameters Range Mean ± SD Range Mean ± SD Range Mean ±
SD
PH (7.15-7.16) 7- 0.005 (7.21--7.32) 7.25- 0.06 (7.55--7.71) 7.62-0.08
EC (3.55-3.69) 3.61 -0.07 (3.55-3.66) 3.59-0.06 (3.28-3.46) 3.35-0.094 Winter
DO (6.3-6.5) 6.4 -0.1 (6.3-6.4) 6.3-0.057 (5.1-5.3) 5.2-0.1
Water Temp. (14-15) 14 -0.57 (15-16) 16-0.57 (13-15) 14-1
PH (7.17-7.18) 7.17-0.005 (7.10--7.28) 7.21-0.101 (7.47--7.56) 7.53-0.058
EC (3.32-3.44) 3.39-0.062 (3.21-3.24) 3.22-0.015 (2.61-2.73) 2.67-0.061 Spring
DO (5.4-5.6) 5.5-0.1 (5.4-5.5) 5.4-0.057 (5.2-5.4) 5.3-0.1
Water Temp. (17-19) 18-1 (18-20) 19-1 (17-18) 17-0.577
PH (8.14--8.16) 8.15 -0.01 (8.15--8.16) 8.15-0.005 (7.89--7.98) 7.88-0.095
EC (4.75-4.88) 4.82 -0.066 (3.64-3.76) 3.68-0.066 (4.67-4.76) 4.72-0.049 Summer
DO (4.6-4.7) 4.6 -0.057 (4.5-4.7) 4.6-0.1 (3.84-3.98) 3.9-0.07
Water Temp. (38-39) 39 -0.577 (38-39) 38 -0.577 (37-38) 38-0.577
PH (7.83--7.84) 7.83 -0.005 (7.53--7.63) 7.56-0.055 (7.43--7.63) 7.53-0.1
EC (2.69-2.85) 2.75 -0.085 (2.89-2.93) 2.91-0.020 (2.59-2.69) 2.63-0.051
DO (5.1-5.3) 5.2 -0.1 (5.0-5.2) 5.1-0.115 (5.1-5.4) 5.2-0.152 Autumn
Water Temp. (21-22) 21 -0.577 (20-22) 21-1 (21-22) 21-0.577
PAH concentration
PAHs do not usually exist as separate entities in environmental media; they are often regarded as a mixture and
the total concentration of their mixture is often used to describe their distribution (31). 16 PAHs recommended by
the (US EPA) were investigated, The results of the chromatographic gas system showed that concentrations ranged
from (1.4754ng / l) in the summer in the first station to (3.4215ng / l) in winter at the third station(table 2,3,4 and
Fig.6). The results showed that the total concentrations of PAHs introduced into the environment are higher in
winter than in summer This is confirmed by (22) and (32) explained that the increase in the total concentration of
PAHs in autumn and winter is due to the fact that aromatic compounds entering the environment are higher in
autumn and winter due to the increase in fuel and wood burning, which is used in heating during the winter. As
well as the low rate of evaporation of PAHs in the winter and reduce the effectiveness of various microorganisms
in the degradation of these compounds with low temperatures (33). While low concentrations in the spring and
summer are due to the warm climate of Iraq in summer, where high temperatures cause PAHs to evaporate from
water(34) .High temperatures also encourage microorganisms to break down these compounds, especially low
molecular weights (35) The process of oxidation is due to the long period of solar brightness and also because of
the intensity of solar radiation (33).
Generally, the high molecular weight (HMW) PAHs with ≥4 rings was predominant in the rivers samples .
This may be attributed to their low solubility in water, less volatility due to their molecular size and higher
persistence in aqueous environment when compared to the low molecular weight (LMW) PAHs (36). The major
source of HMW PAHs can be linked to anthropogenic activities( 37). HMW PAHs are more persistent than LMW
PAHs in the environment due to their increased resistance to oxidation, reduction and vapourisation as molecular
weight increases (38). LMW PAHs such as naphthalene and fluorene have more significant acute toxicity to
aquatic organisms than HMW PAHs but are non-carcinogenic(31). Some HMW PAHs such as benzo[a]pyrene
and benzo[b] fluoranthene are carcinogenic and mutagenic to a wide variety of organisms including fish, birds and
mammals( 39).

Journal of Natural Sciences Research www.iiste.org
ISSN 2224-3186 (Paper) ISSN 2225-0921 (Online) DOI: 10.7176/JNSR
Vol.9, No.14, 2019
36
Table (2) the concentrations of PAHs (ng / l) in water in the study area during the year for the first station.
Compounds Summer Autumn Winter Spring
Naphtalene _ _ _ _
2-methyl naphthalene _ _ _ _
1-methyl naphthalene _ _ 0.1975 _
Acenaphthlene _ _ _ _
Acenaphthene _ _ 0.0314 0.1975
Fluorene _ 0.0594 0.1503 0.0684
Phenanthrene _ 0.0727 0.0533 0.0654
Anthracene _ 0.5215 0.1917 0.0987
Fluoranthene 0.0678 0.0721 0.0317 0.0957
Pyrene 0.6892 0.0862 0.207 0.1342
Benzo[a]fluoranthene 0.0964 0.018 0.0465 0.2451
Chrysene 0.0502 0.4575 1.0383 0.0958
Benzo[b]fluoranthene+Benzo[k]Fluoranthene 0.0392 0.0667 0.0998 0.3761
Di benz[a]pyrene 0.0392 0.1609 1.0926 0.0618
Indeno[1,2,3-c,d]pyrene+Di benz[a,h]anthracene 0.4934 0.4987 0.0733 0.5664
Benzo[g,h,i]perylene _ 0.0651 0.0644 0.0343
Total 1.4754 2.0788 3.2778 2.0394
LPAHs _ 0.6536 0.6242 0.43
HPAHs 1.4754 1.4252 2.6536 1.6094
L/H _ 0.458 0.235 0.267
Fl/Py 0.098 0.836 0.153 0.713
Phenanthrene/ Anthracene _ 0.139 0.278 0.662
Table (3) the concentrations of PAHs (ng / l) in water in the study area during the year for the second station.
Compound Summr Autumn Winter Spring
Naphtalene _ _ 0.0701 _
2-methyl naphthalene _ _ _ _
1-methyl naphthalene _ _ 0.2475 0.6921
Acenaphthlene 0.0148 0.0821 _ _
Acenaphthene _ _ 0.0546 0.1526
Fluorene 0.0961 0.0904 0.2034 0.0745
Phenanthrene _ 0.0287 _ 0.0952
Anthracene _ 0.4015 0.4973 0.0837
Fluoranthene 0.0568 _ 0.0578 _
Pyrene 0.0992 0.0652 0.0772 0.3412
Benzo[a]fluoranthene _ 0.0108 0.0667 0.1914
Chrysene 0.0232 0.5873 _ _
Benzo[b]fluoranthene+Benzo[k]Fluoranthene 0.0692 0.0678 0.0908 0.2641
Di benz[a]pyrene 0.0902 0.1409 1.4427 0.0908
Indeno[1,2,3-c,d]pyrene+Di benz[a,h]anthracene 0.0845 0.4748 0.3033 0.6624
Benzo[g,h,i]perylene 0.5681 0.0991 0.2542 _
Total 1.1131 2.0486 3.3656 2.648
LPAHs 0.1109 0.6027 1.0729 1.0981
HPAHs 0.9912 1.4459 2.2927 1.5499
L/H 0.111 0.416 0.467 0.708
Fl/Py 0.572 _ 0.748 _
Phenanthrene/ Anthracene _ 0.071 _ 1.137

Journal of Natural Sciences Research www.iiste.org
ISSN 2224-3186 (Paper) ISSN 2225-0921 (Online) DOI: 10.7176/JNSR
Vol.9, No.14, 2019
37
Table (4) the concentrations of PAHs (ng / l) in water in the study area during the year for the third station.
Compound Summer Autumn Winter Spring
Naphtalene _ _ _ _
2-methyl naphthalene _ _ _ _
1-methyl naphthalene _ _ 0.9752 0.9135
Acenaphthlene _ _ _ 0.0367
Acenaphthene _ _ 0.1565 _
Fluorene 0.1591 0.0444 _ 0.0741
Phenanthrene 0.0858 _ _ _
Anthracene _ 0.4015 0.3431 0.0787
Fluoranthene _ 0.0347 0.0752 0.0925
Pyrene 0.0382 _ 0.0782 0.2041
Benzo[a]fluoranthene _ 0.1589 0.1447 0.3044
Chrysene 0.1092 0.4743 0.0931 0.0783
Benzo[b]fluoranthene+Benzo[k]Fluoranthene _ 0.2078 _ _
Di benz[a]pyrene 0.2372 0.2589 1.0297 0.1983
Indeno[1,2,3-c,d]pyrene+Di benz[a,h]anthracene 0.1992 0.3081 0.3356 0.7349
Benzo[g,h,i]perylene 0.4989 0.1219 0.1902 0.0921
Total 1.3276 2.0105 3.4215 2.8076
LPAHs 0.2449 0.4459 1.4748 1.103
HPAHs 1.0827 1.5646 1.9467 1.7046
L/H 0.226 0.284 0.757 0.647
Fl/Py _ _ 0.961 0.453
Phenanthrene/Anthracene _ _ _ _
Summer season Autumn season
Winter season Spring season
(Fig.6) :Chromatograms of PAHs compounds in water samples of the studied stations during the season
While the concentration in molluscs varied from 3.672 ng /g at the third station in the summer to 7.257ng / g
at the first station in the winter in the M.nodosa and from 0.876 ng/g in the summer at the first station to 3.506ng/g
in the third station in the winter in the T.jordani and from 1.778ng / g at the third station in the summer to 5.924ng
/ g at the second station in the winter in the M.tuberculata and from 4.07 ng/g in the summer at the second station
to9.093 ng/g at the second station in the winter(table 6,7,8 and fig 7)
The current results showed that the concentrations of PAHs in the water column were lower than those in the
min10 20 30 40
pA
10
20
30
40
50
60
70
FID1 A, Front Signal (IMAN\332.D)
Na
ph
tha
len
e
1-m
eth
yl
na
ph
tha
len
e
Ac
en
ap
hth
len
e A
ce
na
ph
the
ne
Flu
ore
ne
Ph
en
an
thre
ne
An
thra
ce
ne
Flu
ora
nth
en
e
Py
ren
e Be
nz
o(a
)flu
ora
nth
en
e C
hry
se
ne
Be
nz
o(b
)flu
ora
nth
en
e+
Be
nz
o(k
)flu
ora
nth
en
e
Dib
en
z(a
) p
yre
ne
In
de
no
(1,2
,3-c
d)p
yre
ne
+D
ibe
nz
(a,h
)an
thra
ce
ne
Be
nz
o(g
,h,i
)pe
ryle
ne
min10 20 30 40 50
pA
10
15
20
25
30
35
40
45
FID1 A, Front Signal (IMAN\333.D)
Flu
ore
ne
Ph
en
an
thre
ne
An
thra
ce
ne F
luo
ran
the
ne
Py
ren
e
Be
nz
o(a
)flu
ora
nth
en
e C
hry
se
ne
Be
nz
o(b
)flu
ora
nth
en
e+
Be
nz
o(k
)flu
ora
nth
en
e
Dib
en
z(a
) p
yre
ne
In
de
no
(1,2
,3-c
d)p
yre
ne
+D
ibe
nz
(a,h
)an
thra
ce
ne
Be
nz
o(g
,h,i
)pe
ryle
ne
min10 20 30 40 50
pA
8
10
12
14
16
FID1 A, Front Signal (IMAN\324.D)
Flu
ora
nth
en
e
Py
ren
e
Be
nz
o(a
)flu
ora
nth
en
e C
hry
se
ne
Be
nz
o(b
)flu
ora
nth
en
e+
Be
nz
o(k
)flu
ora
nth
en
e
Dib
en
z(a
) p
yre
ne
In
de
no
(1,2
,3-c
d)p
yre
ne
+D
ibe
nz
(a,h
)an
thra
ce
ne
min10 20 30 40 50
pA
8
10
12
14
16
18
FID1 A, Front Signal (IMAN\331.D)
1-m
eth
yl
na
ph
tha
len
e
Ac
en
ap
hth
en
e
Flu
ore
ne
Ph
en
an
thre
ne
An
thra
ce
ne
Flu
ora
nth
en
e
Py
ren
e
Be
nzo
(a)f
luo
ran
the
ne
Ch
rys
en
e
Be
nz
o(b
)flu
ora
nth
en
e+
Be
nzo
(k)f
luo
ran
the
ne
Dib
en
z(a
) p
yre
ne
In
de
no
(1,2
,3-c
d)p
yre
ne
+D
ibe
nz
(a,h
)an
thra
ce
ne
Be
nzo
(g,h
,i)p
ery
len
e

Journal of Natural Sciences Research www.iiste.org
ISSN 2224-3186 (Paper) ISSN 2225-0921 (Online) DOI: 10.7176/JNSR
Vol.9, No.14, 2019
38
molluscs. This may be the result of optical oxidation and the deposition of PAHs from the water column, making
PAHs with low molecular weight predominant in surface water while the higher molecular weight compounds
predominated in the molluscs
Sources of PAHs
The sources of PAHs can either be petrogenic i.e., released from petroleum products or pyrogenic due to the
combustion of biomass. Diagnostic ratios have been designed and used to distinguish the sources of PAHs due to
their stability, physical and chemical attributes (31). Table 2,3 and 4 shows the diagnostic ratios of the PAHs
obtained in this study and their possible sources in the water. The ratio of LPAHs/HPAHs in Shatt Al-Arab river
were >1 in all station and sesonal which implies that the source of the PAHs was from pyrogenic derived from
incomplete combustion of fuel at all stations.
The ratio( fluoranthene/ Pyrene ) was less than one at the first station and for all seasons, Either in the second
and third stations The(FI/Py) ratio was disadvantage because most water sample had undetectable fluoranthene
value and the other samples had undetectable Pyrene values ,only few sample had fluoranthene and Pyrene values
together, because that the ratio ranged from 0.5 to 0.9 and indicate the source of PAHs was Petrogenic. Also,
the(Phenanthrene/ Anthracene) ratio was disadvantage because most water sample had undetectable Phenanthrene
value and the other samples had undetectable Anthracene values ,only few sample had Phenanthrene and
Anthracene values together, because that the ratio ranged from 0.139 to 1.13 and indicate the source of PAHs was
pyrogenic.This study illustrates the defect of these two indicators in water samples because most samples have
undetectable values.
Table 5,6 and 7 shows the diagnostic ratios of the PAHs obtained in this study and their possible sources in
the molluscs. The ratio of LPAHs/HPAHs in M.nodosa were >1 in all station and seasonal which implies that the
source of the PAHs was from pyrogenic derived from incomplete combustion of fuel at all stations. The
ratio( fluoranthene/ Pyrene ) was more than one at all station and for all seasons, except in the third station in the
winter was less than (1) The ratio of (Phenanthrene / Anthracene) is less than the number (10) in all station and
seasons and this indicates that the origin of PAHs in snail samples M.nodosa is Petrogenic and Pyrogenic.
The ratio of LPAHs/HPAHs in T.jordani were >1 in all station and seasonal , except In the first station in
the summer and autumn, the ratio was less than 1. This shows that the origin of PAHs is Petrogenic and a low
amount of Pyrogenic. The ratio( fluoranthene/ Pyrene ) was more than one at all station and for all seasons, except
in the first station in the winter and spring was less than (1) The ratio of (Phenanthrene / Anthracene) is less than
the number (10) in all station and seasons and this indicates that the origin of PAHs in snail samples T.jordani is
Petrogenic and Pyrogenic (table 8,9 and 10)
The ratio of LPAHs/HPAHs in M.tuberculata were >1 in all station and seasonal which implies that the
source of the PAHs was from pyrogenic derived from incomplete combustion of fuel at all stations. The
ratio( fluoranthene/ Pyrene ) was more than one at all station and for all seasons and The ratio of (Phenanthrene /
Anthracene) is less than the number (10) in all station and seasons and this indicates that the origin of PAHs in
snail samples M.tuberculata is Petrogenic and Pyrogenic( table 11,12and 13)
(Table 14,15 and16) shows The ratio of LPAHs/HPAHs in B.bengalensis were >1 in all station and
seasonal ,except In the third station in the spring , the ratio was less than (1)This shows that the origin of PAHs is
Petrogenic and a low amount of Pyrogenic. The ratio( fluoranthene/ Pyrene ) was more than one at all station and
for all seasonsو except In the first station in the summer This shows that the origin of PAHs is Petrogenic and a
low amount of Pyrogenic. and The ratio of (Phenanthrene / Anthracene) is less than the number (10) in all station
and seasons and this indicates that the origin of PAHs in snail samples B.bengalensis is Petrogenic and Pyrogenic

Journal of Natural Sciences Research www.iiste.org
ISSN 2224-3186 (Paper) ISSN 2225-0921 (Online) DOI: 10.7176/JNSR
Vol.9, No.14, 2019
39
Table (5) the concentrations of PAHs (ng / l) in M.nodosa in the study area during the year for the first station.
M.nodosa
Compound summer Autumn Winter Spring
Naphtalene _ _ _ _
2-methyl naphthalene _ _ 0.561 0.566
1-methyl naphthalene 0.378 0.421 1.399 0.542
Acenaphthylene 0.361 0.541 0.703 0.499
Acenaphthene 0.267 0.343 0.585 0.456
Fluorene 0.199 0.445 0.489 0.411
Phenanthrene 0.491 0.389 0.632 0.374
Anthracene 0.376 0.363 0.591 0.266
Fluoranthene 0.342 0.254 0.392 0.374
Pyrene 0.232 0.209 0.265 0.246
Benzo[a]fluoranthene 0.179 0.257 0.291 0.271
Chrysene 0.249 0.187 0.238 0.208
Benzo[b]fluoranthene+Benzo[k]Fluoranthene 0.267 0.261 0.256 0.177
Di benz[a]pyrene 0.311 0.256 0.189 0.162
Indeno[1,2,3-c,d]pyrene+Di benz[a,h]anthracene 0.166 0.141 0.098 0.121
Benzo[g,h,i]perylene 0.104 0.129 0.094 0.153
Total 3.922 4.196 6.783 4.826
LPAHs 2.072 2.502 4.96 3.114
HPAHs 1.85 1.694 1.823 1.712
L/H 1.12 1.476 2.72 1.818
Fl/Py 1.474 1.215 1.479 1.520
Phenanthrene/ Anthracene 1.305 1.071 1.069 1.406
Table (6) the concentrations of PAHs (ng / l) in M.nodosa in the study area during the year for the second station.
M.nodosa
Compound summer Autumn Winter Spring
Naphtalene _ _ _ _
2-methyl naphthalene _ 0.412 0.583 _
1-methyl naphthalene 0.401 0.436 0.713 0.584
Acenaphthylene 0.396 0.568 1.291 0.521
Acenaphthene 0.372 0.367 0.554 0.467
Fluorene 0.202 0.459 0.495 0.416
Phenanthrene 0.521 0.419 0.663 0.464
Anthracene 0.399 0.391 0.604 0.346
Fluoranthene 0.362 0.321 0.665 0.461
Pyrene 0.284 0.304 0.412 0.363
Benzo[a]fluoranthene 0.239 0.277 0.331 0.271
Chrysene 0.249 0.289 0.338 0.268
Benzo[b]fluoranthene+Benzo[k]Fluoranthene 0.277 0.291 0.269 0.199
Di benz[a]pyrene _ _ 0.211 0.261
Indeno[1,2,3-c,d]pyrene+Di benz[a,h]anthracene 0.215 _ 0.128 0.222
Benzo[g,h,i]perylene _ _ _
Total 3.917 4.534 7.257 4.843
LPAHs 2.291 3.052 4.903 2.798
HPAHs 1.626 1.482 2.354 2.045
L/H 1.408 2.059 2.082 1.368
Fl/Py 1.274 1.055 1.614 1.269
Phenanthrene/ Anthracene 1.305 1.071 1.097 1.341
Journal of Natural Sciences Research www.iiste.org
ISSN 2224-3186 (Paper) ISSN 2225-0921 (Online) DOI: 10.7176/JNSR
Vol.9, No.14, 2019
40
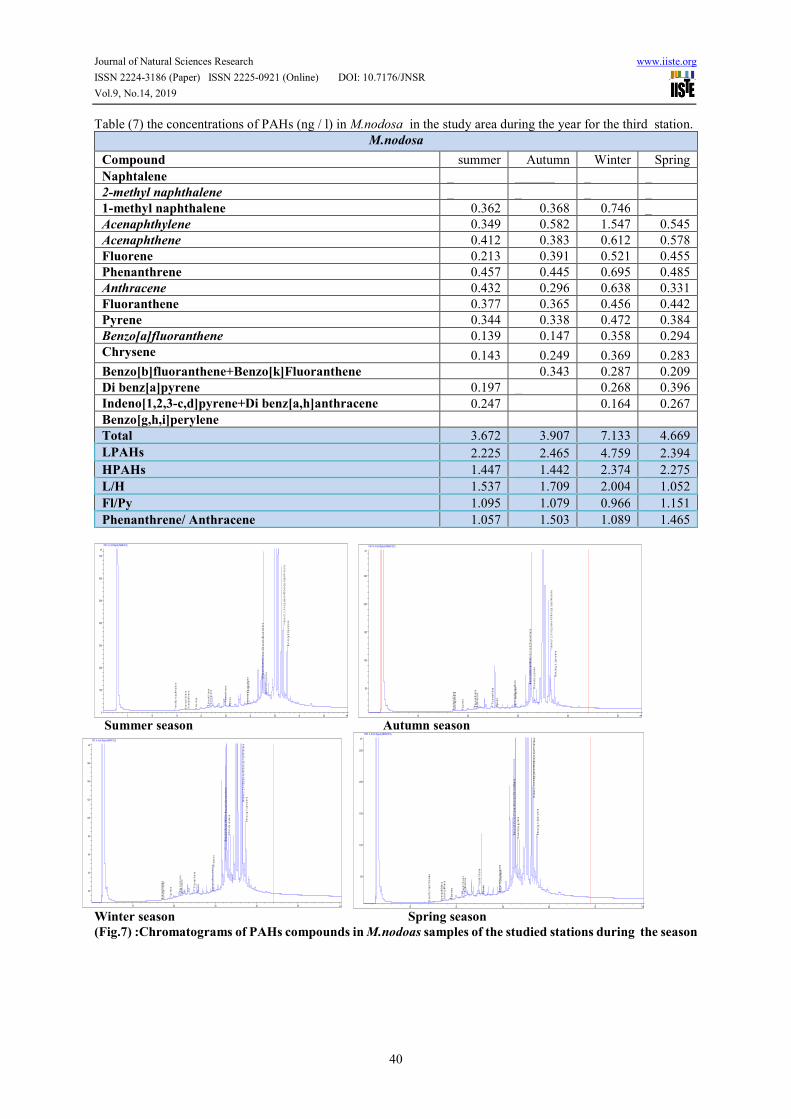
Table (7) the concentrations of PAHs (ng / l) in M.nodosa in the study area during the year for the third station.
M.nodosa
Compound summer Autumn Winter Spring
Naphtalene _ ______ _ _
2-methyl naphthalene _ _ _ _
1-methyl naphthalene 0.362 0.368 0.746 _
Acenaphthylene 0.349 0.582 1.547 0.545
Acenaphthene 0.412 0.383 0.612 0.578
Fluorene 0.213 0.391 0.521 0.455
Phenanthrene 0.457 0.445 0.695 0.485
Anthracene 0.432 0.296 0.638 0.331
Fluoranthene 0.377 0.365 0.456 0.442
Pyrene 0.344 0.338 0.472 0.384
Benzo[a]fluoranthene 0.139 0.147 0.358 0.294
Chrysene 0.143 0.249 0.369 0.283
Benzo[b]fluoranthene+Benzo[k]Fluoranthene 0.343 0.287 0.209
Di benz[a]pyrene 0.197 _ 0.268 0.396
Indeno[1,2,3-c,d]pyrene+Di benz[a,h]anthracene 0.247 0.164 0.267
Benzo[g,h,i]perylene _ _ _
Total 3.672 3.907 7.133 4.669
LPAHs 2.225 2.465 4.759 2.394
HPAHs 1.447 1.442 2.374 2.275
L/H 1.537 1.709 2.004 1.052
Fl/Py 1.095 1.079 0.966 1.151
Phenanthrene/ Anthracene 1.057 1.503 1.089 1.465
Summer season Autumn season
Winter season Spring season
(Fig.7) :Chromatograms of PAHs compounds in M.nodoas samples of the studied stations during the season
min5 10 15 20 25 30 35 40 45
pA
0
100
200
300
400
500
600
700
FID1 A, Front Signal (IMAN\12.D)
1-m
eth
yl
na
ph
tha
len
e
Ac
en
ap
hth
len
e A
ce
na
ph
the
ne
Flu
ore
ne
Ph
en
an
thre
ne
An
thra
ce
ne
Flu
ora
nth
en
e
Py
ren
e
Be
nz
o(a
)flu
ora
nth
en
e C
hry
se
ne
Be
nz
o(b
)flu
ora
nth
en
e+
Be
nz
o(k
)flu
ora
nth
en
e
Dib
en
z(a
) p
yre
ne
In
de
no
(1,2
,3-c
d)p
yre
ne
+D
ibe
nz
(a,h
)an
thra
ce
ne
Be
nz
o(g
,h,i
)pe
ryle
ne
min10 20 30 40 50
pA
50
100
150
200
250
FID1 A, Front Signal (IMAN\15.D)
Ac
en
ap
hth
len
e A
ce
na
ph
the
ne
Flu
ore
ne
Ph
en
an
thre
ne
An
thra
ce
ne
Flu
ora
nth
en
e
Py
ren
e
Be
nz
o(a
)flu
ora
nth
en
e C
hry
sen
e
Be
nzo
(b)f
luo
ran
the
ne
+B
en
zo(k
)flu
ora
nth
en
e
Dib
en
z(a
) p
yre
ne
In
de
no
(1,2
,3-c
d)p
yre
ne
+D
ibe
nz(
a,h
)an
thra
cen
e
Be
nz
o(g
,h,i
)pe
ryle
ne
min10 20 30 40 50
pA
50
100
150
200
250
FID1 A, Front Signal (IMAN\10.D)
2-m
eth
yl
na
ph
tha
len
e
Ac
en
ap
hth
len
e A
ce
na
ph
the
ne
Flu
ore
ne
Ph
en
an
thre
ne
An
thra
ce
ne
Flu
ora
nth
en
e
Py
ren
e
Be
nz
o(a
)flu
ora
nth
en
e C
hry
se
ne
Be
nz
o(b
)flu
ora
nth
en
e+
Be
nz
o(k
)flu
ora
nth
en
e
Dib
en
z(a
) p
yre
ne
In
de
no
(1,2
,3-c
d)p
yre
ne
+D
ibe
nz
(a,h
)an
thra
ce
ne
Be
nz
o(g
,h,i
)pe
ryle
ne
min10 20 30 40 50
pA
20
40
60
80
100
120
140
160
FID1 A, Front Signal (IMAN\13.D)
Ace
na
ph
thle
ne
Ac
en
ap
hth
en
e
Flu
ore
ne
Ph
en
an
thre
ne
An
thra
ce
ne
Flu
ora
nth
en
e
Pyr
en
e
Be
nz
o(a
)flu
ora
nth
en
e Ch
ryse
ne
Be
nzo
(b)f
luo
ran
the
ne
+B
en
zo
(k)f
luo
ran
the
ne
Dib
en
z(a
) p
yre
ne
In
de
no
(1,2
,3-c
d)p
yre
ne
+D
ibe
nz
(a,h
)an
thra
cen
e
Be
nzo
(g,h
,i)p
ery
len
e

Journal of Natural Sciences Research www.iiste.org
ISSN 2224-3186 (Paper) ISSN 2225-0921 (Online) DOI: 10.7176/JNSR
Vol.9, No.14, 2019
41
Table (8) the concentrations of PAHs (ng / l) in T.jordani in the study area during the year for the first station.
T.jordani
Compound summer Autumn Winter Spring
Naphtalene _ _
_
2-methyl naphthalene _ _ _ _
1-methyl naphthalene _ _ _ _
Acenaphthlene 0.093 _ 0.265 0.127
Acenaphthene 0.099 0.148 0.243 _
Fluorene 0.076 0.152 0.232 0.136
Phenanthrene 0.075 0.166 0.205 0.102
Anthracene 0.063 0.157 0.179 0.115
Fluoranthene 0.068 0.119 0.141 0.034
Pyrene 0.058 0.112 0.137 0.061
Benzo[a]fluoranthene 0.059 0.105 0.176 0.069
Chrysene 0.043 0.081 0.129 0.078
Benzo[b]fluoranthene+Benzo[k]Fluoranthene 0.089 0.079 0.121 0.053
Di benz[a]pyrene 0.056 0.066 0.179 0.071
Indeno[1,2,3-c,d]pyrene+Di benz[a,h]anthracene 0.045 0.054 0.081 0.052
Benzo[g,h,i]perylene 0.052 0.061 0.061 0.068
Total 0.876 1.3 2.149 0.966
LPAHs 0.406 0.623 1.124 0.48
HPAHs 0.47 0.677 1.025 0.486
L/H 0.863 0.920 1.096 0.987
Fl/Py 1.172 1.062 1.029 0.55
Phenanthrene/ Anthracene 1.19 1.057 1.145 0.886
Table (9) the concentrations of PAHs (ng / l) in T.jordani in the study area during the year for the second station.
T.jordani
Compound summer Autumn Winter Spring
Naphtalene _ _ _ _
2-methyl naphthalene _ _ _ 0.313
1-methyl naphthalene 0.179 0.146 _ _
Acenaphthylene 0.153 0.168 0.304 0.333
Acenaphthene 0.139 0.181 0.356 0.229
Fluorene 0.086 0.162 0.361 0.232
Phenanthrene 0.095 0.106 0.317 0.209
Anthracene 0.082 0.097 0.292 0.155
Fluoranthene 0.074 0.094 0.253 0.135
Pyrene 0.058 0.072 0.247 0.109
Benzo[a]fluoranthene 0.079 0.085 0.256 0.141
Chrysene 0.033 0.121 0.213 0.127
Benzo[b]fluoranthene+Benzo[k]Fluoranthene _ 0.119 0.235 _
Di benz[a]pyrene 0.067 0.106 0.262 _
Indeno[1,2,3-c,d]pyrene+Di benz[a,h]anthracene 0.052 0.094 _ 0.142
Benzo[g,h,i]perylene 0.048 0.101 _ _
Total 1.145 1.652 3.096 2.125
LPAHs 0.734 0.86 1.63 1.471
HPAHs 0.411 0.792 1.466 0.654
L/H 1.785 1.08 1.111 2.249
Fl/Py 1.275 1.305 1.024 1.238
Phenanthrene/ Anthracene 1.158 1.092 1.085 1.348

Journal of Natural Sciences Research www.iiste.org
ISSN 2224-3186 (Paper) ISSN 2225-0921 (Online) DOI: 10.7176/JNSR
Vol.9, No.14, 2019
42
Table (10) the concentrations of PAHs (ng / l) in T.jordani in the study area during the year for the third station.
T.jordani
Compound summer Autumn Winter Spring
Naphtalene _ _ _ _
2-methyl naphthalene _ _ _ _
1-methyl naphthalene 0.135 _ _ _
Acenaphthylene 0.176 0.123 0.454 0.374
Acenaphthene 0.158 0.168 0.467 0.437
Fluorene 0.096 0.145 0.487 0.216
Phenanthrene 0.099 0.117 0.374 0.237
Anthracene 0.079 0.085 0.243 0.132
Fluoranthene 0.074 0.078 0.238 0.235
Pyrene 0.061 0.055 0.271 0.158
Benzo[a]fluoranthene 0.104 0.075 0.262 0.102
Chrysene 0.073 0.066 0.293 0.097
Benzo[b]fluoranthene+Benzo[k]Fluoranthene _ 0.093 0.205 _
Di benz[a]pyrene 0.121 0.111 0.212 _
Indeno[1,2,3-c,d]pyrene+Di benz[a,h]anthracene 0.093 0.059 _ 0.089
Benzo[g,h,i]perylene 0.048 0.091 _ _
Total 1.317 1.266 3.506 2.077
LPAHs 0.743 0.638 2.025 1.396
HPAHs 0.574 0.628 1.481 0.681
L/H 1.294 1.015 1.367 2.049
Fl/Py 1.213 1.418 0.878 1.487
Phenanthrene/ Anthracene 1.253 1.376 1.539 1.795
Summer season Autumn season
Winter season Spring season
(Fig.8) :Chromatograms of PAHs compounds in T.jordani samples of the studied stations during the
season
min10 20 30 40 50
pA
10
15
20
25
30
35
FID1 A, Front Signal (IMAN\6.D)
Ac
en
ap
hth
en
e
Flu
ore
ne
Ph
en
an
thre
ne
An
thra
ce
ne
Flu
ora
nth
en
e
Py
ren
e
Be
nz
o(a
)flu
ora
nth
en
e C
hry
se
ne
Be
nz
o(b
)flu
ora
nth
en
e+
Be
nz
o(k
)flu
ora
nth
en
e D
ibe
nz
(a)
py
ren
e
In
de
no
(1,2
,3-c
d)p
yre
ne
+D
ibe
nz
(a,h
)an
thra
ce
ne
Be
nz
o(g
,h,i
)pe
ryle
ne
min10 20 30 40 50
pA
10
20
30
40
50
60
70
FID1 A, Front Signal (IMAN\7.D)
Ac
en
ap
hth
en
e
Flu
ore
ne
Ph
en
an
thre
ne
An
thra
ce
ne
Flu
ora
nth
en
e
Py
ren
e
Be
nz
o(a
)flu
ora
nth
en
e C
hry
se
ne
Be
nz
o(b
)flu
ora
nth
en
e+
Be
nz
o(k
)flu
ora
nth
en
e
Dib
en
z(a
) p
yre
ne
In
de
no
(1,2
,3-c
d)p
yre
ne
+D
ibe
nz
(a,h
)an
thra
ce
ne
Be
nz
o(g
,h,i
)pe
ryle
ne
min10 20 30 40 50
pA
10
15
20
25
30
35
40
45
50
FID1 A, Front Signal (IMAN\9.D)
Ac
en
ap
hth
en
e
Flu
ore
ne P
he
na
nth
ren
e A
nth
rac
en
e Flu
ora
nth
en
e
Py
ren
e
Be
nz
o(a
)flu
ora
nth
en
e C
hry
sen
e
Be
nz
o(b
)flu
ora
nth
en
e+
Be
nz
o(k
)flu
ora
nth
en
e D
ibe
nz
(a)
py
ren
e
In
de
no
(1,2
,3-c
d)p
yre
ne
+D
ibe
nz
(a,h
)an
thra
ce
ne
Be
nz
o(g
,h,i
)pe
ryle
ne

Journal of Natural Sciences Research www.iiste.org
ISSN 2224-3186 (Paper) ISSN 2225-0921 (Online) DOI: 10.7176/JNSR
Vol.9, No.14, 2019
43
Table (11) the concentrations of PAHs (ng / l) in M.tuberculata in the study area during the year for the first
station.
M.tuberculata
Compound summer Autumn Winter Spring
Naphtalene _ _ _ _
2-methyl naphthalene _ _ 0.391 _
1-methyl naphthalene _ _ 0.332 _
Acenaphthlene 0.252 1.121 _
Acenaphthene 0.169 _ 0.266 _
Fluorene 0.188 0.401 0.283 0.426
Phenanthrene 0.238 0.411 0.274 0.346
Anthracene 0.166 0.211 0.221 0.261
Fluoranthene 0.098 0.189 1.216 0.159
Pyrene 0.061 0.176 0.204 0.106
Benzo[a]fluoranthene 0.103 0.109 0.199 0.173
Chrysene 0.111 _ _ 0.146
Benzo[b]fluoranthene+Benzo[k]Fluoranthene 0.093 0.112 0.141 0.134
Di benz[a]pyrene 0.115 0.017 0.152 0.115
Indeno[1,2,3-c,d]pyrene+Di benz[a,h]anthracene 0.098 0.075 0.128 0.099
Benzo[g,h,i]perylene 0.072 0.097 0.121 0.065
Total 1.512 2.05 5.049 2.03
LPAHs 0.761 1.275 2.888 1.033
HPAHs 0.751 0.775 2.161 0.997
L/H 1.013 1.645 1.336 1.036
Fl/Py 1.606 1.073 5.96 1.5
Phenanthrene/ Anthracene 1.433 1.947 1.239 1.325
Table (12) the concentrations of PAHs (ng / l) in M.tuberculata in the study area during the year for the second
station.
M.tuberculata
Compound summer Autumn Winter Spring
Naphtalene _ _ _ _
2-methyl naphthalene _ 0.295 0.306 _
1-methyl naphthalene 0.169 0.283 0.319 0.153
Acenaphthlene 0.117 0.229 0.223 0.259
Acenaphthene 0.177 0.162 0.326 0.379
Fluorene 0.154 0.352 2.009 0.461
Phenanthrene 0.162 0.341 0.348 0.331
Anthracene _ 0.234 0.251 0.238
Fluoranthene 0.124 0.177 0.461 0.248
Pyrene 0.118 0.164 0.224 0.246
Benzo[a]fluoranthene 0.134 1.003 0.265
Chrysene 0.103 0.193 0.207 0.363
Benzo[b]fluoranthene+Benzo[k]Fluoranthene _ 0.097 0.12 0.141
Di benz[a]pyrene 0.131 0.053 0.127 _
Indeno[1,2,3-c,d]pyrene+Di benz[a,h]anthracene _ _ _ 0.096
Benzo[g,h,i]perylene _ _ _ 0.078
Total 1.389 2.58 5.924 3.258
LPAHs 0.779 1.896 3.782 1.821
HPAHs 0.61 0.684 2.142 1.437
L/H 1.277 2.771 1.765 1.267
Fl/Py 1.05 1.079 2.058 1.008
Phenanthrene/ Anthracene _ 1.457 1.386 1.39

Journal of Natural Sciences Research www.iiste.org
ISSN 2224-3186 (Paper) ISSN 2225-0921 (Online) DOI: 10.7176/JNSR
Vol.9, No.14, 2019
44
Table (13) the concentrations of PAHs (ng / l) in M.tuberculata in the study area during the year for the third
station.
M.tuberculata
Compound summer Autumn Winter Spring
Naphtalene _ _ _ _
2-methyl naphthalene 0.124 _ 0.216 _
1-methyl naphthalene 0.136 0.134 0.199 0.239
Acenaphthlene 0.107 0.391 0.183 0.206
Acenaphthene _ 0.268 _ 0.392
Fluorene 0.232 0.304 0.159 0.373
Phenanthrene 0.198 _ 0.456 0.394
Anthracene 0.157 0.255 0.315 0.181
Fluoranthene 0.124 0.193 0.497 0.283
Pyrene _ 0.134 0.294 0.216
Benzo[a]fluoranthene 0.339 _ 1.803 0.259
Chrysene 0.156 0.12 0.672 0.336
Benzo[b]fluoranthene+Benzo[k]Fluoranthene 0.094 0.102 0.116 _
Di benz[a]pyrene _ 0.093 0.071 0.135
Indeno[1,2,3-c,d]pyrene+Di benz[a,h]anthracene 0.111 0.095 0.068 0.106
Benzo[g,h,i]perylene _ _ _ _
Total 1.778 2.089 5.049 3.12
LPAHs 0.954 1.352 2.362 1.785
HPAHs 0.824 0.737 2.321 1.335
L/H 1.157 1.834 1.017 1.337
Fl/Py _ 1.44 1.69 1.31
Phenanthrene/ Anthracene 1.261 _ 1.447 2.176
Summer season Autumn season
Winter season Spring season
(Fig.9) :Chromatograms of PAHs compounds in M.tuberculata samples of the studied stations during the
season
min10 20 30 40 50
pA
10
15
20
25
30
35
FID1 A, Front Signal (IMAN\3.D)
Ac
en
ap
hth
len
e
Flu
ore
ne
Ph
en
an
thre
ne
An
thra
ce
ne
Flu
ora
nth
en
e
Py
ren
e
Be
nz
o(a
)flu
ora
nth
en
e C
hry
se
ne
Be
nz
o(b
)flu
ora
nth
en
e+
Be
nz
o(k
)flu
ora
nth
en
e D
ibe
nz
(a)
py
ren
e
In
de
no
(1,2
,3-c
d)p
yre
ne
+D
ibe
nz
(a,h
)an
thra
ce
ne
Be
nz
o(g
,h,i
)pe
ryle
ne
min10 20 30 40 50
pA
8
10
12
14
16
18
20
22
24
26
FID1 A, Front Signal (IMAN\2.D)
Flu
ore
ne
Ph
en
an
thre
ne
An
thra
ce
ne
Flu
ora
nth
en
e
Py
ren
e
Be
nz
o(a
)flu
ora
nth
en
e C
hry
se
ne
Be
nz
o(b
)flu
ora
nth
en
e+
Be
nz
o(k
)flu
ora
nth
en
e
Dib
en
z(a
) p
yre
ne
In
de
no
(1,2
,3-c
d)p
yre
ne
+D
ibe
nz
(a,h
)an
thra
ce
ne
Be
nz
o(g
,h,i
)pe
ryle
ne
min5 10 15 20 25 30 35 40
pA
8
10
12
14
16
18
20
FID1 A, Front Signal (IMAN\5.D)
Ac
en
ap
hth
len
e
Ac
en
ap
hth
en
e
Flu
ore
ne
Ph
en
an
thre
ne
An
thra
ce
ne
Flu
ora
nth
en
e
Py
ren
e
Be
nz
o(a
)flu
ora
nth
en
e C
hry
se
ne
Be
nz
o(b
)flu
ora
nth
en
e+
Be
nz
o(k
)flu
ora
nth
en
e
Dib
en
z(a
) p
yre
ne
In
de
no
(1,2
,3-c
d)p
yre
ne
+D
ibe
nz
(a,h
)an
thra
ce
ne
Be
nz
o(g
,h,i
)pe
ryle
ne
min10 20 30 40 50
pA
10
15
20
25
30
35
40
FID1 A, Front Signal (IMAN\4.D)
2-m
eth
yl
na
ph
tha
len
e 1
-me
thy
l n
ap
hth
ale
ne
Ac
en
ap
hth
len
e A
ce
na
ph
the
ne
Flu
ore
ne
Ph
en
an
thre
ne
An
thra
ce
ne
Flu
ora
nth
en
e
Py
ren
e
Be
nz
o(a
)flu
ora
nth
en
e C
hry
se
ne
Be
nz
o(b
)flu
ora
nth
en
e+
Be
nz
o(k
)flu
ora
nth
en
e
Dib
en
z(a
) p
yre
ne
In
de
no
(1,2
,3-c
d)p
yre
ne
+D
ibe
nz
(a,h
)an
thra
ce
ne
Be
nz
o(g
,h,i
)pe
ryle
ne

Journal of Natural Sciences Research www.iiste.org
ISSN 2224-3186 (Paper) ISSN 2225-0921 (Online) DOI: 10.7176/JNSR
Vol.9, No.14, 2019
45
Table (14) the concentrations of PAHs (ng / l) in B.bengalensis in the study area during the year for the first
station.
B.bengalensis
Compound Summer Autumn Winter Spring
Naphtalene _ 0.365 0.599 _
2-methyl naphthalene 0.342 0.297 0.365 0.394
1-methyl naphthalene 0.251 0.263 0.518 0.484
Acenaphthylene 0.427 0.586 0.743 0.476
Acenaphthene 0.412 0.595 0.675 0.602
Fluorene 0.274 0.412 0.697 0.467
Phenanthrene 0.487 0.512 0.523 0.613
Anthracene 0.327 0.414 0.821 0.569
Fluoranthene 0.421 1.034 0.698 0.538
Pyrene 0.561 0.131 0.692 0.509
Benzo[a]fluoranthene 0.297 0.112 0.732 0.633
Chrysene 0.214 0.135 0.675 0.467
Benzo[b]fluoranthene+Benzo[k]Fluoranthene 0.192 0.066 0.723 0.321
Di benz[a]pyrene 0.106 0.055 0.349 0.231
Indeno[1,2,3-c,d]pyrene+Di benz[a,h]anthracene 0.117 0.247 0.199 0.247
Benzo[g,h,i]perylene 0.056 0.163 0.084 0.163
Total 4.484 5.387 9.093 6.714
LPAHs 2.52 3.444 4.941 3.605
HPAHs 1.964 1.943 4.152 3.109
L/H 1.283 1.772 1.190 1.159
Fl/Py 0.750 7.893 1.008 1.056
Phenanthrene/ Anthracene 1.489 1.236 0.637 1.077
Table (15) the concentrations of PAHs (ng / l) in B.bengalensis in the study area during the year for the second
station.
B.bengalensis
Compound summer Autumn Winter Spring
Naphtalene _ _
2-methyl naphthalene 0.452 0.272 0.615 0.461
1-methyl naphthalene 0.366 0.256 0.583 0.378
Acenaphthylene 0.387 0.562 0.943 0.506
Acenaphthene 0.192 0.495 0.629
Fluorene 0.327 1.097
Phenanthrene 0.517 1.026 0.872
Anthracene 0.277 0.514 0.518 1.069
Fluoranthene 0.798 0.734 0.958 0.537
Pyrene 0.214 0.347 0.784 0.492
Benzo[a]fluoranthene 0.317 0.402 0.536
Chrysene 0.243 0.325 0.562 0.237
Benzo[b]fluoranthene+Benzo[k]Fluoranthene 0.831 0.611
Di benz[a]pyrene 0.076 0.035 0.449 0.257
Indeno[1,2,3-c,d]pyrene+Di benz[a,h]anthracene 0.175 0.147 0.209 0.221
Benzo[g,h,i]perylene 0.056 0.133 0.094 0.132
Total 4.07 5.08 9.01 6.066
LPAHs 2.191 2.957 5.123 3.043
HPAHs 1.879 2.123 3.887 3.023
L/H 1.166 1.392 1.317 1.006
Fl/Py 3.728 2.115 1.221 1.091
Phenanthrene/ Anthracene 1.866 1.996 1.683 _

Journal of Natural Sciences Research www.iiste.org
ISSN 2224-3186 (Paper) ISSN 2225-0921 (Online) DOI: 10.7176/JNSR
Vol.9, No.14, 2019
46
Table (16) the concentrations of PAHs (ng / l) in B.bengalensis in the study area during the year for the third
station.
B.bengalensis
Compound summer Autumn Winter Spring
Naphtalene _ _ _ _
2-methyl naphthalene 1.426 _ _
1-methyl naphthalene 0.356 0.567 1.637 0.738
Acenaphthylene 0.476 0.692 0.683 0.566
Acenaphthene 1.042 _ 0.686 0.493
Fluorene _ 0.274 0.497 0.265
Phenanthrene 0.678 0.669 0.888 _
Anthracene 0.307 0.544 0.872 0.969
Fluoranthene 0.378 0.373 0.689 0.471
Pyrene 0.341 0.271 0.834 0.328
Benzo[a]fluoranthene 0.379 0.392 _ 0.631
Chrysene 0.272 0.325 0.762 0.467
Benzo[b]fluoranthene+Benzo[k]Fluoranthene 0.085 0.124 0.417 0.311
Di benz[a]pyrene 0.091 0.126 0.496 0.275
Indeno[1,2,3-c,d]pyrene+Di
benz[a,h]anthracene
0.253 0.152 0.273 0.313
Benzo[g,h,i]perylene 0.076 0.059 0.104 0.423
Total 4.734 5.994 8.838 6.25
LPAHs 2.859 4.172 5.263 3.031
HPAHs 1.875 1.822 3.575 3.219
L/H 1.524 2.289 1.472 0.941
Fl/Py 1.108 1.376 0.826 1.435
Phenanthrene/ Anthracene 2.208 1.229 1.018 _
Summer season Autumn season
Winter season Spring season
(Fig.9) :Chromatograms of PAHs compounds in B.bengalensis samples of the studied stations during the
season
min10 20 30 40 50
pA
0
200
400
600
800
1000
FID1 A, Front Signal (IMAN\16.D)
Na
ph
tha
len
e
2-m
eth
yl
na
ph
tha
len
e 1
-me
thy
l n
ap
hth
ale
ne
Ac
en
ap
hth
len
e A
ce
na
ph
the
ne
Flu
ore
ne P
he
na
nth
ren
e A
nth
rac
en
e
Flu
ora
nth
en
e
Py
ren
e
Be
nz
o(a
)flu
ora
nth
en
e C
hry
se
ne
Be
nz
o(b
)flu
ora
nth
en
e+
Be
nz
o(k
)flu
ora
nth
en
e
Dib
en
z(a
) p
yre
ne
In
de
no
(1,2
,3-c
d)p
yre
ne
+D
ibe
nz
(a,h
)an
thra
ce
ne
Be
nz
o(g
,h,i
)pe
ryle
ne
min10 20 30 40 50
pA
0
200
400
600
800
1000
FID1 A, Front Signal (IMAN\18.D)
2-m
eth
yl n
ap
hth
ale
ne
1-m
eth
yl n
ap
hth
ale
ne
Ace
na
ph
thle
ne
Ace
na
ph
the
ne
Flu
ore
ne
Ph
en
an
thre
ne
An
thra
cen
e
Flu
ora
nth
en
e
Py
ren
e
Be
nz
o(a
)flu
ora
nth
en
e C
hry
sen
e
Be
nz
o(b
)flu
ora
nth
en
e+
Be
nzo
(k)f
luo
ran
the
ne
Dib
en
z(a
) p
yre
ne
In
de
no
(1,2
,3-c
d)p
yre
ne
+D
ibe
nz
(a,h
)an
thra
ce
ne
Be
nz
o(g
,h,i)
pe
ryle
ne
min10 20 30 40 50
pA
0
100
200
300
400
FID1 A, Front Signal (IMAN\21.D)
2-m
eth
yl
na
ph
tha
len
e 1
-me
thy
l n
ap
hth
ale
ne
Ac
en
ap
hth
len
e A
ce
na
ph
the
ne
Flu
ore
ne
Ph
en
an
thre
ne
An
thra
ce
ne
Flu
ora
nth
en
e
Py
ren
e
Be
nz
o(a
)flu
ora
nth
en
e C
hry
se
ne
Be
nz
o(b
)flu
ora
nth
en
e+
Be
nz
o(k
)flu
ora
nth
en
e
Dib
en
z(a
) p
yre
ne
In
de
no
(1,2
,3-c
d)p
yre
ne
+D
ibe
nz
(a,h
)an
thra
ce
ne
Be
nz
o(g
,h,i
)pe
ryle
ne
min10 20 30 40 50
pA
0
500
1000
1500
2000
2500
3000
FID1 A, Front Signal (IMAN\17.D)
Na
ph
tha
len
e
2-m
eth
yl n
ap
hth
ale
ne
1-m
eth
yl n
ap
hth
ale
ne
Ac
en
ap
hth
len
e A
cen
ap
hth
en
e
Flu
ore
ne
Ph
en
an
thre
ne
An
thra
ce
ne
Flu
ora
nth
en
e
Py
ren
e
Be
nzo
(a)f
luo
ran
the
ne
Ch
rys
en
e
Be
nz
o(b
)flu
ora
nth
en
e+
Be
nz
o(k
)flu
ora
nth
en
e
Dib
en
z(a
) p
yre
ne
In
de
no
(1,2
,3-c
d)p
yre
ne
+D
ibe
nz(
a,h
)an
thra
ce
ne
Be
nz
o(g
,h,i
)pe
ryle
ne
Journal of Natural Sciences Research www.iiste.org
ISSN 2224-3186 (Paper) ISSN 2225-0921 (Online) DOI: 10.7176/JNSR
Vol.9, No.14, 2019
47
Conclusion:
Water and 4 species of Mollusca have some concentrations of Polycyclic Aromatic hydrocarbons.
The Highest concentration of PAHs in the four species were arranged as fellow :Bellamya bengalensis ˃
Melanopsis nodosa ˃ Melanoides taberculata ˃ Theodoxus Jordani.
The sources of PAHs came from many sources, and there is seasonal variations of PAHs in the water due to many
factor such as Temperature, photooxidation and bacterial degradation.
Acknowledgments
The authors wishes to thank the Marine Science Center, University of Basrah for carrying out samples analysis
References
1. Wake, H. (2005). Oil refineries: a review of their ecological impacts on the aquatic environment. Estuarine,
Coastal and Shelf Science, 62(1-2), 131-140.
2. Feldstein, T., Kashman, Y., Abelson, A., Fishelson, L., Mokady, O., Bresler, V., & Erel, Y. (2003). Marine
molluscs in environmental monitoring. Helgoland Marine Research, 57(3), 212.
3. Al-Hejuje, M. M., Hussain, N. A., & Al-Saad, H. T. (2015). Total Petroleum Hydrocarbons (TPHs) n-alkanes
and Polynuclear Aromatic Hydrocarbons (PAHs) in water of Shatt AlArab River–part 1. Global Journal of
Biology Agriculture and Health Sciences N, 4, 88-94.
4. Cajaraville, M.P., Robledo, Y., Etxeberria, M. and Marigomez, J. (1995). Cellular biomarkers as useful tools in
the biological monitoring of environmental pollution: Molluscs digestive lysosomes. In: Cell biology in the
environmental toxicology M. P. Cajaraville (ed .) Univ. of the Basque Country Press, Service, Bilbo, 29-55.
5. Cripps, G.C. and Priddle, J. 1995. Hydrocarbons content of an Antarctic in faunal bivalve-historical record or
life cycle changes? Antarctic Science, 7(2): 127-136
6. Abdel-Shafy, H. I., & Mansour, M. S. (2016). A review on polycyclic aromatic hydrocarbons: source,
environmental impact, effect on human health and remediation. Egyptian Journal of Petroleum, 25(1), 107-
123.
7. Lamichhane, S., Krishna, K. B., & Sarukkalige, R. (2016). Polycyclic aromatic hydrocarbons (PAHs) removal
by sorption: a review. Chemosphere, 148, 336-353.
8. Onozato, M., Nishigaki, A., & Okoshi, K. (2016). Polycyclic aromatic hydrocarbons in sediments and bivalves
on the Pacific coast of Japan: influence of tsunami and fire. PloS one, 11(5), e0156447.
9. Motelay-Massei A., Ollivon D., Garban B., Teil M.J., Blanchard M., Chevreuil M. (2004): Distribution and
spatial trends of PAHs and PCBs in soils in the Seine River basin, France. Chemosphere, 55: 555–565
10. Peng C., Wang M., Zhao Y., Chen W. (2016): Distribution and risks of polycyclic aromatic hydrocarbons in
suburban and rural soils of Beijing with various land uses, Environmental Monitoring and Assessment, 188:
162
11. Irwin RJ, editor. (1997)Environmental contaminants encyclopedia. Colorado: National Park Service.
12. Wild, S.R.; Jones, K.C. (1995) Polynuclear aromatic hydrocarbons in the United Kingdom environment: A
preliminary source inventory and budget. Environ. Pollut., 88, 91–108. [CrossRef]
13. Wania, F.; Mackay, D. (1996)Tracking the distribution of persistent organic pollutants. Environ. Sci. Technol.,
30, 390–396. [CrossRef] [PubMed]
14. Van Jaarsveld, J.A.; Van Pul, W.A.J.; De Leeuw, F.A. (1997)Modelling transport and deposition of persistent
organic pollutants in the European region. Atmos. Environ., 31, 1011–1024. [CrossRef]
15. Li, H., & Ran, Y. (2012). Distribution and bioconcentration of polycyclic aromatic hydrocarbons in surface
water and fishes. The Scientific World Journal.
16. Ali, W.A.; Farid, W. A. and Al-Eed, A. A. (2013). Hydrocarbons distribution in Shatt Al-Arab River bacteria
and fungi. International Journal of Science and Modern Engineering (IJISME), 1(12): 5-9.
17. Al-Saad, H. T., Farid, W. A., & Al-Adhub, A. Y. (2011). Distribution and seasonal variations of n-alkanes in
some species of molluscs from Shatt Al-Arab river. Mesopotamian Journal of Marine Science, 26(2), 182-
196
18. Abdulla SS. (1990).An investigation to river load of Shatt al-Arab in Basrah [dissertation]. Basrah: Marine
Science Center, Basrah University;
19. Moyel, M.S. (2014) Assessment of water quality of the Shatt al-Arab River, using multivariate statistical
technique. Mesopotomia Environ J; 1(1): 39- 46
20. UNEP (United Nation Environmental Program) (1989). Comparative toxicity test of water accommodated
fraction of oils and oil dispersant's to marine organisms. Reference methods for marine pollution. No. 45, 21p
21.Grimalt, J.O. and Oliver, J. 1993. Source input elucidation in aquatic systems by factor and principal component
analysis of molecular marker data. Analaytical. Chemical Acta., 278: pp. 159–176.
22.Al–Saad, H.T. (1995). Distribution and sources of hydrocarbons in Shatt Al– Arab estuary and N.W. Arabian
Gulf. Ph.D. thesis, Basrah University., 186 p.

Journal of Natural Sciences Research www.iiste.org
ISSN 2224-3186 (Paper) ISSN 2225-0921 (Online) DOI: 10.7176/JNSR
Vol.9, No.14, 2019
48
23.Al-Mahmood, H. K. (2009). The monthly variations of discharge and effect that on a total dissolve suspended
and salinity in Shatt Al-Arab River (South of Iraq). Iraqi Journal of science, 50(3), 355-368.
24.Mouillote, D.; Gaillard, S.; Aliaume, C.; Veriaque, M.; Belsher, T.; Troussellier, M. and Chi, T.D. (2005).
Ability of taxonomic diversity indices to discriminate coastal Lagoon environments based on macrophytes
communities. Ecological Indicators, 5(1): 1-17.
25.Rubio-Arias H, Ochoa-Rivero JM, Quintana RM, Saucedo-Teran R, Ortize-Delgado RC, Rey-Burciaga NI, et
al.( 2013) Development of water quality index (WQI) of an artificial aquatic ecosystem in Mexico. J Environ
Prot; 4: 1296-306
26.Dojlido, J.R. and Best, G.A.( 1993) Chemistry of water and water pollution. New York: Ellis Horwood Limited;
27.Al-Hejuje, M. M. (2014). Application of water quality and pollution indices to evaluate the water and sediments
status in the middle part of Shatt Al-Arab River (Doctoral dissertation, Ph. D. Thesis, Biology Department,
College of Science, University of Basrah).
28.Wetzel, R.G. (2001). Limnology, lake and river ecosystems. th ed. Academic press, an Elsevier Science imprint,
San Francisco, New York, London
29.Moyel, M. S., & Hussain, N. A. (2015). Water quality assessment of the Shatt al-Arab river, Southern Iraq.
Journal of coastal life medicine, 3(6), 459-465.
30.Prathumratana, L., Sthiannopkao, S., & Kim, K. W. (2008). The relationship of climatic and hydrological
parameters to surface water quality in the lower Mekong River. Environment international, 34(6), 860-866.
31.Edokpayi, J., Odiyo, J., Popoola, O., & Msagati, T. (2016). Determination and distribution of polycyclic
aromatic hydrocarbons in rivers, sediments and wastewater effluents in Vhembe District, South Africa.
International journal of environmental research and public health, 13(4), 387.
32.Al-Khatib, F.M. (2008). Determination the concentrations, origin and distribution of hydrocarbon compounds
in water, sediments and some biota of Hor Al-Howaiza, south of Iraq and their sources. Ph.D. Thesis.,
University of Basrah, College of Science, Biology Department, 228p. (In Arabic)
33.Al-Timari, A.A.K.; Hantoush, A.A. and Nasir, A.M. (2003). Petroleum hydrocarbons in southern of Iraq waters.
Marina Mesopotamica, 18(2): 141-149
34.Al-Saad, H.T. (1998). Petroleum hydrocarbon concentration and n-alkanes in water from Shatt Al-Arab River.
Marine Science Centre Report
35.Al-Timari, A.A.K. (2000). Oil Pollution in Shatt Al-Arab water studying the monthly variation of poly cyclic
Aromatic hydrocarbons (PAHs). Marina Mesopotamica, 15(2): 535-548
36. Zakaria, M.P.; Mahat, A.A. (2006) Distribution of polycyclic aromatic hydrocarbon (PAHs) in sediments in
the Langat Estuary. Costal Mar. Sci., 30, 387–395.
37. Dickhut, R.M.; Canuel, E.A.; Gustafson, K.E.; Liu, K.; Arzayus, K.M.; Walker, S.E.; Edgecombe, G.; Gaylor,
M.O.; Macdonald, E.H.( 2000) Automotive sources of carcinogenic polycyclic aromatic hydrocarbons
associated with particulate matter in the Chesapeake Bay region. Environ. Sci. Technol., 34, 4635–4640
38. Neff, M. (1979)Polycyclic Aromatic Hydrocarbons in the Aquatic Environment: Sources, Fates and Biological
Effects; Applied Science Publishers: London, UK,
39. Eisler, R. (1987). Polycyclic aromatic hydrocarbon hazards to fish, wildlife, and invertebrates: a synoptic
review. US fish and wildlife service biological report, 85(1.11), 81.