seasonal variation in cytokinin activity and content in
TRANSCRIPT

Portland State University Portland State University
PDXScholar PDXScholar
Dissertations and Theses Dissertations and Theses
1-1-1979
Seasonal variation in cytokinin activity and content Seasonal variation in cytokinin activity and content
in two species of dwarf mistletoes and their hosts in two species of dwarf mistletoes and their hosts
Peter J. Paquet Portland State University
Follow this and additional works at: https://pdxscholar.library.pdx.edu/open_access_etds
Let us know how access to this document benefits you.
Recommended Citation Recommended Citation Paquet, Peter J., "Seasonal variation in cytokinin activity and content in two species of dwarf mistletoes and their hosts" (1979). Dissertations and Theses. Paper 864. https://doi.org/10.15760/etd.864
This Dissertation is brought to you for free and open access. It has been accepted for inclusion in Dissertations and Theses by an authorized administrator of PDXScholar. Please contact us if we can make this document more accessible: [email protected].

; l
I., I ( . [
SEASONAL VARIATION IN CYTOKININ ACTIVITY AND CONTENT
IN TWO SPECIES OF DWARF MISTLETOES AND THEIR HOSTS
by
PETER J. PAQUET
A dissertation submitted in partial fulfillment of the
requirements for the degree of
DOCTOR OF PHILOSOPHY
in
ENVIRONMENTAL SCIENCES AND RESOURCES - BIOLOGY
Portland State University
1979

TO THE OFFICE OF GRADUATE STUDIES A1~ RESEARCH:
The members of the Committee approve the dissertation of
Peter J. Paquet presented March 7, 1979.
Richard D. Tocher, Chairman
Rob~rt O. Tinnin
Malcolm S. Lea
A1frJd S. Levinson
Raymond W. Sommerfeldt '
APPROVED:
W.H. Department of Biology
Graduate Studies and Research
I.:
;
F<

AN ABSTRACT OF THE DISSERTATION OF Peter J. Paquet for the Doctor
of Philosophy in Environmental Sciences and Resources-Biology presented
Harch 7, 1979.
Title: Seasonal Variation in Cytokinin Activity and Content in Two
Species of Dwarf Mistletoes and Their Hosts.
APPROVED BY MEMBERS OF THE DISSERTATION Cmn-nTTEE:
Richard D. Tocher, Chairman
Rob~ O. Tinnin
Malcolm Lea
Alf ed S. Levinson
Raymond Somerfeldt
Cytokinin levels were determined by bioassay on a seasonal basis,
for two species of dwarf mistletoes (Arceuthobium douglasii and Arceutho-
bium tsugense) and their respective hosts, Douglas-fir (pseudotsuga
menziesii) and western hemlock (Tsuga heterophylla). The highest cyto-
kinin levels occurred in early Spring for all of the samples studied. , "
~ ..
2
However, with the exception of the first growth segments of Douglas-fir,
the levels of cytokinins detected were significantly greater in infected :.(
tissue and aerial shoots of the mistletoe than in the healthy tissue.
Further studies were carried out on Spring and Winter samples to
determine the kinds of cytokinins present. High performance thin layer
chromatography and gas liquid chromatography results showed that zeatin
riboside (ZR) was the only detectable cytokinin in Winter samples •. ZR
was also detected in all Spring samples excepting the aerial shoots of
A. douglasii. Two other cytokinins, zeatin and N6-(62isopentenyl) adeno-
sine (2iPA) were also detectable in Spring samples. Zeatin was present
in aerial shoots from both dwarf mistletoes and in the infected fifth
growth segments from Douglas-fir and in infected western hemlock tissue.
Zeatin occurred in the healthy tissue only in first growth segments of
Douglas-fir.
The 2iPA was detectable in the aerial shoots of the dwarf mistle-
toes, in the fifth grmvth segments of Douglas-fir, and in the infected
tissue from western hemlock.
These results are discussed with particular reference to the role
of cytokinins in the physiological interactions between the host and
the parasite.

'I
ACKNOWLEDGMENTS
I wish to thank Doctors Richard D. Tocher and Robert O. Tinnin
for their guidance and advice during the course of this research.
I also wish to thank Dr. Donald M. Knutson of the U.S. Forest
Service for his interest and assistance, and Mr. Richard Doty and
Patrick Green for their technological assistance.
Special thanks go to my wife Caroline for her encouragement and
support.
T gratefully acknowledge the support of the Collins Foundation
for their financial assistance which made this research possible.

,0':
~ .. '
r', I.', I I.
TABLE OF CONTENTS
PAGE
ACKN01.JLEDGMENTS •.•••.••••••••.•...•••.••........•.•.•.•... iii
LIST OF TABLES ••.•.•.••••.•••..•.••.•.•••.••••.•.•..••.... vi
LIST OF FIGURES vii
INTRODUCTION 1
Environmental and Resource Implications .••.••••...•• 10
MATERIALS AND METHOD S ••..•..•...........••...•.......••.•• 14
Collection Sites ••..•••.••.•••.......••.......•••••. 14
Extraction Procedures ••....••..•...••.•.•..•..•..••• 17
Extraction Procedure I ..••..•.••.••.•.••.•....• 17
Extraction Procedure II .•....••••.••..•••.••••• 18
Bioassays •...•.....••.....••.•....••..•••........•.. 20
Pumpkin Seed Cotyledon Bioassay ................ 20
Amaranthus Bioassay .•.••••••••••..•••.•..••...• 22
Chromatographic Procedures •••••.••...••••..••.•••.•. 23
Paper Chromatography ........................... 23
Preparative Thin Layer Chromatography .......... 23
High Performance Thin Layer Chromatography ..... 24
Gas Liquid Chromatography •••...•.•.........•... 25
RESULTS 27
Extraction Procedure I •.•••••••......•••..••......•. 27
Pumpkin Seed Cotyledon Bioassay ................ 27

v
PAGE
Extraction Procedure II •...••.....••...•..•.••.•••. 30
Amaranthus Bioassay ...•..•••...•.••.••.••.•.•• 30
Preparative Thin Layer Chromatography ........ . 41
High Performance Thin Layer Chromatography .... 41
Gas Liquid Chromatography .................... . 49
DISCUSSION AND CONCLUSIONS .•.....•........•••.••••...••.. 56
Seasonal Flue tua t ions .•••.••••..•..•.•..••••••..••• 56
Infected vs. Uninfected Material .......•..........• 57
i _ REFERENCES ...... ,. ........ ,. .............................. . 65
APPENDIX I 70
f ..
, !. I:' I' ~:,
~.: ;
f r r-t
~ . i
i :"
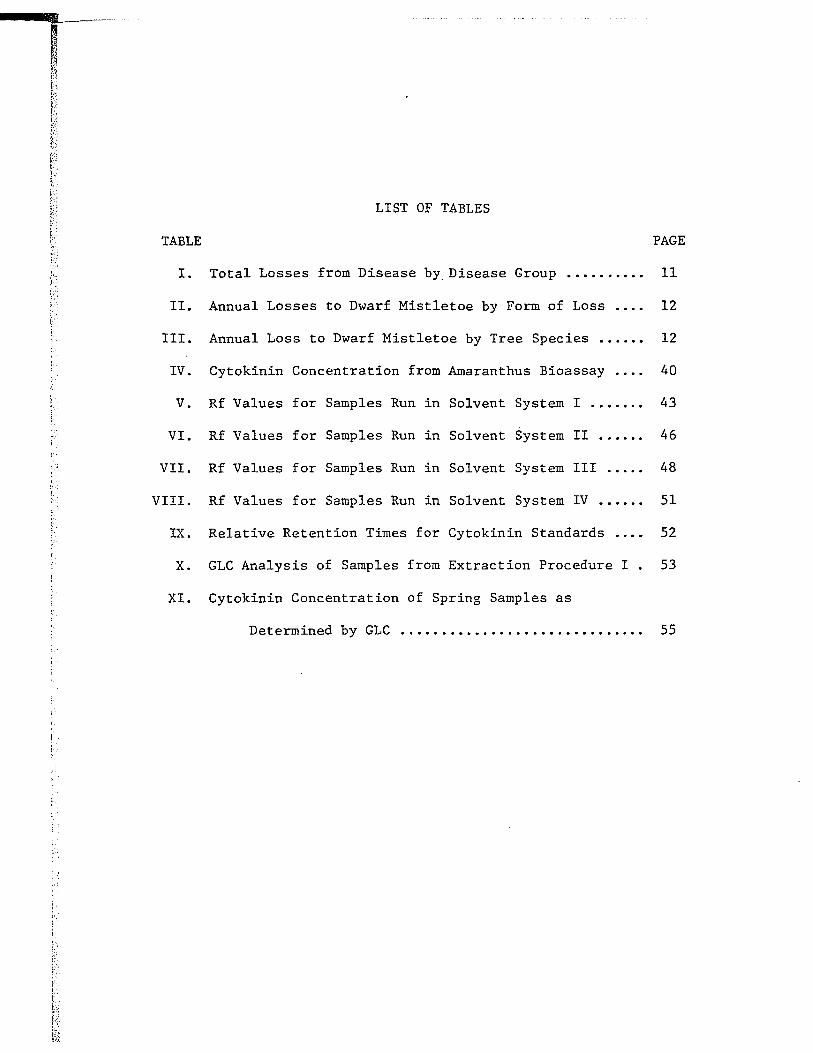
LIST OF TABLES
TABLE PAGE
I. Total Losses from Disease by. Disease Group •.•.••.•.. 11
II. Annual Losses to Dwarf Mistletoe by Form of Loss •••. 12
III. Annual Loss to Dwarf Mistletoe by Tree Species ••..•• 12
IV. Cytokinin Concentration from Amaranthus Bioassay . ... 40
V. Rf Values for Samples Run in Solvent System I . ............ 43
VI. Rf Values for Samples Run in Solvent System II ............ 46
VII. Rf Values for Samples Run in Solvent System III .. ........ 48
VIII. Rf Values for Samples Run in Solvent System IV ............ 51
IX. Relative Retention Times for Cytokinin Standards .. ...... 52
X. GLC Analysis of Samples from Extraction Procedure I . 53
XI. Cytokinin Concentration of Spring Samples as
Determined by GLC ....••••.•..•.....•.•...••.... 55

t i ( .. I'
LIST OF FIGURES
FIGURE PAGE
1. Douglas-fir tree infected with A. douglasii
and showing many "witches' brooms" re-
suIting from this infection .••................• 3
2. Douglas-fir trees that have died as a result
of dwarf mistletoe infection 4
3. Some free bases of natural and synthetic
cytokinins .•..••.••.•••.•.•.•.........•.••••••• 7
4. Fifth growth segment of a branch from Douglas-
fir showing the aerial shoots of A. doug1asii
with female fruits ....•....•.•........•........ 16
5. Flow chart for Extraction Procedure I .......•...••. 19
6. Flow chart for Extraction Procedure II ..........•.• 21
7. Pumpkin seed cotyledon bioassays for cyto-
kinins from 10 g fresh Douglas-fir tissue
or the dwarf mistletoe A. doug1asii ......•..••• 28
8. Pumpkin seed cotyledon bioassays for cyto-
kin ins extracted from 10 g fresh western
hemlock tissue or the dwarf mistletoe
A. tsugense ..•••.•....•.....•..•....•...•.•.•.• 29
9. Cytokinin activity in extracts of healthy (I)
and infected (II) Douglas-fir first year
growth segments, Spring 1977 ••••••.•..•.••..••. 31

i i f:.
viii
FIGURE PAGE
10. Cytokinin activity in extracts of healthy (I)
and infected (II) Douglas-fir first year
growth segments, Spring 1978 •.•••••••••••.••.•• 32
11. Cytokinin activity in extracts of healthy (I)
and infected (II) Douglas-fir fifth year
gorwth segments, Spring 1977 •.•••.••••.••••.••• 33
12. Cytokinin activity in extracts of healthy (I)
and infected (II) Douglas-fir fifth year
growth segments, Spring 1978 .•.•••.•••.•••••••. 34
13. Cytokinin activity in extracts of A. douglasii
aerial shoots .................................. 35
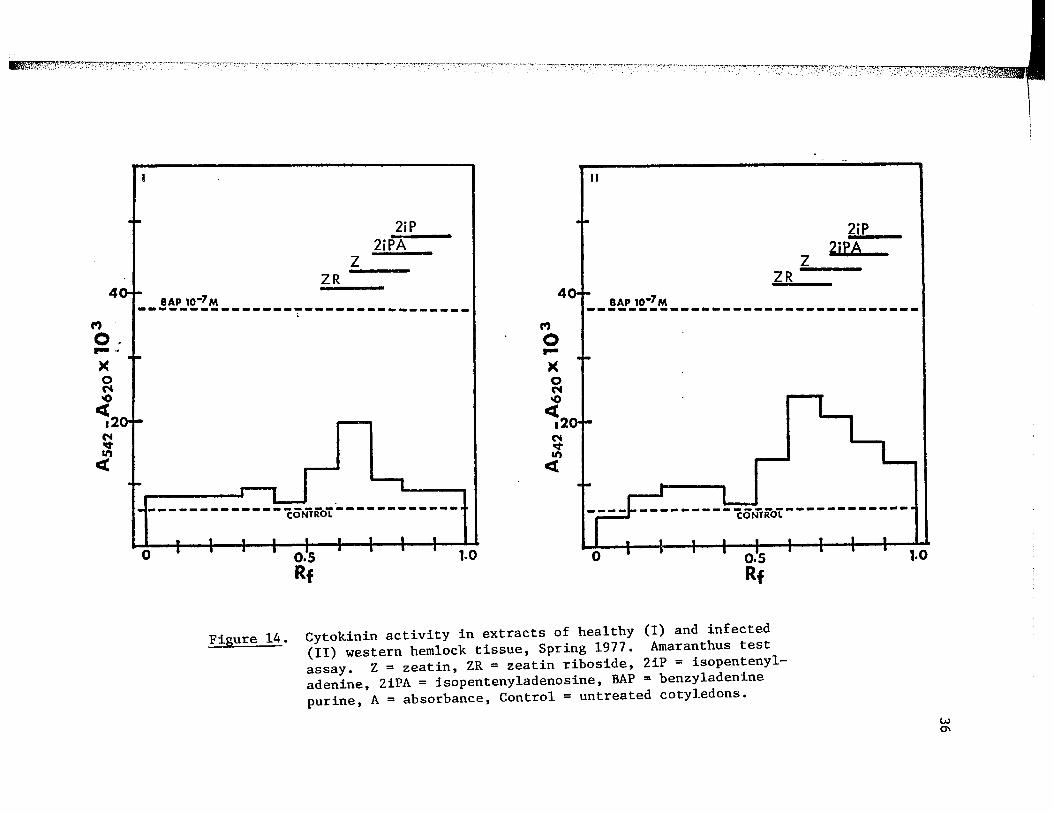
14. Cytokinin activity in extracts of healthy (I)
and infected (II) western hemlock tissue,
Spring 1977 .................................... 36
15. Cytokinin activity in extracts of healthy (I)
and infected (II) western hemlock tissue,
Spring 1978 .................................... 37
16. Cytokinin activity in extracts of A. tsugense
aerial shoots ••.•••••••••••••.•••••.••••••••••• 38
17. Cytokinin activity of typical winter samples
of Douglas-fir (I) and western hemlock (II) 39
18. Rf zones for cytokinin standards and tissue
extracts run in solvent system I on HP-TLC
plates ......................................... 42

I· '.
I'· i, . i t. , !:,. , i'
ix
FIGURE PAGE
19. Rf zones for cytokinin standards and tissue
extracts run in solvent system lIon
HP-TLC plates ................................... 45
20. Rf zones for cytokinin standards and tissue
extracts run in solvent system IlIon
HP-TLC plates ..................................... 47
21. Rf zones for cytokinin standards and tissue
extracts run in solvent system IV on
HP-TLC plates .............................................. 50

r .
i
INTRODUCTION
Dwarf mistletoes (Arceuthobium spp., family Viscaceae) are seed
bearing flowering plants which are parasitic on conifers of the Pinaceae
in the Old and New Worlds and of the Cupressaceae in the Old World (Hawks-
worth and Wiens 1972). Parasitism in dwarf mistletoes is of a strictly
obligate nature with the parasite being dependant upon the host for all
of its water and mineral requirements and for most of its carbohydrates
(dwarf mistletoes do contain chlorophyll and are capable of photosyn-
thesizing to a limited degree) (Hull and Leonard 1964b; Miller and Tocher
1975).
Physiological contact with the host is maintained via the endophy-
tic system whereby, haustoria invade the host branches and maintain close
contact with the host tissue.
The initial symptom of a dwarf mistletoe infection may be the
development of a small spindle-shaped swelling at the site of infection
one or more years after initial penetration (Sharpf and Hawksworth 1968;
Shea and Stewart 1972; Lightle and Weiss 1974). Swelling may be pro-
nounced or inconspicuous. Aerial shoots of the parasite usually arise
from the swelling after another one to two years. How~ver, severe in-
fection may occur without the shoots arising. As the endophytic system
of the parasite becomes more extensive, the development of "witches
brooms", the proliferation of many close weak branches on the host re-
suIting from disruption of normal spical dominance, may occur, (figures

2
1 and 2). 1,:: l·,·
Witches brooms may be classified into two basic types (Hawksworth
and Wiens 1972; Kuijt 1960):
1) Systemic types, in which the endophytic system grows along with
the branch, with aerial shoots of the parasite scattered along the host
branch, often concentrated in the fourth through sixth year growth seg-
ments; and
2) Nonsystemic or localized types in which the shoots remain con-
centrated near the original site of infection. The type of broom forma-
tion is relatively species constant, with the nonsystemic type being
the more common.
A serious infection in a tree may exist without the development of
a broom, but this is usually characterized by abundant shoots along the
branches of the crown (Lightle and Weiss 1974).
The size of witches' brooms may vary considerably from those in
young infections having only a few small branchlets to those with large
masses of branches weighing several hundred pounds (Shea 1966). These
may become large enough, as in Douglas-fir, to include the entire crown
of the tree and may develop long drooping or trailing branches on their
lower portions (Graham 1961). However, in older infections the upper
part of the crown is usually dead or dying and nearly all the foilage
is contained in the broomed branches (Scharpf and Hawksworth 1968;
Graham, 1961).
This results in the typical spike tops (dead tops) seen in heavily
infected Douglas-fir stands. The infected branches may have a greatly
increased growth in diameter. It has been suggested that the broomed

I
I. !.,
I j,
I
". ,.
{ .
, i· " I.
Figure 1. Douglas-fir tree infected with A. doug1asii and showing many "witches' brooms" resulting from this infection. Note healthy trees in background.
3

~ ; ," i
Figure 2. Douglas-fir trees that have died as a result of dwarf mistletoe infection. The abnormal branching pattern in the dead "witches' brooms" may be seen clearly.
4

i ;
, , . ,
i r
f-
i . .
5
branches serve as a nutrient sink, diverting nutrients from the uninfec-
ted parts of the tree. The growing tops of the trees do not get needed
nutrients, resulting in a loss of vigor and usually death of the upper
part of the crown. Accordingly, broomed branches usually outlive their
infected neighbors by many years (Hawksworth and Wiens 1972).
When the trunk of the tree is invaded by the endophytic system,
other symptoms may occur. Old trunk infections may be characterized
by large trunk cankers or by spindle shaped swellings of the trunk
(Graham 1961; Shea and Stewart 1972). Seams in the trunk may appear
associated with broomed branches (Shea 1966). Due to their large size,
broomed branches often break off. The cankers and stubs of broomed
branches can serve as entry points for decay-causing fungi and insects
(Shea 1966; Kuijt 1955; Shea and Stewart 1972).
In 1966 Thimann and Sachs, in their pioneering work on the role
of cytokinins in fasciation disease in peas, suggested the possibility
that cytokinin might playa role in mistletoe infections. Other authors
(Bidwell 1974; Hill 1973) have also made similar statements but to my
knowledge this hypothesis has never been tested.
Cytokinins are a group of plant growth regulators which are potent
inducers of nutrient mobilization, cell division, inhibition of senes-
cence and, as antagonists of auxins, inhibitors of spica1 control.
Because of these properties cytokinins have often been implicated in
plant diseases since many diseases show symptoms that can be mimicked
by cytokinins (see reviews by Daly and Knoche 1976; Sequeira 1973).

6
6 Naturally occurring cytokinins are usually N -substituted adenine
derivatives (Fig. 3), although such substances as dipheny1 urea, iso-
1ated from coconut milk, also act physiologically in the same manner.
The generic name cytokinin is given to chemical substances which
can stimulate cell division or cytokineses, in the manner of kinetin
(Fig. 3), the first chemically defined cytokinin (Skoog and Armstrong 1970;
Varner and Ho 1977). Kinetin is not a naturally occurring cytokinin but
is derived from herring sperm DNA and has been identified as 6-furfury1-
aminopurine (Miller et.a1. 1955). The first naturally occurring cyto-
kinin to be isolated and identified was Zeatin (6-(4-hydroxy-3-methy1-
trans-2-buteny1amino) purine) (Fig. 3) which was isolated from immature
corn kernels (Letham et.a1. 1964). Subsequent to this discovery anum-
ber of other naturally occurring cytokinins have been isolated from a
variety of species (Fig. 3).
; . While cytokinins are considered ~o be hormones which regulate
cell-division activities, their role in plants has gradually been re-
cognized as being so widespread that it includes some aspects of every
part of growth and development. There is also evidence that cytokinins
play important roles in certain diseases. For example, "fasciation
disease", caused by the bacterium Corynybacterium fascians, produces
an abnormal flattening of host branches and an increase in the number of
active lateral buds. The above responses have tentatively been shown to \. :.
be the result of the production of cytokinins by the pathogen (Thimann
and Sachs 1966). The fungus, Taphrina cerasi, which causes "witches'
brooms" in a number of hosts has also been shown to produce the cyto-
kinin zeatin when cultured in artificial media (Barthe and Bu1ard 1974).

~'{J.~YS~'~·~;::·_~:'· .:_-T_";,:."'-" "' _cr~T"":-:--·· ----'--~'.,~.,..-;:.-~~.-" ----;- - .'- ---.--- -_. - -"-~'--'
COMPOUND
6 2 N -(~ -Isopentenyl)adenosine 2iPA
6 2 N -(~ -Isopentenyl)adenine 2iP
Zeatin riboside
6 N -Benzylaminopurine* BAP
Kenetin*
*synthetic
.....••. -.... -.-.--:-< ~-,-,-:-:-c~'",-!:~~-- .. :-: . •. _.~ ·-:.~·.--_r:·· .. : .~ .. -.:--:- ....•.
Rl
. CH3 -NH-CH -CH=C 2 CH
3
CH3 -Nl-!-CH -CH=C
2 CH 3
CH20H -NH-CH -CH=C
2 CH
-NH-CH -C H 266
-NH
3
R2
-ribose
-H
-ribose
-H
-H
Figure 1. Some free bases of natural and synthetic cytokinins.
~ .•••• 7? • .,.< •. =~"';-J \ \
......

---,--~ r ::, 8 I' I,,:
L" A nU!!lber of other brooming responses have also been at.tributed to the
'" ," fe., , ' '"
I·"· r
action of cytokinins (Skoog and Armstrong 1970; Hill 1973).
This study was designed to investigate the role of cytokinins
in two species-of dwarf mistletoe and their respective infected and
healthy hosts. Of the two species chosen, A. doug1asii which infects
Douglas-fir, produces a systemic infection and A. tsugense, which infects
western hemlock, a non-systemic infection. The main objectives were to
determine: 1) the levels of cytokinins (both activity and concentra-
tion); 2) seasonal variation cytokinin levels; and 3) the individual
cytokinins present in the various tissues samples. This was accomplished
using various extraction procedures, bioassays and chromatographic tech-
niques. I felt that cytokinins and possibly other growth regulators
played an important role in the dwarf mist1eto~· infection.
A number of the host responses to dwarf mistletoe infection are
quite similar to the knovffi effects of cytokinins acting alone or in
combination with other hormones. The most obvious is the loss of apical
control in those hosts having a systemic type of infection. This type
of infection is common in Douglas-fir (Pseudotsuga menziesii) and 10dge-
pole pine (Pinus contorta) (Kuijt 1960). The infected host buds also,
tend to break dormancy earlier in the year and tend to remain active for
a longer period of time than is the case for the uninfected hosts (Kuijt
1960). Both of these actions have been simulated in other plant material
by the application of cytokinins alone, or in conjunction with other
hor!!lones (Steward and Krikorian 1971). As host trees begin to succumb
to the infection, infected branches tend to live and stay green for a

i l. ,
f· I· I
9
longer period of time than healthy branches (Kuijt 1960). This type of
response may be looked upon as an example of the "green island" effect
in which application of cytokinins can cause a delaying of senescence and
the typical yellowing that follows (Steward and Krikorian 1971; Hill 1973).
In those host species showing localized or nonsystemic types of
infection such as western hemlock (Tsuga heterophyla) and ponderosa pine
(Pinus ponderosa), the host does not show loss of spical dominance but
does show a large area of swelling in the region of infection (Kuijt
1960). This swelling is due in part to increased cell division and is
the type of response that could be expected from increased cytokinins
(Sequeira 1973).
Another aspect that I believe cllould be emphasized is the ability
of cytokinins to cause mobilization of nutrients. With at least two
fungal diseases it has been shown that there is a mobilization of nut-
rients from the healthy tissue to the areas of infection (Sequeira 1973;
Daly and Knoche 1976). This could be a highly important function in
the dwarf mistletoe host-parasite relationship since it appears that dwarf
mistletoes are almost entirely dependant on their hosts for their nutri-
tiona1 needs (Miller and Tocher 1975; Hull and Leonard 1964a and 1964b).
Indeed, both Hull and Leonard (1964a) and Greenham and Leonard (1965)
have shown that substantial amounts of both carbohydrates and amino acids
are shunted from the host to the parasite.
It should also be emphasized that it is difficult to attribute any
one response to a single hormone. Often these plant growth substances
act synergistically or antagonistically and in some cases there may be

10
as many as four substances involved in a single reaction (Hill 1973).
Often growth substances will vary with the seasons. One substance will
be synthesized rapidly with consequent reduction in another.
ENVIRONMENTAL AND RESOURCE TI-1PLICATIONS OF THIS STUDY
i'
Although dwarf mistletoe can be seen to have an adverse effect on
lumber quality, by far the most serious effect of the parasite is in the
unrealized timber production caused by its presence. Dwarf mistletoe
is known to reduce both height and diameter growth and thus reduce the
yield of an infected stand. Haglund and Dooling (1972) found in a com-
parison of an infected stand of Douglas-fir with a similar uninfected
stand that the uninfected stand produced 1.5 times the board foot volume
in one half the time. In a stem analysis of 30 western hemlock trees,
averaging 110 years old, Smith (1969) found that lightly infected trees
had 41% greater volume growth and 84% greater height growth in a seven
year period than severely infected trees. The timber loss due to dwarf
mist1toes in the western United States is estimated to total 3.2 billion
board feet annually (Shea and Howard 1969). At 1970 prices this would
total approximately $75 million.
Forest diseases in Oregon and Washington cause an estimated loss
of 403 million cubic feet in annual forest productivity. Dwarf mist1e-
toes are the largest single category, accounting for an annual average
loss of 148 million cubic feet, or 37% of the total loss to disease
(Childs and Shea 1967). This is equivalent to the amount of lumber used
to build 82,000 average homes (Stewart and Shea 1971). Other diseases

11
causing timber loss are root rots and other diseases, including foi1age
diseases, stem rusts, etc. (Table I).
TABLE I
Total Losses from Disease by Disease Group.
Million cubic feet Thousand average homes*
Dwarf Mistletoes 148 82
Root Rots 115 64
Heart Rots 110 61
Other 30 17
Total 403 224
*One average home = 11,000 board feet or 1800 cubic feet.
(Table compiled from Childs and Shea, 1967)
Loss from tree diseases can be classified as: 1) growth loss -
growth that would have occurred if a disease was not present; 2)~-
ta1ity - trees that die because of disease; and 3) cull - wood made un-
usable by disease (Stewart and Shea 1971). Loss from dwarf mistletoe
in Oregon and Washington is almost entirely due to growth and mortality,
with cull loss being negligible (Childs and Shea 1967) (Table II).
By tree species, Douglas-fir has the greatest annual losses to
dwarf mistletoe, followed by western hemlock and ponderosa pine (Table
III) •

12
TABLE 11*
Annual Losses to Dwarf Mistletoe by Form of Loss
Million Cubic Feet
Growth Loss 75
Mortality 72
Cull Negligible
Total 148
*Compi1ed from Childs and Shea 1967.
TABLE 111*
Annual Losses to Dwarf Mist1toe by Tree Species
Million Cubic Feet
Douglas-fir 46
Western Hemlock 42
Ponderosa Pine 29
True Firs 11
Miscellaneous 20
Total 148
, i·
*Compi1ed from Childs and Shea 1967.

13
Control of dwarf mistletoe can be seen as a means of increasing
timber yields in order to offset increasing demands for forest products.
Control methods can be placed into three categories: 1) Silvicultural,
or harvesting and replanting methods; 2) Biological methods, involving
the use of organisms which attack, feed on, or some other way affect
the growth and spread of dwarf mistletoe; and 3) Chemical methods, in-
volving the use of herbicides to selectively kill the parasite.
To date, the only method that works is the silvicultural. In
order for the latter two methods to be successful more basic knowledge
concerning the physiology of the host parasite relationship is required.
It is one of the goals of this work to shed some light on what could be
a simple and direct method for control of the dwarf mistletoe.
1- ..
i..
i i· [
MATERIALS AND METHODS
Collection Sites
Locations for obtaining samples were established at two different
sites in the Mt. Hood National Forest. Douglas-fir collection sites
were in the area around the Bear Springs ranger district. This area
contains numerous Douglas-fir dwarf mistletoe infected and healthy
trees which were deemed suitable for sampling. Western hemlock was
collected from the Goat Mountain area, a location with numerous infected
and uninfected specimens.
At each site, fourteen infected trees were chosen and tagged for
future reference. Each of these trees was of approximately the same
age, as determined by height estimates and the diameter at breast height.
The above number of trees was needed in order to collect enough material
from the aerial shoots of the dwarf mistletoe for the extraction pro-
cedures. At the same site, ten uninfected trees were chosen to serve
as controls. These resembled the infected trees as closely as possible.
Tissue samples from the above were collected by removing the por-
tion of the branch to be investigated with pruning shears or a hand
saw. The needles were removed by hand and the appropriate samples
were cut and weighed to the nearest gram and placed in vacuum bottles
containing ice cold ~IO°C) 80% ethanol (see section on extraction pro-
cedures). Aerial shoots of the dwarf mistletoe were hand picked and
treated in the same manner as other tissue.

[,:"' I. f;.:
! .
~ .
/.
15
These collections were made on a seasonal basis, i.e., Fall,
Winter, Spring and Summer. Fall samples were collected after the
first frosts of the year which, at this altitude, occurred in late
September. Winter samples were collected in mid-February. The time of
collection for Spring samples was based on the condition of the buds.
The buds were monitored weekly during April, May and June to determine
when swelling was taking place and collections were made just prior
to bud break. This occurred in late May in infected Douglas-fir and in
mid-June for the uninfected Douglas-fir. Bud break in infected western
hemlock took place in early May and occurred in the first week of June
in the uninfected trees. Spring and Winter samples were collected over
two growing seasons.
In the case of ~. menziesii (a systemic type of infection occurs
on this host) male and female aerial shoots of A. doug1asii and the
first and fifth yearly segments were collected. (A segment refers to
a single years growth length of a conifer branch or stem and is some-
times incorrectly called an internode (Fig. 4).) The first segment
sample contained the dormant bud in the Winter, Summer and Fall collec-
tions. In Spring collections the bud is no longer dormant but is under-
going active growth.
In the case of western hemlock, a species which has a non-systemic
type of infection, only aerial shoots of the mistletoe and the localized
area of infected tissue were collected from the infected trees. In un-
infected western hemlock a segment of the branch was collected that
was of the same size as that from the infected branch and the same dis-
tance from the main trunk.

l' : !
, . ~ , : ~ ..
Figure 4. Fifth growth segment of a branch from Douglas-fir showing the aerial shoots of A. douglasii with female fruits. Portions of the third and sixth growth segments may be seen on the left and right respectively.
16

,.:
!
17
Extraction Procedures
Initial extraction was begun in the field by placing the weighed
samples in 100 m1 of ice cold 80% ethanol in individual vacuum bottles.
This procedure was used as the starting point in both of the following
methods.
Extraction Procedure I
Fifty to 100 samples from the vacuum bottles were ground in 80%
ice cold ethanol (20 m11g of tissue including the ethanol from the
vacuum bottles) in a Waring blender for 10 minutes. The samples were
then extracted 80% ethanol for 24 hours at -20°C. At the end of this
period the samples were vacuum filtered on Whatman's number 42 filter
paper and the filtrate was stored in the freezer (-20°C) for further
extraction. The extraction procedure was carried out two more times
and all of the filtrates were combined.
The ethanol extract was evaporated to the H2
0 phase under vacuum
at 37°C in a rotary flash evaporator. The H20 phase was then adjusted
to pH 8.6 with 1 N NaOH and extracted with ethyl acetate (2 volumes)
three times. The remaining H2
0 phase was discarded and the ethyl ace
tate phase was evaporated to dryness under vacuum at 37°C and the re-
maining residue was dissolved in 80% ethanol. The ethanol fraction was
reduced to the H20 phase under vacuum at 37°C and this phase was then
extracted three times with ethyl acetate (2 volumes).
The ethyl acetate phase was discarded and the water phase was
adjusted to pH 5.5 with 1 N HC1 and extracted three times with water
saturated n-butano1 (3 volumes). The Water fraction was discarded and

'W~~._._ ... _. __ .....
:,.,:.1',.
;,".'
i ",
i,
18
the n-butanol fractions were combined and concentrated to 5 ml under
vacuum at 37°C. The samples were then stored at -20°C for further
analysis. This procedure purportedly removes the other major plant
growth substances, such as auxins, gibberellines and abscisic acid, that
might interfere with bioassays (Shindyand Smith 1975). A flow chart
is presented in Figure 5.
Extraction Procedure II
Fifty to 100 g samples of tissue from vacuum bottles were ground
in ice cold 80% ethanol (20 mllg of tissue including the ethanol from
the vacuum bottle) for 24 hours at -20°C. The extract was filtered on
Whatman's number 42 filter paper and the supernatant solution was re-
turned to the freezer. The filter paper and the residue were stirred
for one hour with a fresh volume of 80% ethanol. This mixture was then
filtered and the procedure was again repeated. All of the supernatant
solutions were combined and reduced to 5 ml in vacuo at 45°C and then
centrifuged for 15 minutes at 2000 x g. The supernata~t solution was
removed and the pellet was washed with 5 ml of distilled H20. The super
natant and the washings were combined and loaded on a polyvinylpyrrolo-
done (PVP) (Polyclar AT, GAF Corp.) column (15 x 2.5 cm.) which had
been prewashed with pH 5.0 citrate buffer, 0.1 M. The column was then
eluted with 215 ml of the same buffer of which the final 125 m1 volume
was retained as sample (Carlson and Larson 1977).
The above sample volume was dried in vacuo at 50°C and the resi-
due was taken up in 5 m1 of H20. The pH was adjusted to 2.5 with 1.0 N
Hel and loaded on a cation exchange resin column, 30 ml bed volume;

FROZEN TISSUE grind with
RES\DUE (discard)
80% EtOH and extract at O°C
i EtOAc
adjust extract
I
evaporate
H 0 t6 pH 2.8 evaporate to dryness
dissolve in EtOH evaporate to H20 phase extract with EEOAc x 3
adjust extract
I
Wir EtOAc
EtOAc FRACTIO!\ II
(neutral auxins)
Figure 5.
EtOAc FRACTION I
(IAA,ABA,GA's)
H2
0 adjust to pH 5.5 extract with H
20
saturated n-butanol x 3
• n-BUTANOL
-,
FRACTION III (cytokinins)
i H
20
(discard)
Flow chart for solvent extraction procedure I.
RES\nUE (discard)
19

f. ..
I::'
f r
20
+ (Dowex 50W-X8 H form, 200-400 mesh). The column was washed with 150
ml 70% ethanol and then 150 ml of distilled H20. Compounds responsible
for cell division activity were eluted from the column with 250 ml of
5 N NH40H. The ammonia was removed by evaporation in vacuo at 50°C.
The residue was taken up in 3 ml of 35% ethanol and stored in the freezer
for use in chromatography and in bioassays (Hewett and Wareing 1973).
This method of extraction has an advantage over the first in that
it employs PVP which is a useful agent in removing phenolic compounds
that could interfere with bioassay procedures. A flow chart is provided
in Figure 6.
Bioassays
Pumpkin Seed Cotyledon Bioassay
This bioassay is essentially a modification of the Cucumber coty-
ledon assay of Fletcher and McCullagh (1971) and is based on the cyto-
kinin induced formation of chlorophyll in etiolated cotyledons. Pumpkin
seeds are used because of their larger size and ease in handling (Fox,
personal communication).
Pumpkin seeds were sown in vermiculite that was in plastic green-
house trays. The vermiculite was watered with distilled water until
saturated and the trays were sealed in opaque plastic bags and placed
in an unlighted growth chamber at 25°C. The seeds wer~ allowed to germ-
inate for six days. At the end of this period the trays were removed
from the plastic bags and placed under a dim green light for the removal
of the cotyledons. Only cotyledon pairs with a maximum degree of hook
angle were chosen for bioassays.

21
TISSUE SAMPLES grind and extract 3 times in 80% EtOH @ OoC.
i RESIDUE i Combined supernatants
(discard) reduced "in vacuo" @ 37°C
I Centrifuged 2000 x G
30 min.
I combined'supernatants
and washings I
PVP Column elute with O.lM phosphate buffer
i PELLET
(discard)
Final 1251m1 buffer eluate reduced to dryness
"in vacuo" & taken up in 5 m1
First 90 mt buffer (discard)
I
I + Dowex 50 W- x 8H
I 3N NH
40H eluate
extract lith H2
0 saturated n-butano1 (pH 8) x 3 - I
i H
20 and 70% MeOH
(discard)
combined' butanol phase reduced to dryness "in vacuo" and taken up in
i H20 phase
(d~scard)
35% EtOH.
Figure 6. Flow Chart for Extraction Procedure II.
22
Five cotyledon pairs were placed in 5 cm. glass petri dishes which
were lined with a double thickness of Whatman 3MM filter paper. Two m1
of M/75 phosphate buffer, pH 6.3, and containing the appropriate cyto-
kinin standards was added to the petri dishes and these were returned
to the dark for 14 hours at 38°C. At the end of this time period the
cotyledons were illuminated with fluorescent light at an intensity of
220 ft-c. After 3 hours the chlorophyll was extracted with 90% acetone
with 2.0 m1 of NH40H per liter, saturated with MgC03 • The volume was
brought up to 10 m1 and the chlorophyll levels determined by measuring
the absorbance at 665 nm.
Extracts from extraction procedure I were tested in this system
by adding 1.5 m1 of the appropriate sample to the filter paper discs
and allowing them to air dry. The discs were then placed in the petri
dishes with the cotyledons and 2.0 m1 of the buffer solution.
Amaranthus Bioassay
This bioassay is based on the formation of betacyanin in the coty-,
1edons and terminal portion of the hypocoty1 of Amaranthus cauda tum
(Biddington and Thomas 1973). This reaction is considered to be highly
specific for cytokinins (Challice 1977).
Seeds were purchased from the Nichols Seed Co. of Albany Oregon.
The seeds were sown in plastic boxes on two layers of Whatman 3MM filter
paper moistened with distilled water, and germinated in a dark growth
chamber at 25°C for 72 hours. The seed coats were removed and exp1ants
consisting of the upper portion of the hypocoty1 plus the cotyledons
were cut from the seedlings. These exp1ants were used as the bioassay

23
sections, sets of ten being transferred to transparent polystyrene bio-
assay boxes. Each box contained two layers of Whatman 3MM filter paper
moistened with 2 ml of M/75 phosphate buffer at pH 6.3 and containing
1 mg/ml tyrosine and the cytokinin to be assayed. The boxes were incu-
bated at 25°C for 18 hours in the dark, after which the explants were
removed and placed in 2.0 ml of distilled water. Betacyanin was extrac-
ted by means of two cycles of freezing and thawing and the quantity de-
termined by calculating the difference between the optical densities at
542 nrn and 620 nm.
;- ..
i The plant extracts were tested by cutting paper chromatograms (see
section on paper chromatography) into ten equal Rf segments and placing
each segment in a bioassay box. The bioassay procedure already described
was then followed with the omission of the cytokinins to the buffer
solution.
Chromatographic Procedures
Paper Chromatography
Paper chromatography was performed on 20 x 20 cm. Whatman 3MM
chromatography paper. The solvent system was isopropanol: ammonia: water
(10:1:1) (Van Staden 1976). One mI. of extract was applied to the origin
as a streak. After development, the chromatogram was thoroughly dried
in a stream of air, divided into ten equal Rf strips and these were then
assayed for cytokinin activity in the Amaranthus bioassay.
Preparative Thin Layer Chromatography
Preparative thin layer chromatography was carried out using 20 x
20 cm. glass plates pre-coated with a 1.Dmm. layer of silica gel F-254

24
(EM Laboratories, Inc., Elmsford, New York). Each extract (1.0 m1) was
applied as a streak and separated with ~-butano1: 1N NH40H: Water (7:
1:2) (Carlson and Larson 1977). Four cytokinin standards were spotted
'. ;
at the right hand edge of the plate and run with the samples for reference.
At the end of the run the plates were air dried and the spots correspond-
ing to the cytokinin standards were located under U.V. light (254 nm).
The area of the plate that corresponded to the Rf zones of the standards
was scraped off and extracted in 80% ethanol. These extracts were used
for high performance thin layer chromatography or converted to their
trimethy1si1y1 derivatives for gas chromatography.
High Performance Thin Layer Chromatography (HP-TLC)
HP-TLC bears the same relationship to ordinary TLC as High Per-
formance Liquid Chromatography to ordinary liquid chromatography. HP-
TLC plates are coated with a thinner layer of absorbent which has been
optimized for separation of samples in the nano1iter range. Particle
size distribution is extremely narrow, much narrower than that of stand-
ard pre-coated plates. The layer density of an HP-TLC plate is comparable
to that of a well packed HPLC column. Samples can be separated after a
migration distance of only 3-6 cm. More than five compounds per minute
can be separated because of the higher resolution resulting from the
very low theoretical plate heights.
HP-TLC was carried out using four different solvent systems. In
all systems the plates used were 10 x 10 cm. glass plates pre-coated with
a 0.2 mm layer of silica gel 60 F-254 (E.M. Laboratories, Inc., Elmsford,
- New York). Solvent system I was n-Butano1: acetic acid: water (12:3:5).

.
,. !
~ .
i ,.
t. '
~. -
25
Solvent system II was Isopropanol: Ammonia: water (10:1:1). Solvent
system III was water saturated n-butanol. Solvent system IV was chloro-
form: methanol (9:1). The HP-TLC plates were kept in a desicator and
were activated at 100°C for 30 minutes just prior to use. The plates
were spotted with a microliter syringe and run to a solvent height of
3-5 cm. After running the plates were air dried and spots were located
under U.V. light (254 nm.).
Gas Liquid Chromatography
Silylation: Aliquots (0.5 - 1.0 m1) from each of the fractions of
extraction procedure I or 1 mg samples of authentic cytokinin standards
were placed in 1 ml reactivials, dried under a nitrogen stream and dis-
solved in 100 pI of N, O-bis-(trimethylsilyl) acetamide (BSA) (Klebe,
et.al., 1966). The vials were immediately capped and heated in an oven
at 70°C for 30 minutes.
One to ten p1 of each trimethylsilyl derivative was injected into
a F&M model 700 dual column gas chromatograph equipped with dual flame
ionization detectors and a temperature programmer. The columns were
matching stainle.ss steel column (3 mm x 150 cm) packed with 3% QF-l
on 60/80 mesh Chrom Q (Analabs). The GLC was operated under the fo1low-
ing conditions: Hydrogen flow 30 m1/min. for the sample column and 28
ml/min. for the reference column; air flow, 200 ml/min. for both columns;
nitrogen carrier gas flow 30 ml/min. in the sample column and 24 ml/min.
in the reference column; injector temperature, 200°C; and detector temp-
erature 275°C. Temperature programming started at 100°C and increased
linearly to 250°C at the rate of 4°C/min. (Shindy and Smith 1975).

i i
26
Retention time was recorded for each peak and compared to those of
TMS derivatives of authentic standards.
A second set of GLC runs was performed using the same standards
as above but in this case both the standards and the samples were spiked
with 0.1 ~l of chromatographic grade pyrene which had been silylated
as described above (Most et.al., 1968). Relative retention times were
determined from the chromatograms relative to the retention time of the
TMS pyrene.

RESULTS
Extraction Procedure I
Pumpkin Seed Cotyledon Bioassay
Extracts (extraction procedure I) from 32 tissue samples were
screened for cytokinin activity by the pumpkin seed cotyledon bioassay.
This bioassay is not as specific as others but is quite rapid and was
therefore used as a preliminary test to indicate which samples would
be analyzed in further detail. The results are presented in figures 5
and 6. In all cases cytokinin activity, as indicated by increased
i chlorophyll content, was highest in the Spring collected samples and
lowest in the Winter samples. The outstanding pattern seen was the large
increase in cytokinin activity in the Spring collected aerial shoots,
fifth growth segments and infected western hemlock tissue as compared
with healthy tissue. Extracts of the Summer and Fall material showed
only small amounts of activity compared with those from the Spring.
GLC analysis of the above extracts indicated that compounds having
the same retention times as cytokinin standards were present.
Based on the results of the foregoing observations, I decided to
carry out more detailed studies on Spring and Winter samples since these
represented the extremes of cytokinin activity.

t ..
:.'. ; i
!:
i,
" t,
l'
0.15 -
0.13
0.11
0.09 iD ....
0.07 ~ •.
t~ 0.05 ~ - I;~
.~
0.03
0.01
~ I ij! c·
I'~i !)"
:r.;. ~~ -
~ 'I~ ~ '~ - . ~:
m .~~ • 10;
~ ;I.i :U" ~ 122
1st GS 5th as ----HEAJ.,THy---
Sp
S,..
. . r,D
~ I ,.
S F
[ 'j
, "
ll. ~ I : S S i~ F
F \11 W ,
.
5th GS
------INFECTED ------
1st GS AS
28
I Control
Figure 7. Pumpkin seed cotyledon bioassays for cytokinins extracted from 10 g fresh Douglas-fir tissue or the dwarf mistletoe A. doug1asii. The results presented are averages from 5 replicates. AS = aerial shoots, GS D grwoth segment, Sp = Spring, S = Summer, F = Fall, W c Winter, Control c
untreated cotyledons.

i i I I. r ; i:'
i·:
t": , i .
b~
0.15 _
- r 0.13 _
-0.11 _
[1' -0.09 _
-0.07 _
-0.05 _
- s 0.03 _ , F'
F F VI
lJ VI - \'~
I 0.01 _
HEALTHY SWELLING AS CONTROL
Figure 8. Pumpkin seed cotyledon bioassays for cytokinins extracted from 10 g fresh western hemlock tissue or the dwarf mistletoe A. tsugense. The resut1s presented are averages from 5 replicates. AS = aerial shoots, GS = grwoth segment, Sp = Spring, S = Summer, F = Fall, W = Winter, Control = untreated cotyledon.
29

[ ... [,~ f
:.-
30
Extraction Procedure II
Amaranthus Bioassay
Samples from Spring and Winter of two different seasons (1976-
1977 and 1977-1978) were tested for cytokinin activity using the Amaran-
thus bioassay. The results are presented in Figures 9 through 17. These
graphs show average values from ten separate bioassays run for each
sample. Statistical analysis (paired t test) of the cytokinin activity
indicated by betacyanin production showed a significant difference in
cytokinin activity levels between healthy and infected Spring tissue
(significant at the 0.05 level) in all cases except for the first growth
segments. Since the cytokinin activity in the Winter samples appeared
to be near zero, no statistical analysis was performed.
Total cytokinin concentration, expressed as ~g BAP equivalents per
gram, fresh weight was calculated for all Spring samples and is presented
in Table IV. A second set of calculations for cytokinin concentration
was made using only the 0.5 to 1.0 Rf zones since these comprised the
areas to which the cytokinin standards ran. These results are also pre-
sented in Table IV.
The outstanding feature seen in these data is the large difference
in cytokinin activity and concentration between healthy and infected
material, with the exception of the first year growth segments. These
differences ranged from a high of about 2.0 ~g BAP equivalents per gram
gresh weight in aerial shoots and infected fifth growth segments to a
low of 0.15 ~g BAP equivalents per gram fresh weight in uninfected mater-
ia1 from fifth year growth segments. In all cases where differences were

4
CO')
o ... M o ('It .c .2
J
II
2iP 2iP 2iPA - 2jPA
z z ZR ZR
lAP 10-7 M 4
lAP 10-7 M -------------------------------- --------------------------------
o
CO')
o P-
M o C'4 .c .2
~ III(
o
Figure 9. Cytokinin activity in extracts of healthy (I) and infected (II) Douglas-fir first year growth segments, Spring 1977. Amaranthus test assay. Z = zeatin, ZR = zeatin riboside, 2iP = isopenteny1adenine, 2iPA = isopenteny1adenosine, BAP = benzy1adenine purine, A = absorbance, control = untreated cotyledons.
1.0
w .....

~'}~;~~·\;.,~C-:r7 :t·~;: ?f~i'-· .:' -' .. ":>:-0;: '. ,- :.:>_- _:" > .~~:. ~'.-:-~L~~-:~::-~~.:-:-~:-_ .. -.-':--:--:"~"';'-:::":-~:""~'''''--~'~-'7~-~~-~~"T""':''-:-:>-:'''--~~~.~:"\,,:--:-'''r:-:'-7'"':"''7,~ ~.~.,.~-~~~::~-:-:,:~.";:~!:r"'--:-~:-:-::-~~"~~::.,,.'.~~~":~'~~~~:·l"?:?~~~:~.:-~.::':·':<'i~·~~;';{~~~>~:~j~i~~"
4
C")
o ...
N 'It In
~
II
2iP
z 2iPA
ZR
2iP
z ~ ZR
4 BAP 10-7 M
BAP 10-7 M -------------------------------------~----------~--------------- C")
o ... >(
N 'It In
c:r:
-~------------CONrRm------------ -------------CONt~L------------
o 1.0 o 0:5
Rf
Figure 10. Cytokinin activity in extracts of healthy (I) and infected (II) Douglas-fir first year growth segments, Spring 1978. Amaranthus test assay. Z = zeatin, ZR = zeatin riboside, 2iP = isopenteny1adenine, 2iPA = isopenteny1adenosine, BAP benzy1adenine purine, A = absorbance, Control = untreated cotyledons.
1.0
I".) N

C')
0: ...
(If ~ In
c:s:
II
2iP
z 2iPA -
.ZR ZR
2iP
z 2jPA
BAP lO-7 M BAP lO-7 M --------------------------------
----------~--------------------- C')
o ... )( o N
~ 12
(If ~ .;
-------------COW~L------------ -------------CONr~L------------
o o 1.0 0.-5
Rf
Figure 11. Cytokinin activity in extracts of healthy (I) and infected (II) Douglas-fir fifth year growth segments, Spring 1977. Arnaranthus test assay. Z = zeatin, ZR = zeatin riboside, 2iP = isopentenyladenine, 2iPA = isopentenyladenosine, BAP = benzyladenine purine, A = absorbance, Control = untreated cotyledons.
1.0
w w

4
M· o ...
C"4 ~ I/)
<C
... ,:." . .. .!~
/I
2iP
Z 2iPA
ZR
2iP
Z :z.i.f8
ZR BAP lO-7 M 4
BAP lO-7M -------------------------------- --------------------------------M
o ... )(
C"4 ~ I/)
~
----------~-------------~------CONTROL
o 0:5 Rf
-1- - - - - - - - - - - - - CONTROL - - - - - - - - - - - -
o
Figure 12. Cytokinin activity in extracts of healthy (I) and infected (II) Douglas-fir fifth year growth segments, Spring 1978. Amaranthus test assay. Z = zeatin, ZR = zeatin riboside, 2iP = isopentenyladenine, 2iPA = isopentenyladenoside, BAP = benzy1adenine purine, A = absorbance, Control = untreated cotyledons.
1.0
VJ ~

~:l'f~iS;,'1t;"~:~":"}r~(i':'L\!':· '. ':<"h ''-'.:;."'] ,. "'''. ' ," . ",' .. :"", ......... ,'. . ,.' ., .. ,. .. . .... . ...... ;', "': .'.... ';:" .,< .' '"J. '.~. !, . J.. • .',:."''. "" '.,·X,:.,:'·"" C\Y ':!c. .·.,,:j&·,:<c";:-';'?'::?:!:'\?:"'T':'i~'!!':':'cytii;;@,,f'~;:r@l~i
4
C? O~ ... )( o C"4
.;, 12
C"4 lit 11)
<
II 2iP ~
2iP z ~ ZR
z ZR
BAP lO-7 M 4
BAP lO-7 M
----------~--------------------- ---~---------------------M
o ... )( o N
.£ 12
N lit .;
~------------------------------CONTROL
o
Figure 13.
1.0 o
Cytokinin activity in extracts of A. doug1asii aerial shoots. Amaranthus test assay. (I) = Spring 1977, (II) = Spring 1978, Z = zeatin, ZR = zeatin riboside, 2iP = isopenteny1adenine, 2iPA = isopenteny1adenosine, BAP = benzy1adenine purine, A = absorbance, Control = untreated cotyledons.
1.0
W I.n
_12\.tt:.'-i't:~~ .. :~~~:~-?~-::'·;::.~-':"~":""~- ~-. - - .. ""-:-_"--:-:,r_::~T_;-r_"~_:. __ ~_ -.-.------,.-,.-,,---.----~-... ~---------.,,---.-----------.-~----- ... --... ----:.-.~--.--?--,...-.----:-,-,--.-,-:~.--,,-~,~--~·-'7~..,,~'7K··,·,::":."-_ .. .-.-J;.:;:·\~;h'11~i;?!{:t!1t:~
CO)
O. ... ~
C"'I ~ In
~
II
2iP 2iP
z 2iPA - z ~
ZR ZR
SAP 10-7 M 4
SAP 10-7 M -------------------------------- --------------------------~-----CO)
o ... )( o C"4 -0 ~
12 C"(
~ In
~
-------------com~L------------
o 1.0
Figure 14. Cytokinin activity in extracts of healthy (I) and infected (II) western hemlock tissue, Spring 1977. Amaranthus test assay. Z = zeatin, ZR = zeatin riboside, 2iP = isopenteny1-adenine, 2iPA = isopenteny1adenosine, BAP = benzy1adenine purine, A = absorbance, Control = untreated cotyledons.
1.0
W 0\

4
M
o .... >< o C"C
< 12
~ <t
:;.: ~'-'~."":"7-:' -~-- .... -~--~-......... ~-~~-~-....... ~~--~::;--.~::T~·~::-:~·':'~"<-~:::::~·;r~~~!. :.~jf:·:~~:.:.~:~~:~~ .. 1
II
2iP 2iPA
2iP 2iPA
Z ZR
z ZR
BAP 10-7 M BAP 10-7 M ---------------------------------------------------------------- M
o ... >< o C"C -0
ct 12
C"C lilt &n
ct
-1- - - - - - - - - - - - - CONTROL - - - - - - - - .. - -- -------------com~L------------
o 0:5 Rf
1.0 o
Figure 15. Cytokinin activity in extracts of healthy (I) and infected (II) western hemlock tissue, Spring 1978. Amaranthus test assay. Z = zeatin, ZR = zeatin riboside, 2iP = isopenteny1-adenine, 2iPA = isopenteny1adenosine, BAP = benzy1adenine purine, A = absorbance, Control = untreated cotyledons.
1.0
W -....J

.f..s.':-PM. ~·:,".-t~·r. -;'. :":':::"),,:-~"':"~?"""'-'-'~-''''-:~:':-'''''':';-'~:-~-'~:' ::'.r::-: ••. ~,--.,......:~.:--:?:.,:-~-.~-~ .... ~ :--""""~--", -," ""'-:-,", .. _r-.,.-_ ...... _._ .. -~.,.....-:-.~::-;--:::.""': .. -7'", ..... --: ..... -.. "" .. -; ·~-:-.··:~"~:·,.--:-·-:-.-::::':.:",~ . ..,--'""·~~-......-;T~,.,~~-.. ~.-.•. ~,.'":"::.r-~ ....... :'~,...~.,.....--.~.r.-:!:., .. ~.-:-:;~.-::; .;.~.:~j::~.': : .. 1/:~:'?-!':.~Z~::-~:?.~.:,:!~\,}};?i~?~-..'.:;r,_"-r.K"
M
o ... )( o C"'C
.l 12
C"4 'It ."
<
II
2it' 2iP
Z ~ 2iPA
Z ZR ZR
BAP lO-7M 4
BAP lO-7M
------~------------------------- --------------------------------M o ... )( o C"'C .0
c:t 12
C"'C 'It ."
ct
------------~CONt~L------------ -------------cONTRm------------
o
Figure 16.
1.0 o
Cytokinin activity in extracts of ~. tsugense aerial shoots. Amaranthus test assay. (I) = Spring 1977, (II) = Spring 1978, Z = zeatin, ZR = zeatin riboside, 2iP = isopenteny1adenine, 2iPA = isopenteny1adenosine, BAP = benzy1adenine purine, A = absorbance, Control = untreated cotyledons.
1.0
w co

F'~\'!tr;:":::';y:~I~""~.';.~:'~"""':'T , ..... . ."'::--;:-;~- ;r;- --_:;---~_-----;-_._._~,
+ 2iP 2iPA
z ZR
4tu. . "'I-~. SAP 10·7M 4
II
z ZR
BAP 10·7 M
" '.: .'". ".,,,.y,,,.,,,,,,,,,,.-J \
2iP 2iPA -
-------------------------------- --------------------------------M o ... +
>< o N >0
~2o-t~ an
< ...
M
o ...
N ..r U'I
<
1-.------- .. ---... r -----r-COmROL ...... - - - - - - - - - .... -1- - .. - :- - - - - - - - - cONTROL - ... - _ .. - - - - - - -
.1
o • .1 ..t.
I I
, I
, 0.'5 Rf
, I .1 _I. I I • • 1.0 o
Figure 17. Cytokinin activity of typical winter samples of Douglas-fir (1) and western hemlock (II). Amaranthus test assay. Z = zeatin, ZR = zeatin riboside, 2iP = isopentenyladenine, 2iPA = isopentenyladenosine, BAP = benzyladenine purine, A = absorbance, Control ~ untreated cotyledons.
1.0
W \0

TABLE IV
CYTOKININ CONCENTRATION FROM AMARANTHUS BIOASSAY
Sample
DFSp 1H DFSp 11 DFSp 1H DFSp 11 DFSp 5H DFSp 51 DFSp 5H DFSp 51 DFSp AS DFSp AS WHSp H WHSp I WHSp H WHSp I WHSp AS WHSp AS
1977 1977 1978 1978 1977 1977 1978 1978 1977 1978 1977 1977 1978 1978 1977 1978
~g BAP eq./g fresh wt.
Rf Zones n.5-1.0
0.88 0.91 0.62 0.55 0.12 1.23 0.09 1.87 1.69 1. 78 0.87 1. 78 0.49 1.35 2.32 2.22
Rf Zones 0.1-1.0
0.90 0.99 0.88 0.75 0.26 1.39 0.15 2.04 2.10 2.01 1.12 2.02 0.73 1.69 2.58 2.46
40

41
significant, the ~g BAP equivalents per gram fresh weight for infected
material were at least twice that of the corresponding healthy material.
It should be noted that the use of the authentic cytokinin markers
in this test is of limited accuracy in determining the actual cytokinin
components in the extracts. They were used only to indicate the general
Rf range to which authentic standards run. Further analyses to deter-
mine the cytokinins present in the samples was thus deemed appropriate
and these results are presented in the following sections.
Preparative Thin Layer Chromatography
Preparative TLC was performed as described in the methods section.
The Rf zones corresponding to cytokinin standards were scraped from the
plates and extracted in 80% ethanol.
High Performance Thin Layer Chromatography
A1iquots (0.50 ~1) of the ethano1ic extracts from the preparative
TLC were applied as spots to HP-TLC plates and were run in solvent system
I (BAW). BAW is effective in separating authentic samples of zeatin and
zeatin riboside but standards of 2iP and 2iPA show poor separation. The
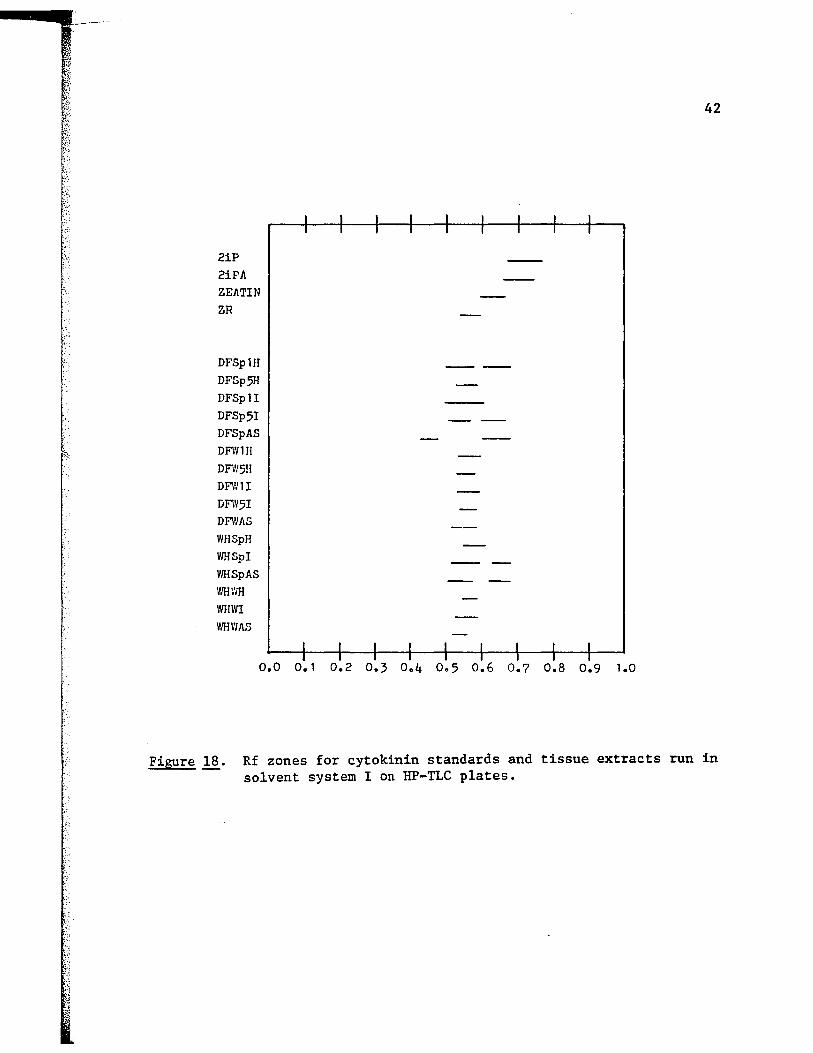
results are presented in Fig. 18 and Table V.
Eleven of the samples showed only a single spot which co-chroma-
tographed with zeatin riboside. Four (DFSp1H, DFSpSI, WHSPI and WHSpAS)
showed two spots. The first co-chromatographed with zeatin riboside and
the second overlapped more than one Rf zone. The sample from the aerial
shoots of !. doug1asii also showed two spots but the first spot did not
correspond to the Rf zone of any of the standards used and the second
overlapped the zones of zeatin, ZiP and 2iPA.
--_.-----
2iP
2iPA
ZEATIN
ZR
DFSplII
DFSp5H
DFSplI
DFSp51
DFSpAS
DFWllI
DFW511
DFi'/lI
DFiV5I
DFWAS
WHSpH
WHSpI
WHSpAS
I'lli\'m
WHWI VlliWAS
----
0.0 0.1 0.2 0.3 0.4 0.5 0.6 0.7 0.8 0.9 1.0
42
Figure 18. Rf zones for cytokinin standards and tissue extracts run in solvent system I on HP-TLC plates.

[ I I r t
TABLE V
Rf values for samples run in solvent system I
Sample
2iP
2iPA
Zeatin
Zeatin riboside
DFSp IH
DFSp 5H
DFSp 11
DFSp 51
DFSp AS
DFW IH
DFW 5H
DFW 11
DFW 51
DFW AS
WHSp H
w"HSp I
WHSp AS
WHW H
WHW I
WHW AS
Rf Zones
(0.67 - 0.77)
(0.66 - 0.74)
(0.60 - 0.66)
(0.54 - 0.60)
(0.51 - 0.58)
(0.53 - 0.58)
(0.51 - 0.61)
(0.52 - 0.57)
(0.43 - 0.47)
(0.54 - 0.61)
(0.53 - 0.58)
(0.53 - 0.60)
(0.54 - 0.58)
(0.52 - 0.59)
(0.55 - 0.61)
(0.52 - 0.60)
(0.51 - 0.58)
(0.54 - 0.59)
(0.53 - 0.59)
(0.52 - 0.56
(0.61 - 0.68)
(0.60 - 0.67)
(0.61 - 0.68)
(0.63 - 0.67)
(0.62 - 0.68)
43

44
The same samples were run in solvent system II (LAW). This system
separates zeatin and zeatin riboside in the reverse order as compared to
(.; system I but still gives poor separation between 2iP and 2iPA. The re-
su1ts are presented in Fig. 19 and Table VI.
Again, eleven samples showed a single spot that co-chromatographed
with zeatin riboside. The same four samples as in system I showed two
spots. The first co-chromatographed with zeatin riboside and the second
overlapped more than one Rf zone. The DFSpAS sample showed two spots,
the first did not correspond to any of the standards used and the second
overlapped several Rf zones.
The above extracts and standards were subjected to HP-TLC in sol-
vent system III (BW) a system which provides good separation of 2iP and
2iPA with some overlaps of the Rf zones of zeatin and zeatin riboside.
The results are presented in Fig. 20 and Table VII.
Twelve of the samples showed a single spot that overlapped the Rf
zones of zeatin and zeatin riboside. Three (DFSpSI, WHSpI and WHSpAS)
samples revealed two spots. The first overlapped with zeatin and zeatin
riboside while the second spot from the DFSpSI and the WHSpI co-chromato-
graphed with 2iPA and the second spot from the WHSpAS overlapped the zones
of zeatin riboside and 2iPA.
One sample (DFSpAS) revealed three spots. The first had an Rf zone
that did not correspond with the Rf zone of the standards. The second
overlapped the zones of zeatin and zeatin riboside while the third co-
i.:" chromatographed with 2iPA.
In a fourth HP-TLC analysis the trimethy1 si1y1 derivatives of the
standards and the extracts were run in solvent system IV (eM). This

;'. i," .
. ;,
2iP 2iF'A
ZEATIN ZR
DF.splH
DFSp5H
DFSpl1
DFSp51
DFSpJ\.')
DFW1H
DFW5H
DF1VlI
DF\'151
DFWAS
WHSpH
\'mSpI
WHSpA.s
VIHWH
VlHI'll
WlII'iA'::;
45
0.0 0.1 0.2 0.3 o.~ 0.5 0.6 0.7 0.8 0.9 1.0
Figure 19. Rf zones for cytokinin standards and tissue extracts run in solvent system II on HP-TLC plates.

46
TABLE VI
Rf values for samples run in solvent system II
Sample Rf Zones f' ..
2iP (0.59 - 0.65)
2iPA (0.58 - 0.69)
Zeatin (0.49 - 0.53)
Zeatin riboside (0.53 - 0.59)
DFSp lH (0.49 - 0.52) (0.54 - 0.58)
DFSp 5H (0.54 - 0.57)
DFSp 11 (0.52 - 0.58)
DFSp 51 (0.46 - 0.52) (0.54 - 0.60)
DFSp AS (0.42 - 0.50) (0.58 - 0.65)
DFW lH (0.52 - 0.57)
DFW 5H (0.52 - 0.58)
DFW II (0.53 - 0.57)
f DFW 51 (0.53 - 0.58) , .
DFW AS (0.52 - 0.59)
WHSp H (0.54 - 0.60)
WHSp I (0.53 - 0.57) (0.63 - 0.68)
WHSp AS (0.48 - 0.51) (0.54 - 0.65)
ia."HW H (0.53 - 0.57)
WHW I (0.54 - 0.58)
WHW AS (0.54 - 0.68)

:.;
.~ .. ;,','
'.-. .,. :,--:
2iP 2iPA ZEATI ZR
DFSpll1 DFSp51 DFSpl1 DFSp51 DFSpAS DFWlll o F'W 5H DFWll
DF\'151 DFWAS WHSpH WHSpl WHSpAS
WHWH WHWl WHVlIW
-----
0.0 0.1 0.2 0.3 0.4 D.' O.~ 0.7 0.8 0.9 1.0
Figure 20. Rf zones for cytokinin standards and tissue extracts run in solvent system IlIon HP-TLC plates.
47

48
",: ~:.~
~:. '". ~
TABLE VII
Rf values for samples run in solvent system III
Sample Rf Zones
2iP (0.68 - 0.75)
2iPA (0.54 - 0.66)
Zeatin (0.41 - 0.50)
Zeatin riboside (0.48 - 0.54)
DFSp 1H (0.44 - 0.55)
DFSp 5H (0.49 - 0.55)
DFSp 11 (0.48 - 0.55)
DFSp 51 (0.44 - 0.53) (0.60 - 0.66)
DFSp AS (0.22 - 0.29) (0.43 - 0.51) (0.57 - 0.65)
DFW 1H (0.47 - 0.52)
DFW 5H (0.49 - 0.54)
DFW 11 (0.50 - 0.54)
DFW 51 (0.48 - 0.53)
DFW AS (0.46 - 0.51)
WHSp H (0.46 - 0.52)
WHSp I (0.45 - 0.53) (0.57 - 0.67)
WHW AS (0.42 - 0.51) (0.51 - 0.60)
WHW H (0.46 - 0.52)
WHW I (0.49 - 0.53)
WHW AS (0.45 - 0.51)

49
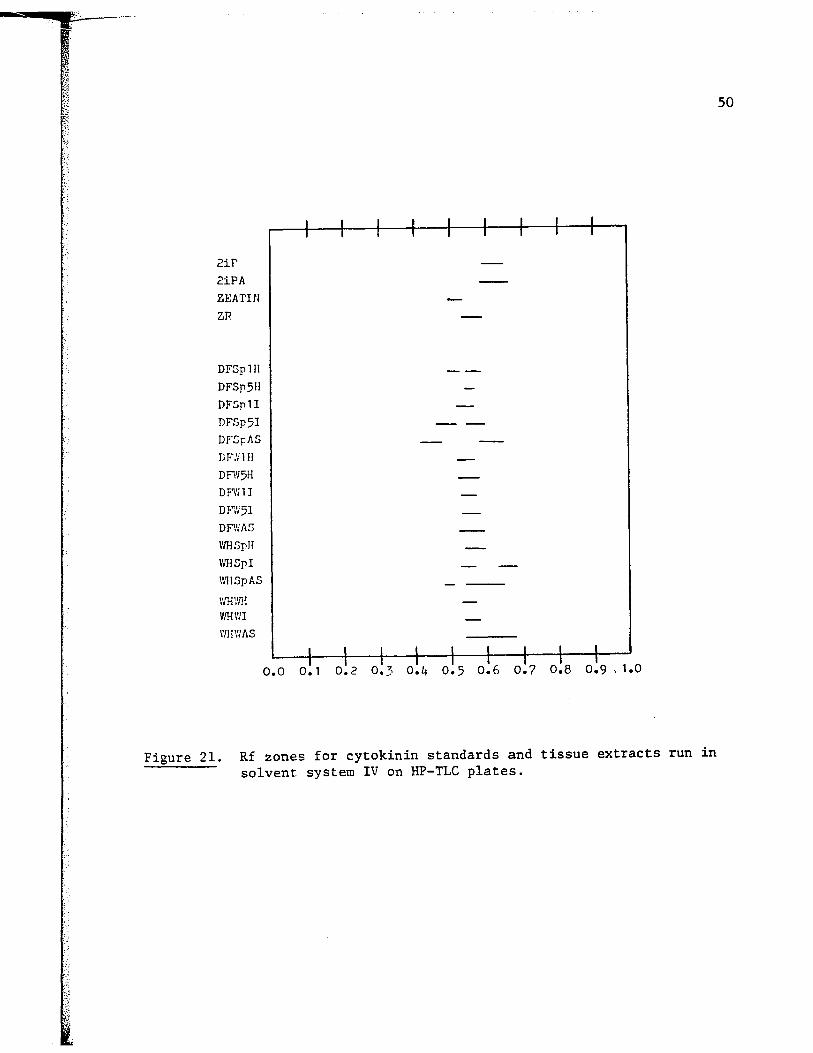
system proved to be advantageous in that the THS derivatives of the ribo-
sides were separated from the corresponding non-rib os ides by a greater
margin. The results are presented in Fig. 21 and Table VIII.
Eleven of the samples showed a single spot which overlapped with ~ ..
zeatin riboside and 2iPA. Five samples (DFSplH, DFSp5I, DFSpAS, waSpI,
and }mSpAS) revealed two spots. The first overlapped the Rf zones of
zeatin and 2iP and the second overlapped the zones of zeatin riboside
and 2iPA.
Gas-Liquid Chromatography
The TMS derivatives of the Spring and Winter samples (1976-1977
and 1977-1978) were subjected to GLe. All of the standards and all of
the tissue samples were spiked with pyrene as an internal standard from
which relative retention times were determined. The results are pre-
sented in Tables IX and X.
The extracts of Winter samples of both the hosts and the dwarf
mistletoes consistently revealed only a single small peak with a rela-
tive retention time corresponding to that of zeatin riboside. A number
of other peaks were recorded but these did not correspond to any of the
known standards.
Both the infected and uninfected Spring samples from Douglas-fir
and western hemlock showed from three to seven peaks but only those that
relative retention times the same as the standards will be dealt with.
The uninfected Spring collected first growth segments from Douglas-fir
had two peaks that had the same relative retention time as zeatin and
zeatin riboside. Uninfected fifth growth segments from the aforemen-
2ir 2iPA
ZEATlfl
ZR
DFSpllI
DFSP511
DF,spl1
DFSP51
DF,spAS DF",'ill!
DFW511
DF\'i1 J
DV.'i 51
DFWJ\S WH!JpH
WHSpI
I'IIl.spAS
V/H\'lI
\'!Il\'IAS
0.0 0.1 0.2 0.3 0.4 0.5 0.6 0.7 0.8 0.9,1.0
Figure 21. Rf zones for cytokinin standards and tissue extracts run in solvent system IV on HP-TLC plates.
50

TABLE VIII
Rf values for samples run in solvent system IV
Sample
2iP
2iPA
Zeatin
Zeatin riboside
DFSp 1H
DFSp 5H
DFSp 11
DFSp 51
DFSp AS
DFW lH
DFW 5H
DFW 1I
DFW 51
DFW AS
WHSp H
WHSp I
WHW H
WHW I
WHW AS
Rf Zones
(0.35 - 0.45)
(0.85 - 0.93)
(0.38 - 0.47)
(0.87 - 0.94)
(0.38 - 0.46
(0.88 - 0.91)
(0.85 - 0.91)
(0.39 - 0.52)
(0.38 - 0.45)
(0.88 - 0.94)
(0.86 - 0.92)
(0.87 - 0.93)
(0.89 - 0.96)
(0.84 - 0.92)
(0.86 - 0.94)
(0.34 - 0.52)
(0.87 - 0.92)
(0.86 - 0.93)
(0.85 - 0.91
(0.88 - 0.91)
(0.86 - 0.95)
(0.88 - 0.93)
(0.84 - 0.95)
51

52
tioned host had only a single peak which had the same relative retention
time as zeatin riboside.
The first growth segment from the infected Spring Douglas-fir also,
showed only a single identifiable peak that had the same relative re
tention time as zeatin riboside. The fifth growth segment from this same
host showed three identifiable peaks which had relative retention times
that corresponded with zeatin, zeatin riboside and 2iPA. The aerial
shoots from the Spring !. doug1assi showed only two identifiable peaks
and these had relative retention times the same as zeatin and 2iPA.
Uninfected tissue from Spring collected western hemlock had a
single identifiable peak which had the same relative retention time as
zeatin riboside. The infected samples of Spring collected western hem
lock had three identifiable peaks that had the same relative retention
times as zeatin, zeatin riboside and 2iPA. Similar results were ob
tained from the extracts of the aerial shoots of A. tsugense.
TABLE IX
Relative Retention Times for Cytokinin Standards
Standard
Pyrene
2iP
Zeatin
2iPA
Zeatin Riboside
Relative Retention Time
1.00
1.25
1.51
1.62
1.80

~'.
Sample
DFSp 1H
DFSp 5H
DFSp 11
DFSp 51
DFSp AS
DFW 1H
DFW 5H
DFW 11
DFW 51
DFW AS
wasp H
wasp I
wasp AS
WHW H
WHW I
WHW AS
TABLE X
GLC Analysis of Extractions from Procedure II
2iP 2iPA
+ (1.61)*
+ (1. 60)*
+ (1.61)*
+ (1.63)*
Zeatin
+ (1.49)*
+ (1.49)*
+ (1.52)*
+ (1.50)*
+ (1.51)*
*Va1ues in parentheses indicate relative retention time.
Zeatin Riboside
+ (1.81)*
+ (1.81)*
+ (1.82)*
+ (1.80)*
+ (1. 78)*
+ (1.82)*
+ (1.80)*
+ (1.81)*
+ (1.83)*
+ (1.81)*
+ (1.80)*
+ (1.80)*
+ (1. 78)*
+ (1.81)*
+ (1.81)*
53
54 '.~
Quantification of the cytokinin components of Spring samples was
carried out by the internal standard method. The results are presented
in Table XI. The accuracy of these values is questionable because of
the difficulties encountered in determining peak areas. Most of these
difficulties arose from the long temperature program employed, which
tends to broaden peak widths and make accurate determination of the
baseline impossible. A number of peaks also overlapped unidentifiable
peaks.
Although these results indicate the same pattern of cytokinin con-
centrations as Amaranthus bioassay, direct comparisons cannot be made.
The cytokinin concentrations shown from the Amaranthus test are ~g equiva-
1ents of the synthetic standard BAP and the actual concentrations of
naturally occurringcytokinins will vary with their biological activity.
Thomas (1975) has indicated that the sensitivity of the Amaranthus
test is on the order of 1.5 to 20 times greater than that of GLC, depend-
ing on the particular cytokinin tested.

55
TABLE XI
Cytokinin Concentration of Spring Samples
as Determined by GLC
CONCENTRATION (~g/g fresh wt.)
Sample 2iP Zeatin 2iPA Zeatin Riboside TOTAL
DFSp 1H 0.15 0.15
DFSp 5H 0.23 0.11 0.34
DFSp 11 0.14 0.14
DFSp 51 0.82 0.16 0.35 1.33
DFSp AS 1.31 0.55 1.90
WHSp H 0.53 0.53
WHSp I 0.86 0.12 0.23 1.21
WHSp AS 1.39 0.26 0.33 1.98

DISCUSSION AND CONCLUSIONS
Seasonal Fluctuation
The results presented indicate that there is a seasonal f1uctua-
tion in cytokinins present in both dwarf mistletoes and their hosts.
My data show a marked increase in cytokinin activity during the period
just prior to bud break in the Spring with a sharp drop off in acti-
vity after this season. The pumpkin seed cotyledon bioassay and the
Amaranthus bioassay are both consistent in demonstrating this fact.
These results are in agreement with those reported by A1vim et. a1.
(1976) for studies conducted on seasonal variation of cytokinins in Salix
vimina1is. They also are in agreement with the results of Hewett and
Wareing (1973) concerning cytokinin activity in the buds and woody sap
of Populus x robusta during chilling and bud break.
Some seasonal variation in the makeup of the cytokinins is also
shown to occur. This variation in cytokinin content is much greater in
the infected tissue and the aerial shoots of the dwarf mistletoes than
in the uninfected tissue. Both the HP-TLC and the GLC analyses indicate
that the major cytokinin component of both infected and uninfected tissue
is zeatin riboside. This cytokinin is present in most of the samples
on a year-round basis. The only exception being the Spring aerial shoots
of A. doug1asii. The other cytokinins examined (zeatin and 2iPA) are
found during the Spring but were not detectable in the other seasons.
The use of larger tissue samples might show these substances to be pre-
sent but in reduced amounts.

57
Infected vs. Uninfected Material
The foregoing results show that there is a large difference in
cytokinin activity between infected and uninfected host tissue in both
Douglas-fir and western hemlock during the Spring just prior to bud
break. In Douglas-fir, the outstanding difference is between the fifth
growth segment samples where there is both a difference in activity as
determined by bioassay and in the cytokinins detected. The bioassays
show that cytokinin activity in the infected fifth growth segments is
more than twice that found in the corresponding uninfected material.
Also, both HP-TLC and GLC analysis show only a single cytokinin (zeatin
riboside) to be present in the uninfected material whereas, there are
three detectable cytokinins in the infected material (2iPA, zeatin and
zeatin riboside).
The first growth segment samples of Spring Douglas-fir are interest
ing in that there is no significant difference in cytokinin activity be
tween healthy and infected materials. However, the healthy material con
tained two cytokinins (zeatin and zeatin riboside) whereas only zeatin
riboside was detectable in the infected material.
The western hemlock tissues tested showed similar results to those
found in the Douglas-fir systems. The infected tissue, taken from the
areas of swelling, showed greater cytokinin activity than the corres
ponding uninfected tissue. The cytokinin identified by GLC and HP-TLC
in the infected tissue were the same as those found in the fifth growth
segments from Douglas-fir. Zeatin riboside was the only identifiable
cytokinin from the uninfected tissues. First year growth segments from
58
western hemlock were not tested so no comparison can be made.
It is of interest to note that zeatin riboside was found to be
present in all of the tissue samples, with the exception of the Spring
aerial shoots of A. doug1asii. This is somewhat puzzling and cannot be
explained at this time. However, it should also be noted that the HP
TLC analysis of this tissue showed a spot in solvent. systems I, II and
III that had Rf values always somewhat lower than the standards used.
It is possible that this spot represents one of the cytokinin glycosides
which have recently been reported as occurring naturally in a number of
plants (VanStaden 1976; Van Staden 1977; Davey and VanStaden 1977; Di
ma1la et. ale 1977).
It should also be noted that 2iPA was found only in the aerial
shoots of dwarf mistletoes or in the infected host material. This
suggests that 2iPA is produced only by the dwarf mistletoe but this can
not be proven without separation and "in vitro" culture of the parasite
including the endophytic system. The possibility remains that this sub
stance is produced by the host in response to the parasite and is trans
located to the aerial shoots via the endophytic system.
As determined by the Amaranthus bioassay and GLC, the aerial shoots
of A. doug1asii had 5 to 10 times the concentration of cytokinins than
the healthy fifth growth segments. A. tsugense aerial shoots had 2 to
3.5 times as much cytokinin as the healthy material.
Two cytokinins, zeatin and 2iPA, were identified by HP-TLC and GLC
as being present in the aerial shoots of A. doug1asii. Both of these
cytokinins were also present in the infected host tissue along with zea
tin riboside which could not be found in the aerial shoots. Uninfected

59
tissue from Douglas-fir contained zeatin and zeatin riboside.
The Spring aerial shoots of A.tsugense contained three cytokinins:
zeatin, zeatin riboside and 2iPA. All three of these cytokinins were
present in the infected tissue whereas, only zeatin riboside was identifed
from the uninfected tissue.
Analysis of Winter aerial shoots from both species showed only zea-
tin riboside to be present during this season.
The foregoing provides several possible clues concerning the host-
parasite physiological relationship. Hull and Leonard (1964a and 1964b)
and Greenham and Leonard (1965) showed dwarf mistletoes to be dependent
upon their hosts for their nutritional needs. Their work, using labeled
carbohydrates and amino acids, indicated that both the endophytic system
and the aerial shoots of dwarf mistletoes are capable of accumulating
large amounts of both carbohydrates and amino acids from their hosts thus,
creating a source sink relationship with the host being the source and the
dwarf mistletoe acting as the sink. Since cytokinins are potent inducers
of nutrient mobilization (Mothes and Engelbrecht 1961; Sequira 1973) in-
creased cytokinin content in dwarf mistletoes may act as a mechanism for
the translocation of host metabolites to the sites of infection. A num-
ber of other workers have shown increased cytokinin activity in tissues
of obligate fungal parasites and their infected host tissue (Kiraly et.
a1 1967; Kirhuizen and Staples 1968; Thimann and Sachs 1966).
Localized infections of Arceuthobium, such as A. tsugense on
western hemlock, are characterized by a fusiform swelling which usually
indicates the extent of the endophytic system (Scharpf 1962). Such swe11-
ings result from stinu1ated cambial activity in the infected region of

60
the host stem. Because of the well known effects of cytokinins on cell
division, the increased cytokinin activity observed in infected western
hemlock stem tissue could account for the swellings observed in infected
tissue. Studies on organisms capable of causing tumors, galls and other
manifestations of disorganized growth in a wide variety of plant species,
have demonstrated there is indeed, increased cytokinin activity associa-
ted with a wide variety of these pathogens (Phillips and Torrey 1970;
Phillips and Torrey 1972; Upper et. a1. 1970; Sequeira 1973; Syono and
Torrey 1976; Peterson and Miller 1976; Edwards and LaMotte 1975; La10we
et. al. 1977; Teg1ey et. a1. 1971; Henson and Wheeler 1977). In a number
of cases, where the pathogens could be isolated and grown in culture, it
was shown that the organisms themselves had the ability to produce cyto-
kinins and excrete them into the culture media (Barthe and Bu1ard 1974;
Teg1ey et. a1. 1971; Miller 1975; Burrows 1976). In the case of ob1i-
gate parasites, such as dwarf mistletoes, it is obvious that the deter-
mination of a possible role of cytokinins is considerably more comp1i-
cated because the parasite cannot be grown separately from the host.
Perhaps, the most difficult topic to address is that of the altered
growth pattern (formation of "witches' brooms") that is observed in dwarf
mistletoe infected hosts. Cytokinins have been implicated in this pro-
cess in other species where "brooming" is observed in response to patho-
gens (Hill 1973; Barthe and Bu1ard 1974). Barthe and Bu1ard (1974) were
able to culture the fungus Taphrina cerasi, which causes "witches brooms"
in a number of hosts, in liquid media and demonstrated the presence of
zeatin in the culture media.

61
In this study, I have demonstrated that increased cytokinin acti
vity occurs in the Spring just prior to bud break. Also, as pointed
out previously, there are differences in the cytokinin makeup between
infected and uninfected hosts and the aerial shoots. The patter of Spring
increases holds for all of the material tested and is not unexpected
since it is during this time period when most cell division takes place
in the newly developing buds and most growth patterns are determined.
In western hemlock the increased cytokinin activity in the area of the
infection could account for the "broom" formation by releasing the
lateral buds from apical control and thus allowing a greater number of
lateral branches to grow in this region.
In Douglas-fir the situation is undoubtedly more complicated be
cause of the systemic nature of the infection. The decreased levels of
activity and the lack of zeatin in the first growth segment, which in
cludes the terminal bud, are somewhat puzzling and seemingly fail to
explain the earlier than normal bud break seen in infected trees. How
ever, it can be pointed out that it is difficult to make direct compari
sons between the infected and the uninfected material since the terminal
bud size and the number of lateral buds is different. It must also be
remembered that although there is greater cytokinin activity in the un
infected first growth segment, the timing of this upswing in the acti
vity is critical in establishing growth patterns and the increase in
cytokinin activity in the infected material is three weeks prior to
that in the uninfected sample.
This earlier than normal bud break could be advantageous to the
parasite since it might allow access to stored nutrients at a time when

"-:'
they are still unavailable to the healthy tissues. Tromp (1970) has
suggested that endogenous cytckinins may have a role in mobilizing
62
stored proteins. Finally, and perhaps most importantly, the role of other
growth regulators, especially the gibberellins and abscisic acid which are
important factors in controlling dormancy, must be evaluated before any
final conclusions can be made.
The finding of increased cytokinin activity and chemical species
in the fifth growth segment of infected Douglas-fir lends some support to
cytokinin involvement in "broom" formation in that this increased acti
vity proximal to the terminal bud could account for the release of lateral
buds from apical suppression due to the basipetal transport of auxins.
(Since this study looked at only the first and fifth growth segments of
the terminal branches, it is difficult to say this for certain). Exo
genously applied cytokinins are capable of releasing lateral buds from
apical control (Thimann and Sachs 1966; Steward and Krikorian 1971) and
in other diseases where alteral bud release is observed, increased cy
tokinin activity has been noted (Thimann and Sachs 1966; Barthe and Bulard
1974).
The increased cytokinin activity found in the aerial shoots of the
dwarf mistletoes probably is not important in the formation of "witches'
brooms" since it is highly unlikely that they are transported to the
lateral buds of the host. It is generally accepted that most cytokinins
are synthesized in the roots and moved through the xylem to specific
sites (Steward and Krikorian 1971; Leopold and Kriedmann 1975) although,
more recent evidence indicates that some cytokinins may be synthesized

63
in actively growing buds (Tucker 1977). Neither of these hypotheses would
l~ad to the conclusim that increased cytokinin activity in the aerial
shoots could influence the release of lateral buds.
Since this study looked at only the first and fifth growth segments
of the terminal branches, it is difficult to state an exact mechanism of
"broom" formation. In my opinion it is necessary to conduct further
studies which would look at cytokinin activity and content proximal to
the infection site where there are greater numbers of lateral branches
released from apical control.
Because the major symptom of "witches' broom" formation seems to be
the abnormal outgrowth of lateral buds and the inception of cell division
in previously non-dividing cells, it is logical to assume some involvement
of cytokinins since these phenomina are two of the major responses elici
ted by these hormones. However, as emphasized in the introduction, it is
important to keep in mind that in situations where complex developmental
processes are taking place it is dangerous to assume any single factor
as the sole agent responsible. In intact plant systems plant growth regu
lators rarely, if ever, function alone. There are many antagonistic and
synergistic reactions already identified among the already discovered
plant hormones and the list is expanding rapidly as more of these sub
stances are discovered. Although there is clearly a relationship between
cytokinin levels and dwarf mistletoe infection, their role remains un
discovered. Further studies are needed to elucidate the temporal inter
action of cytokinins with other hormones and to determine their source,
site, and mode of action, before any real understanding is possible of
64
the complex metabolic events which control early bud break, broom forma
tion, delayed senescence and the establishment of nutrient sinks.

~ .. '
:', --
65
REFERENCES
Alvim, R., E.W. Hewett and P.F. Saunders. 1976. Seasonal variation in the hormone content of willow. I. Changes in abscisic acid content and cytokinin activity in the xylem sap. Plant Physiol. 57: 474-476.
Barthe, P. and C. Bulard. 1974. Identification drune cytokinine par chromatographie en phase gazeuse a partir de 'cultrues pures de taphrina cerasi. Can. J. Bot. 52: 1515-1518.
Biddington, N.L. and T.H. Thomas. 1973. A modified Amaranthus betacyanin bioassay for the rapid determination of cytokinins in plant extracts. Planta 111: 183-186.
Bidwell, R.G.S. 1974. Plant Physiology. p. 548. Ma~mi1lan Publishing Co., Inc. New York.
Burrows, W.J. 1976. Mode of action of N,N-Diphenylurea: The isolation and identification of the cytokinins in the transfer RNA from tobacco callu~; grown in the presence of N ,JHHphenylurea. Planta ~30: 313-316 •.
Carlson, W.C. and M.M. Larson. 1977. Changes in auxin and cytokinin activity in roots of red oak, Quercus rubra, seedlings during lateral root formation. Physiol. Plant. 41: 162-166.
Challice, J.S. 1977. Inhibition by phenolic compounds of cytokininstimulated betacyanin synthesis in Amaranthus ~audatus. Biologia Plantarum 19: 212-218.
Childs, T.W. and K. Shea. Northwest Forests.
1967. Annual losses from disease in Pacific USDA Forest Service Bulletin Pffiv-20. 19p.
Daly, J.M. and H.W. Knoche. 1976. Hormonal involvement in metabolism of host-parasite interactions. Pp. 117-133 in J. Friend and n.R. Threlfall, eds., Biochemical Aspects of Plant-Parasite Relationships. Academic Press, San Francisco.
Davey, J.E. and J. VanStaden. 1977. A cytokinin complex in the developing fruits of Lupinus albus. Physiol. Plant. 39: 221-224.
Dima11a, G.G., J. VanStaden and A.R. Smith. 1977. A comparison of the endogenous hormone levels in stolons and sprouts of the potato Solanum tuberosum. Physiol. Plant. 41: 167-171.

66
Edwards, W.J. and C.E. LaMotte. 1975. Evidence for cytokinins in bacterial leaf nodules of Psychotria punctata (Rubiaceae). Plant Physiol. 56: 425-428.
Fletcher, R.A. and D. McCullagh. 1971. formation in cucumber cotyledons.
Cytokinin-induced chlorophyll P1anta 101: 88-90.
Graham, D.P. 1961. Dwarf mistletoe of Douglas-fir. USDA Forest Service Pest Leaflet 54. 4p.
Greenham, C.O. and D.A. Leonard. 1965. The amino acids of some mistletoes and their hosts. Amer. J. Bot. 52: 41-47.
Haglund, S.A. and O.J. Dooling. 1972. Observations on the impact of dwarf mistletoe on Douglas-fir in western Montana. USDA Forest Service Northern Region, Insect and Disease Report No. D-72-1. 6p.
Hawksworth, F.G. and D. Wiens. 1972. Biology and classification of dwarf mistletoes (Arceuthobium). 1972. USDA Forest Service Agricultural Handbook No. 401. 234 p.
Henson, I.E. and C.T. Wheeler. 1977. Hormones in plants bearing nitrogen fixing root nodules: Distribution and seasonal changes in level of cytokinins in Alnus glutinosa (L.) Gaertn. J. Expt. Bot. 28: 205-214.
Hewett, E.W. and P.F. Wareing. 1973. Cytokinins in Populus X robusta: Changes during chilling and bud burst. Physio1. Plant. 28: 393-399.
Hill, T.A. 1973. Endogenous Plant Growth Substances. Edward Arnold Limited, London.
Hull,
Hull,
R.J. and D.A. Leonard. 1964a. Physiological aspects sitism in mistletoes (Arceuthobium and Phoradendron). carbohydrate nutrition of mistletoe. Plant Physio1. 1007.
R.J. and D.A. Leonard. 1964b. Physiological aspects sitism in mistletoes (Arceuthobium and Phoradendron). carbohydrate nutrition of mistletoe. Plant Physio1. 1017.
of paraI. The
39: 996-
of paraII. The
39: 1008-
Kiraly, Z., M. E1 Hammady and B.I. Pozsar. 1967. Increased cytokinin activity of rust (Uromyces phaseo1i) - infected bean (Phaseo1us vulgaris) and broad bean (Vicia faha) leaves. Phytopathology 57: 93-94. --

67
Kirhuizen, H.M. and R.C. Staples. 1968. Mobilization factors in uredospores and be~, leaves infected with bean rust fungus. Contrib. Boyce Thompson lnst. 24: 39-52.
Klebe, J.F., H. Finkbeiner, and D.M. White. 1966. Silylations with bis (trimethylsilyl) acetamide, a highly reactive silyl-donor. J. Amer. Chem., 88: 3390-3395.
Kuijt, J. 1960. Morphological aspects of parasitism in dwarf mistletoes (arceuthobium). Univ. of Calif. Pub. in Bot. 30: 337-436.
La1oue, M., C. Terrine and J. Guern. 1977. Cytokinins: Metabolism and biological activity of N6-(2-isopentenyl)adenine in tobaco cells and callus. Plant Physiol. 59: 478-483.
Leonard, O.A. and R.J. Hull. 1965. Translocation relationships in and between mistletoes and their hosts. Hilgardia 37: 115-153.
Leopold, C.A. and P.E. Kriedmann. 1975. Plant ~rowth and Development. McGraw-Hill Book Company. San Francisco.
Letham, D.J., J.S. Shannon and l.R. McDonald. zeatin, a factor inducing cell division.
1964. The structure of Proc. Chem. Soc., 230-231-.
Lightle, P.C. and M.J. Weiss. 1974. USDA Forest Service Pest Leaflet. 19. 8p.
Miller, C.O., F. Skoog, C.S. Okumura, M.H. von Saltza and F.M. Strong. 1955. Structure and synthesis of kinetin. J. Am. Chem. Soc., 77: 2662-2663.
Miller, C.O. 1975. Revised methods for purification of ribosyl-trans zeatin from Vinca ~ L. crown gall tumour tissue. Plant Physiol. 55: 448-449.
Miller, J.R. and R.D. Tocher. 1975. Photosynthesis and respiration of Arceuthobium tsugense (loranthaceae). Amer. J. Bot. 62: 765-769.
Most, B.J., J.C. Williams and K.J. Parker. 1968. Gas chromatography of cytokinins. J. Chromatog. 38: 130-138.
Mothes, K. and L. Engelbrecht. 1961. in excised leaves in the dark.
Kinetin induced directed transport Phytochemistry 1: 58-62.
Peterson, J.B. and C.O. Miller. 1976. Cytokinins in Vinca rosa L. crown gall tumour tissue as influenced by compounds containing reduced nitrogen. Plant Physiol. 57: 393-399.
Phillips, D.A. and J.G. Torrey. japonicum. Physiol. Plant.
1970. 23:
Cytokinin production by Rhizobium 1075-1083.

68
Phillips, D.A. and J.G. Torrey. 1972. Studies on cytokinin production by Rhizobium. Plant Physiol. 49: 11-15.
Scharpf, R.F. 1962. Growth rate of the endophytic system of dwarf mistletoe on digger pine. Pacific Southwest Forest and Range Expt. Sta. Res. Note 193. 5p.
Scharpf, R.F. and F.G. Hawksworth. 1968. Dwarf mistletoe on sugar pine. USDA Forest Service Pest Leaflet 113. 4p.
Sequeira, L. 1973. Hormone metabolism in diseased plants. 24: 353-380.
Annu. Rev. Plant Physiol.
Shea, K.R. 1966. Dwarf mistletoe on coastal western hemlock: principles and practices for control. Weyerhauser Forestery Paper No.9. Weyerhauser Forestry Research Center, Centralia, Washington. 9p.
Shea, K.R. and B. Howard. 1969. Dwarf mistletoe control: a program for research and development in the west. Forest Pest Conditions (S.F., California, 1968). Proc. pp. 25-32. West Forest and Conserve Assc., Portland, Ore.
Shea, K.R. and J.L. Stewart. 1972. Hemlock dwarf mistletoe. USDA Forest Service Pest Leaflet 135. 6p.
Shindy, W.W. and O.E. Smith. 1975. Identification of plant hormones from cotton ovules. Plant Physiol. 55: 550-554.
Skoog, F. and D.J. Armstrong. 1970. Cytokinins. Annu. Rev. Plant" Physiol. 21: 359-384.
Smith, R.B. Sci.
1969. Assessing dwarf mistletoe on western hemlock. 15: 277-286.
For.
Steward, F.C. and A. Krikorian." 1971. Plants, Chemicals and Growth. Academic Press, New York.
Stewart, J.L. and K.R. Shea. 1971. Forest diseases of the Pacific Northwest. USDA Forest Service Pacific Northwest Forest and Range Exp. Sta. l4p.
Syono, K. and J.G. Torrey. 1976. Identification of cytokinins of root nodules of the garden pea, Pisum sativum L. Plant Physio1. 57: 602-606.
Tegley, J.R., F.H. Whitman and M. Krasnuk. 1971. Chromatographic analysis of a cytokinin from tissue cultures of crown-gall. Plant Physiol. 47: 581-585.
69
Thimann, K. V. and T. Sachs. 1966. The role of cytokinins in "fasciation" disease caused by Corynebacterium fascians. Amer. J. Bot. 53: 731-739.
Thomas, T.H., J.E. Carroll, F.M.R. Isenberg, A. Pendegrass, and L. Howell. 1975. A simple, inexpensive, high pressure liquid chromatographic method for separating cytokinins in plant extracts. Plant Physiol. 56: 410-414.
Tromp, J. 1970. S;orage and mobilization of nitrogenous compounds in apple trees with special reference to arginine. pp. 143-159 1a L.C. Luckwill and C.V. Cutting, eds., Physiology of ~ Crops. Academic Press, London and New York.
Tucker, D.J. 1977. Hormonal regulation of lateral bud outgrowth in the tomato. Plant Science Letters. 8: 105-111.
Upper, C.D., J.P. Helgeson, J.D. Kemp and C.J. Schmidt. 1970. Gas liquid chromatographic isolation of cytokinins from natural sources. 6-(3-methyl-2-butenylamine) purine from Agrobacterium tumafasciens. Plant Physiol. 45: 543-547.
VanStaden, J. 1976. Seasonal changes in the cytokinin content of the Ginkgo biloba leaves. Physiol. Plant 38: 1-5.
VanStaden, J. 1977. Seasonal changes in the cytokinin content of the leaves of Salix babylonica. Physiol. Plant. 40: 296-299.
Varner, J.E. and D.T.H. Ho. 1977. Hormones. Pp. 713-770 in J. Bonner and J.E. Varner, eds., Plant Biochemistry. Academic Press, San Francisco.

-----~'''-.-
DFSp lH
DFSp 5H
DFSp 11
DFSp 51
DFSp AS
DFS IE
DFS 5H
DFS 11
DFS 51
DFS AS
DFF lR
DFF 5H
DFF 11
DFF 51
DFF AS
DFW lR
DHJ 5H
DFW 11
DFW 51
DFW AS
I.JRSp H
WRSp I
APPENDIX I
LIST OF ABBREVIATIONS
Douglas-fir Spring 1st growth segment - healthy
Douglas-fir Spring 5th growth segment - healthy
Douglas-fir Spring 1st growth segment - infected
Douglas-fir Spring 5th growth segment - infected
Douglas-fir Spring aerial shoots
Douglas-fir Summer 1st grmvth segment - healthy
Douglas-fir Summer 5th growth segment - healthy
Douglas-fir Summer 1st grmvth segment - infected
Doulgas-fir Summer 5th growth segment - infected
Douglas-fir Summer aerial shoots
Douglas-fir Fall 1st growth segment - healthy
Doulgas-fir Fall 5th growth segment - healthy
Douglas-fir Fall 1st growth segment - infected
Douglas-fir Fall 5th grmvth segment - infected
Douglas-fir Fall aerial shoots
Douglas-fir Winter 1st growth segment - healthy
Douglas-fir Winter 5th growth segment - healthy
Douglas-fir Winter 1st growth segment - infected
Douglas-fir Winter 5th growth segment - infected
Douglas-fir Winter aerial shoots
Western hemlock Spring tissue - healthy
Western hemlock Spring tissue - infected
70

----_E~~·-· -71
WHSp AS Western hemlock Spring aerial shoots
WHSH Western hemlock Summer tissue - healthy
WHS I Western hemlock Summer tissue - infected
WHS AS Western hemlock Summer aerial shoots
WHF H Western hemlock Fall tissue - healthy
WHF I Western hemlock Fall tissue - infected
WHF AS Western hemlock Fall aerial shoots
WHW H Western hemlock Winter tissue - healthy
WHW I Western hemlock Winter tissue - infected
WHW AS Western hemlock Winter aerial shoots