seasonal variation in nutritional and anti …
TRANSCRIPT
SEASONAL VARIATION IN NUTRITIONAL AND ANTI-NUTRITIONAL COMPONENTS OF NATIVE SHRUBS AND TREES GROWN IN HAZARGANGI CHILTAN NATIONAL PARK, KARKHASA AND ZARGHOON
By
GHAZALA SHAHEEN
DEPARTMENT OF BOTANY UNIVERSITY OF BALOCHISTAN QUETTA
DECEMBER 2005
SEASONAL VARIATION IN NUTRITIONAL AND ANTI-NUTRITIONAL COMPONENTS OF NATIVE SHRUBS AND TREES GROWN IN HAZARGANGI CHILTAN NATIONAL PARK, KARKHASA AND ZARGHOON.
Thesis Submitted for the requirement of the Degree of Doctor of Philosophy in the University of Balochistan, Quetta.
BY
GHAZALA SHAHEEN
DEPARTMENT OF BOTANY UNIVERSITY OF BALOCHISTAN QUETTA
DECEMBER 2005

IN THE NAME OF ALLAH ALL MIGHTY MOST BENEFICENT, THE MOST MERCIFUL AND HE ALONE
IS THE HELPER.

DEDICATED TO MY PARENTS
LIST OF CONTENTS CONTENTS PAGE NO LIST OF CONTENTS i
LIST OF TABLES iv
LIST OF FIGURES vi
ACKNOWLEDGMENTS viii
ABSTRACT x
1. INTRODUCTION 1
1.1 Description about the plants 5
1.2 General introduction of Pakistan and Balochistan 15
1.3 General introduction of Quetta valley 19
a. Geology 19
b. Climatology 20
c. Hydrology 23
d. Soil 23
e. Biotic Factors 24
1.4 Description of study sites 25
a. Hazargangi Chiltan National Park 25
b. Zarghoon 26
c. Karkhasa 26
2. LITERATURE REVIEW 29
3. MATERIALS AND METHODS 43
3.1 Forage sample collection 43
3.2 Moisture and ash content 44
3.3 Sample preparation 44
3.4 Elemental analysis 44
3.5 Anti-nutritional analysis 45
a. Extraction 45
b. Quantitive determination 45
3.6 Nutritional studies 46
a. Carbohydrate 46
b. Protein 46
c. Crude fiber 47
d. Energy level estimation 48
3.7 Feeding Trails 48
3.8 Soil Analysis 49
3.9. Statistical Analysis 50
4. RESULTS AND DISCUSSION 51
4.1 Forage mineral concentration 51
a. Phosphorus 52
b. Calcium 53
c. Sodium 55
d. Potassium 56
e. Iron 58
f. Other elements 59
4.2 Anti- nutritional studies 68
4.3 Nutritional studies 71
a. Ash Content 71
b. Carbohydrates 72
c. Crude Protein and Nitrogen 75
d. Crude Fiber 79
e. Gross energy 81
4.4 Feeding Trails 91
a. Carbohydrate 92
b. Crude Protein 94
c. Crude Fiber 95
d. Total Nitrogen 96
e. Body Weight 97
4.5 Soil 111
a. Physical Characters 111
b. Chemical Characters 112
i. Calcium 112
ii. Sodium 113
iii. Potassium 113
iv. Phosphorus 114
v. Iron 115
4.6 Conclusion 119
REFERENCES 122
LIST OF ABBREVIATIONS 150
LIST OF TABLES TABLE NO PAGE NO 1. Concentration of Foliage elements of Fraxinus xanthoxyloides 60
2. Concentration of Foliage elements of Pistacia khinjuk 61
3. Concentration of Foliage elements of Amylgdalus brahuica 62
4. Concentration of Foliage elements of Prunus eburnea 63
5. Concentration of Foliage elements of Caragana ambigua 64
6. Concentration of Foliage elements of Sophara mollis 65
7. Concentration of Foliage elementsof Perovskia abrotanoides 66
8. Concentration of Foliage elements of Berberis baluchistanica 67
9. Average leaf nutritional value of Fraxinus xanthoxyloides 83
10. Average leaf nutritional value of Pistacia khinjuk 84
11. Average leaf nutritional value of Amylgdalus brahuica 85
12. Average leaf nutritional value of Prunus eburnean 86
13. Average leaf nutritional value of Caragana ambigua 87
14. Average leaf nutritional value of Sophara mollis 88
15. Average leaf nutritional value of Perovskia abrotanoides 89
16. Average leaf nutritional value of Berberis baluchistanica 90
17. Average value of animal fecal and urine out put of
Fraxinus xanthoxyloides and Pistacia khinjuk 100
18. Average value of animal fecal and urine out put
of Amylgdalus brahuica and Prunus eburnea 102
19. Average value of animal fecal and urine out put of
Caragana ambigua and Sophara mollis 104

20. Average value of animal fecal and urine out put of
Perovskia abrotanoides of Berberis baluchistanica 106
21. Physicochemical characteristic of soil from three localities of
Quetta 117
LIST OF FIGURES FIGURE NO PAGE NO 1. Figure showing the Fraxinus xanthoxyloides 6
2. Figure showing the Pistacia khinjuk 8
3. Figure showing the Amylgdalus brahuica 10
4. Figure showing the Prunus eburnean 10
5. Figure showing the Caragana ambigua 12
6. Figure showing the Sophara mollis 12
7. Figure showing the Perovskia abrotanoides 14
8. Figure showing the Berberis baluchistanica. 14
9. Showing the mean temperature during 2003-2004 21
10. Showing monthly rain fall during 2003-2004 21
11. Showing monthly humidity during 2003-2004 22
12. Map of the Quetta district showing sampling sites 28
13. Figure showing animal fecal and urine out put of
Fraxinus xanthoxyloides 101
14. Figure showing animal fecal and urine out put of
Pistacia khinjuk 101
15. Figure showing animal fecal and urine out put of
Amylgdalus brahuica 103
16. Figure showing animal fecal and urine out put of
Prunus eburnea 103
17. Figure showing animal fecal and urine out put of
Caragana ambigua 105
18. Figure showing animal fecal and urine out put of
Perovskia abrotanoides 107
19. Figure showing the snaps of trail sheep 108
20. Figure showing comparison of body weight of sheep after
consuming tree foliage 109
21. Figure showing comparison of body weight of sheep after
consuming shrub foliage 110
22. Figure showing physical characteristic of soil of three localities 118
23. Figure showing chemical characteristic of soil of three localities 118
ACKNOWLEDGEMENTS
All praise is to Allah, who is our guide in time of darkness and our aid in
times of distresses. I am deeply and sincerely thankful from the core of my heart to
Almighty Allah, most gracious, most merciful, without his help I would have
never been able to complete this task.
Thanks are for Prof. Dr. Mudassir Asrar, My research Supervisor for her
kind consideration, proper attention and deep interest towards my assignment. I
was able to complete this task I feel her continuous inspiration, guidance and
cooperation filled the gaps in my professional personality. Her Supervision is
highly appreciated, her enthusiastic and continuous support made it possible for
me to complete my Ph.D program.
Special thanks to Dr. S. A. Kayani, Dean Faculty of Biological and
Chemical Science for his continuous cooperation, help and encouragement during
my studies I am extremely thankful to Prof. Dr. Rasool Bukhsh Traeen, Chairman,
Botany department for providing me all facilities, identification of plant specimens
and valuable suggestions, help and cooperation through out this work.
I must acknowledge the help and cooperation extended by my friend Mrs.
Gul Bano during the lab as well as in the field.

Sincere thanks to Mr. Abdul Qadir, Mr. Rehan Rashid and Dr. Shakeel
Babar for providing me sheep and all facilities at Live Stock Department
Balochistan.
Finally I am thankful to my parents, brothers and other family members for
their support and constant prayer. They continuously encouraged me during the
hard time of my studies.
ABSTRACT
Balochistan is the largest province of Pakistan and covers about 44% of the
total country. Majority of people rely on live stock for their living. Since the
natural resources are less, insufficient and of low quality, to meet the nutritional
requirements of livestock population. Therefore, this study was conducted to find
out the best source of fodder among the native, dominant trees and shrubs of
Quetta.
Two trees Fraxinus xanthoxyloides and Pistacia khinjuk and six shrubs
Amylgdalus brahuica, Prunus eburnea, Caragana ambigua, Sophara mollis,
Perovskia abrotanoides and Berberis baluchistanica were analyzed for their
nutritional and antinutritional value seasonally from 3 habitats of Quetta district
for 2 years. Plant foliage samples were evaluated for their ash, carbohydrate, crude
protein, crude fiber and energy levels. Macro and micro elemental composition N,
P, Ca, K, Na, Fe, Al and Mn of foliage were also determined by atomic
absorption, flame photometer and X-rayflorescence spectrophotometer. Soil
samples of 3 habitats were also analyzed for their chemical and physical
properties. These were positively correlated with foliage samples. Feeding trials
were carried out by feeding the foliage to sheep, also their initial and final body
weights were monitored, fecal and urine sample were analyzed for carbohydrate,
crude protein, crude fiber and total nitrogen.
F. xanthoxyloides was found to be the best among two trees evaluated as it
has significantly high carbohydrates, crude protein, and mineral content while
comparatively less crude fiber and phenolics as compare to P. khinjuk were
recorded. The elemental concentrations were high during summer season. Mineral
concentration gradually increased from spring to autumn season and showed
decrease in winter’s season. Phosphorus and calcium concentration were higher
than the recommended amount for small ruminants. These concentrations were
positively correlated with soils physical and chemical characters. Significant
increase (P > 0.05) in body weight of sheep was observed when fed with
F. xanthoxyloides. The trees found at Zarghoon had high nutritional values than
the other two sites. Among six shrubs checked P. eburnea had significantly high
nutritional value. The weight of the animals fed with these two species was also
significantly increased. Therefore these two species may be considered as an
excellent source of fodder and are recommended for animal grazing. Among the
other five shrubs the following three species C. ambigua, A. brahuica and
B. baluchistanica were found to have medium nutritional and mineral contents and
provide an important part of diet but must be supplemented with some other
complete diet. P. abrotanoides has an bad odor with high phenolics which
eventually repels the ruminants and thus not generally preferred for grazing.
S. mollis has cutinized leaves which become the sole reason for not being grazed
even though it has better nutritional value. However no significant differences of
energy level were observed between trees and shrubs.

INTRODUCTION
Chapter I
1. INTRODUCTION
Plants have played essential link between mankind and environment.
Generally the trees and shrubs are the oldest friends of man kind and always have
played a major role in shaping the ecology of planet and determining the present
arrangements of life on earth. Trees and shrubs used as fodders vary from region
to region and from season to season, as they have a wide range of adaptability.
Feeding value of fodder trees and shrubs also varies depending on species or
cultivars, phonological stage, plant part, site and environmental conditions.
Shrubs and trees generally serve not only as fuel but also as shade and
shelter for men, animals and crops, these offer tremendous potentials for men and
animal’s benefit in making the arid and semi-arid lands of the world more
productive and useful. Fodder trees and shrubs provide forage for livestock
through out the world, when the values of grasses are below the minimum
requirements for the maintenance of livestock. In the arid and semi-arid areas of
the mediterranean regions fodder trees and shrubs, as forage plants can fill the gap
of feed for livestock during harsh environmental period.
About 65-70 % of Pakistan is categorized as rangeland. These rangelands
provide about 60 % of the total feed requirement for livestock Suleman et al.,
(1995), Bano (2003). According to daily “DAWN" (2005), Pakistan total forested
area is 2.3 million hectares which is of 3.1 % of the total land area. Ahmed (1951),
classified whole Pakistan into eight major climatic regions, out of these 8, 5 are
arid and semi-arid and these constitute more then 75% of the total area of
Pakistan.
Several researchers have investigated the biology and utilization of wild
land shrubs Chapin (1980) May and Killingbeck (1992). However, little
information is available on the trees and shrubs of the Balochistan, especially,
studies on mineral composition of trees and shrubs as forage.
Balochistan is the largest and driest province of the country making 44% of
the country’s area; its population is 6566000. It is poor in natural resources, with
water being limiting factor in development. Balochistan lands have shortage of
water throughout the year; the nomadic livestock grazing is primarily controlled
by the availability of watering points Mohammad (1989). Although the area is
vast, much of it is desert and low grade rangeland due to its arid climate and over
grazing. The vegetation is generally sparse, and reflects the aridity of climate. In
Balochistan shrublands are still seen as a source of livestock feed and deciduous
shrubs are most common.
According to FAO (1983), plant species of Balochistan are deficient in total
digestible nutrients and in digestible protein and dry matter with respect to animal
requirement. In Balochistan, previously the research has been focused only on
quantifying the crude protein of range forages Wahid (1990), with only limited
research focused on quantifying the seasonal dynamics of the nutrients.
In Quetta city very little work has been done to establish the nutritional and
anti-nutritional value of trees and shrubs as forage. These forage trees and shrubs
provide good browsing for sheep, goats and camels, and are source of feed for
livestock, because of their productivity, palatability and nutritional quality. In
recent years of prolonged drought adversely affected the delicate ecosystem of the
Quetta Sarwat et al., (2002) and Bano (2003).
In general, the quality of a diet for grazing ruminants depends upon the
species present in the range, the amount of forage available, and the nutritional
quality of the plant species. The more arid the site, the more common drought
deciduousness and the less common is ever greenness. During dry period, fodder
trees and shrubs play an important role in meeting part of the nutritional
requirement. Fodder quality, specifically its nutritive chemical constituents, is of
great importance for animal feeding and its impact on performance and
production. This is especially true under arid and desert conditions, where feeding
materials are not abundant to satisfy the demand. It is apparent that the nutritional
value between trees and shrubs species leaves varies, but there is no information
available on the nutritional profile of dominant trees and shrubs species of upland
Balochistan. It is further evident that the nutritional value of different fodder tree
leaves varies in biological composition, but there is no concrete evidence on their
nutritional profile between different seasons in Quetta.
The main objective of the present study is to evaluate the seasonal variation
in nutritional and anti-nutritional content, in terms of chemical composition and
digestibility, of native trees and shrubs of Balochistan, Therefore this study was
initiated to investigate the mineral composition, carbohydrates, crude protein,
crude fiber and anti- nutrition content of two commonly and dominated trees, and
six shrubs.
This research may be valuable to animal scientist and plant breeders in
selecting the suitable variety of trees and shrubs to evaluate their comparative
value with reference to all seasons and their effect on ruminants’ nutritional
patterns and subsequent growth also to evaluate the slight deficiency of micro and
macro elements adversely effects reproduction, lactation, growth and flattening
processes of small ruminants.
1.1 Plant Descriptions
Fraxinus xanthoxyloides (G. Don).
Fraxinus xanthoxyloides is commonly called as wild ash, belongs to family
Oleaceae. It is locally called as Shang or Ziarat ash. This is small deciduous tree 3-
7.5m tall. It is native to the sub-continent, including Pakistan, Afghanistan and
India. In Pakistan it is widely found in Gilgit Agency, Chitral, Dir, Swat, Hazara,
Kurrum, and Balochistan Sheikh (1993). It prefers arid and semi- arid conditions,
cool temperate, mediterranean climate with a temperature range of -20 to 35 Cº,
and elevations between 1000 and 2500m, Sheikh (1993). Ash plant produce
compound leaves with toothed leaflets that turn yellow color in autumn. The dull
green leaves are 8-15 inches long and consist of 5-9 oval or lance-shaped leaflets.
Plant is wind pollinated and characterized by apetalous flowers. It grows from
seed as well as by vegetative means. The growth rate is very slow, but the tree is
considered valuable for forestation projects and water shed management. Wood is
hard; branches are often cut and used for burning. The leaves can be used for
fodder for sheep and goats. Natural stands of Fraxinus xanthoxyloides are lopped
by farmers as a nutritious fodder for the animals.
F. xanthoxyloides shows early initiation of leaves and late shedding (end of
October) of foliage, and remains lush green in colour through out the year.
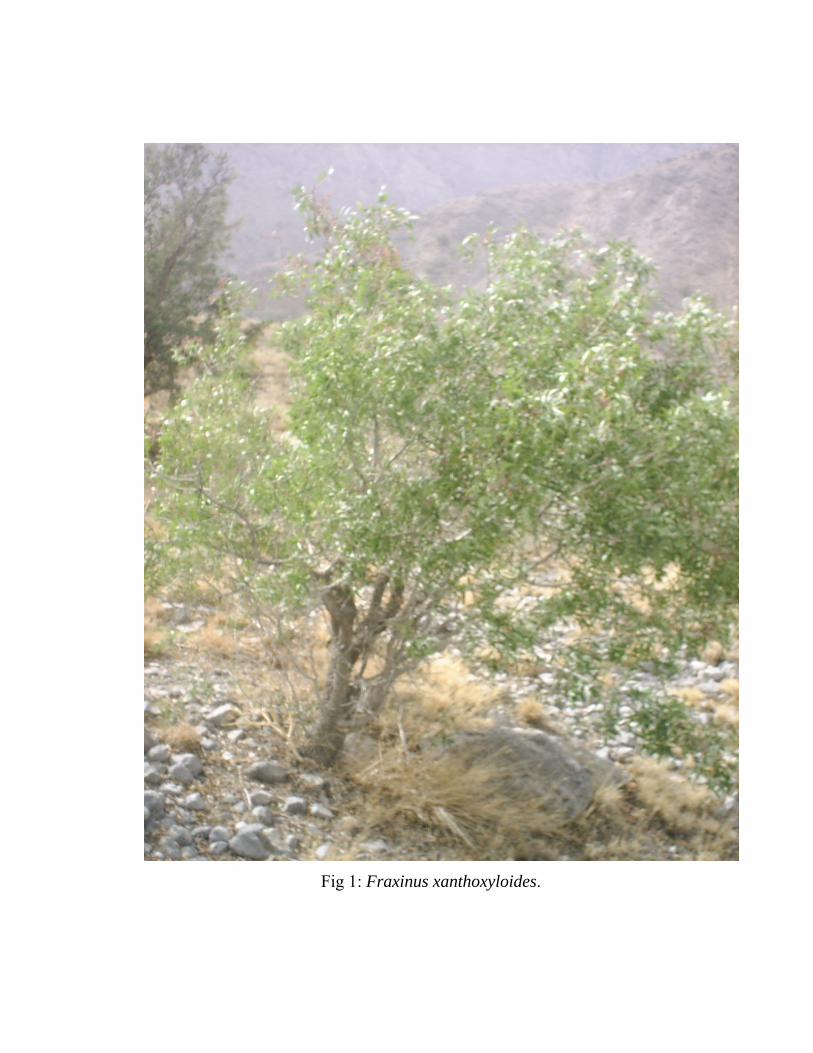
Fig 1: Fraxinus xanthoxyloides.
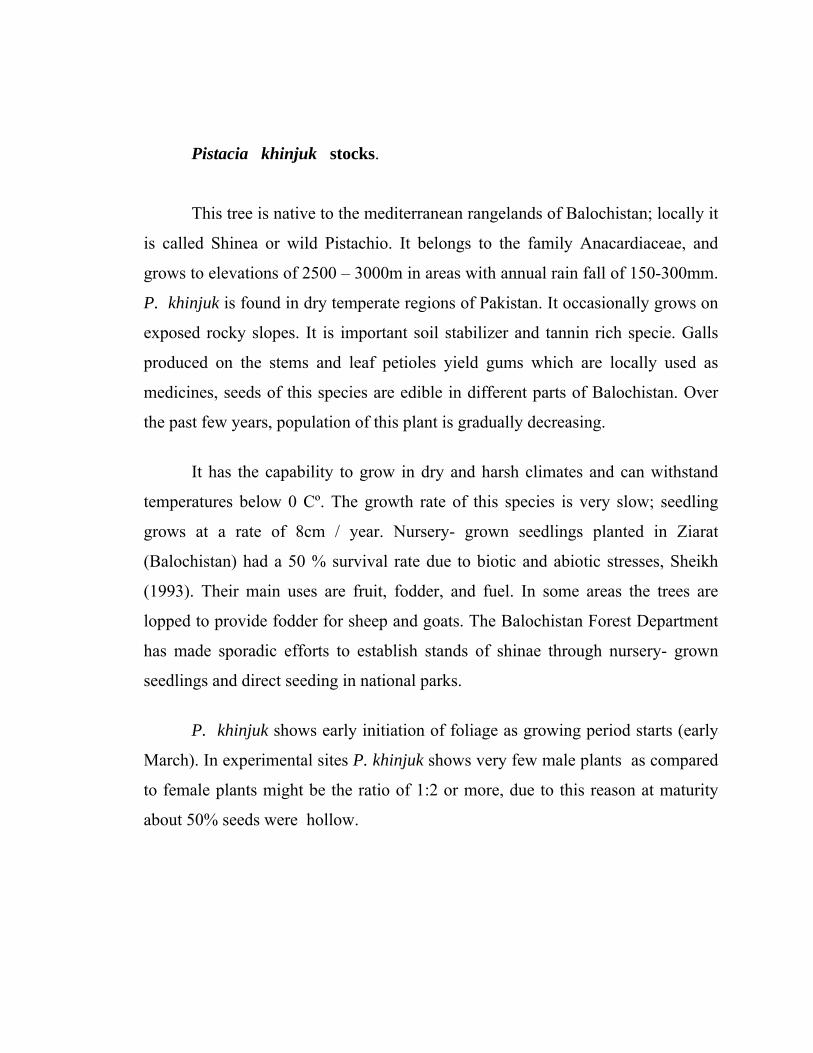
Pistacia khinjuk stocks.
This tree is native to the mediterranean rangelands of Balochistan; locally it
is called Shinea or wild Pistachio. It belongs to the family Anacardiaceae, and
grows to elevations of 2500 – 3000m in areas with annual rain fall of 150-300mm.
P. khinjuk is found in dry temperate regions of Pakistan. It occasionally grows on
exposed rocky slopes. It is important soil stabilizer and tannin rich specie. Galls
produced on the stems and leaf petioles yield gums which are locally used as
medicines, seeds of this species are edible in different parts of Balochistan. Over
the past few years, population of this plant is gradually decreasing.
It has the capability to grow in dry and harsh climates and can withstand
temperatures below 0 Cº. The growth rate of this species is very slow; seedling
grows at a rate of 8cm / year. Nursery- grown seedlings planted in Ziarat
(Balochistan) had a 50 % survival rate due to biotic and abiotic stresses, Sheikh
(1993). Their main uses are fruit, fodder, and fuel. In some areas the trees are
lopped to provide fodder for sheep and goats. The Balochistan Forest Department
has made sporadic efforts to establish stands of shinae through nursery- grown
seedlings and direct seeding in national parks.
P. khinjuk shows early initiation of foliage as growing period starts (early
March). In experimental sites P. khinjuk shows very few male plants as compared
to female plants might be the ratio of 1:2 or more, due to this reason at maturity
about 50% seeds were hollow.
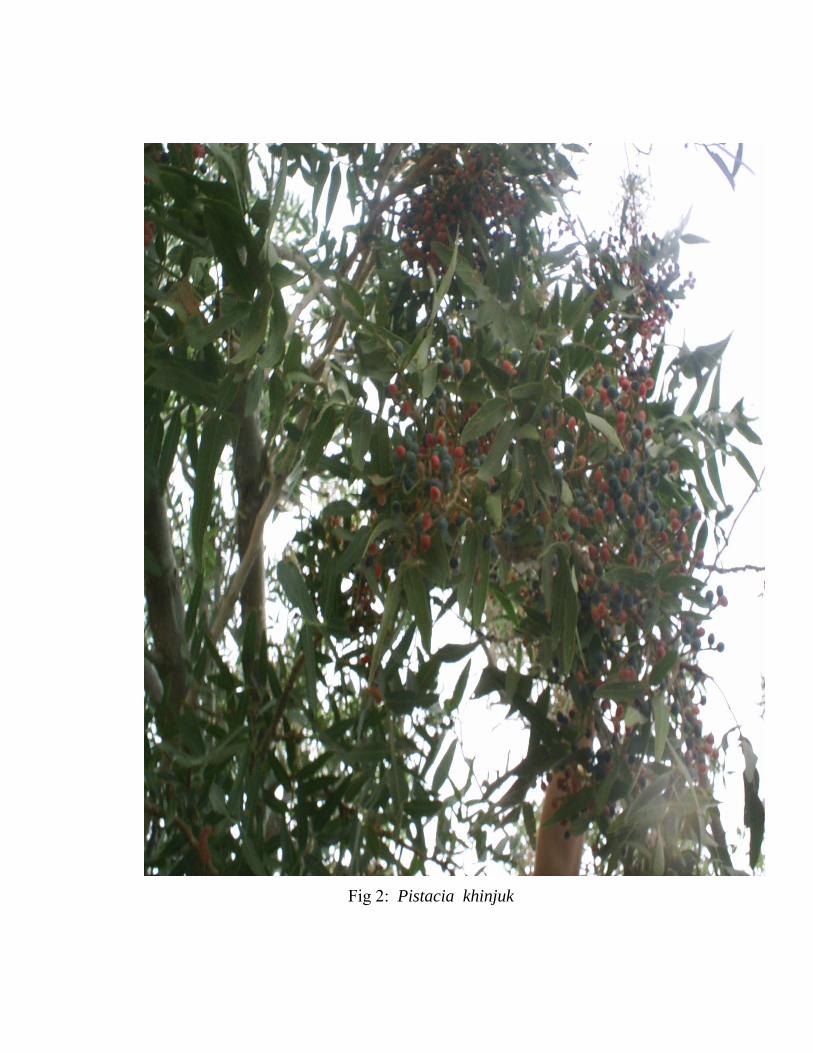
Fig 2: Pistacia khinjuk
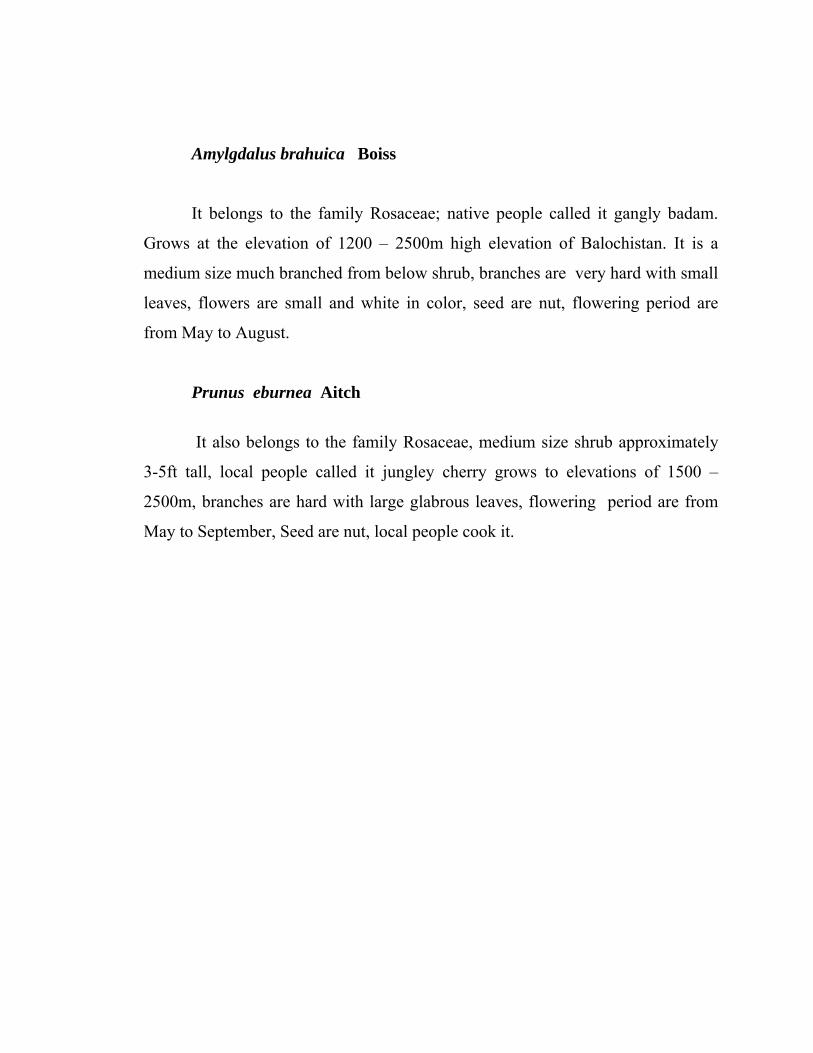
Amylgdalus brahuica Boiss
It belongs to the family Rosaceae; native people called it gangly badam.
Grows at the elevation of 1200 – 2500m high elevation of Balochistan. It is a
medium size much branched from below shrub, branches are very hard with small
leaves, flowers are small and white in color, seed are nut, flowering period are
from May to August.
Prunus eburnea Aitch
It also belongs to the family Rosaceae, medium size shrub approximately
3-5ft tall, local people called it jungley cherry grows to elevations of 1500 –
2500m, branches are hard with large glabrous leaves, flowering period are from
May to September, Seed are nut, local people cook it.
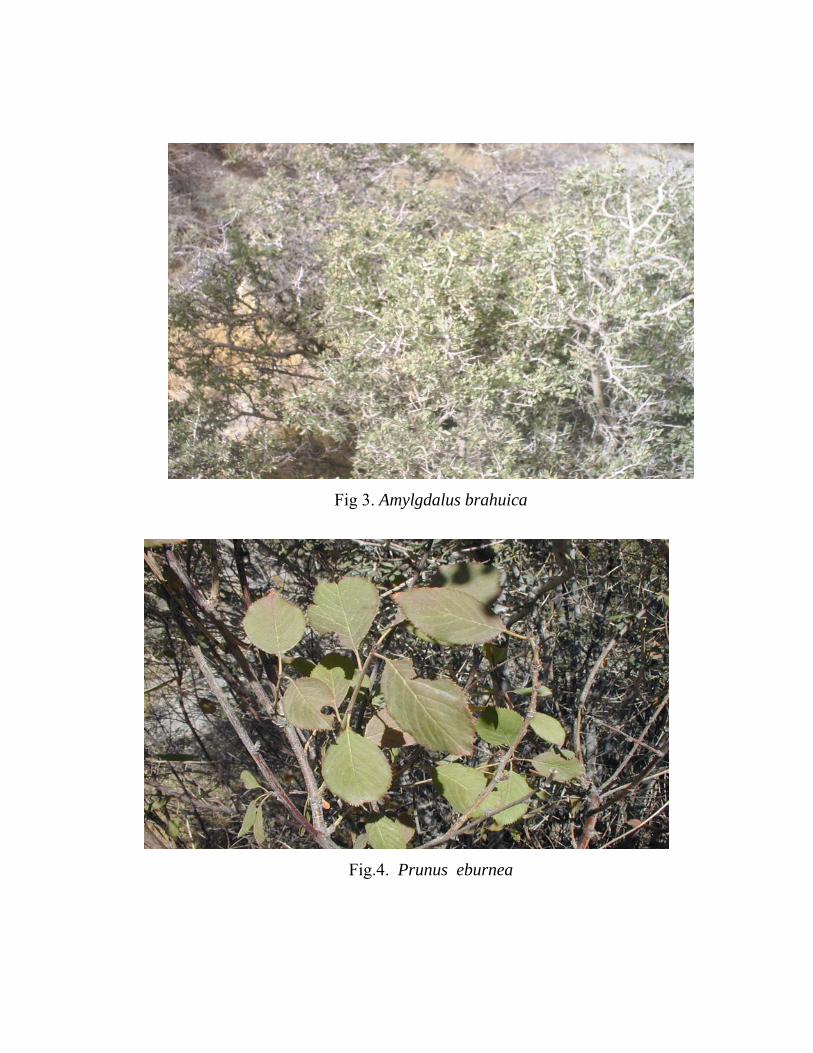
Fig 3. Amylgdalus brahuica
Fig.4. Prunus eburnea
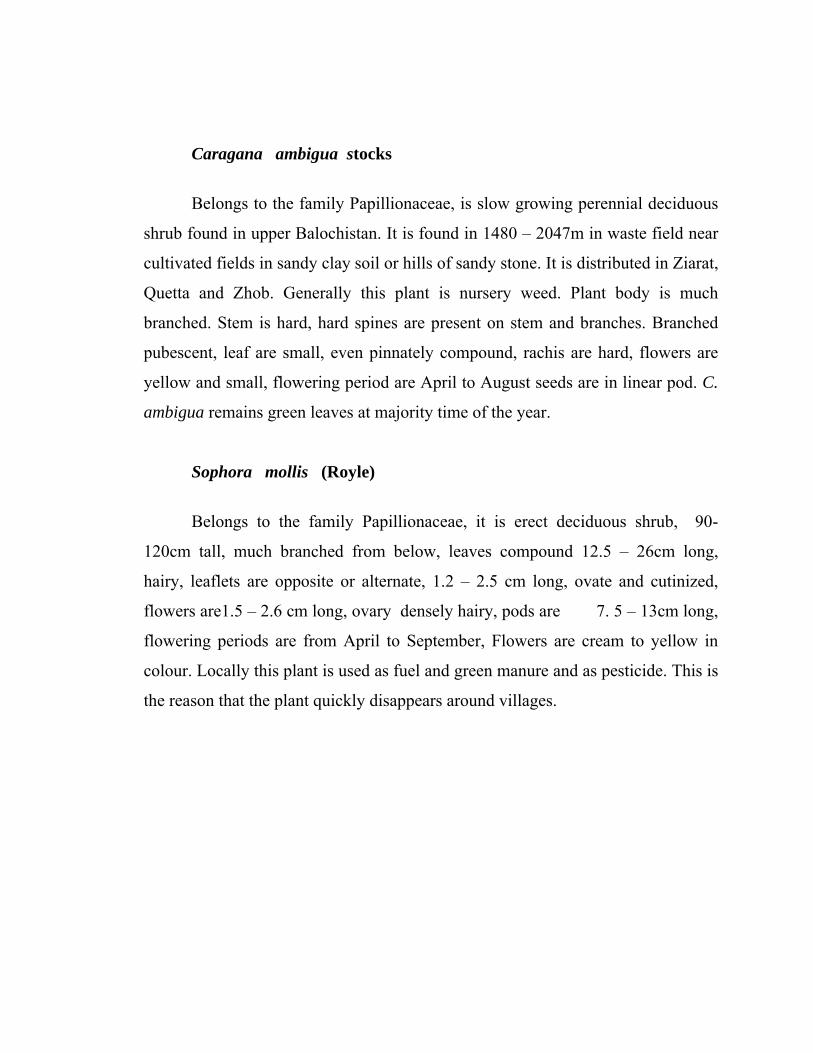
Caragana ambigua stocks
Belongs to the family Papillionaceae, is slow growing perennial deciduous
shrub found in upper Balochistan. It is found in 1480 – 2047m in waste field near
cultivated fields in sandy clay soil or hills of sandy stone. It is distributed in Ziarat,
Quetta and Zhob. Generally this plant is nursery weed. Plant body is much
branched. Stem is hard, hard spines are present on stem and branches. Branched
pubescent, leaf are small, even pinnately compound, rachis are hard, flowers are
yellow and small, flowering period are April to August seeds are in linear pod. C.
ambigua remains green leaves at majority time of the year.
Sophora mollis (Royle)
Belongs to the family Papillionaceae, it is erect deciduous shrub, 90-
120cm tall, much branched from below, leaves compound 12.5 – 26cm long,
hairy, leaflets are opposite or alternate, 1.2 – 2.5 cm long, ovate and cutinized,
flowers are1.5 – 2.6 cm long, ovary densely hairy, pods are 7. 5 – 13cm long,
flowering periods are from April to September, Flowers are cream to yellow in
colour. Locally this plant is used as fuel and green manure and as pesticide. This is
the reason that the plant quickly disappears around villages.
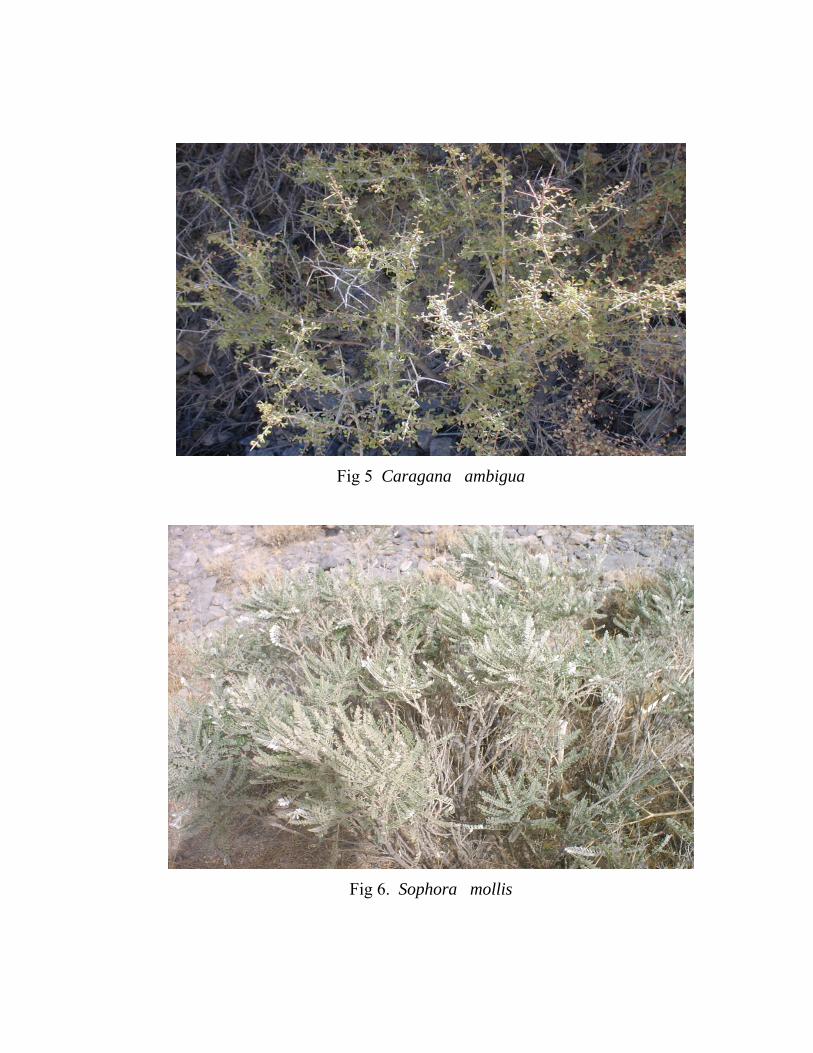
Fig 5 Caragana ambigua
Fig 6. Sophora mollis
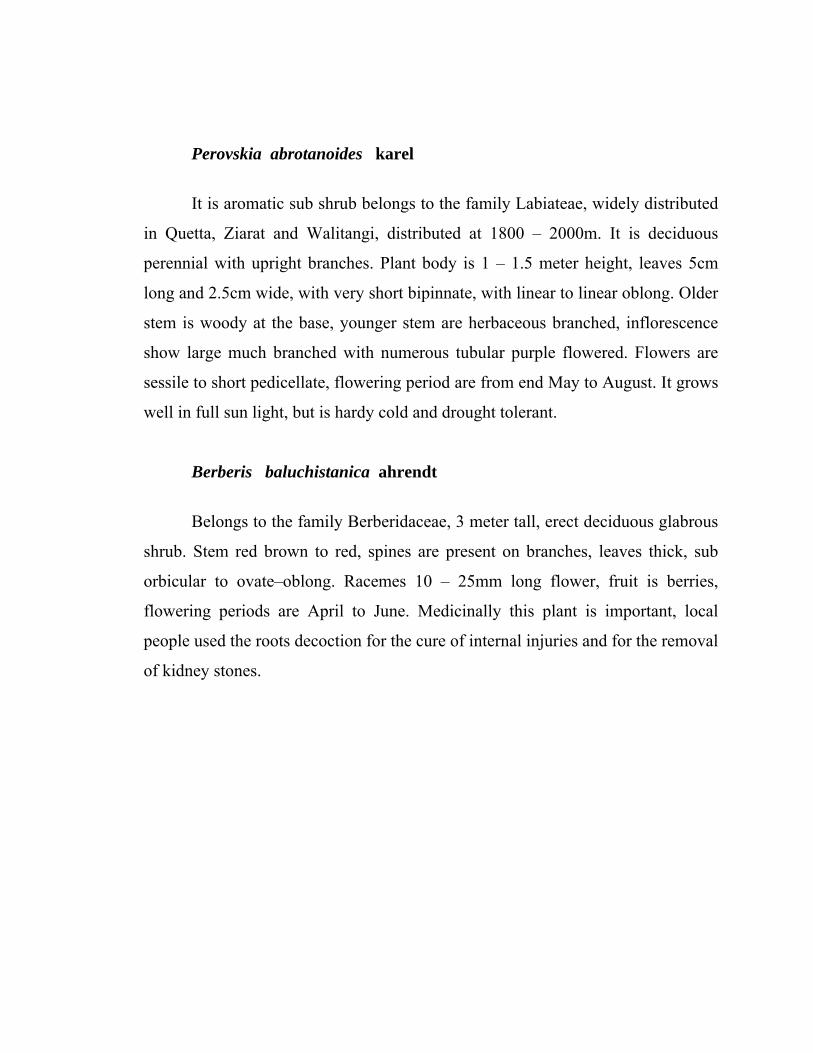
Perovskia abrotanoides karel
It is aromatic sub shrub belongs to the family Labiateae, widely distributed
in Quetta, Ziarat and Walitangi, distributed at 1800 – 2000m. It is deciduous
perennial with upright branches. Plant body is 1 – 1.5 meter height, leaves 5cm
long and 2.5cm wide, with very short bipinnate, with linear to linear oblong. Older
stem is woody at the base, younger stem are herbaceous branched, inflorescence
show large much branched with numerous tubular purple flowered. Flowers are
sessile to short pedicellate, flowering period are from end May to August. It grows
well in full sun light, but is hardy cold and drought tolerant.
Berberis baluchistanica ahrendt
Belongs to the family Berberidaceae, 3 meter tall, erect deciduous glabrous
shrub. Stem red brown to red, spines are present on branches, leaves thick, sub
orbicular to ovate–oblong. Racemes 10 – 25mm long flower, fruit is berries,
flowering periods are April to June. Medicinally this plant is important, local
people used the roots decoction for the cure of internal injuries and for the removal
of kidney stones.
Fig 7. Perovskia abrotanoides
Fig 8. Berberis baluchistanica
1.2 General Introduction of Pakistan and Balochistan
Pakistan is situated between 24º and 37º N latitude and between 61º and 75º
E longitude. The total area of the country is 796,095 km2 (79.6 million ha). In
Pakistan due to its geographically complex domain and altitudinal variations,
variety of soil types and different climatic conditions are found. It has a vast
coastal belt in the south and south west, and high mountain peeks, such as K2
(8,611m) and Naga Parbat (8,126m) in the north. The country is characterized by a
continental climate, which is arid and semi-arid. Ahmed (1951), classified whole
Pakistan into eight major climatic regions, out of these 8, 5 are arid and semi-arid
and these constitute more then 75% of the total area of Pakistan. The climatic
condition of Pakistan is the “tropical monsoon type” with four seasons; spring,
summer, autumn and winter. The monsoon (July to September) provides the major
portion of the rain in most parts of the country. There is an extreme variation in
temperature, which depends upon topography. It is arid, except for the southern
slopes of the Himalayas and the sub- Mountain tract, where annual rain fall varies
between 760 and 1270 mm. The amount of rainfall varies seasonally as well as
spatially, topographic aspect and wind velocity influence variations in climatic
regimes. The Indus basin river system is the World’s largest contiguous irrigation
system. The soils of the Indus basin are mostly alluvial soils, the pH usually
ranges from 8–9, Sheikh (1993).
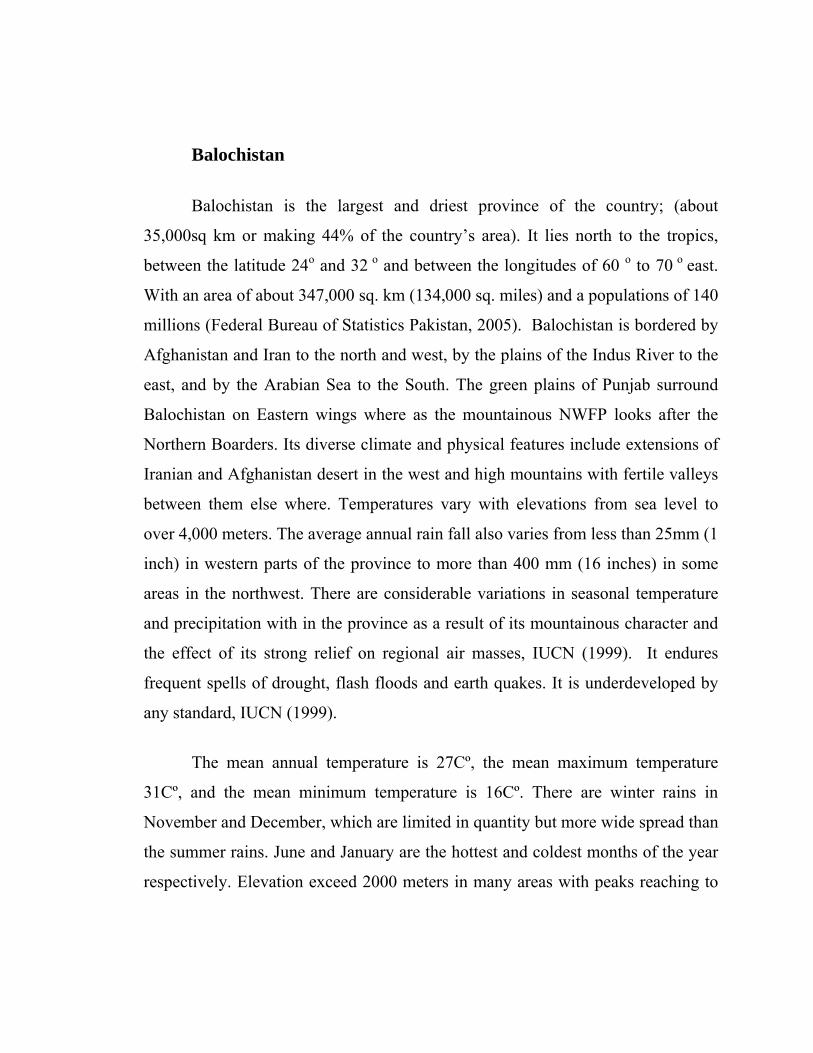
Balochistan
Balochistan is the largest and driest province of the country; (about
35,000sq km or making 44% of the country’s area). It lies north to the tropics,
between the latitude 24o and 32 o and between the longitudes of 60 o to 70 o east.
With an area of about 347,000 sq. km (134,000 sq. miles) and a populations of 140
millions (Federal Bureau of Statistics Pakistan, 2005). Balochistan is bordered by
Afghanistan and Iran to the north and west, by the plains of the Indus River to the
east, and by the Arabian Sea to the South. The green plains of Punjab surround
Balochistan on Eastern wings where as the mountainous NWFP looks after the
Northern Boarders. Its diverse climate and physical features include extensions of
Iranian and Afghanistan desert in the west and high mountains with fertile valleys
between them else where. Temperatures vary with elevations from sea level to
over 4,000 meters. The average annual rain fall also varies from less than 25mm (1
inch) in western parts of the province to more than 400 mm (16 inches) in some
areas in the northwest. There are considerable variations in seasonal temperature
and precipitation with in the province as a result of its mountainous character and
the effect of its strong relief on regional air masses, IUCN (1999). It endures
frequent spells of drought, flash floods and earth quakes. It is underdeveloped by
any standard, IUCN (1999).
The mean annual temperature is 27Cº, the mean maximum temperature
31Cº, and the mean minimum temperature is 16Cº. There are winter rains in
November and December, which are limited in quantity but more wide spread than
the summer rains. June and January are the hottest and coldest months of the year
respectively. Elevation exceed 2000 meters in many areas with peaks reaching to
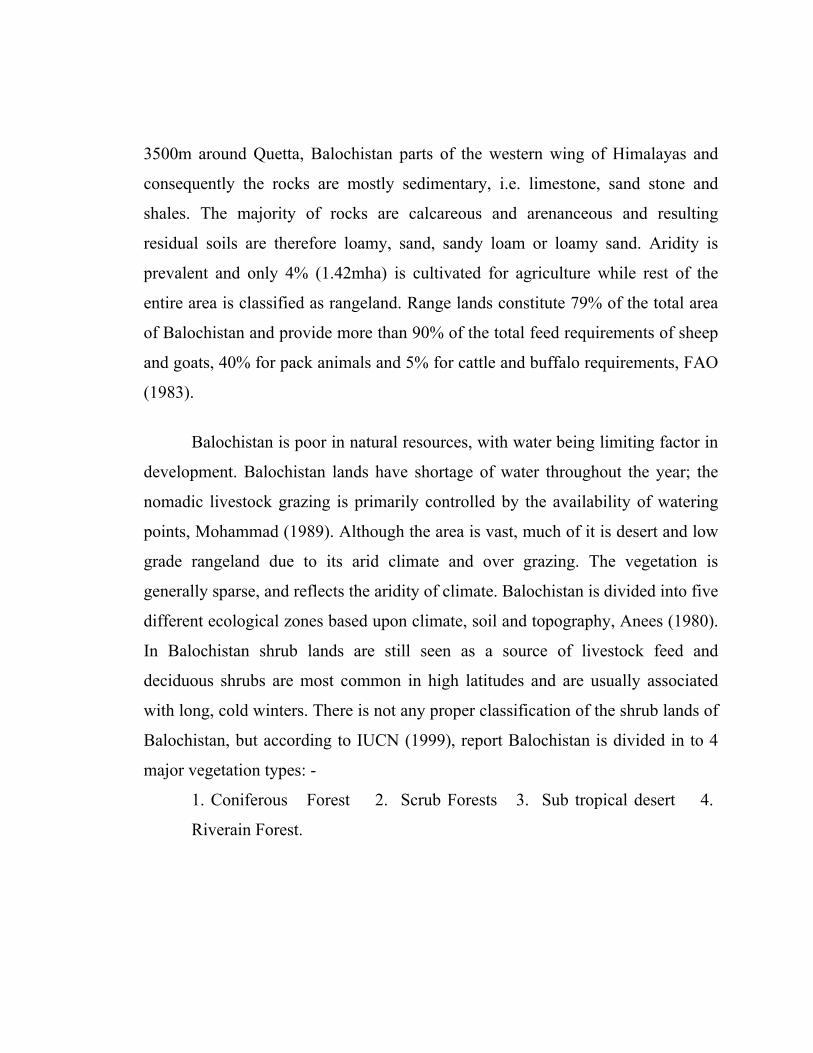
3500m around Quetta, Balochistan parts of the western wing of Himalayas and
consequently the rocks are mostly sedimentary, i.e. limestone, sand stone and
shales. The majority of rocks are calcareous and arenanceous and resulting
residual soils are therefore loamy, sand, sandy loam or loamy sand. Aridity is
prevalent and only 4% (1.42mha) is cultivated for agriculture while rest of the
entire area is classified as rangeland. Range lands constitute 79% of the total area
of Balochistan and provide more than 90% of the total feed requirements of sheep
and goats, 40% for pack animals and 5% for cattle and buffalo requirements, FAO
(1983).
Balochistan is poor in natural resources, with water being limiting factor in
development. Balochistan lands have shortage of water throughout the year; the
nomadic livestock grazing is primarily controlled by the availability of watering
points, Mohammad (1989). Although the area is vast, much of it is desert and low
grade rangeland due to its arid climate and over grazing. The vegetation is
generally sparse, and reflects the aridity of climate. Balochistan is divided into five
different ecological zones based upon climate, soil and topography, Anees (1980).
In Balochistan shrub lands are still seen as a source of livestock feed and
deciduous shrubs are most common in high latitudes and are usually associated
with long, cold winters. There is not any proper classification of the shrub lands of
Balochistan, but according to IUCN (1999), report Balochistan is divided in to 4
major vegetation types: -
1. Coniferous Forest 2. Scrub Forests 3. Sub tropical desert 4.
Riverain Forest.
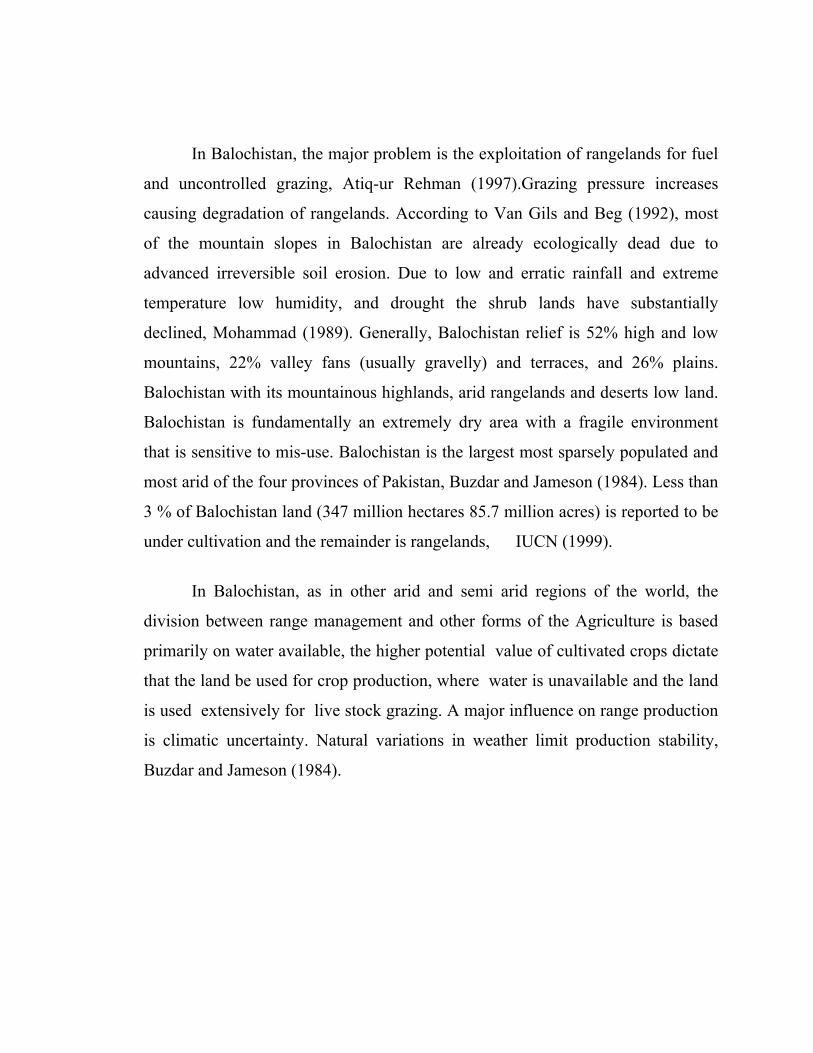
In Balochistan, the major problem is the exploitation of rangelands for fuel
and uncontrolled grazing, Atiq-ur Rehman (1997).Grazing pressure increases
causing degradation of rangelands. According to Van Gils and Beg (1992), most
of the mountain slopes in Balochistan are already ecologically dead due to
advanced irreversible soil erosion. Due to low and erratic rainfall and extreme
temperature low humidity, and drought the shrub lands have substantially
declined, Mohammad (1989). Generally, Balochistan relief is 52% high and low
mountains, 22% valley fans (usually gravelly) and terraces, and 26% plains.
Balochistan with its mountainous highlands, arid rangelands and deserts low land.
Balochistan is fundamentally an extremely dry area with a fragile environment
that is sensitive to mis-use. Balochistan is the largest most sparsely populated and
most arid of the four provinces of Pakistan, Buzdar and Jameson (1984). Less than
3 % of Balochistan land (347 million hectares 85.7 million acres) is reported to be
under cultivation and the remainder is rangelands, IUCN (1999).
In Balochistan, as in other arid and semi arid regions of the world, the
division between range management and other forms of the Agriculture is based
primarily on water available, the higher potential value of cultivated crops dictate
that the land be used for crop production, where water is unavailable and the land
is used extensively for live stock grazing. A major influence on range production
is climatic uncertainty. Natural variations in weather limit production stability,
Buzdar and Jameson (1984).
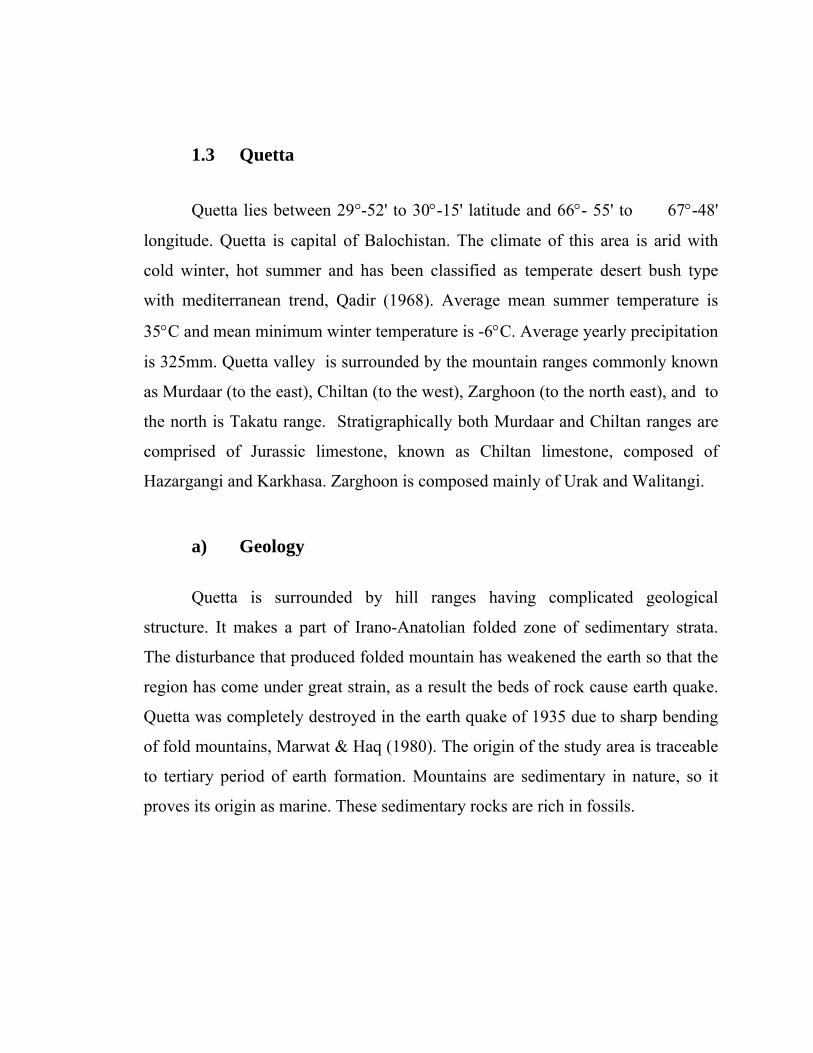
1.3 Quetta
Quetta lies between 29°-52' to 30°-15' latitude and 66°- 55' to 67°-48'
longitude. Quetta is capital of Balochistan. The climate of this area is arid with
cold winter, hot summer and has been classified as temperate desert bush type
with mediterranean trend, Qadir (1968). Average mean summer temperature is
35°C and mean minimum winter temperature is -6°C. Average yearly precipitation
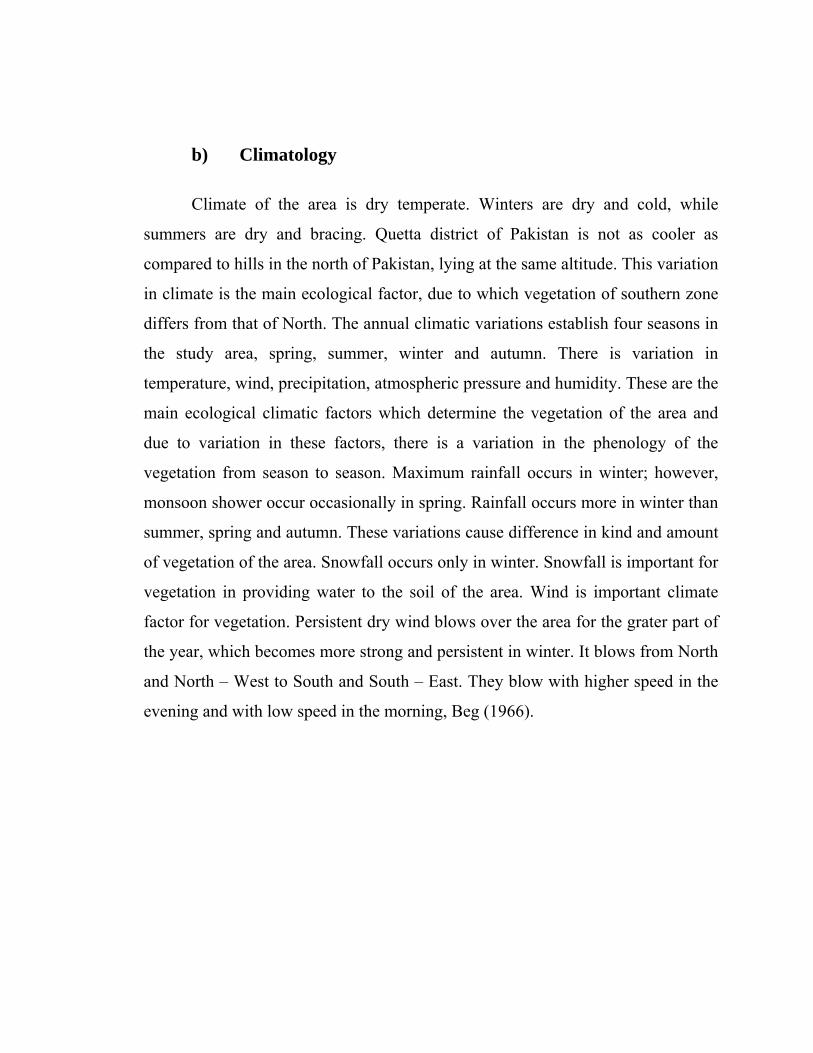
is 325mm. Quetta valley is surrounded by the mountain ranges commonly known
as Murdaar (to the east), Chiltan (to the west), Zarghoon (to the north east), and to
the north is Takatu range. Stratigraphically both Murdaar and Chiltan ranges are
comprised of Jurassic limestone, known as Chiltan limestone, composed of
Hazargangi and Karkhasa. Zarghoon is composed mainly of Urak and Walitangi.
a) Geology
Quetta is surrounded by hill ranges having complicated geological
structure. It makes a part of Irano-Anatolian folded zone of sedimentary strata.
The disturbance that produced folded mountain has weakened the earth so that the
region has come under great strain, as a result the beds of rock cause earth quake.
Quetta was completely destroyed in the earth quake of 1935 due to sharp bending
of fold mountains, Marwat & Haq (1980). The origin of the study area is traceable
to tertiary period of earth formation. Mountains are sedimentary in nature, so it
proves its origin as marine. These sedimentary rocks are rich in fossils.
b) Climatology Climate of the area is dry temperate. Winters are dry and cold, while
summers are dry and bracing. Quetta district of Pakistan is not as cooler as
compared to hills in the north of Pakistan, lying at the same altitude. This variation
in climate is the main ecological factor, due to which vegetation of southern zone
differs from that of North. The annual climatic variations establish four seasons in
the study area, spring, summer, winter and autumn. There is variation in
temperature, wind, precipitation, atmospheric pressure and humidity. These are the
main ecological climatic factors which determine the vegetation of the area and
due to variation in these factors, there is a variation in the phenology of the
vegetation from season to season. Maximum rainfall occurs in winter; however,
monsoon shower occur occasionally in spring. Rainfall occurs more in winter than
summer, spring and autumn. These variations cause difference in kind and amount
of vegetation of the area. Snowfall occurs only in winter. Snowfall is important for
vegetation in providing water to the soil of the area. Wind is important climate
factor for vegetation. Persistent dry wind blows over the area for the grater part of
the year, which becomes more strong and persistent in winter. It blows from North
and North – West to South and South – East. They blow with higher speed in the
evening and with low speed in the morning, Beg (1966).
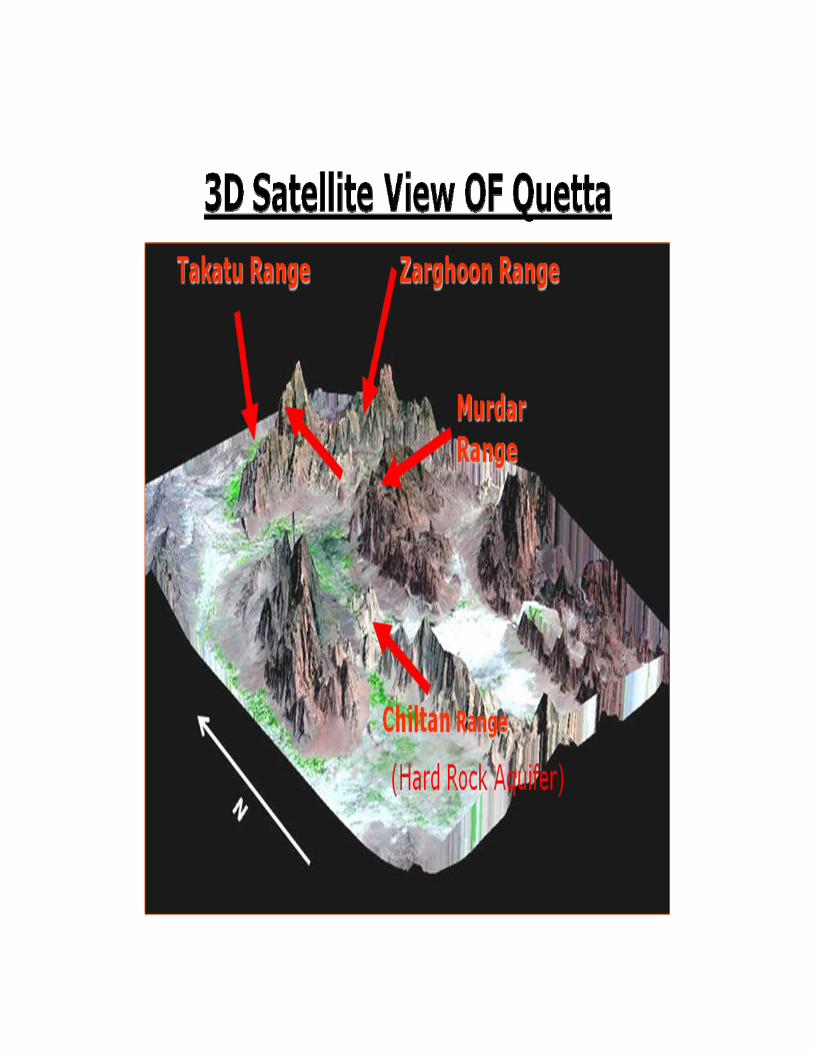
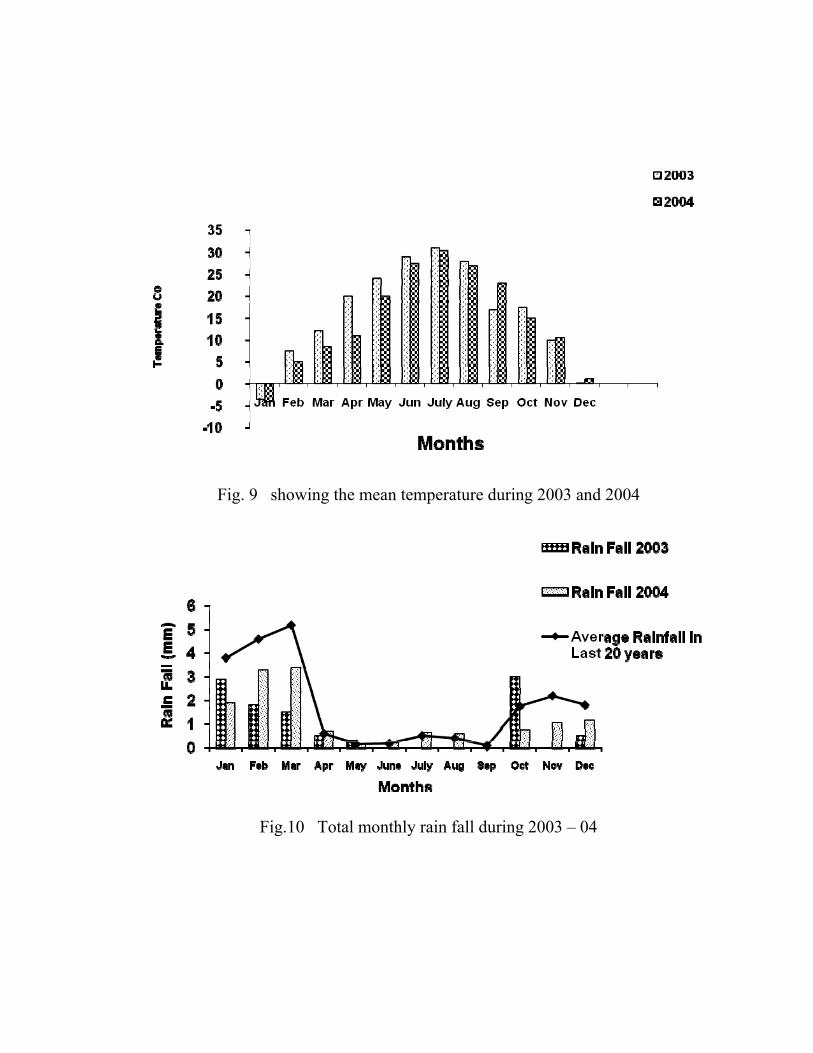
Fig. 9 showing the mean temperature during 2003 and 2004
Fig.10 Total monthly rain fall during 2003 – 04
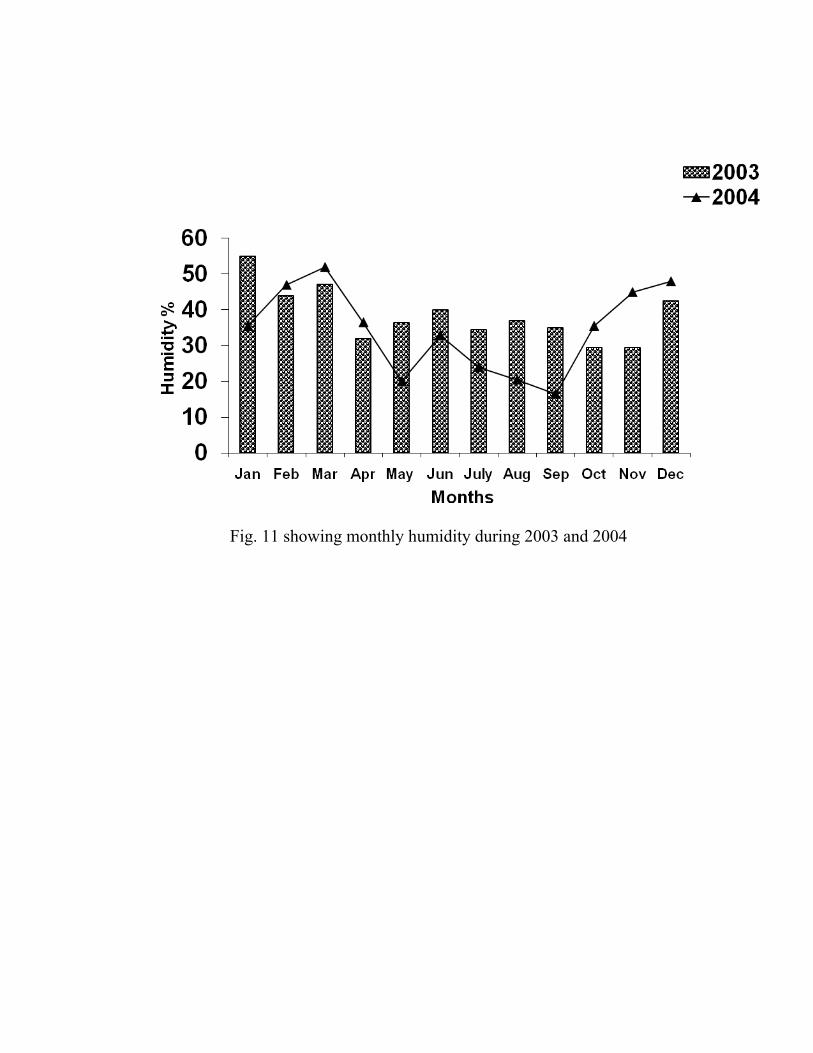
Fig. 11 showing monthly humidity during 2003 and 2004
c) Hydrology
Quetta valley has shortage of water. Most of the area is Barani. Shortage of
water has remained a problem nearly from two decades. The demand of water has
increased due to increase in population, and the development of local industries
and agricultures. Ground water is important water supply source of the area.
Gravelly piedmont fans and aprons skirting the mountains constitute the main
ground water reservoir. When precipitation on the water shed of the area occurs
the ground water is recharged. Ground water is discharged by tubewllls, Karazes,
springs effluent discharged of streams. Mountain, rocky hills, gravelly piedmont,
has safe and pure water, which are useful for irrigation, domestic and livestock
consumption, Marwat & Haq (1980).
d) Soil The soil of the Quetta is formed from the parent rocks. Different types of
parent rocks produce weathered particles of different size and chemical
composition. Formation high in particular trace minerals produce soils high in that
minerals. The soil that accumulates on limestone contains practically, the same
minerals that were in the original rock, only their proportions have been drastically
changed. Weathering merely changes the texture and minerals proportions without
producing a radically new set of minerals. The central part of the Quetta is covered
by the soil that ranges from sandy loam to silt loam. At the margin of valley near
foot hills the soils consist of sandy loam mixed pebbles and rock fragments.
e) Biotic Factors
Biotic factors play important role in the determination of vegetation of an
area. Once vegetation is developed, it establishes itself in a particular habitat and it
changes the climate of that habitat. Man is the main biotic factor that determines
or establishes or destroys the plant communities. Wild animals and birds are also
the consumers of the vegetation but their consumption of plants also depends on
man.
1.4 Description of the Study Sites
All three habitats are found in district Quetta, is semi-arid region, with hot
dry summer, cool winter and receiving less than 250mm of precipitation per year.
The study was conducted in three different habitats of Quetta district. Following
areas were selected for the study.
l: Hazargangi Chiltan National Park 2: Zarghoon 3: Karkhasa.
a) Hazargangi Chiltan National Park
Hazargangi National Park are located near Quetta at a distance of 20Km on
Quetta Mastung road towards N W at 30° 07’N longitude, 66° 58 ’E, 1700 m
altitude). It is one of the oldest and most important enclosed areas of Balochistan.
The region has Mediterranean climate, cold winter and dry summer. The park is
characterized by a dry semi-arid type of vegetation. This vegetation is well
preserved and occurs on the banks and terraces of water courses and along run-off
channels on the hill slopes.
The climate of Hazargangi is similar to Quetta annual rain fall varies
between 250-300 mm per year, Khan & Hussain (1963); Qadir and Ahmed
(1989). The precipitation is mostly confined to winter and spring seasons. Winter
snowfall is dominated the peak of hills in Hazargangi are covered with snow.
Run-off water (rain as well as melting snow) flows down the hill slopes into the
sloping plains as a result of which a number of water courses have developed
which remains dry for the greater part of the year. The mean maximum
temperature in summer is 36 °C and mean minimum temperature in winter is –10
°C.
According to Holdridge’s (1947) bio-climatic system, the region is falls
under the warm temperate bush type of bio-climate, Qadir (1968); Qadir and
Ahmed (1989). The climate of this region indicates a mediterranean trend due to
restriction of precipitation to winter and spring months.
b) Zarghoon
Zarghoon region is located to the southern part of Quetta valley lies
approximately between latitude 30o 39΄ N and longitude 67o 15΄ E. It covers an
area of about 354 square miles out of which 86 sq miles is piedmont 101 square
miles is valley floor and the rest is mountain high land, Hunting Survey
Corporation, (1960). The locality has tremendous variation from hill top to valley
bottoms and gentle slopes with grasses scattered trees, dominated by Fraxinus
xanthoxyloides and Pistacia khinjuk. Rain and snow fall is dominated in winter;
the mean maximum temperature in summer is 25°C and means minimum
temperature in winter is –15°.
c) Karkhasa
The third locality Karkhasa which is near to the slopes of Chiltan mountain
range of Quetta has rocks and precipitation occurs only in winter. Karkhasa
region lies at latitude 30o 09 ́ and longitude 66o 55,́ Hunting Survey Corporation
(1960). The climate of the valley is arid with mild summer and severe winter. It is
characterized by low precipitation, high rate of evaporation and wide range of
temperature. Rain fall of the area greatly varies from year to year. The average
mean monthly maximum temperature rises to 35°C for the month of July in
summer and the mean minimum in winter goes down to –5°C for the month of
January.
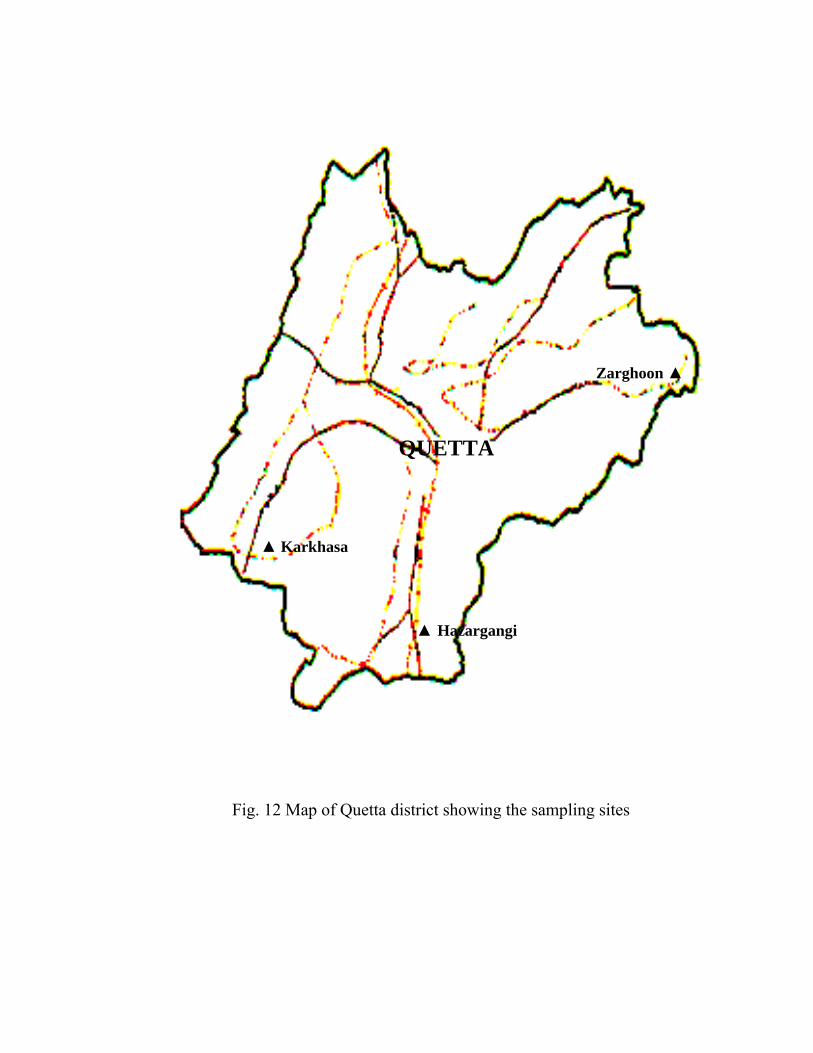
Fig. 12 Map of Quetta district showing the sampling sites
Zarghoon ▲
▲ Hazargangi
▲ Karkhasa
QUETTA

LITERATURE REVIEW
Chapter II
LITERATURE REVIEW
According to Holechek et al., (1995), rangelands remain critical to the
economy of many countries and provide about 70% of the feed needs to domestic
ruminants and 95% of the wild ruminant. Baumer (1983); Ainallis and Tsiouvars
(1996), concluded that in the arid and semi-arid areas of the mediterranean regions
fodder trees and shrubs, as forage plants can fill the gap of feed for livestock
during harsh period. Good (1947), suggested that plant distribution is controlled
by three climatic factors, moisture, temperature and wind and among all these
factors moisture is the most variable and specific for the occurrence of trees and
shrubs. It is documented that range site strongly influences the plant species that
grow in a particular region. This characteristic of site influence is found through
out the world.
According to Papanastasis et al., (1998); Parthasarathy (1986); Bhatia et al.,
(1976) woody plants of the arid zone play an essential role for mammalian
herbivores, tree leaves have also been successfully incorporated into concentrated
supplemented diets of sheep and goats. Incorporation of fodder trees in live stock
diet varies according to climatic zone, topography, soil condition, land utilization,
seasons, species and management of live stock. Trees or woody plants are
common components of most rangelands around the world. The crucial role of
woody plants in semi- arid region has long been recognized by Scholes & Walker
(1993); Breman & Kessler; (1995) and Rosenschein et al., (1999). However, trees
have traditionally been viewed negatively because they are presumed to reduce
herbaceous production and their presence increases the difficulty of livestock
manipulation.
Information on the nutritive value of many trees and shrubs is scarce, Rosales
and Gill (1997). In general, the quality of a diet for grazing ruminants depends upon
the species present in the range, the amount of forage available, and the nutritional
quality of the plant species. Nelson and Molser (1994) concluded that the type of
species present in the range depends on their adaptation for survival.
Lefroy et al., (1992); Corbet (1951), suggested that trees, often called
browse or top feed, have long been considered important for nutrition of grazing
animals in Pakistan, particularly in those areas with pronounced dry season and used
as supplement in the quantity and quality of pastures compounds.
Raghavan (1989); Azim et al., (2002) indicated that tree foliage makes a
significant contribution to meet the nutritional requirements of the ruminants during
the winter. It is well recognized that some tree leaves are palatable, digestible and
high in protein, Palmer and Schlink (1992); Subba et al., (1994); Leng (1997).
They provide a supplement of green feed when grasses and other herbaceous
material are dry and they provide the only source of protein and energy during
drought, when all other feed is absent. Different trees require different management
for maximum production, beside this different species have different soil
requirements, and palatability and preference differ among species.
Abel et al., (1997) concluded that fodder trees are less affected by seasonal
dry conditions because of their more extensive root systems and longer life- spans.
Chemical compositions and nutritive values of tree fodders vary a great deal.
According to Soc. Range Manage (1989), forage includes browse and herbage
which can be consumed by or harvested and fed to animals, their foliage generally
has higher fiber and lignin content than grasses, often has higher levels of tannins
and other astringent compounds. But according to Wilson (1969); Lefroy et al.,
(1992), they have higher in protein; often they have lower energy value than
herbaceous plant due to their lower digestibility. As a consequence of these factors
they are rarely the first choice of grazing animals and seldom make up a
significant proportion of the diet when grasses and other herbaceous feed is
available Graetz and Wilson (1979); Leigh and Mulham (1986); Squires and
Siebert (1983); Lefroy et al., (1992). In recent years, the roles of multipurpose
trees as fodder for maintenance and for production of livestock becomes more
dominant as the environment become harsher, Nitis (1989) and they are only
source of proteins and energy during drought when all other feeds are absent.
The nutritional quality of temperate deciduous tree leaves decreases with
leaf maturity, because mature leaves contain less nitrogen and water Mitchell
(1936); Haukioja et al., (1978); Mattson (1980); Scriber (1984) and Schroeder
(1986), but more fiber, lignin, and tannins than immature leaves, they are less
digestible and nutritionally inferior for herbivores. Leaves with shorter life spans
often have high photosynthetic capacities and high nitrogen contents which make
them favored by herbivores Rathcke (1985); Mooney and Gulman (1982) and
Coley (1983a).
Several researchers have investigated the biology and utilization of wild land
shrubs Chapin (1980); May and Killingbeck (1992). However, little information is
available on the trees and shrubs of the Balochistan, especially studies on mineral
composition of tree’s and shrubs as forage.
In many arid and semi arid regions of the world, shrubs have long been
recognized as an important rangeland resources McKell et al., (1972); Hyder (1973);
McKell (1975); Blaisdell and Holmgren (1984). Large areas of the arid and semi-
arid areas are covered with the combination of shrubby vegetation. Shrubs are
difficult to characterize. Generally shrub can be defined as a plant with multiple
woody, persistent stem but no central trunk and a height from 4.5 to 8m. McArthur
(1988); West and Ibrahim (1968); West (1982). Weber et a1., (1990) concluded that wild land shrubs represent a major forage source for livestock and wild life during
the harsh winter period. Mohammad et al., (1986) concluded that shrub and trees draw fewer nutrients
into above ground biomass and more into roots, and suggested that they have certain
advantages because of their productivity, palatability and nutritional quality. Fodder
shrubs constitute a vital component in livestock productivity in the arid and semi-
arid zones of Balochistan.
Walser et al., (1990) observed that temperate zone woody plants have the
ability to acclimatize during the fall season and thus withstand extremely cold
winter temperatures. Smith and Smith (1989) concluded that aridity, cold
temperature, short growing season, long periods of drought and low nutrient
supply favor shrubs. In certain environments shrubs have many advantages.
Shrubs invest less energy and nutrients in above ground parts than trees. Their
structural modifications improve light interception, heat dissipation, and
evaporation. The multi stemmed forms of shrubs influence interception of
moisture and stem flow, increasing or decreasing infiltration in to the soil, because
most shrubs can get their roots down quickly and form extensive root systems,
they use moisture deep in the soil. This feature gives them a competitive
advantage over trees and grasses Smith and Smith (1989). Ueckert (1985)
suggested that many of the shrubs that were valuable as fodder for livestock and
for wildlife are almost eliminated in many areas by continuous year long grazing
by cattle, sheep and goat. Therefore, the shrubs are suitable, because they produce
more biomass than other plant groups such as annual and perennial grasses during
periods of environmental stress, the level of production may not be sufficient to
sustain a consistently high level of uses.
Ueckert (1985) also suggested that shrubs are good source of digestible
protein during most of their active growth period. In animal grazing the main
nutritional characteristics of shrubs for ruminants and non–ruminants are
palatability, voluntary intake, chemical composition, mineral and amino acid
composition, apparent digestibility, feeding value, toxic or anti–nutritional factors.
Palatability depends upon a number of interacting factors linked to animals as well
as environment. However Sharifi et al., (1990) suggested that the success of
shrubs depends on their ability to compete for nutrients, energy and space.
Date, (1973) suggested that shrubs are recognized as fodder that may vary
from region to region and an extensive inventory of them is difficult to make.
Garcia-Moya and McKell (1970) pointed out in describing the immediate area under
the canopy of desert shrubs as “islands of fertility,” where the interspaced areas is
almost devoid of soil nitrogen. West and Skujins (1978) suggested that each shrub
creates a micro system in which it influences temperature, cycles nutrients, reduces
wind speed, adds organic matter as well as chemical breakdown products, and
stability to the plant- soil animal complex. Generally leaves, pods and flowers could
provide fodder to sustain live stock through the dry season.
Malcolm (1996), suggested that shrub are regarded as desirable component
of a pasture because (i) they provide a forage reserve after the ephemeral feed has
been exhausted, (ii) they help control erosion by reducing wind speed, (iii) they
act as a shelter for plants of other species to become established .While Boulanour
et al., (1996) consider that fodder shrubs are use for several purposes, (i) to reduce
grazing pressure on degraded areas where plant cover is poor, (ii) as a standing
fodder crop to buffer seasonal fluctuations that cover in arid and semi-arid
mediterranean areas, (iii) as a protein supplement for live stock on poor native
range lands or those consuming low quality roughage, (iv) as a forage source on
arid and salt- affected areas, (v) as a source of fuel for low- income farmers, (vi) as
a means of soil erosion control and (vii) as an emergency feed during drought
years.
Shrubs require less care and attention than herbaceous plants. The perennial
nature of shrubs allows immobilization of limiting nutrients and slows nutrient
recycling, Smith and Smith (1989). This feature gives them a competitive
advantage over trees and grasses, Smith and Smith (1989). Heitschmidt and Stuth
(1993) concluded that shrubs and most forbs are dicots, and their leaf biomass is
generally of higher nutritive value than that of grasses.
Cook (1972) suggested that shrubs have higher value of protein,
phosphorus, lignin and carotene than grasses and are most important for fall
and winter grazing when grasses and forbs are not available in quantity and as a
result value of shrubs increases.
Morley (1981); Van Soest (1982); Huston and Pinchak (1993), pointed out
that forage quality is determined by various combinations of micro and macro
scale, biotic and abiotic factors. Fleming (1973); Wilson (1981); Greene et al.,
(1987) considered that chemical and nutrient composition of plants and plant
communities in rangeland varies with climate, species, soil type, phenology and
other abiotic factors. The inherent morphological, anatomical, physiological and
chemical characteristics of each plant species determine its potential nutritive
value while abiotic and temporal factors modify this potential, Huston and Pinchak
(1993). Özcan and Bayçu (2005) worked on some elemental concentrations in
Acrons of Turkish Quercus L. (Fagaceae) Taxa in Turkey and they evaluated
different mineral concentrations in twigs.
Lefroy et al., (1992) concluded that the forage value of any feed depends on
the combination of its palatability, nutrition value and digestibility, Most feed typed
are not sufficiently digestible or nutritious to meet all of animal’s need in isolation.
According to Heitschmidt and Stuth (1993), nutritive value is an inclusive
expression used to encompass all nutritional attributes of forage in relation to it’s
over all value to the consuming animals. Small ruminants are generally tackled with
severe nutritional deficiency during this period of food scarcity, which exacerbate
disease and health problems Akbar et al., (1990). In this period, fodder trees and
shrubs play an important role in meeting part of the nutritional requirement.
Wiener (1975) suggested that concentrations of nutrients in foliage play a
major role in determining the suitability and attractiveness of the foliage for
herbivores. According to “Economic Survey of Pakistan (2004-2005)” the
populations of small ruminants in Balochistan are 25% of the sheep, 56% of the
goats and 80% of the camels. According to Cook and Harris (1977), the daily
nutrition demand of the stock fluctuates according to the physiological functions
of the grazing animals, their pattern of maintenance, gestation, growth, fattening
and lactation.
Abel et al., (1997) suggested that fodder trees can provide protein and
energy to keep rumen microbes active, increasing their ability to digest fiber, and
thus enable live stock to make use of dry season pastures. Ruminants are capable
to utilize forages only because of the unique digestive system they posses Beever,
(1993); Phillipson & Mc Anally (1942).
Zucker (1983); Lindroth (1988); Hanley et al., (1992) pointed out that the
selectively of the plant species by grazing animals may be affected by the presence
of some carbon based anti herbivory compounds found in the foliage. The most
common compounds are lignin and condensed tannin that derive their anti-
nutritional properties from smell taste or physiological activity with the animals.
Mangan (1988); Kumar and D’Mello (1995); Rubanza et al., (2003) also
mentioned that the utilization of browse forages are limited by the anti nutritional
factors such as tannins and Phenolics. In dry environments many range plant
species accumulate large amount of secondary metabolites and these can constitute
a significant proportion of the total carbon fixed by the plant. Haslam (1988);
Garry et. al., (1994), noted that the accumulation of condensed tannins in plants as
chemical defense plays an important role against vertebrates and invertebrate
herbivores. The amount of condense tannin in the foliage may vary with genotype
Garry et al., (1994), although changes in physical environmental factors such as
climate, Jonasson et al., (1986); Horner et al.,(1988); Mole and Joern (1993), light,
Bryant et al., (1987), water availability, Gershenzon (1984) and soil fertility,
Dustin and Cooper-Driver (1992), Northup et al., (1995). Some shrubs have high
level of soluble Phenolics and tannins that can reduce protein digestibility and
retention Moukld and Robbins (1981); Nastis and Malchek (1981); Robinson
(1982).
Feeny (1976); Swain (1979); Niknam and Ebrahimazeh (2002), believed
that Phenolic compounds are distributed in plants and they play important role in
plant- herbivore interactions. According to Farnsworth (1966), Niknam and
Ebrahimazeh (2002), tannins are group of phenols, are economically important as
agents for the tanning of leathers and for certain medicinal purposes, beside this
the medicinal values of phenolics are well known for the long time. Although
some of these substances are poisonous this is not the primary reason for
avoidance because some poisonous plants are selectively eaten by small
ruminants, Arnold (1981). This character may develop with maturity, and
unpalatability occurs with that of fodder plants age due to increased fibrousness.
While Holechek et al., (1990) found that the condensed tannins negatively affect
the nutritional status of ruminants consuming forage with high content of browse
plants, reducing the ruminal digestion of protein and cell wall.
Nuñez - Hernández et al., (1989) mentioned that crude protein
concentration may be misleading used as an indicator of nutritive value of the
species. The most important requirement of a good quality of forage is that it
should contain sufficient energy and protein. Forage contains fixed energy largely
in the form of complex carbohydrates, waxes, terpenes, essential oils, saponins
and phenypropanoids (lignins and tannins). Generally the lignin is high in browse
plants and has a negative effect upon the total organic matter digestibility, Van
Soest (1993).
Le Houerou (1993); Papanastasis (1993) concluded that the forage value of
any feed depends on the combination of its palatability, nutritive value and
digestibility. It is documented that shrubs and trees play an important role in the
nutrition of grazing animals in areas with a prolonged dry season, such as those
found in the mediterranean climate. During the dry months, they produce forage of
high nutritive value, Nastis (1993); Papanastasis (1993), which is the only
available feed.
Ruminants select nutritious diets from environment that contain diverse
array of plant species, growth stage, and plant parts that vary temporally and
spatially in nutritional value and toxicity, Provenza et al., (1994), Bryant et al.,
(1991), Mc Arthur et al., (1991). Youssef et al., (1990) and Khan et al., (2004)
access that the health and degree of productivity of grazing animals are dependent
on balanced and enough quantities and necessary nutrients to meet their
requirements for a given physiological stage.
Lefroy et al., (1992) resulted that the intake of sufficient energy and
nutrients by an animal can not be predicted from separate analysis of plant’s
nutrient content, digestibility or palatability. Firstly, chemical analysis commonly
over estimates digestibility, particularly that of protein, infact that protein is often
bound to lignins and tannins which can prevent its break down in animals, Dann
and low (1988); Miller (1991) secondly, digestibility can be a poor indicator of
forage value , thirdly palatability can vary seasonally and between animals and
can not there fore be assessed on the basis of occasional consumption of browse,
Dann and low (1988); Wilson (1969).
Niknam and Lisar (2004), worked on the carbohydrate, muscilage contents
and chemical composition of Astragalus species of Iran, and suggested that the
variations in the content of plants metabolites are due to genetic components.
Nutritient availability affects the sustainability of plants to herbivores due to
absolute content for minerals, nutritional influences on other essential constituents
such as carbohydrates, and the balance between essential and detrimental
chemicals, Bryant et al., (1983) and McNaughton and chapin (1985).
Ali (1988) concluded the crude protein content of forage is also important
in determining their nutritive value. Crude protein digestibility varies with plant
maturation. As the cell wall hardens through lignifications, protein and other
nutrients become less easily available to rumen micro organisms.
Wallace et al., (1980) concluded that mineral composition of the plants in
any ecosystem is one of its distinguishing features. Chapin and Slack (1979),
suggested that it is possible that plant parts with different chemical composition
that adjust carbohydrate allocation and nutrient acquisition would be expected to
show different mineralization, which might be relevant in determining the release
of nutrients to the soil.Del Vale and Rossel (2000) concluded that edaphic,
climatic and genetic factors affect the morphology and metabolism of shrubs, also
affect the digestibility of shrub tissues. Minson (1982); Elliott and McMeniman
(1987) concluded that edaphic factors such as limited availability of water and
nutrients, are the cause of plant foliage being poor in nitrogen (N), digestible
energy, phosphorus (P), occasionally sodium (Na) and calcium (Ca). McDowell
(1997); Tiffany et al., (2000); Khan et al., (2004) concluded that the poor animal
growth and reproductive problems are common even when forage supply is
enough and can be directed related to minerals deficiencies caused by low mineral
concentration in the soil and associated forages.
Ettershank et al., (1978); West and Skujins (1978); Sharifi et al., (1990)
suggested that nitrogen is generally considered to be the second most important
factor limiting growth in warm desert ecosystem and play a major role in
determining productivity under conditions of adequate water supplies. Beadle and
Tchan (1955) concluded that nitrogen is most limiting factor of arid and semi-arid
regions of the world. Other factors such as phosphorus interact and confound the
relation between available nitrogen status and growth, because nitrogen, primary
control over the fertility of the soil, biological mechanism responsible for nitrogen
fixation are controlled by available soil moisture and it is strongly correlated with
climate. Mooney et al., (1981); Egli and Schmid (1999) observed the effect of leaf
age on leaf nitrogen content with younger leaves having high nitrogen contents
than older ones.
Al-Jaloud et al., (1994) mentioned that the phosphorus content of plant
tissue declines with increasing maturity, and the rate and extent of decline varies
with species.
Noy-Meir (1973) observed that unpredictable and highly variable amounts
of precipitation in arid ecosystems are limiting to primary plant productivity.

However when water is available, the productivity may be influenced or limited
by other factors such as soil and air temperature, herbivory, microflora activity and
soil nutrient availability.

MATERIALS AND
METHODS
Chapter III
MATERIALS AND METHODS
An area of approximately 3 ha represented the experimental plot of each
site. Complete random block design was used for sample collection. Samples were
selected randomly from different trees and shrubs with in the range. Leave
samples were randomly harvested (plucked by hand), from 5-7 trees of each
species and made one unit sample. Three replicates of each forage samples were
taken (as same method). As there is no vegetation during winter season, therefore
fallen leaves from the ground were collected. Plant samples were brought to the
Lab for analysis and one specimen was deposited for identification in the
herbarium of Botany department, University of Balochistan Quetta. After
collection harvested vegetative samples were kept to the laboratory and were dried
in shade at room temperature and ground to pass through 1mm screen thoroughly
mix and stored in sealed plastic bottles until analyzed. Various conversion factors
have been used to determine different factors.
3.1 Forage Sample Collection
Forage samples of two dominant tree Fraxinus xanthoxyloides G.Don and
Pistacia khinjuk stocks, and six shrubs, Amylgdalus brahuica Boiss, Prunus
eburnea Aitch, Caragana ambigua Stocks, Sophora mollis Royle, Perovskia
abrotanoides Karel, and Berberis baluchistanica Ahrendt, (as because Sophora
mollis were not found in Zarghoon). These plants were collected in all four
seasons from March 2003 to Dec 2004 for two years from three habitats;
Hazargangi Chiltan National Park, Zarghoon and Karkhasa.
3.2 Moisture and Ash Content
Moisture content was determined by drying the samples at room
temperature. Ash content was determined by ignited the known amount of plant
material in muffle furnace to 650C° for at least 8 hours. Ash was cooled in
desiccator at room temperature and weighed. Ash content of the samples was
determined by AOAC, (1990).
3.3 Sample Preparation
From each plant sample 0.3 gm of ash in test tube was dissolved in aqua
regia (HCl +HNO3), 6ml: 2ml and kept in aluminum block for digestion at 180C°.
The samples were digested to cool and dry and were diluted with 20ml of 10%
HCl, till the transparent color appears.
3.4 Elemental Analysis
Nitrogen (N), Phosphorus (P), Calcium(Ca), Sodium(Na), Potassium (K),
Iron (Fe), Aluminum(Al), Manganese (Mn) were determined by atomic absorption
/ flame spectrophotometer AA-6105 (Shimdzu),X-ray fluorescence
spectrophotometer, according to “A manual of experiment for plant biology
methods (1995)”. Analysis of samples was carried out in duplicate. Results were
calculated as% on dry weight basis. Elemental analysis of different species was
carried out from nutritional point of view.
3.5 Antinutritional Analysis
Phenolics determination
a. Extraction
0.5 gm plant powder material was extracted with 100ml of MeOH-H2O
(80:20) at 70Co in water bath for three hours (modified from Conde et al., (1995).
The suspensions of water extraction were filtered and the aqueous solution was
used for quantitative determination. The suspensions of methanolic extraction
were filtered and then these solutions were used for quantitative determination.
b. Quantitative determination
Total phenolics content were determined by Waterman and Mole (1994);
Niknam and Ebrahimzadeh (2002) method. In this procedure appropriate volumes
of aqueous solutions were diluted to final volume of 17 ml by distilled H2O then
add 1ml of Folin reagent and 2ml of saturated solution of sodium carbonate were
added. After 30 min, the absorbance was measured at 760nm. Aqueous solutions
of tannic acid (0.0–6.25µg/ml) were used as standards for plotting working curve,
Ranganna (1986). UV-Visible recording spectrophotometer (UV1601Shimadzu)
was used for absorbance measurement.
3.6 Nutritional Studies
Chemical composition of two trees and six shrubs was studied for
nutritional point of view. Carbohydrate, Crude protein, Crude fiber, and Gross
energy of foliage were estimated.
a. Carbohydrate
Carbohydrates were analyzed by Clegg’s Anthrone (1956) method. 1gm of
foliage grind samples was mixed with 10 ml distilled water with a dispenser in
50ml conical flask, after mixing on a vortex mixer for 2min, 13ml of 52% per
chloric acid (HOCLO3) was added. Digestion of samples with per chloric acid was
modified in the present study by shaking the sample on shaker for 20 minutes.
After filtration through Whatman filter paper No. 44 the contents were diluted,
made up to 250ml, mixed thoroughly and then processed for carbohydrate
determined and read the absorbance of the samples at 630nm against the reagent
on spectrophotometer (UV visible1 601 Shimadzu). Total available carbohydrate
(as % glucose) was calculated by the following formula:
% Glucose = 25 × absorbance of diluted sample wt of sample × absorbance of diluted standard
b. Proteins
To determine the protein contents approximately 2gm grind leaves were
taken in the Kjeldhal flask and equal amount of selenium mixture (Catalyst) was
added and mixed. Then 5ml of concentrated H2SO4 was also added to the flask and
heated until contents became transparent. Volume was raised to 100ml with
distilled water. 5ml of digested sample was transferred in distillation chamber of
Kjeldhal apparatus.5ml of 40% NaOH was added. Vapors were passed through the
condenser into flask containing 5ml of 20% boric acid solution mixed with one
drop of methyl red. Ammonia vapors were treated with boric acid solution, pink
color of mixture turned yellow. This ammonium borate solution was titrated
against 0.014 NHCL. The volume of acid consumed during neutralization was
noted till the pink colour was obtained. The amount of nitrogen determined was
multiplied by 6.25, so protein was estimated by using the following formula.
Three replicate samples were taken.
Protein = wt of nitrogen x 6.25.
c. Crude Fiber
Fibers are the organic residue that remains after being digested. Weight
2gm moisture free and ether extracted sample place in a beaker, and add 200ml
boiling dilute H2SO4.Digested the sample for exactly 30 minutes on crude fiber
extraction apparatus. Filtered through glass funnel with the aid of suction air
pump. Washed with hot water until it is acid free. Collect 15ml filtrate; added one
ml of NaOH and one ml of phenolphthalein indicator. (A pink colour indicates that
it is acid free).Then transferred it in to beaker again. Then again added 200ml
boiling dilute NaOH. Again digested for exactly 30 minutes, filtered through glass
funnel with the aid of suction air pump. Washed this first with 10ml hot dilute
H2SO4, and then with hot water until it is acid free and transferred it into crucible
dry it in oven at 135 Co for 2 hour. The whole sample was cooled in desiccator for
30 minutes and weighed. As a last step it was ignited in muffle furnace at 600 Co
for 30 minutes and cooled in desiccator for 1hour and weight. Crude fiber was
calculation by the following formula, PARC (1982).
Loss in weight on ignition % Crude fiber (as fed) = × (100 – % moisture- Sample weight % ether extract)
% crude fiber (as fed) % Crude fiber (DM) = × 100 % dry matter of sample
d. Energy Level Estimation
Foliage gross energy (GE) values were estimated, by ignited the 1gm of
dried sample, using a Parr bomb calorimeter (Model 1266), Parr instrument Co.,
Moline. IL).
3.7 Metabolic Studies
Forty two male sheep of 8 to 10 months old and average body weight of
45.6 ± 1.6 kg were used for experiment. Sheep were obtained from Live Stock
Department (Government of Balochistan) Quetta. Sheep were fed 500gm daily F.
xanthoxyloides, P. Khinjuk and six shrubs, A. Brahuica, P. eburnean, C.
ambigua, S. mollis, P. abrotanoides; and B. baluchistanica for 21 days in
addition to their normal feed. During the experiment sheep were kept in individual
pens. Three sheep were used as control treatment. They were fed on normal diet
(mixed herbage), and no special treatment was accorded to them regarding their
food content. There fecal and urine samples were also collected, analyzed and
compared with the results of experimented animals. Feed was offered once daily at
09:00 hr, water was available free of choice. During digestion trail samples of
feces and urine were collected before new feed was given each morning for 21
days. From every daily out put 10% of fecal sub samples were collected and after
every three days this sample was made one unit to get the mean. The same was
practiced with urine sample where 20 ml of urine was collected in plastic
container to which 5ml of HCl was added.
Fecal samples were dried in oven at 70 Co, grinded to pass 1mm screen and
stored at room temperature for chemical analysis. Carbohydrate, Crude protein,
Crude fiber and total nitrogen were analyzed by the method of PARC (1982).
Initial body weight and final body weight was measured. Difference was
calculated.
3.8 Soil Analysis
Soil of three habitats were collected and analyzed for their physical and
chemical characters. Samples were dried, sieved and made saturated paste with
distal water and filtered it, filtrate were used. pH of soil saturated paste was used
by using glass electrode (pH 3305 Jenway). Electrical Conductivity (EC) of
extract was measured by EC (Solo-bridge) meter. Water holding capacity (WHC)
was estimated by the method SSSA (1952). Soil texture was calculated by
hydrometer (Bouyoucos 1962). Calcium Sodium and Potassium were determined
by flame photometer (Corning 400). Phosphate and Iron were measured by using
UV visible 1601 Spectrophotometer Shimadzu.
3.9 Statistical Analysis
Result are expressed in means and standard error of means (Means ±SEM).
Mean value and standard deviation of elemental concentrations and other
treatments were subjected to analysis of variance (ANOVA). Level of
significance was checked at 0.05 levels.

RESULTS AND
DISCUSSION
Chapter IV
RESULTS AND DISCUSSION
4.1 Forage Mineral Concentrations
Forage trees of three localities of Quetta were analyzed seasonally for two
years for their macro, micro elemental composition. The major mineral element
essential for plants are Nitrogen (N), Phosphorus (P), Potassium (K), Calcium (Ca)
and Sodium (Na) and micro elements include Iron (Fe), Manganese (Mn) and
Aluminum (Al).
Elemental ratios have been successfully used to establish the nature of
nutrient limitation in range lands ecology. The assessments of the potential of
forages to meet the mineral requirement of animals has been mostly assayed and
are well reported in literature, Poland and Schnabel (1980); Jumba et al., (1996).
Biological scientist has investigated the biology and utilization of wild land
shrubs, Chapin (1980); May and Killingbeck (1992). Previously no work on the
quality of these plants was done especially, studies on mineral composition of
trees and shrubs of Quetta. Most of the woody species found here are deciduous,
considering the above-mentioned aspects the study was conducted to determine
mineral composition of these trees and shrubs, their seasonal variation at different
localities. Nitrogen and crude proteins in leaves were found in almost same
amounts, therefore it has been describes with crude protein at section 4.3c.
a) Phosphorus Phosphorus concentration of two trees and six dominated shrubs are
presented (Table1-8). The results of trees showed high concentration was found
(1.65 -1.16%) DM in F. xanthoxyloides, less concentration (1.62-0.12%) DM was
found in P. khinjuk. Maximum concentration was observed in F. xanthoxyloides
from Zarghoon during summer season, while the lowest amount (0.12%) DM was
estimated in P. khinjuk from Karkhasa in winter, and in autumn season.
Phosphorus accumulation in two tree species was high in Zarghoon medium in
Hazargangi and low at Karkhasa.
In shrub species the amount of phosphorus ranged between 1.70 - 0.06%
DM (Table 3-8). Highest amount (1.70%) DM was found in P. eburnea followed
by S. mollis (0.96%) DM. Medium amount (0.86%) DM was observed in C.
ambigua and in P. abrotanoides it was (0.71%) DM. Low amount (0.59%) DM
was found in A. brahuica, and B. baluchistanica (0.51%) DM. High phosphorus
was found during spring season and it decreased in autumn and winter, but this
difference was non significant difference (P > 0.05). S. mollis had high amount of
phosphorus as it is a leguminous plant, almost similar amount was reported from
other leguminous plants by Nasrullah et al., (2004). However mature trees and
shrubs are found to be a good source of phosphorus for animal health during
spring and summer season and these plants are also able to provide complete
nutritional requirement to animals as all trees and shrubs examined were above the
deficiency level of phosphorus which is below 0.15%, Allen (1989). Phosphorus is
a mobile element that this element may be strongly reused within the plant, being
translocated from the senescent tissues to the younger ones Del Valle and Rosell
(2000). The phosphorus content found from trees and shrubs during this study
were more then those reported from grasses. Norton (1981), reported 0.33%
phosphorus in grasses in temperate area and 0.22% in tropical areas, he also found
that phosphorus was highly affected by seasons. More phosphorus was observed
during spring and summer than in autumn and winter similar results were found by
Badri and Hamed (2000), while working on different shrubs of arid environment
they observed phosphorus contents in plant tissues declines with increasing
maturity, and the rate and extent of decline varies with species.
b) Calcium Calcium concentration in leaves of two trees and six shrubs of three habits
were evaluated seasonally (Table1-8). Calcium in tree ranged between 1.37-0.48%
DM was found in F. xanthoxyloides, while in P. khinjuk it ranged between 0.82-
0.49% DM. High calcium was recorded from F. xanthoxyloides leaves (1.37%)
DM, while in P. khinjuk slightly less amount of calcium was found. Its highest
concentration was found from trees of Zarghoon, while low concentration was in
the leaves of Hazargangi. High calcium was found during spring and summer
season. It gradually declined in autumn and winter season, because the fallen
leaves were collected from ground, as during winter as no leaves were found to
growing on trees, therefore true picture during winter cannot be portrayed. The
calcium recorded was more or equal to that required for animal nutrition, a dietary
essential level of calcium is 0.43%, little (1982). Forage concentration required by
grazing animal is influenced by the animal type, age, and weight of the animal and
level of production Khan et al., (2004). According to the recommendation of NRC
(1996), Ca requirement for growing and finishing animals expected to grow is
0.35% DM. Therefore both these tree species are good source of calcium for the
grazing animals.
Shrubs evaluated for calcium concentration has range between 0.71-0.14%
DM. Maximum amount (0.71%) DM was found in C. ambigua followed by P.
eburnea and A. brahuica (0.65%) DM, medium amount was noted in B.
baluchistanica (0.39%) DM and low amount was found in S. mollis (0.13%) DM.
Significantly different (P < 0.05) was observed. Almost same amount was
recorded from all shrubs with the exception of P. abrotanoides, where the
maximum amount of calcium was 1.62% DM, but this amount in shrub is more
than that required for animal nutrition, as a dietary level of 0.43% calcium is
required, Little (1982). Accumulation in high concentrations of any element in any
plant tissue without toxic effects may be a genetic characteristic and may include
tolerance mechanism though these elements are essential, they are also potentially
toxic, so plant possess complex biochemistry to control them Özcan and Bayçu
(2005). Calcium recorded from shrubs was less than that found in trees. Similar
results were found by Del Valle and Rosell (2000); they found low quantity from
two shrubs Atriplex lampa and Prosopis alpacto in Northeastern Patagonia. These
findings were contrary to Nasrullah et al., (2004) who recorded higher calcium
content (0.4-0.6%) from grasses and (1.2-1.6%) from legumes.
c) Sodium
Foliage of two trees and six shrubs species were evaluated seasonally for
the sodium concentration. The range of sodium in trees was 1.33%-0.8% DM
(Table 1-8). F. xanthoxyloides had higher amount of sodium as compared to P.
khinjuk. In both the tree species high amount was found from Karkhasa valley
during winter season, medium amount (0.32%) DM was observed in P. khinjuk
during spring season from Hazargangi, less amount of sodium in both trees was
observed from Zarghoon. My results of trees are comparable to the Badri and
Hamed, (2000) who found highest value (1.68%) in Tamarix from Egypt which
can be categorized as high sodium accumulator.
The sodium concentration in shrub species ranged between 1.33-0.03%
DM, this range was almost similar to that found in trees. High concentration of
sodium (1.33%) DM was observed in P. abrotanoides, the medium amount
(0.58%) DM was found in P. eburnean and low (0.03%) DM was fouond in B.
baluchistanica, however A. brahuica had (0.21%) DM, C. ambigua (0.28%)
DM, and S. mollis had (0.22%) DM of sodium. High sodium content was found
during winter season, maximum amount (0.42%) DM was observed in C.
ambigua from Hazargangi during this season. High (0.32%) DM was found in P.
eburnea and S .mollis during winter season from Hazargangi. Lowest amount
(0.3%) DM was found in P. abrotanoides from Zarghoon during spring season.
Similar results are found by Minson (1990) he found 0.22% from tropical
crops. Sodium in shrubs are non significantly different (P > 0.05) from trees
studied. While low sodium content was reported from grasses and legumes (0.09
and 0.06%) as reported by Nasrullah et al., (2004). Standard concentration of Na
in dry matter required for animals nutrition ranges between 0.09 and 0.21%,
Common Wealth Agricultural Bureau (1980). Critical concentration of Na 0.06%
in forage is recommended by NRC (1996), Anonymous (1996). The highest
amount of sodium in P. abrotanoides makes it less palatable to the grazing
animals therefore this plant is not liked by the animals and is not eaten by them so
this shrub remains green and present through out the year, similar findings was
observed by the Silva Colmer and Passera (1990), in Atriplex sp of Northeastern
Patagonia.
d) Potassium
Potassium concentration of two trees and six shrubs were evaluated
seasonally from three habitats of Quetta are given in (Table1-8). Amount ranged
in trees between 0.71-0.32% DM. Highest (0.71%) DM amount was observed in
P. khinjuk from Hazargangi during autumn season. Lowest amount (0.32%) was
found in F. xanthoxyloides from Zarghoon during summer season.
The amount of potassium in shrub ranges from 1.14-0.04% DM. High
(1.13%) DM amount was found in P. abrotanoides during summer season from
Hazargangi. Medium amount (0.64%) DM was noted in P. eburnea and B.
baluchistanica (0.52%) DM from Zarghoon during summer season, low amount
(0.04%) DM was recorded from, S. mollis, C. ambigua (0.26%) DM and A.
brahuica (0.23%) DM was found during summer season from Karkhasa. Similar
amounts were recorded by Del Valle and Rosell (2000), who found highest
(0.78%) DM value of potassium in summer in the leaves of a shrub Prosopis
alpacto.
Critical level for potassium is 0.60% as recommended by NRC (1996).
Therefore all samples analyzed had less then the required levels of potassium
except a tree P. khinjuk, and two shrubs P. eburnea and B. baluchistanica had
enough amount that can fulfills the animal requirements and are therefore
recommended as the best plants of the area. P. abrotanoides had excessive amount
of potassium in Zarghoon and Hazargangi which is more then the required amount
recommended by NRC (1996), is therefore not much suitable for animal
consumption, although it may not produce any toxic effect. All other species were
potassium deficient in all habitats so are not recommended for animal
consumption as reduced potassium can also depress animal productivity, by
reducing the appetite and so the food intake, Huston and Pinchak (1993). High
solubility and diffusion are fundamental characteristics of hydrated potassium (K)
ions. It provides them with functional mobility through biological membrane and
easy transportation over the entire plant, it also effects on opening and closing of
stomata. Potassium also plays a vital role in the plant water economy because of
its easy hydration and cooperation due to its abundance and high solubility, Del
Valle and Rosell (2000).
e) Iron
Iron is found in plants as micro element, Concentration of Iron of two trees
and six dominated shrubs of Quetta valley are evaluated and presented seasonally
(Table1-8). In tree species its range was 0.07-0.01% DM high Iron (0.07%) DM
was found in P. khinjuk from spring season, while lowest amount (0.01%) DM
was found in summer season from Hazargangi. F. xanthoxyloides had medium
amounts (0.05-0.02%) DM was observed in summer season. Less seasonal
differences were observed between localities.
Shrubs had almost similar amount of iron as found in trees they do not
differ much in their concentration. Maximum amount was found in C.
ambigua (0.09%) DM from summer season from Karkhasa, medium amount
(0.05%) DM was found in A. brahuica, P. eburnea and P. abrotanoides were
also recorded from three habitats. B. baluchistanica also showed medium amount
(0.04%) DM. Lowest amount of iron (0.02%) DM was found in S. mollis from
winter season from Hazargangi. Naturally occurring Iron (Fe) content of fodder
plants ranged from 18 to about 1000µg/g (0.018-0.10%), and various cereal grains
do not differ much in their concentrations. Kabata-Pendias and Pendias (1986)
found the common average iron content of different cereal ranges from 25 to
around 80µg/g. The iron deficiency causes chlorosis in leaves the excessive
amount is beneficial and is stored in leaves. The amount of iron recorded from all
plants were equal or more than that required for animal nutrition therefore all
plants studied provide a good source of animal nutrition.
f ) Other Elements
Other microelement Aluminum (Al) and Manganese (Mn) of two trees and
six shrubs were also evaluated from three habitats of Quetta. The amount of
Aluminum (0.002%) DM was found in F. xanthoxyloides while in P. khinjuk
(0.003%) DM was recorded.
In Shrub the concentration of Aluminum (Al) in A. brahuica (0.003%) was
found, while in C. ambigua, P. eburnean, an P. abrotanoides (0.002%) DM was
observed, (0.004%) DM was found in S. mollis and in B. baluchistanica (0.003%)
DM was recorded from Zarghoon.
Manganese (Mn) in F. xanthoxyloides was (0.004%), while in P. khinjuk
(0.005%) DM was observed. The concentrations of manganese in B.
baluchistanica was (0.006%) DM. P. abrotanoides and A .brahuica (0.005%)
DM, while in C. ambigua and S. mollis (0.004%) DM was recorded. P. eburnea

showed (0.003%) DM. However the amount of these two elements was negligible
in trees and shrubs. Manganese is vital for normal functioning of several enzymes
and particularly for those that regulate the oxidation and reduction phenomena.
This element also is necessary in nitrate reduction, and protein synthesis.
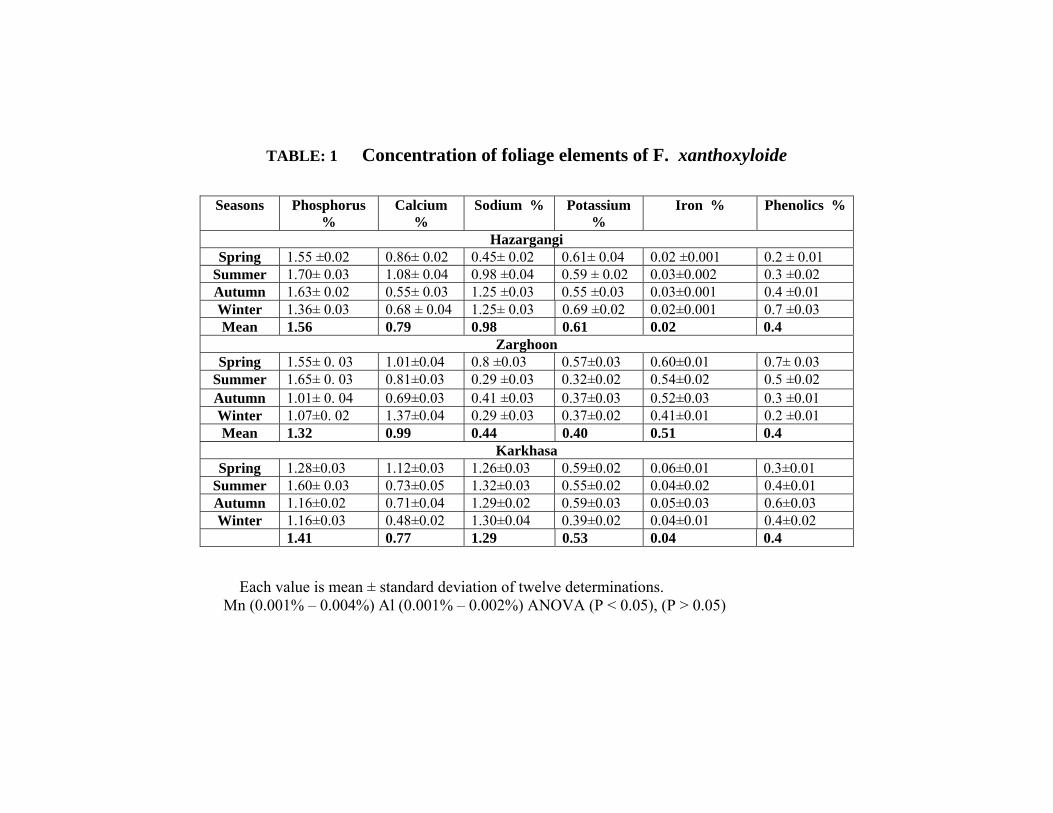
TABLE: 1 Concentration of foliage elements of F. xanthoxyloide
Seasons Phosphorus %
Calcium %
Sodium % Potassium %
Iron % Phenolics %
Hazargangi Spring 1.55 ±0.02 0.86± 0.02 0.45± 0.02 0.61± 0.04 0.02 ±0.001 0.2 ± 0.01
Summer 1.70± 0.03 1.08± 0.04 0.98 ±0.04 0.59 ± 0.02 0.03±0.002 0.3 ±0.02 Autumn 1.63± 0.02 0.55± 0.03 1.25 ±0.03 0.55 ±0.03 0.03±0.001 0.4 ±0.01 Winter 1.36± 0.03 0.68 ± 0.04 1.25± 0.03 0.69 ±0.02 0.02±0.001 0.7 ±0.03 Mean 1.56 0.79 0.98 0.61 0.02 0.4
Zarghoon Spring 1.55± 0. 03 1.01±0.04 0.8 ±0.03 0.57±0.03 0.60±0.01 0.7± 0.03
Summer 1.65± 0. 03 0.81±0.03 0.29 ±0.03 0.32±0.02 0.54±0.02 0.5 ±0.02 Autumn 1.01± 0. 04 0.69±0.03 0.41 ±0.03 0.37±0.03 0.52±0.03 0.3 ±0.01 Winter 1.07±0. 02 1.37±0.04 0.29 ±0.03 0.37±0.02 0.41±0.01 0.2 ±0.01 Mean 1.32 0.99 0.44 0.40 0.51 0.4
KarkhasaSpring 1.28±0.03 1.12±0.03 1.26±0.03 0.59±0.02 0.06±0.01 0.3±0.01
Summer 1.60± 0.03 0.73±0.05 1.32±0.03 0.55±0.02 0.04±0.02 0.4±0.01 Autumn 1.16±0.02 0.71±0.04 1.29±0.02 0.59±0.03 0.05±0.03 0.6±0.03 Winter 1.16±0.03 0.48±0.02 1.30±0.04 0.39±0.02 0.04±0.01 0.4±0.02
1.41 0.77 1.29 0.53 0.04 0.4
Each value is mean ± standard deviation of twelve determinations. Mn (0.001% – 0.004%) Al (0.001% – 0.002%) ANOVA (P < 0.05), (P > 0.05)
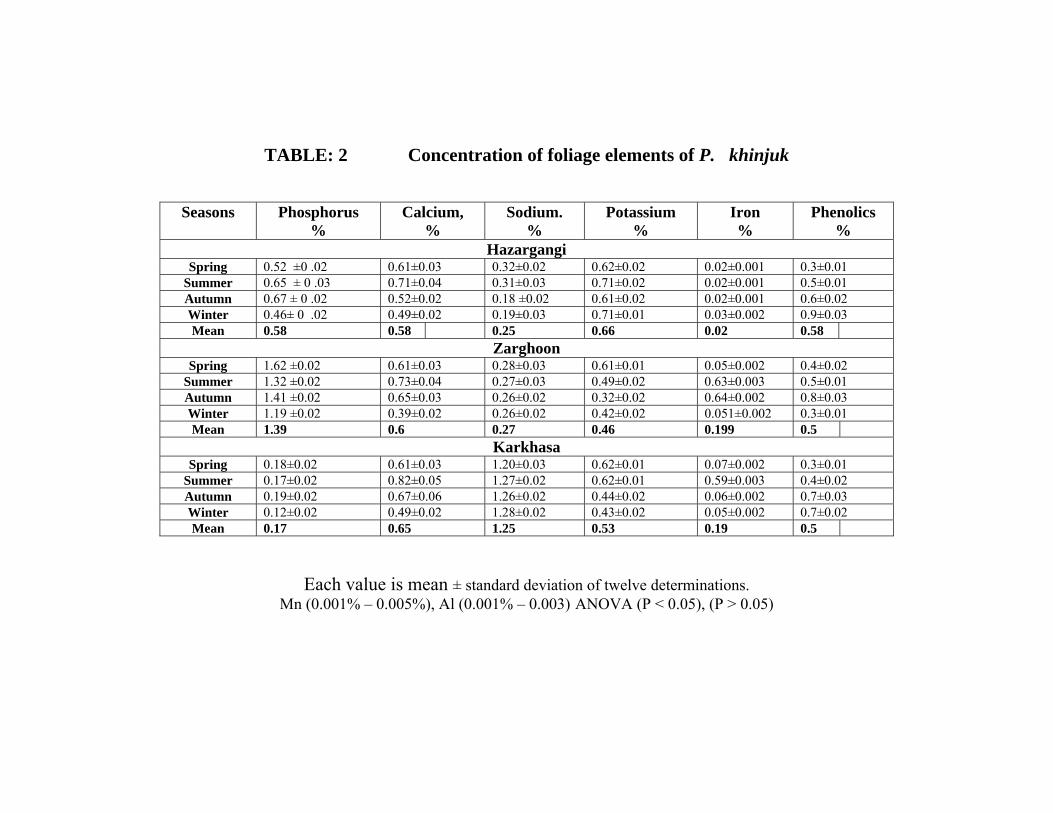
TABLE: 2 Concentration of foliage elements of P. khinjuk
Seasons Phosphorus %
Calcium, %
Sodium. %
Potassium %
Iron %
Phenolics %
Hazargangi Spring 0.52 ±0 .02 0.61±0.03 0.32±0.02 0.62±0.02 0.02±0.001 0.3±0.01
Summer 0.65 ± 0 .03 0.71±0.04 0.31±0.03 0.71±0.02 0.02±0.001 0.5±0.01 Autumn 0.67 ± 0 .02 0.52±0.02 0.18 ±0.02 0.61±0.02 0.02±0.001 0.6±0.02 Winter 0.46± 0 .02 0.49±0.02 0.19±0.03 0.71±0.01 0.03±0.002 0.9±0.03 Mean 0.58 0.58 0.25 0.66 0.02 0.58
Zarghoon Spring 1.62 ±0.02 0.61±0.03 0.28±0.03 0.61±0.01 0.05±0.002 0.4±0.02
Summer 1.32 ±0.02 0.73±0.04 0.27±0.03 0.49±0.02 0.63±0.003 0.5±0.01 Autumn 1.41 ±0.02 0.65±0.03 0.26±0.02 0.32±0.02 0.64±0.002 0.8±0.03 Winter 1.19 ±0.02 0.39±0.02 0.26±0.02 0.42±0.02 0.051±0.002 0.3±0.01 Mean 1.39 0.6 0.27 0.46 0.199 0.5
Karkhasa Spring 0.18±0.02 0.61±0.03 1.20±0.03 0.62±0.01 0.07±0.002 0.3±0.01
Summer 0.17±0.02 0.82±0.05 1.27±0.02 0.62±0.01 0.59±0.003 0.4±0.02 Autumn 0.19±0.02 0.67±0.06 1.26±0.02 0.44±0.02 0.06±0.002 0.7±0.03 Winter 0.12±0.02 0.49±0.02 1.28±0.02 0.43±0.02 0.05±0.002 0.7±0.02 Mean 0.17 0.65 1.25 0.53 0.19 0.5
Each value is mean ± standard deviation of twelve determinations. Mn (0.001% – 0.005%), Al (0.001% – 0.003) ANOVA (P < 0.05), (P > 0.05)
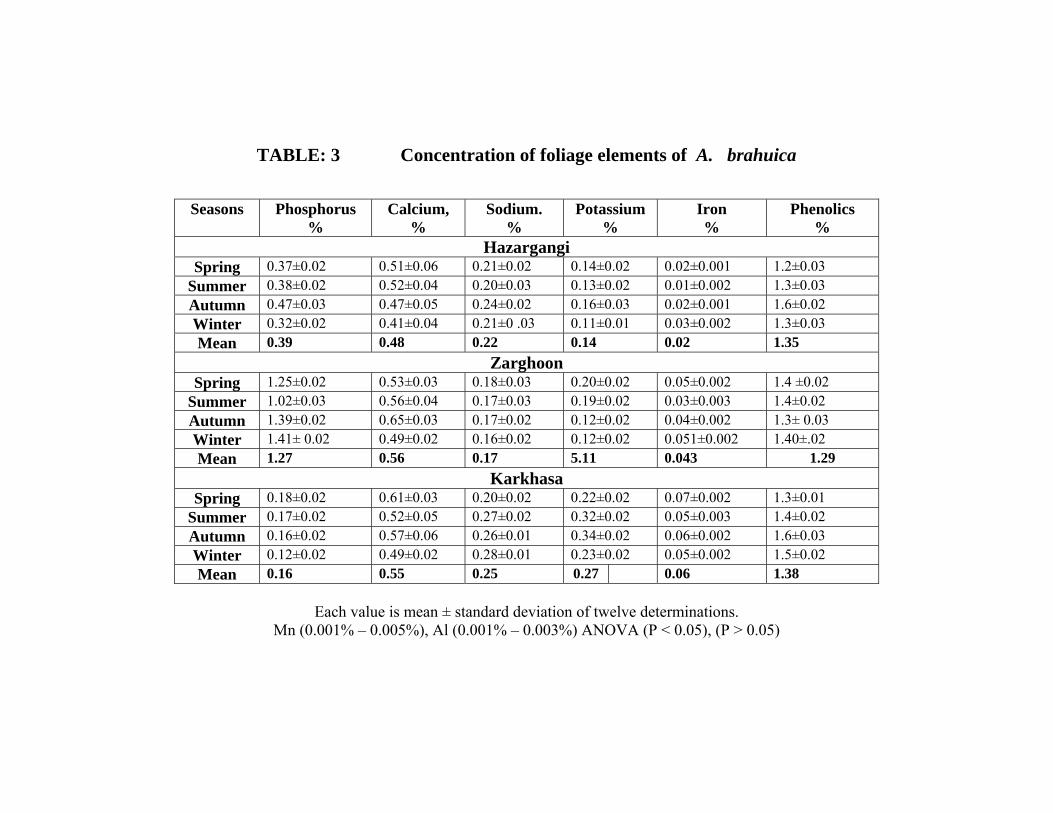
TABLE: 3 Concentration of foliage elements of A. brahuica
Seasons Phosphorus %
Calcium, %
Sodium. %
Potassium %
Iron %
Phenolics %
Hazargangi Spring 0.37±0.02 0.51±0.06 0.21±0.02 0.14±0.02 0.02±0.001 1.2±0.03
Summer 0.38±0.02 0.52±0.04 0.20±0.03 0.13±0.02 0.01±0.002 1.3±0.03 Autumn 0.47±0.03 0.47±0.05 0.24±0.02 0.16±0.03 0.02±0.001 1.6±0.02 Winter 0.32±0.02 0.41±0.04 0.21±0 .03 0.11±0.01 0.03±0.002 1.3±0.03 Mean 0.39 0.48 0.22 0.14 0.02 1.35
Zarghoon Spring 1.25±0.02 0.53±0.03 0.18±0.03 0.20±0.02 0.05±0.002 1.4 ±0.02
Summer 1.02±0.03 0.56±0.04 0.17±0.03 0.19±0.02 0.03±0.003 1.4±0.02 Autumn 1.39±0.02 0.65±0.03 0.17±0.02 0.12±0.02 0.04±0.002 1.3± 0.03 Winter 1.41± 0.02 0.49±0.02 0.16±0.02 0.12±0.02 0.051±0.002 1.40±.02 Mean 1.27 0.56 0.17 5.11 0.043 1.29
Karkhasa Spring 0.18±0.02 0.61±0.03 0.20±0.02 0.22±0.02 0.07±0.002 1.3±0.01
Summer 0.17±0.02 0.52±0.05 0.27±0.02 0.32±0.02 0.05±0.003 1.4±0.02 Autumn 0.16±0.02 0.57±0.06 0.26±0.01 0.34±0.02 0.06±0.002 1.6±0.03 Winter 0.12±0.02 0.49±0.02 0.28±0.01 0.23±0.02 0.05±0.002 1.5±0.02 Mean 0.16 0.55 0.25 0.27 0.06 1.38
Each value is mean ± standard deviation of twelve determinations.
Mn (0.001% – 0.005%), Al (0.001% – 0.003%) ANOVA (P < 0.05), (P > 0.05)
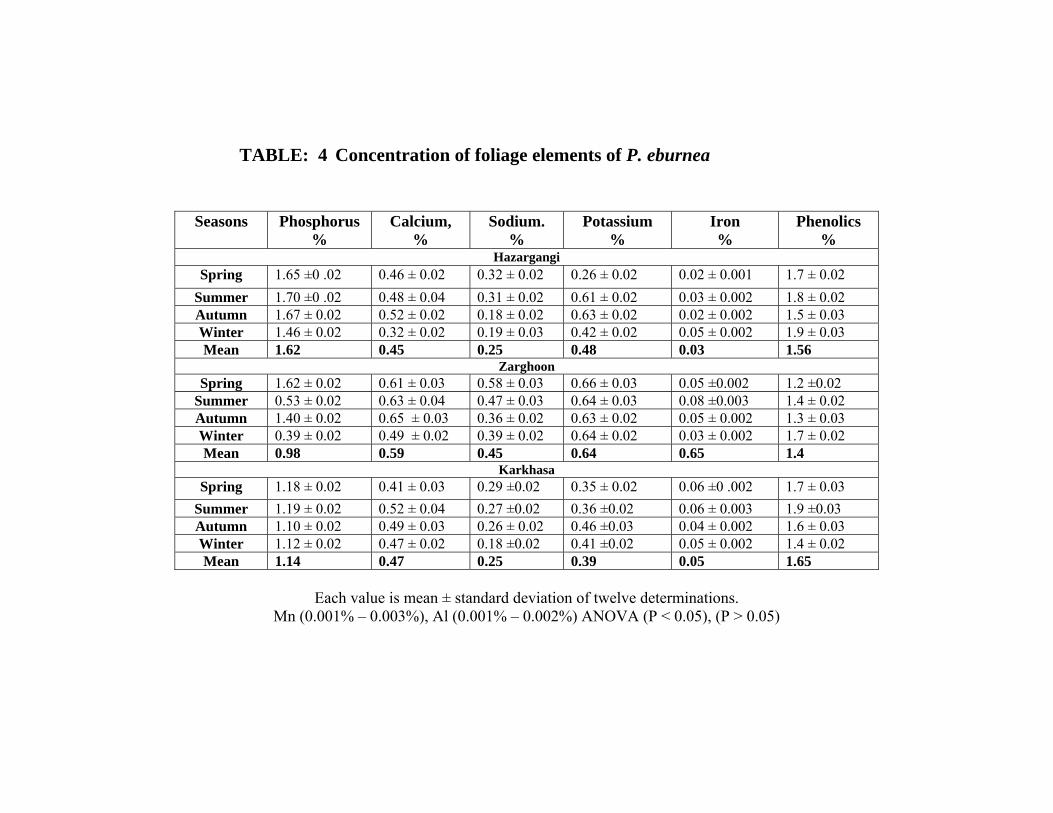
TABLE: 4 Concentration of foliage elements of P. eburnea
Seasons Phosphorus %
Calcium, %
Sodium. %
Potassium %
Iron %
Phenolics %
Hazargangi Spring 1.65 ±0 .02 0.46 ± 0.02 0.32 ± 0.02 0.26 ± 0.02 0.02 ± 0.001 1.7 ± 0.02
Summer 1.70 ±0 .02 0.48 ± 0.04 0.31 ± 0.02 0.61 ± 0.02 0.03 ± 0.002 1.8 ± 0.02 Autumn 1.67 ± 0.02 0.52 ± 0.02 0.18 ± 0.02 0.63 ± 0.02 0.02 ± 0.002 1.5 ± 0.03 Winter 1.46 ± 0.02 0.32 ± 0.02 0.19 ± 0.03 0.42 ± 0.02 0.05 ± 0.002 1.9 ± 0.03 Mean 1.62 0.45 0.25 0.48 0.03 1.56
Zarghoon Spring 1.62 ± 0.02 0.61 ± 0.03 0.58 ± 0.03 0.66 ± 0.03 0.05 ±0.002 1.2 ±0.02
Summer 0.53 ± 0.02 0.63 ± 0.04 0.47 ± 0.03 0.64 ± 0.03 0.08 ±0.003 1.4 ± 0.02 Autumn 1.40 ± 0.02 0.65 ± 0.03 0.36 ± 0.02 0.63 ± 0.02 0.05 ± 0.002 1.3 ± 0.03 Winter 0.39 ± 0.02 0.49 ± 0.02 0.39 ± 0.02 0.64 ± 0.02 0.03 ± 0.002 1.7 ± 0.02 Mean 0.98 0.59 0.45 0.64 0.65 1.4
KarkhasaSpring 1.18 ± 0.02 0.41 ± 0.03 0.29 ±0.02 0.35 ± 0.02 0.06 ±0 .002 1.7 ± 0.03
Summer 1.19 ± 0.02 0.52 ± 0.04 0.27 ±0.02 0.36 ±0.02 0.06 ± 0.003 1.9 ±0.03 Autumn 1.10 ± 0.02 0.49 ± 0.03 0.26 ± 0.02 0.46 ±0.03 0.04 ± 0.002 1.6 ± 0.03 Winter 1.12 ± 0.02 0.47 ± 0.02 0.18 ±0.02 0.41 ±0.02 0.05 ± 0.002 1.4 ± 0.02 Mean 1.14 0.47 0.25 0.39 0.05 1.65
Each value is mean ± standard deviation of twelve determinations.
Mn (0.001% – 0.003%), Al (0.001% – 0.002%) ANOVA (P < 0.05), (P > 0.05)
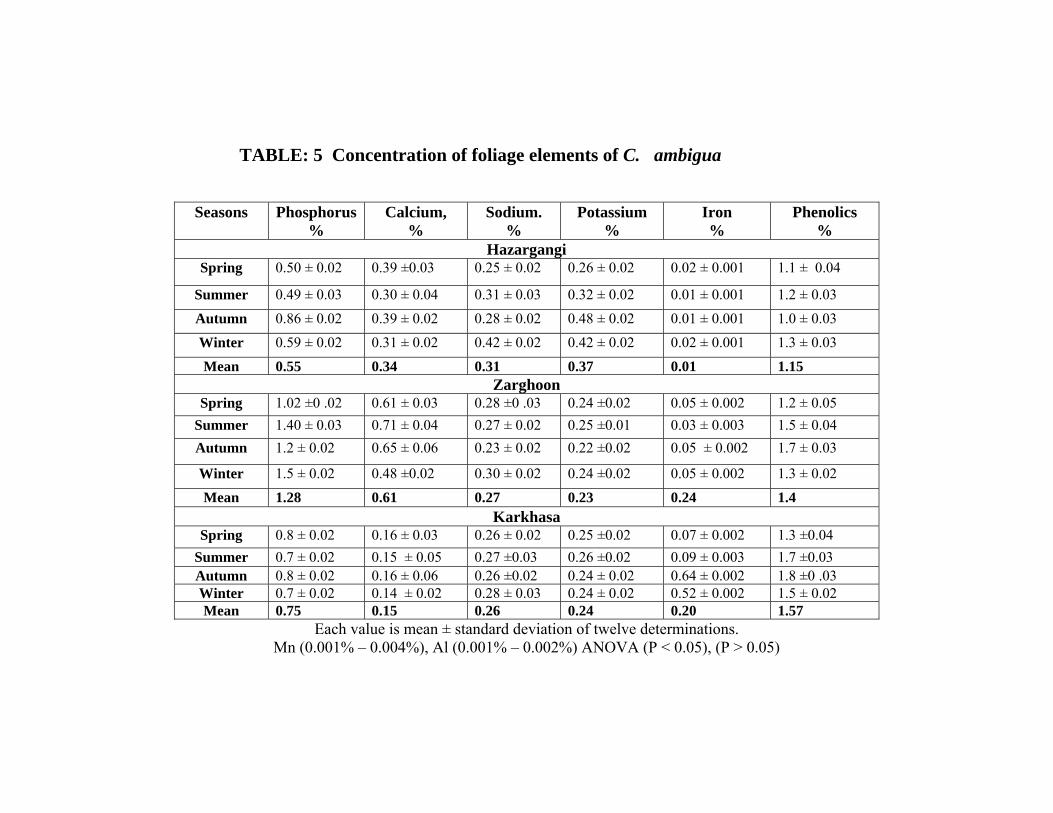
TABLE: 5 Concentration of foliage elements of C. ambigua
Seasons Phosphorus%
Calcium, %
Sodium. %
Potassium %
Iron %
Phenolics %
Hazargangi Spring 0.50 ± 0.02 0.39 ±0.03 0.25 ± 0.02 0.26 ± 0.02 0.02 ± 0.001 1.1 ± 0.04
Summer 0.49 ± 0.03 0.30 ± 0.04 0.31 ± 0.03 0.32 ± 0.02 0.01 ± 0.001 1.2 ± 0.03
Autumn 0.86 ± 0.02 0.39 ± 0.02 0.28 ± 0.02 0.48 ± 0.02 0.01 ± 0.001 1.0 ± 0.03
Winter 0.59 ± 0.02 0.31 ± 0.02 0.42 ± 0.02 0.42 ± 0.02 0.02 ± 0.001 1.3 ± 0.03
Mean 0.55 0.34 0.31 0.37 0.01 1.15 Zarghoon
Spring 1.02 ±0 .02 0.61 ± 0.03 0.28 ±0 .03 0.24 ±0.02 0.05 ± 0.002 1.2 ± 0.05 Summer 1.40 ± 0.03 0.71 ± 0.04 0.27 ± 0.02 0.25 ±0.01 0.03 ± 0.003 1.5 ± 0.04 Autumn 1.2 ± 0.02 0.65 ± 0.06 0.23 ± 0.02 0.22 ±0.02 0.05 ± 0.002 1.7 ± 0.03
Winter 1.5 ± 0.02 0.48 ±0.02 0.30 ± 0.02 0.24 ±0.02 0.05 ± 0.002 1.3 ± 0.02
Mean 1.28 0.61 0.27 0.23 0.24 1.4 Karkhasa
Spring 0.8 ± 0.02 0.16 ± 0.03 0.26 ± 0.02 0.25 ±0.02 0.07 ± 0.002 1.3 ±0.04 Summer 0.7 ± 0.02 0.15 ± 0.05 0.27 ±0.03 0.26 ±0.02 0.09 ± 0.003 1.7 ±0.03 Autumn 0.8 ± 0.02 0.16 ± 0.06 0.26 ±0.02 0.24 ± 0.02 0.64 ± 0.002 1.8 ±0 .03 Winter 0.7 ± 0.02 0.14 ± 0.02 0.28 ± 0.03 0.24 ± 0.02 0.52 ± 0.002 1.5 ± 0.02 Mean 0.75 0.15 0.26 0.24 0.20 1.57
Each value is mean ± standard deviation of twelve determinations. Mn (0.001% – 0.004%), Al (0.001% – 0.002%) ANOVA (P < 0.05), (P > 0.05)
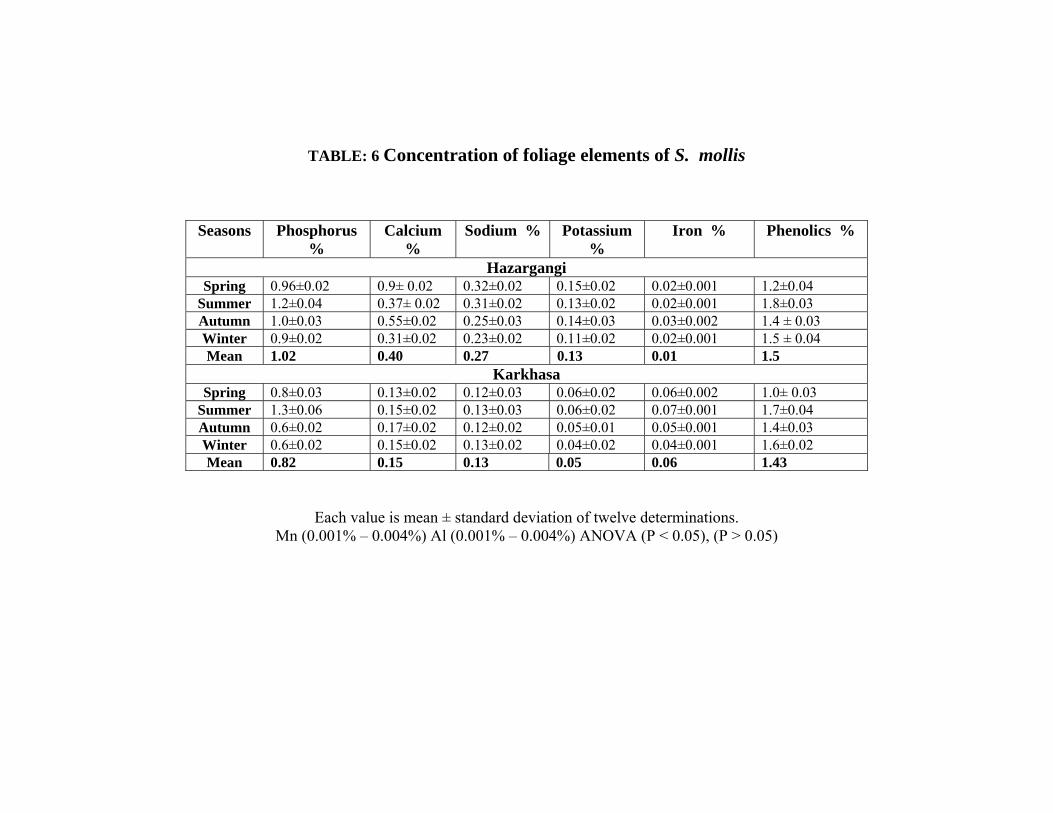
TABLE: 6 Concentration of foliage elements of S. mollis
Seasons Phosphorus %
Calcium %
Sodium % Potassium %
Iron % Phenolics %
Hazargangi Spring 0.96±0.02 0.9± 0.02 0.32±0.02 0.15±0.02 0.02±0.001 1.2±0.04
Summer 1.2±0.04 0.37± 0.02 0.31±0.02 0.13±0.02 0.02±0.001 1.8±0.03 Autumn 1.0±0.03 0.55±0.02 0.25±0.03 0.14±0.03 0.03±0.002 1.4 ± 0.03 Winter 0.9±0.02 0.31±0.02 0.23±0.02 0.11±0.02 0.02±0.001 1.5 ± 0.04 Mean 1.02 0.40 0.27 0.13 0.01 1.5
Karkhasa Spring 0.8±0.03 0.13±0.02 0.12±0.03 0.06±0.02 0.06±0.002 1.0± 0.03
Summer 1.3±0.06 0.15±0.02 0.13±0.03 0.06±0.02 0.07±0.001 1.7±0.04 Autumn 0.6±0.02 0.17±0.02 0.12±0.02 0.05±0.01 0.05±0.001 1.4±0.03 Winter 0.6±0.02 0.15±0.02 0.13±0.02 0.04±0.02 0.04±0.001 1.6±0.02 Mean 0.82 0.15 0.13 0.05 0.06 1.43
Each value is mean ± standard deviation of twelve determinations. Mn (0.001% – 0.004%) Al (0.001% – 0.004%) ANOVA (P < 0.05), (P > 0.05)
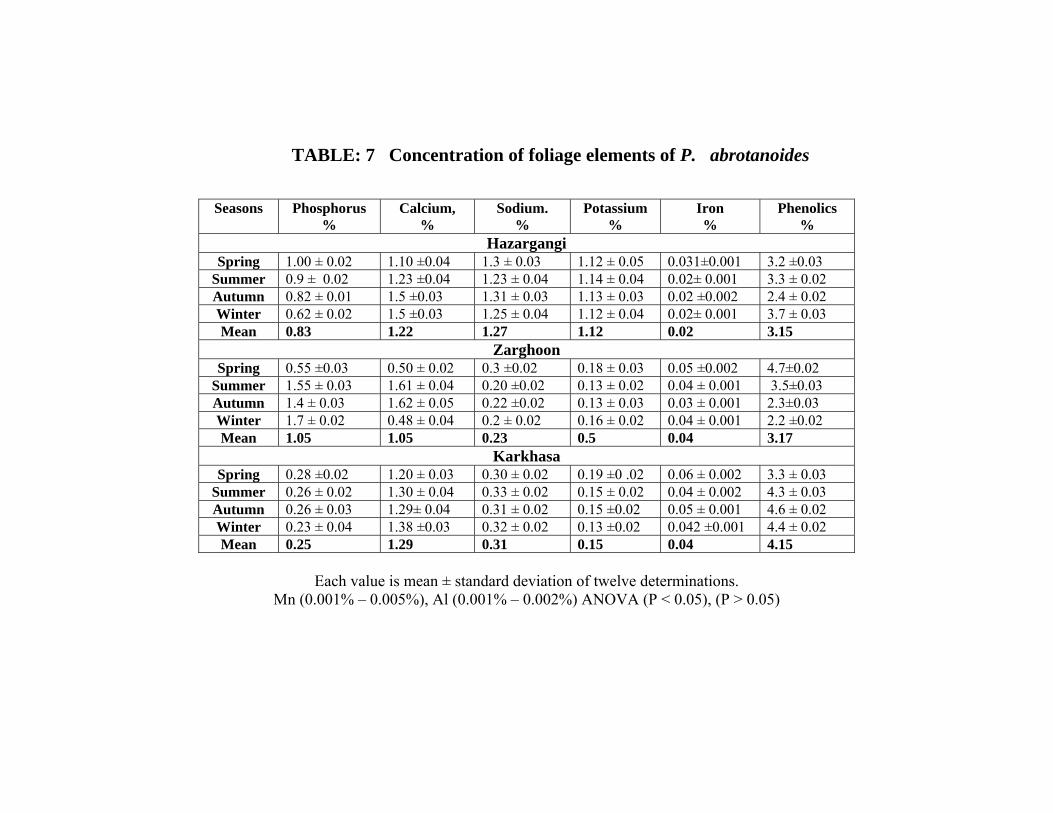
TABLE: 7 Concentration of foliage elements of P. abrotanoides
Seasons Phosphorus %
Calcium, %
Sodium. %
Potassium %
Iron %
Phenolics %
Hazargangi Spring 1.00 ± 0.02 1.10 ±0.04 1.3 ± 0.03 1.12 ± 0.05 0.031±0.001 3.2 ±0.03
Summer 0.9 ± 0.02 1.23 ±0.04 1.23 ± 0.04 1.14 ± 0.04 0.02± 0.001 3.3 ± 0.02 Autumn 0.82 ± 0.01 1.5 ±0.03 1.31 ± 0.03 1.13 ± 0.03 0.02 ±0.002 2.4 ± 0.02 Winter 0.62 ± 0.02 1.5 ±0.03 1.25 ± 0.04 1.12 ± 0.04 0.02± 0.001 3.7 ± 0.03 Mean 0.83 1.22 1.27 1.12 0.02 3.15
Zarghoon Spring 0.55 ±0.03 0.50 ± 0.02 0.3 ±0.02 0.18 ± 0.03 0.05 ±0.002 4.7±0.02
Summer 1.55 ± 0.03 1.61 ± 0.04 0.20 ±0.02 0.13 ± 0.02 0.04 ± 0.001 3.5±0.03 Autumn 1.4 ± 0.03 1.62 ± 0.05 0.22 ±0.02 0.13 ± 0.03 0.03 ± 0.001 2.3±0.03 Winter 1.7 ± 0.02 0.48 ± 0.04 0.2 ± 0.02 0.16 ± 0.02 0.04 ± 0.001 2.2 ±0.02 Mean 1.05 1.05 0.23 0.5 0.04 3.17
Karkhasa Spring 0.28 ±0.02 1.20 ± 0.03 0.30 ± 0.02 0.19 ±0 .02 0.06 ± 0.002 3.3 ± 0.03
Summer 0.26 ± 0.02 1.30 ± 0.04 0.33 ± 0.02 0.15 ± 0.02 0.04 ± 0.002 4.3 ± 0.03 Autumn 0.26 ± 0.03 1.29± 0.04 0.31 ± 0.02 0.15 ±0.02 0.05 ± 0.001 4.6 ± 0.02 Winter 0.23 ± 0.04 1.38 ±0.03 0.32 ± 0.02 0.13 ±0.02 0.042 ±0.001 4.4 ± 0.02 Mean 0.25 1.29 0.31 0.15 0.04 4.15
Each value is mean ± standard deviation of twelve determinations.
Mn (0.001% – 0.005%), Al (0.001% – 0.002%) ANOVA (P < 0.05), (P > 0.05)
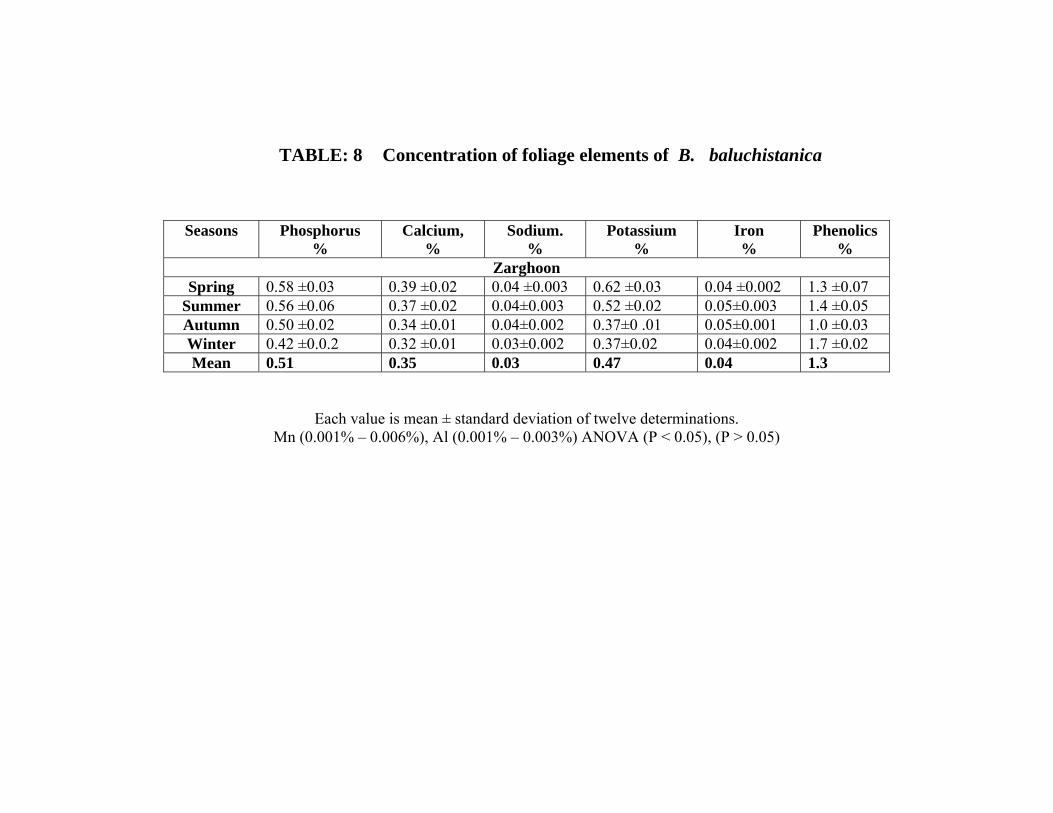
TABLE: 8 Concentration of foliage elements of B. baluchistanica
Seasons Phosphorus %
Calcium, %
Sodium. %
Potassium %
Iron %
Phenolics %
Zarghoon Spring 0.58 ±0.03 0.39 ±0.02 0.04 ±0.003 0.62 ±0.03 0.04 ±0.002 1.3 ±0.07
Summer 0.56 ±0.06 0.37 ±0.02 0.04±0.003 0.52 ±0.02 0.05±0.003 1.4 ±0.05 Autumn 0.50 ±0.02 0.34 ±0.01 0.04±0.002 0.37±0 .01 0.05±0.001 1.0 ±0.03 Winter 0.42 ±0.0.2 0.32 ±0.01 0.03±0.002 0.37±0.02 0.04±0.002 1.7 ±0.02 Mean 0.51 0.35 0.03 0.47 0.04 1.3
Each value is mean ± standard deviation of twelve determinations. Mn (0.001% – 0.006%), Al (0.001% – 0.003%) ANOVA (P < 0.05), (P > 0.05)
4.2 Anti nutritional Studies
Phenolics of two trees and six shrub species were analyzed from
three habitats of Quetta and are presented in (Tables 1 – 8).
The amount of phenolics in tree ranged from (0.2%-0.9%) DM
(Table 1 and 2). High contents of phenolics were recorded from P. khinjuk
(0.9-0.3%) as compared to F. xanthoxyloides (0.2%-0.7%). These amounts
were lower than that reported by Niknam and Ebrahimzadeh (2002). It was
observed that animals do not prefer to eat P. khinjuk, may be due to high
phenolics. Phenolics have both primary and secondary deterrence causes a
predator to reject a plant because of its bitter taste or offensive odor.
Secondary deterrence involves inducing uneasiness in the animals, which
lead the rejection of plants, Grey et al., (1997).
However the amount of phenolics found in shrubs were significantly
higher than those found in trees. Shrubs contain (1.0 - 4.9%) DM of
phenolics. Highest phenol content was observed in P. abrotanoides
(4.9 -2.2%). P. ebrunea (1.9%) DM, C. ambigua (1.8%) DM and S. mollis
(1.8%) DM also showed medium amount of phenolics. While lowest was
found in A. brahuica (1.6 - 1.2%) DM. B. baluchistanica also had low
phenolics contents (1.7%) DM, although this plant is not found in these two
localities so, this plant was only collected and analyzed from Zarghoon.
Results were significantly different from tree species (P < 0.05). Similar
amount of phenolics were recorded from Niknam and Ebrahimzadeh (2002)
from Astragalus species of Iran. The amount of phenolics increases
gradually in summer, winter and autumn season. Domestic animals and
wild ruminants avoid to graze P. abrotanoides, it may be due to the reason
that the high amount of phenolics present in its foliage. Sheep are less
adapted to digest anti-nutritional rich plants, Kumar and Vaithiyanathan
(1990).
The result of this study, along with the results of other scientists
Ebrahimazeh et al., (1999); Ebrahimazeh et al.,(2002); Niknam and
Ebrahimzadeh (2002), can be used for selection of desirable species of
forage, to restore overgrazed range, control erosion, and can replace
undesirable plants in Quetta.
However variations in contents of plant secondary metabolites are
effected by many factors. There may be genetic components to such
variations Bowers and Stamp (1992), but the genotype can be modified by
a variety of biotic and abiotic features. Niknam and Ebrahimzadeh (2002)
suggested that seasonal changes in biochemistry caused by shifting patterns
of resource allocation that reflect different physiological demands
associated with growth, defense and reproduction. However, at the same
time a diversity of environmental stresses contribute to spatial variation
within and among populations Waterman and Mole (1994); Dudt and Shure
(1994).
Schroder (1986) stated that leaf nutrients (nitrogen, sugar, and water
contents) are negatively correlated with the amounts of anti nutrients
(phenolics and fibers) these increase with leaf maturity. The significant
changes in leaf water, nitrogen, or sugar content occurred between spring
and summer. The amount of these compounds present in shrub varies with
the kind of tissue, the age or stage of development, and the season. Similar
results were found in this study, the amount of phenolics increased in
autumn and winter seasons while more nutritional content were found
during spring and summer seasons. Barry and Fross (1983) concluded that
concentration of anti- nutritional compounds in plants is often increased by
low soil fertility, high light intensity, high temperature and drought.
Some shrubs have high level of soluble phenolics and tannins that
can reduce protein digestibility and retention Moukld and Robbins (1981);
Nastis and Malchek (1981) and Robinson (1982). Plants with high
phenolics like P. abrotanoides were not like by the animal, as some of
these substances are poisonous; this is not the primary reason for
avoidance because some poisonous plants are selectively eaten. This
character may develop with maturity, and un-palatability can also advance
with age due to increased fibrousness, similar results were found by
Arnold (1981). The accumulation of tannin in plants as a chemical defense
plays an important role against vertebrates and invertebrate herbivores,
Haslam (1988) and Garry et al., (1994). The amount of condensed
phenolics and tannins in the foliage may vary with genotype, Garry et al.,
(1994); although changes in physical environmental factors such as
climate, Jonasson et al., (1986); Horner et al., (1988); Mole and Joern
(1993); light, Bryant et al., (1987); water availability, Gershenzon, (1984);
and soil fertility, Dustin and Cooper-Driver (1992) and Northup et al.,
(1995).
4.3 Nutritional Studies
a) Ash Content Two dominant trees and six shrubs of Quetta valley from three
habitats were evaluated for their ash content. The fresh weight, dry weight
and ash content of two tree species (Table 9 and 10) and six shrub species
(Table 11-16).
The results of trees showed that ash content in F. xanthoxyloides
ranged from 0.522mg–0.302/10 gm. Maximum ash content were found
during spring season while lowest was found during winter season. Almost
equal amount of ash was recorded from all three localities.
P. khinjuk showed high ash content it ranged from
0.532mg–0.436/10gm. Maximum ash content was found in autumn season
and low amount was found in spring, however Zarghoon was the area in
which high amount of ash was observed. P. khinjuk had high ash content
as compare to F. xanthoxyloides, and both species are non significant
(P < 0.05) in all three habitats. Dry weight in P. khinjuk ranged between
4.7 - 5.8 mg while in F. xanthoxyloides it ranged between 5.5 - 4.6 mg in
P. khinjuk. More or less the amount of dry matter was similar in all three
habitats.
In case of shrub species maximum ash content ranged between
0.592mg - 0.400/10gm. Maximum amount (0.592) was recorded in
S. mollis from Hazargangi this might be due to that S. mollis leaves has
thick cuticle that increases the thickness of leaves. S. mollis is used as fuel
or green manure and as pesticide by the burning of whole plant to the local
people. The minimum amount (0.400mg/10gm) was recorded from
C. ambigua during winter season from Karkhasa and medium amount
(0.497mg/10gm) was noted in A. brahuica and P. abrotanoides from
Karkhasa (Table 11 and 15). The amount of ash (5.23mg/10 gm) was found
from B. baluchistanica and light red to whitish in color that might be due
to the red coloring pigment present in stem and mid vein of leaves.
P. eburnea showed medium amount (0.463mg/10gm), almost all three
habitats showed more or less equal amount of ash content. Species are non
significant at (P < 0.05) level.
The maximum dry weight (5.8mg/10 gm) was calculated in S. mollis
from Karkhasa and lowest amount was noted in A. brahuica (4.8mg /10gm)
the medium amount was in A. brahuica in Karkhasa and Zarghoon
respectively. Almost all of the mineral content of plants is recovered in the
ash; ash gives an indication of the total mineral content, but may be
misleading because of high levels of silica or other no nutrient elements.
b) Carbohydrates
Carbohydrates of two trees and six shrubs leaves were determined
from three habitats of Quetta district during four seasons (Table 9 – 16).
High amount of carbohydrate (15.32%) DM was found in
F. xanthoxyloides from Zarghoon during summer season. Medium amount
(14.60%) DM was found from P. khinjuk during autumn season from
Zarghoon, while minimum amount (10.20%) DM was also recorded from
P. khinjuk during spring season. However different habitats showed high
significant differences in carbohydrates concentration (P > 0.05). Zarghoon
was the best area for both the tree species for the accumulation of
carbohydrate. My findings were similar and comparable with the result of
Norton (1981), he reported that 10% carbohydrate is the minimum required
amount for the effective lactic acid formation, and low amount leads to
poor fodder fermentation.
In shrub species the amount of carbohydrate ranged from 19.24% -
12.00% DM (Table 11–16). Maximum carbohydrates ranged between
19.24% - 16.72% DM, were recorded from P. eburnea it was (19.24%)
DM, medium amount ranged between15.67% - 14.67% DM and found in
A. brahuica while minimum amount ranged between12.59% - 12.00% DM,
low amount (12.00%) DM was found in P. abrotanoides. In the
B. baluchistanica maximum average amount (17.37%) DM was found,
followed by C. ambigua (15.03%) DM, while in S. mollis it was (13.38%)
DM.
In spring season (19.24%) DM was found in P. eburnea. Same
amount in two shrubs (16.72%) DM was found in P. eburnea and
B. baluchistanica in summer season, winter season responded slightly less
amount of carbohydrate in shrub species. In Hazargangi maximum amount
(19.24%) DM was found in P. eburnea, medium amount (17.37%) DM of
carbohydrate in B. baluchistanica was recorded from Zarghoon, less
amount (14.41%) DM was found in A. brahuica from Karkhasa.
P. eburnea and B. baluchistanica showed average good concentration
(16.2, 17.37%) of carbohydrate in all the seasons from all three habitats.
Therefore, P. eburnea and B. baluchistanica can be regarded as a richest
source of carbohydrate, and all other plants studied also proved to be a
good source of carbohydrate. These carbohydrate contents were remarkably
high than those of mixed herbage (4.2%) and far lower than wheat grains
(70 %) Reuter and Robinson (1986).
Similar findings were observed by Arnold (1964), he concluded that
carbohydrates are completely digested, related to palatability, and
negatively correlated with protein concentration. Almost equal amount
(18%) was recorded by Dahot (1993), from Capparis decidua. Niknam and
Lisar (2004) also found low amount of carbohydrates from Astragalus
species from Iran.
However a large variation in plant carbohydrates was recorded in
other shrub species, this may be due to variations in the content of plant
metabolites appears to be the result of many factors. There may be a genetic
component to such variation, Bowers and Stamp (1992); Niknam and Lisar
(2004), but the genotype can be modified by a variety of biotic and abiotic
features. It might be seasonal changes in biochemical characteristics are
caused by shifting patterns of resource allocation that reflect different
physiological demands associated with growth, defense and reproduction.
At the same time, a diversity of environmental stresses such as drought,
rain fall, altitudes, temperature contributes to spatial variation with in and
among populations, Waterman and Mole (1994).
Similar investigations were found by Ebrahimzadeh et al., (1999);
Ebrahimzadeh et al., (2000); Niknam and Ebrahimzadeh (2002); Niknam et
al., (2003) and Niknam and Lisar (2004), can be used for selection of
desirable species for forage purpose to restore overgrazed range, control
erosion and replace desirable plants. Carbohydrates and fats is the basic
source of energy for the small grazing ruminant but these consume able
energy may not be entirely usefully for them.
c) Crude Protein and Nitrogen
Almost same amount of crude protein and nitrogen was found in
leave samples although analysis through different methods. Fodder tree and
shrubs have always played a significant role in feeding domestic animals.
In fact, tree and shrubs are increasingly recognized as important
components of animal feeding, particularly as suppliers of protein and
especially in harsh environmental conditions. In such situations, the
available grazing is not generally sufficient to meet the maintenance
requirements of animals, at least for part of the year. In arid and semi arid
areas, the availability and quality of the forage determines the livestock
production. Rainfall and drought directly affect forage yields and grazing
pressure on various range sites, but rain fall and lack of it, plays an
important role in the utilization of less palatable browse plants.
The main features of browse plants are high crude protein (CP) and
mineral contents. Hence crude protein concentration may be misleading as
an indicator of nutritive value of these species Nuñez- Hernández et al., (1989).
High Crude protein and nitrogen contents of all trees and shrubs
leaves from three localities were analysis during four seasons (Table 9–16).
The tree leave had mean high crude protein (18.25%) DM, in
F. xanthoxyloides crude protein was higher (21.36%) DM and significantly
different (P > 0.05) in summer seasons from Zarghoon. These were more
then that found in P. khinjuk. Similarly crude protein of P. khinjuk showed
(18.72%) DM and significantly different (P > 0.05) from Zarghoon during
autumn season. Crude protein in trees were higher (13–14%) than those
found in shrubs (10–20 %). These were not much affected by the season
and were non-significantly high during summer season, it gradually
decrease dry season. Similar findings were observed by Forwood and
Owensby (1985) they suggested that withdrawal of protein from leaves to
the branches shortly before leaf abscission may explain the leaf protein
decline.
The maximum crude protein in shrubs ranged between 19.38% –
17.42 % DM, these were recorded from P. eburnea (19.38%) and
B. baluchistanica (19.35%) from Zarghoon during autumn season.
A. brahuica and C. ambigua contained medium amount of crude protein
ranged between 16–14% DM basis, while S. mollis and P. abrotanoides
had low amount ranged between 12–10% DM.
Among shrubs average maximum crude protein (18.21%) was found
in P. eburnea leaves followed by B. baluchistanica (17.74%). The crude
protein values found in this study was comparable with the values
(10–28%) reported by Singh (1982), Papachristou and Papanastasis (1994),
Shavo (1997) and Subba (1998). Leaves of P. eburnea and
B. baluchistanica, and C. ambigua contained significantly high amount
(P > 0.05) of crude protein contents during autumn. P. abrotanoides
showed high crude protein during summer and autumn from Zarghoon
only. Generally some plant species are highly nutritious but available only
in limited quantities, while more readily available species are less nutritious
Huston and Pinchak (1993). S. mollis showed low crude protein, although
it is leguminous plant and crude protein content was not significantly
affected by seasons and altitudes. Same results were observed by Tewatia
and Virk (1996), who suggested that some species of family Fabaceae
(Leguminoseae) are the cheap source of protein for both animals and
human beings. Similar findings were observed by Nasrullah et al., (2003);
Wilson (1969) and Nitis (1989), they found that leguminous species contain
more than 25–50% crude protein than non-leguminous plants. Crude
protein in trees and shrubs leave was lower during spring season as
compared to autumn, similarly crude protein of all trees and shrubs leave
were high in winter season.
Crude protein in grasses is low 6– 8% Farooq et al., (1989) compare
to shrubs while these were highest in trees 18.25% DM. The crude protein
recorded from all shrubs was high than those found in grasses, Skarpe and
Bergstrom (1986). These were comparable to the standard table of feed
composition in Japan (2001). Therefore all these plants provide a good
source of protein to animals.
Differences in crude protein content between tree and shrub species
could be mainly due to variations in factors controlling crude protein
accumulation in forage during the growth process. The main factor in
Quetta is severe drought during last four years, due to this crude protein
was less in Hazargangi and Karkhasa and high in Zarghoon, where more
water was available. Martin (1998), found more crude protein during rainy
seasons from some grasses. Our results are contrary to Le Houerou (1992);
he observed more crude protein from arid environment. In drier areas,
forage quality often remains relatively constant through out the year and
sufficient for animal requirements, Danckwerts (1989a), Danckwerts and
Tainton (1996). Turning to inter seasonal variability, forage productivity is
directly related to mean annual rain fall Danckwerts and Tainton (1996). In
arid environments, plant may have adequate protein in relation to other
nutrients when measured as concentrations of total nitrogen, through out
the growing season, Jones and Wilson (1987).
However, some variations in chemical composition between current
findings and literature value could also be due to sample preparation and
climatic influences as forage growth and plant nutrient accumulation,
Rubanza et al., (2003). My findings showed that in tree and shrub species
level of crude protein decreases in winter probably as the plants with draw
these elements for use in the next generation’s similar result were observed
by Skarpe & Bergstrom (1986) and Fadel Elseed (2002).
Therefore it is concluded that all plants studied had high nutritional
values as fodder. Trees had more crude protein as compared to shrubs.
These quantities are more than that found in standard plants and can easily
fulfill the animal’s nutritional requirements.
d) Crude Fiber. The results of crude fiber of two trees and six shrub species were
evaluated during all season from three localities of Quetta are given in
Table (9–16). In tree species it ranged between 17.00– 37.00 % DM, while
in shrubs it range was 16.24–26.10% DM. In tree maximum fiber content
(37.00%) DM was found in F. xanthoxyloides during winter season from
Hazargangi it was significantly different (P > 0.05). In P. khinjuk medium
amount (29.3%) was observed during autumn season from Hazargangi.
However low amount of crude fiber was (17.04%) DM was found in
P. khinjuk from Hazargangi in spring season. As the growth stages
advances the percentage of crude fiber increases in autumn in both tree
species. F. .xanthoxyloides are nutritious for animal feeding in early
season, but it contain large amount of crude fiber as the season matures, so
during winter season crude fiber are digested more slowly and less
completely.
Site conditions are also important for the formation of nutrient
content but in case of crude fiber formation it is negatively correlated with
the digestibility, but frequently this correlation is not significant, Dent and
Aldrich (1963). Seasons and altitude did not affect the formation of fibers,
it might be genetically controlled.
My finding about the tree species indicates the low amount of crude
fiber was present in P. khinjuk as compared to F. xanthoxyloides.
P. khinjuk plant is less nutritious and digestible. It might contain
secondary metabolites, as the plant matures these metabolites increases but
it contain large amount of crude fiber, which increase with the maturation
of leaves, so the P. khinjuk is not palatable for the small ruminant. It might
be due to that fiber digestion takes much time and not completely digested.
Contemporary scientist consider that nutritional value of plant as feed can
be best calculated by the amount of crude protein and crude fiber present in
them Bryant and Kuropat (1983) and Heneidy (1992).
Crude fiber analyzed from six shrubs ranged between 16.00–28.00%
DM. Maximum amount of crude fiber ranged between 22.00–27.00% DM,
was recorded in A. brahuica (27.77%) DM, less amount ranged between
16.24–17.79 % DM, and found in C. ambigua (16.24%) DM.
Crude fiber in leaves of all shrubs was high during autumn and
winter season. In all habitats of the study area more amount of crude fiber
was observed from Zarghoon as compared to Hazargangi, where the
medium amount of crude fiber was recorded, while the lowest amount was
observed from Karkhasa valley. The amount recorded from these trees and
shrub species are comparable to the standard cabbage leaves (27.00%) DM
PARC (1982). Heneidy (2002) also reported high crude fiber (30–36%)
DM from some palatable supplementary feed.
e) Gross Energy
The productivity of the large herbivores depends basically on the
intake of digestible energy and nutrients, not only on the biomass and
species composition of the grazing available, but also on the nutritive
composition and digestibility of the fodder species at any particular time.
All eight plants were analyzed for energy level. Gross energy was
calculated of two dominant trees and six shrub species of Quetta district
during four seasons (Table 9–16). Result indicates the high range of energy
was 4.98–4.81 (Mcal/Kg-DM), and found in F. xanthoxyloides. The
medium amount ranged between 4.61–4.56 (Mcal/Kg-DM) and less amount
ranged between 4.4–4.3 (Mcal/Kg-DM). High amount of gross energy
5.5 (Mcal/Kg-DM) was found during summer season in F. xanthoxyloides.
Low amount was observed 4.1 (Mcal/Kg-DM) in winter season in
F. xanthoxyloides. Medium amount 5.2 (Mcal/Kg-DM) was observed in
autumn in both the tree species from Zarghoon, while from Hazargangi
medium amount 4.54 (Mcal/Kg-DM) of gross energy was found in
P. khinjuk, low amount 4.3 (Mcal/Kg-DM) was noted from Karkhasa
valley. The energy level of trees was similar through out the year but
slightly increases in summer and autumn seasons were recorded. Trees of
Zarghoon area showed slightly better energy level.
In shrub species amount ranged between 4.7–4.29 (Mcal/Kg-DM).
Highest amount was 5.2 (Mcal/Kg-DM) found in P. eburnea and
B. baluchistanica. Medium amount 4.8 (Mcal/Kg-DM) was found in
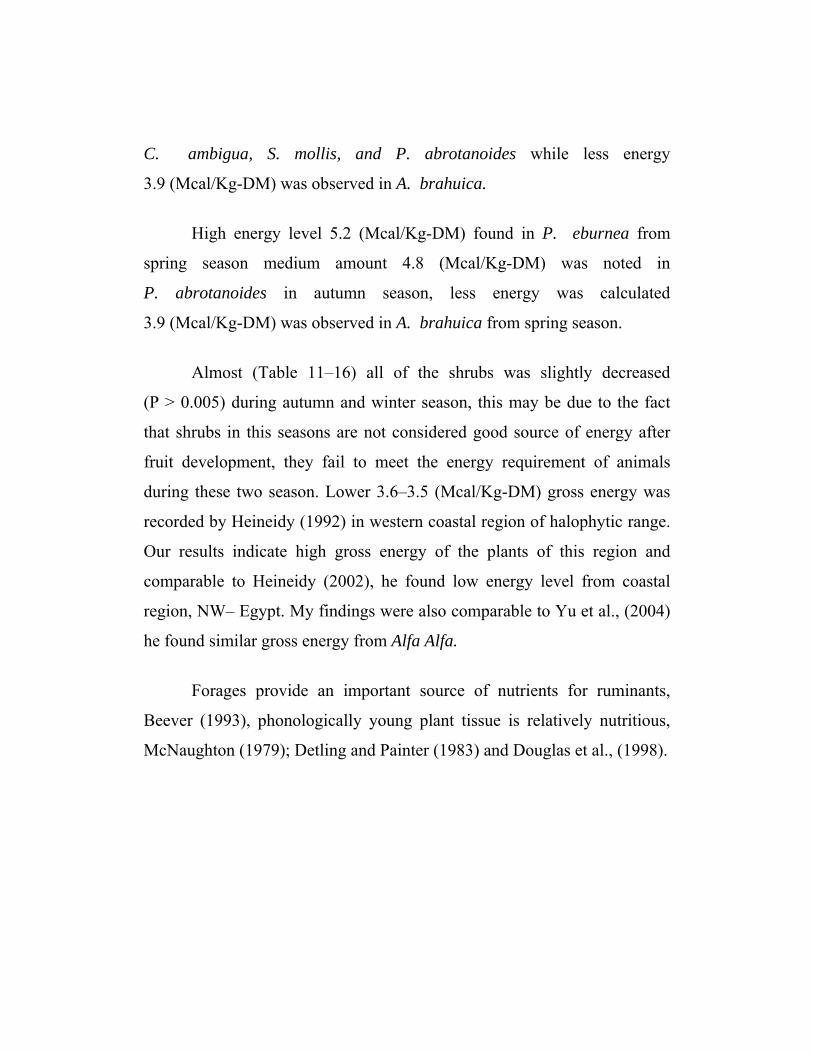
C. ambigua, S. mollis, and P. abrotanoides while less energy
3.9 (Mcal/Kg-DM) was observed in A. brahuica.
High energy level 5.2 (Mcal/Kg-DM) found in P. eburnea from
spring season medium amount 4.8 (Mcal/Kg-DM) was noted in
P. abrotanoides in autumn season, less energy was calculated
3.9 (Mcal/Kg-DM) was observed in A. brahuica from spring season.
Almost (Table 11–16) all of the shrubs was slightly decreased
(P > 0.005) during autumn and winter season, this may be due to the fact
that shrubs in this seasons are not considered good source of energy after
fruit development, they fail to meet the energy requirement of animals
during these two season. Lower 3.6–3.5 (Mcal/Kg-DM) gross energy was
recorded by Heineidy (1992) in western coastal region of halophytic range.
Our results indicate high gross energy of the plants of this region and
comparable to Heineidy (2002), he found low energy level from coastal
region, NW– Egypt. My findings were also comparable to Yu et al., (2004)
he found similar gross energy from Alfa Alfa.
Forages provide an important source of nutrients for ruminants,
Beever (1993), phonologically young plant tissue is relatively nutritious,
McNaughton (1979); Detling and Painter (1983) and Douglas et al., (1998).
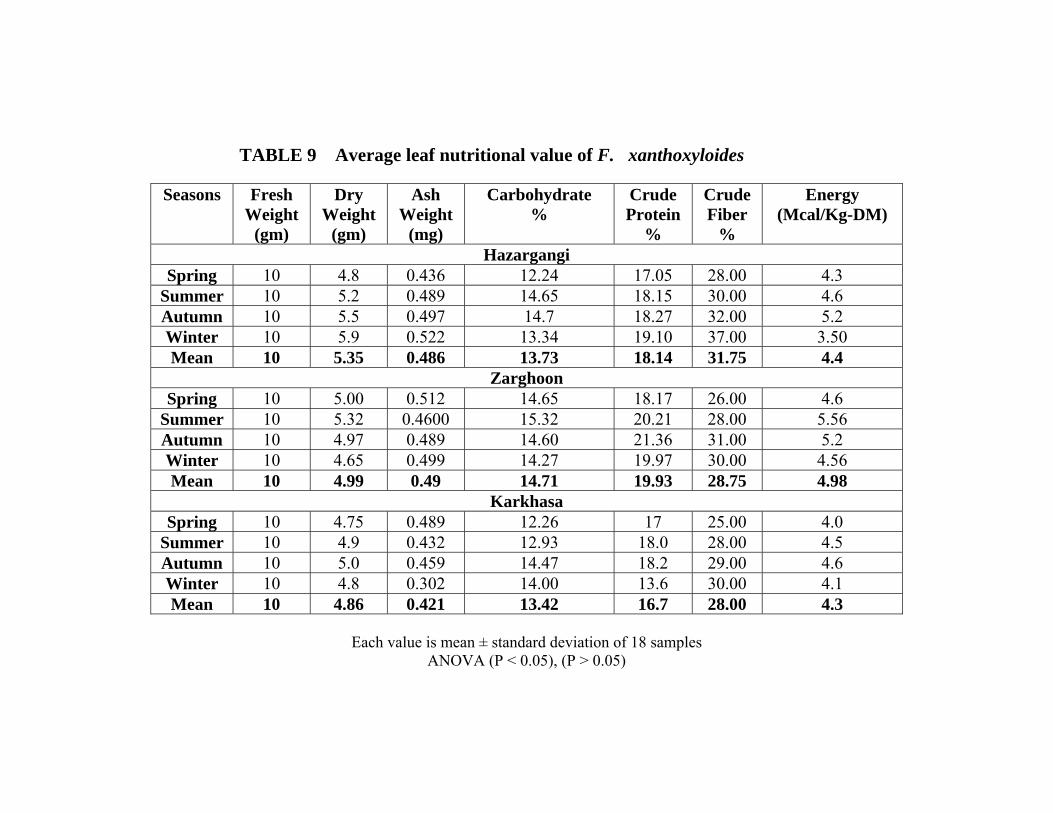
TABLE 9 Average leaf nutritional value of F. xanthoxyloides
Seasons Fresh Weight
(gm)
Dry Weight
(gm)
Ash Weight
(mg)
Carbohydrate %
Crude Protein
%
Crude Fiber
%
Energy (Mcal/Kg-DM)
Hazargangi Spring 10 4.8 0.436 12.24 17.05 28.00 4.3
Summer 10 5.2 0.489 14.65 18.15 30.00 4.6 Autumn 10 5.5 0.497 14.7 18.27 32.00 5.2 Winter 10 5.9 0.522 13.34 19.10 37.00 3.50 Mean 10 5.35 0.486 13.73 18.14 31.75 4.4
Zarghoon Spring 10 5.00 0.512 14.65 18.17 26.00 4.6
Summer 10 5.32 0.4600 15.32 20.21 28.00 5.56 Autumn 10 4.97 0.489 14.60 21.36 31.00 5.2 Winter 10 4.65 0.499 14.27 19.97 30.00 4.56 Mean 10 4.99 0.49 14.71 19.93 28.75 4.98
Karkhasa Spring 10 4.75 0.489 12.26 17 25.00 4.0
Summer 10 4.9 0.432 12.93 18.0 28.00 4.5 Autumn 10 5.0 0.459 14.47 18.2 29.00 4.6 Winter 10 4.8 0.302 14.00 13.6 30.00 4.1 Mean 10 4.86 0.421 13.42 16.7 28.00 4.3
Each value is mean ± standard deviation of 18 samples
ANOVA (P < 0.05), (P > 0.05)
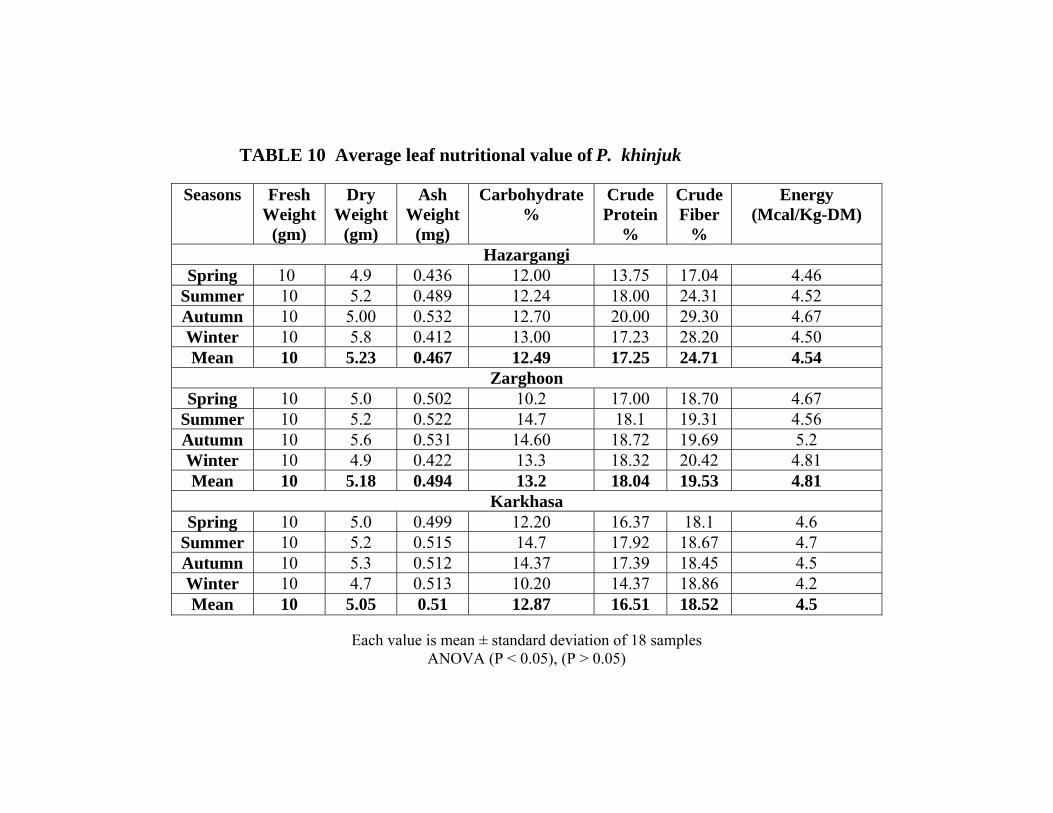
TABLE 10 Average leaf nutritional value of P. khinjuk
Seasons Fresh Weight
(gm)
Dry Weight
(gm)
Ash Weight
(mg)
Carbohydrate %
Crude Protein
%
CrudeFiber
%
Energy (Mcal/Kg-DM)
Hazargangi Spring 10 4.9 0.436 12.00 13.75 17.04 4.46
Summer 10 5.2 0.489 12.24 18.00 24.31 4.52 Autumn 10 5.00 0.532 12.70 20.00 29.30 4.67 Winter 10 5.8 0.412 13.00 17.23 28.20 4.50 Mean 10 5.23 0.467 12.49 17.25 24.71 4.54
Zarghoon Spring 10 5.0 0.502 10.2 17.00 18.70 4.67
Summer 10 5.2 0.522 14.7 18.1 19.31 4.56 Autumn 10 5.6 0.531 14.60 18.72 19.69 5.2 Winter 10 4.9 0.422 13.3 18.32 20.42 4.81 Mean 10 5.18 0.494 13.2 18.04 19.53 4.81
Karkhasa Spring 10 5.0 0.499 12.20 16.37 18.1 4.6
Summer 10 5.2 0.515 14.7 17.92 18.67 4.7 Autumn 10 5.3 0.512 14.37 17.39 18.45 4.5 Winter 10 4.7 0.513 10.20 14.37 18.86 4.2 Mean 10 5.05 0.51 12.87 16.51 18.52 4.5
Each value is mean ± standard deviation of 18 samples
ANOVA (P < 0.05), (P > 0.05)
TABLE 11 Average leaf nutritional value of A. brahuica
Seasons Fresh Weight
(gm)
Dry Weight
(gm)
Ash weight (mg)
Carbohydrate %
Crude Protein
%
CrudeFiber
%
Energy (Mcal/Kg-DM)
Hazargangi Spring 10 4.6 0.531 15.34 14.22 21.0 3.9
Summer 10 4.8 0.522 16.31 15.32 22.12 4.6 Autumn 10 5.1 0.537 16.0 15.32 26.10 4.9 Winter 10 5.0 0.419 14.4 12.42 23.9 4.5 Mean 10 4.88 0.502 15.51 14.32 23.28 4.48
Zarghoon Spring 10 5.0 0.527 15.37 13.39 23.4 4.6
Summer 10 5.1 0.532 15.48 15.26 24.3 4.2 Autumn 10 5.4 0.531 15.56 16.32 26.4 5.1 Winter 10 5.0 0.497 15.03 14.49 27.7 4.7 Mean 10 5.13 0.522 15.36 14.87 25.45 4.65
Karkhasa Spring 10 5.1 0.498 14.41 13.6 19.9 4.7
Summer 10 5.4 0.499 15.49 16.23 20.1 4.4 Autumn 10 5.7 5.0 15.67 17.42 20.62 4.6 Winter 10 4.9 4.97 15.50 15.70 26.37 3.9 Mean 10 5.28 2.742 15.27 15.74 21.75 4.4
Each value is mean ± standard deviation of 18 samples
ANOVA (P < 0.05), (P > 0.05)
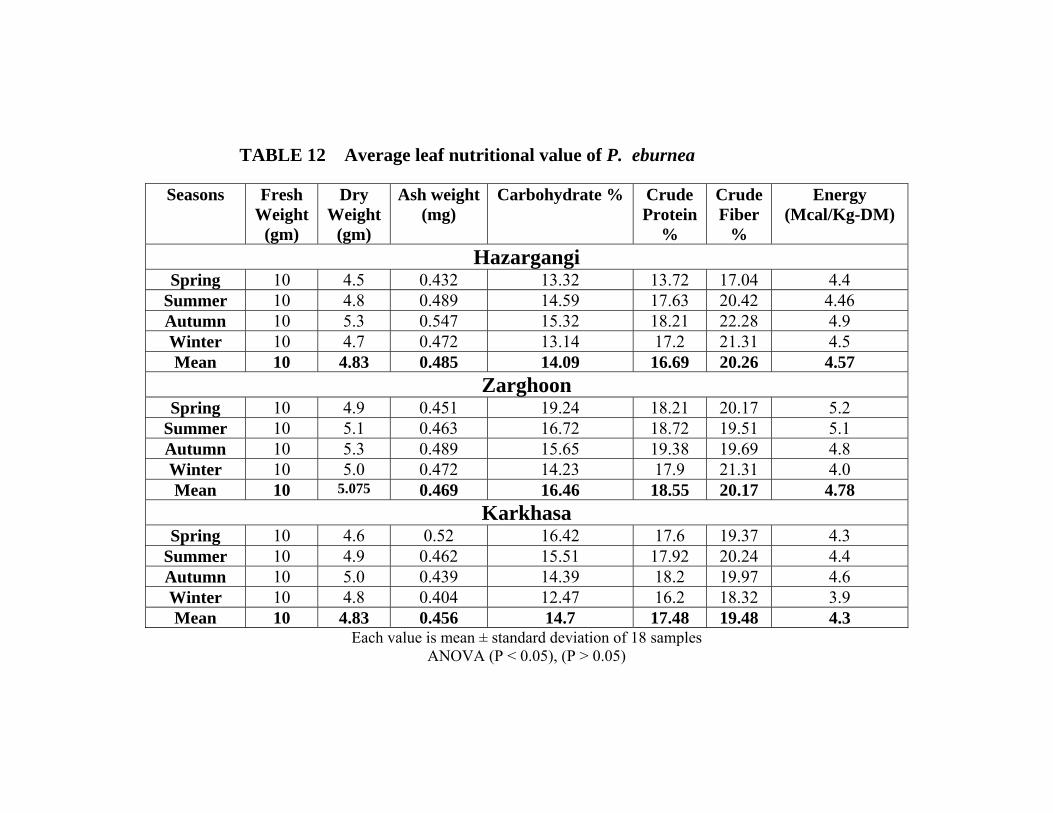
TABLE 12 Average leaf nutritional value of P. eburnea
Seasons Fresh Weight
(gm)
Dry Weight
(gm)
Ash weight(mg)
Carbohydrate % Crude Protein
%
CrudeFiber
%
Energy (Mcal/Kg-DM)
Hazargangi Spring 10 4.5 0.432 13.32 13.72 17.04 4.4
Summer 10 4.8 0.489 14.59 17.63 20.42 4.46 Autumn 10 5.3 0.547 15.32 18.21 22.28 4.9 Winter 10 4.7 0.472 13.14 17.2 21.31 4.5 Mean 10 4.83 0.485 14.09 16.69 20.26 4.57
Zarghoon Spring 10 4.9 0.451 19.24 18.21 20.17 5.2
Summer 10 5.1 0.463 16.72 18.72 19.51 5.1 Autumn 10 5.3 0.489 15.65 19.38 19.69 4.8 Winter 10 5.0 0.472 14.23 17.9 21.31 4.0 Mean 10 5.075 0.469 16.46 18.55 20.17 4.78
Karkhasa Spring 10 4.6 0.52 16.42 17.6 19.37 4.3
Summer 10 4.9 0.462 15.51 17.92 20.24 4.4 Autumn 10 5.0 0.439 14.39 18.2 19.97 4.6 Winter 10 4.8 0.404 12.47 16.2 18.32 3.9 Mean 10 4.83 0.456 14.7 17.48 19.48 4.3
Each value is mean ± standard deviation of 18 samples ANOVA (P < 0.05), (P > 0.05)
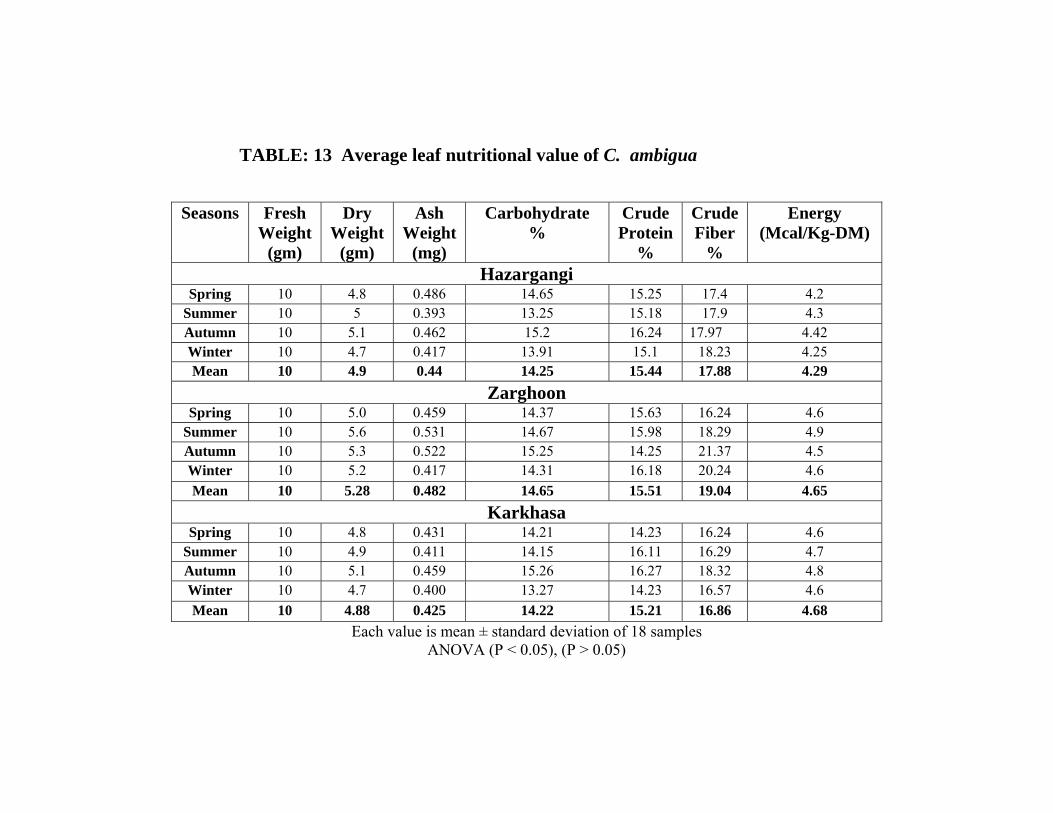
TABLE: 13 Average leaf nutritional value of C. ambigua
Seasons Fresh Weight
(gm)
Dry Weight
(gm)
Ash Weight
(mg)
Carbohydrate %
Crude Protein
%
CrudeFiber
%
Energy (Mcal/Kg-DM)
Hazargangi Spring 10 4.8 0.486 14.65 15.25 17.4 4.2
Summer 10 5 0.393 13.25 15.18 17.9 4.3 Autumn 10 5.1 0.462 15.2 16.24 17.97 4.42 Winter 10 4.7 0.417 13.91 15.1 18.23 4.25 Mean 10 4.9 0.44 14.25 15.44 17.88 4.29
Zarghoon Spring 10 5.0 0.459 14.37 15.63 16.24 4.6
Summer 10 5.6 0.531 14.67 15.98 18.29 4.9 Autumn 10 5.3 0.522 15.25 14.25 21.37 4.5 Winter 10 5.2 0.417 14.31 16.18 20.24 4.6 Mean 10 5.28 0.482 14.65 15.51 19.04 4.65
Karkhasa Spring 10 4.8 0.431 14.21 14.23 16.24 4.6
Summer 10 4.9 0.411 14.15 16.11 16.29 4.7 Autumn 10 5.1 0.459 15.26 16.27 18.32 4.8 Winter 10 4.7 0.400 13.27 14.23 16.57 4.6 Mean 10 4.88 0.425 14.22 15.21 16.86 4.68
Each value is mean ± standard deviation of 18 samples ANOVA (P < 0.05), (P > 0.05)
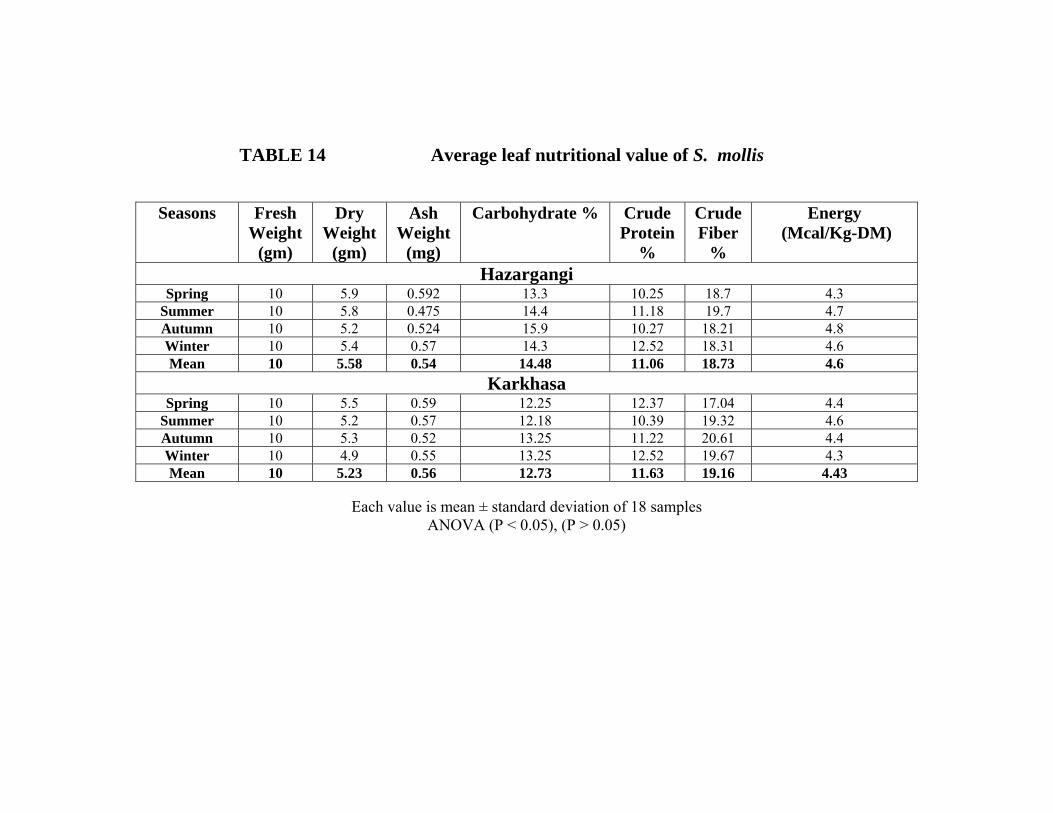
TABLE 14 Average leaf nutritional value of S. mollis
Seasons Fresh Weight
(gm)
Dry Weight
(gm)
Ash Weight
(mg)
Carbohydrate % Crude Protein
%
Crude Fiber
%
Energy (Mcal/Kg-DM)
Hazargangi Spring 10 5.9 0.592 13.3 10.25 18.7 4.3
Summer 10 5.8 0.475 14.4 11.18 19.7 4.7 Autumn 10 5.2 0.524 15.9 10.27 18.21 4.8 Winter 10 5.4 0.57 14.3 12.52 18.31 4.6 Mean 10 5.58 0.54 14.48 11.06 18.73 4.6
Karkhasa Spring 10 5.5 0.59 12.25 12.37 17.04 4.4
Summer 10 5.2 0.57 12.18 10.39 19.32 4.6 Autumn 10 5.3 0.52 13.25 11.22 20.61 4.4 Winter 10 4.9 0.55 13.25 12.52 19.67 4.3 Mean 10 5.23 0.56 12.73 11.63 19.16 4.43
Each value is mean ± standard deviation of 18 samples
ANOVA (P < 0.05), (P > 0.05)
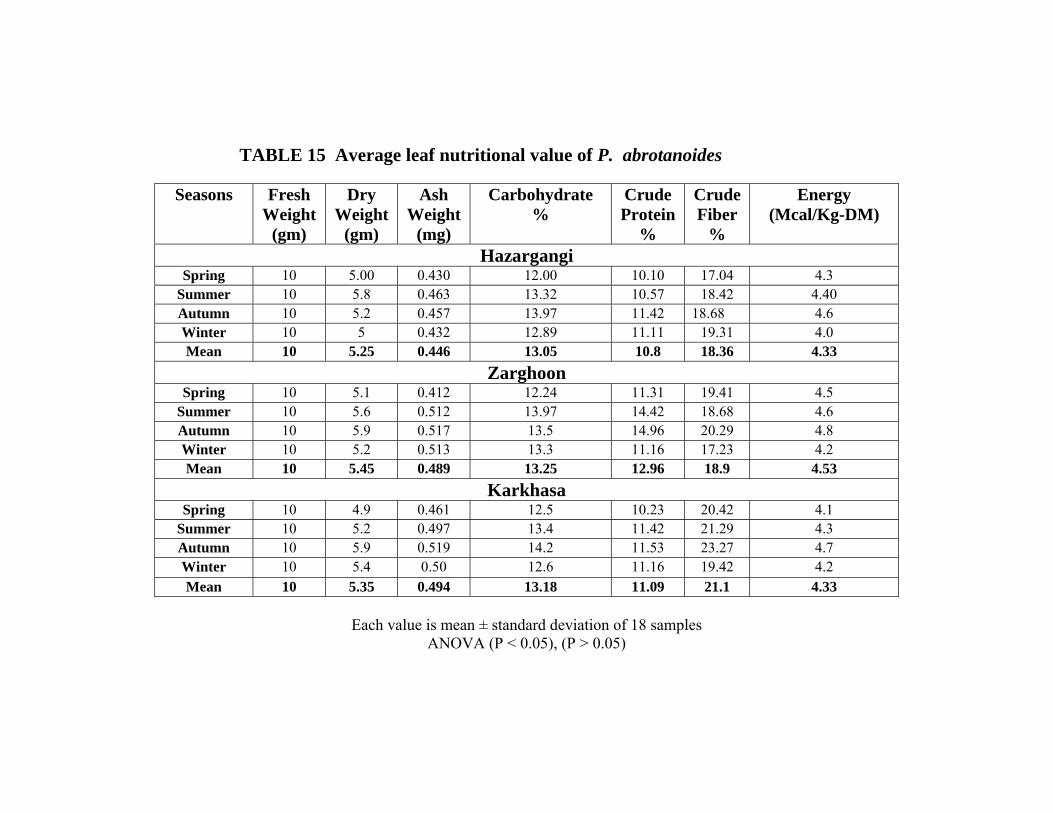
TABLE 15 Average leaf nutritional value of P. abrotanoides
Seasons Fresh Weight
(gm)
Dry Weight
(gm)
Ash Weight
(mg)
Carbohydrate %
Crude Protein
%
CrudeFiber
%
Energy (Mcal/Kg-DM)
Hazargangi Spring 10 5.00 0.430 12.00 10.10 17.04 4.3
Summer 10 5.8 0.463 13.32 10.57 18.42 4.40 Autumn 10 5.2 0.457 13.97 11.42 18.68 4.6 Winter 10 5 0.432 12.89 11.11 19.31 4.0 Mean 10 5.25 0.446 13.05 10.8 18.36 4.33
Zarghoon Spring 10 5.1 0.412 12.24 11.31 19.41 4.5
Summer 10 5.6 0.512 13.97 14.42 18.68 4.6 Autumn 10 5.9 0.517 13.5 14.96 20.29 4.8 Winter 10 5.2 0.513 13.3 11.16 17.23 4.2 Mean 10 5.45 0.489 13.25 12.96 18.9 4.53
Karkhasa Spring 10 4.9 0.461 12.5 10.23 20.42 4.1
Summer 10 5.2 0.497 13.4 11.42 21.29 4.3 Autumn 10 5.9 0.519 14.2 11.53 23.27 4.7 Winter 10 5.4 0.50 12.6 11.16 19.42 4.2 Mean 10 5.35 0.494 13.18 11.09 21.1 4.33
Each value is mean ± standard deviation of 18 samples
ANOVA (P < 0.05), (P > 0.05)
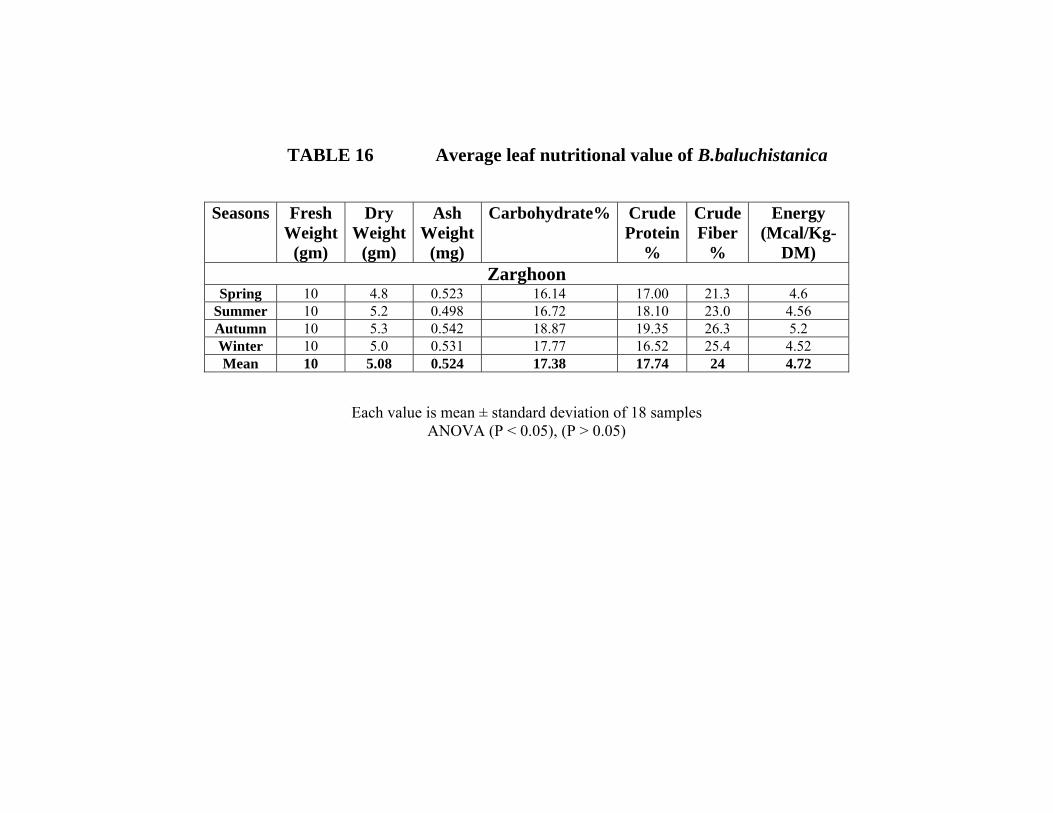
TABLE 16 Average leaf nutritional value of B.baluchistanica
Seasons Fresh Weight
(gm)
Dry Weight
(gm)
Ash Weight
(mg)
Carbohydrate% Crude Protein
%
CrudeFiber
%
Energy (Mcal/Kg-
DM) Zarghoon
Spring 10 4.8 0.523 16.14 17.00 21.3 4.6 Summer 10 5.2 0.498 16.72 18.10 23.0 4.56 Autumn 10 5.3 0.542 18.87 19.35 26.3 5.2 Winter 10 5.0 0.531 17.77 16.52 25.4 4.52 Mean 10 5.08 0.524 17.38 17.74 24 4.72
Each value is mean ± standard deviation of 18 samples ANOVA (P < 0.05), (P > 0.05)
4.4 Feeding Trials
Minerals in forage always play significant role in nutrient utilization
and some biochemical functions related to the production, feeding and
reproduction in grazing animals. The presence of minerals in required
amount in animal diet varies due to several factors which influence their
intake and utilization. Generally the quality of leaves varies in nutrient
quality and digestibility through out the year. Animal utilize minerals
through the consumption of natural available feed Gowda et al., (2004).
Animals can not function normally with out sufficient supply of any of the
essential elements either it may be macro or micro. Trace elements
deficiencies are less wide spread, more difficult to recognize and probably
quantatively less important than macro element deficiencies. Grazing
ruminants select diets from an array of plant species that vary in nutrients
and toxins, Wang and Provenza (1996). The quality of plants found in
ranges is judged primarily upon how readily it is eaten up by animals and
its nutritive content in respect to its phonological development.
F. xanthoxyloides and P. eburnea are most palatable through out
the year. While B. baluchistanica is eaten up only during early growth and
only certain portions of a particular species are consumed during the later
stages of development. Most forage F. xanthoxyloides and P. eburnea are
high in nutrients from April to August, however as they get mature they
lose nutrients, gradually decreasing in autumn to winter season.
a) Carbohydrate
The effect of two trees and six shrubs of Quetta from three habitats
on sheep metabolism were studied. Fecal and urine samples were analyzed
for carbohydrate, crude protein, crude fiber and total nitrogen. Body weight
was also monitored. (Table 17-20).
The sheep fed with P. khinjuk had high carbohydrate (2.8%) in their
feces and (1.3%) in urine. The amount of carbohydrate in P. khinjuk
leaves was 13.08% this shows that almost 21.46% of the plant carbohydrate
was not absorbed, while leaves of F. xanthoxyloides had 13.77%
carbohydrate with significantly low amount of carbohydrate (1.4%) from
feces and (1.2%) in urine of sheep were recorded, this shows that only 10%
carbohydrates were excreted and 90% was absorbed. The carbohydrate of
control sheep was 1.11% while in urine it was 0.10%. This shows that
carbohydrate of F. xanthoxyloides were absorbed more as compared to
P. khinjuk and the amount excreted was comparable to control (1.4%) in
feces and (1.1%) in urine which were fed with mixed herbage therefore it is
concluded that among trees F. xanthoxyloides provides better nutrition to
animal as compared to P. khinjuk. Same results were found by Decandia
et al., (1997), they observed that in mediterranean basin, tannin rich species
(P. lenticus L.) are wide spread and although they are less preferred their
contribution to the diet is important.
In all six shrubs studied the amount of carbohydrate ranged between
6.7 - 2.3% in feces and in urine 2.1% -1.0% (Table17-20).The feeding
experiment of P. eburnea proved it to be a better shrub comparatively as
the amount of carbohydrate was (2.4%) in feces and (1.4%) in urine. The
leaves of P. eburnea had high (17%) carbohydrate content, it indicates that
it was better absorbed (88.24%) in the body of sheep only 14.76% of the
plant carbohydrate was not absorbed and excreted through feces (2.4%).
Therefore P. eburnea proved to be an excellent source of fodder.
Results indicate that the high amount of carbohydrates in feces
(6.7%) and (1.4%) in urine of sheep was observed when they were fed
P. abrotanoides this shows that the plant was not properly absorbed and
digested (40.82% excreted). However, the sheep did not prefer eating this
plant; the reason might be that it has very strong aromatic smell. This
proves that this plant is non palatable and less digestible therefore is not a
good source of fodder. Similar results were found by Arnold (1964), he
observed carbohydrates are completely digested related to palatability and
negatively correlated with protein concentration. Similarly S. mollis had
4.6% carbohydrate in feces and 1.2% in urine. In the foliage of S. mollis
less amount (14.47%) was found, it means that 31.8% carbohydrates were
not absorbed and passed undigested. A. brahuica, C. ambigua and
B. baluchistanica had almost same amount of carbohydrate (3.2%)
respectively while in urine it was 1.4%. The amount of carbohydrates found
in leaves was almost 15%, 20% of the carbohydrate passed unabsorbed
therefore these plants also proved to be less palatable and less digestible.
Carbohydrates are significant part of nutrition in animal, as it is main
source of food. This quality provides satisfaction of appetite and also
stimulates intestinal peristalsis. Sheep lack cellulase enzymes therefore it
can not be absorbed in gastrointestinal tract. Symbiosis helps herbivores to
utilize cellulose (carbohydrate) due to non availability of cellulase. Hence it
is converted into glucose and consumable products.
b) Crude Protein
The crude protein of animal fecal and urine samples were also
evaluated by feeding two native tree species and six shrub species to sheep.
The range of crude protein in feces of sheep fed with all tree leaves were
7.7%- 6.8% in feces and 0.2- 0.4% in urine (Table 17-20). High percentage
of crude protein in P. khinjuk leaves (17.62%) was recorded while 7.9%
was found in feces and 0.3% in urine of the sheep when fed with this plant
while significantly low amount (6.8%) was found in feces and (0.3%) in
urine when fed with F. xanthoxyloides, although high crude Protein 18.25%
was found in its leaves. This proves that crude protein of
F. xanthoxyloides was better digested as very little amount was excreted
therefore this tree provides a very good source of nutrition to animals as
compared to P. khinjuk. The crude protein requirement in ruminants is
6-8% in the diet for the microbial populations and both these plants have
more than the required amount. The feeding experiments of shrub leaves
showed no significant difference between trees and shrubs. Almost similar
amount of crude protein was found in the feces of sheep fed with A.
brahuica (7.2%), P. abrotanoides (7.2%) and B. baluchistanica (7.5%)
while (0.5%, 1.1%, and 1.6%) was found in urine samples respectively.
Medium amount of Crude Protein was observed when fed with
C. ambigua (6.4%) in feces and (1.1%) in urine. The amount recorded
from feces (5.6%) and (1.1%) in urine when fed with S. mollis, while
P. eburnea had less amount (5.0%) of crude protein in feces and in urine
(0.2%). Therefore P. eburnea proved to be the best source of fodder among
all shrubs studied as very less amount of crude protein was excreted and
maximum was absorbed. Generally grazing ruminants get energy from
plant’s carbohydrates and proteins. The animal nutritional needs change
depending on the nutrient content of the food it ingests, and macronutrients
(protein) play a primary role in food preferences Wang and Provenza
(1997).
c) Crude Fiber
Tree and shrubs species were evaluated for crude fiber in sheep’s
fecal and urine samples (Table17-20). The range of crude fiber was
21- 16% in the feces and 1.0-1.2% in urine. Sheep fed with P. khinjuk had
18% crude fiber in feces and in urine 1.3%, while crude fiber were less
when fed with F. xanthoxyloides, it was (16%) in feces and (1.0%) in
urine. Generally the fibrous diet is less preferred and has less nutritional
value for small ruminants. Similarly some woody species have a high fiber,
lignin content, high level of soluble phenolics and tannins that can reduce
nitrogen digestibility and retention, Van Soest (1994).
Shrub species evaluated had high crude fiber13% was found in feces
and 1.1% in urine fed with P. abrotanoides. However, sheep did not prefer
to eat P. abrotanoides might be due to its aromatic smell. Provenza (1995)
observed that taste and odor and their association are important for the
selection of food by small ruminants. While medium amount of crude fiber
was found in feces (10.6%) and (1.3%) in urine by feeding A. brahuica.
Significantly low crude fiber 5.2% in feces and 1.4% in urine by feeding
B. baluchistanica and P. eburnea while by eating C. ambigua 5.6% of
crude fiber was excreted in feces and 2.3% in urine. Therefore among
shrubs studied C. ambigua and P. eburnea are considered as good source of
nutrition as they had lowest crude fiber in the leaves as well as in feces and
urine. Variability in feed degradability could also be due to forage fiber
consumptions. According to Fonseca et al., (1998) and Rubenza et al.,
(2003), fiber proportion and type determine extent and rate of feed
degradation.
d) Total Nitrogen
Total nitrogen from feces and urine of sheep fed separately with two
tree and six shrub species were evaluated. The amount of total nitrogen was
(1.08%) in feces and (0.3%) in urine when fed F. xanthoxyloides, while the
amount (1.18%) was in feces and (0.3%) % in urine was found by feeding
P. khinjuk (Table17-20).
In shrub species when fed P. eburnea less nitrogen (0.8%) was
observed in feces and 0.2% was found in urine. While the amount of total
nitrogen was 1.14% in the feces and 0.2% in urine when fed with
A. brahuica. The amount of nitrogen was found by the feeding of
C. ambigua, S. mollis and P. abrotanoides ranged between 0.9-1.1% in
fecal and 0.3-0.4% in urine. Urine analysis is important tool in disease
detection as well as monitoring and screening animal health. When sheep
fed B. baluchistanica high amount (1.2%) in feces and 0.6% in urine was
found. Generally the protein requirements in ruminants include protein
while nitrogen required for their microbial population. Generally, microbial
requirements are 6-8% crude protein in diet. Nitrite occurs in urine during
some bacterial infection. The ratio of dietary energy and protein play an
important role in efficiency of rumen microbe active. These microbes
require energy to metabolize nitrogen.
Excessive nitrogen in food can also adversely affect in take, Baker
et al., (1988) and Provenza (1995). Small ruminant are better adapted to
the consumption of trees and shrubs with high content of deleterious
substances, provided a gradual ingestion of the browse. These
phenomenons of adaptation, as metabolism of antinutritional substances,
still need further investigation.
e) Body Weight
Body weight was recorded before and after feeding plants to sheep
(Table 17-20). By feeding of F. xanthoxyloides body weight significantly
increased (Fig. 20) and sheep preferred to eat this plant as compared to,
when fed with P. khinjuk. The nutritional concentration of
F. xanthoxyloides is similar or more than the amount required for the
animal nutrition as recommended by Commonwealth Agricultural Bureau
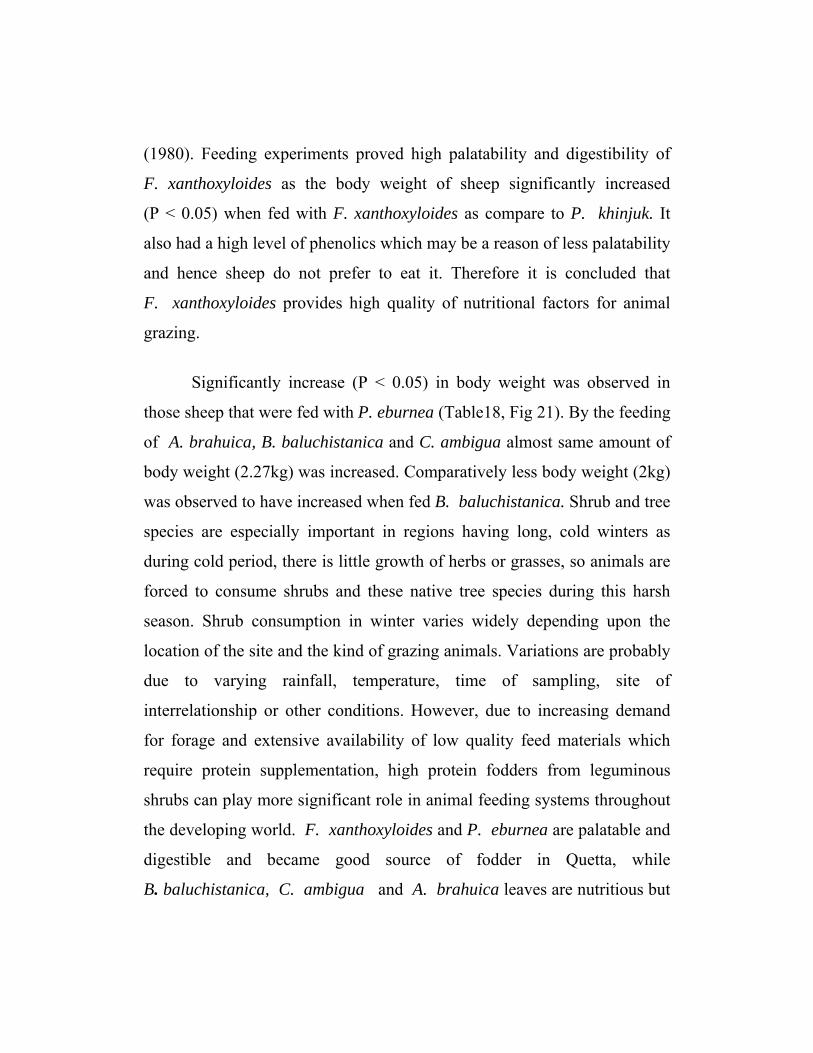
(1980). Feeding experiments proved high palatability and digestibility of
F. xanthoxyloides as the body weight of sheep significantly increased
(P < 0.05) when fed with F. xanthoxyloides as compare to P. khinjuk. It
also had a high level of phenolics which may be a reason of less palatability
and hence sheep do not prefer to eat it. Therefore it is concluded that
F. xanthoxyloides provides high quality of nutritional factors for animal
grazing.
Significantly increase (P < 0.05) in body weight was observed in
those sheep that were fed with P. eburnea (Table18, Fig 21). By the feeding
of A. brahuica, B. baluchistanica and C. ambigua almost same amount of
body weight (2.27kg) was increased. Comparatively less body weight (2kg)
was observed to have increased when fed B. baluchistanica. Shrub and tree
species are especially important in regions having long, cold winters as
during cold period, there is little growth of herbs or grasses, so animals are
forced to consume shrubs and these native tree species during this harsh
season. Shrub consumption in winter varies widely depending upon the
location of the site and the kind of grazing animals. Variations are probably
due to varying rainfall, temperature, time of sampling, site of
interrelationship or other conditions. However, due to increasing demand
for forage and extensive availability of low quality feed materials which
require protein supplementation, high protein fodders from leguminous
shrubs can play more significant role in animal feeding systems throughout
the developing world. F. xanthoxyloides and P. eburnea are palatable and
digestible and became good source of fodder in Quetta, while
B. baluchistanica, C. ambigua and A. brahuica leaves are nutritious but

has spines and thorns which reduce its palatability. Balochistan’s mountain
trees and shrubs provide good and complete diet for sheep, goats and
camels.
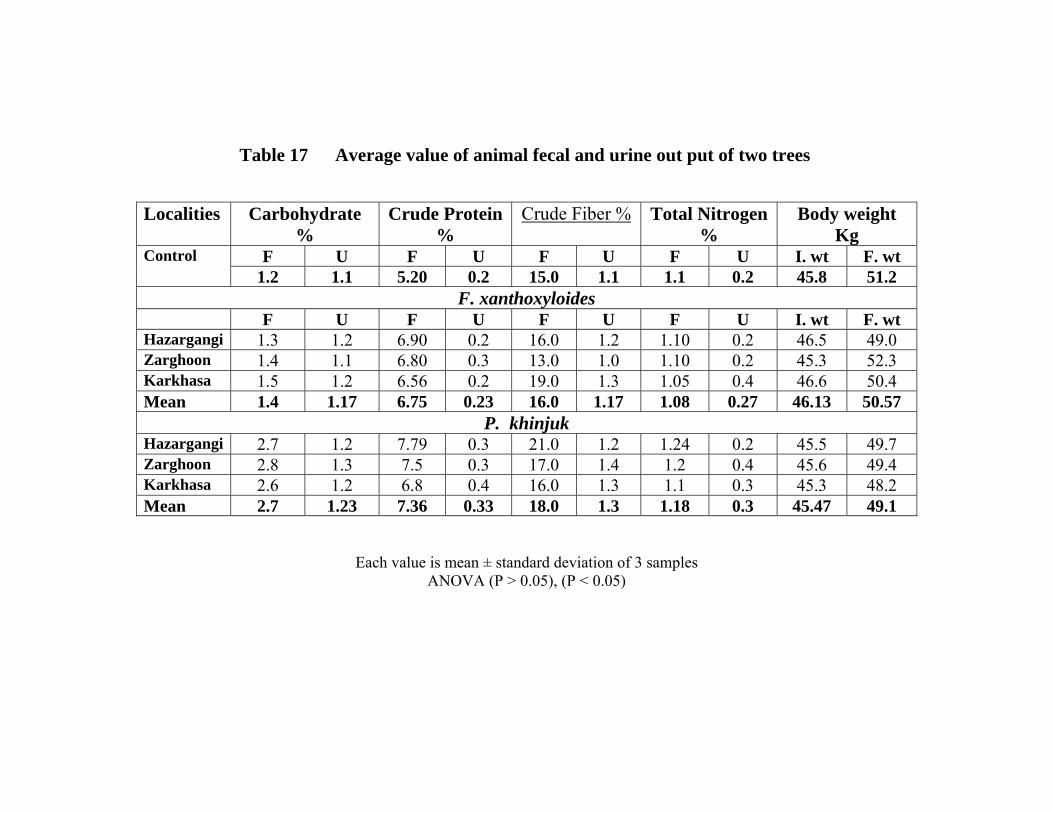
Table 17 Average value of animal fecal and urine out put of two trees Localities Carbohydrate
% Crude Protein
% Crude Fiber % Total Nitrogen
% Body weight
Kg Control F U F U F U F U I. wt F. wt
1.2 1.1 5.20 0.2 15.0 1.1 1.1 0.2 45.8 51.2 F. xanthoxyloides
F U F U F U F U I. wt F. wt Hazargangi 1.3 1.2 6.90 0.2 16.0 1.2 1.10 0.2 46.5 49.0 Zarghoon 1.4 1.1 6.80 0.3 13.0 1.0 1.10 0.2 45.3 52.3 Karkhasa 1.5 1.2 6.56 0.2 19.0 1.3 1.05 0.4 46.6 50.4 Mean 1.4 1.17 6.75 0.23 16.0 1.17 1.08 0.27 46.13 50.57
P. khinjuk Hazargangi 2.7 1.2 7.79 0.3 21.0 1.2 1.24 0.2 45.5 49.7 Zarghoon 2.8 1.3 7.5 0.3 17.0 1.4 1.2 0.4 45.6 49.4 Karkhasa 2.6 1.2 6.8 0.4 16.0 1.3 1.1 0.3 45.3 48.2 Mean 2.7 1.23 7.36 0.33 18.0 1.3 1.18 0.3 45.47 49.1
Each value is mean ± standard deviation of 3 samples ANOVA (P > 0.05), (P < 0.05)
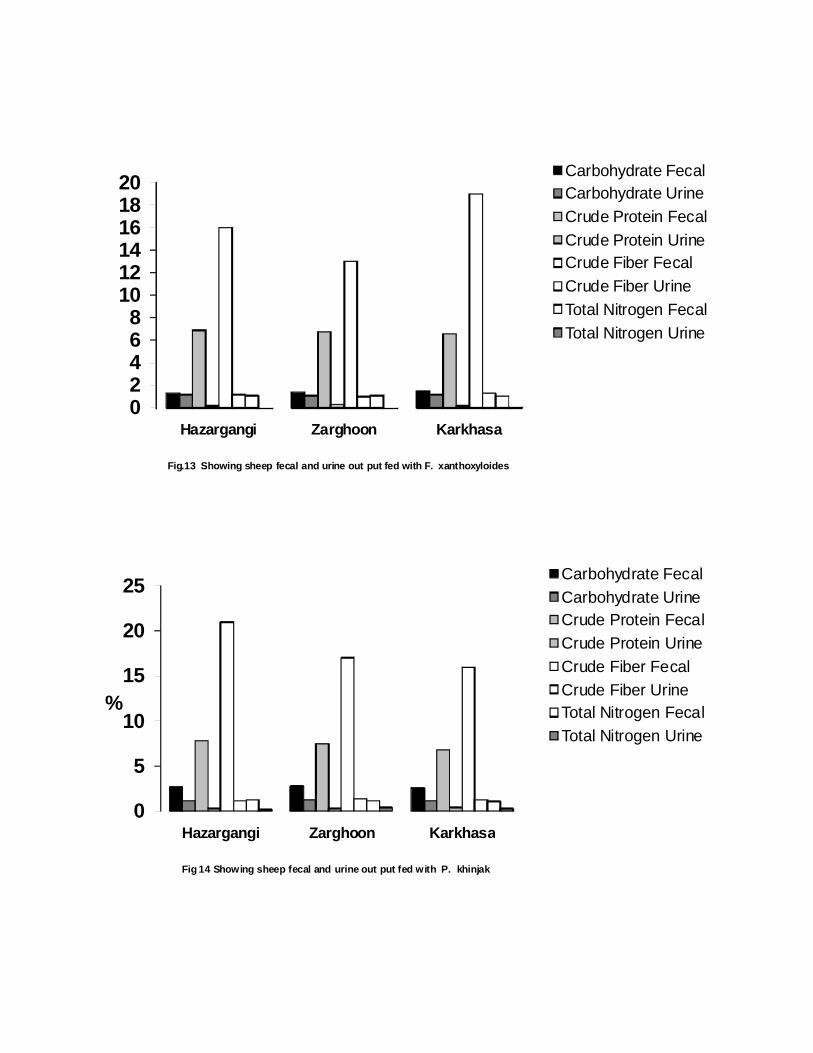
02468
101214161820
Hazargangi Zarghoon Karkhasa
Fig.13 Showing sheep fecal and urine out put fed with F. xanthoxyloides
Carbohydrate FecalCarbohydrate UrineCrude Protein FecalCrude Protein UrineCrude Fiber FecalCrude Fiber UrineTotal Nitrogen FecalTotal Nitrogen Urine
0
5
10
15
20
25
Hazargangi Zarghoon Karkhasa
%
Fig 14 Showing sheep fecal and urine out put fed with P. khinjak
Carbohydrate FecalCarbohydrate UrineCrude Protein FecalCrude Protein UrineCrude Fiber FecalCrude Fiber UrineTotal Nitrogen FecalTotal Nitrogen Urine
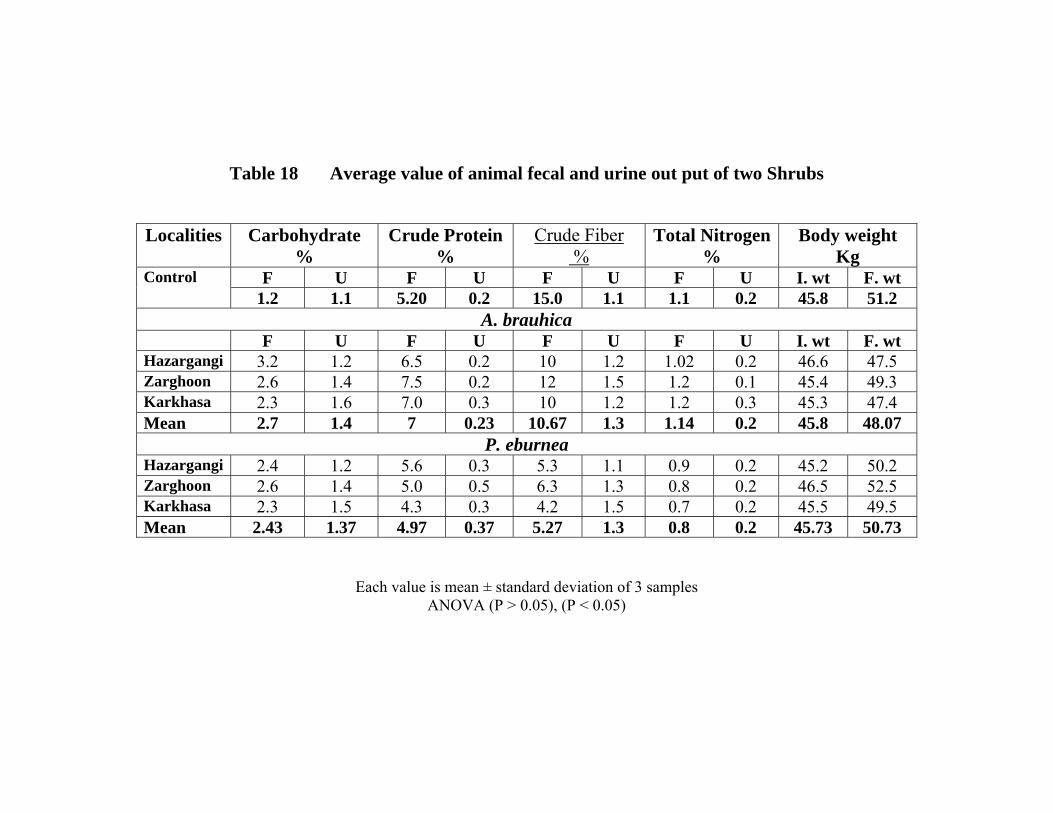
Table 18 Average value of animal fecal and urine out put of two Shrubs
Localities Carbohydrate
% Crude Protein
% Crude Fiber
% Total Nitrogen
% Body weight
Kg Control F U F U F U F U I. wt F. wt
1.2 1.1 5.20 0.2 15.0 1.1 1.1 0.2 45.8 51.2 A. brauhica
F U F U F U F U I. wt F. wt Hazargangi 3.2 1.2 6.5 0.2 10 1.2 1.02 0.2 46.6 47.5 Zarghoon 2.6 1.4 7.5 0.2 12 1.5 1.2 0.1 45.4 49.3 Karkhasa 2.3 1.6 7.0 0.3 10 1.2 1.2 0.3 45.3 47.4 Mean 2.7 1.4 7 0.23 10.67 1.3 1.14 0.2 45.8 48.07
P. eburnea Hazargangi 2.4 1.2 5.6 0.3 5.3 1.1 0.9 0.2 45.2 50.2 Zarghoon 2.6 1.4 5.0 0.5 6.3 1.3 0.8 0.2 46.5 52.5 Karkhasa 2.3 1.5 4.3 0.3 4.2 1.5 0.7 0.2 45.5 49.5 Mean 2.43 1.37 4.97 0.37 5.27 1.3 0.8 0.2 45.73 50.73
Each value is mean ± standard deviation of 3 samples ANOVA (P > 0.05), (P < 0.05)
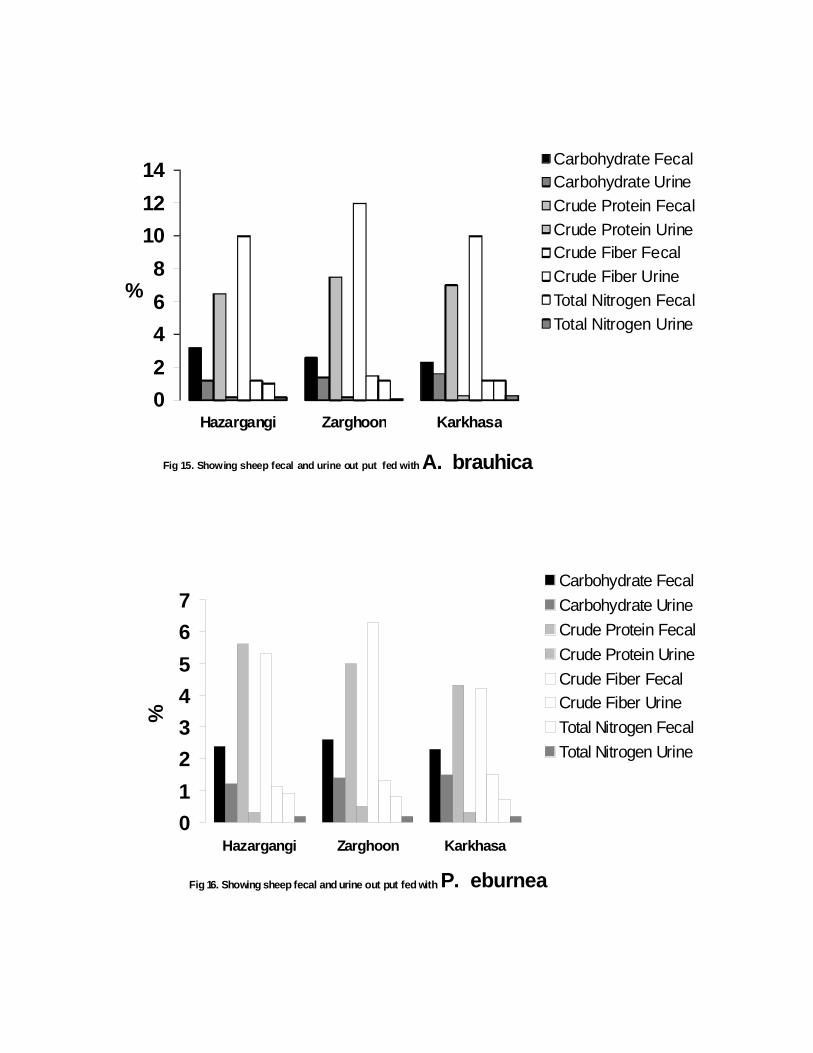
02468
101214
Hazargangi Zarghoon Karkhasa
%
Fig 15. Showing sheep fecal and urine out put fed with A. brauhica
Carbohydrate FecalCarbohydrate UrineCrude Protein FecalCrude Protein UrineCrude Fiber FecalCrude Fiber UrineTotal Nitrogen FecalTotal Nitrogen Urine
01234567
Hazargangi Zarghoon Karkhasa
Fig 16. Showing sheep fecal and urine out put fed with P. eburnea
%
Carbohydrate FecalCarbohydrate UrineCrude Protein FecalCrude Protein UrineCrude Fiber FecalCrude Fiber UrineTotal Nitrogen FecalTotal Nitrogen Urine
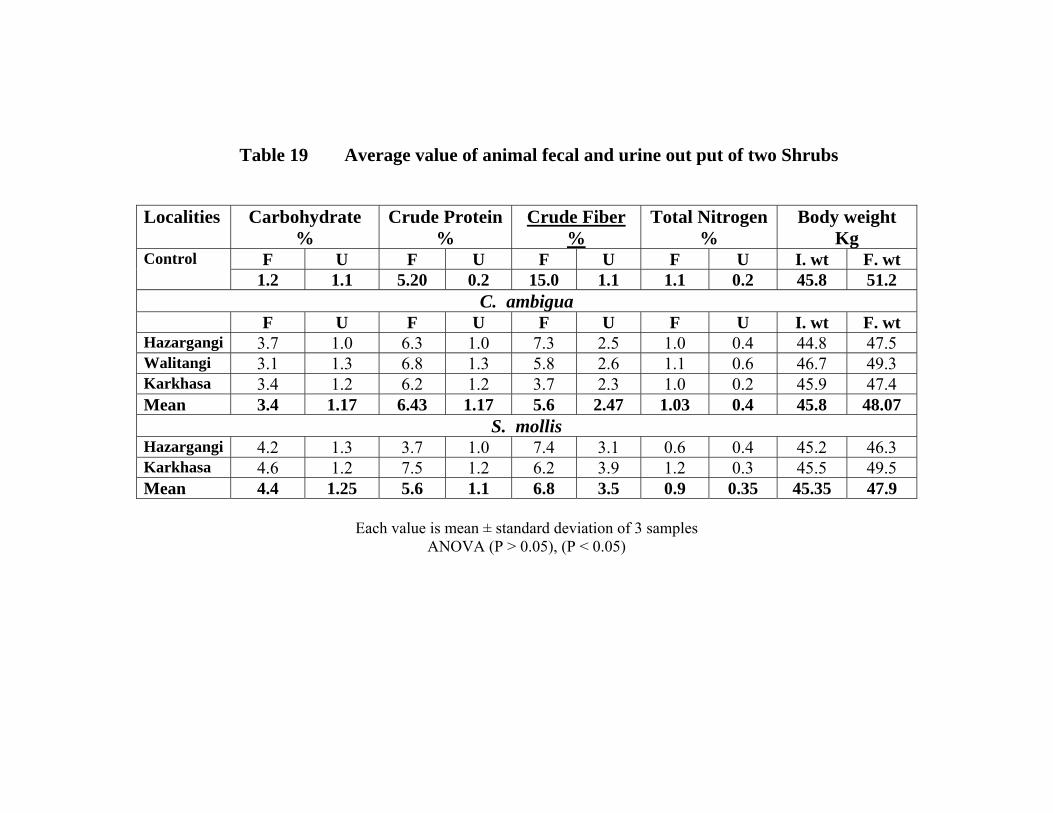
Table 19 Average value of animal fecal and urine out put of two Shrubs
Localities Carbohydrate
% Crude Protein
% Crude Fiber
% Total Nitrogen
% Body weight
Kg Control F U F U F U F U I. wt F. wt
1.2 1.1 5.20 0.2 15.0 1.1 1.1 0.2 45.8 51.2 C. ambigua
F U F U F U F U I. wt F. wt Hazargangi 3.7 1.0 6.3 1.0 7.3 2.5 1.0 0.4 44.8 47.5 Walitangi 3.1 1.3 6.8 1.3 5.8 2.6 1.1 0.6 46.7 49.3 Karkhasa 3.4 1.2 6.2 1.2 3.7 2.3 1.0 0.2 45.9 47.4 Mean 3.4 1.17 6.43 1.17 5.6 2.47 1.03 0.4 45.8 48.07
S. mollis Hazargangi 4.2 1.3 3.7 1.0 7.4 3.1 0.6 0.4 45.2 46.3 Karkhasa 4.6 1.2 7.5 1.2 6.2 3.9 1.2 0.3 45.5 49.5 Mean 4.4 1.25 5.6 1.1 6.8 3.5 0.9 0.35 45.35 47.9
Each value is mean ± standard deviation of 3 samples ANOVA (P > 0.05), (P < 0.05)
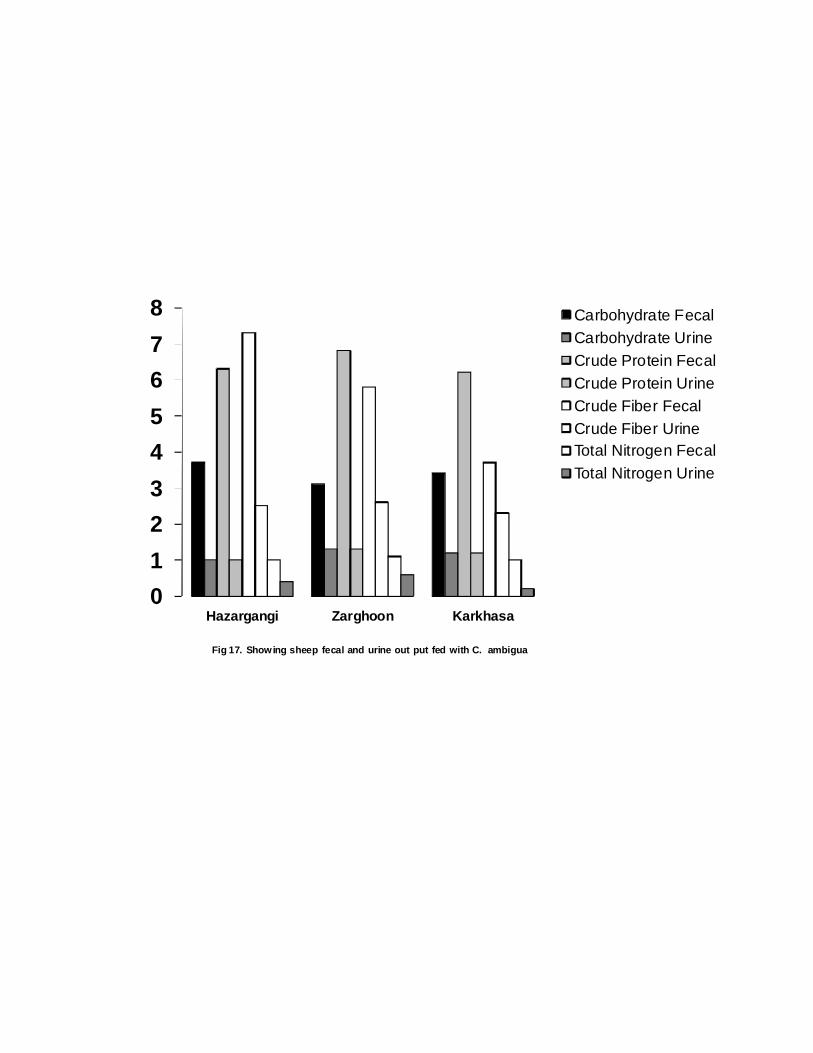
012345678
Hazargangi Zarghoon Karkhasa
Fig 17. Showing sheep fecal and urine out put fed with C. ambigua
Carbohydrate FecalCarbohydrate UrineCrude Protein FecalCrude Protein UrineCrude Fiber FecalCrude Fiber UrineTotal Nitrogen FecalTotal Nitrogen Urine
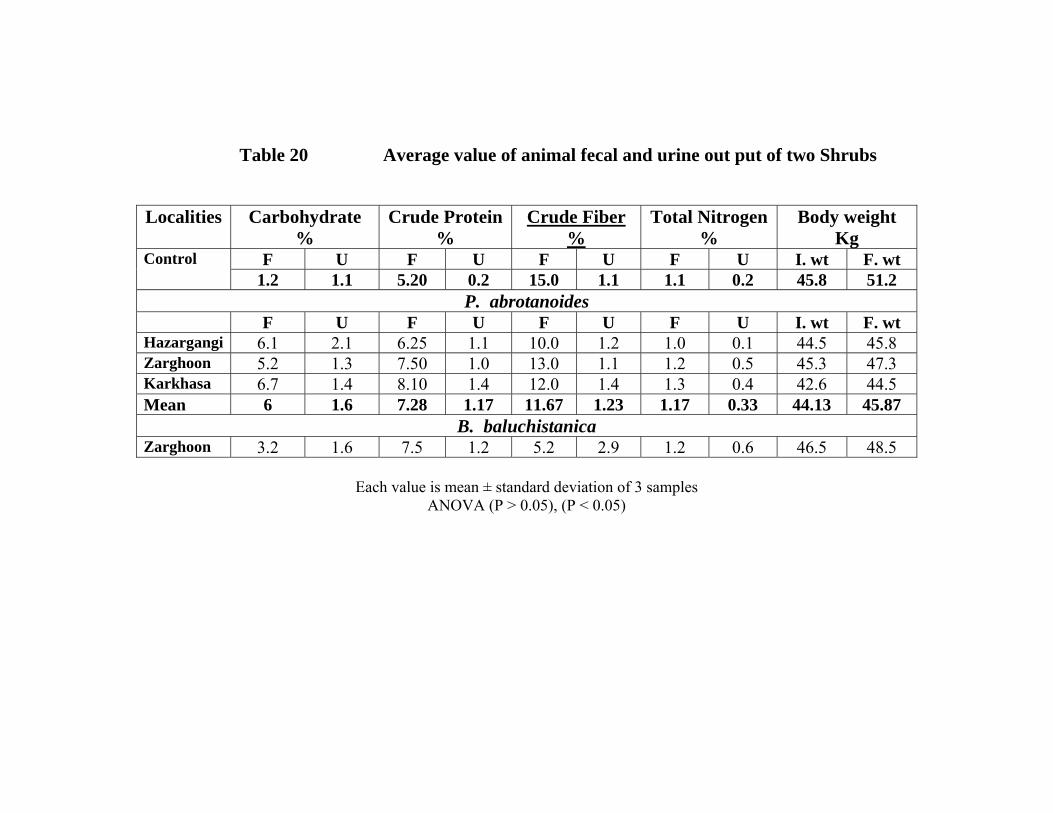
Table 20 Average value of animal fecal and urine out put of two Shrubs
Localities Carbohydrate
% Crude Protein
% Crude Fiber
% Total Nitrogen
% Body weight
Kg Control F U F U F U F U I. wt F. wt
1.2 1.1 5.20 0.2 15.0 1.1 1.1 0.2 45.8 51.2 P. abrotanoides
F U F U F U F U I. wt F. wt Hazargangi 6.1 2.1 6.25 1.1 10.0 1.2 1.0 0.1 44.5 45.8 Zarghoon 5.2 1.3 7.50 1.0 13.0 1.1 1.2 0.5 45.3 47.3 Karkhasa 6.7 1.4 8.10 1.4 12.0 1.4 1.3 0.4 42.6 44.5 Mean 6 1.6 7.28 1.17 11.67 1.23 1.17 0.33 44.13 45.87
B. baluchistanica Zarghoon 3.2 1.6 7.5 1.2 5.2 2.9 1.2 0.6 46.5 48.5
Each value is mean ± standard deviation of 3 samples ANOVA (P > 0.05), (P < 0.05)
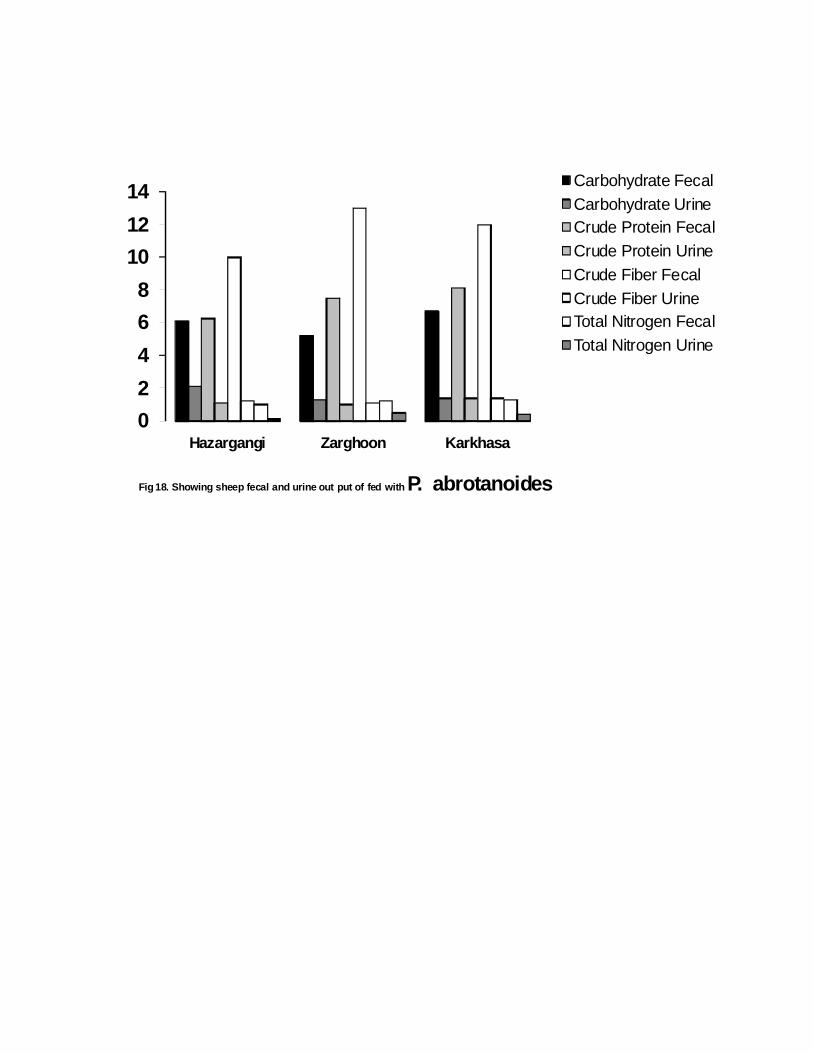
02468
101214
Hazargangi Zarghoon Karkhasa
Fig 18. Showing sheep fecal and urine out put of fed with P. abrotanoides
Carbohydrate FecalCarbohydrate UrineCrude Protein FecalCrude Protein UrineCrude Fiber FecalCrude Fiber UrineTotal Nitrogen FecalTotal Nitrogen Urine
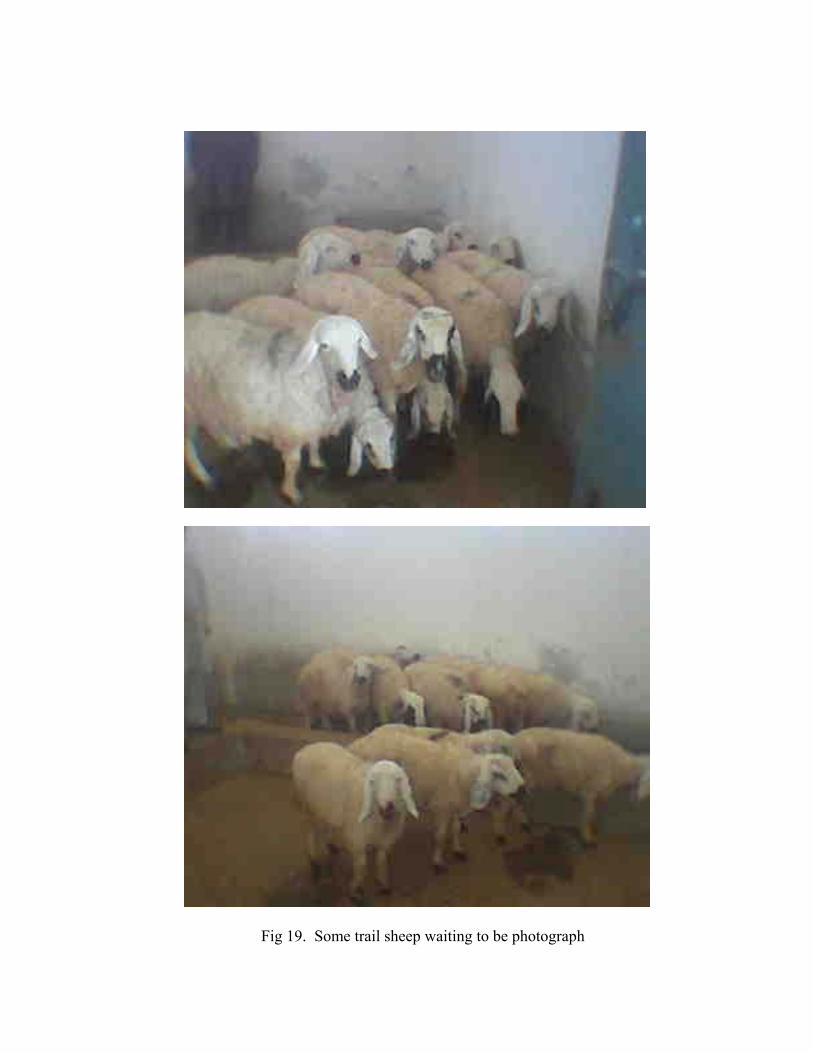
Fig 19. Some trail sheep waiting to be photograph
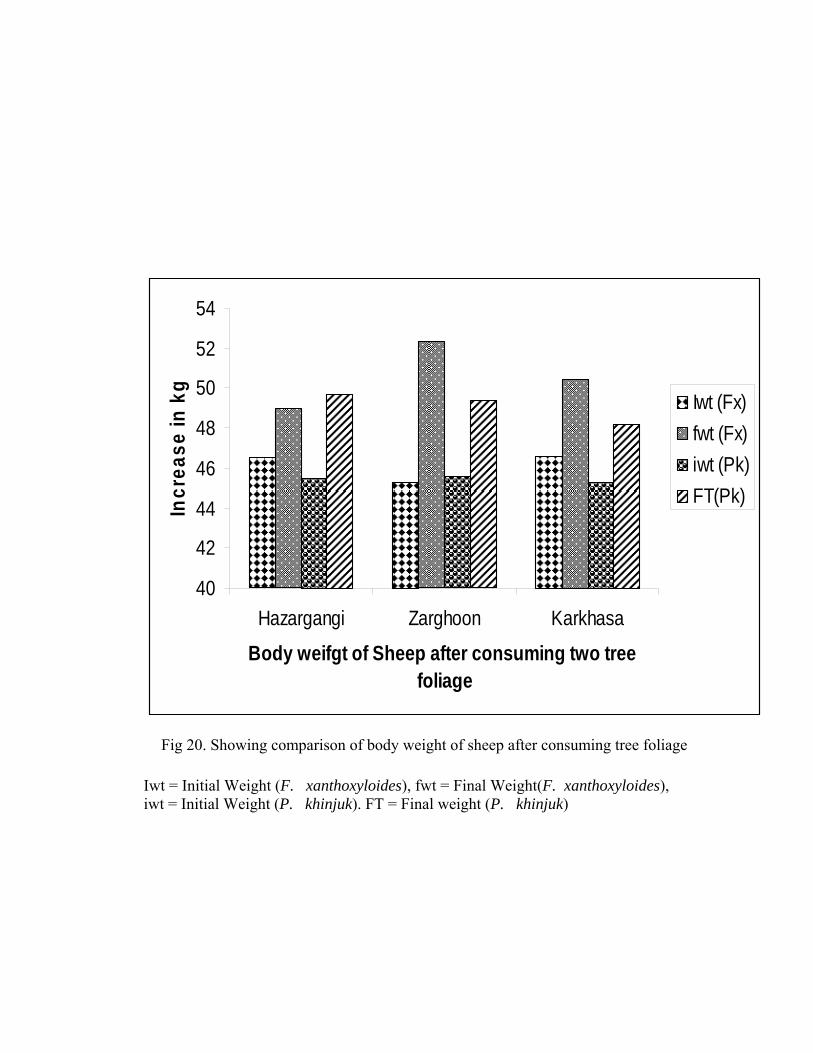
40
42
44
46
48
50
52
54
Hazargangi Zarghoon Karkhasa
Body weifgt of Sheep after consuming two tree foliage
Incr
ease
in k
g
Iwt (Fx)fwt (Fx)iwt (Pk)FT(Pk)
Iwt = Initial Weight (F. xanthoxyloides), fwt = Final Weight(F. xanthoxyloides), iwt = Initial Weight (P. khinjuk). FT = Final weight (P. khinjuk)
Fig 20. Showing comparison of body weight of sheep after consuming tree foliage
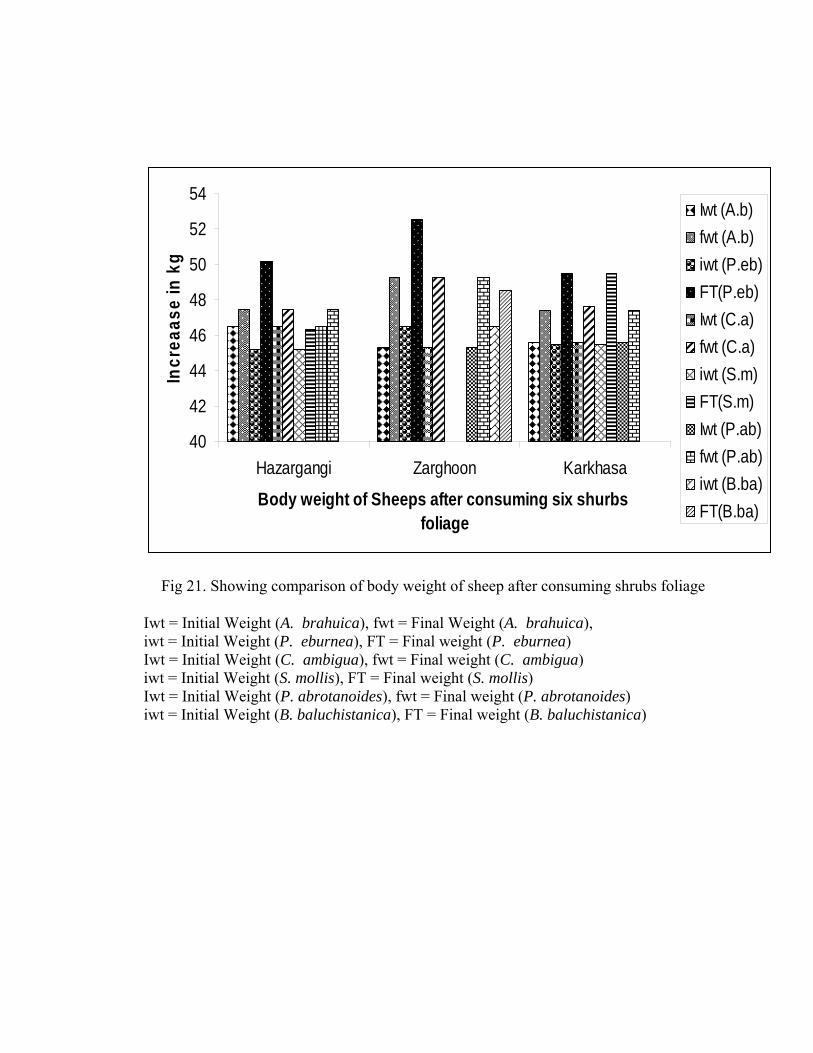
40
42
44
46
48
50
52
54
Hazargangi Zarghoon Karkhasa
Body weight of Sheeps after consuming six shurbs foliage
Incr
eaas
e in
kg
Iwt (A.b)fwt (A.b)iwt (P.eb)FT(P.eb)Iwt (C.a)fwt (C.a)iwt (S.m)FT(S.m)Iwt (P.ab)fwt (P.ab)iwt (B.ba)FT(B.ba)
Iwt = Initial Weight (A. brahuica), fwt = Final Weight (A. brahuica), iwt = Initial Weight (P. eburnea), FT = Final weight (P. eburnea) Iwt = Initial Weight (C. ambigua), fwt = Final weight (C. ambigua) iwt = Initial Weight (S. mollis), FT = Final weight (S. mollis) Iwt = Initial Weight (P. abrotanoides), fwt = Final weight (P. abrotanoides) iwt = Initial Weight (B. baluchistanica), FT = Final weight (B. baluchistanica)
Fig 21. Showing comparison of body weight of sheep after consuming shrubs foliage
4.5 Soil
a) Physical Characters
Different elements play vital role in plant growth as they are
absorbed from soil. Soil of 3 localities of Quetta was analyzed for their
physical and chemical characteristics (Table21, Fig 22). Soil has important
chemical physiological and biological properties and it varies from place to
place, depending upon the parent rock materials, climate topography, age
and biological factors. Soil texture is important because it determine water
intake rates.
The result of physical analysis showed that pH values of soil varies
from 7.6 - 8.1. High pH (8.1) was found from the soil of Hazargangi,
medium (7.6) from Zarghoon and almost neutral (7.3) from Karkhasa.
Electric conductivity (EC) varies from 3.3 to3.6 mS/cm. Water holding
capacity ranged between 22.40-36.04%. High water holding capacity
(36.04%) was found in Zarghoon, medium (28.23%) was analyzed from
Karkhasa and low (22.40%) was found from Hazargangi habitats. Texture
was sandy clay loam in Hazargangi while silt loam was found from
Karkhasa and clay loam from Zarghoon soil.
b) Chemical Characters
i. Calcium
There was variation in soil calcium concentration in all three
different localities. Highest concentration of calcium was found (285mg/kg)
from the soil of Zarghoon area, while (235mg/kg) was estimated from soil
of Karkhasa. Lowest calcium (230mg/kg) was recorded from the soils of
Hazargangi. According to Adams & Hartzog (1980), critical concentration
of calcium in soil is 250mg/kg. Therefore the soil of Zarghoon had enough
calcium required for the growth of these plants. Calcium in plants was
positively correlated with calcium found in soils. Higher level of soil
calcium may increases forage calcium, but no plant studied had more
calcium. Almost same amount of calcium in soil was found by Tiffany
et al., (2000). High calcium was reported by Khan et al., (2004) while
working on soils of Islamabad. The calcium from soil of Zarghoon
(285mg/kg) was higher than Hazargangi and Karkhasa (235mg/kg). This
calcium is directly absorbed by the trees of the area therefore the leaves of
trees of Zarghoon area also had high calcium as compared to trees of
Hazargangi and Karkhasa.
Among the shrub species studied high calcium was recorded from
Karkhasa. Maximum calcium (1.29%) was recorded from a shrub
P. abrotanoides growing in this habitat. Other species C. ambigua,
A. brahuica and P. eburnea absorbed medium amount of calcium from all
3 habitats. In foliage samples of B. baluchistanica and S. mollis less
amount of calcium was absorbed. Calcium is important in pectin synthesis
of middle lamella of cell wall. It is also involved in the metabolism of
nucleus and mitochondria. Beside the structural role, calcium plays minor
catalytic role, involved as activator of a few enzyme as phospholipase.
ii. Sodium
Sodium in soil ranged from 230-310mg/kg. Its high amount
(310mg/kg) was found from Zarghoon site. Medium amount (230mg/kg)
was estimated from Hazargangi and less (226mg/kg) was evaluated from
the soils of Karkhasa. However, according to Rhue & Kidder (1983), Khan
et al.,(2004) the critical concentration of sodium in soil is 62mg/kg. The
soils of all areas studied had excessive amount of sodium than the critical
value. The result shows that sodium was absorbed in high concentration by
the trees. The trees of Karkhasa had maximum sodium as compare to all
other sites. The foliage of P. abrotanoides absorbed maximum amount
(1.27%) of sodium from the soil of Hazargangi. Second highest amount
(0.45%) of sodium was absorbed by P. eburnea leaves from Zarghoon
region. Less amount (0.03%) was absorbed by the leaves of
B. baluchistanica from Zarghoon.
iii. Potassium
The amount of potassium concentration in soil was recorded from all
three studied sites. Highest amount (233mg/kg) was found in soil of
Zarghoon, medium amount (225mg/kg) from Hazargangi and less amount
(200mg/kg) from Karkhasa. Potassium is required in large amount in plants
and this cation is involved in maintenance of ionic balance in cells. It also
serves as a catalytic role. The critical concentration of potassium is
(60mg/kg) as reported by Hanlon et al., (1990). The leaves of P. khinjuk
from Hazargangi absorbed maximum amount of potassium (0.66%) as
compared to F. xanthoxyloides. Among the shrub species studied P.
abrotanoides had highest concentration in the leaves (1.12%) from
Hazargangi. Lowest amount of potassium was absorbed by the leaves of S.
mollis from Karkhasa (0.05%).
iv. Phosphorus
Phosphorus was estimated from the soils of all three sites. High
amount (246mg/kg) was analyzed from Karkhasa, Medium amount
(218mg/kg) was found from Zarghoon and slightly less (192mg/kg) was
estimated from Hazargangi soil. High amount of phosphorus in Karkhasa
was recorded, but low amount was absorbed by the shrubs growing in the
area which might be due to the deficiency of water. As least amount was
found in foliages of P. abrotanoides, C. ambigua and A. brahuica
(0.16-0.75%) from Karkhasa. High phosphorus was found in the leaves of
A. brahuica and C. ambigua (1.05-1.28%) from Zarghoon area where
plenty of water is available. Among trees maximum phosphorus
(1.32-1.56%) was recorded from the leaves of F. xanthoxyloides from all
three habitats. Among shrubs P. eburnea absorbed high amount (1.62%)
from Hazargangi. Phosphate is usually held tightly in soil mineral complex
and is unavailable without water. It forms structural part of many
compounds especially nucleic acid and phospholipids. It is also involved in
energy metabolism. Phosphorus deficiency affects all aspect of plant
metabolism and growth.
v. Iron
Slightly high iron (100mg/kg) was found in Zarghoon soils, medium
amount (97mg/kg) was analyzed in the soils of Karkhasa and less
(62mg/kg) was evaluated from Hazargangi. According to Viets & Lindsay
(1973), critical concentration of iron is 2.5mg/Kg. Less amount (0.02%) of
iron was up taken by the trees studied from Hazargangi. Highest amount
(0.51%) was absorbed in leaves of F. xanthoxyloides from Zarghoon. In
shrub species A. brahuica, P. eburnea and S. mollis takes up (0.05-0.06%)
iron in their foliage from Karkhasa habitats; however the amount of
Karkhasa soil was less as compared to other sites. B. baluchistanica,
P. abrotanoides and A. brahuica absorbed medium amount (0.04%) of Iron
from Zarghoon sites.
Soil conditions are important because it influences the growth
characteristics of plant and indirectly affects their nutritive value. Site also
affects the chemical content of plants and plant parts. Variation in cation
uptake selectively occurs between taxa of different ecological habitats,
Marschner (1995). The soil properties as well as the genotype of any plant
differentiate the concentration and quantity of different plant materials,
Ernst (1995); Őzcan and Bayçu (2005). The variation among plants in their

abilities to absorb different elements is not always constant and is affected
by changing conditions of soil, climate and by the stages of plant growth
Kabata-Pendias & Pendias (1986), Őzcan and Bayçu (2005). Where an
element is easily soluble, plants may take up very large amount of minerals
if water is available. Nutrient which are non functional in plants are linked
to moisture availability.
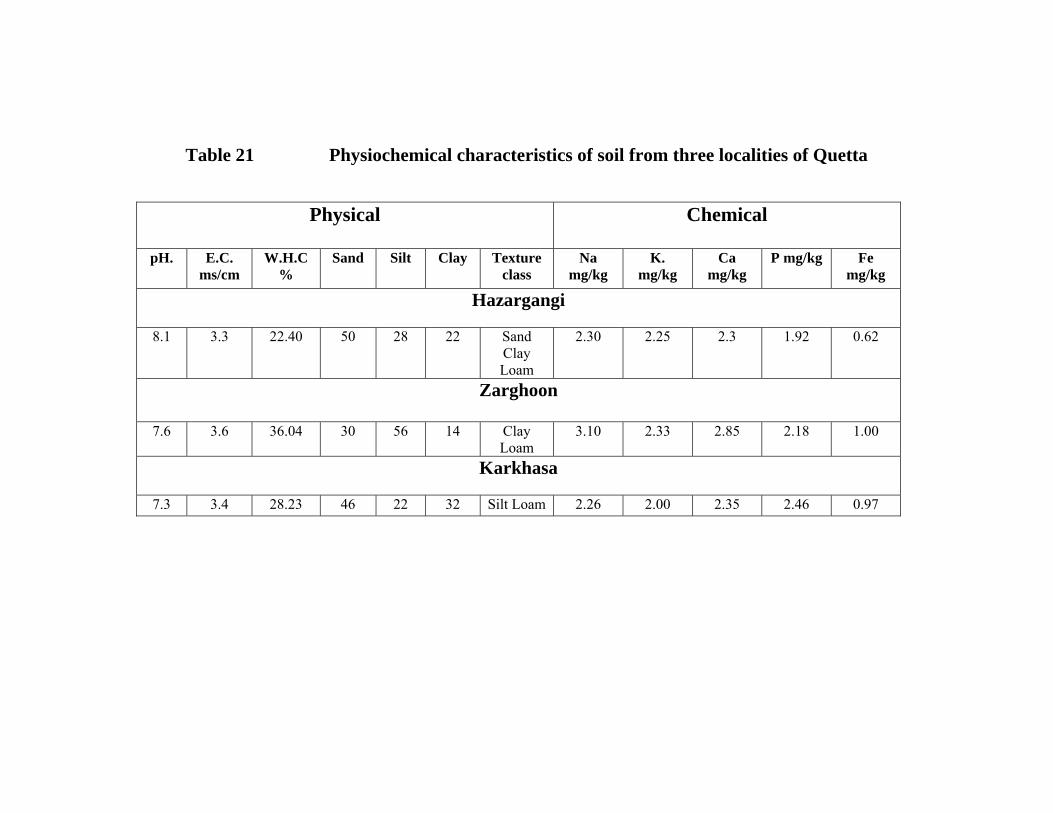
Table 21 Physiochemical characteristics of soil from three localities of Quetta
Physical
Chemical
pH. E.C. ms/cm
W.H.C %
Sand Silt Clay Texture class
Na mg/kg
K. mg/kg
Ca mg/kg
P mg/kg Fe mg/kg
Hazargangi
8.1 3.3 22.40 50 28 22 Sand Clay Loam
2.30 2.25 2.3 1.92 0.62
Zarghoon
7.6 3.6 36.04 30 56 14 Clay Loam
3.10 2.33 2.85 2.18 1.00
Karkhasa
7.3 3.4 28.23 46 22 32 Silt Loam 2.26 2.00 2.35 2.46 0.97
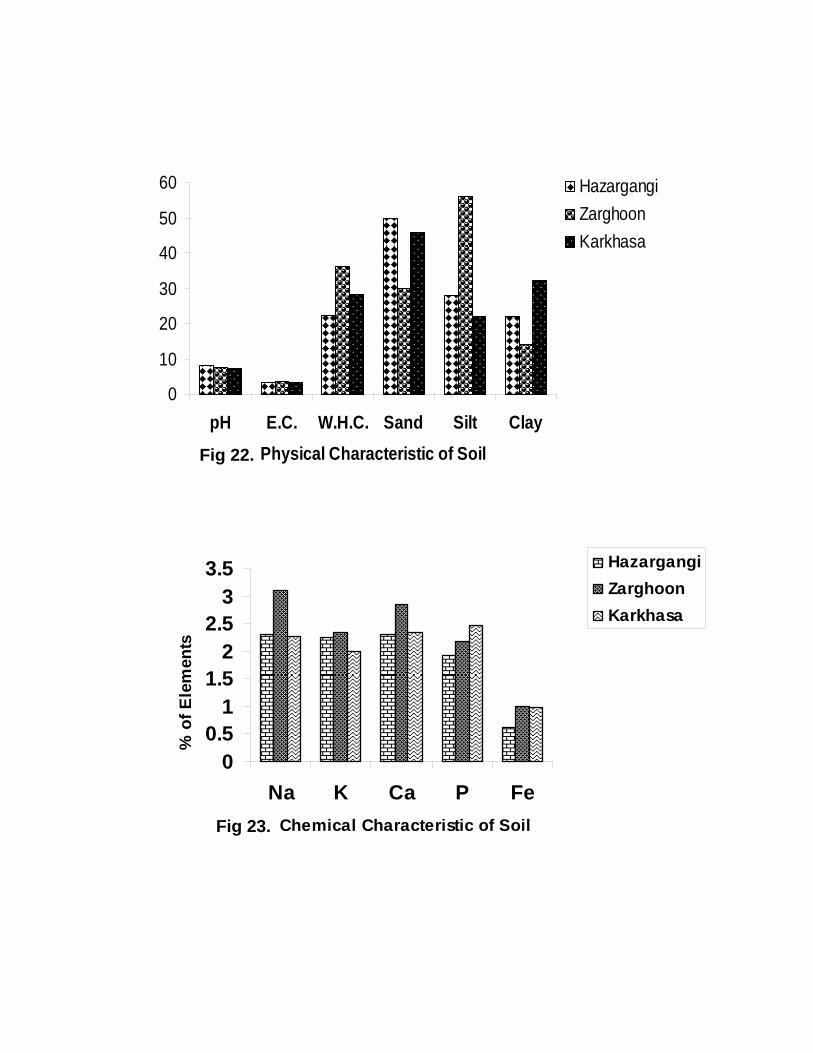
0
10
20
30
40
50
60
pH E.C. W.H.C. Sand Silt ClayPhysical Characteristic of Soil
HazargangiZarghoonKarkhasa
00.5
11.5
22.5
33.5
Na K Ca P FeChemical Characteristic of Soil
% o
f Ele
men
ts
HazargangiZarghoonKarkhasa
Fig 22.
Fig 23.
4.6 Conclusions
In Balochistan 90% area is rangeland. The climate is harsh with low
precipitation and erratic rainfall. This has limited scope of crop cultivation.
Animal get more than 80% feed from these native trees and shrubs. Range
lands are over grazed and are found in sufficient to meet the overall
nutritional requirements for live stock population. The study was carried
out in 3 entirely different habitats of the Quetta valley with diverse climatic
conditions and different vegetation pattern. The objective of this study was
to evaluate seasonal variation in nutritional and anti-nutritional contents of
leaves used as fodder and their digestibility. Two dominant trees Fraxinus
xanthoxyloides and Pistacia khinjuk and six shrubs Prunus eburnea,
Caragana ambigua, Amylgdalus brahuica, Perovskia abrotanoides,
Berberis baluchistanica, and Sophara mollis were studied.
Among the trees studied F. xanthoxyloides showed high ash,
carbohydrates, crude protein, crude fiber, energy levels, with less amount of
Phenolics as compare to P. khinjuk. These concentrations were high during
summer season. Significantly high amount (P < 0.05) of elemental
concentrations of Sodium, Phosphorus and Calcium was recorded from this
plant. Mineral concentration showed gradually increase from spring to
autumn season and decrease in winters. Significant increase (P < 0.05) in
body weight of sheep was observed when fed with this plant. The trees
found at Zarghoon had high nutritional values than the other two sites.
The shrub species studied had almost low nutritional value as
compare to trees. Among all shrubs studied P. eburnea was proved to be
the best species for animal nutrition, as it had high carbohydrates and high
crude protein. The mineral concentration showed high phosphorus,
calcium, medium sodium and potassium concentration and negligible
amount of trace elements.Less amount of Phenolics was also observed.
Significant increase in the body weight of sheep was observed (P < 0.05)
when fed with this plant.
Among the other five shrubs the following 3 species C. ambigua,
A. brahuica and B. baluchistanica were found to have medium nutritional
value as they had high mineral contents and energy level, and less
phenolics content. But all these 3 species has hard stem, small size of
leaves and hard spines make this plant less palatable for grazing ruminants,
although these plants have good nutritional value but these must be
supplemented with some other complete diet.
P. abratonoides remain green in majority of the time of the year,
the plant has maximum calcium and potassium content. Further more it is
low in sodium and carbohydrate. The plant has bad odor and high Phenolics
which makes it less preferred by small ruminants. S. mollis has maximum
amount of ash it has medium amount of phosphorus, calcium and crude
protein. But due to lignin deposition on leaf surface its palatability and
digestibility is reduced. These two plants are not preferred for grazing and
therefore not recommended as fodder.
Minerals concentration was affected by seasons and locations with
regard to satisfying grazing sheep nutrient requirement. These
concentrations were positively correlated with soil physical and chemical
characters. Beside this the persistent drought for the last decade has gravely
influenced the growth and vegetational pattern and their intake by animals.
Zarghoon area was found to be the best, as the nutritional value of plants
growing here were high.

REFERENCES
REFRENCES A, Manual of experiments for plant biology.(1995). Edited by Kokichi
Hinata 13and Teruyoshi Hashiba. Soft Science Publications,
Tokyo, Japan, pp.275-279. Abel, N., Baxter, J., Campbell, A., Cleugh, H., Fargher, J., Lambeck, R.,
Prinsley, R., Prosser, M., Reid, R., Revell, G., Schmidt, C.,
Stirzaker, R. and Thorburn, P. (1997). Design principles for
farm forestry: a guide to assist farmers to decide where to place
trees and farm plantations on farms.Barton, ACT, Rural
Industries Research and Development Corp.
Adams, F. and Hartzog, D.L (1980). The nature of yield responses of
Florunner peanuts to lime peanut Sci., 7:120 123.
Ahmed, K. S. (1951). Climatic regias of Pakistan Pak. Geog. Rev; 6: 1-35.
Ainalis, A., and Tsiouvaras, C. N (1996). Effects of spacing and grazing on
relative growth rate of woody fodder plants in a semi-arid Area
of north Greece. In: Fodder shrub development in arid and
Semi-arid Zones. Proceedings of the Workshop on Native and
Exotic Fodder Shrubs in Arid and semi arid zones.27thOct-2nd
Nov 1996, Hammamet, Tunisia. Volume 2.
Akbar, G., Rafique, S. and Khan, B. R. (1990). Efficacy of water harvesting
measures for the development of range-livestock sector in
Balochistan. Page 273-492. In: proceeding of the National
Seminar on Water Resource Development and its Management
in Arid Areas Vol.2 Quetta, 6-8th October.
Ali, A. (1988). Nutritional status of livestock in Pakistan with special
reference to feeding on rangelands. Proceedings of a seminar
on Range/ Livestock research, organized by the Arid Zone
Research Institute (AZRI), Quetta.
Al-Jaloud, A. A., S. A. Chaudhary., 1.1. Bashour., S. Qureshi and
Alshaghitti, A. (1994). Nutrient evaluation of some arid range
plants in Saudi Arabia. Journal of Arid environments, 28:299-
311.
Allen, S.E .(1989). Chemical Analysis of Ecological Materials. Oxford:
Blackwell Scientific Publication. 368pp.
Anees, M. (1980). An ecological survey of Balochistan. Report: Agric. Res.
Inst. Sariab, Quetta-Pakistan.
Anonymous. (1996). Nutrient requirements of domestic animals (No. 4).
Nutrient Requirements of Beef Cattle. 6th rev. ed. National
Research Council (NRC), National Academy of Science Press,
Washington, DC.
AOAC, (1990). Official Methods of Analysis (15th Edn.), Association of
official Analytical chemists, Washington, DC.
Arnold, G. W. (1981). Grazing behavior.In: ‘Grazing Animals’(Ed.
F.H.W.Morley.) Elsevier, Amsterdam.
Arnold, G. W, (1964). Factors with in plant association affecting the
behavior and performance of grazing animals. In: cris p.
D.J.(Ed.) grazing in terrestrial and marine environments
.pp.133-154. Oxford. Black well Scientific Publications.
Atiq-ur Rehman, (1997). Animal Fees resources and their utilization in
Asghara-Wazulun and Kach Mulazai Project Areas. Quetta:
Integrated Range- Live stock Development Project .FAO.
Azim, A,. Khan, A. G., Ahmad, J., Ayaz, M. and Mirza. I. H. (2002). Nutritional evaluation
of fodder tree leaves with goats. Asian- Aust. J. Anim. Sci. Vol. 15, No1:1-
156.
Badri, M. A., and Hamed, A. I. (2000). Nutrient value of plants in an
extremely arid environment (Wadi Allaqi Biosphere Reserve,
Egypt). Journal of Arid Environments. 44:347-356.
Baker, D. J., May, P.J., and Jones,W.M. (1988).Controlling the intake of
grain supplements by cattle, using urea/super phosphate. Proc.
Aust. Soc. Anim.Prod.17:146-149.
Bano, G. (2003). Seasonal biomass and nutritional quality of two native
grasses Chrysopogan aucheri (Boiss.) Stapf. Cymbopogan
Jwarancusa (Jones) Schult. In Hazargangi Chiltan National
Park. M. Phil thesis submitted to University of Balochistan,
Quetta.
Barry, T. N. and Fross, B. J, (1983). The condensed tannin content of
vegetation Lotus pedunclates, its regeneration by fertilizer
application and effect on protein solubility. Journal of Science.
Food and agriculture 34, 1047-1056.
Baumer, M. (1983). Notes on trees and shrubs in arid and semi-arid
regions. EMASAR, Phase11, FAO, Rome.
Beadle, N. C. W. and Tchan, Y. T, (1955). Nitrogen economy in semi- arid
plant communities. I. The environment and general
considerations. Linn. Soc. N. S. W. Proc. 80:62-70.
Beever, D. E. (1993). Ruminant animal production from forages: present
position and future opportunities. In: ‘Proceedings of XVII
International Grassland Congress’. (Ed. M. J. Baker.) pp. 535-
42. (New Zealand Grassland Association: Wellington, New
Zealand.)
Begg, A.R. (1966). Preliminary study of vegetation of Quetta. proc. Fist
west Pakistan Range management conference, Pakistan Forest
institute Peshawar. pp. 6-17.
Bhatia, D.R., Patnayak, B.C., and Singh, N. P,(1976). Evaluation and
utilization of top feeds for sheep and goats. Central sheep and
wool Research Institute. Avikanagar, India. Annual report.
Blaisdell, J. and. Holmgren, R.C, (1984) Managing intermountain
rangelands- Salt desert shrub ranges. U.S.D.A. Forest Service.
Gen. Tech. Rept. INT-163.
Boulanouar, B., A. Chriyaa and Boutouba, A, (1996).Moroccan
Experience with fodder shrub research and Development. In:
Fodder shrub development in arid and Semi-arid Zones.
Proceedings of the Workshop on Native and Exotic Fodder
Shrubs in Arid and semi arid zones.27th Oct-2nd Nov 1996,
Hammamet, Tunisia. Volume 1.
Bouyoucos, G. J. (1962). Hydrometer method improved for making particle
size of soils. Agron. J. 54: 464 – 465.
Bowers, M. D. and Stamp, N. E, (1992). Chemical variation within and
between individuals of Plantago lanceolata (Plantaginaceae). J.
Chemical. Ecol., 18:985-995.
Breman, H. and Kessler, J. (1995). Woody plants in agro-ecosystems of
semi-arid regions: with an emphasis on the sahelian conntries.
Berlin: Springer-Verlag.270pp.
Bryant, J. P. and Kuropat, P. J,(1983). Selection of winter forage by sub-
arctic browsing vertebrates: the role of plant chemistry. Ann.
Rev. Ecol. Systematic, 11, 261-285.
Bryant, J. P., Provenza. F. D., Pastor, J., Reichardt, P.B., Clausen, T. P .and
duToit, J. T, (1991).Interactions between woody plants and
browsing mammals mediated by secondary metabolites. Ann.
Rev. Ecol. Syst. 22: 431-446.
Bryant, J. F., Chapin.F.S., III, Reichart P. B. and Clausen, T.P, (1987).
Response of winter chemical defense in Alaska paper birch and
green alder to manipulation of plant carbon nutrient /balance-
Oecologia .72:510-514.
Bryant, J. P. Chapin F. S.,111., and Klein. D. R, (1983). Carbon /nutrient
balance of boreal plants in relation to vertebrate herbivory.
Oiks 40:357-368.
Buzdar, N. M., and Jameson, D. A.(1984). Range Management and
Shepherds in Balochistan, Pakistan. Rangelands 6(6). 243-246.
Cellg, K. M. (1956). Total Available carbohydrates. J. Sci. Food Agric. 7:
40.
Chapin, F. S. (1980).The mineral nutrition of wild plants. Ann Rev Ecol
Syst. 11:233- 260.
Chapin, F. S and Slacks, M.(1979). Effect of defoliation upon root growth,
phosphate absorption and respiration in nutrient-limited tundra
graminoids. Oecologia 42:67-79.
Coley, P. D. (1983a). Herbivory and defensive characteristics of tree
species in a low land tropical forest. Ecological Monographs.
53:209-23.3.
Common Wealth, Agricultural Bureau. (1980). The Nutrient Requirements
of Ruminant Livestock. Technical Review. England: CAB.
351 pp.
Conde, E. E., Cadahia, M.C., Garcia-Vallejo and M.B. Fernandez de
Simon. (1995). Polyphenolie composition of wood extracts
from Eucalyptus camaldulensis. E. globulus and E. rudis. Hol-
forschung. 49: 41-417.
Cook, C.W. (1972). Comparative nutrient values of forbs, grasses and
shrubs. In: “Wildland shrubs: Their Biology and Utilization”
(C. M. McKell, J. P. Blaisdell, and J. R.Goodin, eds.) USDA
for Serv. Gen. Tech. Rep. INT- 1,pp. 303-310. Utah state
University, Logan.
Cook, C. W., and Harris, L. E.(1977). Nutritive value of seasonal ranges.
Utah Agr. Exp. Sta. Bull., 472.
Corbet, H. A.(1951) Fodder Trees; Suggestions for their wider use.
Imperial printing company, Perth.
Dahot, M. U. (1993). Chemical evaluation of the Nutritive value of flowers
and fruits of Capparis decidua. Jour.Chem.Soc.Pak.Vol.15,
No,1.
Danckwerts, J. E. (1989a). The quality of herbage ingested by cattle in
rotationally grazed semi-arid grassveld of the eastern Cape.
Journal of Grassland society South Africa 6:65-70.
Danckwerts, J. E. and Tainton, N.M. (1996). Range management:
Optimising forage production and quality. Grasslands of our
world. 264- 270.
Dann, P. and Low, S. (1988). Assessing the value of browse plants as
alternative sources of fodder. Agricultural Science 1:20-27.
Date, R. A. (1973). Nitrogen: A major limitation in the productivity of
natural communities, crops and pastures in the Pacific area.
Soil Biol. Biochem. 5:18
Dawn, (2005). Daily Newspaper (The Thursday Review 12-18 May). pp.
04-09.
Decandia, M., Molle, G., Sitzia, M., Rule, P.A., Pampiro, F., Pintus, A.,
Kababya, D. (1997).Feeding behavior of goats browsing on a
Mediterranean shrub land. In: Book of abstract of the 48th
Annual Meeting of the European Association for Animal
Production, Wien, Austria, 25 – 28 August 1997 (Abstract
S3.13,293).
Del Valle, H. F. and. Rosell, R. A. (2000). Mineral composition of
perennial vegetation of shrub patches in Northeastern
Patagonia. Arid soil Research Rehabilitation 14:15-25.
Dent, J. W. & Aldrich, D. T. (1963). The inter-relationships between
heading date, yield, chemical composition and digestibility in
varieties of perennial ryegrass, timothy, cocksfoot and meadow
fescue. Journal of National Institute of Agricultural Botany, 9:
261-281.
Detling, J. K. Painter E. l. (1983). Defoliation responses of western
wheatgrass population with diverse histories of prairie dog
grazing. Oecologia. 57:65-71.
Douglas, A. Frank., Mc Naughton, S. J. and Tracy, B. F. (1998). The
Ecology of the Earth’s Grazing Ecosystems. Bio-Science vol.
48.No 7: 513-521.
Dustin, C. D. and Cooper- Driver, G .A. (1992). Changes in phenolics
production in the hay- scented fern (Dennstaedtia
punctiolobula ) in relation to resource availability.- Biochem.
Syst.Ecol.20:99-106.
Ebrahimzadeh, H., Niknam, V., and. Maassoumi, A.A (1999). Nitro
compound in Astragalus species from Iran. Biochem. Syst.
Ecol. 27: 743-751.
Ebrahimzadeh, H., Niknam, V., and Maassoumi, A.A.(2000) Mucilage
content and its sugar composition in Astragalus species from
Iran.Pak. J. Bot.32:131-140.
Economic Survey of Pakistan, (2004-2005).Government of Pakistan
Economic wing. Advisor’s Finance Division Islamabad.
Egli, P., and Schimid, B.(1999) Relation ship between leaf nitrogen and
limitations of photosynthesis in canopies of Solidago
altissima.Acta Oecologia.20(5)559-570.
Elliott, R., and Mc Meniman, N. P. (1987). Supplementation of (Eds J. B.
Hacker and J. H. Ternouth.) pp. 409-28. (Academic Press:
Sydney.)
Ernst, W.H.O.(1995).Sampling of plant material for chemical analysis. Sci.
Total environment, 176(1-3): 15-24.
Ettershank, G., Ettershank, J. A., Bryant, M., Whitford, W. G. (1978).
Effects of nitrogen fertilization on primary production in a
Chihuahuas Desert ecosystem. Journal of Arid
Envirnoments.1:135-139.
Fadel Elseed, A. M. A., Amin, A. E., A. Khadiga., Abdel Ati., Sekine, J.,
Hishinuma, M., and Hamana, K. (2002). Nutritive evaluation of
some fodder tree species during the dry season in central
Sudan. Asain- Aust. J. Anim. Sci. Vol. 15, No. 6: 844-850.
Farnsworth, N. R. (1966). Biological and phytochemical screening of
plants. J. Pharmaceutic. Sci., 55: 25-76.
Farooq, A. (1989). Nutritional Evaluation of some Selected Range Grasses.
The Pakistan Journal of Forestry.
Federal Bureau of Statistics Pakistan. (2005). Statistical Pocket Book. Stat
life building, F 6 / 4 Blue Area Islamabad, Pakistan.
Feeny, P. R. (1976). Plant appearency and chemical defense. Recent Adv.
Phytochem. 10:1-40.
Fleming, G. A. (1973). Mineral composition of herbage, (Eds G.W. Butler
and R.W.Bailey). Academic Press, New York.
Fonseca, A. J.M., Dias-da-Silva,A. A. and Ørskov, E. R. (1998). In sacco
gedradation characteristics as predictor of digestibility and
voluntary intake of roughages by mature ewes. Anim.Feed Sci.
Technol. 72:205-219.
Food and Agriculture Organization, (1983). Report of the Balochistan
assistance to rangelands and livestock development survey.
TCP/ PAK/0107. FAO. Tech. Coop. Prog., Fao, Pakistan.
Forwood, J. W, and Owensby, C. E. (1985).Nutritive Value of tree leaves
in the Kansas Flint Hills. Jour of Range Management 38(1) 61-
64.
Garcia- Moya, E. and McKell, C. M. (1970). Contribution of shrubs to the
nitrogen economy of a desert wash plant community. Ecology
51, 81- 88.
Garry, L, Lees., Christopher, F, Hinks and Suttill, Neil, H. (1994). Effect of
high temperature on condensed tannin accumulation in leaf
tissues of big Trefoil (Lotus uliginosus Schkuhr) J. Sci. Food
Agric. 65:415-421.
Gershenzon, J. (1984). Changes in level of plant secondary metabolites
under water and nutrient stress. Recent Adv.
Phytochem.18:273-320.
Good, R. (1947). “The geography of flowering plants.” Longman, Green,
London.
Gowda, N. K. S., Parasad, C. S., Ashok, I. B. and Ramana, J. V. (2004).
Utilization of dietary nutrients, retention and plasma level of
certain minerals in crossbred dairy cows as influenced by
source of mineral supplementation. Asian-Aust. J. Anim. Sci.
vol. 17.No 2: 224-227.
Graetz, R. D. and Wilson, A. D. (1979).An assessment of herbivore diets in
the chenopod Shrub lands. In: Rangelands: Graetz RD and
Howes, K. M. W, eds. Studies of the Australian Arid Zone. I.
V.Chenopod Shrublands, pp 144-159.CSIRO, Melbourne.
Greene, L. W., Pinchak, W.E., and Heitschmidt, R. K. (1987). Seasonal
dynamics of minerals of forage at the Texas experimental
Ranch. Jour of Range Management. 40:502-506.
Grey, C. B., Cowan, D. P., Langton, S. D., and Watkins, R. W. (1997).
Systematic application of L- phenylalanine increases plant
resistance to vertebrate herbivory. J. Chem. Ecol. 23: 1463-
1470.
Hanley, T. A., Robbins, C, T., Hagermann, A. E. and McArthur, C. (1992).
Predicting digestible protein and digestible DM in tannin-
containing forages consumed by ruminants. Ecology. 73:537-
541.
Hanlon, E.A., Kidder, G., and Mc Neal, B. L. (1990). Soil, Container
Media and Water Testing: Interpretations and IFAS
Standardized Fertilization Recommendations. Circular 817.
Florida Cooperative Extension Service, Institute of Food and
Agricultural Science, University of Florida, Gainesville, FL.
Haslam, E. (1988). Plant polyphenoles (Syn vegetable tannins) and
chemical defence-a reappraisal. J.Chem. Ecol. 14: 1789-1805.
Haukioja, E., Niemela, P., Iso-Ivari, L., Ojala, H., and Aro, E. (1978).
Birch leaves as a resource of herbivores. I. Variation in the
suitability of leaves. Reports from the Kevo Subarctic
Research Station 14:5-12.
Heitschmidt and Stuth. (1993).Grazing Management. An ecological
perspective. Timber press Portland, Oregon.
Heneidy, S. Z. (1992). An Ecological Study of the Grazing Systems of
Mariut, Egypt. Submitted to UNESCO. pp: 51.
Heneidy, S. Z. (2002). Role of Indicator Range Species as Browsing Forage
and Effective Nutritive Source, in Matruh Area, a
Mediterranean Coastal Region, NW- Egypt.
Holdridge, L.R. (1947). Determination of world plant formations from
simple climatic data. Science 107: 367. -368.
Holecchek, J. L., Pipeper. R. D. and Herbal. C. H. (1995). Range
management. Principals and Practices. 2nd Edition. (Prentice
Hall, Inc. USA).
Holecchek, J., Munshikpu . A.V., Saiwana. L., Nuñez-Hernánde, G.,
Valdez R., Wallace J. D., and Cardenas, M. (1990). Influences
of six shrubs diets varying in phenol content on intake and
nitrogen retention by goats. Tropical Grasslands. Volume
24:93-98.
Horner, J. D., Gosz, J .R. and Cates, R. G. (1988).The role of carbon- based plant secondary
metabolite in ecomposition in terrestrial ecosystem. Am. Nat. 132:869-880.
Hunting Survey Corporation.(1960) Reconnaissance Geology of part of West Pakistan: A
Colombo Plan cooperation Project, Toronto,Canada.
550 p. Survey of Pakistan Geog. Map. 26. Qta.
Huston, J. E. and Pinchak, W.E. (1993). Range animal nutrition: In:
Grazing management. An Ecological perspective. Timber press
Portland, Oregon.
Hyder, D. N. (1973). Arid Shrublands. Proc. Third Workshop of the United
States / Australia Rangeland Panel. Tucson, Arizona. March 26
April 5, 1973. Soc. Range Manage. Denver, Colorado.
IUCN, (1999). Balochistan Conservation Strategy. 3rd draft July 1999.
Jonasson, S., Bryant, J. P., Chapin. F. S. III and Andreson, M. (986). Plant
phenolics and nutrients in relation to variation in climate and
rodent grazing. Am. Nat. 128:394-408.
Jones, D. I. H. and Wilson, A. D. (1987). Nutritive Quality of Forage. In:
the nutrition of herbivores (Eds.J. B. hacker and J.H.
Ternouth). Pp.65-90 Academic press Australia.
Jumba, I.O., Suttle, N. F., and Wadigo, S. O. (1996). Minearal composition
of tropical. Forages in the mount Elgan region of Kenya. I.
Macro. Minerals. Tropical Agriculture. 73: 108-112
Kabata-Pendias, A. and Pendias, H. (1986). Trace elements in Soil and
Plants. CRC Press, Inc. BocaRaton, Florida.
Khan, A.H and Hussain, S.M. (1963). Ecological assessment of the effect
of closure in Quetta Division Forest Hazargangi. Pak. J. For.13:
(2) 167-193.
Khan. Z. I., Hussain, A., Ashraf, M., Valeem, E. E., Ashraf, M. Y., and
Akhtar, M. S. (2004). Seasonal variation in soil and forage
mineral concentrations in semiarid regions of Pakistan. Pak. J.
Bot. 36 (3): 635 – 640.
Khan. Z. I., Hussain, A., Ashraf, M., Valeem, E. E., Ashraf, M. Y., and
Akhtar, M. S.(2004). Soil and forage mineral (trace elements
status of grazing pasture in the semi arid region o Pakistan.
Pak. J. Bot. 36 (4): 851 – 856
Kumar, R., and D’Mello, J. P. F. (1995). Anti-nutritional Factors in Forage
Legumes. In: (Ed. J. P. F. D’Mello and C. Devendra) Tropical
Legumes in Animal Nutrition. pp. 95-124. CAB International,
Wallington, U.K.
Kumar, R., and Vaithyanathan, S. (1990). Occurrence, nutritional
significance and effect on animal productivity of tannins in tree
leaves. Anim. Feed Sci. Technol.30:21-38.
Le Houerou, H. N. (1993). Environmental aspects of fodder trees and
shrubs plantation in the Mediterranean basin. Page 11-33: In:
Fodder trees and shrubs in the Mediterranean production
System: Objective and Expected Results of the EC Research
Contract (V.P. Papanastasis, ed.).Agriculture, Agrimed
Research Programmed, Commission of the European
Communities, EUR 11459 EN.
Le Houerou, H. N. (1992). The role of salt bushes (Atriplex spp). In arid
Land Rehabilitation in the Mediterranean Basin. A Review
Agro forestry Systems, 18:107-148.
Lefroy, E. C ., Dann, P. R., Wildin, J. H., Wesley- Smith, R. N., and Mc
Gowan, A. A. (1992). Trees and Shrubs as Sources of Fodder
in Australia. Agro forestry Systems 20:139-139.
Leigh, J. H. and Melham, W. E. (1986). Selection of diet by sheep grazing
semi-arid pastures on the riverine plain. Aust Exp Agric Anim
Sic. 6:468-474.
Leng, R. A. (1997). Tree Foliage in Ruminant Nutrition. FAO. Animal
Production and Health paper-139. FAO, United Nations,
Rome.
Lindroth, R. L. (1988). Adaptation of mammalian herbivores to plant
chemical defenses. Pp. 415-445, in K. C. Spencer (ed).
Chemical Mediation of Co evolution. Academic press. New
York.
Little, D, A. (1982). Utilization of minerals. In Hacker, J.B.(Ed.),
Nutritional limits to animal production from Pastures, pp. 259-
283. Farnham Royal, Uk: Common Wealth Agricultural
Bureau.
Malcolm, C.V. (1996).Management of forage shrub plantations in
Australia. In: Fodder shrub development in arid and Semi-arid
Zones.Proceedings of the Workshop on Native and Exotic
Fodder Shrubs in Arid and semi arid zones. 27th Oct-2nd Nov
1996, Hammamet, Tunisia. Volume1.
Mangan, J. (1988). Nutritional Effects of tannins in animal feeds. Nutr.
Res. Rev. 1: 209-231.
Marschner, H. (1995). Mineral nutrition of Higher Plants, 2nd ed.
Academic Press, London.
Martin, P. C. (1998). Nutritive value of tropical grasses. Cuban J. Agric.
Sci. 23:1.
Marwat, Q. D. and Haq .I. (1980). Phytoeological studies of vegetation in
Hanna -uruk areas of Quetta. Department of Botany, University
of Peshawar. M.Sc. Thesis.
Mattson, W. J.(1980). Herbivory in relation to plant nitrogen content.
Annual Review of Ecology and systamatics 11:11
May, D., and Killingbeck, K. T. (1992). Effects of preventing nutrient
resorption on plant fitness and foliar nutrient dynamics.
Ecology. 73: 1868-1878.
Mc Dowell, L. R. (1997). Minerals for grazing ruminants in tropical
regions. Extension Bulletin, Department of Animal Science,
Center for Tropical Agriculture, University of Florida,
Gainesville, FL.
Mc Kell, C. M., Blaisdell, J. P., and Goodin, J. R. (1972). Wild land
Shrubs- Their Biology and Utilization. U. S. D. A. Forest
Service Tech. Rept. INT-1. (ed. ).
McKell, C. M. (1975). Shrub- a neglected resource. Science 187:803-808.
Mc Naughton, S. J. (1979 b). Grazing as an optimization process:
Grass-ungulate relationships in the Serengeti. Amer Nat.
113:691-703.
Mc Naughton, S. J. and Chapin, F.S., 111. (1985). Effects of Phosphorus
nutrition and Defoliation on C4 graminoids from the Serengeti
plains. Ecology 66:5. 1617-1629.
McArthur, C., Hagerman, A. E., Robbins, C, T. (1991). Physilogical
Strategies of Mammalian herbivores against plant defence. In:
Palo, R,T; Robbins, C. T., eds. Plant defenses against
mammalian herbivory. Boca Raton, Fl: CRC press; 103-114.
McArthur, E. D. (1988). New plant development in range management. In
tueller, P. T., ed. Vegetation Science applications for rangeland
analysis and management. The Netherlands: Dordrecht:81-112.
Miller, S. (1991). Improving the Nutritional Quality of Mulga Line, Dept
primary Industries, Charleville, Old.
Minson, D. J.(1990). Forage in ruminant nutrition. Division of tropical
crops and pastures.Common Wealth scientific and industrial
research organization. St. LUCI, Queensland, Australia. P. 51.
Minson, D. J.(1982). Effects of chemical and physical composition of
herbage eaten upon intake. In: ‘Nutritional Limits to Animal
Production from Pastures.’ (Ed. J. B. Hacker.) pp. 167-82.
(Common Wealth Agricultural Bur : UK.)
Mitchell, H.L. (1936). Trends in nitrogen, phosphorus, potassium, and
calcium content of the leaves of some forest trees during the
growing season. Black Rock Forest Papers 1:30
Muhammad, N. (1989). Rangeland management in Pakistan. ICIMOD
Senior fellow ship serried No.1.International Centre for
Integrated Mountain Development, (ICIMOD), Katmandu,
Nepal.
Muhammad, N., Mirza, S. N., and Khan, M. (1986). Pakistan Arid
Scrublands- A Potential resource. Progressive Farming. 6:45-
48.
Mole, S. and Joern, A. (1993). Foliar phenolics of Nebraska sand hills
prairie graminoids: between-years, seasonal and interspecfic
varation.-J.Chem.Ecol.19:1861-1874.
Mooney, H. A., Field, C., Gulmon, S.L., Bazzaz., F. A.
(1981).Photosynthetic capacity in relation to leaf position in
deserts versus old field annuals. Oecologia.50, 109-112.
Mooney, H. A., and Gulmon, S. L. (1982). Constraints on leaf structure
and function in reference to herbivory. Bio science. 32:198-
206.
Morley, F. H. W. (1981). Management of Grazing Systems, p.379-400. In: F. H. W.
Morley (ed.), Grazing animals. Elsevier, New York.
Mould, E. D., and Robbins, C. T. (1981). Nitrogen metabolism in elk. J.
Wild. Manage. 45:323-332.
Nasrullah., Niimi, M., Akashi, R., and Kawamura, O. (2004). Nutritive
evaluation of forage plants grown in South Sulawesi, Indonesia
II. Mineral Composition (Asian-Aust, J. Anim. Sci. Vol. 17,
No. 1 : 63-67)
Nasrullah., Niimi, M., Akashi, R., and Kawamura, O. (2003). Nutritive
evaluation of some browse tree legume foliage native to semi-
arid areas in western Tanzania. Asian-Aust. J. Anim.Sci. Vol.
16, No 10:1429-1437.
Nastis, A. S., and Malechek, J. C. (1981). Digestions and utilization of
nutrients in oak browse by goats. J. Anim. Sci. 53: 283-289.
Nastis, A. S. (1993). Nutritive value of fodder shrubs. Page 75-81: In:
Fodder trees and shrubs in the mediterranean production
System: Objective and Expected Results of the EC Research
Contract (V.P. Papanastasis, ed.).Agriculture, Agrimed
Research Programmed, Commission of the European
Communities, EUR 11459 EN.
Nelson, C. J and Mosler, L. E. (1994). Plant factor affect in forage quality.
In Forage quality, evaluation, and Utilization. Editor George C.
Fahey, Jr (Univ of Nebraska, Lincolin, USA) 115-154.
Nikman, V. and Lisar, Y. (2004). Chemical composition of Astragalus:
Carbohydrates and Mucilage content. Pak. J. Bot. 36 (2):381-
388.
Niknam, V,. and Ebrahimzadeh, H. and Maassoumi, A. A. (2003).
Toxic nitro- compounds in Astragalus species. Biochem. Syst.
Ecol. 6: 557-562.
Niknam, V,. and Ebrahimzadeh, H. (2002b). Phenolics content in
Astragalus species. Pak. J. Bot., 34(3): 283-289.
Nitis, I. M. (1989). Fodder trees and livestock production under harsh
environment. Asian Livestock. October 1989: 116-120.
Northup, R., Yu, Z., Dahlgren, R.A., and Vogt, K. A.(1995) . Polyphenol
control of nitrogen. Release from pine litter. Nature. H.
377:227-29.
Norton, B.W. (1981). Differences between species in forage quality. In :
Hacker, J. B. (Ed.).Nutritional limits to animals production
from pastures, pp.89-110. Proceedings of an International
symposium held at St Lucida, Queen’s land. Australia.
Noy-Meir, I.(1973). Desert ecosystems: environment and producers. In:
Johnston, R. F.,ed. Annual review of ecology and systematic.
Palo Alto, Ca: Annual Review, Inc.4:25-52.
NRC, (1996). Nutrient Requirement of Beef cattle (7th Rev. Edt.).
National Research Council, Washington, DC; National
Academy Press.
Nuñez- Hernández, G., Holecheck, J. L., Wallace, J. D., Galyean, M.L.,
Tembo, A.,Valdez,R.& Cardenas, M. (1989). Influence of
native shrubs on nutritional status of goats: nitrogen retention.
Journal of Range Management, 42:228-232.
Özcan, T., and G. Bayçu .(2005). Some elemental concentrations in the
acorns of turkish Quercus L. (Fagaceae) taxa. Pak.J. Bot.
37(2):361-371.
Pakistan Agricultural Research Council Islamabad.(1982). Manual of Feed
Analysis. (PARC).
Palmer, B and Schlink, A. C. (1992). The effect of drying on the intake
and rate of digestion of shrub legume. Calliandra calothyrsus.
Tropical Grassland. 26:89-83.
Papachristou, T. G. and Pananastasis, V. P. (1994). Forage value of
mediterranean deciduous woody fodder species and its
limitation to managament of silivo-patoral systems for goats.
Agro forestry system. 27(3):269-282.
Papanastasis, V.P. (1993). Review of papers on woody forage plants.
Herba 6:28-33.
Papanastasis, V.P., Platis, P. D. and Dini- Papanastasis, O. (1998). Effects
of age and frequency of cutting on productivity of
Mediterranean deciduous fodder tree and shrubs plantations.
Forest ecology and Management, 110:283-292.
Parthasarathy, M. (1986). Effect of feeding varying levels of Khejri
(Prosopis cineraria) leaves and concentrate on the performance
of Weaker Kids. Indian Journal of Animal Nutrition. 3: 249-
253.
Phillipson, A. T., Mc Anally, R.A. (1942). Studies on the fate of
carbohydrates in the rumen of sheep. Journal of experimental
Biology. 19:199- 214.
Poland, J .S & Schnabel, J. A.(1980). Mineral composition of Digitaria
decumbens and Bracheria decunben. J: America Tropical
Agricultur 57: 258-265.
Provenza, F. D., (1995).Postingestive feedback as an elementary
determinant of food preference and intake in ruminants. J.
Range Manage.48:2-17
Provenza, F. D., Lynch, J. J., Nolan, J. V. (1994a). Food Aversion
conditioned in anesthetized sheep. Physiology and Behaviour.
Vol. 55:3:429-432.
Provenza, F. D.,(1994 b). Acquired Aversions as the basis for varied diets
of ruminants foraging on range lands. J. Animal Sci. 74: 2010-
2020.
Qadir, S. A. (1968). Bio-climatic plant formation of West Pakistan. Abs.
Bio. Sci. Proc. Pak. Sci. Conf.
Qadir, S. A. and Ahmed, S. (1989). Phytosociology of woodland
communities of Hazargangi National Park QTA. Pak. J. Bot.
21 (1): 128-139.
Raghavan, G. N (1989). Availability and use of shrubs and tree fodder in
India. “Shrubs and Tree Fodder for Farm
Animals”(Ed.C.Devendra). Proceeding of Workshop in
Denpasar, Indonesia, 24-29 July. 196-210.
Ranganna, S. (1986). Handbook of analysis and quality control for fruit
and vegetable products. Tata McGraw-Hill Publishing
Company Ltd. New Delhi, pp. 66-82.
Rathcke, B. (1985). Slugs as generalist herbivores: Tests of three
hypotheses on. Plant choices. Ecology, 66 (3), pp. 828-836.
Reuter, D. J., and Robinson, J. B. (1986). Plant analysis Intake Press,
Melbourne, Sydney.pp.369-390.
Rhue, E. D., and Kidder, G. (1983). Analytical procedures used by the
IFAS extension soil testing laboratory and the interpretation of
results. Soil Science department, University of Florida,
Gainesville.
Robinson, K. N. (1982). An evaluation of the relationships between fecal
nitrogen and digestibility, crude protein and dry matter in take
of forages. M. S. Thesis. Texas A & M Univ., College
Station.
Rosales, M and Gill, M. (1997). Tree mixture within integrated farming
systems. Live stock Research for rural Development.Vol:9 66-
79.
Rosenschein, A., Tietemet, T., and Hall, D.O. (1999). Biomass
measurement and monitoring of trees and shrubs in a Semi-arid
region of central Kenya. Journal of arid environment. 42: 97-
116.
Rubanza, C. D. K., Shem, M. N., Otsyina, R., Iehinohe, T., and T.
Fujihara, T. (2003). Nutritive Evaluation of some browse tree
legume foliages native to semi-arid areas in Western Tanzania
Asia-Aust. J. Anim. Sci. Vol: 16, No. 10: 1429-1437)
Sarwat. N. M., Sarfraz, A and Islam, M.(2002).The vagaries of drought in
Balochistan and strategies to reduce economic losses.
Balochistan Agricultural Science.3:39-42.
Scholes, R. J. and Walker, B. H. (1993). An African Savanna: Synthesis of
the Nylsvley study Cambridge: Cambridge University Press.
306 pp.
Schroeder, L. A. (1986). Changes in tree leaf quality and growth
performance of lepidopteran larvae. Ecology. 67:1628-1636.
Scriber, J. M. (1984). Host plant suitability. Pages. 159-202 in R. T.
Carde and W. J. Bell, editors. Chemical ecology of
insects.Chapman Hall, London, England.
Sharifi, M. R., Nilsen, E.T. and Rondel, P.W. (1990). Biomass and net
primary production of Prosopis glandulosa, (Fabaceae) in the
Sonora desert of California. American Journal of Botany, 69:
760-767.
Shavo, C. M.(1997). Use, yield and nutritive value of mulberry (Morus
alba) trees for ruminants, in the semi arid areas of central
Tanzania. Tropical-Grasslands 31(6): 599-604.
Sheikh, M. I.(1993). Trees of Pakistan.Win rock International Institute for
Agricultural development.
Silva. Colomer, J. H., and Passera, C. B. (1990).The nutritional value of
Atriplex spp. As fodder for arid regions. Journal of Arid
Environments 19: 289-295.
Singh, R. V. (1982). Fodder Trees in India. Oxford and IBH Publishing
Co., New Delhi, India.
Skarpe, C. and Bergstrom, R. (1986). Nutrient content and digestibility of
forage plants in relation to plant phenology and rainfall in the
Kalahari, Botswana. J. Arid Environ. 11:147-164.
Smith, L. R., and Smith, T. M.(1989).Fundamental of ecology. 4th edition.
Wesely Longman (New York)
Society for Range Management. (1989). A glossary of terms used in range
management, 3rd ed. Soc. Range Manage., Denver, CO.USA.
Squires, V. R and Siebert, B. D. (1983).Botanical and chemical
components of the diet and live weight change in cattle on
semi-desert rangeland in Central Australia. Aust Rangel J
5(1):28-34.
SSSA,(1952).Report of sub committee on permeability and infiltration,
committee of terminology. Soil Sci Soc. Amer. (SSSA). Proc.,
16: 85 – 88.
Standard tables of feed composition in Japan. (2001). Central association
of livestock industry. Edited by agriculture, forestry and
fisheries research council secretariat, MAFF.
Subba , D. B.,Tamang, P. M., and Tamang, B. B. (1994). Seasonal
fodders in the eastern hills of Nepal. Vet. Rev., 9 & 10, 23-26.
Subba , D. B. (1998). Chemical Composition and Nutritive Values of
Feeds of East Nepal. Pakhribas Agricultureal Centre Dhankuta,
Nepal.
Suleman, S., Wood, M.K., Shah, B.H., and Murray,L.(1995).Rain water
harvesting for increasing live stock forage on arid rangelands of
Pakistan. Journal of Range Management 48, 523-527.
Swain, T. (1979). Tannins and lignins. P. 657-682. In: G. A. Rosenthal
and D. H. Janzen, eds. Herbivores: Their interaction with
secondary plants metabolites. Academic press, New York.
Tewatia, B. S. and Virk, A. S.(1996).Nutritional potential of Faba bean for
improved productivity in Ruminants. F A B I S- News letter,
38-39.
Tiffany, M. E., Mc Dowell, L.R., O’Connor, G. A., Nguyen, H., Martin,
F.G., Wilkinson, N.S., Cardoso, E.C. (2000). Effects of Pasture
applied biosolids on forage and soil concentration over a
grazing season in north Florida. I. Macrominerals. Crude
Protein and In Vitro Digestibility, Commun. Soil Sci. Plant
Anal., 31: 201 – 203.
Ueckert, D.N.(1985). “Use of shrubs for rangeland revegetation”. In:
Proceedings of the International Ranchers Roundup. Laredo,
Texas. Texas Agricultural Extension.
Van Soest, P. J. (1994). Nutrition Ecology of ruminants. Cornell
University Press, Ithaca and London, p. 476.
Van Soest, P. J. (1993). Cell wall matrix interactions and degradation-
session synopsis. In: forage cell wall structure and digestibility,
Editors G Jung, D P Buxton, R D Hatfield and J Ralph. P377.
ASA. CSSA, Madison, WI.
Van Soest, P. J. (1982). Nutritional ecology of the ruminant. O&B Books,
Inc., Corvallis, Ore.
VanGill, H. and Baig, M.S. (1992).Environmental Profile: Balochistan,
Pakistan. (Land Resource and Urban Sciences Department,
International Institute for Aerospace Survey and Earth Science:
Enschede, Netherlands).
Viets, F. G., and Lindsay, W. I.(1973). Testing soil for zinc,copper,
manganese and iron.In:Soil testing and plant analysis (Ed.).L.
M.Walsh and J.Beaton. soil Science of animal Production.
Wahid, A., (1990). Dietary composition and nutritional status of sheep
and goats grazing two rangeland types in Balochistan, Pakistan.
Ph.D thesis, Oregon State University. USA.
Wallace, A., Romney, E. M., Hunter, R. B., Kinnear, J. E. and Alexander,
G. V. (1980). Mineral composition of Atriplex hymenelytra
growing in the northern Mojave Desert, pp. 154-160, in S.L.
Wood, ed., Great Basin, naturalist memoirs, Number 4.
Brigham Young University, Provo, Utah.
Walser, R.H., Weber, D. J., McArthur, E. D., and Sanderson, S.C.(1990).
Salinity and moisture stress in relation to die off of Wild land
Shrubs. In: Proceeding-Symposium on Cheat grass Invasion,
Shrub Die-Off, and Other Aspects of Shrub Biology and
Management. Las Vegas, NV, April 5-7 1989.
Wang, J. and Provenza, F. D.(1997).Dynamic of preference by sheep
offered foods varying in flavors, nutrients, and a toxin. Jour of
Chemical ecology. Vol:23 No: 2. 275-288.
Wang, J. and Provenza, F. D.(1996). Food deprivation affects preference
of sheep for foods varying in nutrients and a toxin. Jour of
Chemical Ecology. Vol: 22. 11. 2011 – 2021.
Waterman, P. G. and Mole, S.(1994). Analysis of Phenolics Metabolites.
Blackwell Scientific Publications, Oxford.
Weber, D.J., Nelson, D. L.,Hess, W. M., and Bhat, R.B. (1990). Salinity
and moisture stress in relation to die off of Wild land Shrubs.
Proceedings- Symposium on Cheatgrass Invasion, Shrub Die-
off , and Other Aspects Of Shrub Biology and Management
West, N.E. (1982). Dynamics of plant communities dominated by
chenopod shrubs. International Journal of ecology and
environmental Science. 8:73-84
West, N.E., and Ibrahim, K.I.(1968). Soil vegetation relation ships in the
shade scale zone of southeastern Utah Ecology. 49:445-456.
West, N., and Skujins, J. (1978). “Nitrogen in Desert Ecosystem.”
Hutchinson & Ross, Stroudsburg, Pennsylvania.
Wiener, J.G.(1975). Nutrient cycles, nutrient limitation and vertebrate
populations. Biologist 57, 104-24.
Wilson, A. D. (1969). A review of browse in the nutrition of gazing
animals. Journal of Range Management 22: 23 – 28.
Wilson, J. R.(1981).Environmental and nutritional factors affecting
herbage quality. In: Nutritional limits to animal production
from pasture. (eds.J.B.Hacker). pp111-113. Common Wealth
Agricultural Bureaux:Uk).
Yousseff, F.G., Medowell, L.R., and Brathwaite, R.A.I. (1999). The status
of certain trace minerals and sulphur of some tropical grasses in
Trinidad. Trop. Agric., 76:57 – 62.
Yu, P., Christensen, D.A., Mc Kinnon, J. J., and Soita, H.W. (2004).Using
chemical and biological approaches to predict energy values of
selected forages affected by variety and maturity stage:
comparison of three approaches. Asian Austin.
J.Anim.Sci.vol17, No 2:228-236.
Zucker, W.V. (1983). Tannins: does structure determine function? An
ecological perspective. The American Naturalist, 121:335-365.
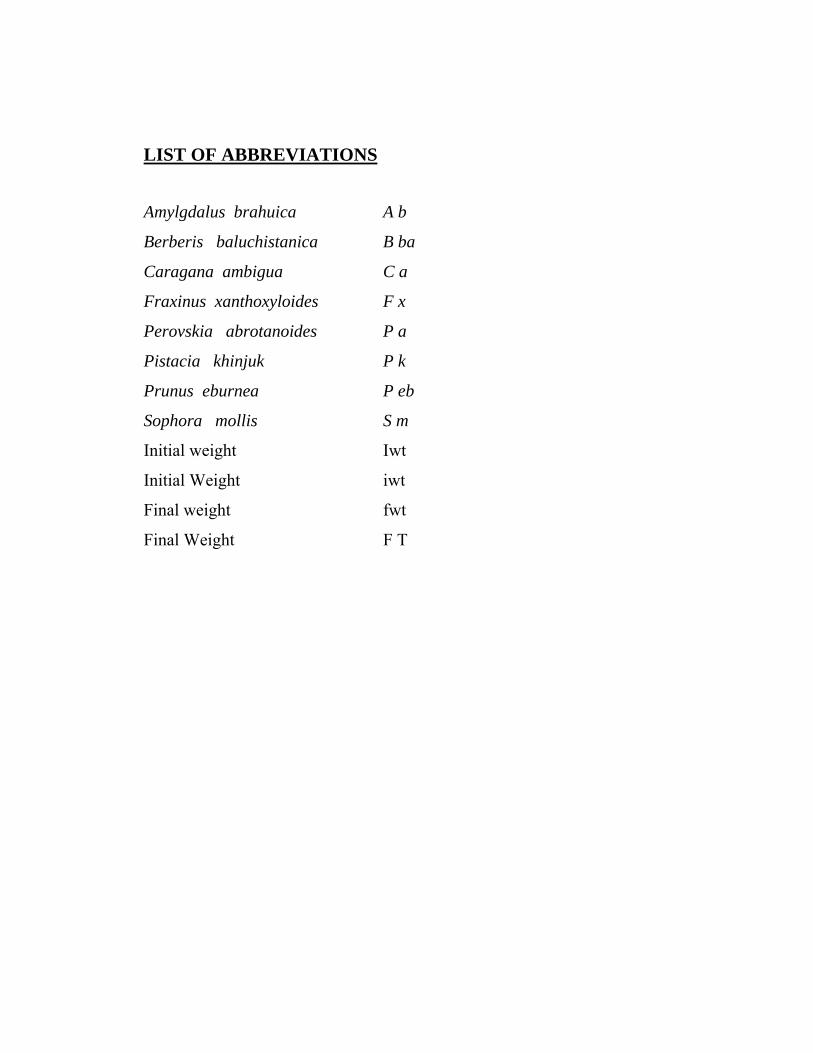
LIST OF ABBREVIATIONS Amylgdalus brahuica A b
Berberis baluchistanica B ba
Caragana ambigua C a
Fraxinus xanthoxyloides F x
Perovskia abrotanoides P a
Pistacia khinjuk P k
Prunus eburnea P eb
Sophora mollis S m
Initial weight Iwt
Initial Weight iwt
Final weight fwt
Final Weight F T