scoping study for integrated catchment modelling in the ... · science report – scoping study for...
TRANSCRIPT
Science Report – Scoping study for integrated catchment modelling in the Frome–Piddle i
Scoping study for integrated catchment modelling in the Frome–Piddle
Science Report – SC050047
SCHO0708BOHI-E-P
Science Report – Scoping study for integrated catchment modelling in the Frome–Piddle ii
The Environment Agency is the leading public body protecting and improving the environment in England and Wales.
It’s our job to make sure that air, land and water are looked after by everyone in today’s society, so that tomorrow’s generations inherit a cleaner, healthier world.
Our work includes tackling flooding and pollution incidents, reducing industry’s impacts on the environment, cleaning up rivers, coastal waters and contaminated land, and improving wildlife habitats.
Published by: Environment Agency, Rio House, Waterside Drive, Aztec West, Almondsbury, Bristol, BS32 4UD Tel: 01454 624400 Fax: 01454 624409 www.environment-agency.gov.uk ISBN: 978-1-84432-925-0 © Environment Agency – August 2008 All rights reserved. This document may be reproduced with prior permission of the Environment Agency. The views and statements expressed in this report are those of the author alone. The views or statements expressed in this publication do not necessarily represent the views of the Environment Agency and the Environment Agency cannot accept any responsibility for such views or statements. This report is printed on Cyclus Print, a 100% recycled stock, which is 100% post consumer waste and is totally chlorine free. Water used is treated and in most cases returned to source in better condition than removed. Further copies of this report are available from: The Environment Agency’s National Customer Contact Centre by emailing: [email protected] or by telephoning 08708 506506.
Authors: Paul Hulme Nick Jarritt Felicity Miller Tim Power Rob Soley Dissemination Status: Released to all regions Publicly available Keywords: Integrated Catchment Management, Water Framework Directive, WAgriCo Research Contractor: Entec UK Ltd, 17 Angel Gate, City Road, London, EC1V 2SH Tel: 0207 843 1400 Environment Agency’s Project Manager: Paul Hulme, Science Department Collaborators: ADAS, Defra, Environment Agency, National Farmers’ Union, Wessex Water Services Ltd and UK Water Industry Research Ltd Science Project Number: SC050047 Product Code: SCHO0708BOHI-E-P
Science Report – Scoping study for integrated catchment modelling in the Frome–Piddle iii
Science at the Environment Agency Science underpins the work of the Environment Agency. It provides an up-to-date understanding of the world about us and helps us to develop monitoring tools and techniques to manage our environment as efficiently and effectively as possible.
The work of the Environment Agency’s Science Department is a key ingredient in the partnership between research, policy and operations that enables the Environment Agency to protect and restore our environment.
The science programme focuses on five main areas of activity:
• Setting the agenda, by identifying where strategic science can inform our evidence-based policies, advisory and regulatory roles;
• Funding science, by supporting programmes, projects and people in response to long-term strategic needs, medium-term policy priorities and shorter-term operational requirements;
• Managing science, by ensuring that our programmes and projects are fit for purpose and executed according to international scientific standards;
• Carrying out science, by undertaking research – either by contracting it out to research organisations and consultancies or by doing it ourselves;
• Delivering information, advice, tools and techniques, by making appropriate products available to our policy and operations staff.
Steve Killeen
Head of Science
Science Report – Scoping study for integrated catchment modelling in the Frome–Piddle iv
Executive summary This report details a short project to scope out and launch a programme of research into the knowledge transfer part of the Environment Agency’s Integrated Catchment Science Research Programme. The work focused attention on the Frome and Piddle trial catchments in Dorset and included:
• holding two workshops: the first with local people working in the Frome–Piddle catchment to develop ideas and scope out the programme, the second with external specialists interested in research collaboration;
• a brief literature review;
• rapid trialling of MIKE BASIN as an example of a lumped catchment model; and
• demonstration of the possible benefits of GIS as a platform for knowledge sharing and more integrated catchment management.
This work was funded by the Environment Agency as part of our contribution to the Life-funded EU Project (ENV D/000182) – Water Management in Cooperation with Agriculture (WAgriCo). It was undertaken to better understand water quality issues in the catchment and support the groundwater modelling to be carried out as part of the WAgriCo project.
The main conclusions and recommendations from the work are listed below.
i. GIS maps and applications have great potential for analysis and knowledge transfer in the Environment Agency and beyond and thereby stimulate more integrated approaches to catchment management. It is therefore recommended that the use of integrated datasets and model results within a common GIS platform should be developed and further investigated.
ii. Area operational staff are keen to be involved in trialling approaches for knowledge sharing and analysis in GIS. It is recommended that users are able to amend the local detail in any approach that is developed.
iii. Many operational staff do not have easy access to local data collected by other Environment Agency functions. To overcome this, it is recommended that all the data already available in GIS format are gathered together, across all Environment Agency functions for a particular catchment. This will aid strategic planning of catchment management.
iv. There are likely to be complex intellectual property rights (IPR) and copyright issues associated with the use and sharing of data, particularly from external sources. If these can be overcome, the sharing of data between the Environment Agency and external stakeholders could extend the value of the GIS.
v. In the limited time available to carry out the literature review it is evident that work is ongoing on many projects and tools for integrated catchment modelling. Several are new, and it is not possible to tell how useful they are without either trialling them directly, or unless a relevant paper describing such a trial has been published. This needs to be investigated further.
vi. Area operational staff do not want money spent on developing complex modelling tools; however, they would like to know what simple tools are available and how they might be used to analyse the data.
Science Report – Scoping study for integrated catchment modelling in the Frome–Piddle v
vii. Current understanding of pathways and connectivity within catchments is limited.
viii. The trial using Mike-BASIN demonstrates that, once the user is familiar with the software, it is easy to use and is suitable for lumped catchment modelling. However, it has not moved us forward with modelling the links between the sources and receptors of diffuse pollution, and further work is needed to test the concepts involved in modelling catchments in such an integrated way.
A follow-on project (Making Information Available for Integrated Catchment Management SC060035/SR) started in January 2007. One of the main aims of this project is to collate locally relevant GIS information and trial the development and use of a GIS-based system by Environment Agency staff in the Frome–Piddle catchment and across the wider South West Region.
Science Report – Scoping study for integrated catchment modelling in the Frome–Piddle vi
Acknowledgements We would like to thank the following people who have given data/time/input to this project. In no particular order these are:
Environment Agency: Paul Sadler, Pauline Johnstone, Emma Rothero, Melissa Robson, Susie Roy, Karen Croker, Alison Matthews, Fran Walker, Ben Bunting, Rachel Jacobs, Jim Grundy, Neil Murdoch, Steve Fletcher, Dave Johnson, Fenella Brown, Stuart Allen, Natalie Phillips, Alwyn Hart, Andrew Wither, Sean Burke, Susan Caspar, Veronique Adriaenssens, Larissa Naylor, Rachael Dils, Mark Everard
CEH Dorset: John Hilton, Jim Smith
Wessex Water: Paul Stanfield
BGS: Andrew Hughes
CEH: Mike Hutchins, Jim Smith
ADAS: Martin Silgram, Paul Davison
Sheffield University: David Lerner
University of Birmingham: Rae MacKay
Newcastle University: Geoff Parkin
University of Nottingham: Andrew Cliff
Science Report – Scoping study for integrated catchment modelling in the Frome–Piddle vii
Contents Science at the Environment Agency iii
Executive summary iv
Acknowledgements vi
Contents vii
1 Introduction 1
2 Integrated Catchment Science research programme and the knowledge transfer package 2
3 The Frome and Piddle catchment and WAgriCo 3
4 Workshops 4 4.1 Workshop 1 4 4.2 Workshop 2 5
5 Literature review 7
6 Lumped catchment model trial 9
7 GIS as a platform for integrated catchment management 11
8 Conclusions and recommendations 13
9 The way forward 14
Appendix A First workshop programme and notes (Frome and Piddle catchment managers) 15
Appendix B Second workshop programme and notes (launching the Integrated Catchment Science programme and knowledge transfer package with potential research partners) 35
Appendix C Review of projects and modelling tools for integrated catchment management 50
Appendix D MIKE BASIN trial modelling 60
Science Report – Scoping study for integrated catchment modelling in the Frome–Piddle 1
1 Introduction This brief report and associated appendices summarise Entec’s involvement in a short project carried out between November 2005 and March 2006 to launch one part of the Environment Agency’s Integrated Catchment Science research programme. The work focused attention on the Frome and Piddle trial catchments in Dorset and included:
• facilitation of two workshops;
• a literature review;
• rapid trialling of MIKE BASIN as an example of a lumped catchment model; and
• collation of map layers, data, tools and links as a demonstration of the possible benefits of GIS as a platform for knowledge sharing and more integrated catchment management.
This work was funded by the Environment Agency as part of our contribution to the Life-funded EU Project (ENV D/000182) – Water Management in Cooperation with Agriculture (WAgriCo). It was undertaken to better understand water quality issues in the catchment and support the groundwater modelling to be carried out as part of the WAgriCo project. Further details on the WAgriCo project can be found in Section 3.
Science Report – Scoping study for integrated catchment modelling in the Frome–Piddle 2
2 Integrated Catchment Science research programme and the knowledge transfer package
The Environment Agency’s Science Group engaged Entec staff to help scope and launch a programme of research into integrated catchment modelling, knowledge transfer and management. This is one of seven work packages which are part of the Environment Agency’s ‘Integrated Catchment Science’ (ICS) programme and will run over a five-year period (2006–2011). By working in partnership with external researchers, the Environment Agency aims to deliver improved approaches to problem solving and knowledge sharing at the catchment scale. This will include the development of tools to encourage a more integrated understanding of catchment processes and the complex interrelationships between different pressures (e.g. pollution, morphology and abstraction) that can put stress on aquatic ecosystems.
Modelling tools which can test and trial alternative management options and solutions may be particularly helpful in informing cost-effective ways of realising environmental improvements on the ground. Such improvements are being particularly driven by the implementation of ‘Programmes of Measures’ to meet the objectives of the EU Water Framework Directive (WFD). These objectives are primarily ecological but also include more integrated management and protection of catchment water resources.
Science Report – Scoping study for integrated catchment modelling in the Frome–Piddle 3
3 The Frome and Piddle catchment and WAgriCo
This area is already the subject of an intensive scientific research and monitoring programme as part of the NERC ‘LOCAR’ (lowland catchment) programme. It is also a pilot area for the EU Life Project, Water Resources Management in Cooperation with Agriculture (WAgriCo). This aims to demonstrate how the cooperation between water resources management and agriculture can be used to reduce diffuse pollution, especially nitrates, for the sustainable achievement of the environmental objectives for groundwater set out in the EC Water Framework Directive. It is a collaborative project piloted in the UK (South West England) and Germany (Lower Saxony). In each location partnerships have been put in place to manage the project. The project is co-funded by the partnerships and by a contribution from the Life financial instrument of the European Community. In the UK the project is based in river catchments of the Frome, Piddle and Wey in Dorset and in Lower Saxony, Germany, the catchments are of the rivers Ems, Weser and Elbe. The UK partners are ADAS, Defra, Environment Agency, National Farmers’ Union, Wessex Water Services Ltd and UK Water Industry Research Ltd.
In order to ensure that the ICS research programme is effectively focused on delivering approaches and tools that will be of real value to practitioners, the involvement of Environment Agency operational and water company staff within a trial catchment has been sought from the outset. The catchments of the rivers Frome and Piddle, which drain into Poole Harbour in Dorset, have been chosen for this purpose. These rivers are groundwater dominated in their upper reaches which drain the chalk aquifer, and flow over less permeable Palaeogene sediments (where runoff and shallow interflow responses are more important) before entering Poole Harbour – a large transitional water body designated under the Habitats Directive regulations. There are several other Natura 2000 terrestrial sites (i.e. the Dorset Heaths) within the catchment. So an integrated understanding of ground and surface water flow systems is important across a variety of water body types which are subject to a range of point and diffuse pollution pressures, physical habitat modifications, and abstraction and discharge stresses.
Diffuse pollution pressures are particularly important here with respect to the eutrophication of both riverine (phosphates) and transitional harbour (nitrate) ecosystems. Rising nitrate concentrations in groundwater are also a risk to drinking water quality, alongside shorter-term peaks in pesticides. Wessex Water is engaged in intensive field monitoring and liaison with landowners and farmers within its groundwater source protection zones in order to improve land management practices and reduce these water quality risks. The Environment Agency’s Catchment Sensitive Farming initiative is also promoting more environmentally sympathetic agricultural approaches at a broader catchment scale.
A wide range of other Environment Agency staff also work within the Frome and Piddle catchment on conservation and fisheries activities, flood risk alleviation and management, water level management plans, abstraction licensing and water resource management, discharge and waste consenting, hydrometric and water quality monitoring. The Centre for Ecology and Hydrology (CEH) is based within the catchment and has a long track record of local research.
Recent work carried out by Entec within the catchment has included the development of a daily rainfall, routed runoff and recharge model which covers the whole area on a uniform 250 metre grid and runs from 1970 to 2006, and the collation of a database of monitoring and WFD risk assessment data.
Science Report – Scoping study for integrated catchment modelling in the Frome–Piddle 4
4 Workshops Two workshops were organised during March 2006. The first, involving people working in the Frome and Piddle catchment, was to develop ideas and scope out the programme. The second shared these ideas with external specialists interested in research collaboration. Appendices A and B of this report include records of these workshops.
4.1 Workshop 1 On 3 March 2006 Environment Agency Science Group representatives and Entec facilitators met in Blandford with operational staff who work in the catchment, the coordinator of Wessex Water’s WAgriCo activities and a representative from CEH. The aim of this first workshop (Appendix A) was to introduce and discuss the scope of the ICS modelling and knowledge transfer research programme. ‘Modelling’ here should be taken in its broadest sense to include conceptual modelling and testing of ideas to improve understanding of the mechanisms along the source–pathway–receptor route, as well as the particular tools that may help to predict the outcomes of alternative management interventions.
Local attendees to the first workshop shared their experiences of working within the Frome and Piddle catchment – the problems which concern them and the way they work. A detailed knowledge of the local situation was an essential component in most people’s jobs. However, there are also many broader areas of overlap where a closer awareness of the activities being carried out by staff from other functions or other organisations could improve the realisation of environmental benefits. One obvious example is the link between schemes to reduce flooding, consequent reductions in sediment and associated bound phosphate load, reductions in eutrophication and the conservation benefits that may result. A more spatially integrated awareness of initiatives and information within a catchment can also be helpful in coordinating engagement with the people who live there and manage the land on a day-to-day basis.
In view of the plethora of possible modelling approaches, the relatively simple step of developing integrated datasets and model results within a common GIS platform was therefore approved as an area that warranted further investigation. Such an approach could yield benefits for all. Representatives from the Science Group summarised the ongoing national initiatives and tool development to support implementation of the Water Framework Directive (WFD). This included presentations on agricultural land management, sediments, riverine ecology and transitional and coastal environments. The WFD should put greater emphasis on integrating the management of estuaries and harbours within the context of the upstream catchment.
Many operational staff do not have easy access to local data collected by other Environment Agency functions. For example, conservation and fisheries staff do not necessarily have easy access to the data which flood defence hold. Nor do they have access to national datasets that have been developed for specific purposes such as WFD risk maps and the datasets supporting the recent Nitrate Vulnerable Zone (NVZ) designations.
Support for integrated catchment management should begin by gathering the data that are already available in GIS format so that Area staff can see all the issues and activities and information that is available across all Environment Agency functions in a particular catchment. This should aid strategic planning of catchment management.
Science Report – Scoping study for integrated catchment modelling in the Frome–Piddle 5
Area staff do not want money spent on developing complex modelling tools but they would like to know what simple tools are already available and how they might be used to analyse the data. As GIS data are collected and reviewed, hypotheses are likely to arise which need to be tested for plausibility. For example, there are a variety of GIS layers related to phosphate pollution. These include:
• the phosphate loading maps developed for the WFD by Rob Willows team;
• the location of sewage treatment works and their discharges;
• the location of septic tanks; and
• the observed phosphate concentrations from the Environment Agency’s monitoring points.
When Area staff consider these data they may be able to form hypotheses about the key sources of phosphate pollution in a river reach or an estuary. It would be useful to have available some simple tools with which to test the plausibility of these hypotheses – for example by estimating the amount of phosphate transferred by each activity and how this compares with that measured.
The first workshop concluded with Environment Agency operational staff keen to get involved in trialling formats and approaches for knowledge sharing and analysis through GIS. Some simple GIS tools will be identified and trialled in the next phase of work (see Section 9).
4.2 Workshop 2 The remainder of the project was focused on preparing a demonstration of GIS as a platform for knowledge sharing and integrated catchment management (summarised below) which could be presented at the second workshop (Appendix B). This was held in Wallingford on 30 March 2006 and was attended by a number of Environment Agency Science Group staff, and by external specialists. These were representatives from CEH, BGS, ADAS and several universities (Birmingham, Newcastle, Nottingham and Sheffield) which are already involved in related research activities and interested in further collaboration with the Environment Agency. The workshop was intended to launch the ICS programme and provide a particular focus on the modelling and knowledge transfer tasks. As in the first workshop, several presentations promoted GIS applications as a route for further development. These included recent Environment Agency work on nitrate vulnerable zones, risks to wetlands, groundwater vulnerability mapping and the development of a decision support tool for agricultural land use management.
As well as promoting better integration, many of these GIS initiatives are also driven by the need for improved analysis and consistent reporting of risks and impacts at a national scale as part of the Environment Agency’s WFD responsibilities. However, it is vital that any initial calculations made at this broad scale are checked by operational staff on the ground. This is because when using GIS systems at a national scale there is a danger that locally significant issues may be missed. This can happen, for example, when field-scale data are averaged to create 1 km2-scale datasets. The development of the new NVZs and the wetland risk assessments has included engagement with Area hydrogeologists to this end but a longer-term process of refinement would be valuable. By applying and improving initial national default assessments it is hoped that such systems could capture, test and share the best available local knowledge in a consistent format which can feed directly into national reporting.
Science Report – Scoping study for integrated catchment modelling in the Frome–Piddle 6
The external specialists also shared progress on their recent and ongoing research in this area and there was a discussion on the difficult issue of Intellectual Property Rights (IPR) and the barriers this can throw up. The second workshop concluded with an invitation for research proposals to be submitted directly to the Environment Agency for support in funding applications.
Science Report – Scoping study for integrated catchment modelling in the Frome–Piddle 7
5 Literature review At the first Area workshop, Entec summarised a short desk-based internet and telephone literature review of integrated catchment modelling projects and tools (presented in Appendix C). These are many and varied. They are typically tailored to suit the particular pressures, processes and ecosystems being considered, as well as the scale at which they are focused. A lumped catchment or distributed model which predicts the impacts of broad-scale land use management changes on riverine phosphorous concentrations may not, for example, be an appropriate tool to consider levels of nitrates in groundwater pumped from an abstraction well. And models focused on pollution or abstraction pressures and processes usually stop short of representing the complex impacts which these may have on the receptor ecosystems. They also rarely build in the localised understanding of impact pathways and mechanisms, or the economic dimensions to a problem, which can both be critical in effecting improvements on the ground.
The majority of the current pollution models available are focused on either defining the risk of mobilisation at source (e.g. export coefficients) or the impact on receptors (e.g. in-stream water quality models such as SIMCAT). Research and therefore current understanding of pathways or connectivity is limited. This is in part due to the spatial and temporal variability of catchment connectivity and the limited data available at the appropriate spatial and temporal resolution to describe the dynamic processes that lead to pollutant transfer from land to receiving water. Improved understanding of connectivity is a key requirement to reduce both model uncertainty and facilitate land management practices aimed at reducing diffuse pollution from agriculture.
One example of ongoing research in this area is the Delivery of Phosphorus from Agricultural Sources to Watercourses or PEDAL project, funded by Defra. This research is evaluating the processes and pathways of phosphorus (P) delivery from agricultural land to water by combining fuzzy modelling and field measures in a range of catchments to predict the delivery of sediment and nutrients to stream channels. PEDAL will help to better inform policy decisions and focus investment in mitigation measures at specific sites where the risk of P delivery may be high. The final output of this research will be a national map of P delivery backed up by scientifically robust delivery coefficients. These coefficients will be presented as a range that will reflect the uncertainty associated, in part, with the limited information contained in the national datasets. In many cases this uncertainty could be reduced through the knowledge of those working in the catchment.
These ‘smart’ export coefficients can also feed into more strategic semi-distributed catchment-scale models, such as the Integrated Lake and Catchment (ILC) model, to provide robust estimates of the relative contribution of diffuse versus point sources. These tools will be essential for generating ‘what if scenarios’ at the catchment scale as part of the River Basin Planning Management process to determine relative economic and environmental benefits of different measures across different sectors.
Another recent model is SCIMAP, a joint project between Durham University and the Centre for Sustainable Water Management at the Lancaster Environment Centre. SCIMAP apportions risk associated with distributed land use activities and their hydrological connectivity to the stream network. It is difficult to establish this risk in absolute terms due to the uncertainty associated with the exact impacts of land management activities (e.g. fertiliser applications) and difficulty in establishing the details of surface connectivity both spatially and temporally. Absolute risks are therefore dynamic in both space and time. However, by establishing the relative risk SCIMAP acts as a powerful tool to help focus where management activities should be prioritised. A locational or source risk is determined as following a smart export
Science Report – Scoping study for integrated catchment modelling in the Frome–Piddle 8
coefficient approach, (similar to PEDAL) while risk of hydrological connectivity is based upon the analysis of high resolution digital topographic data in relation to distributed rainfall.
The above tools are by no means an exhaustive list of current research as diffuse pollution modelling and integrated catchment management is a very active area among academics and water industry professionals (further examples are provided in Appendix C). However, in the limited time available to carry out the literature review, it was evident that work is ongoing on projects and tools for integrated catchment management. Several are new, but it is not possible to tell how useful they are without either trialling them directly, or unless a relevant paper describing such a trial has been published. This needs to be investigated further.
Science Report – Scoping study for integrated catchment modelling in the Frome–Piddle 9
6 Lumped catchment model trial
The modelling of pollution pressures for the purposes of integrated catchment management is relatively new. Usually modellers are specialists working within a particular area of expertise (e.g. groundwater, surface water). There are many tried and tested models available in these areas and they tend to represent specific parts of the system. However, integrated catchment management requires a different approach. For example, if we want to consider a river that is failing its objectives for phosphate, we need to consider the following:
i. identify where the river (receptor) is failing;
ii. identify the possible sources of phosphate within the catchment as a whole, e.g. sewage treatment works (STWs), septic tanks, sediment runoff etc.;
iii. quantify the size and timing of the phosphate inputs to the system from each of the possible sources;
iv. identify the plausible pathways between the possible sources and the river (receptor); and
v. quantify the amount and timing of the phosphate arriving at the receptor via each pathway.
Theoretically at least, the phosphate that is causing the river to fail its objectives can then be apportioned between the various sources that are contributing to the problem. However, current understanding in this area is limited.
As part of this project Entec were asked to investigate the potential of a simple, subcatchment-scale, lumped parameter model to investigate the pollutant loading generated by each pathway (i.e. part (v) above). The trial of DHI’s MIKE BASIN software in the Frome and Piddle catchment is summarised in Appendix D.
The trial showed that it is possible to use this software in association with other available recharge, runoff and GIS datasets to rapidly develop a lumped catchment model which could be applied to investigate point and diffuse pollution issues. In certain catchments, a model like this, which is quick to set up, may provide a useful starting point for further investigation. Useful features of MIKE BASIN are:
i. The software is run through an ArcGIS interface and can effectively be added to an existing ArcGIS project. This is particularly useful in integrated catchment modelling as it allows the user to quickly set up catchments, remain geo-referenced to other datasets and to be able to scavenge data from existing layers (e.g. in delineating catchments and when calculating pollutant load).
ii. The model and processes are easy to parameterise and understand.
iii. The software can accept inputs in a number of time-series formats.
iv. The software includes the Temporal Analyst extension, which allows the user to view time-series model input/output without the need to export the results into another application (e.g. Excel).
v. There is a ‘Load Calculator’ extension, which allows input of pollutant from a variety of diffuse and point sources. The outputs include total annual loads split into a number of fractions according to the origin of the pollutant.
Science Report – Scoping study for integrated catchment modelling in the Frome–Piddle 10
Overall MIKE BASIN is considered to be a good piece of software for the purposes for which it was designed.
However, there were many teething problems in getting the model to run without crashing. It was also not possible to run the model with both the water quality and groundwater extensions active at the same time. Although the Entec staff were experienced groundwater modellers, they had not used MIKE BASIN before and the trial demonstrates how time-consuming it is for new users to develop and build even a relatively simple integrated catchment model.
It is possible for the models to become more complicated by utilising and parameterising more and more (smaller) catchments. In catchments where detailed data exist, it would be necessary to have many catchments to represent the natural complexity, as any lumped simplification would be proved ‘inaccurate’ by the detailed data. It would not be possible to gain any confidence from users given this inaccuracy. So, in essence, the user would need to move away from traditional lumped modelling towards a more distributed approach. Therefore, the question in catchments with detailed information is not whether MIKE BASIN can handle the complexity but more whether a complex integrated model is likely to be fruitful or whether a simpler approach using a range of modelling tools is likely to remain more appropriate.
In less studied catchments a quick and dirty model could provide a useful starting point for further investigation. It is unlikely, however, that such a model could stand up to rigorous scrutiny if major decisions were to be made, for example, on land use or fertiliser application. MIKE BASIN (and most lumped models) generates output to the downstream end of a catchment. In reality we may need to be concerned, for example, with land use and pollution inputs along the entire river length (and aquifer area) and not just the downstream outlet point.
In conclusion, this short trial has demonstrated that MIKE BASIN is easy to use, once the user is familiar with it, and it is suitable for lumped catchment modelling. It may also have application to more complex scenarios, although this needs to be looked into further in conjunction with other models available. The trial has not really moved us forward with modelling the links between the various sources of pollution and the fluxes measured at a receptor. These concepts still need to be tested, and the literature review suggests that there may be other tools and approaches that are worth further investigation.
Science Report – Scoping study for integrated catchment modelling in the Frome–Piddle 11
7 GIS as a platform for integrated catchment management
One of the main conclusions from this short project is that GIS maps and applications have great potential as a platform to promote knowledge transfer within the Environment Agency and beyond, and thereby stimulate more integrated approaches to catchment management. The Water Framework Directive is a key driver in this regard and the delineation of WFD water bodies (groundwaters, rivers, lakes, estuaries and coastal waters) has provided a consistent geographic basis which will drive monitoring, classification, reporting and action into the future. This should promote a much broader appreciation of the catchment pressures and monitored impacts and also provide a framework for summarising the results of modelling studies so that they become more widely available, beyond the staff directly involved with their development.
Selected datasets related to WFD and catchment management that were already available in the Environment Agency were collated during the course of the project. These were displayed within ArcGIS at the two workshops, to illustrate the potential of using GIS as both an analysis and communication tool for integrated catchment management. The data shown included information on pressures, receptors and monitoring locations, together with the underlying geological and OS mapping. The network of WFD water bodies was attributed with a range of risk assessment results. Some locally derived maps for water level plans and conservation areas were incorporated along with simple demonstrations of hotlinks to associated documents and cross-sections. The surface water body network was interlinked so that statistical summary tools could be applied to interrogate point data on an integrated catchment basis (i.e. to calculate and map upstream totals, maxima etc. for all water bodies across the catchment quickly). Derived information from the Hampshire Avon recharge and groundwater models was also provided, together with conceptual mapping features summarised from earlier phases of that project.
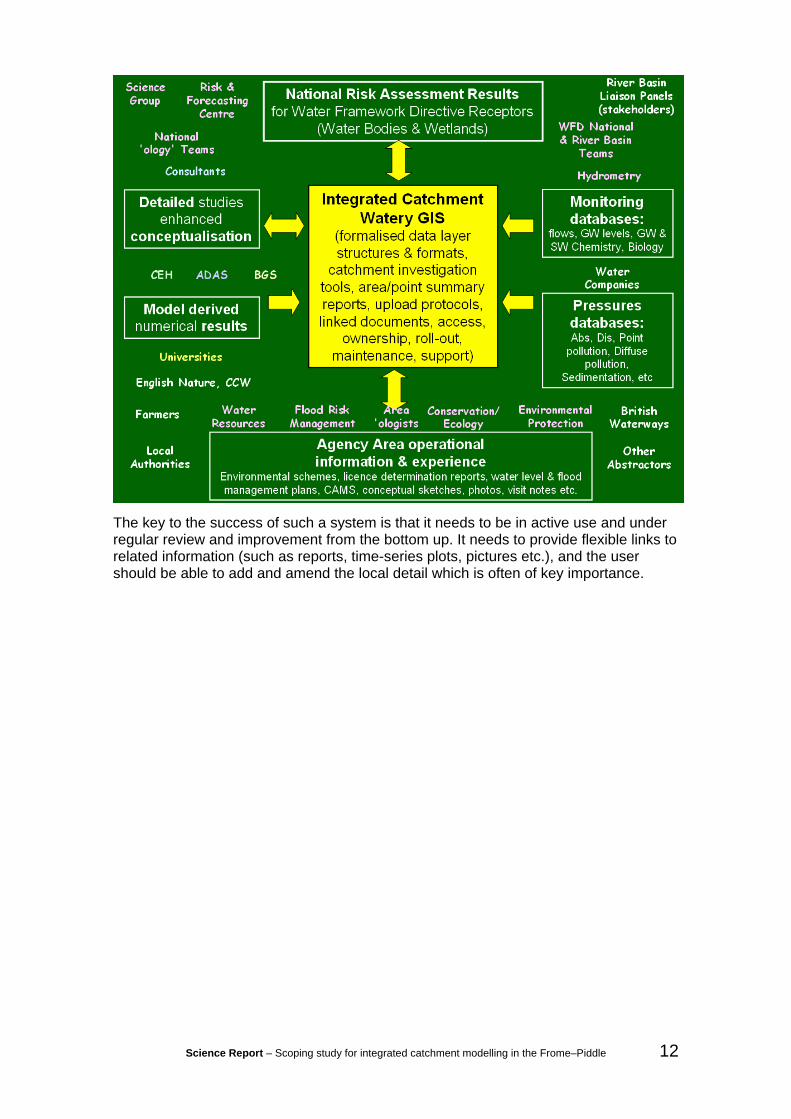
If IPR issues can be overcome, a carefully designed system with internet accessibility could extend the value and application of this WFD platform beyond the regulator – to include the many other organisations and stakeholders involved (see the Figure below).
Science Report – Scoping study for integrated catchment modelling in the Frome–Piddle 12
The key to the success of such a system is that it needs to be in active use and under regular review and improvement from the bottom up. It needs to provide flexible links to related information (such as reports, time-series plots, pictures etc.), and the user should be able to add and amend the local detail which is often of key importance.
Science Report – Scoping study for integrated catchment modelling in the Frome–Piddle 13
8 Conclusions and recommendations
Despite the short time available for this project there are several important conclusions and recommendations from the work. These are listed below.
i. GIS maps and applications have great potential for analysis and knowledge transfer in the Environment Agency and beyond, and thereby to stimulate more integrated approaches to catchment management. It is therefore recommended that the use of integrated datasets and model results within a common GIS platform should be developed and further investigated.
ii. Area operational staff are keen to be involved in trialling approaches for knowledge sharing and analysis in GIS. It is recommended that users are able to amend the local detail in any approach that is developed.
iii. Many operational staff do not have easy access to local data collected by other Environment Agency functions. To overcome this, it is recommended that all the data already available in GIS format are gathered together, across all Environment Agency functions for a particular catchment. This will aid strategic planning of catchment management.
iv. There are likely to be complex IPR and copyright issues associated with the use and sharing of data, particularly from external sources. If these can be overcome, the sharing of data between the Environment Agency and external stakeholders could extend the value of the GIS.
v. In the limited time available to carry out the literature review it is evident that work is ongoing on projects and tools for integrated catchment modelling. Several are new, and it is not possible to tell how useful they are without either trialling them directly, or unless a relevant paper describing such a trial has been published. This needs to be investigated further.
vi. Area operational staff do not want money spent on developing complex modelling tools; however, they would like to know what simple tools are available and how they might be used to analyse the data.
vii. Current understanding of pathways and connectivity within catchments is limited.
viii. The trial using MIKE BASIN demonstrates that, once the user is familiar with the software, it is easy to use and is suitable for lumped catchment modelling. However, it has not moved us forward with modelling the links between the sources and receptors of diffuse pollution, and further work is needed to test the concepts involved in modelling catchments in such an integrated way.
Science Report – Scoping study for integrated catchment modelling in the Frome–Piddle 14
9 The way forward The Environment Agency’s ICS programme is now under way. After the completion of the second workshop the Science Group progressed consultation directly with research collaborators (i.e. not involving Entec). A follow-on project (Making Information Available for Integrated Catchment Management, SC060035/SR) began in January 2007, which aims to collate locally relevant GIS information and trial the development and use of a GIS system by Environment Agency staff in the Frome–Piddle catchment and across the wider South West Region. This system should include simple enhancements, tools and links which help to bring the map layers to life. It is not intended as a substitute for modelling work – it’s abilities to simulate and test hypotheses will be limited – but it should incorporate the derived results from existing models where possible.
Science Report – Scoping study for integrated catchment modelling in the Frome–Piddle 15
Appendix A First workshop programme and notes (Frome and Piddle catchment managers)
Science Report – Scoping study for integrated catchment modelling in the Frome–Piddle 16
INTEGRATED CATCHMENT SCIENCE
Supporting Integrated Catchment Management Under the Water Framework Directive
Workshop 1
3 March 2006 at the Environment Agency, Blandford Forum
Location: Rivers House, Sunrise Business Park, Higher Shaftesbury Road, Blandford Forum, Dorset, DT11 8ST.
You are invited to a workshop in preparation for the start up of the ICS Knowledge Transfer Programme
BACKGROUND
The overarching aim for the Integrated Catchment Science programme from 2006 onwards has been has been in outlined in the document ‘Integrated Catchment Science – a research strategy’. This states that:
‘by 2015 we will have developed the scientific understanding and tools which allow the Environment Agency to manage the environment at the river basin and catchment scales, thus achieving sustainable, long-term improvements to the environment and to the quality of life.’
And that this will be achieved through developing a better understanding of:
• water flow and pollutant movement within and between air, soil, rocks, groundwater, sediments, surface waters and the marine environment;
• the natural variability and dynamics of aquatic (and terrestrial) biological ecosystems and their interactions with natural variables such as: climate, the morphology of the habitat, water flows and levels;
• the society-induced pressures on the physical, chemical and biological systems in order to develop and implement land use management strategies which achieve good water body status;
• the socio-economic consequences of management strategies.
The programme will have at its heart a systemised modelling approach and associated decision-support tools for the management of land use in river basins.
The Frome–Piddle catchment has been selected as one of the demonstration catchments for the ICS work.
Two months’ work is being undertaken in preparation for the start of the ICS Knowledge Transfer (modelling) programme beginning in April 2006. As part of this preparatory work we will be holding two workshops in March.
Science Report – Scoping study for integrated catchment modelling in the Frome–Piddle 17
This aim of the first workshop is to gather ideas from Area staff in the Frome–Piddle demonstration catchment and from Science staff involved in the project, to guide the consultants with the review and trial modelling work and to produce an initial outline of the specification for next year's work.
The second workshop will provide an opportunity for external interested parties to take part. The consultants will present what has been learned in the review and trial modelling and the main output will be a draft specification for next year's work.
WORKSHOP 1
Friday, 3 March at Environment Agency offices in Blandford Forum
Who is it for?
• Local Agency staff to present their issues on integrated catchment management.
• Entec to present their findings on the current work in this field.
• National Science staff to agree the tasks involved in the one-month model trial and to agree with Entec an outline draft spec for the ICS knowledge transfer project starting April 2006.
What do we hope to achieve?
• To understand what issues will be facing regulatory staff and environment managers in the Frome–Piddle demonstration catchment over the next year and the following five years as they prepare to implement the Water Framework Directive (WFD).
• To focus on the issues in the following fields: conservation, quantity & quality of groundwater & surface water bodies, estuaries, land use change, hydromorphology, catchment sensitive farming.
• To identify what has been learned from recent modelling studies in the area and how models have been used in regulatory decision making and environmental management.
Outline of the day
Morning
• Introduction by ICS project manager (Steve Fletcher) – the probable implications of the implementation of WFD over the next 5 years.
• Opportunity for local regulatory staff and environmental managers to present the issues they face in an informal setting. These will not be formal presentations but each person will have 10 mins to talk about what they see as the big issues. Use maps, drawings, reports to illustrate if appropriate. Opportunity for questions at the end of each session to clarify the issues.
Science Report – Scoping study for integrated catchment modelling in the Frome–Piddle 18
Afternoon
• Opportunity for national science staff to present their ideas in 10 mins. Not formal not presentations. Each person gets 10 mins + time for questions. Use maps & drawings where possible.
• Entec present results of review of previous work and ideas for trial modelling.
• All collate ideas to produce outline draft spec which can be circulated to attendees of second workshop.
A few questions to be thinking about:
• How do you think WFD will change the work you do?
• How do you think the Agency should help future catchment management staff, e.g. catchment sensitive farming officers and WFD catchment managers?
• What environmental benefits could you envisage achieving by working together on managing your catchment, e.g. in the areas of flood risk management, farming, nature conservation, water management?
• What are the obstacles or dangers do foresee?
Science Report – Scoping study for integrated catchment modelling in the Frome–Piddle 19
INTEGRATED CATCHMENT SCIENCE
Supporting Integrated Catchment Management under the Water Framework Directive
Workshop 1 Notes 3 March 2006 at the Environment Agency, Blandford Forum
Attendees Science Group Representatives
Steve Fletcher, Paul Hulme, Alwyn Hart, Andrew Wither, Sean Burke, Susan Casper, Veronique Adriaenssens, Larissa Naylor, Rachael Dils
CEH Dorset
John Hilton, Jim Smith
Agency Operations Representatives (South Wessex Area & beyond)
Paul Sadler, Pauline Johnstone, Emma Rothero, Melissa Robson, Susie Roy, Karen Croker, Alison Matthews, Fran Walker, Ben Bunting, Rachel Jacobs, Jim Grundy, Neil Murdoch
Wessex Water
Paul Stanfield
Entec
Tim Power, Nick Jarritt, Rob Soley
Agenda See attached agenda & background: ICS_workshop1_outline-final.doc
Introductions
Introduction to workshop by Steve Fletcher and introductions
‘Science’ team in state of flux and being reorganised. Science has changed how it does R&D. There is no longer a R&D section. All science is now joined into themes. One of these themes is Integrated Catchment Science. Themes are divided into work packages. Within ICS there are 7 work packages:
• WP1: Understanding aquatic ecosystems;
• WP2: Managing soils and sediments;
• WP3: Identifying and understanding catchment pressures;
Science Report – Scoping study for integrated catchment modelling in the Frome–Piddle 20
• WP4: Restoring habitats and ecosystems and remediating historical pollution;
• WP5: Socio-economic considerations;
• WP6: Knowledge Transfer; and
• WP7: Pilot and demonstration catchments.
EA won’t be doing the scientific research (the ‘blue sky’ thinking) – this will be done by universities through NERC, EPSRC. Knowledge transfer – modelling and decision support tools will largely be done in-house, concentrating on demonstration catchments and pilot catchments – working on particular catchments allows us to understand things in more detail and get greater understanding of issues for implementation elsewhere. For ICS the demonstration catchments are hoped to be the Frome–Piddle catchment and Ribble.
ICS underpins WFD. Many of the tools that were expected for WFD haven’t been produced. We want to produce an integrated programme, linking water resources, hydrology, hydrogeology and ecology (holistic solutions). WFD could be called the ‘Land Use Directive’ – the only way to achieve WFD objectives is through changing land use. Catchment managers will need tools to link Programmes of Measures to improvements in ecological status.
WFD will require every farmer to change the way they do things, but this won’t happen unless they are on board and want to change. Nitrates experience suggests that we can’t just tell them. The big issue is trying to convert the information that we will produce into something that farmers can use, and to provide the incentive for change. They must WANT to change land use management.
Today is the first meeting on integrated catchment science and integrated catchment modelling.
What will be produced from integrated catchment modelling – where does modelling fit in?
• Do not envisage one giant integrated model;
• Use models to investigate – conceptual models;
• Integrate ideas and understanding;
• Expose and investigate uncertainty;
• Use current knowledge and available techniques;
• Headwaters to the sea (integrate the whole catchment) – bathing and shellfish waters also affected; and
• Using model results to inform, not blind.
Entec will do brief modelling exercise for the next four weeks. Entec will also work with the Agency Science team to work out what this package will look like over the next year. 2nd workshop at end of March to put more meat on the bones of how we should proceed with this. Plans are open and receptive to input.
Paul Hulme – summarised the previous night’s discussion (between Sean Burke, Steve Fletcher, Paul Hulme, Pauline Johnstone, Jim Grundy, Nick Jarritt and Rob Soley).
Science Report – Scoping study for integrated catchment modelling in the Frome–Piddle 21
We found that we are all coming from different directions and have different understanding of what integrated catchment management is. However, there were some themes that emerged:
• Modelling is not necessarily about big all-singing models – that often doesn’t help;
• Modelling has a very broad definition – conceptual models, spreadsheets, big expensive numerical models;
• Integrated data is the first step – make sure we are using all the data and softer ‘information’ that is available in a consistent way;
• Demonstration catchments mean we can focus on real problems, not generic issues in the abstract. We need to know the real problems that are facing people on the ground. This can then be transferred to other catchments; and
• What do we do about uncertainty? Putting different processes together has uncertainty and we must understand this.
This is a scoping study for the next month – the big ICS programme proper starts in April. Also talked about staff Key Performance Objectives (KPIs). Agency Science is not tied to KPIs. How many EA staff have WFD on their KPIs? Some local staff indicated that they do have this. What can we do to help you deliver your KPIs? But we can’t do this at the expense of dealing with issues that are there now that may not be linked to WFD. Tools should be equally applicable to these problems as WFD. This is part of linking Science back into the business. The technical issues of doing this are probably secondary to the people issues – making sure that people work together as integrated catchment managers. This is the first step of getting disparate people together to make sure that we are talking to each other.
Comments from the floor after the intro suggested that economics are also extremely important – not just sociology & ecology – especially with farmers.
Evaluation of Potential Integrated Catchment Tools, including simple GIS
Nick Jarritt ran through a presentation on the results of desk, internet and telephone consultation into existing tools and previous work on integrated catchment modelling tools.
Rob Soley gave a presentation which emphasised that whilst the integration of recharge, unsaturated zone lags and attenuation, saturated groundwater and surface water discharge is of key importance when understanding diffuse nitrate pollution, it is much less relevant when considering the fate and transport of phosphorous. Different models are appropriate for these different issues in order to help decide on appropriate programmes of measures. The ‘horses for courses’ mantra will always remain for modelling and perhaps the challenge for integrated catchment management is to join up data, conceptual understanding, modelling and risk assessment results from different specialisms and make them widely available through a medium like GIS which is good at integrating different scales.
Rob showed the GIS project which is being developed to collate WFD related pressure – receptor – risk information together with CAMS data, plus some locally derived modelling output from the South Wessex Recharge Model, and the Avon Groundwater Model. He attempted to refer to this throughout the morning to support contributions
Science Report – Scoping study for integrated catchment modelling in the Frome–Piddle 22
from others although this was often hampered by the lack of local information to compare with the national shapefiles which currently dominate.
Discussion after these presentations was as follows:
Sediment problems may often be associated with a small number of fields. Is a catchment-scale model more cost effective than just dealing directly with the ‘troublesome’ fields?
That is a catchment-scale answer, i.e. have a look at the catchment and then focus on the problem. Do you know which fields are troublesome or are you looking for a model to help with this?
No – just wanted to make comment that local-scale fieldwork can be most cost effective.
This statement was backed up by Wessex Water – can easily find where the problems are by fieldwork.
Problems in this catchment are particularly in the River Hook and Frome between Dorchester and Maiden Newton. Sediment load issues will be a focus when talking to farmers.
We will not be able to build a new model (such as ‘Inca’) everywhere. We therefore need to use all existing models to inform and educate EA. Any model is based on the conceptual understanding of how the system works – applying without this understanding doesn’t work. Modelling and tool production must be done in conjunction with education with respect to how the processes work.
We have to change the way farmers are thinking by using things that they understand. Farmers are a crucial part of the conceptual modelling of catchments.
Do we not need disintegrated catchment modelling? The EA uses SIMCAT models for looking at point sources and this won’t change. What we need to understand is how the different communities within the EA exchange information. Don’t try to build big models but work out how we can connect the communities to work together and pass information between each other.
We have the point issues reasonably well understood – what we need to focus on is the diffuse issues where our understanding is more limited. This needs to be backed up by monitoring so that we can relate catchment understanding to diffuse processes. In this regard there is a clear need for more continuous monitoring in order to capture the understanding of occasional pollutant mobilisation during peak runoff events, rather than monthly spot sampling which misses most of these.
Tying in the whole thing – we all know our own disciplines and getting the quantitative information is the easy bit – but we need to know what all this means for the ecology. In the Frome we are looking at biodiversity in terms of Water Level Management Plans (WLMPs) and grazing marsh. How will delivery of this through the agri-environment, driven by Biodiversity Action Plan (BAP) targets deliver benefits in WFD terms – we need a catchment understanding to help to make this link.
Reduction of diffuse pollution is likely to be key to achieving WFD Good Ecological Status. This can be done by affecting pathways as well as by changing pressures. We need to understand the pathways better so that we can target measures. (e.g. soil from tractors getting into rivers via road runoff).
Science Report – Scoping study for integrated catchment modelling in the Frome–Piddle 23
As modellers we want people to be very specific about what they want from the model. If we don’t know this when we start the modelling then we will probably go about things the wrong way (e.g. ‘I want to know what the nitrogen flux is out of the Frome catchment between May and September’ is a different question, and requires a different model, to knowing what the annual average flux is). We need to know what the question is that we are looking for the answer to. The model is just a tool to help us get to the answer and there is no point using the model to get the answer if we don’t know what the question is. The most important thing is to define the question very clearly at the start.
We need to know what the link is to the ecology – there is no point pressing ahead until we know what we are aiming at. Ecology is not providing the science to make the link. A lot of the time we struggle with this because of the way we do our monitoring – monthly samples miss the events which are often key for the ecology. Without continuous monitoring and event monitoring we can’t make the link between the physico-chemical aspects and the ecological impacts/benefits.
Water company and Area staff sharing concerns within the Frome–Piddle catchment
Paul Stanfield (Wessex Water)
We don’t believe in diffuse pollution – it’s a collection of point sources spread about the catchment’.
Wessex is GW dominated in terms of water supply (80%). Wessex water are starting to take a more catchment-based approach to water quality rather than ‘end of pipe’ solutions. Issues are nitrates and pesticides. Note that water companies often do much more continuous monitoring at their sources than the EA and we should be making more use of this data. 9 nitrate schemes being put in place for AMP4. Rising Nitrate trends are apparent and it is the peak concentrations, not the averages which often cause most problems. Treatment is an option but it is costly and has problematic by-products – not sustainable. Also blending is an option, but running out of good quality sources to blend with – the problem is still in the ground.
Wessex are now focusing on the catchment to solve the source of the problem. Within the Frome, Piddle and Wey, Nikki Downton has been employed to work as a catchment advisor (in the Empool catchment) to promote catchment-sensitive farming (WAGRICO project). There are also plans to extend this into the Hook, Lambourne and Dewlish catchments, as well as considering the source of pesticide issues at the Friar Whaddon source – related to spraying in particular fields, i.e. beyond the ‘end of the pipe’. (Wessex Water is leading on this work even though they perceive that the EA has not been as active as they would have hoped in seeking to confront farmers who are responsible). Treatment costs around 400 Euros per hectare per year.
The current model for this operation is using 2 advisors for a 50 km2 catchment to manage intensive local monitoring – data – information – better advice – behaviour change. Modelling could be an important part of this process, but isn’t yet. Catchment management is lower cost to Wessex Water, it is sustainable and there are environmental as well as water supply benefits. Wessex hope that under article 7 of WFD the EA will have more involvement in identifying problems and putting in place Programmes of Measures will help to solve problems they and other water companies are facing.
Science Report – Scoping study for integrated catchment modelling in the Frome–Piddle 24
Questions:
Have you talked to farmers about treating runoff and farm-based solutions?
A key issue is storage of sludge. There is a big debate in Wessex Water about how much they should commit themselves financially.
May be worth considering nitrate capture – could be a cost-saving measure for farmers as well. Also worth looking at precision application of pesticides.
But Wessex are working to tight timescales so they need immediate results.
What lessons have been learnt from working with farmers?
Only just started yet, but we have worked with farmers to identify hotspots – farmers face these issues as well. Its not just about how much nitrogen is applied to the crops, its how much the crops don’t use in their growing.
This is a situation where a simple conceptual model has told a lot about how to manage the system. This is because there is a quick response between cause and effect. In many cases, nitrogen is a slow response issue (long retention time).
Would modelling help you or are you doing OK without it?
With the issues that we are facing then monitoring and field conceptual understanding is providing us with the answers.
Emma Rothero (Ecology)
Fisheries – issues of water quantity and water quality. There are a few barriers to fish migration (salmon) – what levels do we need for these barriers to be passable? Stakeholders are raising concerns over declining trout populations which could be related to excessive siltation of gravels. Data on the barriers is available in asset survey maps of flood defence structures and there is also lots of information on non-flood defence structures. Another concern for fisheries is temperatures – how will Water Level Management Plans affect the temperature and how will this relate to fish. Work has been done on Avon looking at relationship between flow and temperature, but none done yet on the Frome–Piddle.
Recently a contentious issue has been the perceived impacts of cress farms on ecology. This is based on awareness of definite impacts in Hampshire. The problem is a perceived public problem rather than a monitored problem. The concern is how the cress farm is managed. A lot of the farms wash salad produce which can cause a siltation problem. Also the use of zinc to treat a fungal root disease which has had an impact of freshwater shrimps – it impedes reproduction and diminishes populations. Cress bed operation now tends to be much better ecologically than it used to be, but the perception of the problem still remains (interested land owners often have particular concerns).
One fisheries problem is a lack of consistent data to feed into any models – the protocol for monitoring changes often so there are no long-term consistent records. We don’t have a detailed hypothesis on what may be causing the problems, so it is difficult to know what to monitor and what to focus on to solve problems.
Science Report – Scoping study for integrated catchment modelling in the Frome–Piddle 25
Jim Grundy (Groundwater & modelling)
Returning to the theme of integrated catchment management/science, we need to incorporate groundwater into the conceptual understanding of catchment. Groundwater is not a small component. Groundwater–surface water interaction is very important in the Frome–Piddle catchment. Chalk in the headwaters provides baseflow for the rivers. The bottom of catchment has Tertiary deposits. The main pressures on groundwater are abstraction and the agricultural loading of nutrients and pesticides. How can this project help to link the groundwater and surface water assessments in the catchment? We are thinking about modelling as a process rather than a black box tool – we can learn as much by going through the process as by what comes out the other end. Next financial year we will be doing scoping work on a conceptual model of the Frome–Piddle groundwater catchment with a view to a groundwater model (probably distributed numerical). What would help conceptual models is thinking about integrated monitoring – integrate chemical and physical monitoring so that the two can be linked.
Susie Roy (Groundwater quality – especially nitrates)
The main feedback from groundwater quality monitoring is that we need more information/understanding of impacts on ecology. The groundwater quality monitoring network produces aquifer reports. Frome–Piddle monitoring is picking up herbicides (not higher than drinking water standards). What will be the impacts of these on ecology as they find their way into surface waters? Also there are a lot of sewage treatment works soakaways where small areas are not connected to mains sewerage. What are the impacts of this on groundwater quality? Nitrates – collecting lots of data, but EA Area teams don’t do much with it. We have produced nitrate concentration contours and we can map nitrate problems and link this to particular hotspots. Looking at monitoring from 1970 – present has also shown a rising trend in nitrate concentrations across the catchment. This can be fed back to Area teams to inform farm visits. A very wet 2001 appears to have contributed to a recent slight decline in nitrate levels. Contouring work done at a Regional level linked up quite well with the national WFD work done and the recently reviewed NVZ workshop data.
Melissa Robson (Catchment Sensitive Farming)
Modelling has to back-up observed issues rather than the other way round – we shouldn’t be doing modelling and then going out to groundtruth. On the Hook and Frome we did site visits during runoff events to identify the problem areas for erosion and sediment delivery and pollution problems (identified problems with storage of pollutants on the farm, not on the field). Roads are a key issue for suspended sediment problems. Sediment problems and runoff problems also result from over livestocking causing compacted layer in soil. The importance of connectivity and pathways needs to be understood.
If there is a big connectivity between road runoff, will there also be a problem with road rock salting, causing a problem with chloride levels in rivers and possible impact on salmonids?
We are here to identify the essential components of a modelling programme – it is emerging that bringing in local knowledge is a critical part at the start of the programme to ensure that we are always relating national GIS models to what is going on at a fine scale within the catchment. We cannot rely on any national empirical models to deliver local-scale solutions. There needs to be a QA process on the national datasets.
Science Report – Scoping study for integrated catchment modelling in the Frome–Piddle 26
Paul Hulme – this is a good way of starting discussion as putting up the national stuff that probably doesn’t work at a local level provokes discussion about what is going on. There needs to be a feedback process to allow local information to feed back into the national datasets.
Flood Management and Water Level Management Plans
Integrated catchment management is about more than just water quality – we need to be clearer about exactly what it is that this project will be looking at.
WLMPs are flood management driven – looking at reed cutting, impoundments, management of water levels in ditches and fish passage. We are also hoping to have a project to restore grazing marsh through more sensitive land management practices (move from arable to low density grazing). A Catchment Flood Management Plan (CFMP) is currently being prepared. We also have some wider conservation partnership projects to restore biodiversity, offering farmers significant incentives to change land management practices to promote biodiversity. These projects have a relatively short time scale for delivery but how do they link in with water quality and ecological status for WFD?
It is important to involve wildlife groups (Farming and Wildlife Advisory Group) and English Nature so that a focus on delivery is maintained. We should also consider having Fisheries Associations and the National Farmers’ Union (NFU). These groups have ways of promoting delivery of land management objectives.
Part of the project needs to be assessing delivery options to see what works. If we can use this to see if measures deliver what they are supposed to deliver then we have a really useful tool to role out to other catchments.
We are changing the focus from calibration/validation in terms of numbers to calibration/validation of conceptual aspects with stakeholders and local people – checking that the models are representing what people actually think is going on.
The challenge is going to be how we ‘mainstream’ this (into KPIs etc). There is challenge to weave this into Area staff’s day jobs.
If we have a workshop with stakeholders there at the end of March, we don’t want to be presenting a small modelling exercise as this will only confuse things. If we want this workshop to be part of the stakeholder engagement process, then we should focus on building more local information into the GIS datasets, not developing a MIKE BASIN (or other) new model at this stage.
Steve Fletcher – we hadn’t envisaged involving stakeholders in this project, certainly not at this early stage. It is important to remember that this is a science project and that what we are trying to do is to develop the science of doing this.
Karen Croker (Hydrology, CAMS and Review of Consents – Abstractions)
We already have a Catchment Abstraction Management Strategy done for the catchment. From a water resource point of view the catchment low flow resource availability status is either ‘Water Available’ or ‘No Water Available’ (NWA) depending on the river. Based on the ecological criteria we have at the moment there will have to be river flow based restrictions in No Water Available areas (e.g. the Piddle) on abstraction in order to protect the ecology. There is a separate abstraction policy for the confined Chalk. All the new licences issued will have a common end date when
Science Report – Scoping study for integrated catchment modelling in the Frome–Piddle 27
they will be reviewed – does this itself become part of a WFD Programme of Measures?
In terms of the Frome, another water resource issue is that water meadow offtakes related to WLMPs are currently exempt from licensing but will be brought in by the Water Act. We will need to assess their impacts on flows in the main river.
In terms of the CAMS stakeholder meetings key issues were winterbournes, braided rivers and wetland habitats. Few of these get much assessment in CAMS, but they may have to be considered in WFD? – e.g. abstractions from different branches of braided rivers.
Wider water resource issues include the Water Act bringing in currently exempt licenses (quarry dewatering, trickle irrigation, water meadows and WLMPs). Water meadows and WLMPs are potentially in conflict with the needs of the river – we need to understand this in a catchment context to allow us to manage the river needs against the water meadow needs. From a WFD perspective, is this a local issue or is it something that is important in the catchment assessment process?
Because this catchment is groundwater dominated, the pathways from rainfall to river flow are complex. How transferable will issues be from Frome–Piddle to elsewhere because of this. We can’t build complex numerical models everywhere.
We also have a number of Habitats Directive sites within the Frome–Piddle, including some of the Dorset Heaths. We are already pushing a catchment-wide approach (rather than a ‘site-by-site’ focus) through the Review of Consents work.
Can we integrate existing water resources tools with water quality models and ecological impacts? We need to make sure that things are compatible in terms of their output so that decisions can be made based on their collective output.
There ought to be a better mechanism to allow all of the different disciplines to come together. We are all working to different timescales, deadlines and criteria. Are everyone’s objectives compatible – are we all working in our own areas towards different goals – we need more joined-up thinking. Is there any ‘in combination effects’ equivalent assessment?
Alison Matthews (Hampshire Area Groundwater)
From experience on the Itchen Habitats Directive project, the construction of a teetering stack of models (i.e. groundwater – river flow/level – PHABSIM – ditch – damsel fly etc) can result in some basic uncertainties being ignored. It is more important that we have professional people making informed decisions based on the best available evidence, rather than delegating responsibility to computers. Good Ecological Status is less about numbers and more about integrated understanding of the ecology. We should make better use of the monitoring information that we already have rather than developing more new tools (e.g. using the macro-invert. based LIFE data looks likely to result in a more pragmatic method for managing ecology than all the previous modelling). Often we don’t have time to wait for a big model to be developed – we have to make professional judgements all the time.
Concluding morning session comments
We started out looking to develop an integrated catchment model, but it seems that we don’t have integrated catchment thinking within the EA. What we need is actually a model of how to do integrated catchment thinking. It is more about how we work
Science Report – Scoping study for integrated catchment modelling in the Frome–Piddle 28
together than computer modelling. A way in which everyone can feed in what they are doing and what their problems are, and are then able to discuss how this has implications for the rest of the catchment.
From a water company perspective, will this process mean that in 2009 the EA will have measures in place to improve the quality of groundwater?
It isn’t actually the EA that makes the final decision of what will be done – Defra are the final arbiters based on EA recommendations. It all comes down to the costing of Programmes of Measures. Under the Science umbrella we have the opportunity to say what we would like to do. Science makes the recommendations; it’s up to Defra to look at the cost and what to do.
Afternoon session: focusing on National Science debate
Sean Burke (Agricultural Land Management)
Integrated catchment management is more than just the physical side of things. Conceptual understanding is vital. We also need to include researchers and stakeholders, including consideration of social and economic issues. We need education based on useful tools to help to get farmers to move to more catchment-sensitive practices. These include sensitive management in relation to field specific topography and runoff patterns, creating appropriately located sediment capture ponds, contour ploughing across hills, rather than down them (where the field shape permits this from an economic/hassle viewpoint) and re-locating gate access to roads from the drier parts of fields.
Economics are crucial – if we (as a society) decide that it is valuable for us, then we should be prepared to pay for the benefits that we will get.
Andrew Wither (Transitional & Coastal Environments)
Considering the WHOLE catchment, up to the 1 km line from the coast, then 90% of it is saline. Poole harbour is a very important transitional water body. We need to consider the catchment impacts on receiving coastal and transitional waters (sediments, nutrients, etc). Are controls on these targeting benefits for rivers necessarily appropriate limits for transitional waters as well? It may be that improvements in upstream water quality results in increased toxic metal solubility within the transitional water body. Diffuse microbiological pollution is also an emerging problem and is a big issue for the Shellfish Directive and Bathing Waters Directive.
Estuaries play a key role in attenuating what is going on in the upstream catchment. We know, but haven’t quantified, that estuaries (particularly those with large intertidal areas) are able to reduce nitrogen levels considerably through denitrification. Even within transitional waters, we never really look at what is happening to nitrogen (e.g. the green-yellow slime on the mudbanks may play a key role in nitrate attenuation). Nitrogen is used in estuaries as part of the natural recycling of nutrients.
Andrew suggests that the scientific lines of investigation should focus on the transport of microbiological pollution, and separately on diffuse chemicals – both nitrate and the phosphorous processing within the sediment.
Science Report – Scoping study for integrated catchment modelling in the Frome–Piddle 29
Susan Caspar (Sediments)
Susan presented work that is in the planning stage for sediment management (quantity and quality). Conceptual understanding of sediment pathways and processes is fundamental in linking this to ecology. We are looking to engage with Exeter University to look at sediment budget estimations and sediment fingerprinting to learn lessons from research work. We intend to review available sediment models and look at what we need to develop. We will also work with Lancaster University (Louise Heathwaite) on the ecological side and look at how sediment contributes to ecological objectives. Other collaborations with the SedNet group, Neil Preedy and David Boorman are planned. We are looking to develop sediment vulnerability mapping – partly numerical and partly conceptual – to put this into a management framework in order to prioritise mitigation options and management strategies.
The key issues are the transferability of knowledge and limited resources. We need to be able to transfer the work done on F-P to other catchments – we can’t do detailed work in every catchment. Also, how do we scale up from local issues to catchment problems at the river basin management scale.
Science Ecology Team
It is imperative that we work closely with those developing the biological classification tools for WFD. There are three main issues for ecological modelling: 1) There is a need to be able to look at ‘what if’ scenarios. Some of the pressures, particularly linked to hydromorphology and sediment, are not included in the WFD classification pressures tools. 2) We also need to be able to link pressure-impact scenario modelling to management measures, e.g. ‘if we change this what will be the effect on the macro-invertebrate communities?’ The Rivpacs AI project is focused on organic pollution but doesn’t currently allow us to test ideas for Programmes of Measures. Everything for WFD is in terms of ecological status, so we need to be able to simulate this. 2a) Uncertainty propagation. We need to be able to understand uncertainty and variability at all levels so that we can set up a smarter ecological monitoring network and improved ecological models. 3) The link between ecological models and other modelling areas is poor. At the moment ecological models just use the outputs from other models, but we need to integrate the two more closely. A key limitation often relates to scale – single sites are often simulated whereas real problems tend to be more hydro-dynamic.
Robert Willows has commented that there is currently not much being done on hydromorphology. This could be one of the key areas for achieving Good Ecological Status, but we need to know the links to ecology. There is too much focus towards the development of classification tools for individual quality elements and not enough understanding of the links between the pressures, the quality elements and ecological status.
John Hilton (CEH Dorset)
What we have had today is a series of people listing problems that are all being looked at independently. What this project ought to be looking at is not so much models per se, but rather the conceptual understanding and frameworks within which we can work better together. So we all put our problems into the pot and then ask the question what can we do that will benefit all of us? We have to develop frameworks that allow us to look across the system and across the problems. There may well be single solutions that are capable of solving a range of problems, so long as we take an integrated view
Science Report – Scoping study for integrated catchment modelling in the Frome–Piddle 30
of the management of the catchment. For example, for flooding, increasing retention times in headwaters will reduce rates of runoff but may also attenuate sediment and reduce nutrient loads.
Models are useful for two things – to test conceptual understanding (but if we are happy that we understand the system then we don’t need a model) and also for scenario testing to make decisions between different options. Best to avoid an integrated global model. Instead, make integrated decisions about where we want to go, what the direction is, and then decide what actions will be best to take us there.
Comments
Pauline Johnstone commented that the EA structure does not have the machinery to put in place this kind of integrated thinking in order to bring about improved catchment management. We have all the building blocks to do this for responsive regulation, but we don’t have the management structure to let people work together in a more creative way to realise improvements. The formulation of loose project based teams can often be most effective.
Can we do this through KPIs? Paul Sadler said this used to happen through the development of Local Environment Action Plans (LEAPS) and it might be facilitated through EA ‘local contributions’ – ways in which work that Areas do is contributing to national objectives in ‘Creating a Better Place’. Does this provide the structure to create interdisciplinary project teams to do integrated catchment management under the heading of ‘local contributions’? But these teams will need a leader or a manager to ensure that they are working in the right direction. This is a resourcing issue which may be addressed at the RSU level as part of plans for WFD River Basin Planning.
Fran Walker suggested that CAMS provides a framework for this sort of work – CAMS officers project manage the EA project team along with the stakeholder group. This works because it is in people’s business plans. But it was a significant restructure that allowed this to be possible.
Rob Soley said that for CAMS 2nd cycle we are trying to include a lot of the national GIS data. There is a terrific potential for unlocking the power of the map. There is a lot of GIS data about, but it requires effort to present this in the correct way. By rolling out this kind of information as an ‘integrated catchment GIS’ we can get a broader perspective into CAMS 2nd cycle. What we are talking about is data and risk management. We still need teams doing specific things and not everyone needs to think in an integrated catchment way, but they need the information at their fingertips so that they can make use it collaboratively. GIS is very useful for this as it is very visual. At the moment there is probably far too much national stuff on the GIS, but there is work going on to make sure that we can feed in more local data.
We have wanted send these GIS data out to Area staff and to get them to feed into their development. Is this the kind of thing that we should be doing as part of this project? What might be useful is to investigate the design of processes within the Agency to work and develop these types of maps locally and to improve upon national datasets (e.g. including local comments on a separate layer as has been done with the nitrate work recently).
Discussion of initial ideas for the scoping project
When we first thought about this we were looking at data, uncertainty and trialling. ‘Data’ is incorporated into the GIS although this might also include derived model

Science Report – Scoping study for integrated catchment modelling in the Frome–Piddle 31
output. Uncertainty was going to be looked at by Entec applying a model and attempting to optimise it, i.e. if we put all the processes into a very simple model, is there any way of using mathematical wizardry to find out how far we can go with the data to answer our questions, whether we need to go further to develop more complicated models, or whether we need to collect more data. We may already know these things intuitively but what can we do to figure out the appropriate level of complexity to represent?
People have said strongly that for trialling work on the Frome–Piddle they want stakeholders involved. The demo catchment idea has already fired people’s interest locally and we need to make sure that we build on that local interest. However, we as Science need to be careful as we are not able to take up too much local staff time.
Although there are mathematical tools for looking at uncertainty, these may often not be appropriate. These tools say things about how the model is behaving, not how the model is representing reality. If we are going to have a test on how predictive the model is, we need to focus on testing the model, rather than development of new models. We should be trying to compare things by starting with the simplest possible model and only moving on to more complicated models if the simple models don’t have sufficient predictive ability. This is the best way of getting the simplest fit for purpose model.
Scope of Work for the Next Month
The original idea was to build a simple lumped catchment model and do some optimisation and see what we get. We also wanted to do more review of tools and what people have done elsewhere in integrated catchment management. But in the light of what we’ve seen today, should we ditch this and focus on the GIS work?
We would like to see what we can do with the GIS – a review of what GIS could do for EA Area staff – what it could do to management, data management and review of what has been done elsewhere in terms of data and communication in catchment management. We could also link this to the GW modelling work that has been done on the Avon. We would be keen to send things out to Area staff and to make use of their local knowledge, but we cannot call on too much of their time.
This is effectively focusing on the Knowledge Transfer part of the science work package in its broadest sense. Today has turned up two things – we need GIS maps and visualisation but we also need to ‘crowd around’ the conceptual understanding of links to ecological impacts. We must identify where the gaps in this understanding are (in addition to our review of GIS approaches and what we can do with it). We can try to build up the GIS with additional local layers. GIS should also include meta-data as well – not just the spatial data, but also the database information behind it. Should Entec be coming to the office to introduce the GIS system and try to build it up with local data (in a follow-on workshop)? GIS could also plot where different EA Area teams have particular projects to see if there are areas where they should work together more. Water companies are very clear on what they are after in Frome–Piddle: reducing nitrates in their sources. Important from their view to make sure that everyone is focusing on the same issue (or that issues are integrated).
Paul Sadler felt that it would be worth trying the suggested approach, although further involvement in the project would require the approval of the Area Management Team.
Steve Fletcher concluded that the ultimate goals of the programme haven’t changed, but the immediate focus has moved towards development of the ideas for promoting integration using GIS tools. The work investigating modelling tools and approaches
Science Report – Scoping study for integrated catchment modelling in the Frome–Piddle 32
being used for this purpose elsewhere should also continue, and the aim of fleshing out the programme for next year, in discussion with the academics who may be doing the science, remains paramount. Steve and Paul Hulme would decide the best course for the remainder of the scoping study.
Steve thanked all the participants for their valuable contributions, hoping that they had found it interesting, and then closed the meeting.
Post workshop note:
Following the workshop, plans shifted a little because it was not possible for Area staff to make any further significant commitments of time to the project. The way forward is set out in a letter from Paul Hulme to Rob Soley, dated March 15th 2006, which is attached.
Science Report – Scoping study for integrated catchment modelling in the Frome–Piddle 33
Our ref: Your ref: Date: 15 March 2006
Sent by email Dear Rob INTEGRATED CATCHMENT MODELLING – TASK TO END OF MARCH 2006 After our telephone discussions last week I have spoken with Steve Fletcher and can confirm that we would like the following tasks carried out on this project during March:
1) Build a set of GIS layers for the Frome–Piddle that illustrates how GIS can be used to help with IC modelling. We anticipate it would include:
a) All the WFD layers that you already have
b) All Dave Johnson's NVZ layers
c) The significant damage to wetlands layers that Anna Cohen is building for Felicity Miller & I
d) Some ecological data, for example land use change & habitat generation – contact Melissa Robson (Catchment Sensitive Farming) or Emma Rothero (Ecologist) who were at the workshop on 2 Mar.
e) Identify ecological issues that need to be managed. At this stage they will probably be in a sub-area of the catchment only because these are the ones that are readily available. Paul Sadler suggests they may be in the Upper Frome above Dorchester . Use these to show how issues can be identified on the GIS map and described as a table/box that appears when you hover over the point. Look at issues raised at workshop on the flip charts and notes that you have and contact say Melissa Robson & Emma Rothero for more details
f) Derived data (from modelling):
i) WR – 4R data, transmissivity & x-sections from groundwater model that extends into Frome–Piddle catchment
ii) WQ – perhaps SIMCAT modelled results – Steve suggests contacting Neil Murdoch who was at the workshop on the 2 Mar.
iii) Suzie Roy's NO3 data
2) Bring draft version of this GIS to the meeting on 24 with Steve & I. This is the priority.
3) Send notes from 2 Mar workshop and any ideas for draft spec. of next year's work to us by 20 March.
4) On 24 Mar we will all produce draft spec. for next year's work. This will be presented at workshop on 30 Mar.
5) Do some initial lumped modelling with MIKE BASIN to see how it deals with WR & WQ. The results from this will be used on 30 Mar to prompt the academics to giver
Science Report – Scoping study for integrated catchment modelling in the Frome–Piddle 34
their ideas and feedback on the use of integrated catchment models. I know Adrian Butler and Rae MacKay have their own lumped models that they have used. We understand that Tim Power may be over-stretched due to drought modelling work. If so, we suggest subcontracting some of your budget to WMC so that a total of about £6k's worth of work is done on this.
6) Review of other existing work in the integrated catchment management & modelling field to prompt the academics at 30 Mar workshop.
In view of the Area staff being unavailable for significant amounts of work this financial year, there will be no visits to them. However, I have spoken to Paul Sadler and you can call upon an hour or so of the following people's time: Suzie Roy, Melissa Robson & Emma Rothero to ask then about the issues for the GIS described above.
We envisage the programme for the academic workshop to include:
• Aims & proposed method of working for next year's project (Steve Fletcher)
• Presentation of use of GIS for recent delineation of NVZs (Dave Johnson)
• Presentation on use of GIS calculations for groundwater vulnerability (Fenella Brown)
• Presentation of combined GIS layers for Frome–Piddle (Entec)
• Feedback on lumped modelling (?Gareth Price, WMC)
• Feedback on review of existing work (Entec)
• Draft spec. of next year's work
• Ideas from academics (major part of the day).
The exact programme can be finalised on the 24 Mar.
Regards,
PAUL HULME
Science Report – Scoping study for integrated catchment modelling in the Frome–Piddle 35
Appendix B Second workshop programme and notes (launching the Integrated Catchment Science programme and knowledge transfer package with potential research partners)
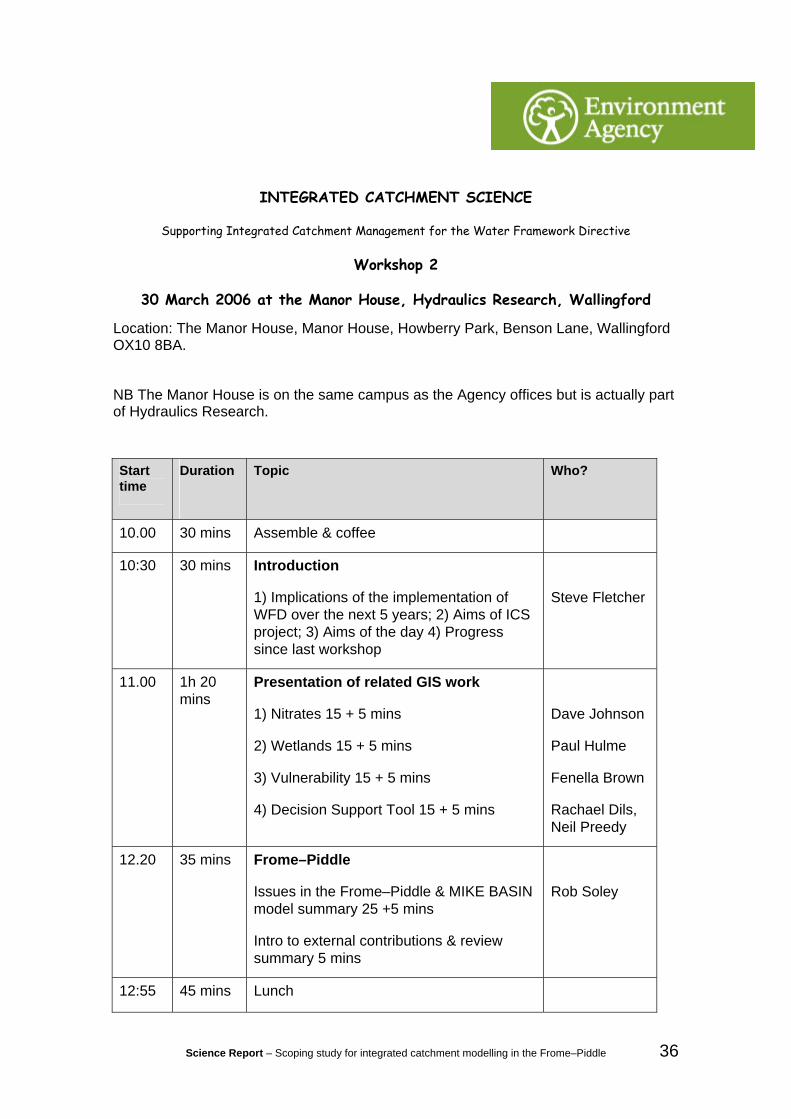
Science Report – Scoping study for integrated catchment modelling in the Frome–Piddle 36
INTEGRATED CATCHMENT SCIENCE
Supporting Integrated Catchment Management for the Water Framework Directive
Workshop 2
30 March 2006 at the Manor House, Hydraulics Research, Wallingford
Location: The Manor House, Manor House, Howberry Park, Benson Lane, Wallingford OX10 8BA.
NB The Manor House is on the same campus as the Agency offices but is actually part of Hydraulics Research.
Start time
Duration
Topic Who?
10.00 30 mins Assemble & coffee
10:30 30 mins Introduction
1) Implications of the implementation of WFD over the next 5 years; 2) Aims of ICS project; 3) Aims of the day 4) Progress since last workshop
Steve Fletcher
11.00 1h 20 mins
Presentation of related GIS work
1) Nitrates 15 + 5 mins
2) Wetlands 15 + 5 mins
3) Vulnerability 15 + 5 mins
4) Decision Support Tool 15 + 5 mins
Dave Johnson
Paul Hulme
Fenella Brown
Rachael Dils, Neil Preedy
12.20 35 mins Frome–Piddle
Issues in the Frome–Piddle & MIKE BASIN model summary 25 +5 mins
Intro to external contributions & review summary 5 mins
Rob Soley
12:55 45 mins Lunch
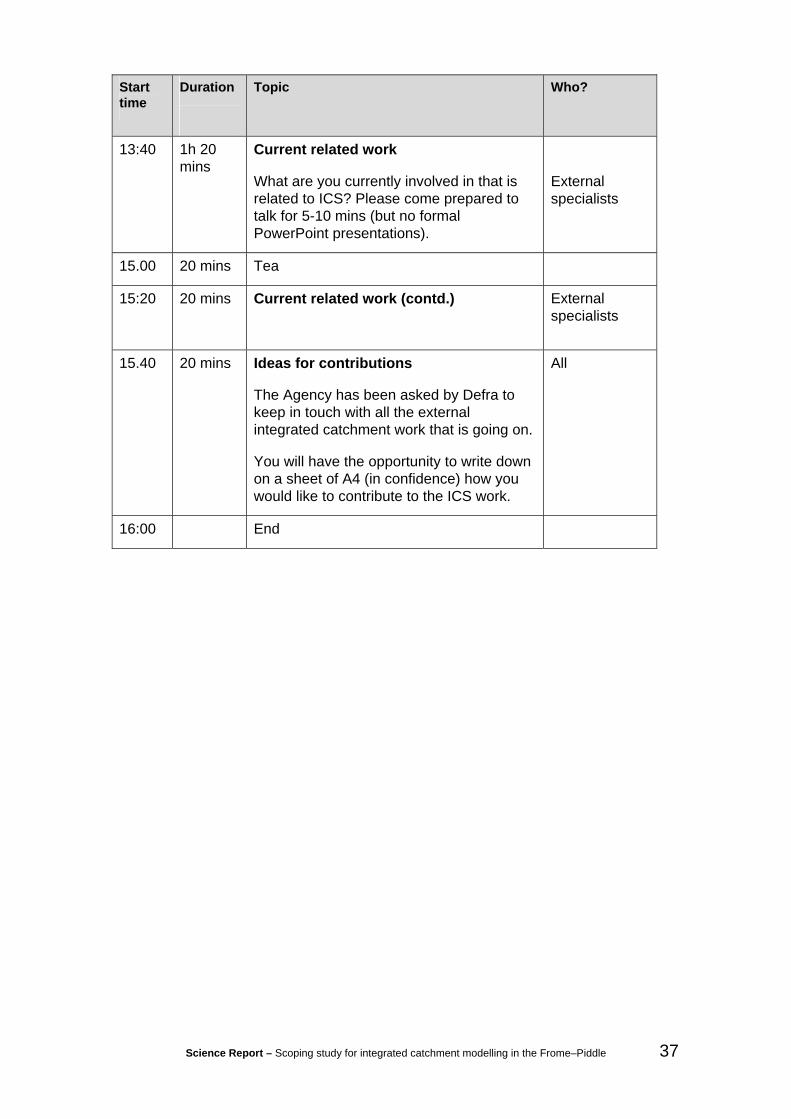
Science Report – Scoping study for integrated catchment modelling in the Frome–Piddle 37
Start time
Duration
Topic Who?
13:40 1h 20 mins
Current related work
What are you currently involved in that is related to ICS? Please come prepared to talk for 5-10 mins (but no formal PowerPoint presentations).
External specialists
15.00 20 mins Tea
15:20 20 mins Current related work (contd.)
External specialists
15.40 20 mins Ideas for contributions
The Agency has been asked by Defra to keep in touch with all the external integrated catchment work that is going on.
You will have the opportunity to write down on a sheet of A4 (in confidence) how you would like to contribute to the ICS work.
All
16:00 End
Science Report – Scoping study for integrated catchment modelling in the Frome–Piddle 38
INTEGRATED CATCHMENT SCIENCE Supporting Integrated Catchment Management for the Water Framework
Directive Notes from Workshop 2, 30th March 2006, Manor House, Hydraulics Research,
Wallingford Author of Minutes: Nick Jarritt (Entec), checked by Rob Soley (Entec)
Attendance: Steve Fletcher (EA), Paul Hulme (EA), Dave Johnson (EA), Sean Burke (EA), Susan Casper (EA), Mark Everard (EA), Fenella Brown (EA), Andrew Wither (EA), Stuart Allen (EA), Natalie Philips (EA), Rachel Dils (EA), Andrew Hughes (BGS), Mike Hutchins (CEH), Jim Smith (CEH), Martin Silgram (ADAS), Paul Davison (ADAS), David Lerner (Sheffield Uni), Rae MacKay (Brirmingham Uni), Geoff Parkin (Newcastle Uni), Andrew Cliff (University of Nottingham), Rob Soley (Entec), Nick Jarritt (Entec),
Introduction (Steve Fletcher)
Overview of the day – presentations to give background to some of the things that are going on with respect to integrated catchment science & knowledge transfer, feedback from experts on work they are currently doing, opportunity to feedback in confidence on how we could take research forward in partnership.
EA Science group is no longer a milk cow – only £150,000 available for this ICS programme over a two-year period. There is no longer Water Resources R & D. Science is concentrated into Themes, one of which is Integrated Catchment Science. This is broken down further into 7 main work packages, including “Knowledge Transfer” – aimed at developing a modelling and risk-based decision making framework.
ICS underpins WFD implementation, and we are expecting to contribute mostly to the 2nd round of RBMPs (i.e. in the longer term – from 2015). But we are also looking for any ‘quick wins’/interim tools which might feed into 1st Round RBMPs. Ultimate aim is to produce a tool for a catchment manager (i.e. whoever’s job it is to implement PoMs). We don’t know what this tool will look like, but we don’t envisage producing 1 large model that does everything. We want to use models to investigate areas of apparent mis-match, not just to make predictions. We can use the modelling process to identify areas where we don’t understand what is happening in the catchment – to point to areas where something different/unusual is happening. We are trying to integrate ideas and understanding – it is more about the process of incorporating ideas, rather than numbers: using modelling results to inform, not blind. We also want to integrate the entire catchment, from headwaters to the sea (i.e. to ensure that transitional and coastal waters are firmly on the ‘integrated catchment’ map).
We want to consider the pros and cons with respect to ‘large complex’ vs ‘quick and dirty’ models. The main areas of interest are:
-> Surface and groundwater interaction
-> sediments, P and N
-> marine interactions
-> ecology (and its links to water quantity and quality)
-> economics & socio-economics (science can’t ignore these if the aim is to realise environmental improvements).
We need to investigate knowledge transfer – how we can get the modelling results out there and include people not involved in the modelling process. How can the wider
Science Report – Scoping study for integrated catchment modelling in the Frome–Piddle 39
community reap more benefit from the detailed modelling work which has already been carried out?
At the first ICS workshop (in Blandford) we proposed to trial development of a catchment model of the Frome–Piddle area, but the feedback from Area staff was that they didn’t want that, but rather they wanted a system to present all the nationally calculated data that we already have in an integrated GIS system to which their own understanding/information/data could also be added.
The challenges that we face are cross-functional working within the EA. We need to generate an integrated catchment modelling community (as has been done with groundwater modelling). Despite the fact that WFD is here and happening now, it is not yet a mainstream activity within the EA. Also, we have very little money. We therefore have to be smarter in the way that we work: look to work with universities to search out areas of funding and help produce grant applications (EA member of staff are allocated to work with this). We will run workshops (like today) and look at studentships (one for the future?).
We need to change hearts and minds to change land use – it will only happen if people want to. We therefore need to explain modelling in a transparent way so that we are believable. Through informed dialogue (2-way, not 1-way) we need to change peoples views and their aims. Land use change costs someone money – we can’t do this without considering the economic aspects of what we are doing. WFD says we need to bring about good ecological status unless it is ‘excessively expensive’, but we need to make sure that this ‘get out’ is not used too often.
What do we need now? Quick successes – we need to produce useful results to show that this is a key part of delivering WFD. Is there anything that anybody is doing now, which the EA can add a small amount of funding to, so that it will deliver quick results?
Tiered approach to conceptual modelling:
Determine issues -> formulate hypothesis -> test with models -> is the risk in this decision to do something acceptable? (i.e. what’s the risk of the decision backfiring or giving the wrong answer). We can do this in a hierarchy going to more detailed models and more detailed investigation if the risk at a general level is unacceptable (i.e. we don’t know enough from a general conceptual model). We need a mechanism for going between tiers of complexity. This must take into account the current knowledge of the system and the probability and consequences of getting the answer wrong. Considering Bayesian ideas, or ‘weight of evidence’ approaches.
After today, we need to develop a 2-year programme and a forward look to 3 years hence.
Comments and Questions:
There are many difficulties in working together within the EA – we need to break these down – please use the expertise in the Risk and Forecasting Centre of the EA.
Presentation of related GIS work
We will use the next series of presentations to set the scene with some of the other work that has been going on within the EA. The common thread is that these have been using GIS tools for risk assessment and are leading into catchment management decisions.
Science Report – Scoping study for integrated catchment modelling in the Frome–Piddle 40
Nitrate Vulnerable Zone (NVZ) Delineation (Dave Johnson)
We went to each EA Regional/Area office. Through the course of a 1-day workshop the new NVZ areas were defined. The base information for this workshop was a GIS system which contained information on monitored groundwater quality data with associated agricultural loads and predictions for the future. This presented just the raw data, so we also had an additional four layers to make up a risk model:
1. Nitrate leaching risk (from a model developed by ADAS) with different scenarios for wet, dry and average years;
2. Urban nitrate loadings;
3. Contoured groundwater concentrations (current);
4. Contoured groundwater concentrations (predicted future).
This gives a general way of identifying the areas at most risk. Combining the four layers we can produce a general risk map identifying areas that are definite problems, areas that are definitely OK, and also areas where the evidence is giving conflicting results. This presented the general data to the EA Area staff, along with all of the other background information (geology, etc). From this starting point we can talk to the Area staff and then integrate local knowledge. This is done with 3 blank layers that we allow the EA Area staff to capture local knowledge in. This can’t override the general national risk map, but it gives the opportunity to add in additional information. An example: national risk map shows some areas of low concentrations within larger areas of high concentrations. Local area knowledge told us that these boreholes were confined and not associated with the same groundwater as the surrounding boreholes. By combining the risk map and the local knowledge the NVZs for each area can be defined. In doing this there are a lot of decisions to be made based on all of the information. The national GIS data (e.g. drift thickness and permeability) combined with the local knowledge through the Area workshops allowed the NVZs to be defined in a rigorous and consistent manner. By working with people we have brought people together through being able to present complex data and modelling output in an easy and visual way.
We are also doing a similar process on the surface water side (with a starting point of GQA data).
Steve Fletcher: a key quick win on this is to produce GIS output presenting existing modelling data for people to use (cf. feedback from 1st workshop that people want visualisation of what we already know).
Comments and Questions: Sean Burke: In some areas (e.g. Doncaster) GW levels are rebounding (e.g. in relation to minewater rebound), which can dilute nitrate concentrations. Steve Fletcher – but we know and first identified this process through the GIS systems which allowed us to link reducing concentrations, rebounding groundwater levels and the cessation of dewatering at mines.
Wetlands (Paul Hulme)
A key part of ICS is checking the plausibility of our hypotheses. An example of this is the assessment of significant damage to GWDTEs (groundwater dependent terrestrial ecosystems or ‘wetlands’). We have used different streams of data and brought them together through GIS to look at a ‘weight of evidence’ approach to identify ‘significant damage’. We are using the classic ‘pressure-pathway-receptor’ model and ask the question ‘what are the chances that the pressure is transmitted to an impact on the wetland’. We have started with our basic datasets (GW abstraction pressure, pollution
Science Report – Scoping study for integrated catchment modelling in the Frome–Piddle 41
pressure – phosphates, GW connectivity, ecological sensitivity to groundwater) and scored the pressure (H – 5, M – 3, L – 1, N – 0). We can sum these scores to give a total for each GWDTE (max score 20, min score 0). Although this is almost certainly too crude and wrong, we have generated a prioritised list on where we think that there may be the most potential problems. We can then go around to the EA Area staff with their local knowledge to allow them to modify the original scores to re-prioritise the list based on increased knowledge. We can also start to increase the certainty in the scoring of the GWDTE. Through workshops we are feeding in more local knowledge, as well a providing a detailed audit trail as to how we have arrived at our answers and where the data have come from.
The ‘local modifiers’ can be based on different parameters, e.g. pesticide loading, nitrates, as well as more local knowledge about GW connectivity (e.g. location of springs). The process is about drawing together different sources of evidence and then modifying that evidence as we dig deeper and get more detailed knowledge from the local consultation with EA Area staff. We end up with ranked lists for consideration. We feel that we are now straying into ‘weight of evidence’ approaches where we are less sure of the science of risk and uncertainty.
We have trialled this in East Anglia. Showing the results to English Nature provided a spark for discussion and more detailed thinking about particular sites with high scores.
Comments and Questions:
Might be worth considering the ‘Wetland Vision’ approach being plugged by the RSPB as a more integrated wetland starting point with more comprehensive coverage than the SSSI network BUT the WFD default objectives cannot be achieved everywhere because it is not possible on a socio-economic basis. The GWDTE issue (significant damage to GWDTE = poor status in GW body) highlights this.
Rachael Dils – how have you decided where to put the thresholds between the different scores? Paul Hulme – at this stage we haven’t worried too much about the thresholds, but rather on putting the method in place. What the work has done is identify where we are uncertain about the mechanisms of impact on wetlands and where we don’t understand where the thresholds should be.
Vulnerability (Fenella Brown)
Currently there are two aspects to the groundwater vulnerability maps – major/minor aquifer and a soil leaching class. We will move from this to add new data – dissolution features (better consideration of karst), superficial thickness, permeability, unsaturated zone, additional soil attributes (the attenuating capacity of the soil), along with Activity Lookup Tables. The tables will identify which processes are relevant to which activities and how the pathways relate to the groundwater. The lookup tables weight different processes for both surface water and groundwater. A by-product of looking at how much goes into groundwater is that we know how much doesn’t = surface water risk. The groundwater vulnerability is a product of the activity, the process and the vulnerability of the groundwater to that process. We can therefore produce different groundwater vulnerability maps based on different activities within catchments.
A GIS tool has been developed to query all of the relevant layers and the activity lookup tables to generate a groundwater vulnerability map. The tool also has the capacity to allow overrides of the input data where we have increased local knowledge, or where we don’t understand the outputs. Where we don’t understand we can look at point assessments and look at scenarios to create a better understanding of the processes determining the groundwater vulnerability.
Science Report – Scoping study for integrated catchment modelling in the Frome–Piddle 42
The GIS tool helps people to understand the different components that went into making up the final groundwater vulnerability – a more useful tool than just providing people with a number and a map, without devolving any of the information behind it. This has been designed to be sent out to the EA Area staff.
The concern with this is that whilst we are devolving more data and understanding, the main users are local councils. By having more data, more maps and more ‘answers’ (based on different activities) we might just be making their lives more difficult by giving them more complexity than they need or can use, or by allowing too much flexibility and ‘user intervention’ into the final outcome.
Comments and Questions: Andrew Hughes suggested there is a layer missing in the vulnerability work – BGS has not paid enough attention to the soils – a gap which they are working to plug in association with the Macaulay Institute. Barry Smith is running this programme. There was debate as to whether ‘grid based’ approaches are more or less open to abuse than line/boundary/polygon based approaches – they must all be rolled out with a clearly caveated appreciation of the minimum scale to which they can be reliably applied.
Decision Support Tool (DST) for agricultural land use management (Rachael Dils)
The aim of the DST is to provide a consistent modelling approach for diffuse agricultural pollutants in land use surface and shallow subsurface zone processes. It was acknowledged that there are a lot of tools and models within the EA that rely on different databases. We wanted to integrate the different tools within a single database model and also provide a single ‘plug and play’ modelling framework.
The single database model aims to bring together soil, climate, hydrology, topography, land use, crop, livestock etc held at the 1km2 scale. The advantage of this is that the data can be centrally managed and maintained on a consistent basis. At this 1 km2 level we can overlay and aggregate the information so that we can start to look at risk and relative risk within catchments.
Most of the work we are doing is with ADAS in Wolverhampton, and the DST is based on MAGPIE (modelling agricultural pollution and interactions with the environment). MAGPIE will be used as a framework to integrate 4 model components:
-> Nitrogen (NEAP-N)
-> Phosphorus (Psychic)
-> Sediment (Morgan-Morgan-Finney)
-> Pesticides (CatchIS), run for individual pesticides
This should be delivered at the end of May from ADAS. The model has been incorporated into GIS, with fairly quick run-times.
The limits of this is that the models are diffuse and don’t look (mostly) at in-stream processes or data (as does INCA, for example). Models can be calibrated against limited monitored data. 1 km2 grid is often too coarse for looking at things on a local level i.e. for ‘on the ground’ management within WFD water bodies the tool is too coarse. The 1 km2 does not allow adequate representation of connectivity. The way forward is to allow local model data to feed back into the DST grid level. We also need to know about source apportionment (point vs diffuse) and incorporate better weather generation and ‘crop swap or land use change’ simulation for scenario testing.
Science Report – Scoping study for integrated catchment modelling in the Frome–Piddle 43
The DST should be operational from May 2006, particularly for supporting catchment sensitive farming and WFD. The framework can only be used to support other models on a more detailed catchment level.
Frome–Piddle trial GIS for promoting integrated management (Rob Soley, Nick Jarritt)
We need a system to integrate and centrally store data from a wide variety of sources – national risk assessments, monitoring databases, pressures databases, EA Area operational information and experience, model results, detailed conceptualisation. We also need a means to improve the communication between the different groups within the EA and also between the EA and the external groups (universities, consultancies).
Rob presented an illustrative GIS integrating different datasets and reporting tools. As well as just including the GIS layers, we also need to include tools to allow people to get the relevant data back out again. And we need a feedback mechanism, by which local data with improved quality control can be fed into and override national datasets, which are often of lower quality.
Nick Jarritt gave a presentation on the MIKE BASIN experiment in Frome–Piddle and some background investigation of the sorts of integrated catchment models that are out there. It was generally agreed that there are overseas examples of good practice in using GIS to promote an integrated understanding of land-management issues across wide areas and with non-technical stakeholders (e.g. work from Australia) which we could learn from.
Current related work (external specialists)
Andrew Wither (EA – NOT an external specialist but…)
…the marine component often gets forgotten and we should have a transitional/coastal component to this project. There is a lot more environment ‘out there’ than there is on land. We need to remember that the impact of rivers on the marine environment differs massively around the country – there is a huge variation in the processes operating in different estuaries, based on monitored hydrochemistry and biological outcomes. Estuaries are also important as potential sinks for nutrients – look at the yellow-green slime on the mudflats which are oozing life – nutrients leave the river but they may never get to the sea. This is an important consideration in terms of biological productivity and also indirectly in preventing erosion. Estuaries are mixing zones – low nitrogen seawater and high nitrogen river water. We still, however, need to understand in greater detail the processes and their integration with pathways, receptors, and pressures so that we can more fully understand the role of estuaries and coastal waters in the catchment environment. This is a big gap – no-one has done it.
Martyn Silgram (ADAS, Environmental Systems group)
We have been doing work for Defra for reporting on inputs from agricultural pollution into the North Sea. This could be useful to the EA. Martyn is the Defra nominated scientific advisor on the reporting committee for this.
Science Report – Scoping study for integrated catchment modelling in the Frome–Piddle 44
Also involved in EuroHARP project. This has been looking at the relative model performance of a subset of 9 catchment models. The project has developed a suite of issues to look at – guidance on model selection, work on evaluating where models work and where they don’t work. The project looked at many catchments across Europe (including the Yorkshire Ouse) and looked at model suitability for a particular purpose (management scenarios) and cost-effectiveness. The final report on this project is due in May 2006. There was a specialist group looking at river retention of N and P. This information is now in a software toolbox on the project website.
ADAS has been involved in the NVZ process. There are some issues to do with the responsiveness of the system to land management change. We need to be sure and confident that the models that we are using can respond to subtle changes in management.
Mitigation of Phosphorus in Sediment (with Lancaster and Reading Universities). Project working on a field scale to get the numbers on cost-effectiveness of different measures (tillage, cropping, etc) which we can use in conjunction with other project that are going on (PEDAL, etc).
There is a need to think about sediment as well as N and P. In particular we need to look at the retention of sediment within the landscape before it gets into the river channels
Paul Davison (ADAS)
PSYCHIC – A lot of the issues that we faced with this were similar to the wider issues on this project (as described by Rachel): conveying models and model output to non-technical stakeholders. The value of visualisation through presentations was huge, in terms of prompting discussion, focusing people on problems and dispersing information. Lessons were learnt on both sides, with ADAS learning about how better to present their model results. There has been a fair bit of validation work done on PSYCHIC, but this is ongoing. There is also more science that could be included (e.g. in-channel aspects).
Also done work in modelling N and P at a field and catchment scale. ChREAM dataset of land use and land cover was out of date in places, so we had to groundtruth this. We were using the models to quantify the loads of N and P from agricultural sources to SSSIs. We followed this up with face-to-face presentations to stakeholders – this process adds a huge amount of value to the project.
Andrew Hughes (BGS)
Groundwater management programme (as distinct from groundwater modelling) – like most government organisations BGS have just started a 5 year programme (1 year in). The programme is to decide what we do with our money from NERC. This gave us the opportunity to re-think priorities. The main project is called ‘Catchment Studies’ which is looking at recharge & runoff–recharge at the field scale, river–aquifer interaction (building on LOCAR in the Pang Lambourne and Frome–Piddle including a CASE studentship at Imperial) and project with NW Region of EA and United Utilities looking at the River Eden catchment (focused particularly on nitrate risks to PWS sources).
National Groundwater Survey – large-scale conceptual model of how the hydrogeology of the country works (on a regional basis). This is moving away from printed manuals and moving towards web-based working with everything published on the internet
Science Report – Scoping study for integrated catchment modelling in the Frome–Piddle 45
though web-based GIS (ArcIMS). This map based ‘Geoscience Data Index’ will underpin all of the projects within the groundwater management programme.
Diffuse pollution – looking at nitrate, phosphate, pesticide. This is a field-based project looking at how groundwater concentrations vary with depths, saturated/unsaturated zones, etc
Groundwater modelling – the vision is, in 5 years’ time, to have a modelling system that will track a conservative pollutant throughout the hydrological cycle (not just the hydrogeology), using Object-Oriented techniques. Different organisations can populate this with the relevant objects, with BGS looking at the hydrogeological part of the cycle. OOP techniques are very applicable as we can model different objects in different ways, with different complexities. It also allows the system to evolve as we develop better and more detailed models. It also allows us to examine how different components interact with each other (ZOOM model, HarmonIT – models should be OpenMI compliant – like the Mike models & those used by Delft & HR). What happens if we link the ZOOM model with a ‘real’ river model? We are also using R (high-level programming language) to look at automated timeseries statistical analysis to produce simple consistent reports. Within groundwater modelling we also want to be able to deliver modelling results via the internet using ArcIMS.
We won’t get there overnight but BGS are aiming to play to their strengths and stick with the hydrogeological aspects of things, but they are looking to work with other people and groups to develop the other OOP components.
Rae Mackay (Birmingham University)
Hydrogeology group at Birmingham has a primary interest in processes. We are working at the ‘building block’ level. But we also scale up to look at integrated catchment aspects. We are involved in LOCAR looking at recharge processes through drift, scaling fine-scale understanding up to a simplified model form for catchment modelling, and we have made good progress on this.
The oil industry (Schlumberger) have 3-d model – Eclipse – and are now interested in this as a groundwater modelling tool. We are using this to translate the oil industry speak into groundwater modelling speak. Eclipse is a very powerful tool that can go from the very coarse to the very detailed within one model.
Integrated studies for small catchments in NE Brazil – we have developed a highly simplified spreadsheet model to get some handle on understanding interactions between surface and groundwater. The spreadsheet helps to understand the interaction so that we can put in place better management of the water systems in a more sustainable way. There is a system working out strategies to take the outputs of models into the community which has resulted in a significant amount of work in incorporating local ‘common-sense’ understanding of systems. In particular we have developed our understanding through information exchanges between models and the community.
Switch is a 5-year programme integrated urban study into sustainable water resources management. We have adopted a programme called ‘learning alliances’ which is a way of getting stakeholders, government, universities to work together to develop a common understanding of problems and solutions. It has been used before in agriculture and irrigation, but this is the first time that it has been used for urban water management. There are 33 partner organisations involved and Birmingham will be one of 9 trial cities. The project itself is covering not just technology and modelling but also institutional change and governance. There are some issues within integrated
Science Report – Scoping study for integrated catchment modelling in the Frome–Piddle 46
catchment science that need to address governance issues as well as stakeholder and information issues – we need to look upwards as well as downwards.
On a more local level we are developing a sustainability indicator model to understand all of the inputs in terms of water and energy and their flow through cities (energy budgets and water budgets) – using a simplified modelling approach and linking this to further integrated catchment models.
Michael Hutchins (CEH)
CEH are currently working on three core research programmes – water, biodiversity and biogeochemistry. 80–90 staff working in the water programme. 3 themes: water extremes (flood and drought), process understanding (feedback interactions between quantity, quality and biota, contaminant sources and fates) and catchment science (integrating data, scientific understanding and management methods at the catchment scale). CEH hold a lot of national monitoring databases. This is feeding into catchment-scale modelling and management.
CEH are interested in investigative modelling on a catchment scale. CEH have a long (20 year) experience of catchment-scale modelling. CASCADE/QUESTOR has been used on a number of research projects (e.g. Humber River Basin District, originally part of LOIS programme – set up over 5 years). Model is a linked approach taking a diffuse pollution model (5 km2 subcatchments with soil parameters, land use data) to model flow, nutrient and pesticide losses from hydrological response units. We don’t focus in on field-scale studies in modelling, but we do use collaboration to better understand from more detailed modelling what our parameterisation should be at the larger scale. CEH are interested in linking with more dedicated groundwater modelling. QUESTOR is the in-stream component of the model which takes the diffuse inputs of CASCADE and routes them through the river network. In-stream processes are modelling in detail (e.g. in-channel stores and sinks).
CEH are also involved in a project (RELU) with UEA to link physical modelling with economic analysis, particularly focused on assessment of farming management options for WFD, considering impacts on rural economies.
CEH have been involved in various CATCHMOD cluster projects, one of which was to develop protocols for model selection whereby, in consultation with the end-user, models appropriate for particular applications can be selected in a rigorous manner. We have evaluated the ability of different models to link in with other models. This is based on a number of schemes – scientific rigour, data availability, usability, IPR, output. These can be weighted as appropriate depending on the output that the end user wants. We also have considerable experience of looking at model complexity and structure as well as sensitivity and uncertainty analysis.
CEH have also been involved in a quality assurance project to ensure that modelling applications are done to acceptable standards (HarmoniQA tool available on internet). We have also developed the Open Modelling Interface (OpenMI) with the aim of making modelling compliant with OpenMI for better consistency.
CEH are keen to share model code with collaborators and to link models and understanding – they are not software sellers.
Jim Smith (CEH Dorset) added that, in Frome–Piddle they have built up and extensive dataset of N and P – intensive modelling of STW inputs. A lot of models are not good as they are based on poor data, particularly for STW effluents. We have collected a lot of data for model validation.
Science Report – Scoping study for integrated catchment modelling in the Frome–Piddle 47
Conclusions from model review work – most modellers tend to over-hype their model and are also reluctant to carry out blind prediction trials!
Comment – Andrew Wither: surprised that neither BGS or CEH have mentioned the NERC Knowledge Transfer programme which is aimed at getting public-funded environmental science research better linked to the end users of that research (i.e. the Environment Agency)
Geoff Parkin (Newcastle University)
We ( Newcastle Uni & the National GW Modeller’s Forum) will be putting in a bid to NERC on the Knowledge Transfer programme to start to integrate university, consultancy and EA for integrated management.
We are looking at developing conceptual model understanding of how catchments work. So far we have looked at diffuse pollution and WFD but there has been no mention of flooding – which is clearly related (sediments/phosphorous/soil loss/land management). We are looking to develop conceptual models and approaches that are applicable to groundwater, surface water, nutrients, sediments etc.
We also need evidence of how small-scale changes have an impact at the catchment scale. For this we need long-term datasets that will show how catchments react to land management change. We are developing ‘earth systems laboratories’ (new name for field sites) to look at changes and impacts in the field on as large a scale as possible.
Newcastle University have traditionally been a modelling group. Have developed SHE-TRAN which is a research tool with a lot of process representation representing N, P, sediments and in-stream water quality. Also have river hydrodynamic model called NOAH for 1d and 2d in-stream modelling.
Recharge and diffuse pollution – Tadpole study on the Nottingham Triassic sandstone to look at impacts of land use on recharge to the aquifer. A lot of work is now focused on the Eden catchment (in partnership with EA, BGS and UU). Currently looking at the effects of spatial variability of drift deposits on recharge and the impacts on high nitrates within the catchment – interaction of groundwater and surface water pathways on residence time. Also work looking at soil nutrient cycling responses to global warming – currently on a field scale, but this will be scaled up to the catchment scale in due course. Plus work on distributed minewater rebound impacts, and looking at farm management decision tools – (includes the smallest scale influences such as contrasts between ‘down-slope’ and ‘contour’ ploughing direction).
River flows and flooding – flood risk estimation, focusing on Eden catchment. Developing an integrated modelling framework for looking at land use impacts on flood risk. It will identify which parts of the catchment are impacting on which part of the flood hydrography – we can then identify which parts of the catchment that are contributing to runoff, which will have spin-off benefits in terms of diffuse pollution. Working with Bayesian approaches here. Also looking at salmonid related Hands off Flows within the river Eden. These projects are giving us the basic hydrological understanding, along with the nutrients and sediments. Continuing monitoring in the Eden catchment is building up a database of meteorological, hydrological, chemical, hydrogeological data that provides a valuable calibration and validation base for modelling. As a ‘close to natural’ catchment the Eden is useful for looking at the underlying principles and basic process understanding (part of the CHASM programme).
High flows are important and engagement with flood risk science will be important in delivering WFD objectives as well as consideration of low flows and water quality.
Science Report – Scoping study for integrated catchment modelling in the Frome–Piddle 48
Comment – Steve Fletcher accepted the importance of linking with flood risk WORKS – through CFMPs. Defra have significant programmes/funding in this area and floods will inevitably loom large in public stakeholder consultation, even if the WFD is intended to focus on the impacts of people on the environment (more than the impacts of the environment on people).
Andrew Cliffe (University of Nottingham)
A 1-week workshop to understand how we should make decisions in the light of uncertain data (‘scientific uncertainty and decision making‘) spawned a project looking at how uncertainty propagates through coupled models. To facilitate looking at uncertainty using the basic tool of Monte Carlo techniques, we have replaced computationally intensive models with simple emulators to allow us to do many more model runs. The Monte Carlo simulation is based on the emulators and is much faster than using the original models. This is a Gaussian process. Uncertainty is key to understanding how we can use model results. The other aspect of this is ’expert judgement‘ and how expert information can be fed into modelling. Experts may be better at saying what they expect the outputs of models to be, but not necessarily about how the input parameters should look. The project is linked with the EA in applying some of these ideas to the Frome–Piddle catchment using stakeholder workshops to ensure wider community, multidisciplinary inputs. The project is running for 3.5 years, starting in October.
Comment – Jim Smith – there has been too much focus on looking at error propagation within models, and not enough in terms of blind testing of models and looking at error propagation against the real world. In EuroHARP some models could deal with blind testing, but others were very poor. This is fundamental as if models don’t work on the ground then they are not going to get used again.
Andrew Cliffe – Blind testing is not everything – there is an important difference between uncertainty (what we don’t know) and error (where we are wrong).
David Lerner (Sheffield University)
EA is co-funding the catchment science centre at Sheffield University – we want it to be an open affair and we are always keen to collaborate with other people in order to deliver practically useful outputs (already working together with Birmingham, the Open University and Lancaster). We are looking towards the 2nd cycle of RBMPs, but we have resources (8 people with European funding). There is still scope to mould our projects to deliver what the EA wants. We are intending to look at the impacts of water quality and quantity on the ecology. We are also going to look at systems modelling – coupling models together often leaves gaps and creates uncertainty, so we want to take a systems analysis approach to the integrated catchment modelling programme. In 10 years we will have a model that does everything. In the short term we want to focus on one catchment (close to Sheffield!). We also want to include urban as well as rural diffuse pollution aspects. We are working with Yorkshire Water and we hope to set up another experimental catchment (probably small and urbanised), but we are open to being influenced on what we do in the future.
David also suggested that the external representatives should submit their initial suggestions on collaboration with the Agency’s ICS programme directly to Steve Fletcher, rather than through any third party (such as the consultants Entec) & this was agreed as the best way to end the workshop.
Science Report – Scoping study for integrated catchment modelling in the Frome–Piddle 49
General discussion
Dave Johnson commented that there are significant issues with IPR and licensing the data and models which underpin many of the examples of integrated catchment knowledge transfer demonstrated & discussed today. We can put the NVZ data up this month, but the licenses for some of the data run out at the end of the month, and we can’t continue to use them. We all have problems with data access and use. It is often the biggest problem that we have in modelling. At the level at which we are operating we can’t change this.
Andrew Hughes of BGS responded that income from data is a key part of BGS finances. Martin Silgram of CEH also stated that models often become redundant because the data sources aren’t funded.
Dave asked is there some way that we can start thinking around this problem? Fenella showed that the maps derived from the data can be freely available, with payment required when you get the reports on the background data. What about the Freedom of Information Act? Sorting out the legal issues is very problematic.
It was separately noted that there are a lot of organisations in different fields working in ICS – we should have a forum to draw all of this research together (similar to that in place for Groundwater Modelling).
Science Report – Scoping study for integrated catchment modelling in the Frome–Piddle 50
Appendix C Review of projects and modelling tools for integrated catchment management
Science Report – Scoping study for integrated catchment modelling in the Frome–Piddle 51
This review summarises the results of a brief internet and telephone-based search to identify projects and modelling tools relevant to integrated catchment management. This is a very active area of research, both nationally and internationally, and consequently the list below is not exhaustive.
1. Research initiatives/projects identified
1.1 ASTHyDA (Analysis synthesis and transfer of knowledge and tools on hydrological drought assessment) http://www.geo.uio.no/drought/
The aims of this project are:
• to review, analyse, and synthesise knowledge and tools on low streamflow and groundwater, including management practice and the impact of environmental changes on water quantity and in-stream ecology;
• to encourage harmonisation of methods and provide recommendations for tools for drought estimation, monitoring, forecasting and mitigation;
• to foster cross flow of information between the consortium and representatives from national and local water management organisations across Europe;
• to disseminate and valorise the knowledge and tools to a wide audience through the publication of a textbook;
• to promote collaboration and capacity building between scientists and practising water managers and hydrologists through the initiation of a European Drought Partnership.
1.2 CATCHMOD cluster http://www.harmonit.org
This EU-funded project is about making possible the construction of whole catchment models to facilitate integrated catchment management.
The objective is to develop, implement and approve a European Open Modelling Interface and Environment (OpenMI) that will simplify the linking of models and hence allow catchment managers to explore the likely outcomes of different policies.
The simplification of the model linking process will lead to an improved ability to model process interactions, the ability to use appropriate model combinations and the ability to swap in and out different models of the same process and hence facilitate sensitivity analyses and benchmarking.
1.3 ChREAM – Catchment Hydrology, Resources, Economics And Management: Integrated Modelling of WFD Impacts upon Rural Land Use and Farm Incomes http://www.uea.ac.uk/env/cserge/research/relu/index
ChREAM combines natural science with socio-economic research to assess the costs and benefits to the rural community of changing farming and community practices to produce a healthy and sustainable river environment of good amenity value. A key focus of the analysis is to examine how (within a context of reforms of the Common Agricultural Policy and complicating issues such as climate variability and non-agricultural sources of pollution) the EU Water Framework Directive is likely to affect
Science Report – Scoping study for integrated catchment modelling in the Frome–Piddle 52
agricultural activities concerning fertilisers, pesticides and faecal matter and so impact upon incomes within already fragile farming communities. It also assesses the value and transferability of potential water amenity and recreational benefits arising from such policies and compares this to their likely cost. The work combines physical environment models with economic analyses and surveys of farmer attitudes and behaviour to provide a highly interdisciplinary study of this multifaceted issue.
Specific objectives of this research include:
1. To develop a methodology for integrated hydrological–economic modelling of the relationship between rural land use (and consequent farm incomes) and water quality (including diffuse and point sources of nutrients, pesticides and faecal matter and consequent ecological status), with allowance for climate variability and instability.
2. To estimate the impact upon rural land use and farm incomes of the consequences of implementing the Water Framework Directive (WFD) and Common Agricultural Policy (CAP) reforms.
3. To provide relevant policy guidance regarding alternative strategies for securing the objectives of the WFD and to estimate the impacts of such strategies upon fragile rural economies.
4. To assess economic values for the social benefits that may be generated by implementation of the WFD.
5. To step beyond integrated modelling to combine this with attitude-behaviour surveys of farm decision making.
For further details regarding ChREAM please contact Professor Ian Bateman at the University of East Anglia [email protected]
Further details of similar research funded under the same research programme the RELU (Rural Economy and Landuse) is available on the website http://www.relu.ac.uk/research/Theme%20A.htm
Further information on recent research relevant to diffuse pollution and integrated catchment management can be found on the adapt website http://www.uk-adapt.org.uk/home/
There are other integrated catchment management initiatives funded outside academia. Recent examples in the south west of England include Cycleau (http://www.cycleau.com) and the Cornwall Rivers Project (described below).
1.4 Cornwall Rivers Project Targeting 15 key river catchments across the county, this initiative was designed to bring significant benefits to both the environment and the economic viability of local rural communities in Cornwall. The specific objective of the project is to improve the economic potential of Cornwall's freshwater fisheries resource, the development of which relies on a pristine riverine environment. The primary aim of this four-year programme, funded by Defra and the EU, has been rehabilitation of the key rivers and their catchments across the Objective 1 area while bringing improvement in the economic viability of local rural communities. During the project, 870 landholdings across Cornwall were visited by the Westcountry Rivers Trust officers, each one receiving a confidential individually tailored and free ‘Integrated River Basin Resource Management Plan’, which identified opportunities to improve farming practice, to protect the environment and to make economic savings. These plans cover a total land area in excess of 560 km2 and over 1380 km of surveyed watercourses.
Science Report – Scoping study for integrated catchment modelling in the Frome–Piddle 53
An independent economic survey of the project revealed that the majority of respondents have already made significant savings through taking up the advice – the average annual savings per farm are calculated to be in excess of £1369. For more information please see: http://www.cornwallriversproject.org.uk/
The Association of Rivers Trust is the umbrella of all the local rivers trusts across the UK. Further details of the activities of all the trusts can be found on: http://www.associationofriverstrusts.org.uk/.
1.5 MOPEX (model parameter estimation experiment) http://nws.noaa.gov/oh/mopex/index.html
The MOPEX project investigates techniques for the a priori estimation of parameters used in land surface parameterisation schemes of atmospheric models and in hydrological models. A first major step is the development of a comprehensive database containing many years of historical hydrometeorological time-series data and land surface characteristics data for many basins in the USA and from other countries. The project has the following objectives:
1. To develop improved a priori model parameter estimation techniques for large-scale modelling applications and for un-gauged basins.
2. To develop an international database of retrospective hydrometeorological data and basin characteristics data for a wide range of climate and geophysiological conditions.
3. To develop objective measures to evaluate the parameter estimate techniques and to understand parameter uncertainty.
4. To develop diagnostic tools to foster improved understanding of natural hydrologic processes at basin scales and related behaviour of hydrologic models.
5. To promote and facilitate the exchange of ideas and experiences on approaches to model parameter estimation for different climatic regimes.
1.6 Optimising Nutrient Management to Sustain Agricultural Ecosystems and Protect Water Quality (US Department of Agriculture)
This ongoing research by the US Department of Agriculture has the following aims:
• to quantify the impacts of fertiliser, manure, crop and grazing management on P, N and C cycling in soils;
• to define critical source areas and transport pathways of P and N by relating soil levels to losses in surface runoff and leachate, and delineate hydrologic processes controlling nutrient loss from watersheds;
• to determine stream channel hydrologic processes and fluvial sediment properties that control the transport of nutrients and pathogens from the edge-of-field to lakes, reservoirs and estuaries;
• to develop and apply models and indices to assess and rank site vulnerability to nutrient loss and their impact on surface water quality; and
• to define best management practices to minimise nutrient transfers from agricultural land to water.
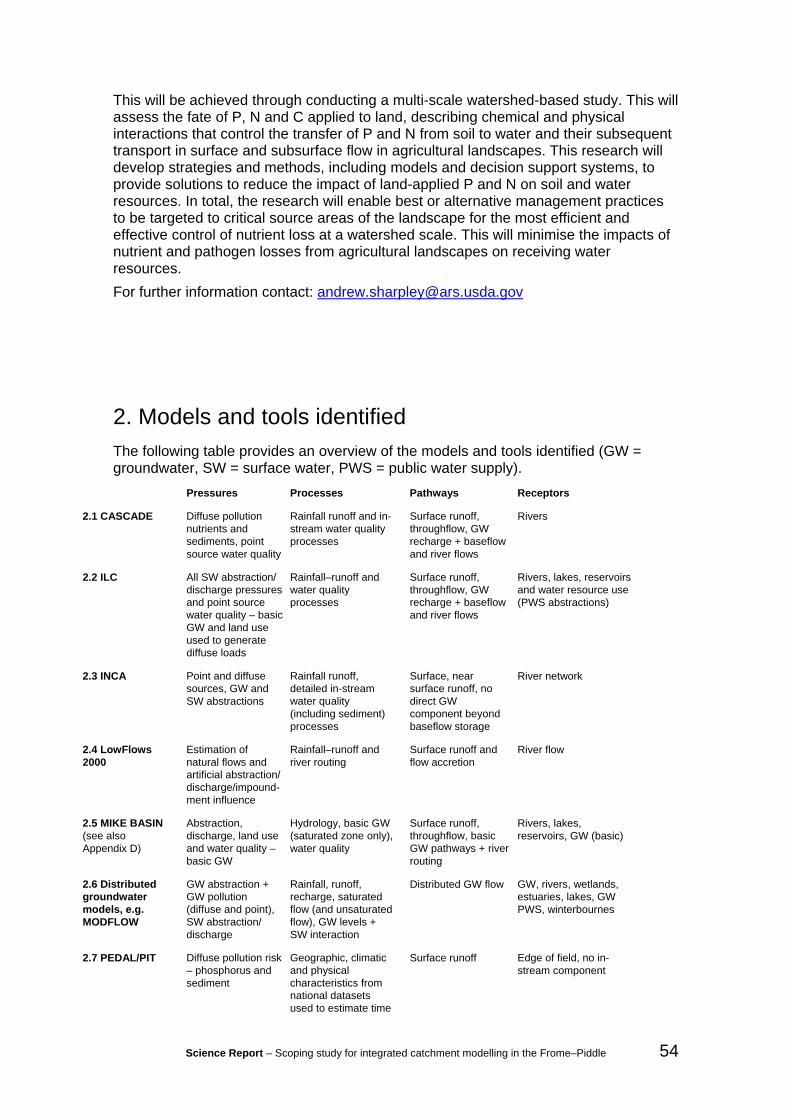
Science Report – Scoping study for integrated catchment modelling in the Frome–Piddle 54
This will be achieved through conducting a multi-scale watershed-based study. This will assess the fate of P, N and C applied to land, describing chemical and physical interactions that control the transfer of P and N from soil to water and their subsequent transport in surface and subsurface flow in agricultural landscapes. This research will develop strategies and methods, including models and decision support systems, to provide solutions to reduce the impact of land-applied P and N on soil and water resources. In total, the research will enable best or alternative management practices to be targeted to critical source areas of the landscape for the most efficient and effective control of nutrient loss at a watershed scale. This will minimise the impacts of nutrient and pathogen losses from agricultural landscapes on receiving water resources. For further information contact: [email protected]
2. Models and tools identified The following table provides an overview of the models and tools identified (GW = groundwater, SW = surface water, PWS = public water supply).
Pressures Processes Pathways Receptors
2.1 CASCADE Diffuse pollution nutrients and sediments, point source water quality
Rainfall runoff and in-stream water quality processes
Surface runoff, throughflow, GW recharge + baseflow and river flows
Rivers
2.2 ILC All SW abstraction/ discharge pressures and point source water quality – basic GW and land use used to generate diffuse loads
Rainfall–runoff and water quality processes
Surface runoff, throughflow, GW recharge + baseflow and river flows
Rivers, lakes, reservoirs and water resource use (PWS abstractions)
2.3 INCA Point and diffuse sources, GW and SW abstractions
Rainfall runoff, detailed in-stream water quality (including sediment) processes
Surface, near surface runoff, no direct GW component beyond baseflow storage
River network
2.4 LowFlows 2000
Estimation of natural flows and artificial abstraction/ discharge/impound-ment influence
Rainfall–runoff and river routing
Surface runoff and flow accretion
River flow
2.5 MIKE BASIN (see also Appendix D)
Abstraction, discharge, land use and water quality – basic GW
Hydrology, basic GW (saturated zone only), water quality
Surface runoff, throughflow, basic GW pathways + river routing
Rivers, lakes, reservoirs, GW (basic)
2.6 Distributed groundwater models, e.g. MODFLOW
GW abstraction + GW pollution (diffuse and point), SW abstraction/ discharge
Rainfall, runoff, recharge, saturated flow (and unsaturated flow), GW levels + SW interaction
Distributed GW flow GW, rivers, wetlands, estuaries, lakes, GW PWS, winterbournes
2.7 PEDAL/PIT Diffuse pollution risk – phosphorus and sediment
Geographic, climatic and physical characteristics from national datasets used to estimate time
Surface runoff Edge of field, no in-stream component
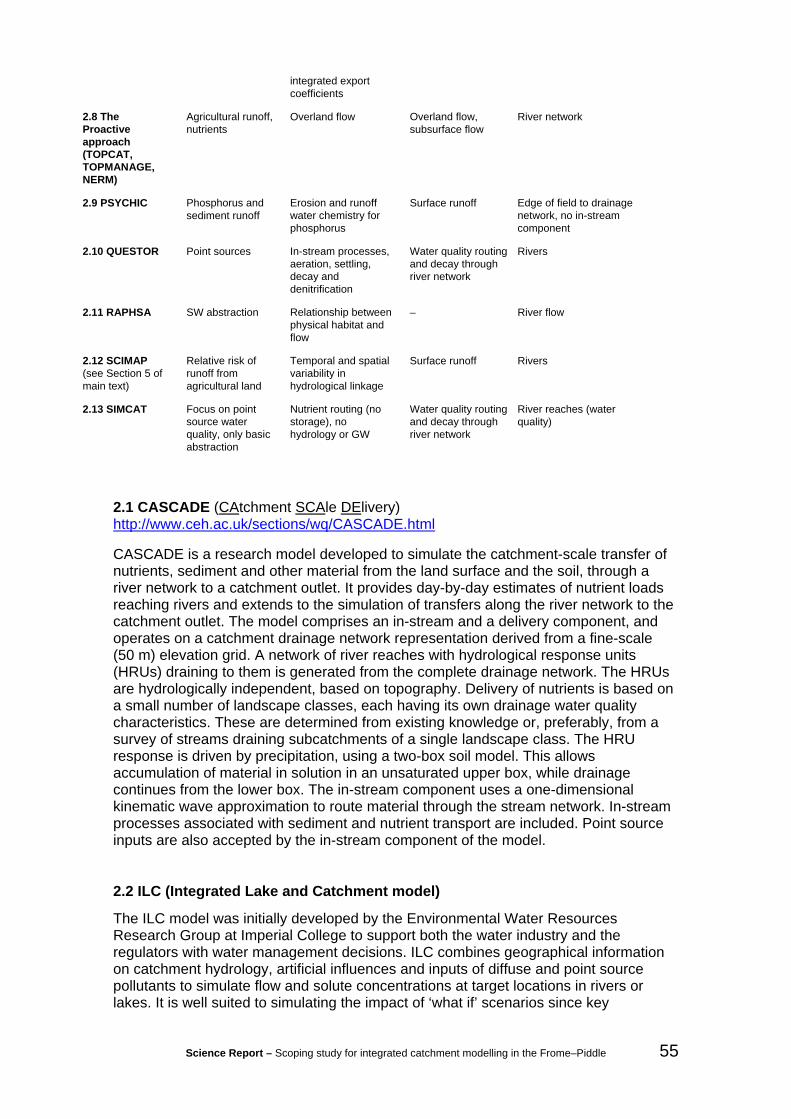
Science Report – Scoping study for integrated catchment modelling in the Frome–Piddle 55
integrated export coefficients
2.8 The Proactive approach (TOPCAT, TOPMANAGE, NERM)
Agricultural runoff, nutrients
Overland flow Overland flow, subsurface flow
River network
2.9 PSYCHIC Phosphorus and sediment runoff
Erosion and runoff water chemistry for phosphorus
Surface runoff Edge of field to drainage network, no in-stream component
2.10 QUESTOR Point sources In-stream processes, aeration, settling, decay and denitrification
Water quality routing and decay through river network
Rivers
2.11 RAPHSA SW abstraction Relationship between physical habitat and flow
– River flow
2.12 SCIMAP (see Section 5 of main text)
Relative risk of runoff from agricultural land
Temporal and spatial variability in hydrological linkage
Surface runoff Rivers
2.13 SIMCAT Focus on point source water quality, only basic abstraction
Nutrient routing (no storage), no hydrology or GW
Water quality routing and decay through river network
River reaches (water quality)
2.1 CASCADE (CAtchment SCAle DElivery) http://www.ceh.ac.uk/sections/wq/CASCADE.html
CASCADE is a research model developed to simulate the catchment-scale transfer of nutrients, sediment and other material from the land surface and the soil, through a river network to a catchment outlet. It provides day-by-day estimates of nutrient loads reaching rivers and extends to the simulation of transfers along the river network to the catchment outlet. The model comprises an in-stream and a delivery component, and operates on a catchment drainage network representation derived from a fine-scale (50 m) elevation grid. A network of river reaches with hydrological response units (HRUs) draining to them is generated from the complete drainage network. The HRUs are hydrologically independent, based on topography. Delivery of nutrients is based on a small number of landscape classes, each having its own drainage water quality characteristics. These are determined from existing knowledge or, preferably, from a survey of streams draining subcatchments of a single landscape class. The HRU response is driven by precipitation, using a two-box soil model. This allows accumulation of material in solution in an unsaturated upper box, while drainage continues from the lower box. The in-stream component uses a one-dimensional kinematic wave approximation to route material through the stream network. In-stream processes associated with sediment and nutrient transport are included. Point source inputs are also accepted by the in-stream component of the model.
2.2 ILC (Integrated Lake and Catchment model)
The ILC model was initially developed by the Environmental Water Resources Research Group at Imperial College to support both the water industry and the regulators with water management decisions. ILC combines geographical information on catchment hydrology, artificial influences and inputs of diffuse and point source pollutants to simulate flow and solute concentrations at target locations in rivers or lakes. It is well suited to simulating the impact of ‘what if’ scenarios since key
Science Report – Scoping study for integrated catchment modelling in the Frome–Piddle 56
environmental controls (e.g. discharge consents, intermittent discharges, abstractions, river control structures, pumping rules and control curves) are modelled explicitly. Daily diffuse loads are generated as a function of effective rainfall and land use based export coefficients for phosphorus and a simplified version of the INCA model for nitrates. In addition, the core in-stream model simulates ammonia, dissolved oxygen, BOD and chlorophyll-a. Conservative tracers or first order decay parameters can also be simulated. The model is dynamic, producing output time series (daily), and it is semi-distributed and reliant on data that are readily available in UK catchments.
For further information regarding ILC contact: [email protected]
2.3 INCA (Integrated Nitrogen in Catchments) http://www.rdg.ac.uk/INCA/
The INCA model is a process-based representation of plant/soil system and in-stream nitrogen dynamics. The INCA project aims to use the model to assess the nitrogen dynamics in key European ecosystems.
Based on mass balance and reaction kinetics, the INCA model accounts for the multiple sources of N and simulates the principal N mechanisms operating, including mineralisation, immobilisation, nitrification and denitrification. The model is dynamic and N concentrations and fluxes are produced as a daily time series. The model is semi-distributed, and as such, it does not model the catchment land surface in a detailed manner; rather, different land use classes within subcatchments are modelled simultaneously and the information is fed sequentially into a multi-reach river model. The model provides:
• an assessment of the river catchment N sources and sinks; and
• estimates of the likely impacts of N deposition, land use and climate change scenarios on N fluxes, both in the plant/soil system and in-stream.
However, extensive databases that describe the hydrology and N dynamics of the study areas are required to run the model, thereby limiting its use as a generic tool.
Further research has led to the development of INCA-P and INCA-Sed that simulate phosphorus and sediments respectively.
For further information on the suite of INCA models email: [email protected]
2.4 LowFlows 2000 http://www.hydrosolutions.co.uk/lowflows1.html
LowFlows 2000 is a tool designed to estimate river flows at ungauged sites and to aid the development of catchment and regional water resources. It is the standard software system used by the Environment Agency and the Scottish Environment Protection Agency for providing estimates of river flows. Flow is represented by annual and monthly duration statistics, for any river reach in the UK.
2.5 MIKE BASIN
Further details can be found in Appendix D.
Science Report – Scoping study for integrated catchment modelling in the Frome–Piddle 57
2.6 Distributed groundwater models
For example, MODFLOW. The Environment Agency has more than 30 distributed groundwater models covering the major UK aquifers. These focus on groundwater flow processes and their representation of surface water–groundwater interactions is limited.
2.7 Delivery of Phosphorus from Agricultural Sources to Watercourses (PEDAL)/ The Phosphorus Indicators Tool (PIT) http://www.lec.lancs.ac.uk/cswm/pit/po.php
The PEDAL project aims to evaluate the processes and pathways of phosphorus delivery from agricultural land to water by combining fuzzy modelling and field measures in a range of catchments to predict the delivery of sediment and nutrients to stream channels. The project combines field and modelling approaches to obtain data on phosphorus delivery with which to calibrate the delivery coefficients in various models. The PEDAL project is linked with the PIT project.
The development of the PIT model was funded by Defra. The aim of this project was to identify appropriate indicators of the sources of P and pathways of transfer that may lead to the delivery of P from agricultural land towards watercourses. The objective was to integrate these indicators within a single calculation system or model to predict the spatial variation in the risk of P loss. To achieve this, the model needed to:
1. Be able to respond to changes on both agricultural land use and management and to environmental factors.
2. Be structured in such a way that the individual parameters and stages of calculation have physical meaning based on field measurements.
3. Use data that are readily available at the catchment scale (for any catchment in England and Wales).
The model operates at the 1 km2 scale and has three layers: P sources (layer 1), P transfer (layer 2) and P delivery (layer 3). The capability for future modification of parameter/coefficient values as new empirical data becomes available and our understanding improves, through local knowledge, is built in. The PIT model is written in ArcGIS using the VBA programming language. Excel files containing the input data for the model are directly converted into an ArcGIS grid.
2.8 The Proactive initiative – This project by Newcastle University contains several tools described below. Further information can be found at: http://www.ncl.ac.uk/iq/index.html
a. TOPCAT is a simple hydrological model that provides time-series modelling of flow and of nitrates, phosphates and phosphorus. It is a simplification of the rainfall runoff model TOPMODEL and, as such, uses identical soil moisture stores and subsurface flow equations. TOPCAT does not, however, use a topographic distribution function and thus does not allow the representation of topographically controlled variable source areas. TOPCAT also contains an extra baseflow/dry weather flow component and two overland flow components that are caused by intense agricultural management practices. TOPCAT-N and TOPCAT-P are based on simplified versions of the key equations used by EPIC, a physically based model. These describe transfer of nitrates and phosphates respectively.
Science Report – Scoping study for integrated catchment modelling in the Frome–Piddle 58
b. TOPMANAGE is a digital terrain analysis (DTA) tool, which is designed to demonstrate to farmers and land managers the effect of different land uses on hydrology. Used in conjunction with a GIS such as ArcView, TOPMANAGE enables the user to assess what the effect would be of adding to, or removing from, the land topographic features. Starting from a digital terrain map of a particular field or area of farmed land, usually derived from Geographical Positioning System (GPS) measurement, maps can be input to the GIS, topographic features added, and augmented terrain maps analysed using TOPMANAGE. The model can identify sinks associated with a particular topography and estimates of the accumulation of flow at a point which is used as a basis for the prediction of source areas, saturation excess overland flow and subsurface flows. c. The Nutrient Export Risk Matrix (NERM) is a decision support tool to allow farmers and land use planners to assess the risk of nutrient loss from their land and to explore options to reduce nutrient loss while maintaining farmer income. This enables farmers and stakeholders to compare current land use practice within the wider context of alternative land management options.
2.9 PSYCHIC – Phosphorus and Sediment Yield Characterisation in Catchments http://www.psychic-project.org.uk
The development of PSYCHIC has been jointly funded by Defra, the Environment Agency and English Nature to develop a risk assessment and decision support tool to control diffuse loads of phosphorus and particulates from agricultural land.
This research draws together the available knowledge and expertise on the sources, mobilisation and delivery of sediment and P from agricultural land to water to develop a prototype decision support tool. This will enable catchment stakeholders to target various control options within a catchment in a pragmatic and mutually acceptable way. The development of PSYCHIC has been undertaken in two study catchments suffering diffuse pollution, the Hampshire Avon and the Wye, and is designed to be compatible with current policy initiatives in England for bringing about the changes in farming practice that are identified by the tool.
It is a collaborative project with ADAS, the CEH, the National Soils Resources Institute and the Universities of Exeter and Reading.
2.10 QUESTOR (Quality Evaluation and Simulation Tool for River-systems) http://www.ceh.ac.uk/products/software/CEHSoftware-QUESTOR.htm
QUESTOR is a software framework to support the development of in-stream water quality models. It provides the basic differential equations to simulate a set of parameters that include the following: flow; temperature; pH, dissolved oxygen; biological oxygen demand; nitrate, ammonia and ammonium. Aeration, settling and decay as well as nitrification and denitrification processes are simulated within well mixed reaches. There is no limit to the number of reaches that can be used to represent the river network. Diffuse inflows are not represented explicitly, instead they are treated as inflows to the top of a specified reach.
For further information email Dr David Boorman in the Water Quality Division at CEH: [email protected].
2.11 RAPHSA (Rapid Assessment of Physical Habitat Sensitivity to Abstraction)
Science Report – Scoping study for integrated catchment modelling in the Frome–Piddle 59
RAPHSA was set up as a collaborative project between the CEH and the Environment Agency. It investigated the technical feasibility of developing a (suite of) catchment-wide tool(s) for rapidly determining the sensitivity of physical habitats to abstraction pressures. This makes use of the direct relationship between physical habitat and flow as a potential tool for assessing the ecological impact of changing the flow regime of a river. At the core of this study is the RAPHSA database that contains data from 66 detailed physical habitat studies across the UK.
The output from RAPHSA has been two new tools: the Direct Rapid Assessment of Physical Habitat Toolkit (DRAPHT) and the Catchment Habitat Assessment Tool (CHAT). The DRAPHT is a risk-based approach to rapid physical habitat assessment and contains three tools that differ in their input data requirements:
• DRAPHTCC – a low confidence tool that requires physical catchment characteristics, such as drainage area and average annual rainfall. Values can be derived from computer-based tools such as LowFlows 2000 without the need for a field visit.
• DRAPHTTM – a low–medium confidence tool that requires measurements to be taken of the river channel such as mean width and depth with mapping of the river length of interest. The exceedance percentile of the river flow at the time of measurement must be known.
• DRAPHTCM – a medium confidence tool that requires measurements to be taken of the river channel (as with DRAPHTTM) plus velocity measurements with a current meter. Again the exceedance percentile of the river flow at the time of measurement must be known.
CHAT is a high confidence tool developed for habitat assessment using hydraulic output data from a separate one-dimensional model output. Software has been written to allow the import of data from the ISIS one-dimensional hydraulic model often used in flood studies.
The tools produce estimated relationships between river flow and river width, depth, velocity or physical habitat. The slope of any relationship produced by RAPHSA indicates the sensitivity to abstraction at that flow.
For further information contact Mike Acreman at CEH.
2.12 SCIMAP
For discussion, please refer to Section 5 of the main text.
2.13 SIMCAT
SIMCAT is a one-dimensional, steady state model that can represent river quality impacts resulting from inputs from point source and diffuse effluent discharges. It uses the Monte Carlo simulation approach to mix discharges and diffuse inputs with river waters and then routes flows in the river down through the catchment, applying water quality transformation processes en route. Hence, SIMCAT is able to predict flow and quality distributions at any selected point in the catchment and produce results as statistics for comparison with specific river quality standards.
Further information can be found at: http://www.wrcplc.co.uk/default.aspx?item=383
Science Report – Scoping study for integrated catchment modelling in the Frome–Piddle 60
Appendix D MIKE BASIN trial modelling
Science Report – Scoping study for integrated catchment modelling in the Frome–Piddle 61
Introduction This appendix gives a brief summary on the work undertaken to trial the use of MIKE BASIN as an integrated water management model for the Frome and Piddle catchment. This text adds some commentary to the PowerPoint Slides presented during Workshop 2 on 30 March 2006.
MIKE BASIN licence and model handover
MIKE BASIN is not a piece of software for which Entec hold a current licence. For the purposes of this project, a time-limited trial licence was granted by the proprietor, DHI Water and Environment (DHI). As the licence has lapsed in the period between the trial and the report writing, it has not been possible to present results in ‘report format’ nor has it been possible to check the model prior to handover to the Environment Agency. Instead, this report will refer to a number of ‘screen dumps’ that were taken during the model trial.
Scope of work
It is important to note that only a relatively limited amount of work was undertaken in trialling the software. The work comprised three main components:
• A two-day MIKE BASIN training course run by Børge Storm and Jesper Overgaard of DHI. This was a generic course run under the title ‘MIKE BASIN – A Versatile Decision Support Tool for Integrated Water Resources Management and Planning’.
• Further reading of the training literature and User Manual for MIKE BASIN.
• A trial model for the surface and groundwater catchment of the River Frome to East Stoke gauging station.
Background to MIKE BASIN
In essence MIKE BASIN is a lumped parameter catchment simulation model representing the hydrology of a basin in space and time. A full description of the software and its capability is given by http://www.dhigroup.com/Software/WaterResources/MIKEBASIN.aspx
For the purposes of this project, MIKE BASIN was trialled as it reported to contain the following components and features:
• GIS compatibility;
• easy catchment delineation;
• rainfall–runoff modelling;
• water allocation modelling (i.e. abstractions and discharges);
• lumped representation of groundwater; and
• water quality modelling (both in groundwater and surface water).
Science Report – Scoping study for integrated catchment modelling in the Frome–Piddle 62
It was therefore hoped that MIKE BASIN could be used to create ‘quick and dirty’ hydrological models for any catchment (i.e. any combination of surface water or groundwater dominance) and then these ‘base models’ could be used to investigate water quality processes related to a number of activities both as point sources (e.g. sewage treatment works) and diffuse sources (e.g. agricultural inputs).
Comment on generic ease of use
The software is run through an ArcGIS interface and can effectively be added to an existing ArcGIS project. This is particularly useful in integrated catchment modelling as it allows the user to quickly set up catchments, remain geo-referenced to other datasets and be able to scavenge data from existing layers (e.g in delineating catchments and when calculating pollutant load).
The model and processes are also easy to parameterise and understand. The software can accept inputs in a number of time-series formats. The software also includes the Temporal Analyst extension, which allows the user to view time-series model input/output without the need to export the results into another application (e.g. Excel).
On the downside, Entec experienced a number of problems in getting the software installed and operating correctly. While such installation problems could be easily ironed out, there were also issues with the software ‘crashing’. For example, it was not possible to run MIKE BASIN with both the Water Quality and Groundwater extensions active simultaneously. The error messages that the software reports are cryptic and difficult to interpret. It should be acknowledged that DHI’s Software Support were extremely diligent in reacting to problems and did eventually resolve most issues (though after trial completion).
Overall, MIKE BASIN is considered to be a good piece of software for the purposes for which it was designed.
Trialling on the River Frome
Recharge and runoff
The majority of the Frome Catchment is on a Chalk outcrop and so the inputs are dominated by recharge. In the Tertiary deposits to the southwest of the catchment, runoff and interflow are also important processes. Runoff is also important in the areas of thin unsaturated zone and alluvium outcrop along the river corridors. Figures 1 to 3 show these components as calculated by the South Wessex Recharge and Runoff Model (constructed by Entec for the Environment Agency and Wessex Water). For the purposes of time efficiency, outputs from the South Wessex Model were used in preference to starting from scratch. MIKE BASIN includes a recharge and runoff model called ‘NAM’, though this was not examined during this trial.
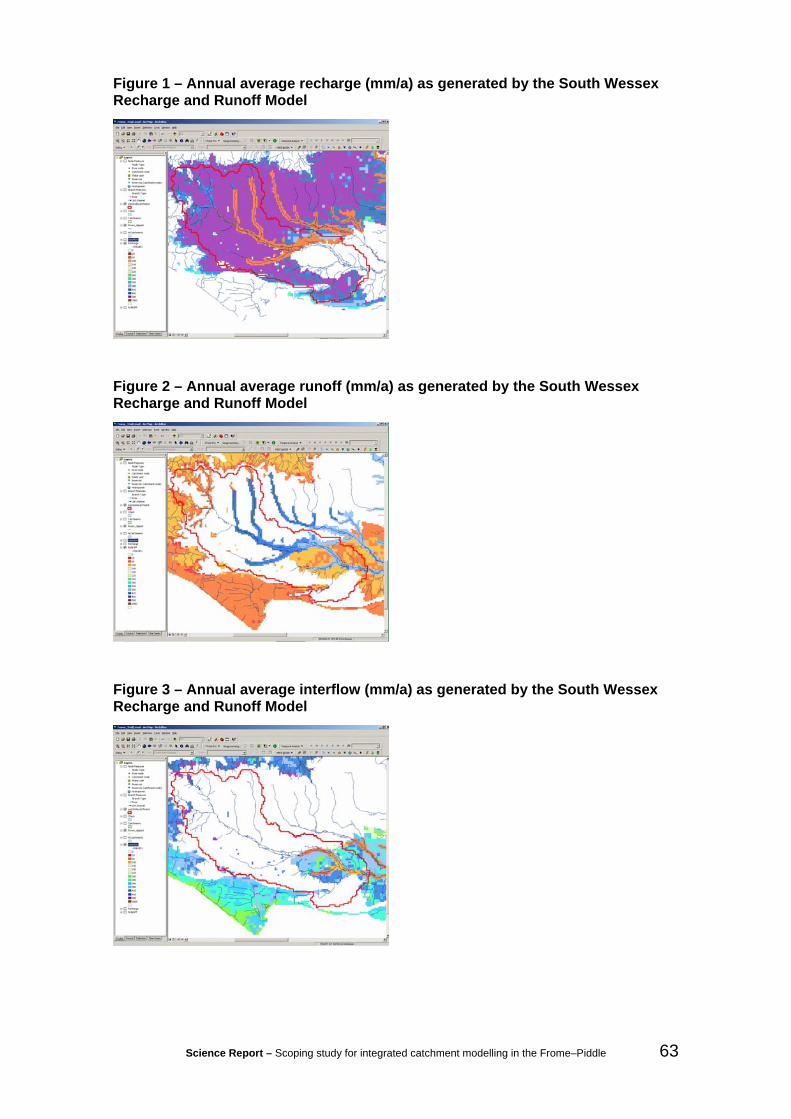
Science Report – Scoping study for integrated catchment modelling in the Frome–Piddle 63
Figure 1 – Annual average recharge (mm/a) as generated by the South Wessex Recharge and Runoff Model
Figure 2 – Annual average runoff (mm/a) as generated by the South Wessex Recharge and Runoff Model
Figure 3 – Annual average interflow (mm/a) as generated by the South Wessex Recharge and Runoff Model

Science Report – Scoping study for integrated catchment modelling in the Frome–Piddle 64
General set-up in MIKE BASIN
The following screen dumps show the ease with which a lumped parameter model can be created in MIKE BASIN. Figure 4 shows the catchment to East Stoke gauging station. This is created by digitising the main river and by ‘scavenging’ the surface water catchment from a previous study’s shapefiles. MIKE BASIN is also able to generate the river networks and catchments directly from digital terrain models (DTMs).
Figure 4 – Basic set-up of the Frome MIKE BASIN model
Groundwater component
MIKE BASIN handles groundwater through the use of a simple linear reservoir model. This model can have one (shallow aquifer) or two (shallow and deep aquifers) layers. The groundwater interacts with the surface water via the following fluxes:
• stream seepage to aquifer (river to aquifer);
• groundwater recharge;
• pumping; and
• groundwater discharge (aquifer to river).
Stream seepage is calculated as either a user-defined fraction of flow or as a direct flow loss volume. Groundwater recharge is specified for each catchment as discussed above.
Interaction between the two layers and the surface water environment are controlled by the relative outlet depths of the reservoirs and the time decay constants on release. Figure 5 shows the parameterisation of the groundwater component of the Frome catchment. The numbers shown indicate the ‘final calibration’ values, though it should be noted that these are not ‘measured’ numbers and have been arrived at through a couple of hours of ‘educated trial and error modelling’.
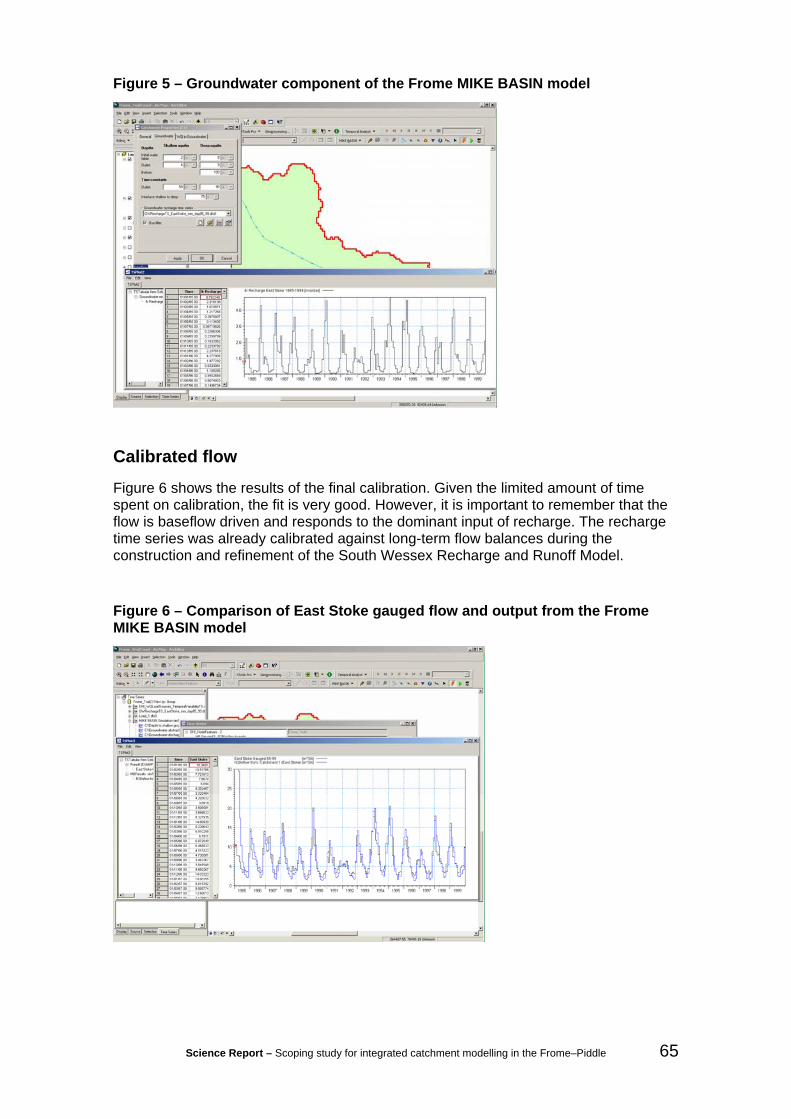
Science Report – Scoping study for integrated catchment modelling in the Frome–Piddle 65
Figure 5 – Groundwater component of the Frome MIKE BASIN model
Calibrated flow
Figure 6 shows the results of the final calibration. Given the limited amount of time spent on calibration, the fit is very good. However, it is important to remember that the flow is baseflow driven and responds to the dominant input of recharge. The recharge time series was already calibrated against long-term flow balances during the construction and refinement of the South Wessex Recharge and Runoff Model.
Figure 6 – Comparison of East Stoke gauged flow and output from the Frome MIKE BASIN model
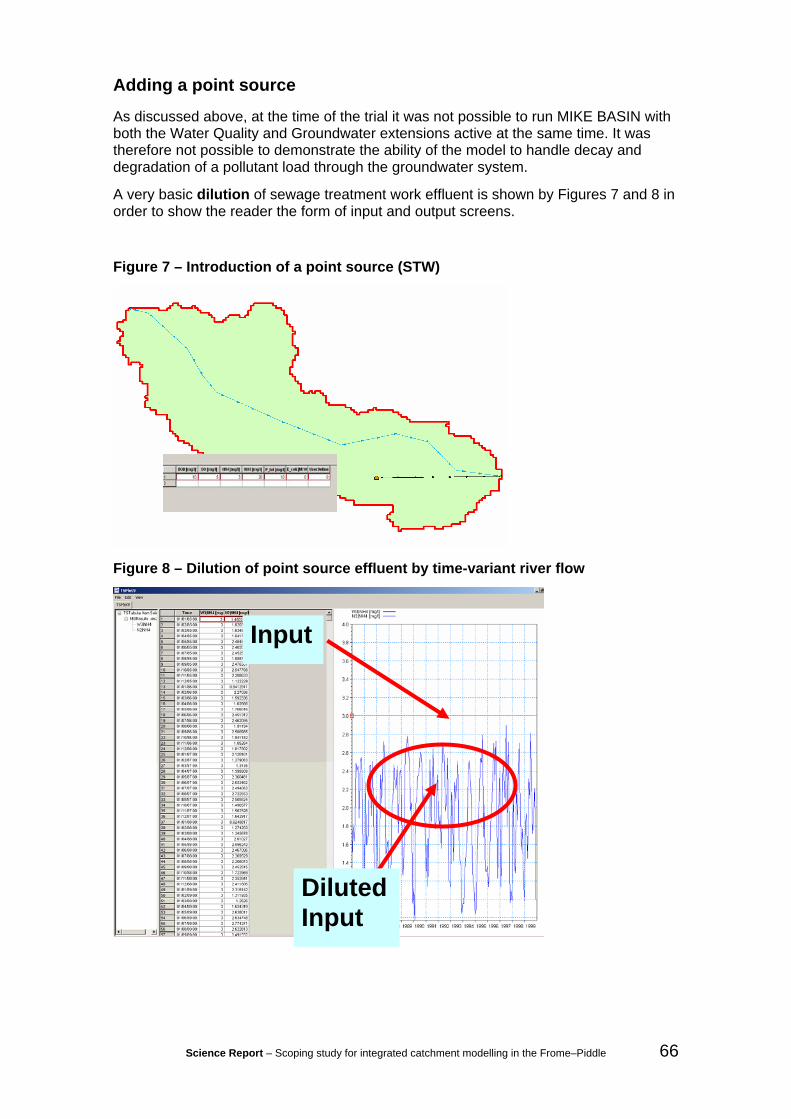
Science Report – Scoping study for integrated catchment modelling in the Frome–Piddle 66
Adding a point source
As discussed above, at the time of the trial it was not possible to run MIKE BASIN with both the Water Quality and Groundwater extensions active at the same time. It was therefore not possible to demonstrate the ability of the model to handle decay and degradation of a pollutant load through the groundwater system.
A very basic dilution of sewage treatment work effluent is shown by Figures 7 and 8 in order to show the reader the form of input and output screens.
Figure 7 – Introduction of a point source (STW)
Figure 8 – Dilution of point source effluent by time-variant river flow
Input
Diluted Input
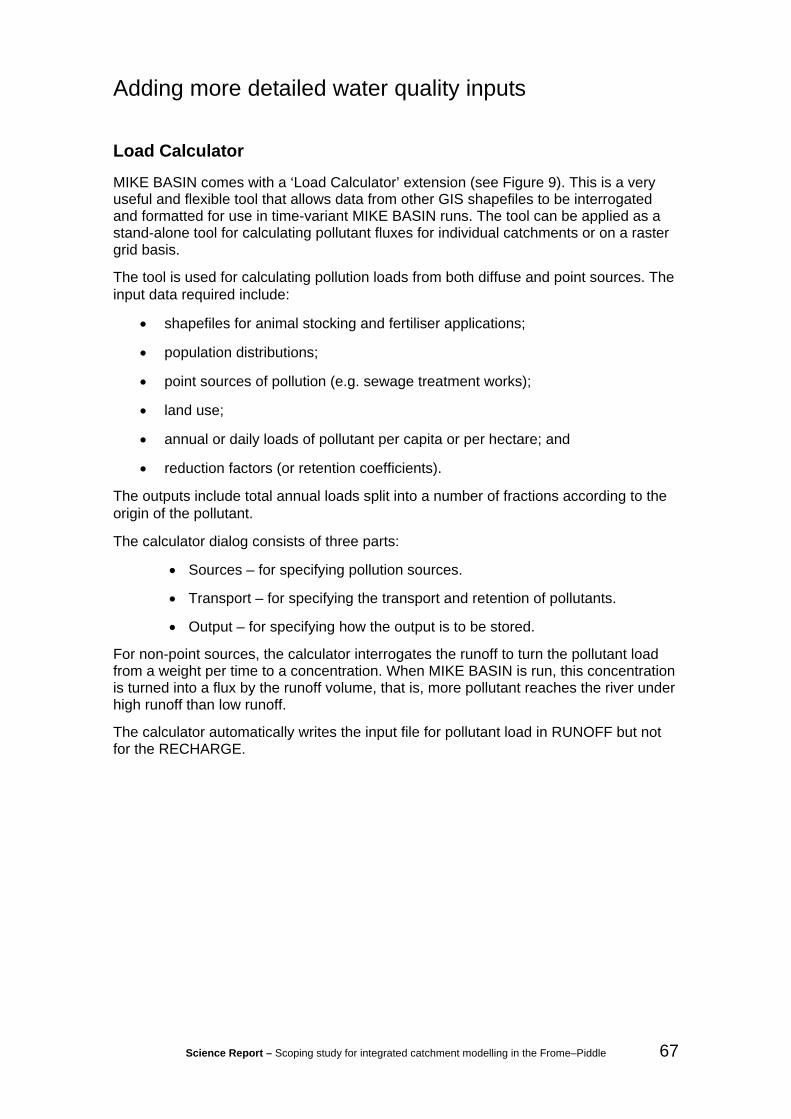
Science Report – Scoping study for integrated catchment modelling in the Frome–Piddle 67
Adding more detailed water quality inputs
Load Calculator
MIKE BASIN comes with a ‘Load Calculator’ extension (see Figure 9). This is a very useful and flexible tool that allows data from other GIS shapefiles to be interrogated and formatted for use in time-variant MIKE BASIN runs. The tool can be applied as a stand-alone tool for calculating pollutant fluxes for individual catchments or on a raster grid basis.
The tool is used for calculating pollution loads from both diffuse and point sources. The input data required include:
• shapefiles for animal stocking and fertiliser applications;
• population distributions;
• point sources of pollution (e.g. sewage treatment works);
• land use;
• annual or daily loads of pollutant per capita or per hectare; and
• reduction factors (or retention coefficients).
The outputs include total annual loads split into a number of fractions according to the origin of the pollutant.
The calculator dialog consists of three parts:
• Sources – for specifying pollution sources.
• Transport – for specifying the transport and retention of pollutants.
• Output – for specifying how the output is to be stored.
For non-point sources, the calculator interrogates the runoff to turn the pollutant load from a weight per time to a concentration. When MIKE BASIN is run, this concentration is turned into a flux by the runoff volume, that is, more pollutant reaches the river under high runoff than low runoff.
The calculator automatically writes the input file for pollutant load in RUNOFF but not for the RECHARGE.
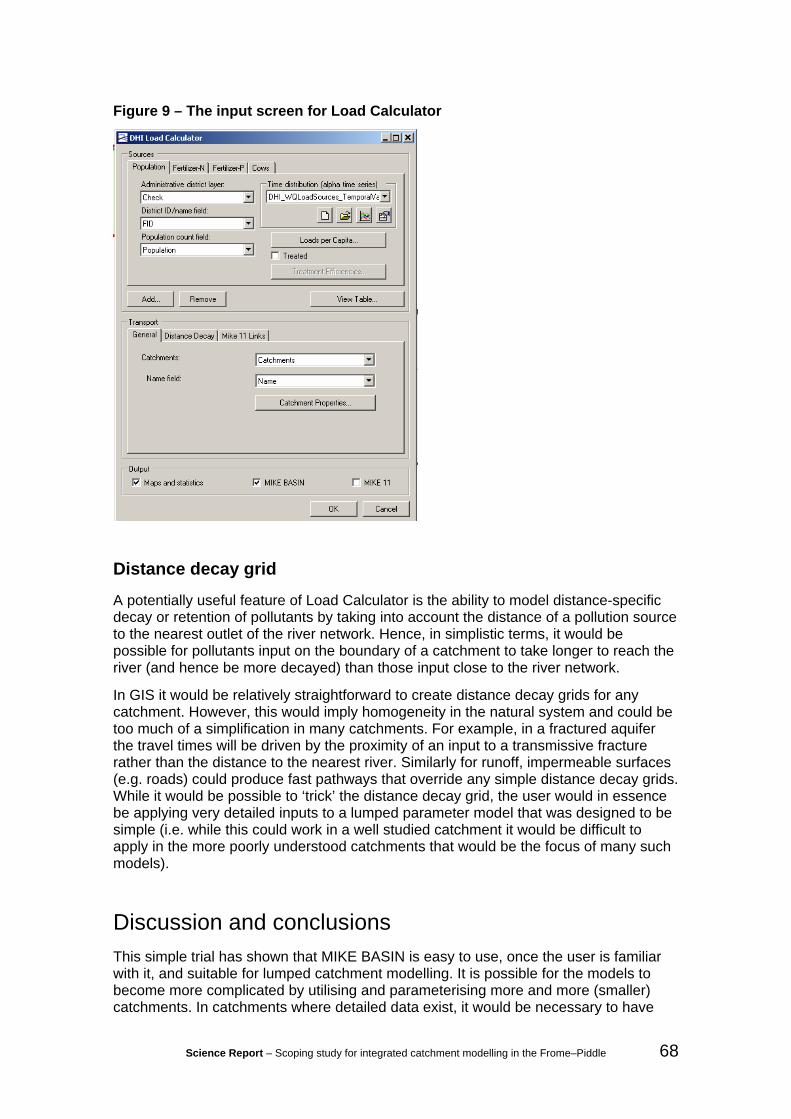
Science Report – Scoping study for integrated catchment modelling in the Frome–Piddle 68
Figure 9 – The input screen for Load Calculator
Distance decay grid
A potentially useful feature of Load Calculator is the ability to model distance-specific decay or retention of pollutants by taking into account the distance of a pollution source to the nearest outlet of the river network. Hence, in simplistic terms, it would be possible for pollutants input on the boundary of a catchment to take longer to reach the river (and hence be more decayed) than those input close to the river network.
In GIS it would be relatively straightforward to create distance decay grids for any catchment. However, this would imply homogeneity in the natural system and could be too much of a simplification in many catchments. For example, in a fractured aquifer the travel times will be driven by the proximity of an input to a transmissive fracture rather than the distance to the nearest river. Similarly for runoff, impermeable surfaces (e.g. roads) could produce fast pathways that override any simple distance decay grids. While it would be possible to ‘trick’ the distance decay grid, the user would in essence be applying very detailed inputs to a lumped parameter model that was designed to be simple (i.e. while this could work in a well studied catchment it would be difficult to apply in the more poorly understood catchments that would be the focus of many such models).
Discussion and conclusions This simple trial has shown that MIKE BASIN is easy to use, once the user is familiar with it, and suitable for lumped catchment modelling. It is possible for the models to become more complicated by utilising and parameterising more and more (smaller) catchments. In catchments where detailed data exist, it would be necessary to have
Science Report – Scoping study for integrated catchment modelling in the Frome–Piddle 69
many catchments to represent the natural complexity as any lumped simplification would be proved ‘inaccurate’ by the detailed data. It would not be possible to gain any confidence from users given this inaccuracy. So in essence the user would need to move away from traditional lumped modelling towards a more distributed approach.
Therefore, the question in catchments with detailed information is not whether MIKE BASIN can handle the complexity, but more whether a complex integrated model is likely to be fruitful or whether a simpler approach using a range of modelling tools is likely to remain more appropriate.
In less studied catchments, a quick and dirty model could provide a useful starting point for further investigation. It is unlikely, however, that such a model could stand up to rigorous scrutiny if major decisions were to be made, for example on land use or fertiliser application. MIKE BASIN (and most lumped models) generates output to the downstream end of a catchment. In reality we may need to be concerned, for example, with land use and pollution inputs along the entire river length (and aquifer area) and not just the downstream outlet point.
We are The Environment Agency. It's our job to look after your environment and make it a better place – for you, and for future generations.
Your environment is the air you breathe, the water you drink and the ground you walk on. Working with business, Government and society as a whole, we are making your environment cleaner and healthier.
The Environment Agency. Out there, making your environment a better place.
Published by: Environment Agency Rio House Waterside Drive, Aztec West Almondsbury, Bristol BS32 4UD Tel: 0870 8506506 Email: [email protected] www.environment-agency.gov.uk © Environment Agency All rights reserved. This document may be reproduced with prior permission of the Environment Agency.