scientific elite revisited: patterns of productivity
TRANSCRIPT

* e-mail: [email protected]
Scientific elite revisited:
Patterns of productivity, collaboration, authorship and impact
Jichao Li1,2,3,4, Yian Yin2,3,5, Santo Fortunato6,7 and Dashun Wang2,3,4,5*
1 College of Systems Engineering, National University of Defense Technology, Changsha, China 2 Center for Science of Science and Innovation, Northwestern University, Evanston, IL, USA. 3 Northwestern Institute on Complex Systems, Northwestern University, Evanston, IL, USA. 4 Kellogg School of Management, Northwestern University, Evanston, IL, USA 5 McCormick School of Engineering, Northwestern University, Evanston, IL, USA 6 School of Informatics, Computing, and Engineering, Indiana University, Bloomington, IN, USA 7 Indiana University Network Science Institute (IUNI), Indiana University, Bloomington, IN, USA
2
ABSTRACT Throughout history, a relatively small number of individuals have made a profound and lasting
impact on science and society. Despite long-standing, multi-disciplinary interests in understanding
careers of elite scientists, there have been limited attempts for a quantitative, career-level analysis.
Here, we leverage a comprehensive dataset we assembled, allowing us to trace the entire career
histories of nearly all Nobel laureates in physics, chemistry, and physiology or medicine over the
past century. We find that, although Nobel laureates were energetic producers from the outset,
producing works that garner unusually high impact, their careers before winning the prize follow
relatively similar patterns as ordinary scientists, being characterized by hot streaks and increasing
reliance on collaborations. We also uncovered notable variations along their careers, often
associated with the Nobel prize, including shifting coauthorship structure in the prize-winning
work, and a significant but temporary dip in the impact of work they produce after winning the
Nobel. Together, these results document quantitative patterns governing the careers of scientific
elites, offering an empirical basis for a deeper understanding of the hallmarks of exceptional
careers in science.

3
Introduction According to Harriet Zuckerman1, scientific elites “are worthy of our attention not merely because
they have prestige and influence in science, but because their collective contributions have made
a difference in the advance of scientific knowledge”. Indeed, across the broad spectrum of sciences,
scientific elites are often pathbreakers and pacesetters in the science of their time2-7. Understanding
patterns governing the careers of scientific elites helps us uncover insightful markers for
exceptional scientific careers, useful for scientists and decision makers who hope to identify and
develop individual careers and institutions8.
The Nobel Prize, widely regarded as the most prestigious award in science, offers a unique
opportunity to systematically identify and trace many of the world’s greatest scientists1,3,8-15. These
scientific elites have attracted interest from a wide range of disciplines1,3,8,11,12,15-27, spanning
sociology, economics, psychology, and physics. On the one hand, quantitative studies analyzing
publication and citation records have mainly focused on the prize-winning work alone, helping
uncover a set of highly reproducible patterns ranging from understanding the link between age and
creativity3,16,17,28-30, to allocating credits and recognition4,15,19,21. On the other hand, Zuckerman’s
canonical work1 probes into the entire career histories of Nobel laureates through qualitative
methods13,14,16,31-35. The rich patterns articulated by Zuckerman vividly highlight the need to go
beyond their prize-winning works, and put them in the context of the entire careers of laureates.
Together, the two strands of research call for a quantitative, career-level analysis relying on large-
scale datasets to study patterns of productivity, collaboration, authorship, and impact governing
the careers of scientific elites.
Despite recent surge of interest in the science of science3,19,28,29,36-43 and efforts in constructing
large-scale datasets of scholarly activities3,44-46, large-scale studies of the career histories of Nobel
laureates remained limited, largely owing to the difficulty in collecting systematic data for their
scientific contributions. Here, by combining information collected from the Nobel Prize official
websites, laureates’ university websites, Wikipedia entries, publication and citation records from
the Microsoft Academic Graph (MAG)47, and extensive manual curations, we constructed a unique
dataset capturing career histories of nearly all Nobel laureates in physics, chemistry, and
physiology or medicine from 1900 to 2016 (545 out of 590, 92.4%)48. We cross-validated this

4
dataset with four different approaches to ensure the reliability of our results. We deposited the
derived dataset in a public data repository49, and describe our data collection and validation
procedures in a data descriptor with great detail48.
We further constructed a comparison dataset of scientific careers using data from the Web of
Science (WOS) and Google Scholar (GS)46, representing the kinds of “ordinary” careers that tend
to be studied in the science of science literature29,50. For each laureate who published the first paper
after 1960, we randomly selected 20 scientists in the same discipline who started their careers in
the same year (Supplementary Information S1). Note that the goal here is not to create a matching
sample of Nobel-caliber scientists, but a comparison group consisting of scientists who are more
similar to typical scientists in the field. One advantage of this comparison approach is that, by
selecting individuals with long careers and well-maintained GS profiles, it covers scientists with
relatively higher visibility and impact than typical scientists, indicating that our comparisons offer
a conservative estimate of the difference between Nobel laureates and their contemporary peers.
Results Early Performance. Widely held is the belief that the great minds do their critical work early in
their careers3,16,17, prompting us to ask if there is any early signal that distinguishes Nobel laureates.
Here we focus on the first five years since their first publication and measure their productivity
and impact at this early stage of their careers. Consistent with Zuckerman’s observation1, we find
that Nobel laureates were energetic producers from the outset, publishing almost twice as many
papers as scientists in our comparison group (Fig. 1a). Yet, compared with this productivity
difference, more impressive is the gap in impact. Indeed, the future laureates had a more than six-
fold increase over the comparison group in terms of the rate of publishing hit papers, defined as
the papers with top 1% of rescaled 10-year citations (Eq. (1)) in the same year and field
(Supplementary Information S3.1) (Fig. 1b). This difference is not simply driven by the early onset
of prize-winning works. Indeed, we repeated our measurements by omitting the careers of laureates
who published their prize-winning work in this period, finding that a substantial gap remained
(Fig. S1).

5
To conceptualize the observed difference in productivity and impact, we separated team- and solo-
authored papers, finding that both types of work boost early performance, but they do so in
different ways: Most of the difference in early productivity is accounted for by team-authored
papers, as solo-authored papers show meager productivity difference between the laureates and
their comparison group (Fig. 1c), documenting a greater propensity toward collaborations for
scientific elites in their early careers1. The only exception is physics laureates who published
slightly more solo-authored papers than their comparison group (1.73 vs 1.07, Student’s t-test, p-
value=0.07). Yet interestingly, solo-authored papers in early careers turned out to
disproportionally more likely to be prize-winning papers than team-authored ones. Indeed,
comparing the fractions of prize-winning papers within solo- and team-authored papers, we find
that the former is about twice as high as the latter on average (Chi-squared test, p-value<10-11, Fig.
1d).
Career before the prize. Figure 1 documents outstanding early performance of future laureates.
This is consistent with the innovation literature, which shows that the most important works tend
to occur early in the lifecycle3,16,51, speaking to the idea that great, young minds disproportionally
break through. Yet on the other hand, growing evidence shows that ordinary scientific careers are
governed by the random impact rule28, predicting that the highest impact work occurs randomly
within the sequence of works. To reconcile these two schools of thought, we focus on the career
of laureates before they were awarded the Nobel and measure the positions of the prize-winning
work and highest impact work within the sequence of works one produced. Here the paper impact
is measured by rescaled 10-year citation (Methods). We find both types of works tend to occur
early within the sequence of papers (Fig. 2a), a result that contradicts the random impact rule
governing typical scientific careers28,46. Yet, our earlier analysis suggests that a selection effect
may offer a potential explanation for this observation52—since the Nobel Prize in science has never
been awarded posthumously, those who produced ground-breaking works early were more likely
to wait long enough to be recognized20,22. Indeed, we removed prize-winning papers and calculate
among the remaining ones the position of the highest impact papers. We find that the timing of
each of the three remaining highest impact works for Nobel laureates all follow clearly uniform
patterns52 (Fig. 2b). This means, apart from the prize-winning work, all other important works in
Nobel careers closely follow the random impact rule: They could be, with equal likelihood, the

6
very first work, the last, or any one in between. This observation is in line with the recent discovery
of hot streaks that occur at random within individual careers46, and therefore raises an important
next question: Are these high-impact works clustered together in time?
To answer this question, we quantify the relative timing between the two most cited papers (𝑁∗
and 𝑁∗∗) within each career by calculating the joint probability 𝑃(𝑁∗, 𝑁∗∗)with a null model in
which the two papers each follow their independent temporal patterns. We uncovered clear
diagonal patterns across all three domains (Figs. 2c-e), showing that high-impact papers are more
likely to cluster together than expected by chance. The diagonal pattern disappeared when we
shuffle the order of the works, while preserving the random impact rule (Figs. 2f-h). We also
measured the distribution of the longest streak within a career 𝐿, finding that 𝑃(𝐿) follows a
broader distribution compared with that in shuffled careers across all three disciplines (Figs. 2i-k)
(Supplementary Information S4.3-4.5). We further find that their hot streaks occur randomly
within the sequence of works (Fig. 2l), and are not associated with any detectable change in the
overall productivity (Fig. 2m, Kolmogorov-Smirnov test, p-value=0.18). Together, these results
demonstrate a remarkable resemblance between the career histories of Nobel laureates and
ordinary scientists46.
What seems to distinguish the Nobel laureates from ordinary scientists, however, is that they are
disproportionately more likely to have more than one hot streak. Indeed, while hot streak is usually
unique for typical scientists46, Nobel laureates are characterized by 1.93 hot streaks on average
(Fig. 2n). Furthermore, their hot streaks also tend to sustain for longer. We measured the duration
distribution of hot streaks for Nobel laureates, finding that it peaks around 5.2 years (Fig. 2o),
compared with 3.7 years for typical scientists46. The longer duration of laureates’ hot streaks is
also captured by its proportion over career length (Fig. 2p). We also find that prize-winning works
are disproportionately more likely to be produced during hot streaks (Fig. 2q). Overall the vast
majority of all Nobel winning works (88%) occurred within hot streaks.
Collaboration patterns. One of the most fundamental shifts in science over the past century is
the flourishing of large teams across all areas of science29,39,53,54. Compared with the overall rate
of this shift, Nobel laureates’ papers are produced by an even higher proportion of large teams

7
(Fig. 3a). One possible factor that may explain this team-size difference is impact, as larger teams
tend to produce papers with higher impacts37. To control for this factor, we created a matching
sample for each paper published by the laureates by selecting 20 papers from the same field and
year but with the most similar number of citations. We find that, after controlling for impact, the
Nobel laureates’ papers are still more likely to be produced by larger teams in all times across the
last century (Fig. 3b).
Figure 3ab thus underscore another similarity between Nobel and ordinary careers, highlighting
the increasing reliance of team work across all types of scientific careers. Yet the ubiquitous
increase in team size can be in tension with the fact that the Nobel Prize can only be awarded to at
most three recipients for each subject every year1, prompting us to compare the team size of all
prize-winning papers with those published immediately before and after them by the same
laureates52 (Supplementary Information S5.1). We find a greater propensity for the prize-winning
papers to be written by less than three authors52 (61.43% vs 53.28%, Chi-squared test, p-value<10-
4, Fig. 3c). We further examine the authorship structure of the prize-winning papers, finding that
they are substantially more likely to have the laureates as the first author than other joint papers
published by them (45.04% vs 30.64%, Chi-squared test, p-value<10-7) (Fig. 3d). We also
calculated the probability of being the last author, finding no statistical difference (Chi-squared
test, p-value=0.41).
To test if these phenomena are unique to the prize-winning work, we removed the prize-winning
papers and repeated the same analysis for the most cited paper among the remaining papers. We
find that there is no statistical difference in their likelihood of being written by small teams52 (60.18%
vs 56.17%, Chi-squared test, p-value=0.1193, Fig. 3e). While the difference in the likelihood of
being the first author still exists for chemistry laureates, there is no statistical difference for
laureates in physics or medicine (Fig. 3f). Together, these results show that prize-winning papers
are more likely to be authored by fewer than three authors, with an intriguing tendency for laureates
to claim the first authorship in the prize-winning works. While these observations are consistent
with the finding that works produced by small teams tend to disrupt science and technology37, they
are also consistent with Zuckerman’s argument that “the future laureates were especially

8
concerned to have the record clear for their most significant work, and particularly in their prize-
winning research papers”1.
After the prize. How does winning the Nobel impact one’s subsequent career? The Matthew
effect4,55 tells us that winning begets more winnings. Hence one may expect that works produced
after the Nobel garner more impact than those produced before, given their substantially elevated
reputation and visibility15. Here we find that, to the contrary, when comparing the average impact
of papers (defined in Eq. (4)) published by the laureates in each of the four years before and after
winning the Nobel, the average impact per paper shows a significant drop in the two years
following the Nobel. The effect is most significant in the year immediately after, where impact
dropped by 11.1% on average compared with the year before. Furthermore, the effect is not
permanent, with impact quickly bouncing back by year four to a similar level as the year of the
Nobel (Fig. 4a). The “Nobel dip” is most pronounced for physics laureates, as the impacts of their
papers were reduced by 18.1%, compared with 4.8% for chemistry and 13.4% for medicine
(Supplementary Information S6.2, Fig. S17). Interestingly, in contrast to the common perception
of decreased productivity following the Nobel1,21, possibly due to “the disruptive consequences of
abrupt upward social mobility”1, we find that the average number of papers by the laureates shows
no significant change (Fig. 4b), indicating that the uncovered Nobel dip mainly pertains to impact
rather than productivity. Note that winning the Nobel may introduce citation boosts to prior papers
by the laureate15,26. To understand if the observed dip in impact may be explained by this factor,
we alter the observation window to exclude post-Prize citations to pre-Prize works, finding that
the “dip and bounce back” pattern remains robust (Fig. 4c, Supplementary Information S6.4, Fig.
S20). We also find that the number of solo-authored papers decreased precipitately after the Nobel
(Student’s t-test, p-value=0.004, Fig. 4d), whereas the fraction of team-authored papers increased
(Student’s t-test, p-value=0.008, Fig. 4e), suggesting that collaboration and teamwork carry an
increasing importance for the laureates after winning the Nobel.
The Nobel dip signals that scientific community’s attention is not driven by status but the quality
of work. To unearth potential mechanisms underlying the “dip and bounce back” dynamics, we
trace topic changes before and after Nobel as reflected in their publications. We use an established
method43 that detects research topics based on communities in the co-citing network of papers
9
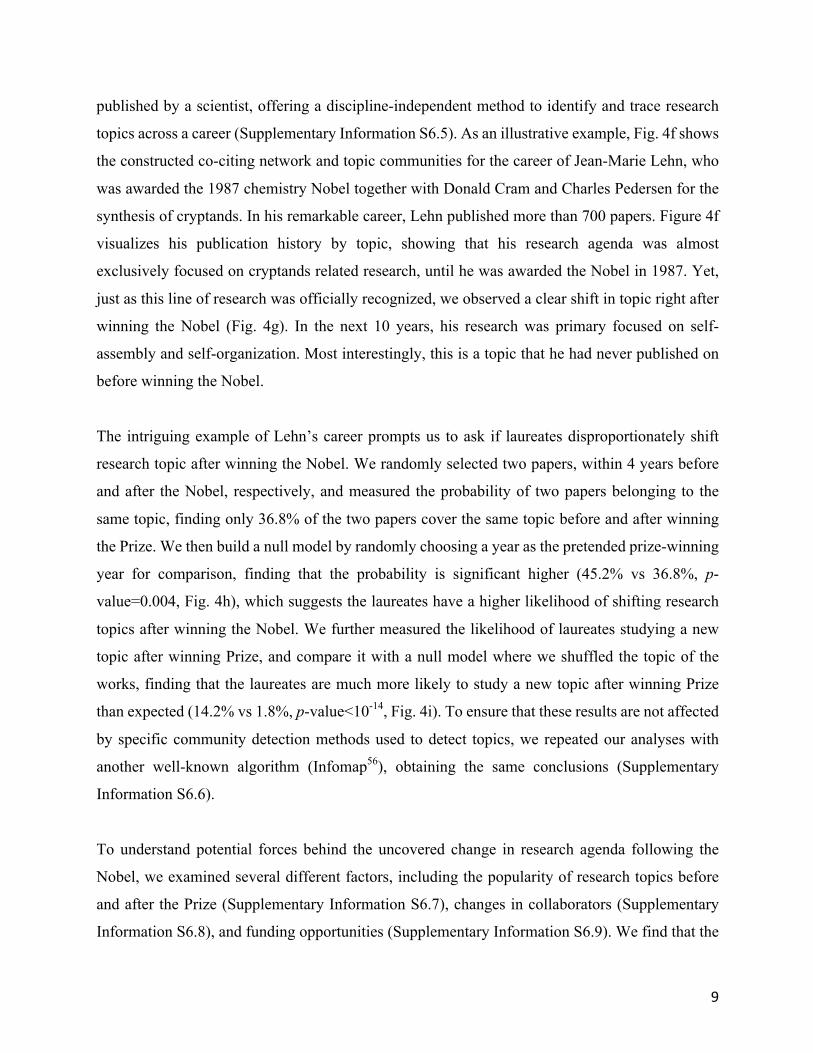
published by a scientist, offering a discipline-independent method to identify and trace research
topics across a career (Supplementary Information S6.5). As an illustrative example, Fig. 4f shows
the constructed co-citing network and topic communities for the career of Jean-Marie Lehn, who
was awarded the 1987 chemistry Nobel together with Donald Cram and Charles Pedersen for the
synthesis of cryptands. In his remarkable career, Lehn published more than 700 papers. Figure 4f
visualizes his publication history by topic, showing that his research agenda was almost
exclusively focused on cryptands related research, until he was awarded the Nobel in 1987. Yet,
just as this line of research was officially recognized, we observed a clear shift in topic right after
winning the Nobel (Fig. 4g). In the next 10 years, his research was primary focused on self-
assembly and self-organization. Most interestingly, this is a topic that he had never published on
before winning the Nobel.
The intriguing example of Lehn’s career prompts us to ask if laureates disproportionately shift
research topic after winning the Nobel. We randomly selected two papers, within 4 years before
and after the Nobel, respectively, and measured the probability of two papers belonging to the
same topic, finding only 36.8% of the two papers cover the same topic before and after winning
the Prize. We then build a null model by randomly choosing a year as the pretended prize-winning
year for comparison, finding that the probability is significant higher (45.2% vs 36.8%, p-
value=0.004, Fig. 4h), which suggests the laureates have a higher likelihood of shifting research
topics after winning the Nobel. We further measured the likelihood of laureates studying a new
topic after winning Prize, and compare it with a null model where we shuffled the topic of the
works, finding that the laureates are much more likely to study a new topic after winning Prize
than expected (14.2% vs 1.8%, p-value<10-14, Fig. 4i). To ensure that these results are not affected
by specific community detection methods used to detect topics, we repeated our analyses with
another well-known algorithm (Infomap56), obtaining the same conclusions (Supplementary
Information S6.6).
To understand potential forces behind the uncovered change in research agenda following the
Nobel, we examined several different factors, including the popularity of research topics before
and after the Prize (Supplementary Information S6.7), changes in collaborators (Supplementary
Information S6.8), and funding opportunities (Supplementary Information S6.9). We find that the

10
topic studied after the Nobel tends to be less popular at the time. The number of new collaborators
does not increase after the Nobel, but these collaborators tend to more established in terms of
productivity and impact. And somewhat surprisingly, the overall funding to each laureate remains
mostly constant around the time of the award. Although none of these factors can directly explain
the observed topic change and the associated citation dip (Figs. 4j-m, Supplementary Information
S6.7-S6.9, Figs. S24-S26), they appear consistent with an endogenous shift in the laureate’s
interest to explore new directions. Note that, although the uncovered dip-bounce-back dynamics
and topic shifting behavior both occur around the same time (when awarded the Nobel), it does
not imply that the two are causally related. On the other hand, while one may be better at
anticipating which work will be recognized by the Nobel eventually57, it remains difficult to
precisely predict the year of winning, indicating that the award year can be viewed as a largely
exogenous variation in a career58, which then coincides with topic shifting behavior that is largely
endogenous to the individual. Regardless, these results highlight the unwavering scientific efforts
by the laureates, actively pursuing new lines of enquiry while undeterred by the extra burdens
imposed by growing duties and responsibilities1.
Discussion In summary, building on Zuckerman’s canonical work on scientific elites1, here we present a
systematic empirical investigation of the careers of Nobel laureates by studying patterns of
productivity, collaboration, authorship, and impact. This analysis is now possible thanks to a novel
dataset we curated—both algorithmically and manually—which links several disparate
biographical and bibliographical data sources, offering a unique opportunity to quantitatively study
the scientific contributions and recognitions of scientific elites. Despite the clear difference
between the Nobel laureates and “ordinary” scientists, we find universal career patterns that are
applicable to both ordinary and elite scientists. Indeed, we find the careers of the laureates before
winning the prize are governed by remarkably similar patterns as ordinary scientists, characterized
by hot streaks and increasing reliance on team work. Hence these results help advance the
canonical innovation literature by offering new empirical evidence from large-scale datasets. At
the same time, we also uncovered notable but previously unknown variations along their careers
associated with the Nobel prize, including shifting coauthorship structure in the prize-winning
work, and a temporary but significant dip in the impact of work they produce after winning the

11
Nobel. Overall, these results represent new empirical patterns that further enrich our understanding
of careers of the scientific elite.
Together, this paper takes an initial but crucial step probing our quantitative understanding of
career patterns of scientific elite, which not only offer an empirical basis for future studies of
individual careers and creativity in broader domains16,51, but also deepen our quantitative
understanding of patterns governing exceptional careers in science.
Methods Rescaled number of citations. To approximate the scientific impact of each paper, we calculate the number
of citations the paper received after 10 years, 𝐶*+, and use it as a proxy for the paper’s impact. Previous
studies29,37,44 have shown that the average number of citations per paper changes over time. To be able to
compare the impact of papers published at different times and to adjust for temporal effects, the rescaled
number of citations a paper receives after 10 years, C*+,-, is suggested as a good proxy for publication
impact. According to the reference29, given a paper i, C*+,-, is defined as follows:
C*+,- = 10 ∙ 345,6345
, (1)
where C*+,- is the raw number of 10-year citations for paper i, and C*+ is the average C*+ calculated over
all publications published in the same year and field.
Definition of hit paper rate. In Fig. 1b, we compare the “hit” paper rate—defined as the probability of
publishing papers in the top 1% of rescaled 10-year citations in the same year and field—for Nobel laureates
and typical authors. Our collected Nobel laureate dataset is based on information provided by the MAG,
which assigns the field of subject for each paper. It is worth noting that the field of subject is a hierarchal
structure with six levels. The first level contains 19 main fields, such as “physics,” “chemistry,” “medicine,”
and “biology.” The second level contains 295 subfields, such as “astrophysics,” “biophysics,” and
“geophysics.” In this paper, we choose the second level fields in calculating the hit paper rate for Nobel
laureates. The GS typical scientist dataset is based on information from the WOS, and it is almost
impossible to precisely match the career histories of 3540 GS scientists from the WOS to the MAG. Thus,
the hit rate analysis of the GS scientists is based on the WOS database itself. Papers in the WOS are also
assigned to one of 234 specific field categories, such as “astronomy & astrophysics,” “biophysics,” and
“geochemistry & geophysics.” The hit paper rate for typical scientists is calculated using these 234 specific
fields from the WOS.
12
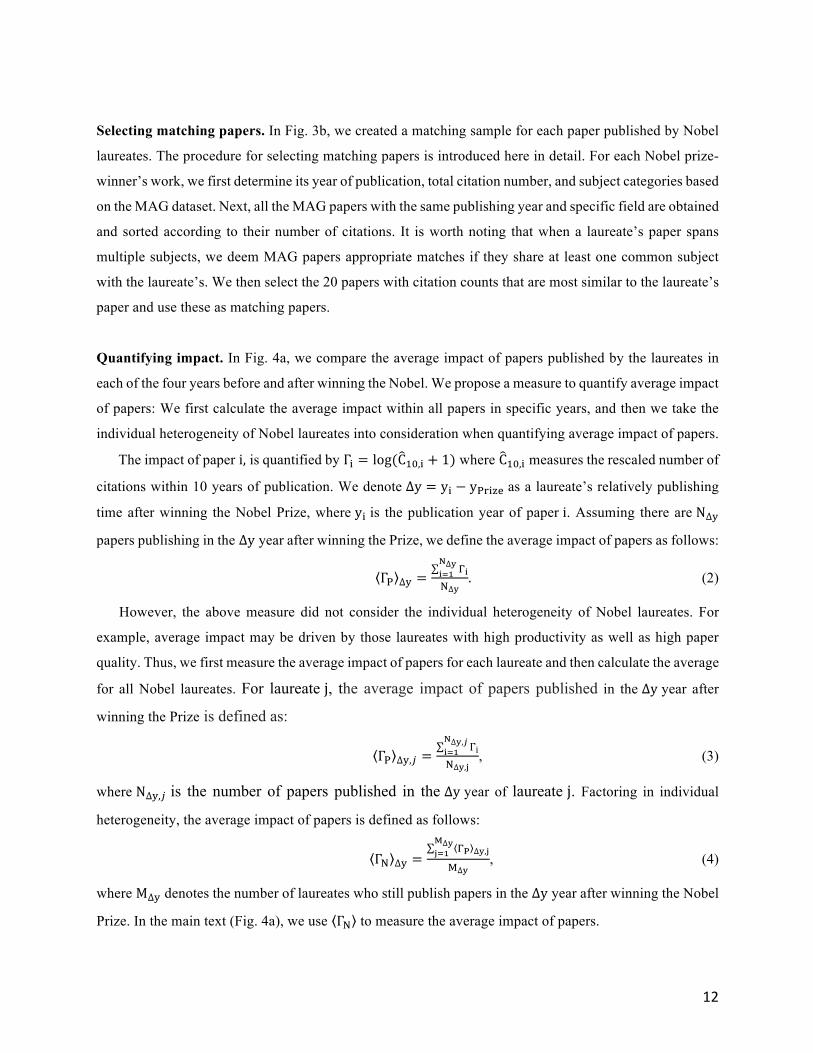
Selecting matching papers. In Fig. 3b, we created a matching sample for each paper published by Nobel
laureates. The procedure for selecting matching papers is introduced here in detail. For each Nobel prize-
winner’s work, we first determine its year of publication, total citation number, and subject categories based
on the MAG dataset. Next, all the MAG papers with the same publishing year and specific field are obtained
and sorted according to their number of citations. It is worth noting that when a laureate’s paper spans
multiple subjects, we deem MAG papers appropriate matches if they share at least one common subject
with the laureate’s. We then select the 20 papers with citation counts that are most similar to the laureate’s
paper and use these as matching papers.
Quantifying impact. In Fig. 4a, we compare the average impact of papers published by the laureates in
each of the four years before and after winning the Nobel. We propose a measure to quantify average impact
of papers: We first calculate the average impact within all papers in specific years, and then we take the
individual heterogeneity of Nobel laureates into consideration when quantifying average impact of papers.
The impact of paper i, is quantified by Γ- = log(C*+,- + 1) where C*+,- measures the rescaled number of
citations within 10 years of publication. We denote ∆y = y- − y?@-AB as a laureate’s relatively publishing
time after winning the Nobel Prize, where y- is the publication year of paper i. Assuming there are N∆D
papers publishing in the ∆y year after winning the Prize, we define the average impact of papers as follows:
Γ? ∆D =E6
F∆G6H4I∆G
. (2)
However, the above measure did not consider the individual heterogeneity of Nobel laureates. For
example, average impact may be driven by those laureates with high productivity as well as high paper
quality. Thus, we first measure the average impact of papers for each laureate and then calculate the average
for all Nobel laureates. For laureate j, the average impact of papers published in the ∆y year after
winning the Prize is defined as:
Γ? ∆D,L =Γi
F∆G,M6H4I∆G,N
, (3)
where N∆D,L is the number of papers published in the ∆y year of laureate j. Factoring in individual
heterogeneity, the average impact of papers is defined as follows:
ΓI ∆D =EO ∆G,N
P∆GNH4
Q∆G, (4)
where M∆D denotes the number of laureates who still publish papers in the ∆y year after winning the Nobel
Prize. In the main text (Fig. 4a), we use ΓI to measure the average impact of papers.

13
Topic changing after winning the Nobel Prize. To quantify the topic of a paper, we adopt a recent method
based on community structure of the co-citing network of a scientist’s papers51. To ensure meaningful
community detection results, we consider all Nobel laureates who have published at least 50 papers. We
also excluded Nobel laureates who published fewer than five papers after winning the Prize. Finally, we
selected 283 Nobel laureates (74 for physics, 96 for Chemistry, 113 for medicine) who satisfied these
requirements.
In Fig. 4g, we measure the probability of two papers belonging to the same topic within 4 years before
and after the reception of the Prize and a random year. To measure the probability of changing topics of
Nobel laureates after winning Prize, we randomly selected two papers, within 4 years before and after the
Nobel, respectively, and measured the probability of two papers belonging to the same topic. We then build
a null model by randomly choosing a year as the pretended prize-winning year for comparison.
To test if Nobel laureates tend to study a new topic after winning Prize, we measure the chance of Nobel
laureates shifting to a new topic after winning the Nobel, #TBUVWX-YZ[\VB@U-TT-T]?@-AB#VWX-YZ
. We also shuffled the
topic of the works and repeated the measurement as a null model for comparison.
Author Contributions D.W. and S.F. conceived the project, D. W. designed the experiments; J.L. and Y.Y.
collected data and performed empirical analyses with help from S.F. and D.W.; all authors discussed and
interpreted results; D.W., J.L. and Y.Y. wrote the manuscript; all authors edited the manuscript.
Acknowledgements The authors thank L. Liu, Y. Wang, Y. Ma, and all members of Northwestern Institute
on Complex Systems (NICO) for invaluable comments. Funding data sourced from Dimensions, an inter-
linked research information system provided by Digital Science (https://www.dimensions.ai).
Data Accessibility The main data that support the findings of this study is freely available. Deposited in
public repositories with detailed descriptions in Harvard Dataverse
(https://doi.org/10.7910/DVN/6NJ5RN).
Funding Statement This work is supported by the Air Force Office of Scientific Research under award
number FA9550-15-1-0162, FA9550-17-1-0089 and FA9550-19-1-0354, National Science Foundation
grant SBE 1829344 and Northwestern University’s Data Science Initiative.

14
Reference
1 Zuckerman, H. Scientific Elite: Nobel Laureates in the United States. (Free Press, 1977). 2 Barabasi, A. L., Song, C. M. & Wang, D. S. Handful of papers dominates citation. Nature 491, 40-
40 (2012). 3 Jones, B. F. & Weinberg, B. A. Age dynamics in scientific creativity. P Natl Acad Sci USA 108,
18910-18914 (2011). 4 Merton, R. K. The Matthew effect in science. Science 159, 56-63,
https://doi.org/10.1126/science.159.3810.56 (1968). 5 Newman, M. E. J. The structure of scientific collaboration networks. P Natl Acad Sci USA 98, 404-
409, https://doi.org/10.1073/pnas.021544898 (2001). 6 Price, D. J. D. General Theory of Bibliometric and Other Cumulative Advantage Processes. J Am
Soc Inform Sci 27, 292-306, https://doi.org/10.1002/asi.4630270505 (1976). 7 Petersen, A. M., Jung, W. S., Yang, J. S. & Stanley, H. E. Quantitative and empirical demonstration
of the Matthew effect in a study of career longevity. P Natl Acad Sci USA 108, 18-23, https://doi.org/10.1073/pnas.1016733108 (2011).
8 Zuckerman, H. The sociology of the Nobel prizes. Sci Am 217, 25-+, https://doi.org/10.1038/scientificamerican1167-25 (1967).
9 Zuckerman, H. Interviewing an Ultra-Elite. Public Opin Quart 36, 159-+, Doi 10.1086/267989 (1972).
10 Moulin, L. Sociology of Nobel-Prize Winners for Science, 1901-1960, with Special-Reference to Nationality. Cah Int Sociol 31, 145-163 (1961).
11 Zuckerman, H. Nobel laureates in science: Patterns of productivity, collaboration, and authorship. Am Sociol Rev 32, 391-403, https://doi.org/10.2307/2091086 (1967).
12 Hansson, N., Halling, T. & Fangerau, H. Nobel nomination letters point to a winning formula. Nature 555, 311, https://doi.org/10.1038/d41586-018-03057-z (2018).
13 Garfield, E. Do Nobel-Prize Winners Write Citation-Classics. Curr Contents, 3-8 (1986). 14 Garfield, E. & Welljams-Dorof, A. Of Nobel class: a citation perspective on high impact research
authors. Theor Med 13, 117-135 (1992). 15 Mazloumian, A., Eom, Y. H., Helbing, D., Lozano, S. & Fortunato, S. How citation boosts promote
scientific paradigm shifts and nobel prizes. Plos One 6, https://doi.org/10.1371/journal.pone.0018975 (2011).
16 Simonton, D. K. Genius, Creativity, and Leadership. (Harvard University Press, 1984). 17 Simonton, D. K. Creative productivity: A predictive and explanatory model of career trajectories
and landmarks. Psychol Rev 104, 66-89, https://doi.org/10.1037/0033-295x.104.1.66 (1997). 18 Moreira, J. A. G., Zeng, X. H. T. & Amaral, L. A. N. The distribution of the asymptotic number of
citations to sets of publications by a researcher or from an academic department are consistent with a discrete lognormal model. Plos One 10, https://doi.org/10.1371/journal.pone.0143108 (2015).
19 Shen, H. W. & Barabasi, A. L. Collective credit allocation in science. P Natl Acad Sci USA 111, 12325-12330, https://doi.org/10.1073/pnas.1401992111 (2014).
20 Fortunato, S. Growing time lag threatens Nobels. Nature 508, 186-186 (2014). 21 Nobel reactions. Nat Phys 13, 921-921, https://doi.org/10.1038/nphys4296 (2017). 22 Chan, H. F. & Torgler, B. Time-lapsed awards for excellence. Nature 500, 29-29,
https://doi.org/10.1038/500029c (2013). 23 Seeman, J. I. Synthesis and the Nobel prize in chemistry. Nat Chem 9, 925-929,
https://doi.org/10.1038/nchem.2864 (2017). 24 Fleming, L., Mingo, S. & Chen, D. Collaborative brokerage, generative creativity, and creative
success. Admin Sci Quart 52, 443-475, https://doi.org/10.2189/asqu.52.3.443 (2007).

15
25 Singh, J. & Fleming, L. Lone inventors as sources of breakthroughs: Myth or reality? Manage Sci 56, 41-56, https://doi.org/10.1287/mnsc.1090.1072 (2010).
26 Azoulay, P., Stuart, T. & Wang, Y. B. Matthew: Effect or fable? Manage Sci 60, 92-109, https://doi.org/10.1287/mnsc.2013.1755 (2014).
27 Weinberg, B. A. & Galenson, D. W. Creative careers: The life cycles of Nobel laureates in economics. De Economist pp, 1-18 (2019).
28 Sinatra, R., Wang, D., Deville, P., Song, C. M. & Barabasi, A. L. Quantifying the evolution of individual scientific impact. Science 354 (2016).
29 Fortunato, S. et al. Science of science. Science 359, eaao0185, https://doi.org/10.1126/science.aao0185 (2018).
30 Jones, B. F., Kim, N. J. D. & Miranda, M. J. Age and High-Growth Entrepreneurship. (2018). 31 Runco, M. A. Creativity: Theories and themes: Research, development, and practice. (Elsevier,
2014). 32 Taleb, N. N. The black swan: The impact of the highly improbable. Vol. 2 (Random house, 2007). 33 Latour, B. & Woolgar, S. Laboratory life: The construction of scientific facts. (Princeton
University Press, 2013). 34 Taubes, G. Nobel dreams: Power, deceit and the ultimate experiment. (Microsoft Press, 1988). 35 Cole, S. & Cole, J. R. Scientific output and recognition: A study in the operation of the reward
system in science. Am Sociol Rev, 377-390 (1967). 36 Zeng, A. et al. The science of science: From the perspective of complex systems. Phys Rep 714, 1-
73, https://doi.org/10.1016/j.physrep.2017.10.001 (2017). 37 Wu, L., Wang, D. & Evans, J. A. Large teams develop and small teams disrupt science and
technology. Nature 566, 378–382 (2019). 38 Clauset, A., Arbesman, S. & Larremore, D. B. Systematic inequality and hierarchy in faculty hiring
networks. Sci Adv 1 (2015). 39 Milojevic, S. Principles of scientific research team formation and evolution. P Natl Acad Sci USA
111, 3984-3989, https://doi.org/10.1073/pnas.1309723111 (2014). 40 Petersen, A. M. Multiscale impact of researcher mobility. J R Soc Interface 15, 20180580 (2018). 41 Pfeiffer, T., Tran, L., Krumme, C. & Rand, D. G. The value of reputation. J R Soc Interface 9,
2791-2797 (2012). 42 Youn, H., Strumsky, D., Bettencourt, L. M. & Lobo, J. Invention as a combinatorial process:
evidence from US patents. J R Soc Interface 12, 20150272 (2015). 43 Zeng, A. et al. Increasing trend of scientists to switch between topics. Nature Communications 10,
3439 (2019). 44 Ioannidis, J. P., Baas, J., Klavans, R. & Boyack, K. W. A standardized citation metrics author
database annotated for scientific field. PLoS biology 17, e3000384 (2019). 45 Vuong, Q. H. et al. An open database of productivity in Vietnam's social sciences and humanities
for public use. Sci Data 5, https://doi.org/10.1038/sdata.2018.188 (2018). 46 Liu, L. et al. Hot streaks in artistic, cultural, and scientific careers. Nature 559, 396–399 (2018). 47 https://www.microsoft.com/en-us/research/project/microsoft-academic-graph/. 48 Li, J., Yin, Y., Fortunato, S. & Wang, D. A dataset of publication records for Nobel laureates. Sci
Data 6, 33 (2019). 49 Li, J., Yin, Y., Fortunato, S. & Wang, D. A dataset of publication records for Nobel laureates.
Harvard Dataverse, https://doi.org/10.7910/DVN/6NJ5RN (2018). 50 Azoulay, P. et al. Toward a more scientific science. Science 361, 1194-1197,
https://doi.org/10.1126/science.aav2484 (2018). 51 Simonton, D. K. Scientific genius: A psychology of science. (Cambridge University Press, 1988). 52 Li, J., Yin, Y., Fortunato, S. & Wang, D. Nobel laureates are almost the same as us. Nature Reviews
Physics 1, 301–303 (2019). 53 Wuchty, S., Jones, B. F. & Uzzi, B. The increasing dominance of teams in production of
knowledge. Science 316, 1036-1039 (2007).
16
54 Petersen, A. M. Quantifying the impact of weak, strong, and super ties in scientific careers. P Natl Acad Sci USA 112, E4671-E4680, https://doi.org/10.1073/pnas.1501444112 (2015).
55 Perc, M. The Matthew effect in empirical data. J R Soc Interface 11, 20140378 (2014). 56 Rosvall, M. & Bergstrom, C. T. Maps of random walks on complex networks reveal community
structure. Proceedings of the National Academy of Sciences 105, 1118-1123 (2008). 57 https://en.wikipedia.org/wiki/Clarivate_Citation_Laureates. 58 Adams, D. Mostly Harmless. (Del Rey, 1993). 59 Blondel, V. D., Guillaume, J.-L., Lambiotte, R. & Lefebvre, E. Fast unfolding of communities in
large networks. Journal of statistical mechanics: theory and experiment 2008, P10008 (2008).

17
Fig. 1 | Early Career Performance. By early career (stage) here we mean the first five years after publishing
the first paper. a and b show the early role performance of Nobel laureates compared with typical authors
in terms of productivity and hit rate per paper (top 1%). We choose typical authors with at least 10 years of
career length. Since most authors of the GS dataset fall in recent decades, we only consider Nobel laureates
and GS typical scientists with their first paper published after 1960. We randomly select 20 typical authors
with the same first-paper publishing year and research domain, eventually leading to 3540 scientists for 177
Nobel laureates. a In terms of productivity, the Nobel laureates are indeed more productive (11.15 vs 6.59,
Student’s t-test, p-value<10-7). b When it comes to impact, the two populations are not comparable, and the
hit paper rate (probability of publishing papers in the top 1% of rescaled 10-year citations in the same year
and field) of the Nobel laureates is 6.33 times higher than for typical authors. c Much of the difference in
early productivity between Nobel laureates and typical scientists resulted from joint papers (9.67 vs 5.46,
Student’s t-test, p-value<10-7). In chemistry and medicine, there was no significant difference between the
average number of single-authored papers published by laureates in their early stage and the average author.
In physics, instead, Nobel laureates publish a little more single-authored papers than typical authors
(Student’s t-test, p-value=0.07). d We further compare the fractions of prize-winning papers within all
laureates’ early stage single-authored papers and team-authored papers published in early stages. The
former is 2.16 times as high as the latter on average (Chi-squared test, p-value<10-11). As for different
disciplines, the ratios are 2.13, 1.95 and 2.03 times for physics, chemistry and medicine, respectively. ***
a b
dc

18
p<0.01, ** p<0.05, * p<0.1 and N.S. (not significant) for p>0.1. Error bars represent the standard errors of
the mean.

19

20
Fig. 2 | Hot streak phenomenon. a The cumulative distribution function P(≤ 𝑁`/N) of relative sequence
positions of the prize-winning paper and the most-cited paper (citations are ranked based on 10-year citation
counts) during the academic career before the reception of the prize. 𝑁` denotes the order of the hit work
within 𝑁 works in a career. The red dotted line represents the null model, in which the most-cited paper can
occur at any position in the sequence of papers. b To eliminate sample bias brought from prize-winning
work (49.7% of the most-cited papers before the Prize is given are the prize-winning papers, and the
Laureates wait an average of 17.6 years for formal recognition after making prize-winning achievements),
prize-winning papers are removed and then we recalculate the top three most-cited papers among the papers
published before the conferment of the award. c-e The normalized joint distribution of the relative position
of the top two most cited papers (e.g., 𝑁∗ and 𝑁∗∗) within 𝑁 works in a career of a Nobel laureate across
three domains, compared with a null model in which the two papers each follow their independent timing
distributions. Values greater than one indicate that two hits are more likely to co-locate than random. f-h
We shuffle the order of each work in a career while keeping their impact intact as a null model for c-e. The
longest streak within a career before the Nobel Prize, L, is defined as the maximum number of consecutive
works whose impact is above the median impact of the career before the Prize. i-k The distribution P(𝐿) of
the longest streak within a career before the Prizeand the corresponding distribution P(𝐿c) for shuffled
careers, for physics, chemistry and medicine, respectively. Orange dots represent empirical observations,
whereas green dots correspond to shuffled careers. The orange solid line shows the simulation results
produced by a hot-streak model (Supplementary Information S4.3-4.5) and the shuffled version is illustrated
by the green solid line. l The hot-streak model describes well the laureates’ scientific career pattern for
different disciplines. 𝑁defcfghij/𝑁 measures the relative position of the work lying in the middle position
of the hot streak period, among works in a career before the Prize after removing the prize-winning papers.
Their cumulative distributions are shown in green dots. m The distribution of the number of works produced
during hot streaksP 𝑁k , compared with a null distribution, where we randomly pick one work as the start
of the hot streak for Nobel laureates. We use the Kolmogorov-Smirnov (KS) measure to compare P 𝑁k
of data with the null distribution, finding that we cannot reject the hypothesis that the two distributions are
drawn from the same distribution (p-value=0.18). n The histogram of the number of hot-streak periods.
Nobel winners have 1.93 hot-streak periods on average, specifically, 1.67 for physics, 2.08 for chemistry
and 2.04 for medicine. o The duration distribution of the hot streak P 𝜏k for Nobel laureates. The median
hot streak duration 𝜏k is 8 years, which is shown as the red dot line. p The relative hot streak duration
distribution P 𝜏k/𝑇 for Nobel laureates, where T is the career length of Nobel laureates. Red dot line
shows the median relative duration. q We show the normalized probability of prize-winning papers

21
occurring during the hot-streak periods opqrrqrstutvwx
owuryz{. We find that the prize-winning papers are about 1.42
times more likely occurring during the hot-streak periods than random, especially for physics laureates.
22
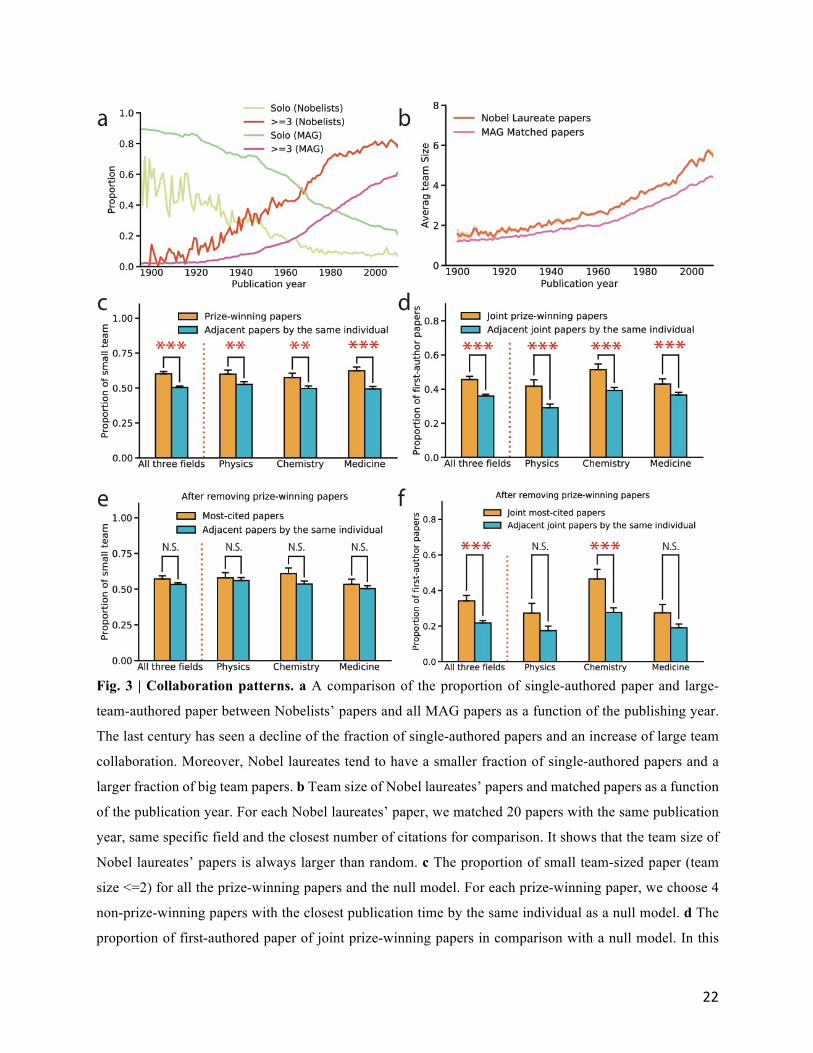
Fig. 3 | Collaboration patterns. a A comparison of the proportion of single-authored paper and large-
team-authored paper between Nobelists’ papers and all MAG papers as a function of the publishing year.
The last century has seen a decline of the fraction of single-authored papers and an increase of large team
collaboration. Moreover, Nobel laureates tend to have a smaller fraction of single-authored papers and a
larger fraction of big team papers. b Team size of Nobel laureates’ papers and matched papers as a function
of the publication year. For each Nobel laureates’ paper, we matched 20 papers with the same publication
year, same specific field and the closest number of citations for comparison. It shows that the team size of
Nobel laureates’ papers is always larger than random. c The proportion of small team-sized paper (team
size <=2) for all the prize-winning papers and the null model. For each prize-winning paper, we choose 4
non-prize-winning papers with the closest publication time by the same individual as a null model. d The
proportion of first-authored paper of joint prize-winning papers in comparison with a null model. In this

23
case, we only consider joint-authored papers. For each joint-authored prize-winning paper, we choose 4
joint-authored non-prize-winning papers published by the same Nobel laureate with the closest publication
time. e We also measure the proportion of small team-sized paper for the most-cited papers after removing
the prize-winning papers before the Prize in comparison with a null model. For each most-cited paper, we
choose 4 papers published by the same Nobel laureate with the closest publication time as the null model.
f We then compare the proportion of first-authored papers among joint most-cited papers after removing
the prize-winning papers before the Prize with a null model, and we choose 4 joint-authored papers
published by the same Nobel laureate with the closest publication time as the null model. *** p<0.01, **
p<0.05, * p<0.1 and N.S. (not significant) for p>0.1. Error bars represent the standard errors of the mean.

24
Fig. 4 | After the Prize: The temporary dip and bounce back. a Average impact per paper (defined in
Eq. (4)) as a function of time. The year when the Prize is given is marked as 0. For each laureate, we
calculate the average impact of papers she published in each of the four years before and after the Nobel,
as well as the prize-winning year. The solid line indicates the average across all laureates in our sample,
with the shaded area denoting the standard error of the mean. b The average number of papers before and
after winning the Nobel. The solid line indicates the average across all laureates in our sample, with the
shaded area denoting the standard error of the mean. The change following the Nobel mainly pertains to
impact rather than productivity. In contrast to common belief of decreased productivity following the
Nobel, the average number of publications by the laureates shows no significant changes. cAverage impact
per paper as a function of time. We set the observation window as 5 years and calculate the average impact
of papers based on the 5-year citation counts. For each laureate, we compare the average impact of papers
published in the 5th year before and each of the four years after winning the Nobel. d Comparison of the
number of individual papers within 4 years before and after the reception of the Prize. It shows a significant
25
decrease of individual work after the Nobel. The change is significant for chemistry and medicine, while
there is no significant difference for physics. e Comparison of the proportion of joint papers within 4 years
before and after the Prize. It shows an increase of joint works after the Nobel. f Communities of topics for
Nobel laureate Jean-Marie Lehn. Each paper is represented by a node, and two papers are connected if they
share at least one reference, thus, constructing a co-citing network. Here communities are detected using
the fast unfolding algorithm43,59, and each community represents a research topic. g The time series of all
the papers published by Nobel laureate Jean-Marie Lehn, and the Y-axis shows the citation for each paper.
Each paper is represented by a point and the color corresponds to the topic community in the co-citing
network. It shows a clear topic switching from ‘Cryptates and Molecular Recognition’ to ‘Self-assembly
and Self-organization’ for Nobel laureate Jean-Marie Lehn right after winning Nobel prize. h Comparison
of the probability of two papers belonging to the same topic within 4 years before and after the reception
of the Prize and a random year. The probability is significant lower after winning the Prize, suggesting
Nobel laureates tend to shift research topic after winning the Nobel. i We measure the chance of Nobel
laureates shifting to a new topic after winning the Nobel, #|h}fe~`�ci�fhg}`||`|�og`�h#fe~`�c
. We also shuffled
the topic of the works and repeated the measurement as a null model, finding that the laureates are much
more likely to shift to a new topic after winning Prize than random (14.2% vs 1.8%, p-value<10-14). The
change is significant for physics and chemistry, while there is no significant difference for medicine. jThe
distribution of paper citations for prior topics before Prize and new topics after Prize. We use the
Kolmogorov-Smirnov measure to compare the two distribution, finding that papers of the prior topics
receive higher citations than those of the new topics after Prize (Kolmogorov-Smirnov test, p-value<10-71).
k Comparison of the average number of papers of new collaborators before and after the Nobel, showing
post-Prize collaborators tend to be more productive (Student’s t-test, p-value<10-3). l Comparison of the
average impact of new collaborators before and after the Nobel, showing post-Prize collaborators tend to
have a higher impact (Student’s t-test, p-value=0.02). m Comparison of the average number of awarded
new grants within four years before and after winning the Nobel, showing there is no significant change in
funding before and after the Prize (Student’s t-test, p-value=0.77). *** p<0.01, ** p<0.05, * p<0.1 and N.S.
(not significant) for p>0.1. Error bars represent the standard errors of the mean.

1
Supplementary Information for Scientific elite revisited: Patterns of
productivity, collaboration, authorship and impact
Jichao Li1,2,3,4, Yian Yin2,3,5, Santo Fortunato6,7 and Dashun Wang2,3,4,5*
1 College of Systems Engineering, National University of Defense Technology, Changsha, China
2 Center for Science of Science and Innovation, Northwestern University, Evanston, IL, USA.
3 Northwestern Institute on Complex Systems, Northwestern University, Evanston, IL, USA.
4 Kellogg School of Management, Northwestern University, Evanston, IL, USA
5 McCormick School of Engineering, Northwestern University, Evanston, IL, USA
6 School of Informatics, Computing, and Engineering, Indiana University, Bloomington, IN, USA
7 Indiana University Network Science Institute (IUNI), Indiana University, Bloomington, IN, USA

2
Contents
S1 DataDescription.............................................................................................3S1.1 Dataset of career histories for Nobel laureates.................................................3S1.2 Comparison dataset..........................................................................................3S1.3 Data preprocessing...........................................................................................3
S2 LiteratureReviewofNobelPrizeStudies.........................................................4
S3 SupportingInformationforFigure1................................................................5S3.1 Hit paper rate...................................................................................................5S3.2 Robustness check of Fig. 1d..............................................................................6S3.3 Robustness check of early career length...........................................................6
S4 SupportingInformationforFigure2................................................................7S4.1 Normalized joint probability between the three most cited papers..................7S4.2 Normalized joint probability between prize-winning papers and hit works....7S4.3 Hot-streak model..............................................................................................7S4.4 Fitting the hot-streak model.............................................................................8S4.5 Parameters of the generative hot-streak model................................................8S4.6 Number and duration of hot streaks................................................................9
S5 SupportingInformationforFigure3................................................................9S5.1 Selecting adjacent papers.................................................................................9S5.2 Authorship analysis controlling for temporal factors.......................................9S5.3 Authorship analysis for hit works..................................................................10
S6 SupportingInformationforFigure4..............................................................10S6.1 Hit paper rate changes after the Prize............................................................10S6.2 Robustness check of disciplines......................................................................11S6.3 Robustness check of publication time.............................................................11S6.4 Nobel dip after controlling for the burst.........................................................11S6.5 Topic changing after winning the Nobel Prize................................................12S6.6 Topic identification based on Infomap algorithm..........................................12S6.7 The popularity of research topics before and after the Prize.........................13S6.8 Changes in collaborators before and after the Prize......................................13S6.9 Funding opportunities before and after the Prize..........................................14
S7 SupplementaryFigures.................................................................................15
Reference.............................................................................................................27

3
S1 Data Description
S1.1 Dataset of career histories for Nobel laureates
In this project, we manually gather 874 prize-winning papers for 545 Nobel laureates. The prize-winning papers are then matched in the Microsoft Academic Graph (MAG) database. We also construct a unique dataset of publication lists of 93,394 laureate papers for almost all (545 out of 590, or 92.4%) Nobel laureates by manually combining information collected from Nobel Prize official websites, the laureates’ university websites, and Wikipedia, and matching laureates with their publications from the MAG database. The dataset obtained through this process is validated with external sources from manually collected CVs, selected Google Scholar (GS) profiles, additional affiliation information, and manual verification of a random selection of 60 Nobel laureates (20 for each Nobel laureate). The collected publication records can be downloaded at https://doi.org/10.7910/DVN/6NJ5RN. The manual curation and algorithmic disambiguation procedures for collecting the publication records of the Nobel laureates are detailed in our paper1.
S1.2 Comparison dataset
We also leverage a dataset of over 20,040 carefully disambiguated typical authors from GS2 as our comparison group. To show the cross-domain difference between laureates and typical authors, typical authors are classified in each of the three Nobel fields if they have published at least one paper in a related field. The Nobel field categories for physics, chemistry, and medicine are referred to Jones’s paper3. Most typical authors in the GS dataset have produced work in recent decades. To eliminate this temporary effect, we only consider Nobel laureates and typical scientists whose first paper was published after 1960 and whose careers were at least 10 years in length. For each Nobel laureate who published her first paper after 1960, we randomly match 20 typical authors in the same research domain with the same first-paper publishing year, which eventually resulted in 3540 authors (1260 in physics, 1140 in chemistry, and 1140 in medicine) randomly matched to 177 Nobel laureates (63 in physics, 57 in chemistry, and 57 in medicine).
S1.3 Data preprocessing
To ensure the feasibility and reliability of the results, the raw data is processed in the following ways for further analysis: 1) We only focus on the laureates’ original papers, meaning that all review and note papers are removed; 2) Nobel lecture papers are also removed; 3) When performing citation analysis, we only focus on papers published before 2005 to ensure that all analyzed papers garner 10 years of citations.

4
S2 Literature Review of Nobel Prize Studies
The Nobel Prize, commonly perceived as the highest honor that a natural scientist could ever have, has been frequently used as a proxy for identifying top researchers of supreme achievement. A large body of literature in disciplines ranging from sociology, economics, psychology, and physics has focused on these scientific ultra-elites, which can be summarized into two main streams: quantitative and qualitative study. On the one hand, quantitative study is based on the laureate’s publication and citation records, primarily their milestone events, i.e. their prize-winning research. Topics related to these milestones include scientific creativity, credit allocation, breakthrough recognition, collaboration patterns, and changing citation dynamics. However, most of the literature is focused on either one specific domain or a small percent of the laureates, resulting from an incomprehensive dataset. On the other hand, qualitative research aims to understand laureates’ entire careers, often by examining Nobel archives or interviewing prizewinners. The most representative work in this area is from Zuckerman, who interviewed 45 American Nobel laureates, systematically examining each career in detail. Table S1 reviews selected studies related to the Nobel Prize. Table S1: Literature review of Nobel Prize studies
Year Paper Category Topic Data
1957 Manniche et al. (1957)4
quantitative & qualitative
Age and creativity 164 prizewinners in the period 1901-1950
1967 Zuckerman (1967)5
quantitative Nobel prestige Affiliation information of 76 prize-winners
1967 Zuckerman (1967)6
quantitative & qualitative
Productivity, collaboration and authorship
Interview information from 41 prize-winners
1977 Zuckerman (1977)7
quantitative & qualitative
Productivity, collaboration and authorship
Interview information from 41 prize-winners
1978 Ashton et al. (1978)8
quantitative Citation analysis Citation record of Nobel prizewinner, W. N. Lipscomb
1984 Crawford (1984)9 qualitative Documented study Nobel Archives between 1901-1915
1986 Garfield (1986)10 quantitative Citation analysis Citation records of 125 prizewinners from 1965 to 1984
1988 Diamond (1988)11 quantitative Citation analysis Citation counts of 24 prizewinners in economics between 1969 and 1986
1991 MacLauchlan (1991)12
quantitative & qualitative
Nobel nominations study
Nobel Archives between 1901 and 1937
1992 Garfield (1992)13 quantitative Citation analysis Citation records of 37 prizewinners between 1961 and 1976
1999 Van Dalen (1999)14
quantitative Age and creativity Productivity record of Nobel Prize laureates in economics, 1969-1997
2000 Rodgers (2000)15 qualitative How the winners are selected
/
2000 Feldman (2000)16 qualitative The history of Nobel Prize
/
2001 Friedman (2001)17 qualitative Politics of excellence Nobel Archives up to 1950
2001 Crawford (2001) 18 qualitative How the winners are selected
Nobel population 1901–1950
2002 Crawford (2002)19 qualitative Social history of science
Nobel Archives between 1901 and 1939
2003 James (2003)20 qualitative Academic success /
2003 Friedman (2003)21 qualitative Prize recognition /
2005 Hirsch (2005)22 quantitative Citation analysis Physicists who earned Nobel Prizes between 1985 and 2005
2006 Wray (2006)23 qualitative Collaboration and authorship
/

5
Year Paper Category Topic Data
2008 Rablen (2008)24 quantitative Age analysis Nobel Prize winners and nominees in physics and chemistry between 1901 and 1950
2010 Gingras (2010)25 quantitative Specialty increasing Meta-data of nominees and winners of the chemistry and physics prizes (1901–2007)
2011 Rodríguez-Navarro (2011)26
quantitative Nobel prestige Number of Nobel Prize achievements from 1989–2008
2011 Jones et al. (2011)3 quantitative Age and creativity A dataset of 525 Nobel Prize winners
2011 Mazloumian et al. (2011)27
quantitative Citation analysis around landmark paper
Citation records for 124 Nobel Prize laureates
2011 John et al. (2011)28 quantitative Recognition lag Meta-data of Nobel laureates, 1901-2009
2013 Heinze et al. (2013)29
quantitative Citation analysis Citation records of prizewinners Gerd Binnig, Heinrich Rohrer, Harold Kroto, Richard Smalley, and Robert Curl
2013 Chan et al. (2013)30
quantitative Recognition lag 466 recipients of Nobel Prizes in physics, Chemistry, and Physiology or medicine awarded from 1901 to 2000
2014 Azoulay et al. (2014)31
quantitative Citation analysis 16 Howard Hughes Medical Investigator prizewinners
2014 Liu et al. (2014)32 quantitative Citation analysis Citation data of six Nobel Prize-winning articles
2014 Santo et al. (2014)33
quantitative Recognition lag Meta-data of Nobel laureates before 2014
2015 Caroline et al. (2015)34
quantitative Collaboration and authorship
Meta-data of 68 Nobel Laureates in Physiology or medicine between 1969 and 2011
2016 Hanson et al. (2016)35
qualitative How the winners are selected
/
2017 Sondhi et al. (2017)36
qualitative Prize-granting entities /
2017 Seeman (2017)37 qualitative Prize recognition Nobel Prizes for organic chemistry research since 1965
2018 Hanson et al. (2018)38
quantitative Winning formula Hundreds of nominations for the Nobel Prize in Physiology or medicine for the period 1901–66
2018 Ferry (2018)39 qualitative Road to Prize /
2019 Weinberg et al. (2019)40
quantitative Age and creativity Citation records of Nobel laureate economists born in or before 1926
S3 Supporting Information for Figure 1
S3.1 Hit paper rate
In Fig. 1b of the main text, we compare the “hit” paper rate—defined as the probability of publishing papers in the top 1% of citations in the same year and field—for Nobel laureates and typical authors. Our collected Nobel laureate dataset is based on information provided by the MAG, which assigns the field of subject for each paper. It is worth noting that the field of subject is a hierarchal structure with six levels. The first level contains 19 main fields, such as “physics,” “chemistry,” “medicine,” and “biology.” The second level contains 295 subfields, such as “astrophysics,” “biophysics,” and “geophysics.” In this paper, we choose the second level fields in calculating the hit paper rate for Nobel laureates. The GS typical scientist dataset is based on information from the WOS, and it is almost impossible to precisely match the career histories of 3540 GS scientists from the WOS to the MAG. Thus, the hit rate analysis of the GS scientists is based on the WOS database itself. Papers in the WOS are also assigned to one of 234 specific field categories, such as “astronomy & astrophysics,” “biophysics,” and “geochemistry & geophysics.” The hit paper rate for typical scientists is calculated using these 234 specific fields from the WOS.
We then compare the hit paper rate for Nobel laureates with typical authors for both single-authored and joint papers after removing prize-winning papers. As we can

6
see from Fig. S1, the top 1% hit paper rate of single-authored papers for laureates shows a 6.7-fold increase over their peers. In the case of team-authored papers, laureates experience a 4.7-fold increase.
We also compare the top 5% hit paper rate for Nobel laureates and typical authors after removing prize-winning papers. We find that Nobel laureates experience, on average, a 3.1-fold increase over their peers. That number is 3.9-fold and 2.9-fold for single-authored paper and team-authored papers respectively (Fig. S2).
S3.2 Robustness check of Fig. 1d
In the main text (Fig. 1d), we measure the proportion of prize-winning papers written early in a career among all single-authored papers and team-authored papers, respectively. We find that early-stage single-authored papers have a higher chance of being prize-winning than early-stage team-authored papers, especially in physics and chemistry. Does this phenomenon change over time? Here we measure the fraction of early-stage prize-winning papers as a function of year of publication (Fig. S3). Though the average fraction of early-stage prize-winning papers decreases over time, the proportion of prize-winning papers in the single-authored category is always higher than that in the team-authored category (p-value<10-3). In conclusion, our results are robust over time.
We also measure the proportion of single-authored papers among all early-stage papers and prize-winning papers respectively. The fraction of single-authored papers within early-stage, prize-winning papers is much higher than that within early-stage, non-prize-winning papers (Fig. S4). Almost 40% of early-stage, prize-winning papers are single-authored, but that fraction is less than 25% of the early-stage, non-prize-winning papers category (p-value<10-11). This conclusion is consistent across the three disciplines (physics: p-value<10-5; Chemistry: p-value<10-3; medicine: p-value=0.014), and the results are robust concerning different periods (Fig. S5). Although the fraction of single-authored papers is decreasing over time, the proportion of early-stage, prize-winning papers that are single-authored is still higher than that of early-stage papers more generally (p-value<10-3).
More interestingly, the advantage that comes with single-authoring a paper does not remain consistent over the course of a career. Rather, early-stage scientists experience the strongest benefit from single-authoring. Such benefit decays systematically as scientist ages, reaching a balance point after roughly 30 years when prize-winning papers have relatively the same chance of being single-authored or written jointly (Fig. S6). We drew the same conclusion with respect to a person’s overall odds of writing a prize-winning paper. (Fig. S7).
S3.3 Robustness check of early career length
When we refer to “early career” or “early stage” in the main text, we mean the initial five years after a given scientist publishes her first paper. Do our findings still hold if we adjust the early career length? To answer this question, we repeated the same

7
analysis shown in Fig. 1 for the first four and six years of the careers of both laureates and typical scientists, finding the same productivity and impact patterns (Figs. S8-9).
S4 Supporting Information for Figure 2
S4.1 Normalized joint probability between the three most cited
papers
We quantify the relative timing between the three most cited papers (𝑁∗, 𝑁∗∗ and 𝑁∗∗∗) within each career by calculating the joint probability 𝑃(𝑁∗, 𝑁∗∗ ), 𝑃(𝑁∗, 𝑁∗∗∗)and 𝑃(𝑁∗∗, 𝑁∗∗)compared with a null model in which the three papers each follow their independent temporal patterns. We uncovered clear diagonal patterns across all three domains (Figs. S10a-c), showing that high-impact papers by the laureates are more likely to cluster together than expected by chance. The diagonal pattern disappeared when we shuffle the order of the works while preserving the random impact rule (Figs. S10d-f).
S4.2 Normalized joint probability between prize-winning papers
and hit works
The documented diagonal pattern prompts us to ask if a similar pattern exists between prize-winning papers and highest-impact works. Here we measure the normalized joint probability of a prize-winning paper (for Nobel laureates with multiple prize-winning papers, we take the average; the same below) and the top three highest impact works within a career before the Prize. Figures S11a-c show clear colocation diagonal patterns between prize-winning papers and the laureates’ hit works. If we shuffle the order of each work in a career before the Prize while keeping each paper’s impact, the pattern disappears (Figs. S11d-f).
S4.3 Hot-streak model
We find that the career histories of laureates exhibit patterns that are broadly consistent with the hot-streak model2. Here, we introduce the hot-streak model. The impact of work, 𝑖, produced by an individual can be quantified by Γ* = log(𝐶01 + 1), where 𝐶01 measures the rescaled number of citations within 10 years of publication (S3.1). Recently, a ubiquitous hot-streak phenomenon has been confirmed as a fundamental law governing a scientist’s dynamics of academic performance2. It is shown that the vast majority of scientists have at least one hot-streak period, when an individual’s performance is substantially higher than her typical performance, which can be curved with a step function:
Γ 𝑡 =Γ5𝑡↑ ≤ 𝑡 ≤ 𝑡↓Γ1𝑜𝑡ℎ𝑒𝑟𝑤𝑖𝑠𝑒
.

8
The function features an individual’s performance deviations from a baseline performance Γ1 at a certain point in a career 𝑡↑, elevating to a higher value Γ5. After sustaining 𝑡5 = 𝑡↓ − 𝑡↑, the individual’s performance then falls back to a level similar to Γ1.
S4.4 Fitting the hot-streak model
The procedure to fit an individual career performance using the hot-streak model is well-documented in existing study2. To evaluate the goodness-of-fit of the hot-streak model, we measure the difference between fitted and real paper impact by calculating the coefficient of determination 𝑅B. The coefficient of determination 𝑅B is defined with the following formula:
𝑅B = MSS/TSS = (TSS − RSS)/TSS, where MSS is the model sum of squares (also known as ESS, or explained sum of squares), which is the sum of the squares of the prediction minus the mean for that variable; TSS is the total sum of squares associated with the outcome variable, which is the sum of the squares of the measurements minus their mean; and RSS is the residual sum of squares, which is the sum of the squares of the measurements minus the prediction from the model.
We fit the career performance of each laureate using the hot-streak model and measure the 𝑅B between the step-function-simulated career and the real career for all Nobel winners in our dataset. We find the 𝑅B peaks around 0.75, suggesting that the hot-streak model can capture the career performance of laureates quite well (Fig. S12).
S4.5 Parameters of the generative hot-streak model
In the main text, the solid lines of Figs. 2i-k show the simulation results of the distribution of the longest streak within a career before the Prize. In this section, we introduce how the simulation results are generated through a simple hot-streak model. Referring to the previous study2, we use the empirical productivity information for each laureate to generate a work sequence, and the impact of a work is randomly drawn from a normal distribution 𝑁(Γ5, 𝜎B) if it is produced during the hot streak period, or 𝑁(Γ1, 𝜎B) if otherwise. We randomly pick one work out of the sequence of works if the laureate produced at least five papers before the Prize (we define a hot-streak period as being composed of no less than five papers) as the start of a hot-streak period, and denote its production year as 𝑡↑. We assume Γ1, Γ5, σ and 𝑡5 = 𝑡↓ − 𝑡↑ to be the same for each individual in a domain, and Γ5 = Γ1 + 1 for simplicity. The value of parameters, Γ1 , Γ5 , σ , and 𝑡5 of the generative hot-streak model in Figs. 2i-k are evaluated partly according to our previous fitting results and partly as a guide by eye, in particular, Γ1 = 2.9, Γ5 = 3.9, σ = 1.1, and 𝑡5 = 7.9 for physics; Γ1 = 3.1, Γ5 =4.1, σ = 0.9, and 𝑡5 = 9.8 for chemistry; Γ1 = 3.0, Γ5 = 4.0, σ = 1.1, and 𝑡5 = 9.1 for medicine.

9
S4.6 Number and duration of hot streaks
We measure the number of hot-streak periods for laureates before the Prize (Fig. S13), and find that their careers are characterized by 1.71 hot streaks (1.51 for physics, 1.85 for chemistry, and 1.76 for medicine) on average, whereas the vast majority of scientists experience just one hot streak.
In Fig. 2o in the main text, we measure the duration distribution of the hot-streak period for Nobel laureates, finding that the duration peaks at around 5.2 years. In Figs. S15a-c, we measure the duration distribution of the hot-streak period over the course of entire careers across different disciplines. The duration peaks at around 5.0, 5.2, and 7.5 years for physics, chemistry, and medicine respectively. Dotted lines represent the median hot-streak duration, which is 8, 7, and 9 years for physics, chemistry and medicine respectively. Figs. S14a-c show the relative duration distribution for individuals, where T is the career length. Figs. S14d-f show the relative duration distribution for individuals, where T is the career length of each individual. Dotted lines represent the median relative hot-streak duration, which hovers at around 22%, 20%, and 22% for physics, chemistry and medicine respectively.
S5 Supporting Information for Figure 3
S5.1 Selecting adjacent papers
In Fig. 3c, we created a null model for prize-winning papers by selecting adjacent papers. The procedure for doing so is introduced here in detail. To ensure the feasibility and reliability of the results, we only focus on the laureates’ original work, hence all review and note papers are removed. To rule out the temporal effect, we choose the four non-prize-winning papers with the closest publication time (within three years) for each prize-winning paper by the same individual for use as our null model. In Fig. 3d, we also created a null model for joint prize-winning papers for comparison. In that case, we only consider the joint-authored papers, and for each joint-authored prize-winning paper, we choose 4 joint-authored non-prize-winning papers published by the same Nobel laureate with the closest publication time as the null model.
The same procedure for selecting adjacent papers is also used to build a null model for the hit works (ranked by 10-year citations) to use in comparison when analyzing team size and authorship. When it comes to hit works, it is worth noting that we only focus on papers published before 2005 to ensure that all analyzed papers garner 10-year citations.
S5.2 Authorship analysis controlling for temporal factors
To check if the authorship pattern documented in Fig. 3d is dominated by a temporal effect, we control for publication time and age information using a logistic regression model. The logistic regression model is defined as follows:
10
log(𝑝*
1 − 𝑝*) = 𝛽1 + 𝛽0𝑥*0 + 𝛽B𝑥*B + 𝛽T𝑥*T + 𝜀*,
where 𝑝* indicates the probability of paper 𝑖 having the laureate as the first author; x*0 is a dummy variable, x*0 = 1 if paper 𝑖 is a prize-winning paper, x*0 = 0if otherwise; x*B is the publication year of paper 𝑖; and x*T denotes the career age of the laureate when publishing paper 𝑖. For each joint-authored prize-winning paper, we choose four joint-authored non-prize-winning papers published by the same Nobel laureate with the closest publication time. We find that the results are robust after controlling for temporal effect, which supports our conclusion that laureates are more likely to claim first authorship in the case of their prize-winning papers (p-value<10-3).
S5.3 Authorship analysis for hit works
We have studied the authorship of all joint prize-winning papers in Fig. 3d, finding that prize-winning papers are substantially more likely to be first-authored by laureates. To test if this phenomenon is unique to the prize-winning work, we repeated the same analysis for each laureate’s top three most-cited papers before the Prize by comparing them with those published by the same laureates immediately before and after. First, we compared the proportion of first-authored papers of joint most-cited papers to a null model. For each joint-authored most-cited paper, we choose four joint-authored papers published by the same Nobel laureate with the closest publication time and used these for the null model. While we find that a laureate is more likely to have first-authored her most-cited paper, the phenomenon for the second and third most-cited papers in terms of different disciplines is pretty weak (Figs. S15a-c). It is worth noting that 51.74% of the laureate’s most-cited papers are also his/her prize-winning papers. To test if this phenomenon is driven by the recognition that comes with prize-winning work, we repeated our measurements by removing the careers of laureates who published their prize-winning work, and find no statistical difference for physics and medicine, while the difference still holds for chemistry (Figs. S15d-f).
S6 Supporting Information for Figure 4
S6.1 Hit paper rate changes after the Prize
How does a laureate’s hit paper rate change after a Prize is awarded? To answer this question, we first measure the top 1% hit paper rate as a function of career years, with the year the Prize is given marked as 0. For each laureate we calculate the top 1% hit paper rate of papers she published in each of the four years before and after the Nobel, as well as those in the prize-winning year. Then, we calculate the average top 1% hit paper rate across all laureates in our sample. We find that the average top 1% hit paper rate remains almost the same—around 17% four years before the Prize. It shows a significant drop in the subsequent two years after the Nobel is awarded, reaching 12%, and then increases slightly by year four. (Fig. S16a). We also measure changes in the

11
average top 5% hit paper rate after the Prize is awarded. It also experiences a significant drop in the two years after the Nobel, with a slight increase by year four. (Fig. S16b).
S6.2 Robustness check of disciplines
To study if the Nobel dip effect occurs in different disciplines, we calculate the average impact of papers published by the laureates in each of the four years before and after winning the Nobel across three domains. We find that the Nobel dip is most pronounced for prizewinners in physics, who show a reduced impact of 18.1% the second year after the Prize, compared with 4.8% for chemistry and 13.4% for medicine, where prizewinners experiences their most significant dip in the third and first year respectively (Fig. S17). In all domains, the prizewinners’ impact gradually recovers, bouncing back to a pre-Nobel level by year four. However, there is no significant difference when it comes to the laureate’s productivity before and after the Prize (Fig. S18).
S6.3 Robustness check of publication time
Nobel dip rate, denoted as R in our study, is defined as follows:
R = WX YZ[\]^ WX _\Z`]\
WX YZ[\],
where Γa bcdefc is the average impact of papers two years before winning the Nobel Prize, while Γg hijkl measures the average impact of papers two years after winning the Nobel Prize.
To check if our results hold over time, we measure the Nobel dip rate according to each decade in the last century (we merge the first 30 years of the last century into one group because of the small amount of data in the sample). The average impact of papers shows a significant drop in the two years immediately following the Nobel, and the results are robust with respect to different time periods (Fig. S19).
S6.4 Nobel dip after controlling for the burst
The burst of citations to pre-Prize paper may account for part of the observed Nobel dip. Yet more interestingly, we find that the dip persists after we control for the burst. More specifically, we re-measure the paper impact based on citations received within an observation window 𝑘 , i.e., 𝑘 years of publication. The impact of paper i, is
quantified by Γo = log(Cq,o + 1), where Cq,o measures the rescaled number of citations
within 𝑘 years of publication. For each laureate, the average impact of papers published
in the jst year after Prize is defined as Γ u =Γi
vwxyza{
, where N} is the number of papers
published in the jst year. Given an observation window 𝑘, we exclude all works where the impact measure includes post-Prize citations for the pre-Nobel papers and compare the impact of works published in the kth years before and each of the years after winning

12
Prize. In the main text, we set the observation window as 5 years, and here we alter the observation window as 4 years, 3 years and 2 years. Then we calculate the average impact per paper as a function of publication year with the different observation, we find the average impact per paper still shows a significant drop the year following the Nobel even after excluding works where the impact measure includes post-Prize citations. (Figs. S20a-c).
S6.5 Topic changing after winning the Nobel Prize
To quantify the topic of a paper, we adopt a recent method based on community structure of the co-citing network of a scientist’s papers41. To ensure meaningful community detection results, we consider all Nobel laureates who have published at least 50 papers. We also excluded Nobel laureates who published fewer than five papers after winning the Prize. Finally, we selected 283 Nobel laureates (74 for physics, 96 for Chemistry, 113 for medicine) who satisfied these requirements.
In the main text (Fig. 4h), we measure the probability of two papers belonging to the same topic within 4 years before and after the reception of the Prize and a random year. To measure the probability of changing topics of Nobel laureates after winning Prize, we randomly selected two papers, within 4 years before and after the Nobel, respectively, and measured the probability of two papers belonging to the same topic. We then build a null model by randomly choosing a year as the pretended prize-winning year for comparison.
To ask if Nobel laureates tend to study a new topic after winning Prize, we then measure the chance of Nobel laureates shifting to a new topic after winning the Nobel, #�k�j��*��hijkl�*��*���l*�k
#j��*��. We also shuffled the topic of the works and repeated the
measurement as a null model for comparison.
S6.6 Topic identification based on Infomap algorithm
In the main text (Fig. 4), we find that laureates disproportionately shift research topic after winning the Nobel. To test if the results are affected by the choice of different community detecting methods, we repeated the results based on another algorithm, Infomap42. Figure S21 visualizes the publication history of Nobel laureate Jean-Marie Lehn by color coding each paper according to the topic community to which it belongs. Based on the Infomap community detecting algorithm, the papers of Nobel laureate Jean-Marie Lehn are divided into 17 different communities of topics with 7 starting before the Nobel and 10 starting after (including the Noble year) the Nobel.
We then measured measure the probability of changing topics of Nobel laureates after winning Prize based on the Infomap community detecting method, finding only 42.3% of the two papers belonging to the same topic after winning the Prize. We further build a null model by randomly choosing a year as the pretended prize-winning year for comparison, finding that the probability is significant higher (48.5% vs 42.3%, p-

13
value=0.03, Fig. S22), which suggests Nobel laureates tend to shift research topic after winning the Nobel.
We also measured the chance of Nobel laureates shifting to a new topic after winning the Nobel based on the Infomap community detecting method, finding the laureates have more than one quarter chance of shifting to a new topic after winning the Nobel. However, the chance is only around 5.0% when we shuffled the topic of the works and repeated the measurement as a null model (25.1% vs 5.0%, p-value<10-12, Fig. S23).
S6.7 The popularity of research topics before and after the Prize
To test if the overpopulation of prior topics might encourage laureates to change research agenda after the Nobel, we first focus on laureates’ papers that belong to the topics recognized by the Nobel and use citations to these papers as a proxy to trace topic popularity. We find that papers of the prior topics receive much higher citation counts after the Prize than before (Fig. S24, Student’s t-test, p-value = 0.04). We then compared the total citation counts of the prior topics before the Prize and those of the new topics after the Prize. We find that the former received higher citations than the latter (Kolmogorov-Smirnov test, p-value < 10-71, Fig. 4j in the main text).
While it’s difficult to measure directly whether a topic is over-popular, these results suggest that (1) the prior topic continues to be popular after the Nobel; (2) papers published on the Nobel topic tend to garner more citations than papers on the new topic. Together these results are consistent with an endogenous shift by the laureates to explore new directions, even though the new topic may be less popular (less cited on average) than the Nobel topic.
S6.8 Changes in collaborators before and after the Prize
Another rather insightful mechanism is that the Nobel may attract new collaborations, which may be related to the topic change observed following the Nobel. To test this hypothesis, we first compare the number of new collaborators before and after the Prize. We find there is no significant change in the number of new collaborators before and after the Prize (Fig. S25), a pattern that is consistent across all three domains.
Although the number of new collaborators did show any significant change, the Nobel with added recognition may attract more established collaborators. To test this hypothesis, we analyzed the publication record of the collaborators before and after the Nobel. For each collaborator, we only focus their career record before the first collaboration with the laureate. We define Nq as the number of papers published before the first collaboration with Nobel laureates for collaborators k , and the impact of
collaborators k is measured as Γq = log( C01,oa�o�0 + 1) , where C01,o is the 10-year
citation counts of paper i. Comparing the profiles of collaborators before and after the Nobel, we find post-Prize collaborators tend to be more productive (Student’s t-test, p-value < 10-3, Fig. 4k in the main text) and have a higher impact (Student’s t-test, p-value = 0.02, Fig. 4l in the main text).

14
Together, these results suggest that the Nobel does not necessarily attract more new collaborators than expected, but new collaborators after the Nobel tend to be more productive with higher impact. From this result, one would expect the impact of works produced after the Nobel to increase, not decrease, which then makes the impact dip shortly after the Nobel more intriguing.
S6.9 Funding opportunities before and after the Prize
The Prize and the added recognition may result in more and better funding opportunities, conducive to changing research directions. To test this hypothesis, in this revision we have acquired a novel dataset that captures funding records across all funding agencies world-wide, linked with individual investigators and resulting publications43-47. To the best of our knowledge, it is the most comprehensive research grants database to date48, ideal to test this hypothesis.
We collected around 5 million grants between 1950 and 2019. We then connect the grant records to the careers of Nobel laureates we curated through systematic efforts of paper matching and author name disambiguation, resulting in 470 grants for 51 Physics laureates, 920 grants for 66 Chemistry laureates, and 509 grants for 72 Medicine laureates, respectively.
To measure changes in funding opportunities before and after the Prize, we first compare the average number of active grants for each laureate in each of the four years before and after winning the Nobel, finding that overall there is no significant change (Fig. S26a). We then separated this measurement by field, finding a suggestive signal for Physics laureates to increase their grant support around the time of the award (Fig. S26b), whereas the active grants for Chemistry and Medicine laureates stayed roughly the same (Figs. S26cd). We also compare the average number of new grants within four years before and after winning the Nobel, arriving at the same conclusion (Fig. 4m in the main text). Together our analysis suggests that there is no significant change in funding before and after the Prize, which is somewhat surprising. Indeed, according to the Matthew effect, we would have expected to observe an increase in funding. On the other hand, the lack of increase is consistent with the change in topic and research agenda which requires more time to build up for funding.

15
S7 Supplementary Figures
Fig. S1 | Hit paper rate (top 1%) after removing the prize-winning paper. A comparison of hit paper rate (top 1%) for Nobel laureates and typical authors in terms of all papers (a), single-authored papers (b), and joint papers (c). Even after removing prize-winning papers, both Nobel laureates’ early-stage single-authored papers and joint-authored papers have much higher impact in terms of the hit paper rate (top 1%). *** p<0.01, ** p<0.05, * p<0.1 and NS for p>0.1. Error bar represents the standard error of the mean.
Fig. S2 | Hit paper rate (top 5%) per early-stage paper after removing prize-winning paper. A comparison of hit paper rate (top 5%) for Nobel laureates and typical authors in terms of all papers (a), single-authored papers (b), and joint papers (c). Even after removing prize-winning papers, both Nobel laureates’ early-stage single-authored papers and joint-authored papers have much higher
a
*** ***5.7 times***3.5 times***4.3 times5.1 times
***4.7 times ***5.3 times***3.3 times***3.2 times
c
***6.7 times
b
***8.0 times***4.2 times***7.1 times
***3.1 times ***2.6 times ***2.2 times ***3.3 times
***3.9 times ***3.5 times ***2.6 times ***4.4 times ***2.9 times ***2.3 times ***2.1 times ***3.1 times
a
b c

16
impact in terms of the hit paper rate (top 5%). *** p<0.01, ** p<0.05, * p<0.1 and NS for p>0.1. Error bar represents the standard error of the mean.
Fig. S3 | Proportion of early-stage prize-winning papers as a function of publication time. The average fraction of early-stage prize-winning papers decreases over time, which is well-fitted using a logistic regression model. The scattered data points refer to the mean value averaged within 20 years and shading around the lines shows 95% confidence limits. In the early-stage, after controlling for publication year, we also find that single-authored papers have a higher probability of being prize-winning than team-authored papers (p-value<10-3).
Fig. S4 | Fraction of single-authored papers in the early stage. We compare the fraction of single-authored papers within all laureates’ early stage non-prize-winning papers (orange) and within prize-winning papers published in early stages (green) for the entire group of laureates that we examined. The fraction of single-authored papers is much higher among early-stage prize-winning papers than for non-prize-winning papers in the early stage, a trend that holds for physics, Chemistry, and medicine. *** p<0.01, ** p<0.05, * p<0.1 and N.S. (not significant) for p>0.1. Error bars represent the standard errors of the mean.

17
Fig. S5 | Proportion of single-authored early stage papers as a function of publication time. The average fraction of single-authored early stage papers decreases over time, which is well-fitted using a logistic regression model. The scattered data points refer to the mean value averaged within 20 years and shading around the lines shows 95% confidence limits. After controlling for the publication year, we find that early-stage papers are more likely to be single-authored (p-value<10-
3).
Fig. S6 | Proportion of single-authored papers as a function of career age. The average fraction of single-authored papers decreases over career age, which is well-fitted using a logistic regression model. The scattered data points refer to the mean value averaged within 10 career years and shading around the lines shows 95% confidence limits. The fraction of single-authored papers is much higher among prize-winning than non-prize-winning papers in the early stage, though the advantage of single-authoring decays systematically over time, reaching a balance point after roughly 30 years, when prize-winning papers have relatively the same chance of being single-authored or team-authored.

18
Fig. S7 | Proportion of prize-winning papers as a function of career age. The average fraction of prize-winning papers decreases over career age, which is well-fitted using a logistic regression model. The scattered data points refer to the mean value averaged within 10 career years and shading around the lines shows 95% confidence limits. Single-authored papers have a higher chance of being prize-winning in the early stage, though the advantage of single-authoring decays systematically over time, reaching a balance point after roughly 30 years, when single-authored and team-authored papers have relatively even odds of being prize-winning.
Fig. S8 | Early Career Performance (The First Four Years). a In terms of productivity, the Nobel laureates are indeed more prolific (8.66 vs 5.34, Student’s t-test, p-value<10-7). b When it comes to impact, the two populations are not comparable, and the hit paper rate (top 1%) of the Nobel laureates is 6.23 times higher than for typical authors. c Much of the difference in early published output between Nobel laureates and typical scientists resulted from joint papers (7.59 vs 4.41, Student’s t-test, p-value<10-7). There was no significant difference between the average number of single-authored papers published by laureates in their early stage and the average author. d We further compare the fractions of prize-winning papers within all laureates’ early stage single-authored papers and within team-authored papers published in early stages. The fraction of prize-
ba
c d

19
winning papers is much higher among early-stage single-authored papers than for team-authored papers (Chi-squared test, p-value<10-11). *** p<0.01, ** p<0.05, * p<0.1 and N.S. (not significant) for p>0.1. Error bars represent the standard errors of the mean.
Fig. S9 | Early Career Performance (The First Six Years). a In terms of productivity, the Nobel laureates are indeed more prolific (13.90 vs 8.02, Student’s t-test, p-value<10-8). b When it comes to impact, the two populations are not comparable, and the hit paper rate (top 1%) of the Nobel laureates is 6.53 times higher than for typical authors. c Much of the difference in early published output between Nobel laureates and typical scientists resulted from joint papers (12.11 vs 6.68, Student’s t-test, p-value<10-8). In chemistry and medicine, there was no significant difference between the average number of single-authored papers published by laureates in their early stage and the average author. In physics, Nobel laureates tend to publish more single-authored papers than typical authors (Student’s t-test, p-value=0.09). d We further compare the fractions of prize-winning papers within all laureates’ early stage single-authored papers and within team-authored papers published in early stages. The fraction of prize-winning papers is much higher among early-stage single-authored papers than for team-authored papers (Chi-squared test, p-value<10-10). The difference is significant for laureates in physics and Chemistry, but we find no significant difference for laureates in medicine. *** p<0.01, ** p<0.05, * p<0.1 and N.S. (not significant) for p>0.1. Error bars represent the standard errors of the mean.
a b
c d

20
Fig. S10 | Joint probability of the top three highest impact works. a-c We measure the joint probability of the top three highest impact works within a career before the Prize. Values greater than 1 indicate two hits are more likely to collocate than random. d-f We shuffle the order of each work in a career while keeping their impacts intact as a null model for a-c. We find clear diagonal patterns, demonstrating that high-impact papers are more likely to cluster together than expected by chance. The diagonal pattern disappears when we shuffle the order of the works.
Fig. S11 | Joint probability of prize-winning papers and the top three highest impact works. a-c We measures the joint probability of a prize-winning paper (for Nobel laureates with multiple prize-winning papers, we take the average; the same below) and the top three highest impact works within a career before the Prize. Values greater than 1 indicate two hits are more likely to collocate than random. d-f We shuffle the order of each work in a career while keeping their impact intact as a null model for a-c. We can find a clear positive correlation between prize-winning papers and the top three highest impact works along the diagonal.

21
Fig. S12 | The distribution of the coefficient of determination 𝑹𝟐. We fit each laureate’s career performance using the hot-streak model, and measure the 𝑅B between the step-function-simulated careers and the real careers of all Nobel winners in our dataset. We find the 𝑅B peaks around 0.75, suggesting the hot-streak model captures the career performance of laureates well.
Fig. S13 | Histogram of the number of hot-streak periods before the Prize. Laureates in all three Nobel fields experience 1.71 hot-streak periods on average (1.51 for physics, 1.85 for chemistry and 1.76 for medicine).
Fig. S14 | Hot-streak duration distribution across different disciplines. a-c We measure the duration distribution of the hot-streak period within careers across different disciplines. The duration peaks at around 5.0, 5.2 and 7.5 years for physics, chemistry and medicine respectively. Dotted lines represent the median hot-period duration, which is 8, 7, and 9 years for physics, chemistry and medicine respectively. d-f We shows the relative duration distribution
for individuals, where T is

22
the career length of each individual. Dotted lines represent the median relative hot-period duration, which hovers around 22%, 20% and 22% for physics, chemistry and medicine respectively.
Fig. S15 | Fraction of first-authored papers of joint hit works. We calculate the laureates’ fraction of first-authored papers of joint hit works before the Prize (a for most-cited papers, b for second-most-cited papers, and c for third-most-cited papers) in comparison with a null model. In this case, we only consider joint-authored papers. For each joint-authored hit work, we choose four joint-authored papers published by the same Nobel laureate with the closest publication time as the null model. To rule out the effect of the prize-winning works, we repeated our measurements by removing the careers of laurates who published their prize-winning work (d for most-cited papers, e for second-most-cited papers, and f for third-most-cited papers). *** p<0.01, ** p<0.05, * p<0.1 and N.S. (not significant) for p>0.1. Error bars represent the standard errors of the mean.
Fig. S16 | Average hit rate of papers published four years before and after the Nobel Prize year. a The solid line indicates the average across all papers in our sample, with the shaded area denoting the standard error of the mean. We find that the average top 1% hit paper rate remains almost the same--roughly 17%--four years before the Prize, then shows a significant drop in the subsequent two years after the Nobel is awarded, reaching 12%, and then slightly increasing by year four. b We also measure the average top 5% hit paper rate change before and after the Prize, which likewise experiences a significant drop in the two years after the Nobel is awarded and a slight increase by year four.
*** **
a
d e f
N.S. N.S. N.S.
N.S. N.S. N.S. N.S. N.S. N.S. N.S.N.S. N.S.
N.S. N.S. N.S.
b c
* *** ***
***** ***

23
Fig. S17 | Impact of papers published four years before and after the Nobel Prize year according to different disciplines. The solid line indicates the average across all laureates in our sample, with the shaded area denoting the standard error of the mean. The Nobel dip is most pronounced in physics, where laureates show a reduced impact of 18.1% in the second year after the Prize, compared with a drop of 4.8% in chemistry and 13.4% in medicine. In chemistry and medicine, laureates experience their most significant dip in the third and first year respectively.
Fig. S18 | Average number of papers published four years before and after the Nobel Prize year according to different disciplines. The solid line indicates the average across all laureates in our sample, with the shaded area denoting the standard error of the mean. In all three disciplines, productivity does not drop significantly after the Nobel is awarded.
Fig. S19 | Nobel dip rate according to different time periods (two years before and after winning Nobel Prize). The average paper impact per paper shows a significant drop in the two years immediately following the Nobel, and these results are robust with respect to different time periods.

24
Fig. S20 | Average impact per paper as a function of career years. a We set the observation window as 4 years and calculate the average impact of papers based on the 4-year citation counts. For each laureate, we exclude all works where the impact measure includes post-Prize citations and compare the average impact of papers published by the laureates in the 4th year before and each of the four years after winning the Nobel. The solid line indicates the average across all laureates in our sample four years before and after the Nobel, as well as the prize winning year, with the shaded area denoting the standard error of the mean. b-c Average impact per paper as a function of career years with the observation windows as 3 years and 2 years respectively.
Fig. S21 | The publication history of Nobel laureate Jean-Marie Lehn by color coding each paper according to the related topic community based on the Infomap community detecting algorithm. The X-axis shows the time series of all the papers published by Nobel laureate Jean-Marie Lehn, and the Y-axis shows the citation for each paper. Each paper is represented by a point and the color corresponds to the topic community in the co-citing network.
Fig. S22 | Comparison of the probability of two papers belonging to the same topic within 4 years before and after the reception of the Prize and a random year. The probability is significant lower after winning the Prize, suggesting Nobel laureates tend to shift research topic
** N.S.** N.S.

25
after winning the Nobel. The change is significant for physics, while there is no significant difference for chemistry and medicine. *** p<0.01, ** p<0.05, * p<0.1 and N.S. (not significant) for p>0.1. Error bars represent the standard errors of the mean.
Fig. S23 | Comparison of the likelihood of laureates shifting to a new topic after winning Prize with random. We measured the likelihood of laureates shifting to a new topic after winning Prize, #�k�j��*��hijkl�*��*���l*�k
#j��*��. Then, we shuffled the topic of the works and repeated the
measurement as a null model, finding that the laureates are much more likely to shift to a new topic after winning Prize than random. The observation is significant for all three fields. *** p<0.01, ** p<0.05, * p<0.1 and N.S. (not significant) for p>0.1. Error bars represent the standard errors of the mean.
Fig. S24 | Average yearly accumulated citation counts of prior topic papers as a function of career years. We focus on laureates’ papers that belong to the prior Prize topics, and measure its yearly accumulated citation counts before and after the Prize. The solid line indicates the average across all laureates in our sample four years before and after the Nobel, as well as the prize winning year, with the shaded area denoting the standard error of the mean.
*** *** *** ***

26
Fig. S25 | Average number of new collaborators before and after the Prize. For each laureate, we calculate the new collaborators each year. The solid line indicates the average across all laureates in our sample four years before and after the Nobel, as well as the prize-winning year, with the shaded area denoting the standard error of the mean.
Fig. S26 | Funding opportunities changing before and after the Prize. a-d Average number of active grants as a function of career years. We only focus on those laureates who participated in at least one active grant project both within 5 years before and after the Prize, thus resulting in 25 Physics laureates, 46 Chemistry laureates and 43 Medicine laureates. The year when the Prize is given is marked as 0. For each laureate, we calculate the active grant number he/she involved in each of the four years before and after the Nobel, as well as the prize-winning year. The solid line indicates the average across all laureates in our sample, with the shaded area denoting the standard error of the mean.

27
Reference
1 Li, J., Yin, Y., Fortunato, S. & Wang, D. A dataset of publication records for Nobel laureates. Sci Data 6, 33 (2019).
2 Liu, L. et al. Hot Streaks in Artistic, Cultural, and Scientific Careers. Nature 559, 396–399, https://doi.org/10.1038/s41586-018-0315-8 (2018).
3 Jones, B. F. & Weinberg, B. A. Age dynamics in scientific creativity. P Natl Acad Sci USA 108, 18910-18914 (2011).
4 Manniche, E. & Falk, G. Age and the Nobel-Prize. Behav Sci 2, 301-307 (1957). 5 Zuckerman, H. The sociology of the Nobel prizes. Sci Am 217, 25-+,
https://doi.org/10.1038/scientificamerican1167-25 (1967). 6 Zuckerman, H. Nobel laureates in science: Patterns of productivity, collaboration, and
authorship. Am Sociol Rev 32, 391-403, https://doi.org/10.2307/2091086 (1967). 7 Zuckerman, H. Scientific Elite: Nobel Laureates in the United States. (Free Press,
1977). 8 Ashton, S. V. & Oppenheim, C. Method of Predicting Nobel Prizewinners in Chemistry.
Soc Stud Sci 8, 341-348, Doi 10.1177/030631277800800306 (1978). 9 Elisabeth, C. (Cambridge: Cambridge University Press, 1984). 10 Garfield, E. Do Nobel-Prize Winners Write Citation-Classics. Curr Contents, 3-8
(1986). 11 Diamond, A. M. Citation counts for Nobel Prize winners in economics. Journal of the
History of Economic Thought 10, 67-70 (1988). 12 MacLachlan, J. Defining physics: the Nobel Prize selection process, 1901–1937.
American Journal of Physics 59, 166-174 (1991). 13 Garfield, E. & Welljams-Dorof, A. Of Nobel class: a citation perspective on high
impact research authors. Theor Med 13, 117-135 (1992). 14 Van Dalen, H. P. The golden age of Nobel economists. The American Economist 43,
19-35 (1999). 15 Rodgers, P. Countdown to the Nobel prize. Phys World 13, 10 (2000). 16 Feldman, B. The Nobel Prize. A History of Genius, Controversy and Prestige/Burton
Feldman.-New York: Arcade Pub (2000). 17 Friedman, R. M. The politics of excellence: Behind the Nobel Prize in science. (Times
Books, 2001). 18 Crawford, E. Nobel population 1901-50: anatomy of a scientific elite. Phys World 14,
31-35 (2001). 19 Crawford, E. Nationalism and internationalism in science, 1880-1939: four studies of
the Nobel population. (Cambridge University Press, 2002). 20 James, I. Singular scientists. J Roy Soc Med 96, 36-39, DOI 10.1258/jrsm.96.1.36
(2003). 21 Friedman, R. M. Is science losing out in the race for recognition? Nature 426, 495-495,
10.1038/426495a (2003). 22 Hirsch, J. E. An index to quantify an individual's scientific research output. P Natl Acad
Sci USA 102, 16569-16572, 10.1073/pnas.0507655102 (2005). 23 Wray, K. B. Scientific authorship in the age of collaborative research. Stud Hist Philos

28
Sci 37, 505-514, 10.1016/j.shpsa.2005.07.011 (2006). 24 Rablen, M. D. & Oswald, A. J. Mortality and immortality: The Nobel Prize as an
experiment into the effect of status upon longevity. J Health Econ 27, 1462-1471, 10.1016/j.jhealeco.2008.06.001 (2008).
25 Gingras, Y. & Wallace, M. L. Why it has become more difficult to predict Nobel Prize winners: a bibliometric analysis of nominees and winners of the chemistry and physics prizes (1901-2007). Scientometrics 82, 401-412, 10.1007/s11192-009-0035-9 (2010).
26 Rodríguez-Navarro, A. Measuring research excellence: Number of Nobel Prize achievements versus conventional bibliometric indicators. Journal of Documentation 67, 582-600 (2011).
27 Mazloumian, A., Eom, Y. H., Helbing, D., Lozano, S. & Fortunato, S. How citation boosts promote scientific paradigm shifts and nobel prizes. Plos One 6, https://doi.org/10.1371/journal.pone.0018975 (2011).
28 Baffes, J. & Vamvakidis, A. Are you too young for the Nobel Prize? Res Policy 40, 1345-1353, 10.1016/j.respol.2011.06.001 (2011).
29 Heinze, T., Heidler, R., Heiberger, R. H. & Riebling, J. New patterns of scientific growth: How research expanded after the invention of scanning tunneling microscopy and the discovery of Buckminsterfullerenes. J Am Soc Inf Sci Tec 64, 829-843, 10.1002/asi.22760 (2013).
30 Chan, H. F. & Torgler, B. Time-lapsed awards for excellence. Nature 500, 29-29, https://doi.org/10.1038/500029c (2013).
31 Azoulay, P., Stuart, T. & Wang, Y. B. Matthew: Effect or fable? Manage Sci 60, 92-109, https://doi.org/10.1287/mnsc.2013.1755 (2014).
32 Liu, Y. X. & Rousseau, R. Citation Analysis and the Development of Science: A Case Study Using Articles by Some Nobel Prize Winners. J Assoc Inf Sci Tech 65, 281-289, 10.1002/asi.22978 (2014).
33 Fortunato, S. Prizes: Growing time lag threatens Nobels. Nature 508, 186, https://doi.org/10.1038/508186a (2014).
34 Wagner, C. S., Horlings, E., Whetsell, T. A., Mattsson, P. & Nordqvist, K. Do Nobel Laureates create prize-winning networks? An analysis of collaborative research in physiology or medicine. Plos One 10, e0134164 (2015).
35 Hansson, N., Fangerau, H., Tuffs, A. & Polianski, I. J. No Silver Medal for Nobel Prize Contenders Why Anesthesia Pioneers Were Nominated for but Denied the Award. Anesthesiology 125, 34-38, 10.1097/Aln.0000000000001099 (2016).
36 Sondhi, S. & Kivelson, S. Time to fix science prizes. Nat Phys 13, 822-822, DOI 10.1038/nphys4246 (2017).
37 Seeman, J. I. Synthesis and the Nobel Prize in Chemistry. Nat Chem 9, 925-929, DOI 10.1038/nchem.2864 (2017).
38 Hansson, N., Halling, T. & Fangerau, H. Nobel nomination letters point to a winning formula. Nature 555, 311, https://doi.org/10.1038/d41586-018-03057-z (2018).
39 Ferry, G. Ribosome reader to Royal Society leader: a biologist’s road to the Nobel. Nature (2018).
40 Weinberg, B. A. & Galenson, D. W. Creative careers: The life cycles of Nobel laureates in economics. De Economist pp, 1-18 (2019).

29
41 Zeng, A. et al. Increasing trend of scientists to switch between topics. Nature Communications 10, 3439 (2019).
42 Rosvall, M. & Bergstrom, C. T. Maps of random walks on complex networks reveal community structure. Proceedings of the National Academy of Sciences 105, 1118-1123 (2008).
43 Hook, D. W., Porter, S. J. & Herzog, C. Dimensions: building context for search and evaluation. Frontiers in Research Metrics and Analytics 3, 23 (2018).
44 Herzog, C., Hook, D. & Konkiel, S. Dimensions: Bringing down barriers between scientometricians and data. Quantitative Science Studies, 1-9 (2020).
45 Orduna-Malea, E., Aytac, S. & Tran, C. Y. Universities through the eyes of bibliographic databases: a retroactive growth comparison of Google Scholar, Scopus and Web of Science. Scientometrics 121, 433-450 (2019).
46 Orduna-Malea, E. & López-Cózar, E. D. Demography of Altmetrics under the Light of Dimensions: Locations, Institutions, Journals, Disciplines and Funding Bodies in the Global Research Framework. Journal of Altmetrics 2 (2019).
47 Mouratidis, R. W. Dimensions. Journal of the Medical Library Association: JMLA 107, 459 (2019).
48 https://www.dimensions.ai/.