elite producer business conference - agweb.com policinski wide screen slides for...elite producer...
TRANSCRIPT

Elite Producer Business Conference Las Vegas, Nevada November 6, 2012
Chris Policinski President and CEO Land O’Lakes, Inc.

Telling Our Story… Listening to the Marketplace

Our Story….
The Great Untold Productivity Story of American Agriculture
50
100
150
200
250
300
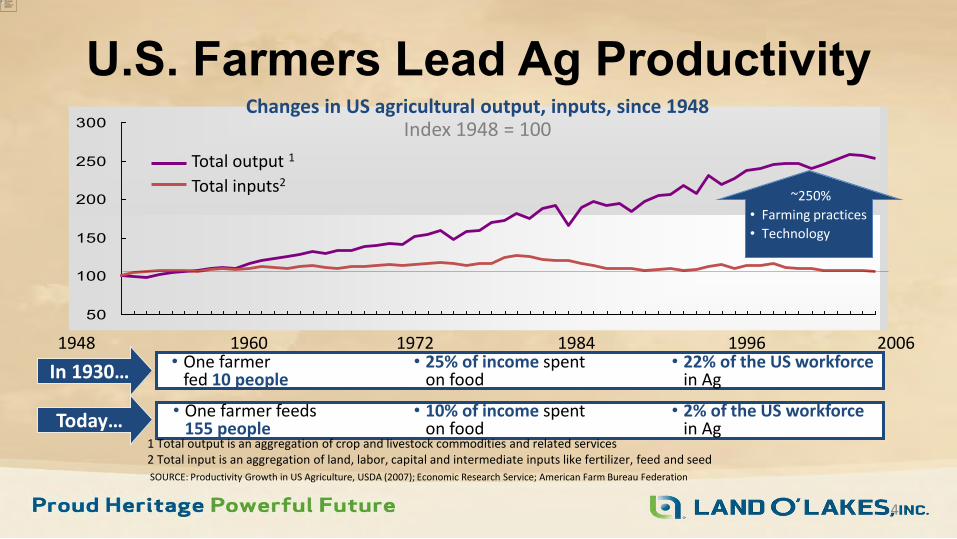
U.S. Farmers Lead Ag Productivity
4
1984 1972 1960 1948 2006 1996
Total inputs2
Total output 1
SOURCE: Productivity Growth in US Agriculture, USDA (2007); Economic Research Service; American Farm Bureau Federation
Changes in US agricultural output, inputs, since 1948 Index 1948 = 100
In 1930…
Today…
• One farmer fed 10 people
• One farmer feeds 155 people
• 25% of income spent on food
• 10% of income spent on food
• 22% of the US workforce in Ag
• 2% of the US workforce in Ag
~250%
• Farming practices
• Technology
1 Total output is an aggregation of crop and livestock commodities and related services 2 Total input is an aggregation of land, labor, capital and intermediate inputs like fertilizer, feed and seed

U.S. Ag Productivity Drivers • Adoption of modern business, production management
practices on the farm • Application of safe, proven agricultural technologies

In Agriculture….Consumer Perceptions
Big = “Bad” Technology = “Scary”

The Great Divide “Good” or “Bad” Agriculture
Large or Small Specialized or Diversified High-Tech or Traditional
Biotech or Conventional or Organic

The Risk of Misperception 98%+ of U.S. population are NOT farmers
8
False perceptions can take root … influencing public opinion Public opinion can quickly become public policy
“Productivity Story” Even More Important…
“The food industry is one of the great growth industries of our era.”
• World population to grow from 6.8 billion to more than 9
billion by 2050
• Global food production will have to increase 70% to meet higher demand
SOURCE: United Nations Food and Agricultural Organization World Food Day 2010

Challenge: Finite / Stressed Resources • There is, at most, 12% more
arable land available globally • Analysts expect only 5% more
land will be cultivated by 2050 • Demand expected to outstrip
water supply by 40% by 2030
SOURCES: OECD-FAO, global water supply/demand model; agricultural production based on IFPRI computed general equilibrium model base case; A Daunting Task, Prof. Robert Thompson (2010)
We will have to produce more with less.
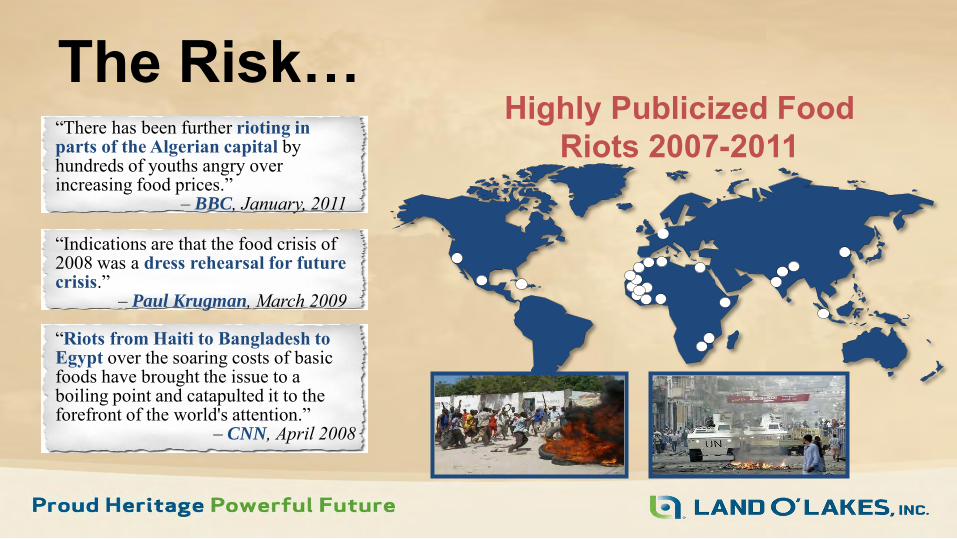
The Risk… “There has been further rioting in parts of the Algerian capital by hundreds of youths angry over increasing food prices.”
– BBC, January, 2011
“Indications are that the food crisis of 2008 was a dress rehearsal for future crisis.”
– Paul Krugman, March 2009
“Riots from Haiti to Bangladesh to Egypt over the soaring costs of basic foods have brought the issue to a boiling point and catapulted it to the forefront of the world's attention.”
– CNN, April 2008
Highly Publicized Food Riots 2007-2011

What Can We Do? 1. Build a fact-based understanding of
agriculture – Advocate … but also educate
2. Listen to messages from the marketplace – Feedback = opportunity to learn / respond – Translate into stronger agriculture and food systems
12

50
100
150
200
250
300
U.S. Farmers Lead Ag Productivity
13
1984 1972 1960 1948 2006 1996
Total inputs2
Total output 1
SOURCE: Productivity Growth in US Agriculture, USDA (2007); Economic Research Service; American Farm Bureau Federation
Changes in US agricultural output, inputs, since 1948 Index 1948 = 100
In 1930…
Today…
• One farmer fed 10 people
• One farmer feeds 155 people
• 25% of income spent on food
• 10% of income spent on food
• 22% of the US workforce in Ag
• 2% of the US workforce in Ag
~250% • Farming
practices • Technology
1 Total output is an aggregation of crop and livestock commodities and related services 2 Total input is an aggregation of land, labor, capital and intermediate inputs like fertilizer, feed and seed

14
SOURCE: FAO Expert Meeting on How to Feed the World in 2050 (2009)
Arable land expansion / cropping intensity
Yield increases via technology / management
practices
Sources of growth in crop production, 2005-2050 Percent
Advances in production practices and technology are needed to achieve the yields the world requires
23%
77%
Advanced Management Practices, Technology Are THE Most Essential Productivity Levers
Need Size / Technology to Feed 9 Billion!

“The world has the technology,
either available or well-
advanced in the research
pipeline to feed a population of
10 billion people.
The more pertinent question
today is whether farmers and
ranchers will be permitted to use
this new technology.”
Dr. Norman Borlaug

Listen to Messages From the Marketplace
Feedback =
Opportunity to Learn / Respond

Stewardship / Sustainability No one has a greater stake in good
stewardship of the environment and sustainable agricultural practices
than the farmer.

Productivity Drives Sustainability!
• 2007 vs. 1944: per gallon of milk, dairy farmers used – Only 10% of the land – Only 35% of the water resources
• 2007 vs. 1944: per gallon of milk, dairy
farming generated – Only 24% of the manure – Only 43% of the methane
cattlenetwork.com July 7, 2010 Megan Pierce, Dairy Herd Magazine

1930 – 2010 650% more corn… on 13% fewer acres
Source: USDA Economic Research Service
Productivity Drives Sustainability!
Responding to the “Green” Message
The facts are very friendly!
Productivity = Authentic Sustainability

And… Go on the offensive to improve
sustainability performance in agriculture

Let’s talk about production agriculture not only in output or
economic terms … but also in
environmental terms.

Animal Welfare Message
The public wants and demands, responsible animal care.
Undercover video shows abuse of sick cows – USDA begins investigation to discover if ‘downer cows’ may have ended up in school lunches
CBS News
Animal rights group’s video depicts abuse of chickens at egg farms
San Francisco Chronicle

The Irony of the Animal Welfare Debate
Most farmers are very sensitive to animal well-being and already operate at a high standard.
“I have my life invested in my farm and my animals … of course, I want to
provide the best care I can … they are the future of my operation.”
“Quality care is in my best interests, healthy animals are more productive. It makes economic sense and it’s just the right thing to do.”

Responding to the Animal Welfare Message
Most farmers are sensitive to animal care issues … but not all
We must advocate … the industry must adopt formal animal care standards … and
self enforce

Food Safety / Quality Message
The public wants assurances that
the food they purchase is safe and healthful.

Food Safety / Quality Reality = Perception
“The American food supply is the safest in the world, thanks to industry and government efforts.”
Dr. Jean Weese, PhD., Professor and Food Scientist Extension Specialist,
Auburn University

Recalls Create Concern
Food Safety / Quality There is not “good” versus
“bad” food based on the type of agriculture…
just different food.

There is Not Just One Nutritious Food Supply
30
SOURCE: Nutritional quality of organic foods: a systematic review (The American Journal of Clinical Nutrition, 2009)
1 A statistically significant (at P=0.05) difference in the reported mean nutrient counts of conventionally and organically produced foodstuffs
2 Due to an insufficient number of studies to compare nutrient content for specific foodstuffs, nutrient categories were compared across all studies. Only nutrient categories reported in 10 or more studies were included in this analysis
Higher concentrations in organic or conventional crops?1,2
Based on a review of selected studies between Jan 1958-Feb 2008
Nitrogen
Titratable acidity
Phosphorus
Magnesium
Calcium
Vitamin C
Potassium
Zinc
Total soluble solids
Copper
Phenolic compounds
Nutrient Conventional Organic No difference
A review of 55 available studies indicates that organic and conventional foods have similar nutrient content
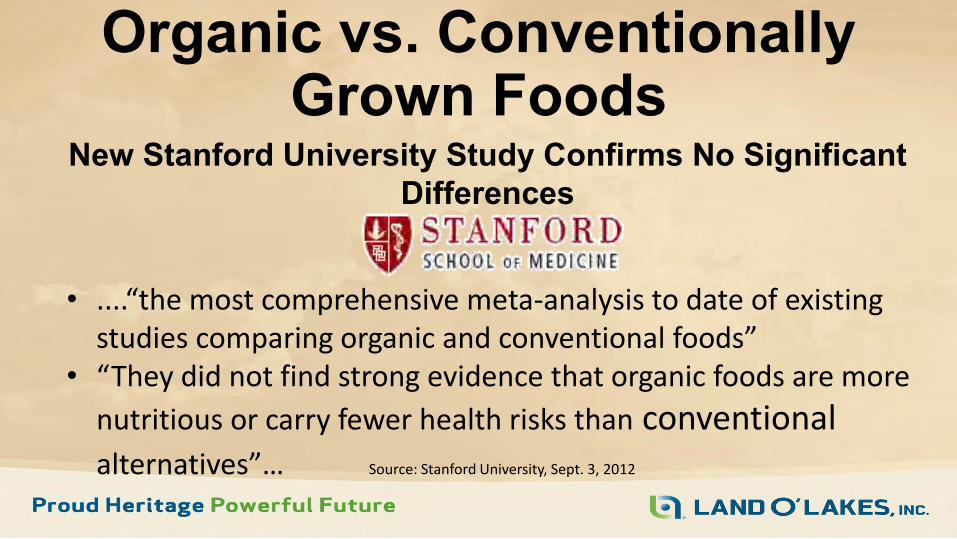
Organic vs. Conventionally Grown Foods
New Stanford University Study Confirms No Significant Differences
• ....“the most comprehensive meta-analysis to date of existing studies comparing organic and conventional foods”
• “They did not find strong evidence that organic foods are more
nutritious or carry fewer health risks than conventional alternatives”… Source: Stanford University, Sept. 3, 2012

Call to Action
1. Tell our story Advocate Educate
2. Listen to the marketplace Learn Respond

Co-existence and Choice Large and Small
Specialized and Diversified
High-Tech and Traditional
Biotech, Conventional and Organic

Conclusion:
Large-scale farms driven by science and technology, connected to consumers through global supply chains
Small-scale farms connected to
consumers through local
food networks
AND
Meet global food demands Keep local/rural communities and infrastructure vibrant
Future Success will be Driven by Co-existence and Choice

Food Security Economic Security Political Security
We Have To Get This Right!

THANK YOU!