schwartz eyalberman dror instructor : dr. danny barash
TRANSCRIPT

Schwartz Eyal Berman Dror
Instructor : Dr. Danny Barash

• RNA overview
• RNA secondary structures prediction
• Genetic Algorithm
• Using GA in our project
• Results
• A look into the future
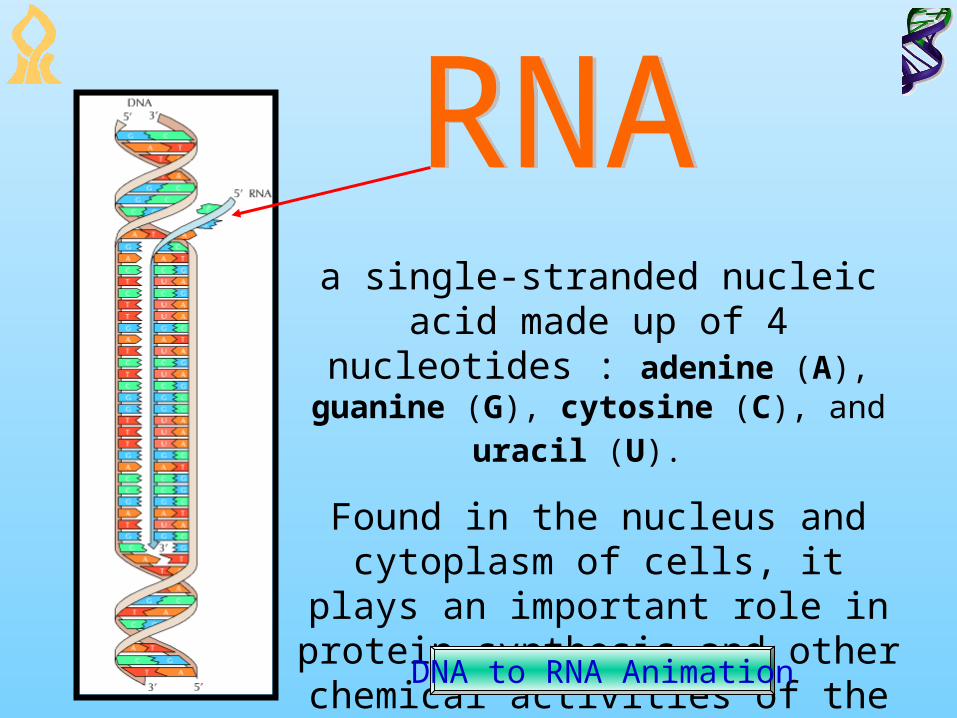
a single-stranded nucleic acid made up of 4 nucleotides : adenine (A), guanine
(G), cytosine (C), and uracil (U).
Found in the nucleus and cytoplasm of cells, it plays an important role in
protein synthesis and other chemical activities of the cell
DNA to RNA Animation
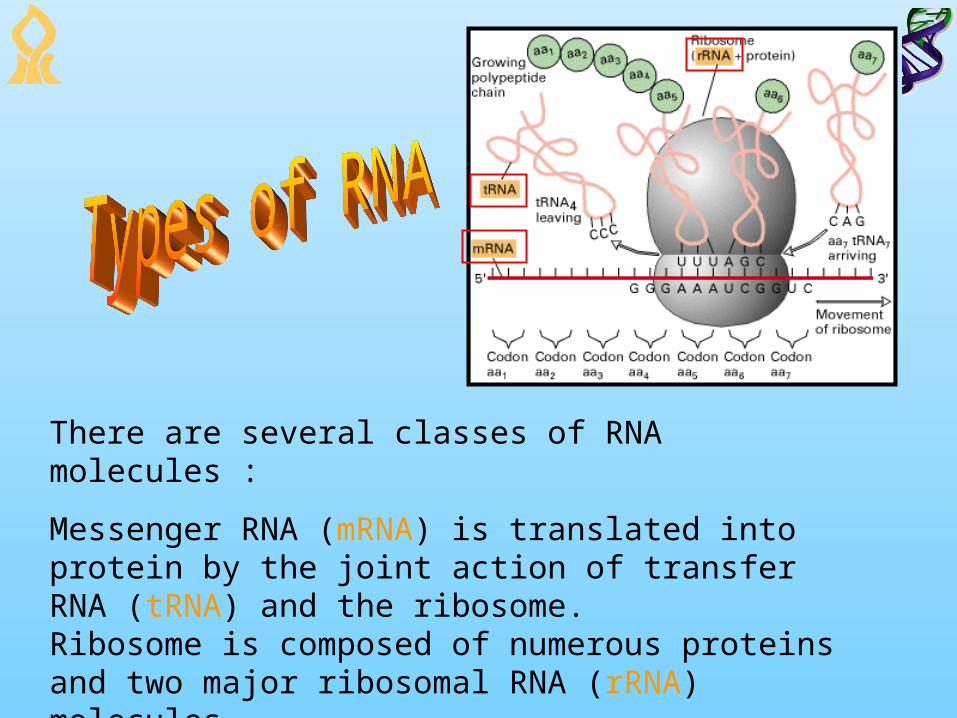
There are several classes of RNA molecules :
Messenger RNA (mRNA) is translated into protein by the joint action of transfer RNA (tRNA) and the ribosome.Ribosome is composed of numerous proteins and two major ribosomal RNA (rRNA) molecules.Other small RNAs (smRNA) exists, serving a great variety of purposes.

a) Stem-loops, hairpins, and other secondary structures can form by base pairing between distant complementary segments of an RNA molecule.
b) Interactions between the flexible loops may result in further folding to form tertiary structures such as the pseudoknot.

RNA Folding by Energy MinimizationRNA Folding by Energy Minimization
One way for RNA structure prediction is to assign an energy to each base pair in a secondary structure. That is, there is a function e such that e(ri,rj) is the energy
of a base pair. The energy of the entire structure, is then given by:

A) optimally folded according to a criterion of lowest free energy using the FOLD algorithm of Zuker and Stiegler
B) Suboptimal folding using the same algorithm but imposing the biochemically mandated constraint that the adenines at positions 39 and 53 (color) should not be base paired.
G = -46.5KJ
G = -43.44KJ

Vienna RNA Package – using RNA fold
The Zuker Group - using mfold
to predict secondary structure:
Input : RNA Sequence
Output : Predicted structure, based on the lowest energy values for this sequence, energy values of optimal and sub-optimal solutions.

What are we looking for ?Natural RNA’s
P5abc - Sub Domain
Our goal is to predict Natural RNA’s Using Evolutionary Computation

So…what is the problem?
If we are looking for RNAs that will minimize a certain function - we have to many options.
For a small size RNA of 56 nucleotides, there are 456!!! possible sequences.
NP-complete!
Solution… Genetic algorithm

A genetic algorithm is an optimisation algorithm based on the mechanisms of Darwinian evolution which uses random mutation, crossover and selection procedures to breed better models or solutions from an originally random starting population or sample

1. [Start] Generate random population of n chromosomes (suitable solutions for the problem)
2. [Fitness] Evaluate the fitness f(x) of each chromosome x in the population 3. [New population] Create a new population by repeating the following steps
1. [Selection] Select two parent chromosomes from a population according to their fitness
2. [Crossover] With a crossover probability cross over the parents to form new offspring (children). If no crossover was performed, offspring is the exact copy of parents.
3. [Mutation] With a mutation probability mutate new offspring at each position in chromosome.
4. [Accepting] Place new offspring in the new population
4. [Replace] Use new generated population for a further run of the algorithm 5. [Test] If the end condition is satisfied, stop, and return the best solution in
current population 6. [Loop] Go to step 2

Our population – a random group of RNA’s, each consists of 56 nucleotides
Population

SelectionSelecting parent chromosomes from a population
according to their fitness – the better fitness, the
bigger chance to be Selected.
Roulette Wheel Technique

• A certain probability exists that two selected organisms will actually breed
• Organisms can mate or propagate into the next generation unchanged
• Crossover results in two new child chromosomes, which are added to the new generation
Cross-Over
For example:accguaccgucugagccgguagaagccguaggggcaguaguc
Cross-over
accgucguaggggcaguagucgaagcaccgucugagccggua

Types:• Transition• Transversion
Mutation
Transition / Transvertion Rate is 2:1
G U
CA
acguggcgaggugccggcuac
Mutation
acgaggcgaggugucggcuac
For example:

• Each Generation a certain amount of the fittest individuals are past to the next generation unchanged.
• This principle is proven to provide better and faster results
Elitism

0 : GATGTCTCAAATGCAAAAACTTGCATCAGGTAGGTCAGGAGGTATTATTCATAGAA1 : GCAATTACGTGGCAGTGCACAAAACATCTTCCAGCTCCATCGCGGTGAAGCCGCCA2 : CACATTCTCGGGAGGCATTGTCGTTTAGACGCCTGAGTTTGCGGTATTTGCGATGT3 : GGCGATACTGGCCCCTTTCGTAGGTTCTTTGCCAACTATGGCATGCTCAAATCGCA4 : CGTACCGTCGACGTTAATTTAGAATATAGCAATTACAGAGAATGAGGAGGTGAATT5 : AGTTTTTTGTATGACGAACAGTCACATGAGCCACAAATTTGTGATTTTTAACTCGC6 : CCTGTATTCTTGGGCACTCAGAACAAGTCAAGCTAAATACGTTAGACTTGACGAGG7 : ACCCCGTTCATCTTTGTGGCTTAGCAATAGCATTCCCCAGCTAATTGGCCTAATTG8 : ATCACTCCGGGTTGCACCCAATGGACGCCCTCAACGTGTCCCAATGCATGCACTGG9 : CATGGGTGGAAGTTTAAAATGCACTCCCATTCAGTGAGAGTCAGAAGCAGAGAATT10 : CCAGATTACTGCCTAAAAGAAACATGGTGGGATTGTGCAAAGCGCCGCGCGGCTTA11 : CCTATGAGCGGTTGTAACGGGATACCTTCGTGTTGTCGCGATCACCAGGGAAGTCA12 : CATGGGACCTAGCGAGCGGTTGCCACCGAGGCGCTAAAGCTGAAAAGGGACCGGGG13 : TACTGTCCCACCATGTGGAGTGACTCTCTCAGCCGAATCCTGGAGCTATTGGGTAC14 : ATGAAGGGTAGATTCTCATTCGTAGGTACTCCGTCGGAACAGCACTTTTGGAAGAG15 : ATGCGTGATATCATGAGAATTTGGCCGGTGATGTAAGGCCGAGGTCTCCTCATTGA16 : AAGTGTGAGGCACGGTGAGCCCTGAAGTTAAAAGTTCGTTAAACGGCAGTGAACGA17 : CCAACAAGGACAGATGCTATCCAAAGAATGAATAACACTTCATTAGCCGCCTGCTG18 : TTGGGTGCTGGATCTACGTGACTGGAGCCCTACGGTCAAATTAGATTGCGAGTTAG19 : AGTCAGGCAAACCAGATGGAGCGTAGCTCGCCAATATCCTCCCGGTGCCCCTGTTG20 : CAGTGTATATTTACGGGTAAGTGAATTGTGCATTTCGAAGTACACAGTTGAGCGGC21 : CCAAACCTAAAGACCACGAGGGCGACAGTGTCTTCTAGGATTTTAATCGTTCCATG22 : GTACCTGATAATGGACCTCCTAGCACGCGCTAATCCTAGGAGCGACAGACTTCGCC23 : TTTCCGCCGTTCTCTTTACTGCCGGCGATTCGGAATTCCCAAGTCCGACATTCCGA24 : GAACTCTCGTCCCGGCGACTCTTGTGGCTACCACGTGGAACCCGTTACTCAAATTA25 : GCCCCGTCTCACTAGCGTTCTTTGATTCTGCCTGGAACCTTCAGCGTTGTCCGATT26 : TGAGACTTTGTTTAGGCGCTCAGTTTAGTTCTGCCGGCGCTCAGGGCTAGGCGCAG27 : AAAAACTGGAAACGCAACTGTACTGACACCGCGGCGTAACCACGTGTTTGCGGGGA28 : GTATATCGCGACTAGACAGAGCTGTAACGGCCCGAGCCAGACTTCGTGGCGATCGG29 : CTAACCCTTCCATCTTGGGAACGGGCTCGCAAAAAGCCCCGGCCTAAGTGGTTAGG
Average fitness : 12.468
Fitness of 33.04
First Elite PickRNA No. 12
Second Elite PickRNA No. 25
Fitness of 24.06
The Danger : Converging into a local minima
Elitism

Fitness Function – Naïve ApproachMain Idea : going for the lowest free energy value
RNA’s with very low energy value
Fitness(RNA) = Min_Energy(RNA)
The Resultsbut without biological value

• Fitness function based just on Minimum Energy functions tend to converge into un-natural structures
• The output sequences consists mainly of C-G nucleotides bonds which leads to very rigid low energy structures
• The GA Algorithm works well – BUT the Fitness Function is not suitable
Conclusions
Fitness Function – Naïve Approach

• Research had studied the optimal vs. Suboptimal solutions
• The results shows that in Nature RNA’s :– Best Sub-Optimal Solution ~ 95% of the Optimal
Solution
– Usually there is only a few stable sub-optimal solution
– The RNA structure energy is low though enables a certain energy freedom – meaning not too low and rigid
Fitness Function – Different Approach

Building the fitness function :
• Consisting of the three former conditions, the core fitness function is built to converge towards Natural RNA’s sequences
• The parameters can be set so that each component may have a different importance
Fitness Function – Different Approach

#1 : Number Of Structures
Fitness Function – Different Approach
Based on Three Components
The Idea : there are significantly fewer Sub-Optimal structures close to the optimal structure in natural RNA sequences than in random sequences
Outcome : higher values of fitness will be given as a sequence converges into having few structures within this range
Comment : usually more than one structure appears

#2 : Minimum Energy Structure
The Idea : The ground state free energies of natural RNA sequences are significantly lower than those of random sequencesimplementation : A structure will have higher fitness as it’s optimal structure has lower energyCaution : as a structure needs to function, it can’t be too rigid (look at the naive approach). We take this into our consideration and try to put it in the right proportion
Fitness Function – Different Approach

Fitness Function – Different Approach
#3 : 5 percent ∆
The Idea : natural RNA’s first Sub-Optimal solution, statistically has energy value of around 95 percent of the optimal structure energy
Implementation : A structure will have higher fitness as its first Sub-Optimal structure energy value is closer to the 95% of the optimal one
|(95% optimal solution) – (first sub-optimal solution)| ~ 0

Fitness Function – Different Approach
Combining the components
Fitness (RNA) =
P_A * (No. of Sub-Optimal Solutions) +
P_B * (Minimum Energy) +
P_C * |(95% Optimal) – (first Sub-Optimal)|
Each Parameter reflects the relative importanceof its component in the fitness function
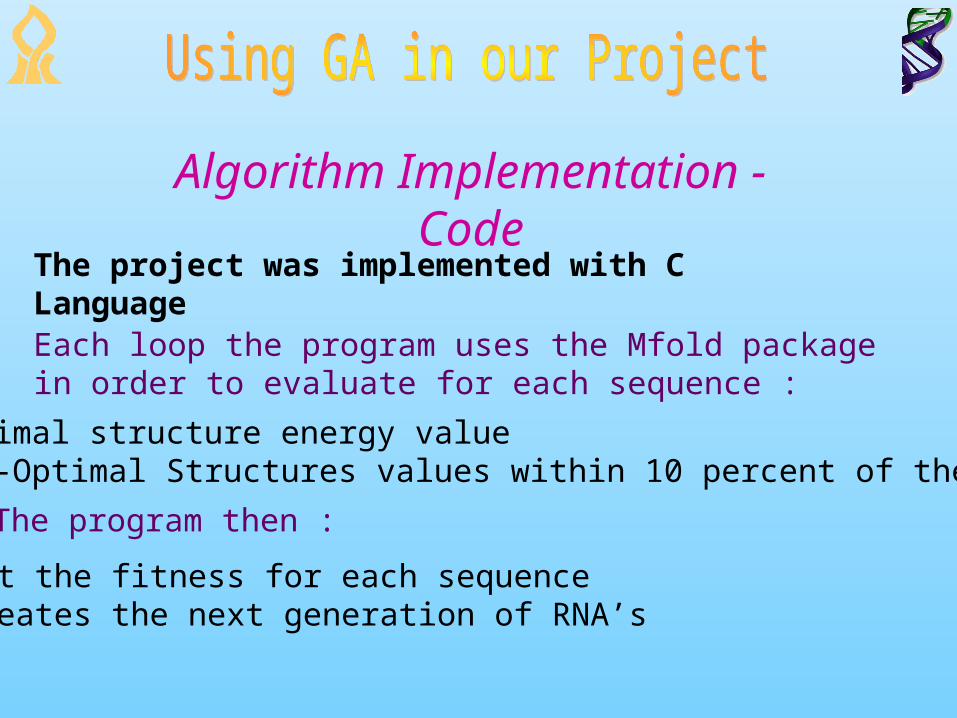
Algorithm Implementation - Code
The project was implemented with C Language
Each loop the program uses the Mfold package in order to evaluate for each sequence :
• Set the fitness for each sequence• Creates the next generation of RNA’s
The program then :
• The optimal structure energy value• All Sub-Optimal Structures values within 10 percent of the optimal

So… Does It Work ?
Natural RNA – P5abc Sub-Domain Predicted RNA after 200 Generations
The Truth Is Out There ..

Run #1
• 2 structures (best)• 5% difference (best)• low energy structure (average)
Example Runs
Number of RNA’s in the population = 30 Number of Generations = 300RNA length (number of nucleotides) = 56 Elite Size = 2
GGCAGGATCGAAGTGCTCGACCTGTAACCCAGGTGTGCGTTGTGCCTAGCTAGGGG
Output Sequence :
Run Parameters :
Analyzing Sequence using MfoldStructure 1 : Initial dG = -20.0 kcal/moleStructure 2 : Initial dG = -19.0 kcal/mole
Conclusion
The GA has produced sequence that fits well with our demands

Run #1 – Output Sequence Structures

Run #2
Evidence of quick convergence – Local Minima
Run Parameters :RNA length (number of nucleotides) = 56Number of RNA’s in the population = 30 Elite Size = 3
First Examination : After 15 Generations
Output Sequence :TTATGTGAGACCGGGGGCATCAGCGAGTTGTGCTCCGACCGGTCTCTAGGGCGCGA
Analyzing Sequence using MfoldStructure 1 : Initial dG = -22.2 kcal/mole Structure 2 : Initial dG = -21.1 kcal/mole
• 2 structures (best)• 5% difference (best)• low energy structure (average)
10%

After 15 Generations
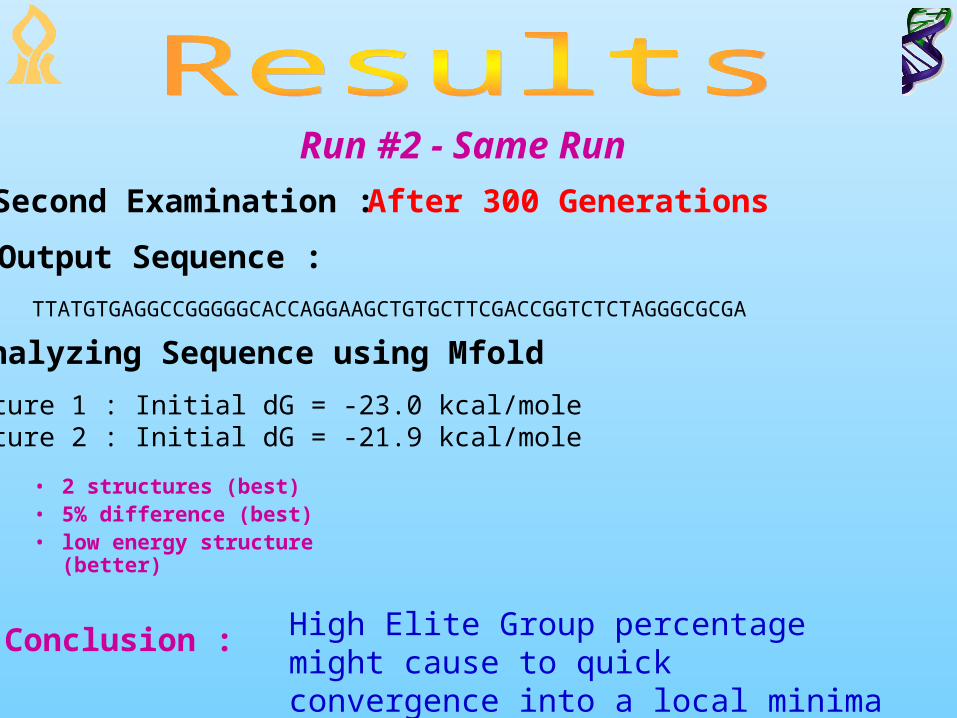
Second Examination : After 300 Generations
Output Sequence :
TTATGTGAGGCCGGGGGCACCAGGAAGCTGTGCTTCGACCGGTCTCTAGGGCGCGA
Analyzing Sequence using Mfold
Structure 1 : Initial dG = -23.0 kcal/mole Structure 2 : Initial dG = -21.9 kcal/mole
• 2 structures (best)• 5% difference (best)• low energy structure (better)
Conclusion : High Elite Group percentage might cause to quick convergence into a local minima
Run #2 - Same Run

Structure After 300 Generations
Quick Convergence
Refinements
Run #2

Run #3 – Proportions Changed
• 2 structures (best)• 7% difference (average)• low energy structure (fits tRNA)
Number of RNA’s in the population = 40 Number of Generations = 300RNA length (number of nucleotides) = 56 Elite Size = 1
Run Parameters :
AGGGGAACACACAACAGGACCCCCGCGACCCATACCTTCATTAGTGCTTCCCTTGA
Output Sequence :
Analyzing Sequence using MfoldStructure 1 : Initial dG = -12.1 kcal/moleStructure 2 : Initial dG = -11.2 kcal/mole
Conclusion
GA has produced sequence fits wellwith tRNA energy values average
Overlooking lower energies – consisting just 15% of the fitness function

Run #3 – Output Comparisons
Predicted RNA after 200 Generations Natural RNA – tRNAPHE

• Predicting natural RNA’s can be done quite well using Evolutionary Computation
• The basics of getting good results lies in a proven & balanced fitness function
• Using several arguments within the fitness function, one should set the right relative proportion between them

Running the GA with different parameter values and Analyzing the
results
Changing the heart of the program
The Fitness Function:The Fitness Function:
1. Structural Changes caused by Point Mutations
2. RNA Data-Base as a key for constructing a new RNA

Dr. Danny Barash
Nir Dromi Assaf Avihoo Adaya Cohen