scenarios of future california water demand through · pdf filescenarios of future california...
TRANSCRIPT

Scenarios of Future California Water Demand Through 2050 Growth and Climate Change
August 2014
Topic: Data and Analytical Tools Scenarios of Future California Water Demand Through 2050
CA Water Plan Update 2013 Vol 4 Reference Guide Page 1
ii
This page left blank intentionally
Topic: Data and Analytical Tools Scenarios of Future California Water Demand Through 2050
CA Water Plan Update 2013 Vol 4 Reference Guide Page 2
iii
This Document was Prepared By:
Mohammad Rayej
Senior Water Resources Engineer Department of Water Resources
with assistance from
Rich Juricich
Principal Water Resources Engineer Department of Water Resources
Tom Hawkins
Senior Land and Water Use Scientist Department of Water Resources
Morteza Orang
Senior Land and Water Use Scientist Department of Water Resources
Salma Kibrya
Research Program Specialist II (Demography) Department of Water Resources
Marla Hambright
Research Program Specialist I (Demography) Department of Water Resources
Vivian Gaxiola
Student Assistant (Engineering & Architecture) Department of Water Resources
Topic: Data and Analytical Tools Scenarios of Future California Water Demand Through 2050
CA Water Plan Update 2013 Vol 4 Reference Guide Page 3

iv
Table of Contents
Table of Contents ....................................................................................................................... iv
Figures ....................................................................................................................................... vi
Tables ....................................................................................................................................... vii
1 Introduction .......................................................................................................................... 1
2 Development of Narrative Scenarios .................................................................................... 1
2.1 What are Scenarios ...................................................................................................... 1
2.2 Why use Scenarios ....................................................................................................... 2
2.3 Development of Narrative Scenarios for Update 2013 ................................................... 2
2.4 Growth Scenarios for Update 2013 ............................................................................... 3
2.5 12 Scenarios of Future Climate Change........................................................................ 5
3 Detailed Description of Water Demands Factors .................................................................10
3.1 Indoor Water Demands for Municipal, Commercial, and Industrial Sectors ..................11
3.1.1 Population .............................................................................................................11
3.1.2 Housing and Housing Density ...............................................................................11
3.1.3 Commercial and Industrial Employment ................................................................12
3.2 Outdoor Urban Water Demand for Municipal, Commercial, and Large Landscapes .....12
3.3 Urban Water Use Conservation ...................................................................................12
3.4 Agricultural Water Demand ..........................................................................................12
3.5 Agricultural Water Use Efficiency .................................................................................13
4 Application of WEAP Model to Quantify Future Water Demands .........................................13
4.1 Selection of an Analytical Framework ..........................................................................13
4.2 WEAP Model Overview ................................................................................................14
4.3 Quantifying Water Demands in WEAP .........................................................................15
4.3.1 Single & Multi-family Residential ...........................................................................15
4.3.2 Commercial ..........................................................................................................17
4.3.3 Industrial ...............................................................................................................17
4.3.4 Large Landscape ..................................................................................................17
4.3.5 Agricultural Water Demand ...................................................................................18
5 Results of Future Water Demands through Year 2050 ........................................................18
6 Conclusions ........................................................................................................................22
7 References ..........................................................................................................................22
Topic: Data and Analytical Tools Scenarios of Future California Water Demand Through 2050
CA Water Plan Update 2013 Vol 4 Reference Guide Page 4

v
Appendices ...............................................................................................................................24
Appendix 1 North Coast ....................................................................................................24
Appendix 2 San Francisco Bay ..........................................................................................27
Appendix 3 Central Coast ..................................................................................................30
Appendix 4 South Coast ....................................................................................................33
Appendix 5 Sacramento River ...........................................................................................36
Appendix 6 San Joaquin River ..........................................................................................39
Appendix 7 Tulare Lake .....................................................................................................42
Appendix 8 North Lahontan ...............................................................................................45
Appendix 9 South Lahontan ..............................................................................................48
Appendix 10 Colorado River ..............................................................................................51
Topic: Data and Analytical Tools Scenarios of Future California Water Demand Through 2050
CA Water Plan Update 2013 Vol 4 Reference Guide Page 5
vi
Figures
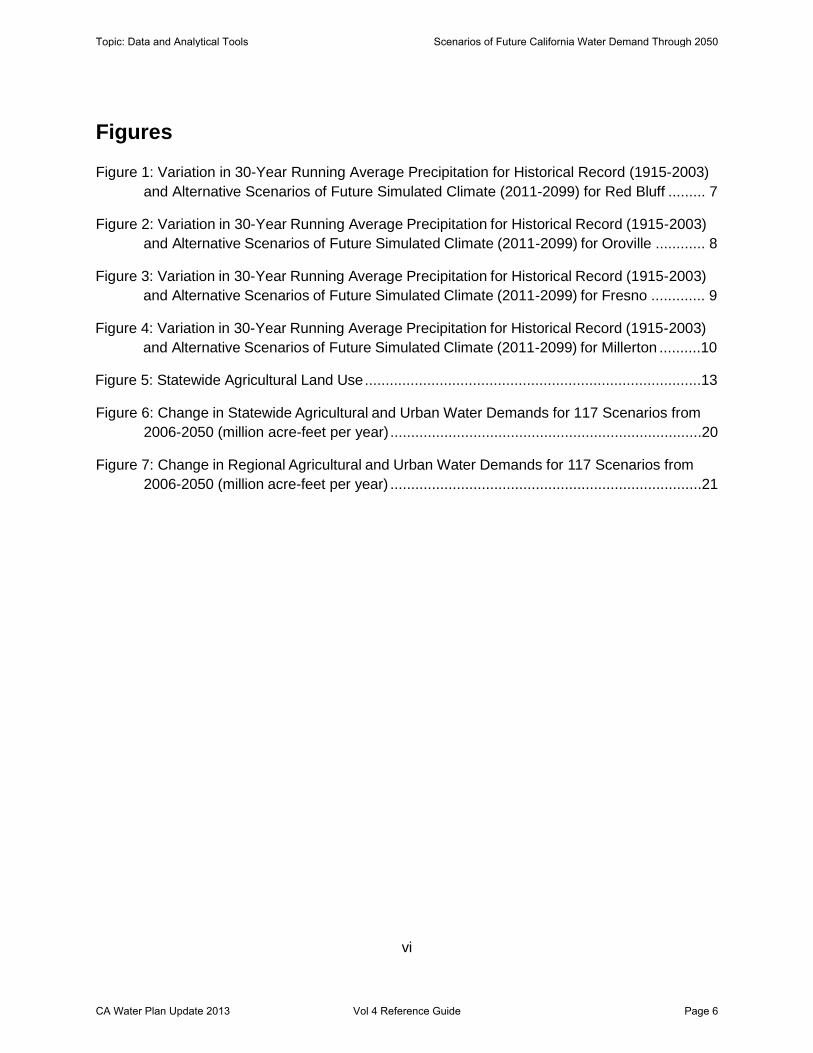
Figure 1: Variation in 30-Year Running Average Precipitation for Historical Record (1915-2003) and Alternative Scenarios of Future Simulated Climate (2011-2099) for Red Bluff ......... 7
Figure 2: Variation in 30-Year Running Average Precipitation for Historical Record (1915-2003) and Alternative Scenarios of Future Simulated Climate (2011-2099) for Oroville ............ 8
Figure 3: Variation in 30-Year Running Average Precipitation for Historical Record (1915-2003) and Alternative Scenarios of Future Simulated Climate (2011-2099) for Fresno ............. 9
Figure 4: Variation in 30-Year Running Average Precipitation for Historical Record (1915-2003) and Alternative Scenarios of Future Simulated Climate (2011-2099) for Millerton ..........10
Figure 5: Statewide Agricultural Land Use .................................................................................13
Figure 6: Change in Statewide Agricultural and Urban Water Demands for 117 Scenarios from 2006-2050 (million acre-feet per year) ...........................................................................20
Figure 7: Change in Regional Agricultural and Urban Water Demands for 117 Scenarios from 2006-2050 (million acre-feet per year) ...........................................................................21
Topic: Data and Analytical Tools Scenarios of Future California Water Demand Through 2050
CA Water Plan Update 2013 Vol 4 Reference Guide Page 6

vii
Tables
Table 1: Conceptual Growth Scenarios ...................................................................................... 3
Table 2: Growth Scenarios (Urban) — Statewide Values ........................................................... 4
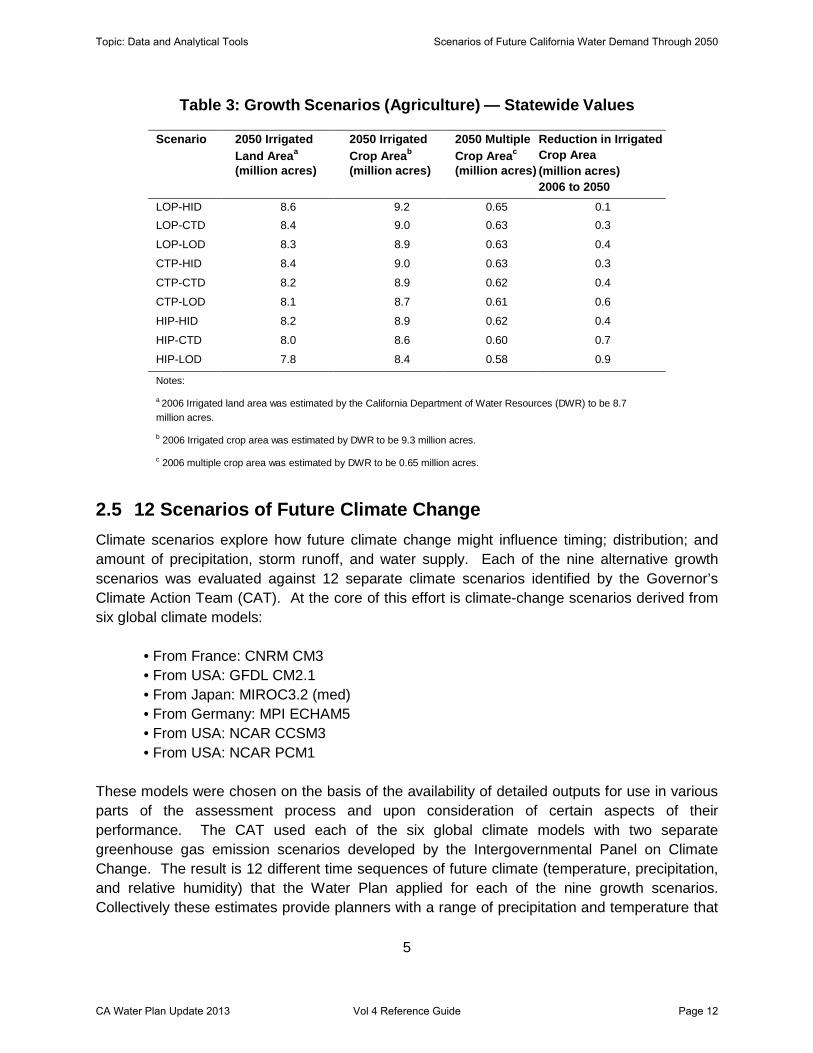
Table 3: Growth Scenarios (Agriculture) — Statewide Values .................................................... 5
Table 4: Growth Scenarios (Demographic) — Statewide Values ...............................................11
Table 5: Elasticity Factors Used in Demand Calculation ...........................................................16
Topic: Data and Analytical Tools Scenarios of Future California Water Demand Through 2050
CA Water Plan Update 2013 Vol 4 Reference Guide Page 7

1
1 Introduction
This paper describes the application of future scenarios for Water Plan Update 2013 (DWR 2013) to quantify future water demand for California and our 10 hydrologic regions out to the year 2050. Starting with the publication of California Water Plan Update 2005 (DWR 2005), DWR has applied the concept of scenarios to describe future water management conditions. Scenarios are used to capture a broad range of uncertain factors that affect water management that are considered to be beyond the control of water managers. For Update 2013 scenarios were organized around narrative themes of growth and climate change, which were then quantified using factors about future population growth, housing densities, land use patterns, and climate. For Updates 2005 and 2009, DWR attempted only to quantify future water demand management strategies at the hydrologic region scale. The hydrologic regions are large areas of tens of thousands square miles, too large to compute meaningful information on regional water management actions. But in parallel to the hydrologic region scale analysis as in current Update 2013, DWR has been pursuing a longer term project, to perform a more complete hydrologic analysis at the finer planning area scale. Results and analysis of planning area water management strategies is given in a separate report. In addition to this paper, background information on the application of scenarios can be found in Chapter 5 and 6 of Update 2013. Chapter 5 provides information how scenarios are used to quantify water management uncertainty. Chapter 6 describes DWR’s efforts to effect long term improvements in data and analytical tools to support the Water Plan.
2 Development of Narrative Scenarios
2.1 What are Scenarios Scenarios have been used for planning purposes for many years. In his book, The Art of the Long View, Peter Schwartz (1991) describes the roots of scenario planning by the U.S. Air Force during World War II. From there it was increasingly adopted for business management, most notably beginning in the 1970s by Royal Dutch/Shell.
As applied for the Water Plan, scenario analysis is similar to sensitivity analysis, in which the values of important factors are varied to test their effects upon the system being analyzed. However, in scenario analysis groups of factors are tested together in an organized way. Each scenario includes factors that support a given theme or story. For this Water Plan scenarios are organized around themes of population growth and development patterns, which are used to characterize a range of uncertainty surrounding future water demand. Growth scenarios are then evaluated under several scenarios reflecting future climate change. Ultimately scenarios
Topic: Data and Analytical Tools Scenarios of Future California Water Demand Through 2050
CA Water Plan Update 2013 Vol 4 Reference Guide Page 8

2
are used to test the robustness of strategies by evaluating how well strategies perform across a wide range of possible future conditions.
2.2 Why use Scenarios Scenarios help to plan for future uncertainty, and planning for future water management is inherently uncertain. Particularly in California which has high population growth in many areas, a robust agricultural sector, and diverse ecosystems. Adding to this uncertainty is the effect of future climate change on the timing, distribution, and amount of precipitation and water requirements. Together these uncertainties often cloud the public dialogue surrounding future water management responses. For example, it is not unreasonable for the public to question if the future additional water demands forecasted by a water agency could be reduced or eliminated with alternative development patterns or additional water conservation. Scenarios enable planners to organize the different factors driving future water demand and supply according to different assumptions about population, development patterns and climate change. In turn, alternative water management responses can be tested under the different scenarios and evaluated for robustness, sustainability, economic costs, benefits and other performance measures.
2.3 Development of Narrative Scenarios for Update 2013 The purpose of developing narrative scenarios is to encourage decision makers and the public to think holistically about the factors affecting water management. This includes those factors that are not widely considered today, but that could have profound implications for future water management. For example, 15 years ago it was unthinkable by many to consider future climate change in water management planning, but today it is considered a requirement by most water managers. A key role of the narrative scenarios is to develop storylines about the future before undertaking the technically challenging work of quantifying the many factors that can affect the future. The Water Plan organized uncertain factors around the following categories:
• Economic and financial • Institutional and political • Natural systems • Technological • Social practices
The Water Plan developed scenarios using the same collaborative approach applied to the Water Plan as a whole. This included an iterative process of vetting scenario narratives with Water Plan stakeholders. For Update 2009 and 2013 a series of workshops were conducted with the key advisory groups for the Water Plan. These included the State Agency Steering Committee, the statewide policy Advisory Committee, Regional Forums, and the Statewide Water Analysis Network, SWAN. SWAN serves as the technical advisory group for the Water Plan. Workshops were conducted for preparation of Update 2009 to develop the bulk of
Topic: Data and Analytical Tools Scenarios of Future California Water Demand Through 2050
CA Water Plan Update 2013 Vol 4 Reference Guide Page 9

3
narrative scenarios during the second half of 2007, followed by workshops discussing the quantification of scenarios in 2008, and refinement of both the narratives and quantification occurring in 2009. For Update 2013, most of the efforts were devoted to refine growth scenarios by including variations of housing densities to the mix of population growth scenarios as explained below. Activities included developing agricultural and urban land use footprints based on population, infill percentage, housing lot sizes, employees per household and other factors used in UPlan model.
2.4 Growth Scenarios for Update 2013 Growth scenarios characterize a range of uncertainty surrounding how cities and other land managers will accommodate future population growth through infill development or expansion into areas of existing open space and agriculture. Update 2013 considers many alternative, plausible, yet very different future scenarios as a way of considering uncertainty and risk and improving resource sustainability. For example, three alternative population growth rates and three alternative assumptions about future land-use development density are considered, thus yielding nine alternative growth scenarios. The concept is not to plan for any one given future, but to identify strategies that are robust across many scenarios. Certain combinations of management strategies may prove to be robust regardless of future conditions. This is especially true if the strategies have a degree of adaptability to differing conditions that may develop. Future water demand is affected by a number of growth and land use factors, such as population growth, planting decisions by farmers, and size and type of urban landscapes. The CWP quantifies several factors that together provide a description of future growth and how growth could affect water demand for the urban, agricultural, and environmental sectors. Growth factors are varied among the scenarios to describe some of the uncertainty faced by water managers. Population growth and development density will reflect how large the urban landscape will have become by 2050 and are used by the CWP to quantify encroachment into agricultural lands by 2050. Table 1 below identifies conceptual growth scenarios relative to current trends by using population information from the California Department of Finance and the Public Policy Institute of California (Public Policy Institute of California. February 2008).
Table 1: Conceptual Growth Scenarios
Scenario Population Growth Development Density LOP-HID Lower than Current Trends Higher than Current Trends LOP-CTD Lower than Current Trend Current Trends LOP-LOD Lower than Current Trends) Lower than Current Trends CTP-HID Current Trends Higher than Current Trends CTP-CTD Current Trends Current Trends CTP-LOD Current Trends Lower than Current Trends HIP-HID Higher than Current Trends Higher than Current Trends HIP-CTD Higher than Current Trends Current Trends HIP-LOD Higher than Current Trends Lower than Current Trends
Topic: Data and Analytical Tools Scenarios of Future California Water Demand Through 2050
CA Water Plan Update 2013 Vol 4 Reference Guide Page 10

4
For Update 2013, DWR worked with researchers at the University of California, Davis, to quantify how California might grow through 2050. The UPlan model was used to estimate a year 2050 urban footprint under the scenarios of alternative population growth and development density listed in Table 2 (http://ice.ucdavis.edu/project/uplan for information on the UPlan model). UPlan is a simple, rule-based urban growth model intended for regional or county-level modeling. The needed space for each land use type is calculated from simple demographics and is assigned based on the net attractiveness of locations to that land use (based on user input), locations unsuitable for any development, and a general plan that determines where specific types of development are permitted. Values of urban footprints in Table 2 for each of the 10 hydrologic regions are shown in Appendices 1-10.
Table 2: Growth Scenarios (Urban) — Statewide Values
Scenario 2050 Population Development 2050 Urban Urban Population Change Density Footprint Footprint
(millions) (millions) (million acres) Increase 2006a to (million acres)
2050 2006b to 2050
LOP-HID 43.9c 7.8 High 5.6 0.3 LOP-CTD 43.9 7.8 Current Trends 6.2 1.0
LOP-LOD 43.9 7.8 Low 6.5 1.2 CTP-HID 51.0d 14.9 High 6.3 1.1
CTP-CTD 51.0 14.9 Current Trends 6.7 1.5
CTP-LOD 51.0 14.9 Low 7.1 1.9 HIP-HID 69.4e 33.3 High 6.8 1.6
HIP-CTD 69.4 33.3 Current Trends 7.6 2.4
HIP-LOD 69.4 33.3 Low 8.3 3.1
Notes: a 2006 population was 36.1 million. b 2006 urban footprint was 5.2 million acres. c Values modified by the California Department of Water Resources (DWR) from the Public Policy Institute of California. d Values provided by the California Department of Finance
Table 3 below describes future agricultural footprint as affected by urban growth in 2050. Irrigated land area is the total agricultural footprint. Irrigated crop area is the cumulative area of agriculture, including multi-crop area, where more than one crop is planted and harvested each year. Each of the growth scenarios shows a decline in irrigated acreage over existing conditions, but to varying degrees. Values of agricultural footprints in Table 3 for each of the 10 hydrologic regions are shown in Appendices 1-10.
Topic: Data and Analytical Tools Scenarios of Future California Water Demand Through 2050
CA Water Plan Update 2013 Vol 4 Reference Guide Page 11
5
Table 3: Growth Scenarios (Agriculture) — Statewide Values
Scenario 2050 Irrigated Land Areaa
(million acres)
2050 Irrigated Crop Areab
(million acres)
2050 Multiple Crop Areac
(million acres)
Reduction in Irrigated Crop Area (million acres) 2006 to 2050
LOP-HID 8.6 9.2 0.65 0.1 LOP-CTD 8.4 9.0 0.63 0.3 LOP-LOD 8.3 8.9 0.63 0.4 CTP-HID 8.4 9.0 0.63 0.3 CTP-CTD 8.2 8.9 0.62 0.4 CTP-LOD 8.1 8.7 0.61 0.6 HIP-HID 8.2 8.9 0.62 0.4 HIP-CTD 8.0 8.6 0.60 0.7 HIP-LOD 7.8 8.4 0.58 0.9 Notes:
a 2006 Irrigated land area was estimated by the California Department of Water Resources (DWR) to be 8.7 million acres.
b 2006 Irrigated crop area was estimated by DWR to be 9.3 million acres.
c 2006 multiple crop area was estimated by DWR to be 0.65 million acres.
2.5 12 Scenarios of Future Climate Change Climate scenarios explore how future climate change might influence timing; distribution; and amount of precipitation, storm runoff, and water supply. Each of the nine alternative growth scenarios was evaluated against 12 separate climate scenarios identified by the Governor’s Climate Action Team (CAT). At the core of this effort is climate-change scenarios derived from six global climate models:
• From France: CNRM CM3 • From USA: GFDL CM2.1 • From Japan: MIROC3.2 (med) • From Germany: MPI ECHAM5 • From USA: NCAR CCSM3 • From USA: NCAR PCM1
These models were chosen on the basis of the availability of detailed outputs for use in various parts of the assessment process and upon consideration of certain aspects of their performance. The CAT used each of the six global climate models with two separate greenhouse gas emission scenarios developed by the Intergovernmental Panel on Climate Change. The result is 12 different time sequences of future climate (temperature, precipitation, and relative humidity) that the Water Plan applied for each of the nine growth scenarios. Collectively these estimates provide planners with a range of precipitation and temperature that
Topic: Data and Analytical Tools Scenarios of Future California Water Demand Through 2050
CA Water Plan Update 2013 Vol 4 Reference Guide Page 12

6
might be experienced in the future and are used in the Water Plan scenarios with other factors to estimate future water demands. See the following link for the Climate Change article describing the 12 climate models: http://www.waterplan.water.ca.gov/docs/cwpu2009/0310final/v4c02a12_cwp2009.pdf The figures below show ranges of future precipitation compared with historical climate in different parts of California. They show variation in 30-year running average annual precipitation for several locations in the Central Valley and Sierra Nevada foothill regions for the 1915-2003 historical period as well as 2011-2099 for the 12 CAT scenarios of future climate (Figures 1, 2, 3 and 4). The variation in the 30-year running average precipitation is represented as a box plot (also known as a box-and-whisker diagram or plot), which is a convenient way of graphically summarizing groups of numerical data using five numbers (the smallest observation, lower quartile [Q1], median [Q2], upper quartile [Q3], and largest observation). For example, for the historical period, the box plot for Red Bluff shows a minimum value of about 20 inches in the driest 30-year period and a maximum value of slightly over 23 inches in the wettest 30-year period. The precipitation values used to generate the box plots are from a specific point in each location.
Topic: Data and Analytical Tools Scenarios of Future California Water Demand Through 2050
CA Water Plan Update 2013 Vol 4 Reference Guide Page 13

7
Figure 1: Variation in 30-Year Running Average Precipitation for Historical Record (1915-2003) and Alternative Scenarios of Future Simulated Climate (2011-2099) for Red Bluff
Topic: Data and Analytical Tools Scenarios of Future California Water Demand Through 2050
CA Water Plan Update 2013 Vol 4 Reference Guide Page 14

8
Figure 2: Variation in 30-Year Running Average Precipitation for Historical Record (1915-2003) and Alternative Scenarios of Future Simulated Climate (2011-2099) for Oroville
Topic: Data and Analytical Tools Scenarios of Future California Water Demand Through 2050
CA Water Plan Update 2013 Vol 4 Reference Guide Page 15

9
Figure 3: Variation in 30-Year Running Average Precipitation for Historical Record (1915-2003) and Alternative Scenarios of Future Simulated Climate (2011-2099) for Fresno
Topic: Data and Analytical Tools Scenarios of Future California Water Demand Through 2050
CA Water Plan Update 2013 Vol 4 Reference Guide Page 16

10
Figure 4: Variation in 30-Year Running Average Precipitation for Historical Record (1915-2003) and Alternative Scenarios of Future Simulated Climate (2011-2099) for Millerton
3 Detailed Description of Water Demands Factors
Future water demand is affected by a number of factors like population growth, planting decisions by farmers, size and type of urban landscapes, and background water conservation measures (like plumbing codes, natural replacement, actions water users implement on their own, etc.). The scenarios developed for Water Plan Update 2013 group several factors into themes that together are used to quantify future water demand for the urban, agricultural sectors. Each of these factors is varied between the growth scenarios to describe some of the uncertainty faced by water managers. In this section we describe the key factors of uncertainty used to quantify urban, agricultural water demands for Update 2013.
Topic: Data and Analytical Tools Scenarios of Future California Water Demand Through 2050
CA Water Plan Update 2013 Vol 4 Reference Guide Page 17

11
3.1 Indoor Water Demands for Municipal, Commercial, and Industrial Sectors
Key factors affecting indoor urban water demand are population and numbers of single-family homes, multi-family homes, commercial employees, and industrial employees. Statewide values for these demographic factors are reported in Table 4 for 2006 and 2050 under each of the nine growth scenarios. These factors are used to quantify indoor urban sector water demands by the sub categories single family, multi-family, commercial, and industrial. Values of demographic factors for each of the 10 hydrologic regions are shown in Appendices 1-10.
Table 4: Growth Scenarios (Demographic) — Statewide Values
Total Household Population in Population in Total Single Family Multi-Family Total SF MF Commercial Industrial Woods & PoolePopulation Population Single Family HH Multi-Family HH Households Households Households P / HH P / HH P / HH Employment Employment Mean Income
2006 Base Year 36,246,822 35,391,821 24,934,929 10,456,892 12,411,729 8,072,288 4,339,441 2.85 3.09 2.41 19,028,736 1,623,338 $110,136CTP_CTD 51,013,984 49,499,385 35,875,114 13,624,271 17,514,151 11,832,262 5,681,889 2.83 3.03 2.40 31,038,377 1,078,674 $202,572CTP_LOD 51,013,984 49,499,381 37,569,564 11,929,817 17,514,150 12,508,287 5,005,863 2.83 3.00 2.38 31,038,377 1,078,674 $202,572CTP_HID 51,013,984 49,499,382 31,562,321 17,937,061 17,514,149 10,149,964 7,364,185 2.83 3.11 2.44 31,038,377 1,078,674 $202,572LOP_CTD 43,949,342 42,645,643 30,124,257 12,521,386 15,722,424 10,496,391 5,226,033 2.71 2.87 2.40 20,249,888 1,078,677 $203,126LOP_LOD 43,949,342 42,645,638 31,254,121 11,391,517 15,722,426 10,941,859 4,780,567 2.71 2.86 2.38 20,249,888 1,078,677 $203,126LOP_HID 43,949,342 42,645,640 27,201,373 15,444,267 15,722,427 9,374,735 6,347,692 2.71 2.90 2.43 20,249,888 1,078,677 $203,126HIP_CTD 69,376,362 67,289,175 48,722,285 18,566,890 23,835,257 16,069,614 7,765,643 2.82 3.03 2.39 36,094,243 1,078,674 $204,007HIP_LOD 69,376,362 67,289,175 52,974,513 14,314,662 23,835,260 17,820,597 6,014,663 2.82 2.97 2.38 36,094,243 1,078,674 $204,007HIP_HID 69,376,362 67,289,176 39,022,305 28,266,871 23,835,260 12,191,658 11,643,602 2.82 3.20 2.43 36,094,243 1,078,674 $204,007
Statewide Demographic Information for Growth Scenarios
SCENARIOS
2050 Growth Scenarios
3.1.1 Population
Three different estimates of future population growth to 2050 were developed for the three Water Plan scenarios. The Current Trends scenario (CTP) follows population projections by the California Department of Finance (DOF). Populations for the Low Population (LOP) and High Population (HIP) scenarios are respectively based on low and high population growth scenarios developed by the Public Policy Institute of California as described in “Population projections for California climate change scenarios”. The PPIC study was conducted for the Governor’s Climate Action Team 2008 Biennial Climate Assessment Report. Some minor changes were made to the PPIC high population growth to distinguish it from the DOF projections. See the following link for the PPIC Article. http://www.waterplan.water.ca.gov/docs/cwpu2009/0310final/v4c02a13_cwp2009.pdf
3.1.2 Housing and Housing Density The three estimates of future population growth described above were used to develop estimates of future housing and housing density for the three Water Plan scenarios. Future population was used with demographic information from Woods and Poole (Woods and Poole Economics, 2007) to develop estimates of future single- and multiple-family households and household size. Estimates of future single- and multiple-family households and household size
Topic: Data and Analytical Tools Scenarios of Future California Water Demand Through 2050
CA Water Plan Update 2013 Vol 4 Reference Guide Page 18

12
for the Current Trends, Low, and High Growth scenarios are consistent with the DOF, PPIC Low, and PPIC High population projections respectively.
3.1.3 Commercial and Industrial Employment
Similar to the housing factors, commercial and industrial employment for the Current Trends, Low, and High Growth scenarios are consistent with the DOF, PPIC Low, and PPIC High population projections, respectively, and are based on demographic information from Woods and Poole (up to 2040).
3.2 Outdoor Urban Water Demand for Municipal, Commercial, and Large Landscapes
A significant improvement to the scenarios for Update 2005 and current Update 2013 was to quantify outdoor demand as a function of both demographics as well as climatic factors. Key demographic factors are similar to those in indoor demand; e.g. population, single/multi family homes, commercial employees. To incorporate climatic factors like temperature, precipitation, relative humidity and wind speed, outdoor demands were modeled as catchments. Details for quantifying outdoor demands are described in Section 4.3.1.2 Outdoor Demand.
3.3 Urban Water Use Conservation The urban water demands for each of the Water Plan scenarios include factors describing background urban water conservation. Background water conservation includes actions that occur without policy intervention (called naturally occurring conservation) and through efficiency due to the continued implementation of existing Best Management Practices (BMPs) in the Memorandum of Understanding (CUWCC 2004). Percent reduction in both indoor and outdoor water use rate by the year 2050 for naturally occurring and BMP plans were assumed 10% and 5%, respectively. These factors are applied equally to indoor and outdoor demands for all subsectors of urban demand (single family residential, multifamily residential, commercial, industrial, and large landscapes) and for all regions of the state. Additional efficiency that would occur from the implementation of new water conservation programs beyond naturally occurring conservation and the MOU is not included in the Water Plan scenarios for Update 2013, but could be included as part of a water management response.
3.4 Agricultural Water Demand Key factors affecting agricultural water demand include irrigated land area, multi-crop area, and irrigated crop area. Irrigated land area is the agricultural footprint on the land surface. Multi-crop area is the acreage that is farmed more than once in a single season often with different crops. The irrigated land area is combined with the multi-crop area and expressed as the total
Topic: Data and Analytical Tools Scenarios of Future California Water Demand Through 2050
CA Water Plan Update 2013 Vol 4 Reference Guide Page 19

13
0 1,000 2,000 3,000 4,000 5,000 6,000 7,000 8,000 9,000 10,000
irrigated crop area. Values for each of these variables for 2006 and 2050 are reported in Figure 5. Values of factors in Figure 5 for each of the 10 hydrologic regions are shown in Appendices 1-10.
Irrigated Crop Area (x 1,000 acres)
Figure 5: Statewide Agricultural Land Use
3.5 Agricultural Water Use Efficiency Similar to water use efficiency factors for the urban sector, the same level of naturally occurring conservation was applied to agricultural sector under the 9 growth scenarios. These factors capture a broad range of activities that could reduce demand for water including precision field leveling, irrigation methods, crop varieties, and on-farm re-use. These specific irrigation methods are not explicitly quantified in the scenarios. Instead the total potential water conservation is captured in efficiency factors.
4 Application of WEAP Model to Quantify Future Water Demands
4.1 Selection of an Analytical Framework For Update 2013, DWR continued working with Statewide Water Analysis Network (SWAN), the technical advisory group for the Water Plan, to further refine the application of the Water Evaluation and Planning System (WEAP) to help quantify future scenarios. Series of workshops in 2012 were conducted to develop future agricultural and urban footprint. See www.weap21.org for additional information about the WEAP tool. But specifically, DWR chose the WEAP tool for future CWP Updates because WEAP:
• has a friendly graphical user interface that supports collaboration, • requires a shorter learning curve than alternatives,
Population Density
Year Scenario Scenario
2006 Current Current
2050 Low High
2050 Low Current Trend
2050 Low Low
2050 Current Trend High
2050 Current Trend Current Trend
2050 Current Trend Low
2050 High High
2050 High Current Trend
2050 High Low
Topic: Data and Analytical Tools Scenarios of Future California Water Demand Through 2050
CA Water Plan Update 2013 Vol 4 Reference Guide Page 20
14
• has been successfully applied other researchers to evaluate climate scenarios (RAND 2008), and
• received positive feedback from SWAN and other Water Plan stakeholders. The current WEAP application builds on work begun in Update 2005 and other studies by employing the WEAP modeling tool to simulate and evaluate more refined integrated water management scenarios. Ultimately, the Water Plan will quantify a small set of hand-crafted narrative scenarios with advice from SWAN and the public Advisory Committee and also generate a larger ensemble of plausible scenarios to systematically evaluate the performance of various regional water management response packages in the face of a number of critical uncertainties, including climate change. See the link below for the article describing the technical approached for developing the WEAP model. http://www.waterplan.water.ca.gov/docs/cwpu2009/0310final/v4c04a05_cwp2009.pdf The California Water Plan has developed the following objectives to guide our analysis of future water management conditions:
• Develop an integrated scenario analysis modeling framework • Use this framework to assess the full spectrum of uncertainties that confront
water planning in California, including global climate change, land use and demographic changes, and others
• Evaluate the results of these analyses against an appropriate set of performance metrics, introducing the notions of robustness and risk as part of the evaluation process
• Evaluate a portfolio of promising regional water management responses
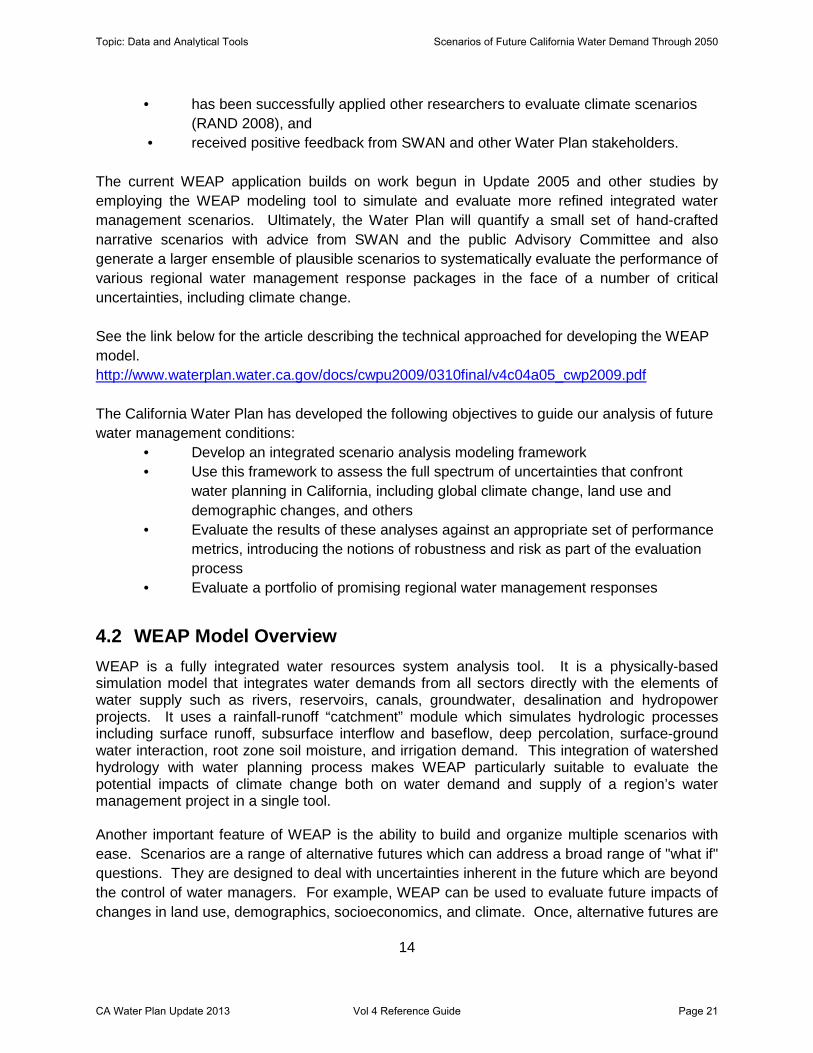
4.2 WEAP Model Overview WEAP is a fully integrated water resources system analysis tool. It is a physically-based simulation model that integrates water demands from all sectors directly with the elements of water supply such as rivers, reservoirs, canals, groundwater, desalination and hydropower projects. It uses a rainfall-runoff “catchment” module which simulates hydrologic processes including surface runoff, subsurface interflow and baseflow, deep percolation, surface-ground water interaction, root zone soil moisture, and irrigation demand. This integration of watershed hydrology with water planning process makes WEAP particularly suitable to evaluate the potential impacts of climate change both on water demand and supply of a region’s water management project in a single tool. Another important feature of WEAP is the ability to build and organize multiple scenarios with ease. Scenarios are a range of alternative futures which can address a broad range of "what if" questions. They are designed to deal with uncertainties inherent in the future which are beyond the control of water managers. For example, WEAP can be used to evaluate future impacts of changes in land use, demographics, socioeconomics, and climate. Once, alternative futures are
Topic: Data and Analytical Tools Scenarios of Future California Water Demand Through 2050
CA Water Plan Update 2013 Vol 4 Reference Guide Page 21

15
built into WEAP, a range of water management responses including structural or non-structural changes to the water system can be evaluated. Finally, WEAP can provide a wide array of system-specific diagnostics (e.g. unmet demand, demand coverage, statistical exceedance curve, supply reliability, fixed and operating costs) which can be used to evaluate the effectiveness of the proposed management responses.
4.3 Quantifying Water Demands in WEAP A per capita water use approach was used to calculate indoor demand for Update 2013. In this approach, indoor water use calculations are based on the number of single and multi family residential units and commercial and industrial employees. Water consumption is a function of different elasticity factors expressing trends in future water conservation, family income, and water prices, but is independent of future climate. However, a different approach was used to calculate outdoor demand for single family, multi family, commercial and large landscapes that includes the effects of climate. A physically-based rainfall-runoff hydrologic approach in WEAP (as described above) was used to incorporate soil, plant and climate factors in demand calculations. In this section a brief description is provided of the quantification methodology for indoor and outdoor demand categories.
4.3.1 Single & Multi-family Residential Single and Multi-family residential demand was disaggregated in WEAP into Indoor and Outdoor demands. A method was developed to estimate a baseline for irrigated land per housing unit for single family and multifamily by hydrologic region (HR) using the 70 gpcd interior water use, volumes of outdoor applied water (AW) stored in the DWR’s Water Portfolio database, and ET of applied water (ETaw) estimates for warm and cool season grasses based on the Cal-SIMETAW model. The Cal-SIMETAW application provides spatial soil and climate information and it uses crop information with precipitation (Pcp) and ETc data to generate hypothetical water balance irrigation schedules to determine ETaw, which is a seasonal estimate of the water needed to irrigate a crop assuming 100% irrigation efficiency.
4.3.1.1 Indoor Demand
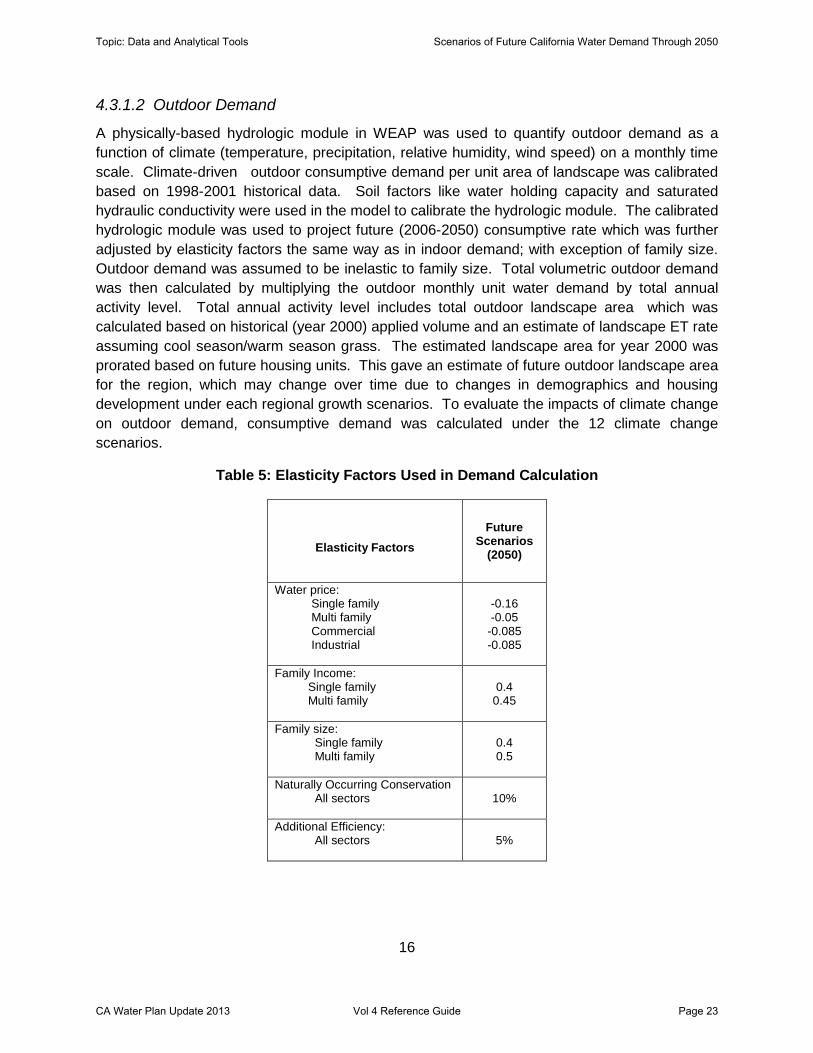
An indoor demand module was developed in WEAP to calculate total indoor demand by multiplying the annual activity level and unit water use rate. Annual activity level includes number of single family homes based on demographic and housing development projections which vary annually under each 3 population scenarios coupled with 3 housing density scenarios. Unit water use rate is the amount of water used per single family unit which can also change annually over time following an elasticity function under each growth scenarios. The elasticity function describes changes in baseline (year 2006) water consumption over time as a function of water price, family income, and family size and water conservation measures. See Table 5 for the elasticity factors used to estimate future water demands.
Topic: Data and Analytical Tools Scenarios of Future California Water Demand Through 2050
CA Water Plan Update 2013 Vol 4 Reference Guide Page 22
16
4.3.1.2 Outdoor Demand
A physically-based hydrologic module in WEAP was used to quantify outdoor demand as a function of climate (temperature, precipitation, relative humidity, wind speed) on a monthly time scale. Climate-driven outdoor consumptive demand per unit area of landscape was calibrated based on 1998-2001 historical data. Soil factors like water holding capacity and saturated hydraulic conductivity were used in the model to calibrate the hydrologic module. The calibrated hydrologic module was used to project future (2006-2050) consumptive rate which was further adjusted by elasticity factors the same way as in indoor demand; with exception of family size. Outdoor demand was assumed to be inelastic to family size. Total volumetric outdoor demand was then calculated by multiplying the outdoor monthly unit water demand by total annual activity level. Total annual activity level includes total outdoor landscape area which was calculated based on historical (year 2000) applied volume and an estimate of landscape ET rate assuming cool season/warm season grass. The estimated landscape area for year 2000 was prorated based on future housing units. This gave an estimate of future outdoor landscape area for the region, which may change over time due to changes in demographics and housing development under each regional growth scenarios. To evaluate the impacts of climate change on outdoor demand, consumptive demand was calculated under the 12 climate change scenarios.
Table 5: Elasticity Factors Used in Demand Calculation
Elasticity Factors
Future Scenarios
(2050)
Water price: Single family Multi family Commercial Industrial
-0.16 -0.05
-0.085 -0.085
Family Income: Single family Multi family
0.4
0.45
Family size: Single family Multi family
0.4 0.5
Naturally Occurring Conservation All sectors
10%
Additional Efficiency: All sectors
5%
Topic: Data and Analytical Tools Scenarios of Future California Water Demand Through 2050
CA Water Plan Update 2013 Vol 4 Reference Guide Page 23

17
4.3.2 Commercial
Commercial demand was calculated based on employment in commercial sector, rather than on commercial activities. It was also assumed that 60 percent of commercial water demand occurs indoor and the remainder 40 percent is used up by outdoor commercial landscape.
4.3.2.1 Indoor demand
Volumetric indoor commercial demand was calculated was multiplying annual commercial employment and annual per capita water use rate. Annual commercial employment was obtained by linear interpolation of decadal commercial employment under each growth scenario. Annual indoor water use rate was based on year 2005 baseline per capita (per commercial employees) water consumption which was further adjusted and annually varied over time as a function of elasticity factors; water price and conservation measures.
4.3.2.2 Outdoor demand
Similar to outdoor residential, the outdoor commercial landscape demand was also calculated using the WEAP hydrologic module to incorporate climate factors. Commercial historical water use data (1998-2001) was used to calibrate demand per unit area of outdoor landscape in commercial sector. The calibrated unit demand was then used to project future (2006-2050) unit demand under each 12 climate change scenarios. Unit demands were further adjusted by commercial elasticity factors; water price and conservation measures. Total volumetric demand was calculated by multiplying unit demand rate and total commercial outdoor landscaped area for each region. Similar to residential outdoor landscaped area calculations as described earlier, future commercial outdoor landscape area was based on historical landscaped area adjusted by changes in future commercial employment under nine growth scenarios.
4.3.3 Industrial
Industrial demand, similar to water demand in the commercial sector, was also assumed as a function of employment rather than industrial activity. It was further assumed that it all occurs indoor. Volumetric demand was calculated by multiplying annual industrial employment and annual per capita (per industrial employee) water use rate. Annual industrial employment was obtained by linear interpolation of decadal industrial employment in each hydrologic region under the nine growth scenarios. Annual per capita water use rate was based on year 2006 baseline per capita (per industrial employee) water consumption which was further adjusted and varied annually over time as a function of elasticity factors; water price and conservation measures.
4.3.4 Large Landscape
It was assumed that water demand for large landscapes (parks, golf courses) is driven by human activity and thus a function of population. Also, similar to residential and commercial outdoor demand, the rainfall-runoff hydrologic module in WEAP was used to incorporate climate factors in calculating large landscape demand. Volumetric demand was calculated by
Topic: Data and Analytical Tools Scenarios of Future California Water Demand Through 2050
CA Water Plan Update 2013 Vol 4 Reference Guide Page 24

18
multiplying annual landscape area driven by population and monthly water use rate driven by climate factors. Similar to residential outdoor landscape area, future projection of large landscaped area was obtained using historical estimates adjusted by changes in future population under each growth scenarios.
4.3.5 Agricultural Water Demand
Similar to outdoor landscape demand, the rainfall-runoff hydrologic module in WEAP (as described earlier) was used to calculate agricultural demand. This was done to incorporate soil, plant and climate factors in crop consumptive use calculations. Agricultural historical water use data (1998-2005) was used to calibrate the model for crop consumptive demand per unit area of irrigated land for each crop category. Soil factors (e.g. water holding capacity and saturated hydraulic conductivity) and irrigation threshold points in the model were used to calibrate the hydrologic module. There were 20 crop categories in each hydrologic region. The calibrated model was then used to project future crop consumptive demand (2006-2050) per unit area of irrigated land on a monthly time scale under the 12 climate scenarios. Volumetric demand was calculated by multiplying unit area consumptive demand and total irrigated acreage for each of the 20 crop categories. Future projections of irrigated crop acreage were obtained based on population growth and assumptions of agricultural lands lost due to urban encroachment under the nine growth scenarios. Volumetric demand was further adjusted to include background conservation measures assumed under nine growth scenarios. All scenarios assumed 10% water conservation by 2050 from 2006.
5 Results of Future Water Demands through Year 2050
In this section, a description is provided for how future statewide water demands might change under scenarios organized around themes of growth and climate change described earlier. The change in water demand from 2006 to 2050 is estimated for each hydrologic region for agriculture and urban sectors under nine growth scenarios and 13 scenarios of future climate change. The climate change scenarios included the 12 CAT scenarios described earlier in this chapter and a thirteenth scenario representing a repeat of the historical climate (1962-2006) to evaluate a “without climate change” condition. Figure 6 below shows the change in statewide water demands for the urban and agricultural sectors under nine growth scenarios, with variation shown across 13 climate scenarios. The nine growth scenarios include three alternative population growth projections and three alternative urban-land development densities, as explained earlier. The change in water demand is the difference between the historical average for 1998 to 2005 and future average for 2043 to 2050. Urban demand is the sum of indoor and outdoor water demand, where indoor demand is assumed not to be affected by climate. Outdoor demand, however, depends on such climate factors as the amount of precipitation falling and the average air temperature. Also shown in Figure 6 is the change in water demand under a repeat of historical climate and a range representing 12 scenarios of future climate change. The net change in water demand for
Topic: Data and Analytical Tools Scenarios of Future California Water Demand Through 2050
CA Water Plan Update 2013 Vol 4 Reference Guide Page 25

19
the sum of the urban and agricultural sectors is shown at the top of the figure. Urban demand increased under all nine growth scenarios, consistent with population growth. On average, urban demand increased by about 1.3 million acre-feet (maf) under the three low- population scenarios, 2.9 maf under the three current-trend population scenarios, and about 6.1 maf under the three high-population scenarios, when compared with the historical average of 8.2 maf. The results show that change in future urban water demands is less sensitive to housing density assumptions or climate change than to assumptions about future population growth. Agricultural water demand decreases under all future scenarios owing to reduction in irrigated lands as a result of urbanization and background water conservation, when compared with historical average water demand of 30.2 maf. Under the three low-population scenarios, the average reduction in water demand was about 3.0 maf, while it was about 4.3 maf for the three high-population scenarios. For the three current trend population scenarios, this change was about 3.6 maf. The results show that low-density housing would result in more reduction in agricultural water demand because more agricultural lands are lost under low-density housing than high-density housing.
Topic: Data and Analytical Tools Scenarios of Future California Water Demand Through 2050
CA Water Plan Update 2013 Vol 4 Reference Guide Page 26

20
Figure 6: Change in Statewide Agricultural and Urban Water Demands for 117 Scenarios
from 2006-2050 (million acre-feet per year)
Topic: Data and Analytical Tools Scenarios of Future California Water Demand Through 2050
CA Water Plan Update 2013 Vol 4 Reference Guide Page 27
21
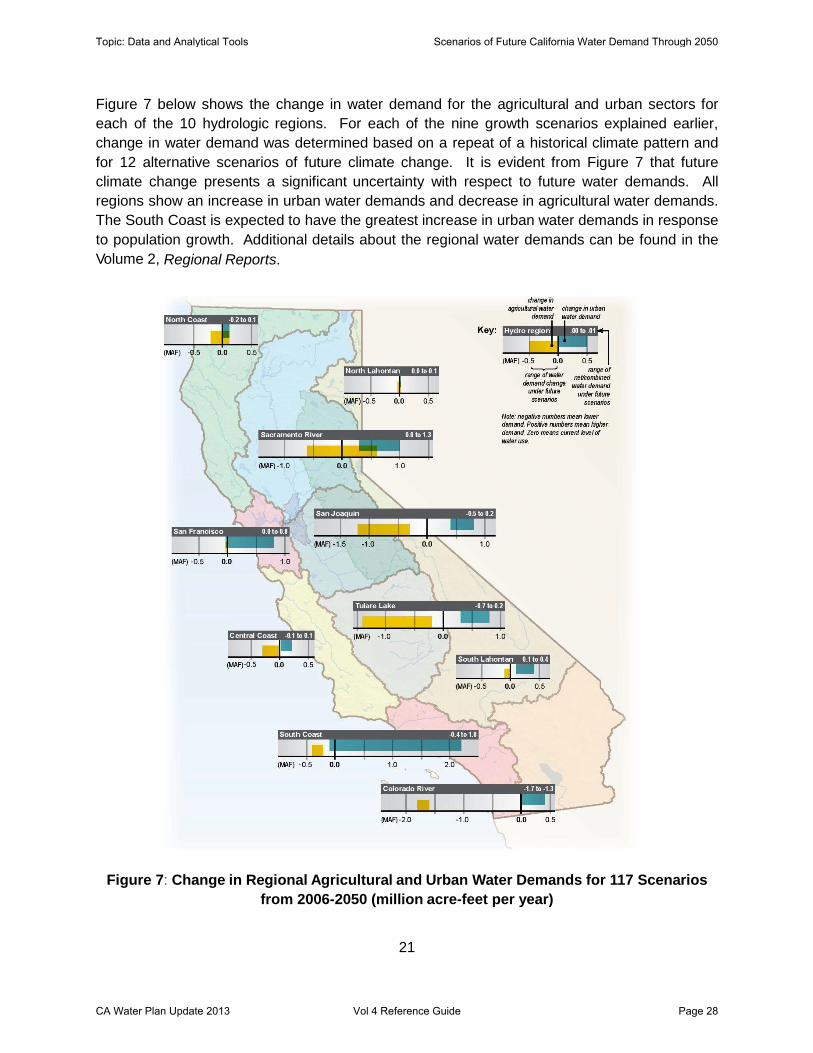
Figure 7 below shows the change in water demand for the agricultural and urban sectors for each of the 10 hydrologic regions. For each of the nine growth scenarios explained earlier, change in water demand was determined based on a repeat of a historical climate pattern and for 12 alternative scenarios of future climate change. It is evident from Figure 7 that future climate change presents a significant uncertainty with respect to future water demands. All regions show an increase in urban water demands and decrease in agricultural water demands. The South Coast is expected to have the greatest increase in urban water demands in response to population growth. Additional details about the regional water demands can be found in the Volume 2, Regional Reports.
Figure 7: Change in Regional Agricultural and Urban Water Demands for 117 Scenarios from 2006-2050 (million acre-feet per year)
Topic: Data and Analytical Tools Scenarios of Future California Water Demand Through 2050
CA Water Plan Update 2013 Vol 4 Reference Guide Page 28

22
6 Conclusions
The scenarios developed for Water Plan Update 2013 show how key uncertainties like future population growth, land use patterns, and climate affect future water demands. Future demands were evaluated for 10 hydrologic regions of the State for urban, agriculture, under nine growth scenarios and twelve CAT future climate scenarios and a thirteenth scenario representing a repeat of historical climate (1962-2006). Future demands were developed within the framework of the Water Evaluation and Planning system model (WEAP) using catchment hydrology and land use types. The 12 climate scenarios are based on scenarios identified by the Governor’s Climate Action Team (CAT) for the 2008 Biennial Assessment report. The CAT used six global climate models with two separate greenhouse gas emission scenarios developed by the Intergovernmental Panel on Climate Change. The result is 12 different time sequences of future climate (temperature, precipitation, and relative humidity) used to estimate outdoor urban, agricultural, and environmental water demands. Future urban Water demands under the three growth scenarios are heavily influenced by the assumptions of future population growth and to a lesser extent by future climate. Future agricultural water demands are heavily influenced by assumptions about future climate and urbanization of agricultural lands. The hydrologic region based scenarios presented in this paper are an initial effort that are part of a larger strategy to conduct a robust evaluation of future demands and alternative water management strategies in light of the many uncertainties facing water managers. This strategy has been developed in consultation with the Statewide Water Analysis Network (SWAN), the technical advisory group for the California Water Plan. While the hydrologic region analysis is acceptable for high level screening, the hydrologic regions are very large areas (on the order of tens of thousands of square miles); they are too large to evaluate the complex interactions occurring among local and regional water managers in California. DWR has a parallel effort to develop a more refined tool to evaluate scenarios at the planning area scale for these more complex interactions across these alternative growth and climate scenarios. Work on the planning area scale model was initiated for Update 2009 and is continuing under the development of Update 2013.
7 References
CUWCC. (2004). "Memorandum of Understanding Regarding Urban Water Conservation in California." California Urban Water Conservation Council, Sacramento, CA. Department of Finance. July 2012. Interim Projections of Population for California; State and Counties.
http://www.dof.ca.gov/research/demographic/
Topic: Data and Analytical Tools Scenarios of Future California Water Demand Through 2050
CA Water Plan Update 2013 Vol 4 Reference Guide Page 29

23
Department of Water Resources, California Water Plan Update 2005. http://www.waterplan.water.ca.gov/previous/cwpu2005 Department of Water Resources, California Water Plan Update 2009. http://www.waterplan.water.ca.gov/cwpu2009 Public Policy Institute of California. February 2008. Population projections for California climate change scenarios. http://www.waterplan.water.ca.gov/docs/cwpu2009/0310final/v4c02a13_cwp2009.pdf RAND Corporation (2008). Presenting Uncertainty About Climate Change to Water Resource Managers, A Summary of Workshops with the Inland Empire Utilities Agency. Published by the RAND Corporation. Woods & Poole Economics. (2007). "2004 State Profile - State and County Projections to 2030 (California)." Woods & Poole Economics, Washington, D.C.
Topic: Data and Analytical Tools Scenarios of Future California Water Demand Through 2050
CA Water Plan Update 2013 Vol 4 Reference Guide Page 30

24
Appendices
Appendix 1 North Coast Table 1: Growth Scenarios (Urban) — North Coast
Scenarioa 2050 Population (thousand)
Population Change (thousand) 2006b to 2050
Development Density
2050 Urban Footprint (thousand acres)
Urban Footprint Increase (thousand acres) 2006c to 2050
LOP-HID 763.3d 106.7 High 204.3 15.9
LOP-CTD 763.3 106.7 Current Trends 206.5 18.1
LOP-LOD 763.3 106.7 Low 208.5 20.1
CTP-HID 814.9e 14.9 High 219.4 31.0
CTP-CTD 814.9 14.9 Current Trends 221.8 33.4
CTP-LOD 814.9 14.9 Low 224.6 36.2
HIP-HID 1,185.6f 33.3 High 267.5 79.1
HIP-CTD 1,185.6 33.3 Current Trends 278.0 89.6
HIP-LOD 1,185.6 33.3 Low 288.6 100.2
Source: California Department of Water Resources 2012.
Notes:
a CTD = , CTP = , HID = , HIP = ,LOD = , LOP =
b 2006 population was 656.6 thousand.
C 2006 urban footprint was 188.4 thousand acres.
d Values modified by the California Department of Water Resources (DWR) from the Public Policy Institute of California.
e Values provided by the California Department of Finance.
f Values modified by DWR from the Public Policy Institute of California.
Topic: Data and Analytical Tools Scenarios of Future California Water Demand Through 2050
CA Water Plan Update 2013 Vol 4 Reference Guide Page 31

25
Table 2: Growth Scenarios (Agriculture) — North Coast Scenarioa 2050 Irrigated
Land Areab (thousand acres)
2050 Irrigated Crop Areac (thousand acres)
2050 Multiple Crop Aread (thousand acres)
Change in Irrigated Crop Area (thousand acres) 2006 to 2050
LOP-HID 325.1 325.1 0.0 -37.8
LOP-CTD 324.7 324.7 0.0 -38.2
LOP-LOD 324.4 324.4 0.0 -38.5
CTP-HID 322.4 322.4 0.0 -40.5
CTP-CTD 322.0 322.0 0.0 -40.9
CTP-LOD 321.4 321.4 0.0 -41.5
HIP-HID 314.4 314.4 0.0 -48.4
HIP-CTD 312.3 312.3 0.0 -50.6
HIP-LOD 310.2 310.2 0.0 -52.7
Source: California Department of Water Resources 2012.
Notes:
a CTD = , CTP = , HID = , HIP = ,LOD = , LOP =
b 2006 Irrigated land area was estimated by the California Department of Water Resources (DWR) to be 362.9 thousand acres.
c 2006 Irrigated crop area was estimated by DWR to be 362.9 thousand acres.
d 2006 multiple crop area was estimated by DWR to be 0.0 thousand acres.
Topic: Data and Analytical Tools Scenarios of Future California Water Demand Through 2050
CA Water Plan Update 2013 Vol 4 Reference Guide Page 32

26
d
d
d
0 50 100 150 200 250 300 350 400
Table 3: Growth Scenarios (Demographic) — North Coast
Total Household Population in Population in Total Single Family Multi-Family Total SF MF Commercial Industrial Woods & PoolePopulation Population Single Family HH Multi-Family HH Households Households Households P / HH P / HH P / HH Employment Employment Mean Income
2006 Base Year 656,609 636,227 489,796 146,431 259,442 191,309 68,133 2.45 2.56 2.15 336,178 29,108 $88,035CTP_CTD 814,889 784,808 612,377 172,431 321,106 240,220 80,886 2.44 2.55 2.13 529,250 20,973 $157,624CTP_LOD 814,889 784,808 620,336 164,472 321,106 244,040 77,066 2.44 2.54 2.13 529,250 20,973 $157,624CTP_HID 814,889 784,808 587,389 197,419 321,108 228,320 92,788 2.44 2.57 2.13 529,250 20,973 $157,624LOP_CTD 763,337 735,237 571,213 164,024 300,703 223,976 76,727 2.45 2.55 2.14 370,845 20,930 $157,863LOP_LOD 763,337 735,236 576,614 158,622 300,703 226,569 74,134 2.45 2.54 2.14 370,845 20,930 $157,863LOP_HID 763,337 735,236 554,032 181,204 300,703 215,802 84,901 2.45 2.57 2.13 370,845 20,930 $157,863HIP_CTD 1,185,626 1,140,713 900,569 240,144 466,925 356,932 109,993 2.44 2.52 2.18 608,397 21,165 $156,935HIP_LOD 1,185,626 1,140,712 927,220 213,492 466,927 369,715 97,212 2.44 2.51 2.20 608,397 21,165 $156,934HIP_HID 1,185,626 1,140,713 810,919 329,794 466,926 314,352 152,574 2.44 2.58 2.16 608,397 21,165 $156,935
North Coast Region Demographic Information for Growth Scenarios
SCENARIOS
2050 Growth Scenarios
Irrigated Crop Area (x 1,000 acres)
Figure 1: Ag Land Use — North Coast
Population Density
Year Scenario Scenario
2006 Current Current
2050 Low High
2050 Low Current Trend
2050 Low Low
2050 Current Trend High
2050 Current Trend Current Trend
2050 Current Trend Low
2050 High High
2050 High Current Trend
2050 High Low
Topic: Data and Analytical Tools Scenarios of Future California Water Demand Through 2050
CA Water Plan Update 2013 Vol 4 Reference Guide Page 33

27
Appendix 2 San Francisco Bay Table 1: Growth Scenarios (Urban) — San Francisco Bay
Scenarioa 2050 Population (thousand)
Population Change (thousand) 2006b to 2050
Development Density
2050 Urban Footprint (thousand acres)
Urban Footprint Increase (thousand acres) 2006c to 2050
LOP-HID 6,135.7d -21.5 High 706.1 23.9
LOP-CTD 6,135.7 -21.5 Current Trends 708.9 26.7
LOP-LOD 6,135.7 -21.5 Low 712.2 30.0
CTP-HID 7,666.8e 1,509.6 High 770.8 88.6
CTP-CTD 7,666.8 1,509.6 Current Trends 779.1 96.9
CTP-LOD 7,666.8 1,509.6 Low 787.0 104.8
HIP-HID 11,039.4f 4,882.2 High 863.3 181.1
HIP-CTD 11,039.4 4,882.2 Current Trends 880.8 198.6
HIP-LOD 11,039.4 4,882.2 Low 896.9 214.7
Source: California Department of Water Resources 2012.
Notes:
a CTD = , CTP = , HID = , HIP = ,LOD = , LOP =
b 2006 population was 6,157.2 thousand.
C 2006 urban footprint was 682.2 thousand acres.
d Values modified by the California Department of Water Resources (DWR) from the Public Policy Institute of California.
e Values provided by the California Department of Finance.
f Values modified by DWR from the Public Policy Institute of California.
Topic: Data and Analytical Tools Scenarios of Future California Water Demand Through 2050
CA Water Plan Update 2013 Vol 4 Reference Guide Page 34

28
Table 2: Growth Scenarios (Agriculture) — San Francisco Bay Scenarioa 2050 Irrigated
Land Areab (thousand acres)
2050 Irrigated Crop Areac (thousand acres)
2050 Multiple Crop Aread (thousand acres)
Change in Irrigated Crop Area (thousand acres) 2006 to 2050
LOP-HID 86.6 87.7 1.1 +5.1
LOP-CTD 86.2 87.3 1.1 +4.7
LOP-LOD 85.6 86.7 1.1 +4.1
CTP-HID 79.8 80.8 1.0 -1.8
CTP-CTD 79.0 80.0 1.0 -2.6
CTP-LOD 78.1 79.1 1.0 -3.5
HIP-HID 69.6 70.5 0.9 -12.1
HIP-CTD 67.5 68.4 0.9 -14.2
HIP-LOD 65.5 66.4 0.9 -16.2
Source: California Department of Water Resources 2012.
Notes:
a CTD = , CTP = , HID = , HIP = ,LOD = , LOP =
b 2006 Irrigated land area was estimated by the California Department of Water Resources (DWR) to be 81.6 thousand acres.
c 2006 Irrigated crop area was estimated by DWR to be 82.6 thousand acres.
d 2006 multiple crop area was estimated by DWR to be 1.0 thousand acres.
Topic: Data and Analytical Tools Scenarios of Future California Water Demand Through 2050
CA Water Plan Update 2013 Vol 4 Reference Guide Page 35

29
d
d
d
0 10 20 30 40 50 60 70 80 90
Table 3: Growth Scenarios (Demographic) — San Francisco Bay
Total Household Population in Population in Total Single Family Multi-Family Total SF MF Commercial Industrial Woods & PoolePopulation Population Single Family HH Multi-Family HH Households Households Households P / HH P / HH P / HH Employment Employment Mean Income
2006 Base Year 6,157,203 6,030,094 4,208,695 1,821,399 2,313,801 1,422,927 890,874 2.61 2.96 2.04 3,628,880 339,314 $139,694CTP_CTD 7,666,853 7,416,639 5,251,495 2,165,144 2,827,628 1,791,151 1,036,477 2.62 2.93 2.09 5,624,906 205,672 $259,345CTP_LOD 7,666,853 7,416,643 5,375,310 2,041,333 2,827,628 1,849,014 978,614 2.62 2.91 2.09 5,624,906 205,672 $259,345CTP_HID 7,666,853 7,416,642 4,952,304 2,464,338 2,827,627 1,650,524 1,177,103 2.62 3.00 2.09 5,624,906 205,672 $259,345LOP_CTD 6,135,710 5,936,508 3,961,509 1,974,999 2,506,598 1,559,098 947,500 2.37 2.54 2.08 3,036,335 205,254 $259,234LOP_LOD 6,135,710 5,936,509 4,008,563 1,927,946 2,506,598 1,580,813 925,785 2.37 2.54 2.08 3,036,335 205,254 $259,234LOP_HID 6,135,710 5,936,508 3,830,260 2,106,248 2,506,599 1,497,558 1,009,041 2.37 2.56 2.09 3,036,335 205,254 $259,234HIP_CTD 11,039,391 10,675,642 7,543,378 3,132,264 4,059,985 2,562,726 1,497,259 2.63 2.94 2.09 6,764,730 206,225 $258,777HIP_LOD 11,039,391 10,675,641 8,092,690 2,582,951 4,059,984 2,824,093 1,235,891 2.63 2.87 2.09 6,764,730 206,225 $258,777HIP_HID 11,039,391 10,675,642 6,548,435 4,127,207 4,059,985 2,096,670 1,963,315 2.63 3.12 2.10 6,764,730 206,225 $258,777
San Francisco Bay Region Demographic Information for Growth Scenarios
SCENARIOS
2050 Growth Scenarios
Irrigated Crop Area (x 1,000 acres)
Figure 1: Ag Land Use — San Francisco Bay
Population Density
Year Scenario Scenario
2006 Current Current
2050 Low High
2050 Low Current Trend
2050 Low Low
2050 Current Trend High
2050 Current Trend Current Trend
2050 Current Trend Low
2050 High High
2050 High Current Trend
2050 High Low
Topic: Data and Analytical Tools Scenarios of Future California Water Demand Through 2050
CA Water Plan Update 2013 Vol 4 Reference Guide Page 36

30
Appendix 3 Central Coast Table 1: Growth Scenarios (Urban) — Central Coast
Scenarioa 2050 Population (thousand)
Population Change (thousand) 2006b to 2050
Development Density
2050 Urban Footprint (thousand acres)
Urban Footprint Increase (thousand acres) 2006c to 2050
LOP-HID 1,629.2d 140.1 High 336.4 19.0
LOP-CTD 1,629.2 140.1 Current Trends 338.8 21.4
LOP-LOD 1,629.2 140.1 Low 341.3 23.9
CTP-HID 1,830.0e 340.9 High 379.7 62.3
CTP-CTD 1,830.0 340.9 Current Trends 385.8 68.4
CTP-LOD 1,830.0 340.9 Low 391.1 73.7
HIP-HID 2,755.2f 1,266.1 High 480.8 163.4
HIP-CTD 2,755.2 1,266.1 Current Trends 496.0 178.6
HIP-LOD 2,755.2 1,266.1 Low 510.4 193.0
Source: California Department of Water Resources 2012.
Notes:
a CTD = , CTP = , HID = , HIP = ,LOD = , LOP =
b 2006 population was 1,489.1 thousand.
C 2006 urban footprint was 317.4 acres.
d Values modified by the California Department of Water Resources (DWR) from the Public Policy Institute of California.
e Values provided by the California Department of Finance.
f Values modified by DWR from the Public Policy Institute of California.
Topic: Data and Analytical Tools Scenarios of Future California Water Demand Through 2050
CA Water Plan Update 2013 Vol 4 Reference Guide Page 37

31
Table 2: Growth Scenarios (Agriculture) — Central Coast Scenarioa 2050 Irrigated
Land Areab (thousand acres)
2050 Irrigated Crop Areac (thousand acres)
2050 Multiple Crop Aread (thousand acres)
Change in Irrigated Crop Area (thousand acres) 2006 to 2050
LOP-HID 441.9 654.5 212.6 -18.1
LOP-CTD 441.1 653.4 212.3 -19.2
LOP-LOD 440.4 652.3 211.9 -20.3
CTP-HID 425.4 630.1 204.7 -42.5
CTP-CTD 423.7 627.6 203.9 -45.0
CTP-LOD 422.3 625.5 203.2 -47.1
HIP-HID 395.0 585.1 190.1 -87.5
HIP-CTD 389.3 576.6 187.3 -96.0
HIP-LOD 384.1 568.9 184.8 -103.7
Source: California Department of Water Resources 2012.
Notes:
a CTD = , CTP = , HID = , HIP = ,LOD = , LOP =
b 2006 Irrigated land area was estimated by the California Department of Water Resources (DWR) to be 454.9 thousand acres. c 2006 Irrigated crop area was estimated by DWR to be 672.6 thousand acres. d 2006 multiple crop area was estimated by DWR to be 217.7 thousand acres.
Topic: Data and Analytical Tools Scenarios of Future California Water Demand Through 2050
CA Water Plan Update 2013 Vol 4 Reference Guide Page 38

32
d
d
d
0 100 200 300 400 500 600 700 800
Table 3: Growth Scenarios (Demographic) — Central Coast
Total Household Population in Population in Total Single Family Multi-Family Total SF MF Commercial Industrial Woods & PoolePopulation Population Single Family HH Multi-Family HH Households Households Households P / HH P / HH P / HH Employment Employment Mean Income
2006 Base Year 1,489,121 1,422,231 1,028,087 394,144 522,803 364,978 157,825 2.72 2.82 2.50 805,153 51,323 $111,288CTP_CTD 1,829,996 1,739,628 1,289,114 450,514 633,567 455,635 177,932 2.75 2.83 2.53 1,181,000 41,265 $212,004CTP_LOD 1,829,996 1,739,626 1,301,242 438,384 633,563 460,654 172,909 2.75 2.82 2.54 1,181,000 41,265 $212,004CTP_HID 1,829,996 1,739,625 1,163,847 575,778 633,565 407,742 225,823 2.75 2.85 2.55 1,181,000 41,265 $212,004LOP_CTD 1,629,225 1,548,655 1,120,989 427,666 578,988 410,406 168,582 2.67 2.73 2.54 800,315 41,699 $212,651LOP_LOD 1,629,225 1,548,655 1,125,155 423,500 578,985 412,113 166,872 2.67 2.73 2.54 800,315 41,699 $212,651LOP_HID 1,629,225 1,548,655 1,047,785 500,870 578,987 382,935 196,052 2.67 2.74 2.55 800,315 41,699 $212,651HIP_CTD 2,755,165 2,621,036 2,027,751 593,285 948,562 714,613 233,949 2.76 2.84 2.54 1,519,085 40,704 $211,838HIP_LOD 2,755,165 2,621,036 2,076,473 544,563 948,562 734,287 214,275 2.76 2.83 2.54 1,519,085 40,704 $211,838HIP_HID 2,755,165 2,621,035 1,515,497 1,105,538 948,563 523,094 425,469 2.76 2.90 2.60 1,519,085 40,704 $211,838
Central Coast Region Demographic Information for Growth Scenarios
SCENARIOS
2050 Growth Scenarios
Irrigated Crop Area (x 1,000 acres)
Figure 1: Ag Land Use — Central Coast
Population Density
Year Scenario Scenario
2006 Current Current
2050 Low High
2050 Low Current Trend
2050 Low Low
2050 Current Trend High
2050 Current Trend Current Trend
2050 Current Trend Low
2050 High High
2050 High Current Trend
2050 High Low
Topic: Data and Analytical Tools Scenarios of Future California Water Demand Through 2050
CA Water Plan Update 2013 Vol 4 Reference Guide Page 39

33
Appendix 4 South Coast Table 1: Growth Scenarios (Urban) — South Coast
Scenarioa 2050 Population (thousand)
Population Change (thousand) 2006b to 2050
Development Density
2050 Urban Footprint (thousand acres)
Urban Footprint Increase (thousand acres) 2006c to 2050
LOP-HID 21,582.3d 2,377.1 High 2,001.5 157.0
LOP-CTD 21,582.3 2,377.1 Current Trends 2,026.3 181.8
LOP-LOD 21,582.3 2,377.1 Low 2,050.7 206.2
CTP-HID 24,717.8e 5,512.7 High 2,171.7 327.2
CTP-CTD 24,717.8 5,512.7 Current Trends 2,211.1 366.6
CTP-LOD 24,717.8 5,512.7 Low 2,246.3 401.8
HIP-HID 33,516.7f 14,311.5 High 2,374.7 530.2
HIP-CTD 33,516.7 14,311.5 Current Trends 2,444.7 600.2
HIP-LOD 33,516.7 14,311.5 Low 2,506.7 662.2
Source: California Department of Water Resources 2012.
Notes:
a CTD = , CTP = , HID = , HIP = ,LOD = , LOP =
b 2006 population was 19,205.2 thousand.
C 2006 urban footprint was 1,844.5 thousand acres.
d Values modified by the California Department of Water Resources (DWR) from the Public Policy Institute of California.
e Values provided by the California Department of Finance.
f Values modified by DWR from the Public Policy Institute of California.
Topic: Data and Analytical Tools Scenarios of Future California Water Demand Through 2050
CA Water Plan Update 2013 Vol 4 Reference Guide Page 40

34
Table 2: Growth Scenarios (Agriculture) — South Coast Scenarioa 2050 Irrigated
Land Areab (thousand acres)
2050 Irrigated Crop Areac (thousand acres)
2050 Multiple Crop Aread (thousand acres)
Change in Irrigated Crop Area (thousand acres) 2006 to 2050
LOP-HID 208.6 223.2 14.6 -17.0
LOP-CTD 205.4 219.8 14.4 -20.4
LOP-LOD 202.0 216.2 14.2 -24.0
CTP-HID 181.5 194.2 12.7 -46.0
CTP-CTD 175.9 188.2 12.3 -52.0
CTP-LOD 170.7 182.7 12.0 -57.5
HIP-HID 143.3 153.4 10.0 -86.8
HIP-CTD 132.7 142.0 9.3 -98.2
HIP-LOD 122.3 130.9 8.6 -109.3
Source: California Department of Water Resources 2012.
Notes:
a CTD = , CTP = , HID = , HIP = ,LOD = , LOP =
b 2006 Irrigated land area was estimated by the California Department of Water Resources (DWR) to be 223.9 thousand acres.
c 2006 Irrigated crop area was estimated by DWR to be 240.2 thousand acres.
d 2006 multiple crop area was estimated by DWR to be 16.3 thousand acres.
Topic: Data and Analytical Tools Scenarios of Future California Water Demand Through 2050
CA Water Plan Update 2013 Vol 4 Reference Guide Page 41

35
d
d
d
0 50 100 150 200 250 300
Table 3: Growth Scenarios (Demographic) — South Coast
Total Household Population in Population in Total Single Family Multi-Family Total SF MF Commercial Industrial Woods & PoolePopulation Population Single Family HH Multi-Family HH Households Households Households P / HH P / HH P / HH Employment Employment Mean Income
2006 Base Year 19,205,170 18,813,521 12,750,183 6,063,338 6,356,525 3,916,784 2,439,741 2.96 3.26 2.49 10,178,625 934,247 $110,469CTP_CTD 24,717,846 23,988,965 16,489,856 7,499,109 8,286,559 5,224,449 3,062,110 2.89 3.16 2.45 15,235,648 579,836 $210,905CTP_LOD 24,717,846 23,988,964 17,361,153 6,627,811 8,286,559 5,572,358 2,714,201 2.89 3.12 2.44 15,235,648 579,836 $210,905CTP_HID 24,717,846 23,988,965 14,867,855 9,121,110 8,286,558 4,593,956 3,692,602 2.89 3.24 2.47 15,235,648 579,836 $210,905LOP_CTD 21,582,263 20,946,989 13,910,863 7,036,126 7,608,990 4,733,448 2,875,542 2.75 2.94 2.45 10,339,681 581,556 $211,482LOP_LOD 21,582,263 20,946,989 14,520,632 6,426,357 7,608,993 4,976,330 2,632,663 2.75 2.92 2.44 10,339,681 581,556 $211,482LOP_HID 21,582,263 20,946,990 12,779,920 8,167,070 7,608,991 4,294,455 3,314,536 2.75 2.98 2.46 10,339,681 581,556 $211,482HIP_CTD 33,516,737 32,525,943 22,267,353 10,258,590 11,236,926 7,039,752 4,197,174 2.89 3.16 2.44 17,957,000 578,474 $211,670HIP_LOD 33,516,737 32,525,942 24,695,991 7,829,951 11,236,926 8,029,427 3,207,499 2.89 3.08 2.44 17,957,000 578,474 $211,670HIP_HID 33,516,737 32,525,942 18,016,140 14,509,802 11,236,927 5,338,820 5,898,107 2.89 3.37 2.46 17,957,000 578,474 $211,670
South Coast Region Demographic Information for Growth Scenarios
SCENARIOS
2050 Growth Scenarios
Irrigated Crop Area (x 1,000 acres)
Figure 1: Ag Land Use — South Coast
Population Density
Year Scenario Scenario
2006 Current Current
2050 Low High
2050 Low Current Trend
2050 Low Low
2050 Current Trend High
2050 Current Trend Current Trend
2050 Current Trend Low
2050 High High
2050 High Current Trend
2050 High Low
Topic: Data and Analytical Tools Scenarios of Future California Water Demand Through 2050
CA Water Plan Update 2013 Vol 4 Reference Guide Page 42

36
Appendix 5 Sacramento River Table 1: Growth Scenarios (Urban) — Sacramento River
Scenarioa 2050 Population (thousand)
Population Change (thousand) 2006b to 2050
Development Density
2050 Urban Footprint (thousand acres)
Urban Footprint Increase (thousand acres) 2006c to 2050
LOP-HID 3,894.6d 1,010.2 High 807.1 109.5
LOP-CTD 3,894.6 1,010.2 Current Trends 823.4 125.8
LOP-LOD 3,894.6 1,010.2 Low 839.5 141.9
CTP-HID 4,486.2e 1,601.8 High 882.9 185.3
CTP-CTD 4,486.2 1,601.8 Current Trends 906.6 209.0
CTP-LOD 4,486.2 1,601.8 Low 930.2 232.6
HIP-HID 5,892.6f 3,008.2 High 1,007.8 310.2
HIP-CTD 5,892.6 3,008.2 Current Trends 1,053.4 355.8
HIP-LOD 5,892.6 3,008.2 Low 1,098.1 400.5
Source: California Department of Water Resources 2012.
Notes:
a CTD = , CTP = , HID = , HIP = ,LOD = , LOP =
b 2006 population was 2,884.4 thousand.
C 2006 urban footprint was 697.6 thousand acres.
d Values modified by the California Department of Water Resources (DWR) from the Public Policy Institute of California.
e Values provided by the California Department of Finance.
f Values modified by DWR from the Public Policy Institute of California.
Topic: Data and Analytical Tools Scenarios of Future California Water Demand Through 2050
CA Water Plan Update 2013 Vol 4 Reference Guide Page 43

37
Table 2: Growth Scenarios (Agriculture) — Sacramento River
Scenarioa 2050 Irrigated Land Areab (thousand acres)
2050 Irrigated Crop Areac (thousand acres)
2050 Multiple Crop Aread (thousand acres)
Change in Irrigated Crop Area (thousand acres) 2006 to 2050
LOP-HID 1880.6 1895.1 14.5 -4.8
LOP-CTD 1876.6 1891.1 14.5 -8.9
LOP-LOD 1872.8 1887.2 14.4 -12.7
CTP-HID 1859.3 1873.6 14.3 -26.3
CTP-CTD 1853.3 1867.6 14.3 -32.3
CTP-LOD 1846.9 1861.1 14.2 -38.8
HIP-HID 1825.7 1839.8 14.1 -60.1
HIP-CTD 1813.2 1827.2 14.0 -72.7
HIP-LOD 1800.6 1814.5 13.9 -85.4
Source: California Department of Water Resources 2012.
Notes:
a CTD = , CTP = , HID = , HIP = ,LOD = , LOP =
b 2006 Irrigated land area was estimated by the California Department of Water Resources (DWR) to be 1879.6 thousand acres.
c 2006 Irrigated crop area was estimated by DWR to be 1899.9 thousand acres.
d 2006 multiple crop area was estimated by DWR to be 20.3 thousand acres.
Topic: Data and Analytical Tools Scenarios of Future California Water Demand Through 2050
CA Water Plan Update 2013 Vol 4 Reference Guide Page 44

38
nd
nd
nd
0 200 400 600 800 1,000 1,200 1,400 1,600 1,800 2,000
Table 3: Growth Scenarios (Demographic) — Sacramento River
Total Household Population in Population in Total Single Family Multi-Family Total SF MF Commercial Industrial Woods & PoolePopulation Population Single Family HH Multi-Family HH Households Households Households P / HH P / HH P / HH Employment Employment Mean Income
2006 Base Year 2,884,442 2,824,691 2,139,331 685,360 1,093,806 791,812 301,994 2.58 2.70 2.27 1,539,898 72,729 $89,693CTP_CTD 4,486,215 4,378,102 3,433,171 944,931 1,688,041 1,259,006 429,035 2.59 2.73 2.20 2,611,568 55,515 $161,563CTP_LOD 4,486,215 4,378,098 3,567,374 810,724 1,688,038 1,319,834 368,204 2.59 2.70 2.20 2,611,568 55,515 $161,563CTP_HID 4,486,215 4,378,098 2,945,948 1,432,150 1,688,037 1,044,602 643,435 2.59 2.82 2.23 2,611,568 55,515 $161,563LOP_CTD 3,894,657 3,800,866 2,964,612 836,254 1,467,188 1,088,320 378,868 2.59 2.72 2.21 1,800,892 55,605 $161,517LOP_LOD 3,894,657 3,800,862 3,047,840 753,022 1,467,187 1,125,523 341,664 2.59 2.71 2.20 1,800,892 55,605 $161,517LOP_HID 3,894,657 3,800,864 2,678,143 1,122,721 1,467,185 965,919 501,266 2.59 2.77 2.24 1,800,892 55,605 $161,517HIP_CTD 5,892,626 5,749,931 4,542,239 1,207,692 2,217,079 1,669,984 547,095 2.59 2.72 2.21 2,904,049 55,507 $161,306HIP_LOD 5,892,626 5,749,933 4,819,522 930,411 2,217,078 1,794,326 422,752 2.59 2.69 2.20 2,904,049 55,507 $161,306HIP_HID 5,892,626 5,749,931 3,591,787 2,158,144 2,217,076 1,254,175 962,901 2.59 2.86 2.24 2,904,049 55,507 $161,306
Sacramento River Region Demographic Information for Growth Scenarios
SCENARIOS
2050 Growth Scenarios
Irrigated Crop Area (x 1,000 acres)
Figure 1: Ag Land Use — Sacramento River
Population Density
Year Scenario Scenario
2006 Current Current
2050 Low High
2050 Low Current Trend
2050 Low Low
2050 Current Trend High
2050 Current Trend Current Trend
2050 Current Trend Low
2050 High High
2050 High Current Trend
2050 High Low
Topic: Data and Analytical Tools Scenarios of Future California Water Demand Through 2050
CA Water Plan Update 2013 Vol 4 Reference Guide Page 45

39
Appendix 6 San Joaquin River Table 1: Growth Scenarios (Urban) — San Joaquin River
Scenarioa 2050 Population (thousand)
Population Change (thousand) 2006b to 2050
Development Density
2050 Urban Footprint (thousand acres)
Urban Footprint Increase (thousand acres) 2006c to 2050
LOP-HID 3,396.9d 1,367.4 High 550.1 141.2
LOP-CTD 3,396.9 1,367.4 Current Trends 570.7 161.8
LOP-LOD 3,396.9 1,367.4 Low 591.4 182.5
CTP-HID 3,685.0e 1,655.5 High 626.8 217.9
CTP-CTD 3,685.0 1,655.5 Current Trends 653.8 244.9
CTP-LOD 3,685.0 1,655.5 Low 681.0 272.1
HIP-HID 4,941.1f 2,911.6 High 736.3 327.4
HIP-CTD 4,941.1 2,911.6 Current Trends 788.6 379.7
HIP-LOD 4,941.1 2,911.6 Low 841.6 432.7
Source: California Department of Water Resources 2012.
Notes:
a CTD = , CTP = , HID = , HIP = ,LOD = , LOP =
b 2006 population was 2.029.5 thousand.
C 2006 urban footprint was 408.9 thousand acres.
d Values modified by the California Department of Water Resources (DWR) from the Public Policy Institute of California.
e Values provided by the California Department of Finance.
f Values modified by DWR from the Public Policy Institute of California.
Topic: Data and Analytical Tools Scenarios of Future California Water Demand Through 2050
CA Water Plan Update 2013 Vol 4 Reference Guide Page 46
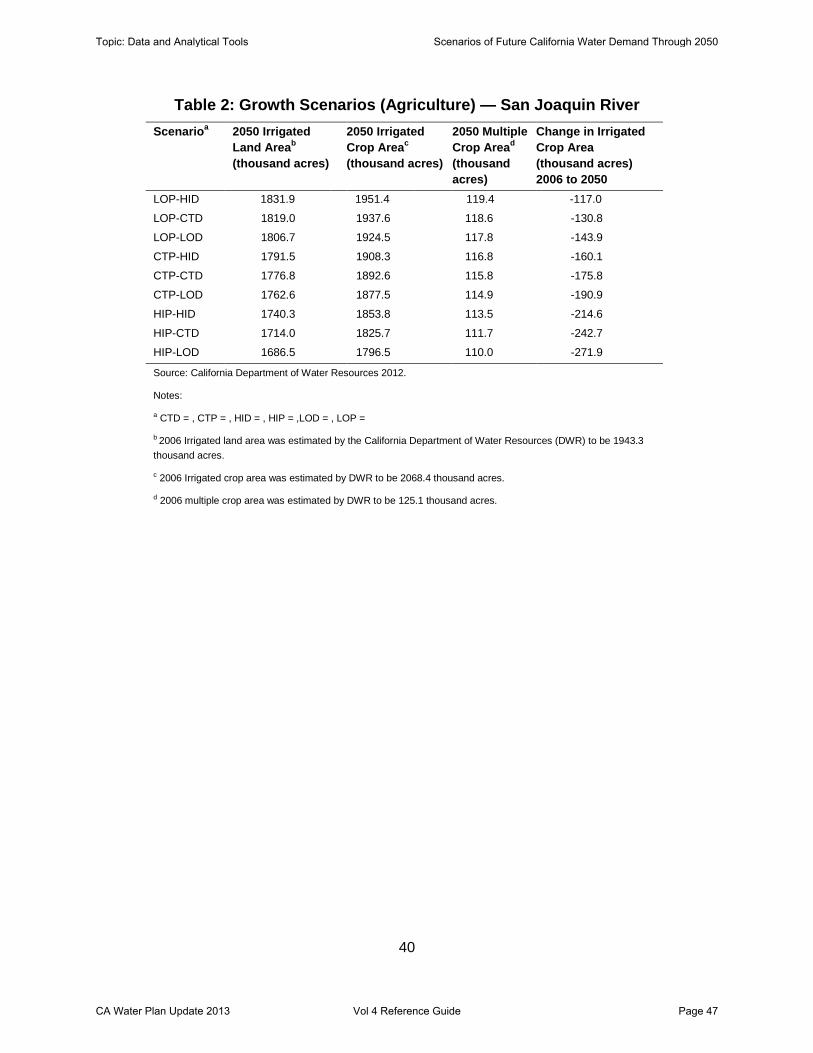
40
Table 2: Growth Scenarios (Agriculture) — San Joaquin River Scenarioa 2050 Irrigated
Land Areab (thousand acres)
2050 Irrigated Crop Areac (thousand acres)
2050 Multiple Crop Aread (thousand acres)
Change in Irrigated Crop Area (thousand acres) 2006 to 2050
LOP-HID 1831.9 1951.4 119.4 -117.0
LOP-CTD 1819.0 1937.6 118.6 -130.8
LOP-LOD 1806.7 1924.5 117.8 -143.9
CTP-HID 1791.5 1908.3 116.8 -160.1
CTP-CTD 1776.8 1892.6 115.8 -175.8
CTP-LOD 1762.6 1877.5 114.9 -190.9
HIP-HID 1740.3 1853.8 113.5 -214.6
HIP-CTD 1714.0 1825.7 111.7 -242.7
HIP-LOD 1686.5 1796.5 110.0 -271.9
Source: California Department of Water Resources 2012.
Notes:
a CTD = , CTP = , HID = , HIP = ,LOD = , LOP =
b 2006 Irrigated land area was estimated by the California Department of Water Resources (DWR) to be 1943.3 thousand acres.
c 2006 Irrigated crop area was estimated by DWR to be 2068.4 thousand acres.
d 2006 multiple crop area was estimated by DWR to be 125.1 thousand acres.
Topic: Data and Analytical Tools Scenarios of Future California Water Demand Through 2050
CA Water Plan Update 2013 Vol 4 Reference Guide Page 47

41
nd
nd
nd
0 500 1,000 1,500 2,000 2,500
Table 3: Growth Scenarios (Demographic) — San Joaquin River
Total Household Population in Population in Total Single Family Multi-Family Total SF MF Commercial Industrial Woods & PoolePopulation Population Single Family HH Multi-Family HH Households Households Households P / HH P / HH P / HH Employment Employment Mean Income
2006 Base Year 2,029,462 1,975,541 1,567,412 408,129 678,842 530,021 148,821 2.91 2.96 2.74 839,812 70,697 $89,252CTP_CTD 3,685,017 3,597,130 2,963,918 633,212 1,248,287 1,011,186 237,101 2.88 2.93 2.67 1,908,400 48,635 $164,247CTP_LOD 3,685,017 3,597,129 3,066,044 531,085 1,248,289 1,047,980 200,309 2.88 2.93 2.65 1,908,400 48,635 $164,247CTP_HID 3,685,017 3,597,131 2,322,834 1,274,297 1,248,288 784,729 463,559 2.88 2.96 2.75 1,908,400 48,635 $164,247LOP_CTD 3,396,946 3,315,778 2,724,749 591,029 1,150,604 929,949 220,655 2.88 2.93 2.68 1,325,216 48,568 $163,597LOP_LOD 3,396,946 3,315,777 2,810,025 505,752 1,150,604 960,214 190,390 2.88 2.93 2.66 1,325,216 48,568 $163,597LOP_HID 3,396,946 3,315,778 2,181,875 1,133,903 1,150,606 740,241 410,365 2.88 2.95 2.76 1,325,216 48,568 $163,597HIP_CTD 4,941,139 4,821,595 4,013,679 807,916 1,675,655 1,372,467 303,188 2.88 2.92 2.66 2,110,304 48,466 $163,709HIP_LOD 4,941,139 4,821,595 4,196,710 624,885 1,675,657 1,439,254 236,403 2.88 2.92 2.64 2,110,304 48,466 $163,709HIP_HID 4,941,139 4,821,595 2,899,490 1,922,105 1,675,656 975,629 700,027 2.88 2.97 2.75 2,110,304 48,466 $163,709
San Joaquin River Region Demographic Information for Growth Scenarios
SCENARIOS
2050 Growth Scenarios
Irrigated Crop Area (x 1,000 acres)
Figure 1: Ag Land Use — San Joaquin River
Population Density
Year Scenario Scenario
2006 Current Current
2050 Low High
2050 Low Current Trend
2050 Low Low
2050 Current Trend High
2050 Current Trend Current Trend
2050 Current Trend Low
2050 High High
2050 High Current Trend
2050 High Low
Topic: Data and Analytical Tools Scenarios of Future California Water Demand Through 2050
CA Water Plan Update 2013 Vol 4 Reference Guide Page 48

42
Appendix 7 Tulare Lake Table 1: Growth Scenarios (Urban) — Tulare Lake
Scenarioa 2050 Population (thousand)
Population Change (thousand) 2006b to 2050
Development Density
2050 Urban Footprint (thousand acres)
Urban Footprint Increase (thousand acres) 2006c to 2050
LOP-HID 3,588.5d 1,445.6 High 627.0 129.3
LOP-CTD 3,588.5 1,445.6 Current Trends 647.5 149.8
LOP-LOD 3,588.5 1,445.6 Low 667.3 169.6
CTP-HID 4,351.6e 2,208.7 High 727.1 229.4
CTP-CTD 4,351.6 2,208.7 Current Trends 756.8 259.1
CTP-LOD 4,351.6 2,208.7 Low 787.1 289.4
HIP-HID 5,345.9f 3,203.0 High 785.9 288.2
HIP-CTD 5,345.9 3,203.0 Current Trends 829.3 331.6
HIP-LOD 5,345.9 3,203.0 Low 873.7 376.0
Source: California Department of Water Resources 2012.
Notes:
a CTD = , CTP = , HID = , HIP = ,LOD = , LOP =
b 2006 population was 2,142.9 thousand.
C 2006 urban footprint was 497.7 thousand acres.
d Values modified by the California Department of Water Resources (DWR) from the Public Policy Institute of California.
e Values provided by the California Department of Finance.
f Values modified by DWR from the Public Policy Institute of California.
Topic: Data and Analytical Tools Scenarios of Future California Water Demand Through 2050
CA Water Plan Update 2013 Vol 4 Reference Guide Page 49
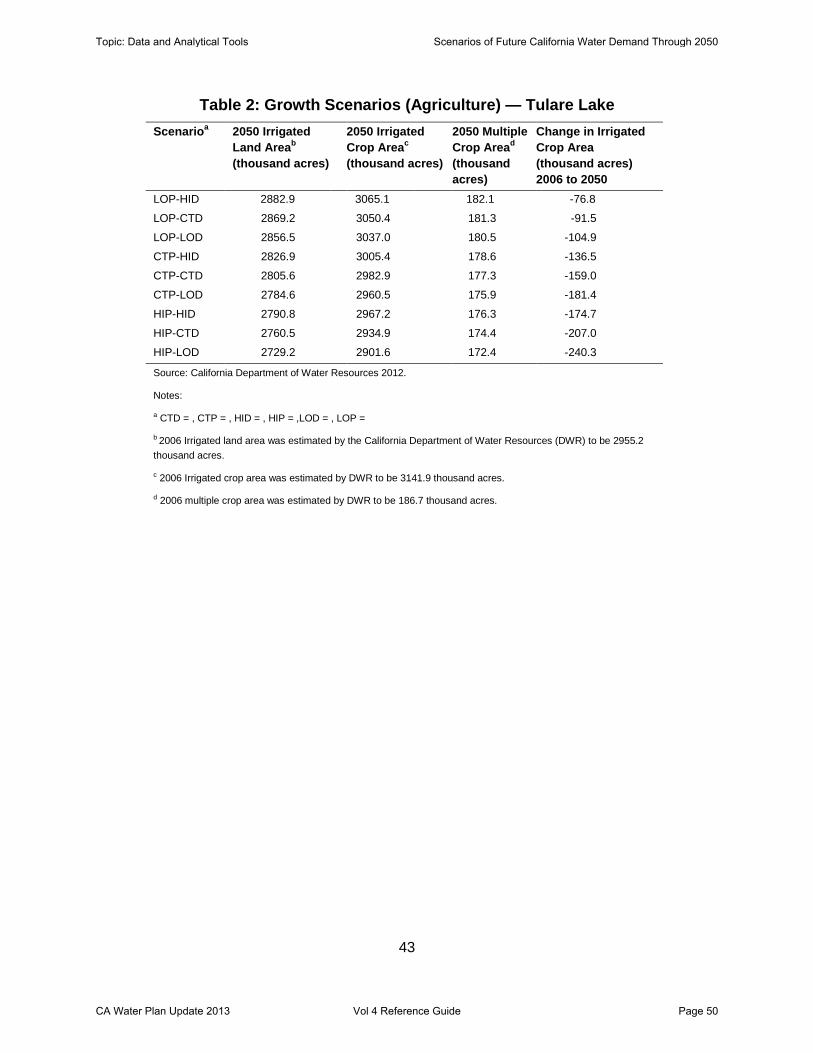
43
Table 2: Growth Scenarios (Agriculture) — Tulare Lake
Scenarioa 2050 Irrigated Land Areab (thousand acres)
2050 Irrigated Crop Areac (thousand acres)
2050 Multiple Crop Aread (thousand acres)
Change in Irrigated Crop Area (thousand acres) 2006 to 2050
LOP-HID 2882.9 3065.1 182.1 -76.8
LOP-CTD 2869.2 3050.4 181.3 -91.5
LOP-LOD 2856.5 3037.0 180.5 -104.9
CTP-HID 2826.9 3005.4 178.6 -136.5
CTP-CTD 2805.6 2982.9 177.3 -159.0
CTP-LOD 2784.6 2960.5 175.9 -181.4
HIP-HID 2790.8 2967.2 176.3 -174.7
HIP-CTD 2760.5 2934.9 174.4 -207.0
HIP-LOD 2729.2 2901.6 172.4 -240.3
Source: California Department of Water Resources 2012.
Notes:
a CTD = , CTP = , HID = , HIP = ,LOD = , LOP =
b 2006 Irrigated land area was estimated by the California Department of Water Resources (DWR) to be 2955.2 thousand acres.
c 2006 Irrigated crop area was estimated by DWR to be 3141.9 thousand acres.
d 2006 multiple crop area was estimated by DWR to be 186.7 thousand acres.
Topic: Data and Analytical Tools Scenarios of Future California Water Demand Through 2050
CA Water Plan Update 2013 Vol 4 Reference Guide Page 50

44
0 500 1,000 1,500 2,000 2,500 3,000 3,500
Table 3: Growth Scenarios (Demographic) — Tulare Lake
Total Household Population in Population in Total Single Family Multi-Family Total SF MF Commercial Industrial Woods & PoolePopulation Population Single Family HH Multi-Family HH Households Households Households P / HH P / HH P / HH Employment Employment Mean Income
2006 Base Year 2,142,863 2,061,500 1,563,564 497,936 655,029 484,560 170,469 3.15 3.23 2.92 946,757 68,214 $82,056CTP_CTD 4,351,581 4,234,192 3,315,567 918,625 1,397,155 1,051,848 345,307 3.03 3.15 2.66 2,207,529 75,385 $154,710CTP_LOD 4,351,581 4,234,192 3,609,145 625,047 1,397,156 1,162,275 234,881 3.03 3.11 2.66 2,207,529 75,385 $154,710CTP_HID 4,351,581 4,234,192 2,564,147 1,670,045 1,397,155 768,624 628,531 3.03 3.34 2.66 2,207,529 75,385 $154,710LOP_CTD 3,588,539 3,490,860 2,721,395 769,465 1,151,914 862,705 289,209 3.03 3.15 2.66 1,459,766 75,229 $154,409LOP_LOD 3,588,539 3,490,860 2,913,553 577,307 1,151,915 935,002 216,913 3.03 3.12 2.66 1,459,766 75,229 $154,409LOP_HID 3,588,539 3,490,859 2,227,977 1,262,882 1,151,915 676,695 475,220 3.03 3.29 2.66 1,459,766 75,229 $154,409HIP_CTD 5,345,935 5,199,174 4,066,000 1,133,174 1,715,425 1,289,546 425,879 3.03 3.15 2.66 2,205,805 75,493 $154,362HIP_LOD 5,345,935 5,199,174 4,497,977 701,197 1,715,426 1,451,943 263,483 3.03 3.10 2.66 2,205,805 75,493 $154,362HIP_HID 5,345,935 5,199,175 2,953,053 2,246,122 1,715,425 870,320 845,105 3.03 3.39 2.66 2,205,805 75,493 $154,362
Tulare Lake Region Demographic Information for Growth Scenarios
SCENARIOS
2050 Growth Scenarios
Irrigated Crop Area (x 1,000 acres)
Figure 1: Ag Land Use — Tulare Lake
Population Density
Year Scenario Scenario
2006 Current Current
2050 Low High
2050 Low Current Trend
2050 Low Low
2050 Current Trend High
2050 Current Trend Current Trend
2050 Current Trend Low
2050 High High
2050 High Current Trend
2050 High Low
Topic: Data and Analytical Tools Scenarios of Future California Water Demand Through 2050
CA Water Plan Update 2013 Vol 4 Reference Guide Page 51

45
Appendix 8 North Lahontan Table 1: Growth Scenarios (Urban) — North Lahontan
Scenarioa 2050 Population (thousand)
Population Change (thousand) 2006b to 2050
Development Density
2050 Urban Footprint (thousand acres)
Urban Footprint Increase (thousand acres) 2006c to 2050
LOP-HID 113.1d 15.2 High 46.2 2.7
LOP-CTD 113.1 15.2 Current Trends 46.4 2.9
LOP-LOD 113.1 15.2 Low 46.6 3.1
CTP-HID 119.9e 22.0 High 48.0 4.5
CTP-CTD 119.9 22.0 Current Trends 48.4 4.9
CTP-LOD 119.9 22.0 Low 48.6 5.1
HIP-HID 159.8f 61.9 High 54.8 11.3
HIP-CTD 159.8 61.9 Current Trends 56.5 13.0
HIP-LOD 159.8 61.9 Low 58.5 15.0
Source: California Department of Water Resources 2012.
Notes:
a CTD = , CTP = , HID = , HIP = ,LOD = , LOP =
b 2006 population was 97.9 thousand.
C 2006 urban footprint was 43.5 thousand acres.
d Values modified by the California Department of Water Resources (DWR) from the Public Policy Institute of California.
e Values provided by the California Department of Finance.
f Values modified by DWR from the Public Policy Institute of California.
Topic: Data and Analytical Tools Scenarios of Future California Water Demand Through 2050
CA Water Plan Update 2013 Vol 4 Reference Guide Page 52
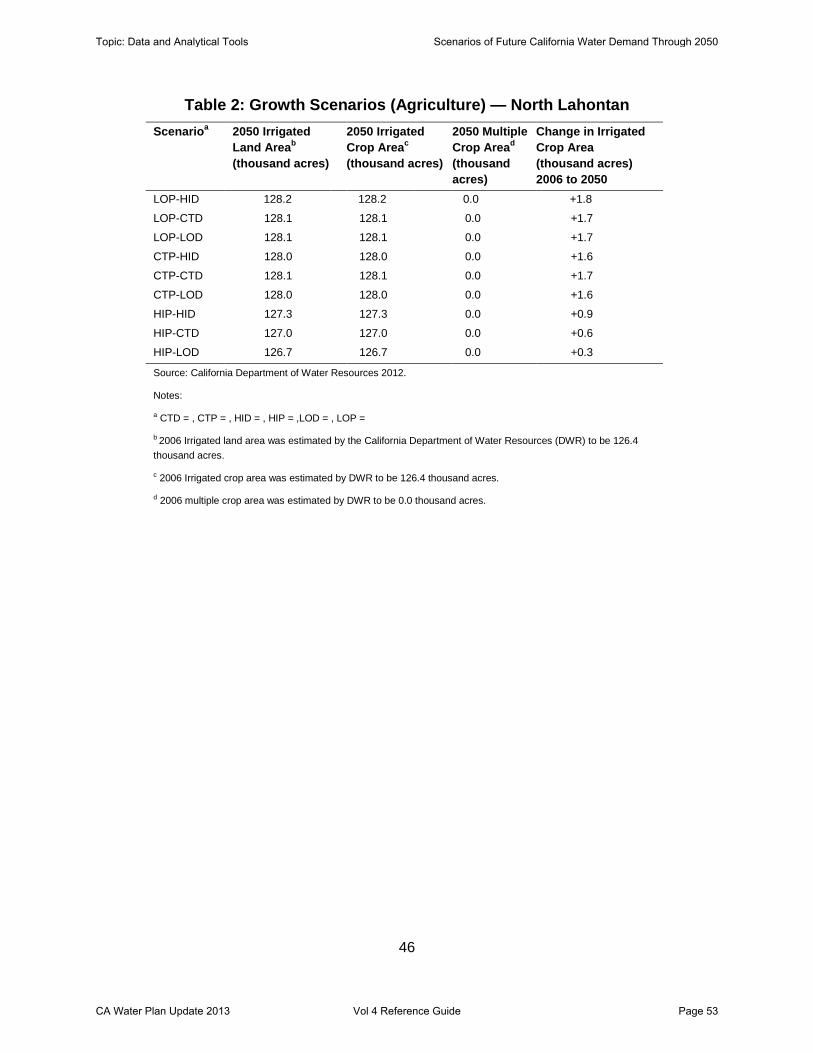
46
Table 2: Growth Scenarios (Agriculture) — North Lahontan
Scenarioa 2050 Irrigated Land Areab (thousand acres)
2050 Irrigated Crop Areac (thousand acres)
2050 Multiple Crop Aread (thousand acres)
Change in Irrigated Crop Area (thousand acres) 2006 to 2050
LOP-HID 128.2 128.2 0.0 +1.8
LOP-CTD 128.1 128.1 0.0 +1.7
LOP-LOD 128.1 128.1 0.0 +1.7
CTP-HID 128.0 128.0 0.0 +1.6
CTP-CTD 128.1 128.1 0.0 +1.7
CTP-LOD 128.0 128.0 0.0 +1.6
HIP-HID 127.3 127.3 0.0 +0.9
HIP-CTD 127.0 127.0 0.0 +0.6
HIP-LOD 126.7 126.7 0.0 +0.3
Source: California Department of Water Resources 2012.
Notes:
a CTD = , CTP = , HID = , HIP = ,LOD = , LOP =
b 2006 Irrigated land area was estimated by the California Department of Water Resources (DWR) to be 126.4 thousand acres.
c 2006 Irrigated crop area was estimated by DWR to be 126.4 thousand acres.
d 2006 multiple crop area was estimated by DWR to be 0.0 thousand acres.
Topic: Data and Analytical Tools Scenarios of Future California Water Demand Through 2050
CA Water Plan Update 2013 Vol 4 Reference Guide Page 53

47
d
d
d
0 20 40 60 80 100 120 140
Table 3: Growth Scenarios (Demographic) — North Lahontan
Total Household Population in Population in Total Single Family Multi-Family Total SF MF Commercial Industrial Woods & PoolePopulation Population Single Family HH Multi-Family HH Households Households Households P / HH P / HH P / HH Employment Employment Mean Income
2006 Base Year 97,922 88,747 72,202 16,545 35,880 28,354 7,526 2.47 2.55 2.20 49,359 1,481 $94,340CTP_CTD 119,879 108,445 90,266 18,179 44,642 36,486 8,156 2.43 2.47 2.23 74,764 1,461 $169,894CTP_LOD 119,879 108,445 90,653 17,792 44,644 36,664 7,980 2.43 2.47 2.23 74,764 1,461 $169,894CTP_HID 119,879 108,445 88,631 19,814 44,642 35,734 8,908 2.43 2.48 2.22 74,764 1,461 $169,895LOP_CTD 113,111 102,259 84,566 17,693 41,912 33,958 7,954 2.44 2.49 2.22 49,951 1,483 $170,361LOP_LOD 113,111 102,260 84,780 17,480 41,914 34,056 7,858 2.44 2.49 2.22 49,951 1,483 $170,357LOP_HID 113,111 102,261 83,613 18,648 41,914 33,521 8,393 2.44 2.49 2.22 49,951 1,483 $170,359HIP_CTD 159,789 141,288 121,296 19,992 58,252 49,299 8,953 2.43 2.46 2.23 74,192 1,413 $164,539HIP_LOD 159,789 141,289 122,182 19,107 58,252 49,705 8,547 2.43 2.46 2.24 74,192 1,413 $164,540HIP_HID 159,789 141,289 117,398 23,891 58,253 47,515 10,738 2.43 2.47 2.22 74,192 1,413 $164,539
North Lahontan Region Demographic Information for Growth Scenarios
SCENARIOS
2050 Growth Scenarios
Irrigated Crop Area (x 1,000 acres)
Figure 1: Ag Land Use — North Lahontan
Population Density
Year Scenario Scenario
2006 Current Current
2050 Low High
2050 Low Current Trend
2050 Low Low
2050 Current Trend High
2050 Current Trend Current Trend
2050 Current Trend Low
2050 High High
2050 High Current Trend
2050 High Low
Topic: Data and Analytical Tools Scenarios of Future California Water Demand Through 2050
CA Water Plan Update 2013 Vol 4 Reference Guide Page 54

48
Appendix 9 South Lahontan Table 1: Growth Scenarios (Urban) — South Lahontan
Scenarioa 2050 Population (thousand)
Population Change (thousand) 2006b to 2050
Development Density
2050 Urban Footprint (thousand acres)
Urban Footprint Increase (thousand acres) 2006c to 2050
LOP-HID 1,374.7d 501.4 High 333.4 67.3
LOP-CTD 1,374.7 501.4 Current Trends 341.6 75.5
LOP-LOD 1,374.7 501.4 Low 348.4 82.3
CTP-HID 1,592.5e 719.2 High 398.3 132.1
CTP-CTD 1,592.5 719.2 Current Trends 408.1 142.0
CTP-LOD 1,592.5 719.2 Low 420.0 153.9
HIP-HID 2,293.0f 1,419.7 High 497.5 231.4
HIP-CTD 2,293.0 1,419.7 Current Trends 527.2 261.1
HIP-LOD 2,293.0 1,419.7 Low 556.9 290.8
Source: California Department of Water Resources 2012.
Notes:
a CTD = , CTP = , HID = , HIP = ,LOD = , LOP =
b 2006 population was 873.3 thousand.
C 2006 urban footprint was 266.1 thousand acres.
d Values modified by the California Department of Water Resources (DWR) from the Public Policy Institute of California.
e Values provided by the California Department of Finance.
f Values modified by DWR from the Public Policy Institute of California.
Topic: Data and Analytical Tools Scenarios of Future California Water Demand Through 2050
CA Water Plan Update 2013 Vol 4 Reference Guide Page 55
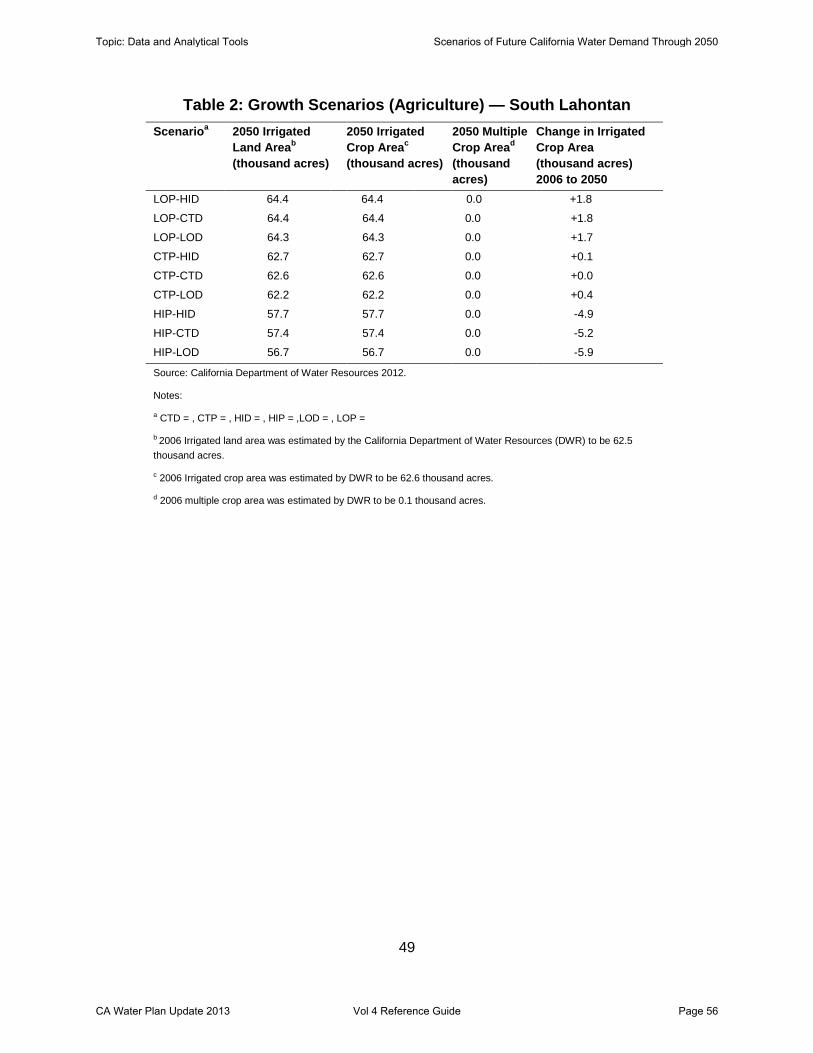
49
Table 2: Growth Scenarios (Agriculture) — South Lahontan
Scenarioa 2050 Irrigated Land Areab (thousand acres)
2050 Irrigated Crop Areac (thousand acres)
2050 Multiple Crop Aread (thousand acres)
Change in Irrigated Crop Area (thousand acres) 2006 to 2050
LOP-HID 64.4 64.4 0.0 +1.8
LOP-CTD 64.4 64.4 0.0 +1.8
LOP-LOD 64.3 64.3 0.0 +1.7
CTP-HID 62.7 62.7 0.0 +0.1
CTP-CTD 62.6 62.6 0.0 +0.0
CTP-LOD 62.2 62.2 0.0 +0.4
HIP-HID 57.7 57.7 0.0 -4.9
HIP-CTD 57.4 57.4 0.0 -5.2
HIP-LOD 56.7 56.7 0.0 -5.9
Source: California Department of Water Resources 2012.
Notes:
a CTD = , CTP = , HID = , HIP = ,LOD = , LOP =
b 2006 Irrigated land area was estimated by the California Department of Water Resources (DWR) to be 62.5 thousand acres.
c 2006 Irrigated crop area was estimated by DWR to be 62.6 thousand acres.
d 2006 multiple crop area was estimated by DWR to be 0.1 thousand acres.
Topic: Data and Analytical Tools Scenarios of Future California Water Demand Through 2050
CA Water Plan Update 2013 Vol 4 Reference Guide Page 56

50
0 10 20 30 40 50 60 70
Table 3: Growth Scenarios (Demographic) — South Lahontan
Total Household Population in Population in Total Single Family Multi-Family Total SF MF Commercial Industrial Woods & PoolePopulation Population Single Family HH Multi-Family HH Households Households Households P / HH P / HH P / HH Employment Employment Mean Income
2006 Base Year 873,359 851,463 609,625 241,838 275,559 182,634 92,925 3.09 3.34 2.60 407,123 35,734 $94,341CTP_CTD 1,592,506 1,549,189 1,129,413 419,776 513,011 344,502 168,509 3.02 3.28 2.49 892,178 26,567 $185,688CTP_LOD 1,592,506 1,549,188 1,184,027 365,161 513,012 366,092 146,920 3.02 3.23 2.49 892,178 26,567 $185,687CTP_HID 1,592,506 1,549,189 1,023,355 525,834 513,014 302,737 210,277 3.02 3.38 2.50 892,178 26,567 $185,687LOP_CTD 1,374,730 1,337,743 973,583 364,160 450,572 304,987 145,585 2.97 3.19 2.50 583,727 25,745 $182,808LOP_LOD 1,374,730 1,337,743 1,013,048 324,695 450,572 320,511 130,061 2.97 3.16 2.50 583,727 25,745 $182,808LOP_HID 1,374,730 1,337,742 896,435 441,307 450,572 274,747 175,825 2.97 3.26 2.51 583,727 25,745 $182,808HIP_CTD 2,293,037 2,229,691 1,573,579 656,112 746,523 480,279 266,244 2.99 3.28 2.46 1,140,375 27,865 $192,362HIP_LOD 2,293,037 2,229,691 1,729,275 500,416 746,523 543,308 203,215 2.99 3.18 2.46 1,140,375 27,865 $192,362HIP_HID 2,293,037 2,229,691 1,303,687 926,004 746,524 371,387 375,137 2.99 3.51 2.47 1,140,375 27,865 $192,362
South Lahontan Region Demographic Information for Growth Scenarios
SCENARIOS
2050 Growth Scenarios
Irrigated Crop Area (x 1,000 acres)
Figure 1: Ag Land Use — South Lahontan
Population Density
Year Scenario Scenario
2006 Current Current
2050 Low High
2050 Low Current Trend
2050 Low Low
2050 Current Trend High
2050 Current Trend Current Trend
2050 Current Trend Low
2050 High High
2050 High Current Trend
2050 High Low
Topic: Data and Analytical Tools Scenarios of Future California Water Demand Through 2050
CA Water Plan Update 2013 Vol 4 Reference Guide Page 57
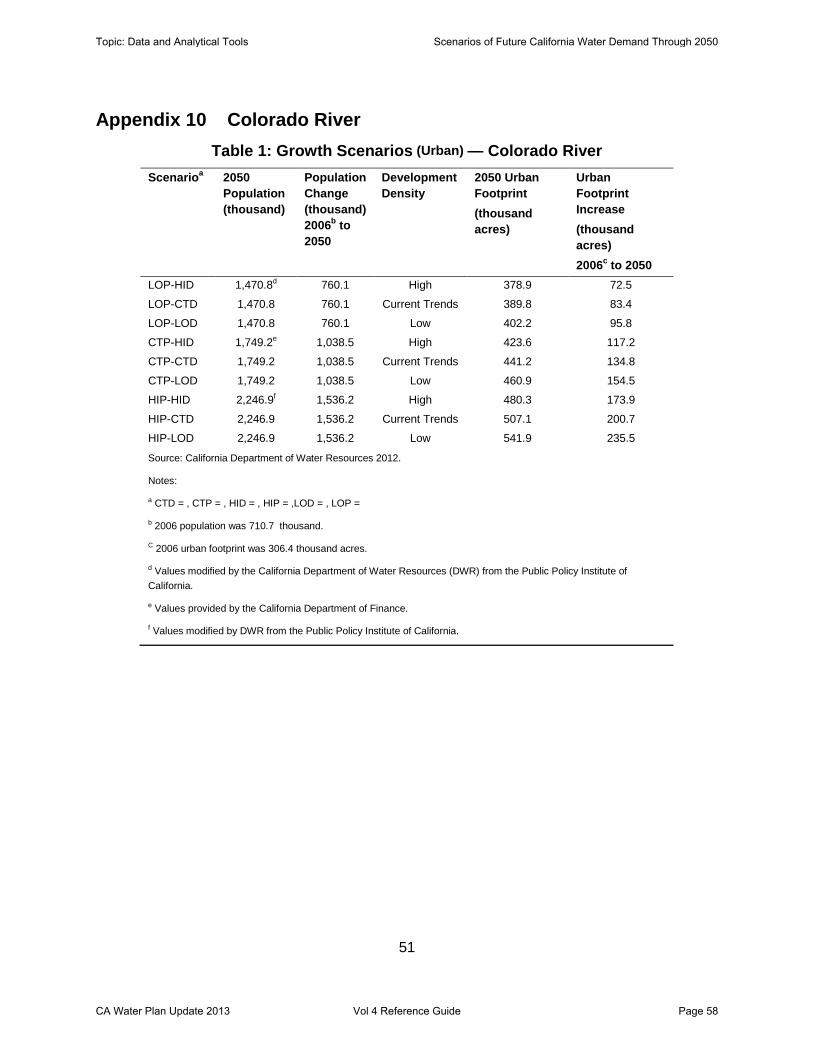
51
Appendix 10 Colorado River Table 1: Growth Scenarios (Urban) — Colorado River
Scenarioa 2050 Population (thousand)
Population Change (thousand) 2006b to 2050
Development Density
2050 Urban Footprint (thousand acres)
Urban Footprint Increase (thousand acres) 2006c to 2050
LOP-HID 1,470.8d 760.1 High 378.9 72.5
LOP-CTD 1,470.8 760.1 Current Trends 389.8 83.4
LOP-LOD 1,470.8 760.1 Low 402.2 95.8
CTP-HID 1,749.2e 1,038.5 High 423.6 117.2
CTP-CTD 1,749.2 1,038.5 Current Trends 441.2 134.8
CTP-LOD 1,749.2 1,038.5 Low 460.9 154.5
HIP-HID 2,246.9f 1,536.2 High 480.3 173.9
HIP-CTD 2,246.9 1,536.2 Current Trends 507.1 200.7
HIP-LOD 2,246.9 1,536.2 Low 541.9 235.5
Source: California Department of Water Resources 2012.
Notes:
a CTD = , CTP = , HID = , HIP = ,LOD = , LOP =
b 2006 population was 710.7 thousand.
C 2006 urban footprint was 306.4 thousand acres.
d Values modified by the California Department of Water Resources (DWR) from the Public Policy Institute of California.
e Values provided by the California Department of Finance.
f Values modified by DWR from the Public Policy Institute of California.
Topic: Data and Analytical Tools Scenarios of Future California Water Demand Through 2050
CA Water Plan Update 2013 Vol 4 Reference Guide Page 58

52
Table 2: Growth Scenarios (Agriculture) — Colorado River Scenarioa 2050 Irrigated
Land Areab (thousand acres)
2050 Irrigated Crop Areac (thousand acres)
2050 Multiple Crop Aread (thousand acres)
Change in Irrigated Crop Area (thousand acres) 2006 to 2050
LOP-HID 567.9 660.4 92.5 -8.0
LOP-CTD 566.6 658.9 92.3 -9.5
LOP-LOD 565.1 657.2 92.1 -11.1
CTP-HID 558.6 649.5 91.0 -18.8
CTP-CTD 556.4 647.0 90.6 -21.3
CTP-LOD 554.2 644.5 90.3 -23.8
HIP-HID 547.1 636.2 89.1 -32.1
HIP-CTD 543.3 631.8 88.5 -36.5
HIP-LOD 538.8 626.6 87.8 -41.7
Source: California Department of Water Resources 2012.
Notes:
a CTD = , CTP = , HID = , HIP = ,LOD = , LOP =
b 2006 Irrigated land area was estimated by the California Department of Water Resources (DWR) to be 589.3 thousand acres.
c 2006 Irrigated crop area was estimated by DWR to be 668.3 thousand acres.
d 2006 multiple crop area was estimated by DWR to be 79.0 thousand acres.
Topic: Data and Analytical Tools Scenarios of Future California Water Demand Through 2050
CA Water Plan Update 2013 Vol 4 Reference Guide Page 59
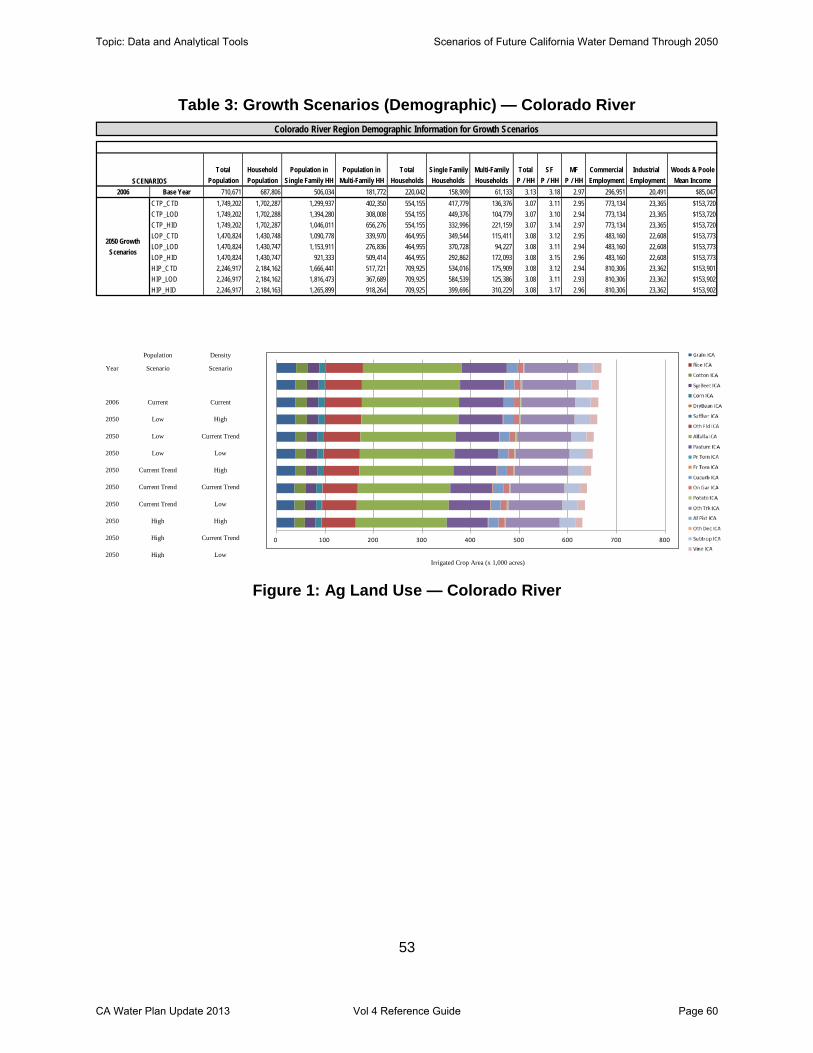
53
0 100 200 300 400 500 600 700 800
Table 3: Growth Scenarios (Demographic) — Colorado River
Total Household Population in Population in Total Single Family Multi-Family Total SF MF Commercial Industrial Woods & PoolePopulation Population Single Family HH Multi-Family HH Households Households Households P / HH P / HH P / HH Employment Employment Mean Income
2006 Base Year 710,671 687,806 506,034 181,772 220,042 158,909 61,133 3.13 3.18 2.97 296,951 20,491 $85,047CTP_CTD 1,749,202 1,702,287 1,299,937 402,350 554,155 417,779 136,376 3.07 3.11 2.95 773,134 23,365 $153,720CTP_LOD 1,749,202 1,702,288 1,394,280 308,008 554,155 449,376 104,779 3.07 3.10 2.94 773,134 23,365 $153,720CTP_HID 1,749,202 1,702,287 1,046,011 656,276 554,155 332,996 221,159 3.07 3.14 2.97 773,134 23,365 $153,720LOP_CTD 1,470,824 1,430,748 1,090,778 339,970 464,955 349,544 115,411 3.08 3.12 2.95 483,160 22,608 $153,773LOP_LOD 1,470,824 1,430,747 1,153,911 276,836 464,955 370,728 94,227 3.08 3.11 2.94 483,160 22,608 $153,773LOP_HID 1,470,824 1,430,747 921,333 509,414 464,955 292,862 172,093 3.08 3.15 2.96 483,160 22,608 $153,773HIP_CTD 2,246,917 2,184,162 1,666,441 517,721 709,925 534,016 175,909 3.08 3.12 2.94 810,306 23,362 $153,901HIP_LOD 2,246,917 2,184,162 1,816,473 367,689 709,925 584,539 125,386 3.08 3.11 2.93 810,306 23,362 $153,902HIP_HID 2,246,917 2,184,163 1,265,899 918,264 709,925 399,696 310,229 3.08 3.17 2.96 810,306 23,362 $153,902
Colorado River Region Demographic Information for Growth Scenarios
SCENARIOS
2050 Growth Scenarios
Irrigated Crop Area (x 1,000 acres)
Figure 1: Ag Land Use — Colorado River
Population Density
Year Scenario Scenario
2006 Current Current
2050 Low High
2050 Low Current Trend
2050 Low Low
2050 Current Trend High
2050 Current Trend Current Trend
2050 Current Trend Low
2050 High High
2050 High Current Trend
2050 High Low
Topic: Data and Analytical Tools Scenarios of Future California Water Demand Through 2050
CA Water Plan Update 2013 Vol 4 Reference Guide Page 60