scaling parameters for dynamic diffusion-reaction over porous
TRANSCRIPT
UC San DiegoUC San Diego Previously Published Works
TitleScaling parameters for dynamic diffusion-reaction over porous catalysts
Permalinkhttps://escholarship.org/uc/item/9bc7v3kv
JournalIndustrial and Engineering Chemistry Research, 54(16)
ISSN0888-5885
AuthorHerz, RK
Publication Date2015-04-29
DOI10.1021/ie503860w Peer reviewed
eScholarship.org Powered by the California Digital LibraryUniversity of California
Scaling parameters for dynamic di↵usion-reaction
over porous catalysts
Richard K. Herz⇤
NanoEngineering Department, Jacobs School of Engineering, University of California, San
Diego, CA, USA 92093-0448
E-mail: [email protected]
Cite as: Herz, R.K., Ind. Eng. Chem. Res., 2015, 54 (16), pp 4095-4102. doi: 10.1021/ie503860w
Abstract
The e↵ect of di↵usion resistance in porous solid catalysts on reaction rate during peri-
odic cycling of CO concentration is shown for CO oxidation over Pt/Al2O3 by numerical
simulation. At some cycling frequencies, the average reaction rate during cycling is higher
than the steady-state rate at the mean CO concentration, as expected for this nonlinear,
reactant-inhibited reaction. In order to identify major aspects of dynamic di↵usion-reaction
behavior, a simple kinetic mechanism that shows the main features of CO oxidation and other
reactions with significant inhibition by reactants is investigated. A single dimensionless pa-
rameter group, the dynamic di↵usion coe�cient, is added when going from steady-state to
unsteady-state di↵usion-reaction equations. In the dynamic di↵usion coe�cient, the rate
at which gas-phase reactant di↵uses is reduced by the surface adsorption capacity of the
catalyst. The frequency at which the peak average rate occurs is controlled by the dynamic
di↵usion coe�cient. Keywords: dynamic, di↵usion-reaction, reaction-di↵usion, heteroge-
neous catalyst, porous catalyst, periodic operation, unsteady state.
⇤To whom correspondence should be addressed
1

Introduction
Scott Fogler’s textbooks1,2 helped teach my students the subject of reaction engineering
for over 20 years at UC San Diego. Scott was kind enough to include my Reactor Lab
software3 with the later editions of his reaction engineering texts.
I had the pleasure to meet Scott many years ago in Michigan, when I worked at GM
Research Labs. People from U. Michigan, Wayne State, GM, Ford, Dow and other research
labs in the area got together frequently at meetings of the Michigan Catalysis Society, where
we socialized and listened to visiting speakers.
At one of those meetings, Joe Kummer of Ford asked me about the research I was doing.
I explained something about di↵usion plus elementary step reaction models (microkinetics).
Joe replied, “steady state is boring!” Taken aback, I later realized that he had a point
and decided to focus on catalysis under dynamic conditions.4 The microkinetic models of
Herz and Marin5 were extended to dynamic conditions by our colleague at GM, Byong
Cho, who predicted interesting space-time patterns of components in porous catalysts.6 We
developed microkinetic di↵usion-reaction models, which we fit to time-resolved experimental
measurements of CO oxidation.7-10
Peter Silveston would sometimes visit the Michigan Catalysis Society from nearby Wa-
terloo University in Ontario, Canada. Peter later edited the book Composition Modulation
of Catalytic Reactors.11 Whereas we usually teach students to design systems to operate
at the optimal steady state, works in this book demonstrated that periodic operation of
reactors can sometimes achieve higher conversion of reactants than steady-state operation.
Peter, along with Robert Hudgins, recently published a related book, Periodic Operation of
Reactors,12 which reviews additional modes of operation such as temperature cycling.
The result that dynamic operation of a reactor has the potential to achieve better perfor-
mance than steady-state operation is both an intriguing and potentially profitable idea.13,14
In order for a reaction system to have the possibility of rate enhancement during composition
modulation, the kinetics must be nonlinear.13,15-18
2
Models with equations that describe dynamic di↵usion and reaction in porous catalysts
during composition forcing have been developed for specific reactions to explain experimen-
tal measurements. Many of these works have studied CO oxidation 6-10,19 or three-way
automotive catalytic reactions20 with rather complex models.
There is a need for studying periodic operation with more general models that exhibit
the main features of experimental results but whose di↵usion-reaction equations are simple
such that parameters that determine performance can be identified. An important feature
for any useful model is description of the maximum capacity of a porous catalyst for ad-
sorbed components. Work with models that specify linear adsorption and no limit on surface
coverage21 e↵ectively add only a reversible step to a homogenenous reaction system.
In this work, results for reactant composition cycling of CO oxidation in a porous cata-
lyst are presented. Significant aspects of the steady-state and dynamic behavior seen for CO
oxidation, such as rate enhancement during composition cycling, can also be obtained with
a simple reaction model with reactant inhibition. Di↵usion-reaction equations are devel-
oped for the simple model. Dimensionless scaling parameters are identified that explain the
frequency range in which maximum rate enhancement is obtained under limiting conditions.
Even with a simple reaction model under limiting conditions, the parameter and operating
condition ranges are large and outside the scope of this work. Thus, the goal of this work is
to stimulate further study of the dynamic operation of di↵usion-reaction systems.
Periodic Operation of a CO Oxidation Catalyst
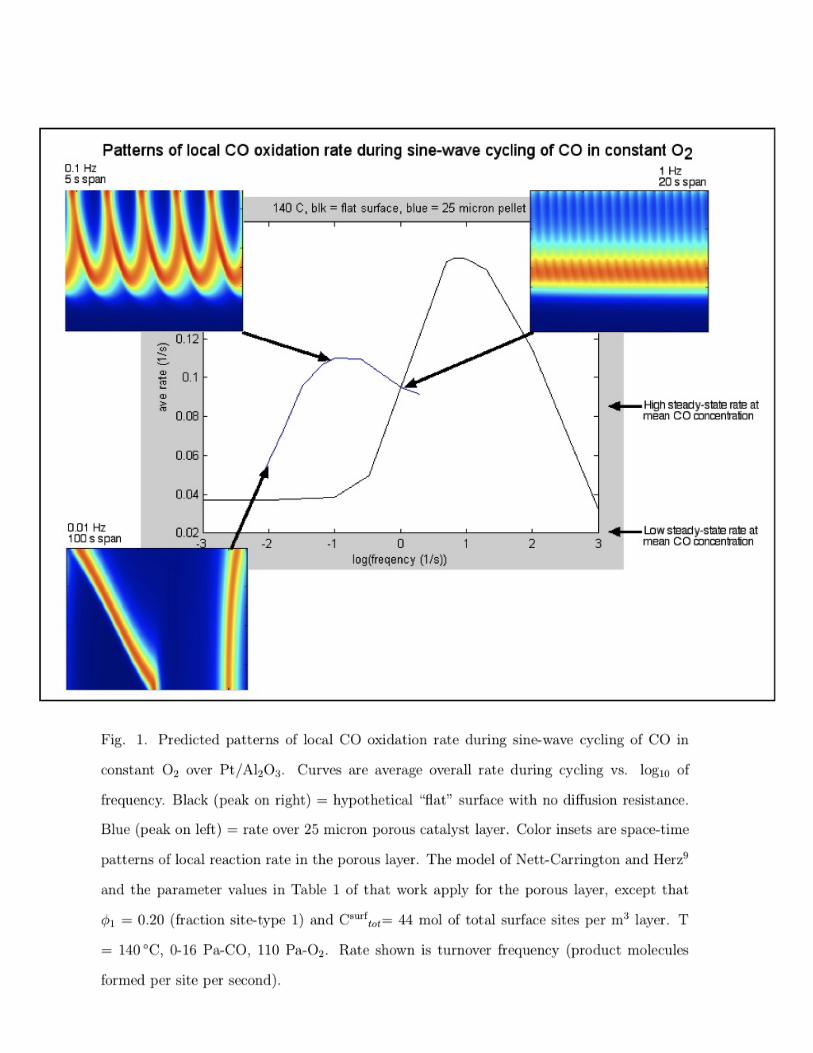
Fig. 1 shows plots of predicted average rate vs. frequency for periodic operation of a CO
oxidation catalyst. CO was cycled in a sine wave while the O2 pressure was held constant.
The detailed di↵usion-reaction model solved was that of Nett-Carrington and Herz9 for
a porous Pt/Al2O3 catalyst. The model was developed from experiments in which gas
concentrations were measured (a) for gas flowing over a porous catalyst layer and (b) at the
equivalent center of the layer where a no-flux boundary condition was closely approached.8
Isothermal conditions were assumed and were closely approached in the experiments used to
3

develop the model.8,9
The sti↵ system of partial di↵erential equations for the elementary-step model and porous
catalyst were integrated numerically using the Crank-Nicolson method9,22 with 40 equally
spaced nodes. An empty-surface initial condition was specified, and the system of equations
was integrated until a steady cycling pattern developed. Average rates are the mean of
local reaction rates within the layer during one period. Computation time is long for low
frequencies but a steady cycling pattern is reached after only a few cycles.
The curve that peaks on the right side of the figure is the average rate predicted for these
kinetics over a hypothetical “flat” catalyst surface with no mass transfer resistance.
The curve that peaks on the left side of the figure is the average rate predicted over
a 25 micron-thick porous catalyst layer at 140 �C, 0-16 Pa-CO, 110 Pa-O2. Compared to
the results for the flat catalyst, the peak in rate is lower in height and is at two-orders of
magnitude slower frequency. Although the presence of di↵usion resistance appears to degrade
the performance of the catalyst, the “flat” case with no di↵usion resistance is hypothetical
and most industrial catalysts are porous for a variety of reasons.
The color insets show space-time patterns of local reaction rate within the porous layer.
The vertical dimension is position in the layer and the horizontal dimension is time. The top
of each color inset is at the outer boundary of the layer that is exposed to flowing gas. The
bottom is the inner boundary of the layer with a no-flux boundary condition. Left-to-right
is the progression of time. The local reaction rate is on a color scale (MATLAB jet) that is
blue for low rate and red for high rate. There are no space-time patterns for the flat surface
because there is no spatial variation in that case.
At low cycling frequency, CO penetrates to the inner boundary of the porous catalyst
layer, and the rate is inhibited or “quenched” everywhere in the layer during part of the
cycle. At intermediate frequency near the peak in rate, there is a periodic looping pattern
of local rate in the layer. At high frequency, relaxed steady-state conditions are approached
such that the average rate during cycling approaches the steady-state rate at the mean
5
concentration.
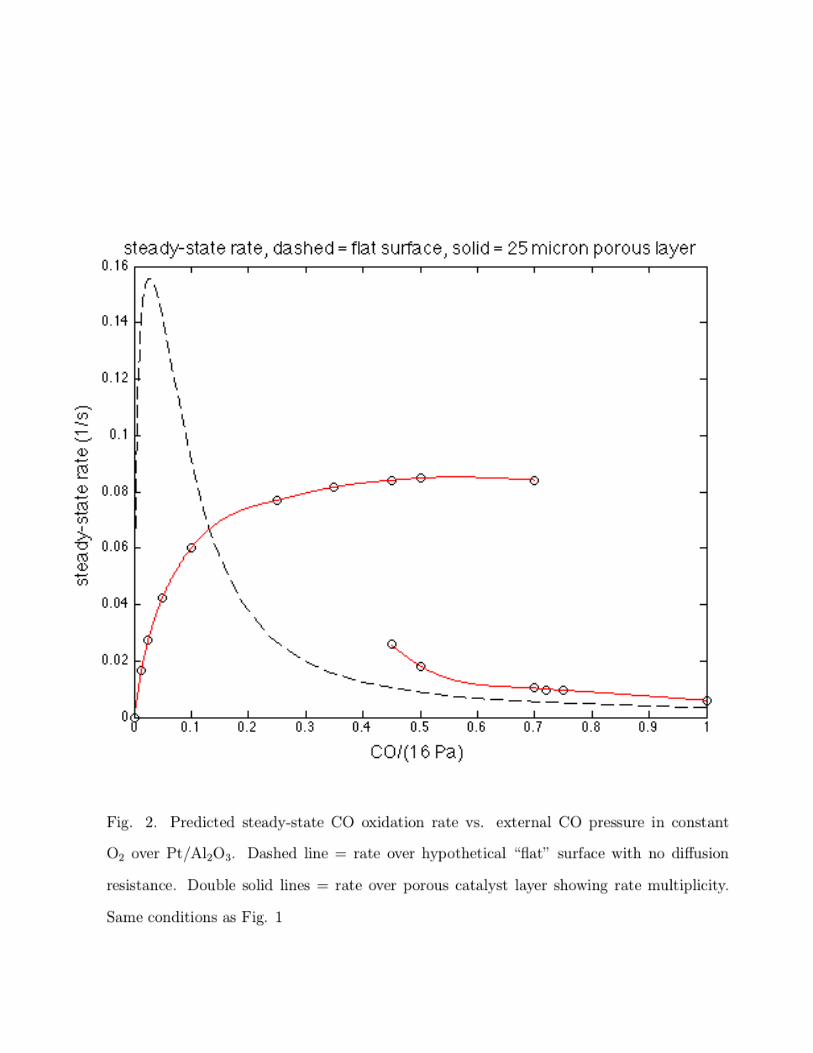
Fig. 2 shows predicted steady-state rate vs. CO pressure under steady-state conditions
over the flat surface and porous layer under the same conditions as Fig. 1. Near the mean
CO pressure, there is a region for the porous catalyst where there are two stable steady
states possible at a given CO pressure. This rate multiplicity is caused by the coupling of the
nonlinear, Langmuir-Hinshelwood, reactant-inhibited kinetics with di↵usion resistance.23 For
these kinetics, there are no multiple steady states over the flat surface with specified external
CO concentration. Other CO oxidation kinetics may admit to intrinsic rate multiplicity.24,25
Note that the rate over the porous catalyst (di↵usion resistance) is greater than the rate
over the flat surface (no di↵usion resistance) for external CO pressures greater than 2.2 Pa,
CO/(16 Pa) > 0.14. The e↵ectiveness factor is greater than one in this range for the CO-
inhibited reaction. For a di↵erent case with either the flat or porous catalyst inside a CSTR,
multiple steady states of reaction rate vs. reactor inlet CO concentration can occur due to
coupling of the nonlinear kinetics with the material balance over the reactor.26
High reaction rate occurs when coverages of both adsorbed CO and adsorbed O over the
surface are at intermediate values, since the rate determining step is reaction of adsorbed
CO and O to form CO2. The lower branch of the curve for the steady-state reaction in the
porous layer is at conditions where the coverage of the catalyst surface by CO is high, the
coverage of O is low, and the rate is relatively low.
At the maximum CO pressure during cycling, if steady-state were to be approached, the
coverage of CO would be high and the rate would be low. This condition occurs at low
cycling frequencies, as seen in the left-most space-time color inset in Fig 1. At intermediate
and high frequencies, the layer never becomes covered with high CO everywhere, and high
reaction rates are obtained at points within the layer.
6
The rate at the peaks of both curves in Fig. 1 during cycling are higher than the steady-
state rate at the mean CO concentration on the high-rate branch of the curve in Fig. 2. That
is, the reaction rate during cycling is higher than at steady-state at the mean concentration.
In Fig. 1, note the arrow and label in the right margin that refers to the porous layer: “High
steady-state rate at mean CO concentration.”
The rate enhancement can be explained in terms of storage by the surface of adsorbed
reactants in one half of a cycle and desorption and reaction of the stored reactants in the
other half of the cycle, with CO and O2 being stored in successive halves of the cycle.6,27
The magnitude and location of the mean rate vs. frequency curve for a porous catalyst
will vary with many factors, including layer thickness, active site concentration, and shape
of the composition forcing function.
Periodic Operation With Simplified Kinetics
The kinetic mechanism used for Figs. 1 and 2 are complex since they were developed
to explain experimental measurements. A simple reaction mechanism, which exhibits the
same main qualitative results, can be used to highlight the relationships between catalyst
parameters and conditions and how they a↵ect rate vs. frequency curves.
The reaction mechanism modeled in this work is:
1) A (g) + S *) AS
2) AS + S * P (g) + 2S
with overall stoichiometry A * P.
Step 1 is reversible adsorption of reactant component A over surface sites S. Step 2 is the
rate determining step and is assumed to be far from equilibrium under the conditions con-
sidered. Assumptions of Langmuir-Hinshelwood kinetics apply such as random distribution
of adsorbates over sites with constant properties.
At low concentrations of A, the overall rate is first-order in A. At intermediate concen-
trations of A, when the concentrations of AS and S are equal, the overall rate reaches a
maximum. At high concentrations of A, the rate is low because the concentration of vacant
8
sites S is low, and the overall rate is negative-order in A. The main feature of this model,
inhibition of the reaction by a reactant, is also a key feature of some industrially important
reactions including CO oxidation.
In the limit of small surface rate constant and the absence of mass-transport resistance,
the steady-state rate equation is:
�rA
=k2KA
CA
(1 +KA
CA
)2(1)
where CA
is the gas-phase concentration of the reactant, KA
is the equilibrium adsorption
constant for adsorption of A, and k2 is the rate constant of step 2. This is the same form
of rate equation used by Wei and Becker23 to study the e↵ects of di↵usion resistance on CO
oxidation over porous catalysts. A plot of steady-state rate vs. reactant concentration for
this equation is qualitatively similar to the curve in Fig. 2 for the flat surface.
Other mechanisms with di↵erent step 2 reactions should also exhibit su�cient nonlin-
earity to provide rate enhancement during composition cycling. Examples include (a) AS
+ AS ! P (g) + 2S and (b) A + AS ! P (g) + S. These mechanisms will change from
second-order in A to zero-order as the concentration of A increases. A mechanism with AS
! P (g) + S will change from first-order to zero-order as the concentration of A increases,
which is a regime that should not produce rate enhancement during cycling.17
The dimensionless equation for the dynamic system in a 1D porous catalyst layer is, for
the adsorbed reactant at each position within the layer:
d✓
d⌧=
ads
(1� ✓)� ✓ � rxn
✓(1� ✓) (2)
with dimensionless variables and parameters:
✓ = fractional coverage of surface by adsorbed reactant (3)
9
⌧ = t(s)k�1(s�1)= dimensionless time (4)
where k�1 is the reactant desorption rate constant in step 1,
ads
=k1(m3mol�1s�1)C
A,max
(mol m�3)
k�1(s�1)= reactant adsorption rate constant (5)
=C
A
CA,max
= gas-phase reactant concentration (6)
rxn
=k2(s�1)
k�1(s�1)= reaction rate constant (7)
The dimensionless equation for the dynamic system in a 1D porous catalyst layer is, for
the gas-phase reactant:
@
@⌧=
⇣di↵
✏
⌘✓@2
@�2
◆� ↵ [
ads
(1� ✓)� ✓] (8)
with dimensionless parameters:
di↵
=
✓D
e
L2
◆✓1
k�1
◆= dimensionless di↵usion coe�cient in layer of thickness L (9)
✏ = void fraction in porous catalyst layer (10)
� =z(m)
L(m)= position within layer (11)
with z measured from the interior, zero-flux boundary,
↵ =A(m2)Csurface
A,max
(mol m�2)
✏V (m3)CgasA,max
(mol m�3)= surface-to-gas capacity ratio (12)
where A is the active internal surface area of the layer, and V is the volume of the layer.
The surface-to-gas capacity ratio ↵ is the ratio between the maximum number of moles that
can be adsorbed on the surface in the layer to the maximum number of moles of gas that
can be held in the pore volume of the layer.9,7 The boundary conditions for the gas-phase
10
equation are:
(� = 1, t) = 1(t) (13)
d
dt
�
�=0
= 0 (14)
For specified parameter values and initial conditions, the system behavior can be com-
puted for specified reactant concentration forcing functions 1(t) over the external boundary
of the layer. Hsiao28 has written a general di↵usion-reaction solver that can solve this prob-
lem as well as problems with arbitrary kinetic schemes.
Even with such simple kinetics, there are four dimensionless parameters to specify (ads
,
rxn
, (diff
/✏), ↵) and two di↵erential equations to integrate (surface, gas) in order to solve
the dimensionless system.
The system can be simplified by considering a limiting case that will hold over many
practical catalyst systems, including catalytic CO oxidation. This simplification will allow
identification of scaling parameters and explanation of the frequency range at which maxi-
mum rate enhancement occurs. The limiting case is obtained when the surface reaction is
rate limiting and the surface capacity for adsorbed reactant is large.
First, specify that the surface reaction rate constant is small, rxn
<< 1, such that step
1 in the mechanism is in close approach to equilibrium adsorption of reactant. The equation
for reactant gas in the catalyst pores becomes:
@
@⌧=
⇣di↵
✏↵
⌘"1
1↵
+ ads(1+ads )2
# @2
@�2� �2
(1 + ads
)2
�(15)
where the Thiele modulus � is given by:
�2 =
✓rxn
ads
di↵ /(✏↵)
◆=
L2
De
⇥k2(A/V )
ads
CsurfaceA,max
⇤=
L2(m2)
De
(m2 s�1)
⇥K
r
(s�1)⇤
(16)
This Thiele modulus is equivalent to that defined for these kinetics by Wei and Becker.23
Since reactant surface coverages closely approach equilibrium under this specification,
11

only the gas-phase equation must be solved under dynamic conditions: the equilibrium
surface coverage at each time and position can be computed from the gas concentration.
This is also termed a quasi-steady-state approximation for adsorbed components.21
Next, specify that the surface-to-gas capacity ratio is large, ↵ >> 1. This is a reasonable
condition for many systems, including the system shown in Fig. 1. For example, ↵ = 100
for 0.1% CO in 1 atm-gas at 360 K over 2% exposed, 1 wt% Pt on 1 g/cm3 alumina with ✏
= 0.3.
The equation for reactant gas in the catalyst pores becomes:
@
@⌧=
⇣di↵
✏↵
⌘(1 +
ads
)2
ads
� @2
@�2� �2
(1 + ads
)2
�(17)
For this limiting case, the number of di↵erential equations has been reduced from two to
one, and the number of dimensionless parameters has been reduced from four to three: rxn
,
ads
, and (diff
/(✏↵)). The Thiele modulus � is a combination of the other dimensionless
parameters:
�2 =
✓rxn
ads
di↵
/(✏↵)
◆(18)
�2 = (✏↵)
✓L2
De
◆(
rxn
ads
k�1) (19)
Under steady-state conditions:
@2
@�2= �2
(1 + ads
)2(20)
where the two boundary conditions are the same as above, Eqns. 13 and 14, for the dynamic
gas-phase equation. The dimensionless steady-state solution is determined by two values:
those of � and ads
. Solutions of this steady-state equation were presented by Wei and
Becker.23 Plots of steady-state rate vs. reactant concentration will look similar to the curves
for the porous catalyst in Fig. 2, also showing the possibility of multiple steady states in the
presence of di↵usion resistance.
12
Finally, redefine the dimensionless time:
@
@T=
(1 +
ads
)2
ads
� @2
@�2� �2
(1 + ads
)2
�(21)
T =⇣
di↵
✏↵
⌘⌧ (22)
t(s) = (✏↵)
✓L2
De
◆T (23)
The di↵erential equation for the limiting case, Eqn. 21, was solved with an explicit
finite-di↵erence numerical method with 40 equally spaced nodes. An empty-surface initial
condition was specified, and the system of equations was integrated until a steady cycling
pattern developed. Average rates are the mean of local reaction rates within the layer during
one period.
The gas phase concentration of reactant over the outer boundary of the layer 1 was
changed in steps and was also cycled in square waves and sine waves in di↵erent numerical
experiments. During periodic operation, the real-time frequency ! (s-1) can be defined by
its use in a sine-wave forcing function:
1(t) = 0.5 [1 + sin(2⇡!t)] (24)
The dimensionless frequency ⌦ can be defined by:
1(T ) = 0.5 [1 + sin(2⇡⌦T )] (25)
⌦ = (✏↵)
✓L2
De
◆! (26)
13
Scaling Parameters
In going from the steady-state system (Eqn. 20) to the dynamic system, (Eqn. 17), only
one more dimensionless parameter is added: (diff
/(✏↵)). This parameter can be considered
a dynamic di↵usion coe�cient in which the surface-to-gas capacity ratio ↵ modifies the
di↵usion dynamics. For example, a larger surface capacity slows the rate of penetration of
reactant gas into the porous catalyst layer.
The system has been simplified su�ciently such that we can see some interesting scaling
cases.
Case 1 : Change any two or more components of the dynamic di↵usion coe�cient (diff
/(✏↵))
= (✏↵L2/De
) such that the value of the group remains constant.
Result 1: The steady-state solution of dimensionless concentration profile (�) remains
unchanged because the Thiele modulus � and the adsorption constant ads
remain
unchanged.
Result 2: The dynamic solutions of dimensionless concentration profiles remain unchanged
in both dimensionless time (�,T ) and real time (�,t) as the external reactant con-
centration is varied. This result is true for arbitrary forcing functions.
Result 3: Although the dimensionless solutions remain unchanged, the dimensioned rate of
reaction over the catalyst layer (mol/s) will change if the ratio L2/De
changes.
Case 2 : Change di↵
and rxn
by the same factor such that the Thiele modulus � remains
constant but the dynamic di↵usion coe�cient value changes. Keep ads
constant.
Result 1: The steady-state solution (�) remains unchanged.
Result 2: The dynamic solution in dimensionless time (�,T ) remains unchanged.
Result 3: The dynamic solution in real time (�,t) changes because the dynamic di↵usion
coe�cient, which relates t(s) and T, has changed.
14
The results of Case 2 prove an imperative for kinetic studies: Dynamic experiments should
be performed in addition to steady-state experiments, since two catalytic systems can exhibit
the same steady-state behavior but di↵erent dynamic behavior.29
Frequency at Maximum Rate Enhancement
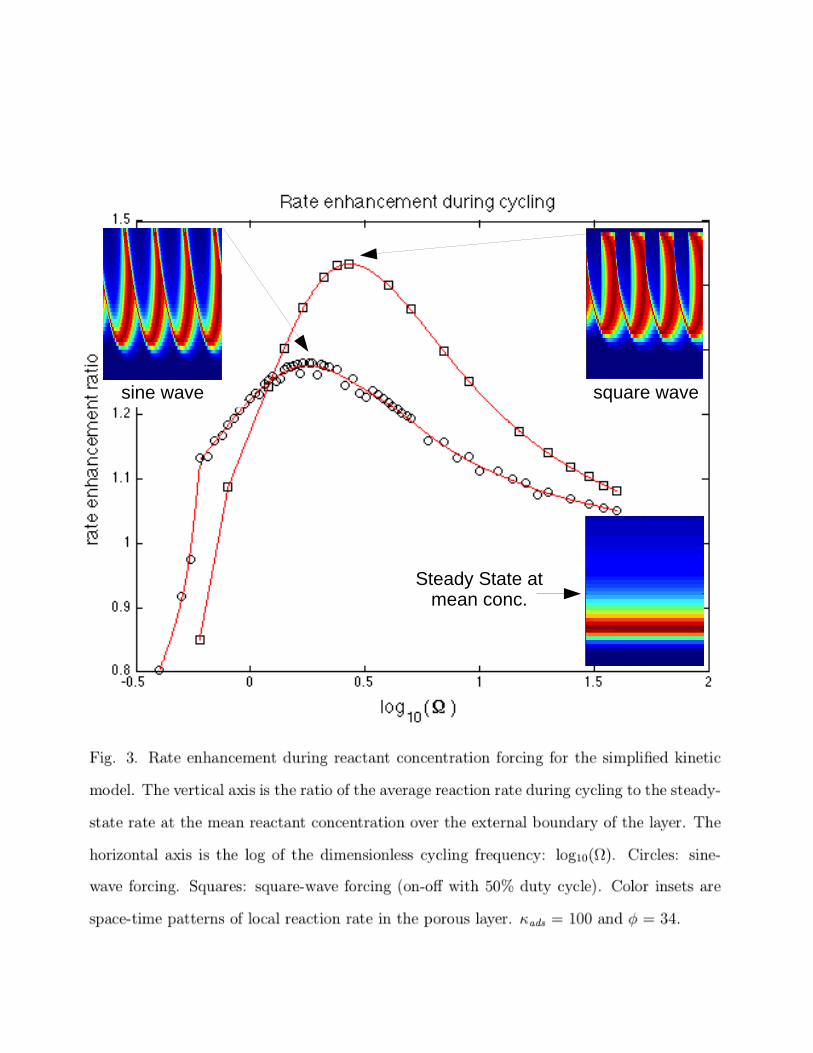
The solutions for the simplified kinetic model during periodic operation show peaks in
average rate vs. frequency, similar to those seen in Fig. 1 for a detailed kinetic model of CO
oxidation. The results for the simplified model are shown in Fig. 3. The color insets show
space-time patterns of local reaction rate within the porous layer, as described above for
Fig. 1. Also shown is the local reaction rate pattern for steady state at the mean reactant
concentration over the layer.
The simplified kinetics allow us to understand some of the features of the average rate
vs. cycling frequency curves. Case 1, Result 2 above shows that systems with constant �,
ads
and (✏↵L2/De
) will exhibit the same dimensionless solutions during periodic operation
on rate vs. ! (s-1) real-time frequency plots.
Case 2, Result 3 shows that systems with constant � and ads
but di↵erent (✏↵L2/De
)
will exhibit di↵erent curves on rate vs. ! (s-1) plots. The frequency at which the peak in
rate occurs is related to the surface-to-gas capacity ratio ↵ as well as the layer thickness and
e↵ective di↵usivity.
Case 2, Result 2 shows that systems with constant � and ads
but di↵erent (✏↵L2/De
)
will fall on the same curve on rate vs. ⌦ dimensionless frequency plots.
For ads
= 100 and � = 34, rate multiplicities exist at the mean concentration on the
steady-state rate vs. concentration plot. Steady-state profiles were presented by Wei and
Becker23 for these parameter values.
For these parameter values, the peak in average rate during cycling occurs at ⌦ = 1.8
for sine-wave forcing (Eqn. 25, initial condition (�,0)=0, and integrating to steady cycling
conditions). The magnitude of the peak in average rate is 1.28 times the steady-state rate at
the mean concentration on the high branch of the steady-state rate vs. concentration curve.
15
Steady State atmean conc.
square wavesine wave
As the forcing frequency increases above the peak frequency, the average rate during
cycling approaches the steady-state rate at the mean concentration (on the high branch of
the rate vs. concentration curve when rate multiplicities exist and when starting from an
empty-surface initial condition). That is, the value of the rate enhancement ratio approaches
one. At very high frequencies, the assumption of close approach to equilibrium adsorption
in Eqn. 21 will not hold and detailed simulations using Eqn. 2 and Eqn. 8 can be used to
extend the plot closer to the relaxed steady-state asymptote at high frequencies.
As the forcing frequency decreases below the peak frequency for these kinetics and pa-
rameter values (ads
= 100 and � = 34), the entire layer will go into the inhibited state (low
branch of the rate vs. concentration curve) for part of the cycle, thus, causing the average
rate during cycling to be less than the steady-state rate at the mean concentration on the
high branch of the rate curve (rate enhancement ratio < 1). The onset of this condition at
low frequency can be seen in Fig. 3 where the curve for sine-wave cycling has an abrupt
change in slope at log10(⌦) = -0.22, ⌦ = 0.60.
As discussed below, the peak rate occurs at ⌦ = 2.7 for square-wave cycling vs. ⌦ = 1.8
for sine-waves. The result that the peak rate occurs at about ⌦ = 2 can be explained in
terms of the rate at which the surface inside the layer can be filled by adsorbed reactant in
the presence of di↵usion resistance.
Consider a limiting case in which adsorption is fast such that the outer fraction of the
porous catalyst layer that is exposed to any amount of gas-phase reactant at any time is fully
covered and the remaining portion of the layer is empty. After an empty layer is suddenly
exposed to a fixed external concentration of reactant gas, the time required to completely
fill the internal surface in the layer with adsorbed reactant is:7,30
tfill(s) =1
2(✏↵)
✓L2
De
◆(27)
Note that increasing surface-to-gas capacity ratio ↵ increases the time required to fill the
17
surface in the layer.
Now, if we force the system with a frequency that is the inverse of this surface filling
time,
!(s�1) =1
tfill(s)=
2
✏↵
✓D
e
L2
◆(28)
we get the dimensionless frequency near which the peaks in average rate vs. cycling frequency
are obtained:
⌦ = (✏↵)
✓L2
De
◆! (29)
⌦ = 2 (30)
This is an approximation, of course. The surface in the layer doesn’t fill completely with
adsorbed reactant, and a portion of the cycle period is needed to desorb and react adsorbed
reactant. But this approximation does give a physical reason for the location of the peak.
For the porous layer in Fig. 1, the peak in rate is at ⌦ = 0.8 for sine-wave forcing of a
complex CO+O2 oxidation mechanism over a surface with two adsorbed reactants and two
types of sites with di↵erent parameter values.
The presence and magnitude of a peak in rate vs. frequency is also related to the Thiele
modulus � and the adsorption equilibrium constant ads
. As the Thiele modulus decreases
and adsorption constant increases, the potential for rate enhancement during periodic oper-
ation increases. Identification of the ranges of parameter values for which rate enhancement
is possible is outside the scope of this work.
Eqn. 21 for the limiting condition was obtained for rxn
<< 1 and ↵ >> 1. This is a
single partial di↵erential equation. For larger values of ads
and smaller values of ↵, solution
of a sti↵ system of coupled di↵erential equations may be required. The e↵ect of such changes
in the parameters will be to make the kinetics more linear and decrease the surface storage
capacity, thus, lowering the rate enhancement during periodic operation.
18
Forcing Function Shape
Rate vs. frequency curves vary with the shape of the forcing function, as shown in Fig.
3. For these parameter values (ads
= 100 and � = 34), the peak in average rate during
sine-wave cycling occurs at ⌦ = 1.8 with a peak in average rate 1.28 times the steady-state
rate at the mean concentration.
For the same conditions but with 50% duty-cycle, on-o↵ square-wave forcing, the peak
in rate occurs at ⌦ = 2.7 with a peak in average rate 1.43 times the steady-state rate at the
mean concentration.
Reaction over a porous catalyst tends to lessen the e↵ects of changes in the shape of the
forcing function relative to reaction over a hypothetical “flat” surface in the absence of mass
transfer resistance.
Over the “flat” surface with no di↵usion resistance, maximum rate enhancement can
be obtained with on-o↵ square-wave forcing in which the reactant is “on” for only a small
fraction of the cycle. For these kinetics, the enhancement in average rate during cycling
increases with an increase in ads
, i.e., for k1 >> k�1. This is because a relatively large
amount of reactant is “stored” by adsorption over the surface during the “on” fraction of
the cycle, when ads
is large and equilibrium coverage ✓ is high, for later reaction (plus
desorption) during the “o↵” fraction of the cycle. Since the adsorption rate constant k1 is
relatively large, the surface fills to capacity in a relatively short period of time, i.e., short
fraction of the cycle.
In contrast, over a porous catalyst layer, the filling and emptying of the surface through-
out the layer is controlled by the dynamic di↵usion coe�cient and not k1 and k�1.
Conclusion
This work has discussed the importance of studying and, in some cases, operating porous
heterogeneous catalysts under dynamic conditions. Focus was placed on the e↵ects of internal
di↵usion resistance and the development of dimensionless scaling parameters for dynamic
operation. Scott Fogler is to be complimented for including many sections in his textbooks
19
about dynamic operation of chemical reactors.
References
(1) Fogler, H. S. Elements of Chemical Reaction Engineering, 4th ed.; Prentice-Hall: New
York, 2005.
(2) Fogler, H. S. Essentials of Chemical Reaction Engineering ; Prentice-Hall: New York,
2010.
(3) Herz, R. K. Reactor Lab; educational software available at http://ReactorLab.net (ac-
cessed Sept. 29, 2014).
(4) Herz, R. K. Dynamic behavior of automotive three-way emission control systems, in
Catalysis and Automotive Pollution Control ; Elsevier: Amsterdam, 1987; pp. 427-444.
(5) Herz, R. K.; Marin, S. P. Surface chemistry models of carbon monoxide oxidation on
supported platinum catalysts. J. Catal. 1980, 65, 281-296.
(6) Cho, B. K. Dynamic behavior of a single catalyst pellet 1. Symmetric concentration
cycling during carbon monoxide oxidation over platinum/alumina. Ind. Eng. Chem. Fun-
damen. 1983, 22, 410-420.
(7) Racine, B. N.; Herz, R. K. Modeling dynamic CO oxidation over Pt/Al2O3: E↵ects of
intrapellet di↵usion and site heterogeneity. J. Catalysis 1992, 137, 158-178.
(8) Cannestra, A. F.; Nett, L. C.; Herz, R. K. Measurement of gas composition at the center
of a porous pellet during adsorption and catalytic reaction under dynamic conditions. J.
Catalysis 1997, 172, 346-354.
(9) Nett-Carrington, L. C.; Herz, R. K. Spatiotemporal patterns within a porous catalyst:
dynamic carbon monoxide oxidation in a single-pellet reactor. Chem. Eng. Sci. 2002, 57,
1459-1474.
(10) Herz, R.K. Spatiotemporal patterns in a porous catalyst during light-o↵ and quenching
of carbon monoxide oxidation. Chem. Eng. Sci. 2004 59, 3983-3991.
(11) Silveston, P. L. Composition modulation of catalytic reactors ; CRC Press, 1998.
(12) Silveston, P. L.; Hudgins, R. R. Periodic Operation of Reactors ; Oxford : Elsevier
20
Science, 2012.
(13) Schadlich, K.; Ho↵mann, U.; Hofmann, H. Periodical Operation of Chemical Processes
and Evaluation of Conversion Improvements. Chem. Eng. Sci. 1983 38, 1375-1384.
(14) Silveston, P.; Hudgins, R.R.; Renken, A., 1995. Periodic operation of catalytic reactors-
introduction and overview. Catalysis Today 1995 25, 91-112.
(15) Gutsche, R.; Lange, R.; Witt, W. The e↵ect of process nonlinearities on the performance
of a periodically operated isothermal catalytic reactor. Chem. Eng. Sci. 2003 58, 5055-
5068.
(16) Alvarez, J.; Meraz, M.; Valdes-Parada, F.J.; Alvarez-Ramirez, J. First-harmonic balance
analysis for fast evaluation of periodic operation of chemical processes. Chem. Eng. Sci.
2012 74, 256-265.
(17) Petkovska, M.; Nikolic, D.; Markovic, A., Seidel-Morgenstern, A. Fast evaluation of
periodic operation of a heterogeneous reactor based on nonlinear frequency response analysis.
Chem. Eng. Sci. 2010 65, 3632-3637.
(18) Paunic, D.N.; Perkovska, M. Evaluation of periodic processes with two modulated inputs
based on nonlinear frequency response analysis. Case study: CSTR with modulatoin of the
inlet concentration and flow-rate. Chem. Eng. Sci. 2013 104, 208-219.
(19) Hoebink, J.H.B.J.; Nievergeld, A.J.L.; Marin, G.B. CO oxidation in a fixed bed reactor
with high frequency cycling of the feed. Chem. Eng. Sci. 1999 54, 4459-4468.
(20) Kocı, P.; Kubıcek, M.; Marek, M. Periodic forcing of three-way catalyst with di↵usion
in the washcoat. Catalysis Today 2004 98, 345-355.
(21) Lee, C. K.; Bailey, J. E. Di↵usion waves and selectivity modifications in cyclic operation
of a porous catalyst, Chem. Eng. Sci. 1974, 29, 1157-1163.
(22) Crank, J.; Nicolson, P. A practical method for numerical evaluation of solutions of
partial di↵erential equations of the heat-conduction type. Proceedings of the Cambridge
Philosophical Society, Mathematical and Physical Sciences 1947, 43, 50-67.
(23) Wei, J.; Becker, E. R. The optimum distribution of catalytic material on support layers
21

in automotive catalysis, in ACS Adv. Chem. Ser. 143 ; Amer. Chem. Soc.: Washington,
DC, 1975;. Chapter 10, pp. 116-132.
(24) Harold, M. P.; Garske, M. E. Kinetics and multiple rate states of CO oxidation on Pt
I. Model development and multiplicity analysis. J. Catalysis 1991, 127, 524-552.
(25) Eigenberger, G., Kinetic instabilities in heterogeneously catalyzed reactionsI: Rate mul-
tiplicity with langmuir-type kinetics. Chem. Eng. Sci. 1978 33, 1255-1261.
(26) Do, D.D.; Weiland, R.H. Substrate-inhibited kinetics with catalyst deactivation in an
isothermal CSTR. II. Multiple pseudosteady states and reactor failure. AIChE J. 1980 26,
1020-1028.
(27) Racine, B.N.; Sally, M.J.; Wade, B.; Herz, R.K. Dynamic CO oxidation over Pt/Al2O3.
J. Catalysis 1991 127, 307-331.
(28) Hsiao, H.-W. Numerical Study of Reaction in Porous Catalysts under Composition
Modulation, Ph.D. dissertation, U. California, San Diego, 2010.
(29) Renken, A.; Hudgins, R. R.; Silveston, P. L. Use of Modulation in Mechanistic Studies,
in Periodic Operation of Reactors, P. L. Silveston and R. R. Hudgins, eds.; Elsevier Science:
Oxford, 2012; Chap. 13, pp. 369-386.
(30) Herz, R. K.; Shinouskis, E. J. Transient oxidation and reduction of alumina-supported
platinum Appl. Surf. Sci. 1984 19, 373
22
Figure Captions
Fig. 1. Predicted patterns of local CO oxidation rate during sine-wave cycling of CO in
constant O2 over Pt/Al2O3. Curves are average overall rate during cycling vs. log10 of
frequency. Black (peak on right) = hypothetical “flat” surface with no di↵usion resistance.
Blue (peak on left) = rate over 25 micron porous catalyst layer. Color insets are space-time
patterns of local reaction rate in the porous layer. The model of Nett-Carrington and Herz9
and the parameter values in Table 1 of that work apply for the porous layer, except that
�1 = 0.20 (fraction site-type 1) and Csurftot
= 44 mol of total surface sites per m3 layer. T
= 140 �C, 0-16 Pa-CO, 110 Pa-O2. Rate shown is turnover frequency (product molecules
formed per site per second).
Fig. 2. Predicted steady-state CO oxidation rate vs. external CO pressure in constant
O2 over Pt/Al2O3. Dashed line = rate over hypothetical “flat” surface with no di↵usion
resistance. Double solid lines = rate over porous catalyst layer showing rate multiplicity.
Same conditions as Fig. 1
Fig. 3. Rate enhancement during reactant concentration forcing for the simplified kinetic
model. The vertical axis is the ratio of the average reaction rate during cycling to the steady-
state rate at the mean reactant concentration over the external boundary of the layer. The
horizontal axis is the log of the dimensionless cycling frequency: log10(⌦). Circles: sine-
wave forcing. Squares: square-wave forcing (on-o↵ with 50% duty cycle). Color insets are
space-time patterns of local reaction rate in the porous layer. ads
= 100 and � = 34.
23