sap bpc430 en-col96_fv_part_a4-bpc-10.0
TRANSCRIPT
BPC430SAP BusinessObjects Planning
and Consolidation: Reporting andPlanning
SAP BusinessObjects - Financial Performance Management
Date
Training Center
Instructors
Education Website
Participant HandbookCourse Version: 96Course Duration: 5 Day(s)Material Number: 50106150
An SAP course - use it to learn, reference it for work
SAP Class Week of April 16, 2012
Copyright
Copyright © 2011 SAP AG. All rights reserved.
No part of this publication may be reproduced or transmitted in any form or for any purpose without theexpress permission of SAP AG. The information contained herein may be changed without prior notice.
Some software products marketed by SAP AG and its distributors contain proprietary softwarecomponents of other software vendors.
Trademarks
• Microsoft®, WINDOWS®, NT®, EXCEL®, Word®, PowerPoint® and SQL Server® areregistered trademarks of Microsoft Corporation.
• IBM®, DB2®, OS/2®, DB2/6000®, Parallel Sysplex®, MVS/ESA®, RS/6000®, AIX®, S/390®,AS/400®, OS/390®, and OS/400® are registered trademarks of IBM Corporation.
• ORACLE® is a registered trademark of ORACLE Corporation.• INFORMIX®-OnLine for SAP and INFORMIX® Dynamic ServerTM are registered trademarks
of Informix Software Incorporated.• UNIX®, X/Open®, OSF/1®, and Motif® are registered trademarks of the Open Group.• Citrix®, the Citrix logo, ICA®, Program Neighborhood®, MetaFrame®, WinFrame®,
VideoFrame®, MultiWin® and other Citrix product names referenced herein are trademarks ofCitrix Systems, Inc.
• HTML, DHTML, XML, XHTML are trademarks or registered trademarks of W3C®, World WideWeb Consortium, Massachusetts Institute of Technology.
• JAVA® is a registered trademark of Sun Microsystems, Inc.• JAVASCRIPT® is a registered trademark of Sun Microsystems, Inc., used under license for
technology invented and implemented by Netscape.• SAP, SAP Logo, R/2, RIVA, R/3, SAP ArchiveLink, SAP Business Workflow, WebFlow, SAP
EarlyWatch, BAPI, SAPPHIRE, Management Cockpit, mySAP.com Logo and mySAP.com aretrademarks or registered trademarks of SAP AG in Germany and in several other countries allover the world. All other products mentioned are trademarks or registered trademarks of theirrespective companies.
Disclaimer
THESE MATERIALS ARE PROVIDED BY SAP ON AN "AS IS" BASIS, AND SAP EXPRESSLYDISCLAIMS ANY AND ALL WARRANTIES, EXPRESS OR APPLIED, INCLUDING WITHOUTLIMITATION WARRANTIES OF MERCHANTABILITY AND FITNESS FOR A PARTICULARPURPOSE, WITH RESPECT TO THESE MATERIALS AND THE SERVICE, INFORMATION, TEXT,GRAPHICS, LINKS, OR ANY OTHER MATERIALS AND PRODUCTS CONTAINED HEREIN. INNO EVENT SHALL SAP BE LIABLE FOR ANY DIRECT, INDIRECT, SPECIAL, INCIDENTAL,CONSEQUENTIAL, OR PUNITIVE DAMAGES OF ANY KIND WHATSOEVER, INCLUDINGWITHOUT LIMITATION LOST REVENUES OR LOST PROFITS, WHICH MAY RESULT FROMTHE USE OF THESE MATERIALS OR INCLUDED SOFTWARE COMPONENTS.
g20121711251
SAP Class Week of April 16, 2012
About This HandbookThis handbook is intended to complement the instructor-led presentation of thiscourse, and serve as a source of reference. It is not suitable for self-study.
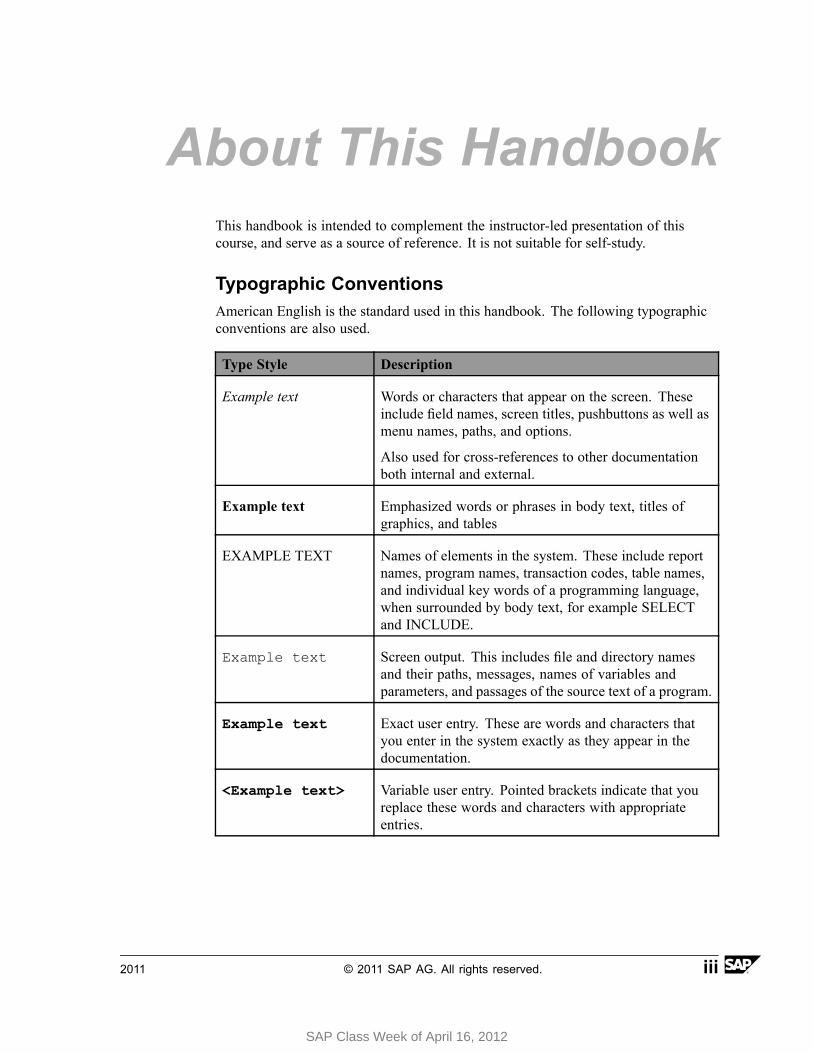
Typographic ConventionsAmerican English is the standard used in this handbook. The following typographicconventions are also used.
Type Style Description
Example text Words or characters that appear on the screen. Theseinclude field names, screen titles, pushbuttons as well asmenu names, paths, and options.
Also used for cross-references to other documentationboth internal and external.
Example text Emphasized words or phrases in body text, titles ofgraphics, and tables
EXAMPLE TEXT Names of elements in the system. These include reportnames, program names, transaction codes, table names,and individual key words of a programming language,when surrounded by body text, for example SELECTand INCLUDE.
Example text Screen output. This includes file and directory namesand their paths, messages, names of variables andparameters, and passages of the source text of a program.
Example text Exact user entry. These are words and characters thatyou enter in the system exactly as they appear in thedocumentation.
<Example text> Variable user entry. Pointed brackets indicate that youreplace these words and characters with appropriateentries.
2011 © 2011 SAP AG. All rights reserved. iii
SAP Class Week of April 16, 2012
About This Handbook BPC430
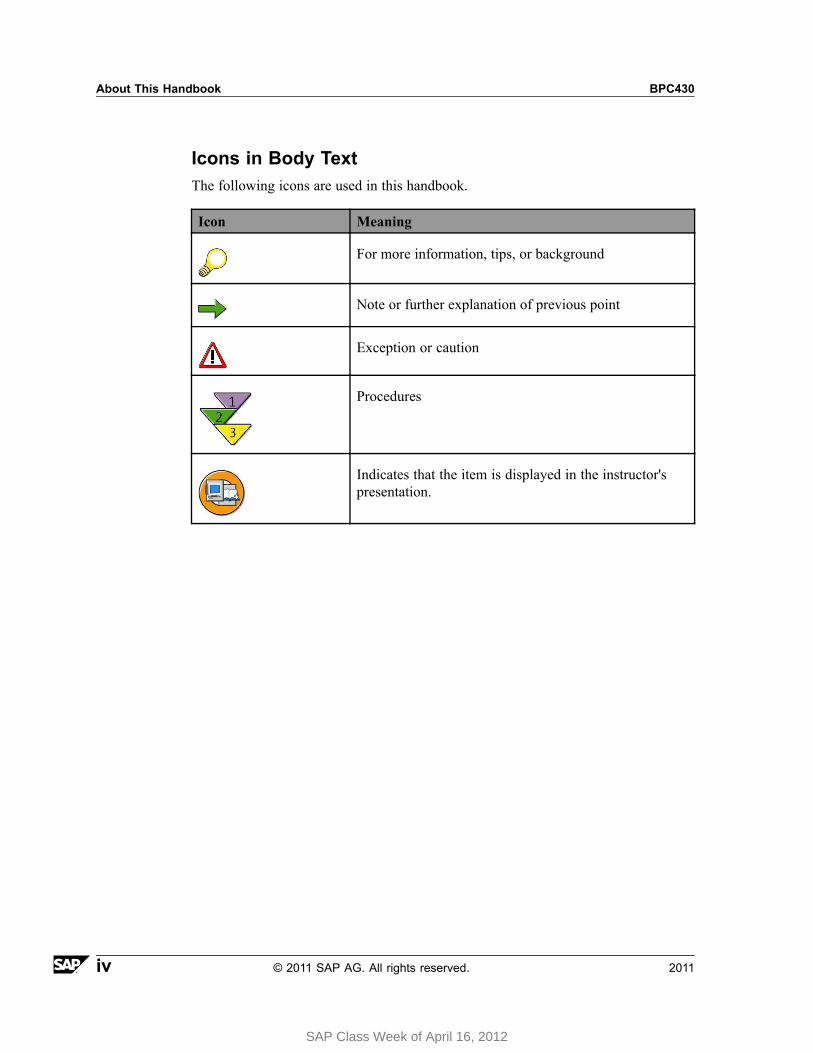
Icons in Body TextThe following icons are used in this handbook.
Icon Meaning
For more information, tips, or background
Note or further explanation of previous point
Exception or caution
Procedures
Indicates that the item is displayed in the instructor'spresentation.
iv © 2011 SAP AG. All rights reserved. 2011
SAP Class Week of April 16, 2012
ContentsCourse Overview ............................................................................. vii
Course Goals.. . . . . . . . . . . . . . . . . . . . . . . . . . . . . . . . . . . . . . . . . . . . . . . . . . . . . . . . . . . . . . . . . . . . . . . . . . . . . . . .viiCourse Objectives ... . . . . . . . . . . . . . . . . . . . . . . . . . . . . . . . . . . . . . . . . . . . . . . . . . . . . . . . . . . . . . . . . . . . . . . . .vii
Unit 1: SAP BusinessObjects Planning and Consolidation – Overview...........1Introducing the Benefits, the Interfaces, and the Components .. . . . . . . . . . . . . . . . . . . . . . .3Introducing the Excel Interface of the EPM add-in .. . . . . . . . . . . . . . . . . . . . . . . . . . . . . . . . . . . . 12Implementing SAP BusinessObjects Planning and Consolidation ... . . . . . . . . . . . . . . . . 57
Unit 2: The Excel Interface of the EPM add-in ......................................... 73Using the Report Editor .. . . . . . . . . . . . . . . . . . . . . . . . . . . . . . . . . . . . . . . . . . . . . . . . . . . . . . . . . . . . . . . . . . 75Using The Member Selector .. . . . . . . . . . . . . . . . . . . . . . . . . . . . . . . . . . . . . . . . . . . . . . . . . . . . . . . . . . . .130Working With Member Recognition ... . . . . . . . . . . . . . . . . . . . . . . . . . . . . . . . . . . . . . . . . . . . . . . . . . .138Linking Reports .. . . . . . . . . . . . . . . . . . . . . . . . . . . . . . . . . . . . . . . . . . . . . . . . . . . . . . . . . . . . . . . . . . . . . . . . . . .149Formatting ... . . . . . . . . . . . . . . . . . . . . . . . . . . . . . . . . . . . . . . . . . . . . . . . . . . . . . . . . . . . . . . . . . . . . . . . . . . . . . .154Multi-Source Reporting ... . . . . . . . . . . . . . . . . . . . . . . . . . . . . . . . . . . . . . . . . . . . . . . . . . . . . . . . . . . . . . . . .178Using Basic and Advanced EPM Functions & Creating Cell Based Reports .. . . . .196Using Delivered Templates ... . . . . . . . . . . . . . . . . . . . . . . . . . . . . . . . . . . . . . . . . . . . . . . . . . . . . . . . . . . . .254Comparing EvDRE to EPM Reports .. . . . . . . . . . . . . . . . . . . . . . . . . . . . . . . . . . . . . . . . . . . . . . . . . . .258Migrating EvDRE Templates ... . . . . . . . . . . . . . . . . . . . . . . . . . . . . . . . . . . . . . . . . . . . . . . . . . . . . . . . . . .275
Unit 3: Distribution and Collection, Comments, and Planning Functions .....297Using the Distribution and Collection Wizard ... . . . . . . . . . . . . . . . . . . . . . . . . . . . . . . . . . . . . . . .298Using the Comment Feature ... . . . . . . . . . . . . . . . . . . . . . . . . . . . . . . . . . . . . . . . . . . . . . . . . . . . . . . . . .330Using the Spread, Trend, and Weight Manual Planning Functions ... . . . . . . . . . . . . . .359
Unit 4: Business Process Flows .........................................................375Creating Planning Business Process Flows ... . . . . . . . . . . . . . . . . . . . . . . . . . . . . . . . . . . . . . . . .376
Unit 5: Web Integration.....................................................................437Using The Web Client .. . . . . . . . . . . . . . . . . . . . . . . . . . . . . . . . . . . . . . . . . . . . . . . . . . . . . . . . . . . . . . . . . . . .438Using Web Reports, Input Forms, and Workspaces ... . . . . . . . . . . . . . . . . . . . . . . . . . . . . . . .448Publishing Books ... . . . . . . . . . . . . . . . . . . . . . . . . . . . . . . . . . . . . . . . . . . . . . . . . . . . . . . . . . . . . . . . . . . . . . . .467
2011 © 2011 SAP AG. All rights reserved. v
SAP Class Week of April 16, 2012
Contents BPC430
Unit 6: Drill Through ........................................................................499Using Drill Through for BW, ECC, and Websites .. . . . . . . . . . . . . . . . . . . . . . . . . . . . . . . . . . . .500
Unit 7: Word and Powerpoint .............................................................531Using Word and PowerPoint . . . . . . . . . . . . . . . . . . . . . . . . . . . . . . . . . . . . . . . . . . . . . . . . . . . . . . . . . . . . .532
Unit 8: Dashboards .........................................................................551SAP BusinessObjects Dashboard Integration ... . . . . . . . . . . . . . . . . . . . . . . . . . . . . . . . . . . . . . .552
vi © 2011 SAP AG. All rights reserved. 2011
SAP Class Week of April 16, 2012
Course Overview
Target AudienceThis course is intended for the following audiences:
• Application Consultants• Project leaders• Project team members• Report writers• Technical pre-sales
Course PrerequisitesRequired Knowledge
• Excel
Recommended Knowledge
• Experience with OLAP products
Course GoalsThis course will prepare you to:
• Describe the system components and integration.• Report in the Excel Interface of the EPM add-in.• Configure the EPM - Report Editor.• Use the EPM functions.• Configure the formatting template.• Report in the Web Client.• Use business process flows for planning.
Course ObjectivesAfter completing this course, you will be able to:
2011 © 2011 SAP AG. All rights reserved. vii
SAP Class Week of April 16, 2012

Course Overview BPC430
• Describe the SAP BusinessObjects Planning and Consolidation concepts andcomponents.
• Work with the delivered templates.• Use the Excel Interface of the EPM add-in• Set up and run the distribution and collection wizard.• Set up and run drill throughs.• Use Books to distribute precalculated static reports• Work with the Word, and PowerPoint Interfaces of the EPM add-in.• Build and use Dashboards for the purpose of integrating with SAP
BusinessObjects Planning and Consolidation.• Configure the comments feature.• Work with the EPM Functions.
viii © 2011 SAP AG. All rights reserved. 2011
SAP Class Week of April 16, 2012

Unit 1SAP BusinessObjects Planning and
Consolidation – Overview
Unit OverviewThis unit will give you an overview of SAP BusinessObjects Planning andConsolidation, an introduction to the Excel Interface of the EPM add-in, and projectimplementation guidelines.
Unit ObjectivesAfter completing this unit, you will be able to:
• Explain the key terms• Discuss the benefits of SAP BusinessObjects Planning and Consolidation• Describe the components• Identify the most important features of SAP BusinessObjects Planning and
Consolidation• Create an EPM add-in connection• Describe the features of the EPM add-in ribbon• Define default values for dimensions with the EPM Context Bar• Build a simple report• Discuss the implementation process• Describe general business requirements for the planning and consolidation
application
Unit ContentsLesson: Introducing the Benefits, the Interfaces, and the Components .. . . . . .3Lesson: Introducing the Excel Interface of the EPM add-in .. . . . . . . . . . . . . . . . . . . 12
Procedure: Connecting to a BW InfoProvider .. . . . . . . . . . . . . . . . . . . . . . . . . . . . . . 19Procedure: Enabling the EPM add-in .. . . . . . . . . . . . . . . . . . . . . . . . . . . . . . . . . . . . . . . . 20Exercise 1: Report and Plan in the Excel Interface of the EPM Add-In .. 33
2011 © 2011 SAP AG. All rights reserved. 1
SAP Class Week of April 16, 2012

Unit 1: SAP BusinessObjects Planning and Consolidation – Overview BPC430
Lesson: Implementing SAP BusinessObjects Planning and Consolidation .. 57
2 © 2011 SAP AG. All rights reserved. 2011
SAP Class Week of April 16, 2012
BPC430 Lesson: Introducing the Benefits, the Interfaces, and the Components
Lesson: Introducing the Benefits, the Interfaces, and theComponents
Lesson OverviewIn this lesson, you will learn about the benefits of SAP BusinessObjects Planning andConsolidation as well as the interfaces, the key terms, and components.
Lesson ObjectivesAfter completing this lesson, you will be able to:
• Explain the key terms• Discuss the benefits of SAP BusinessObjects Planning and Consolidation• Describe the components• Identify the most important features of SAP BusinessObjects Planning and
Consolidation
Business ExampleYou are implementing the product and therefore need to familiarize yourself with thekey features, the interfaces, and the components.
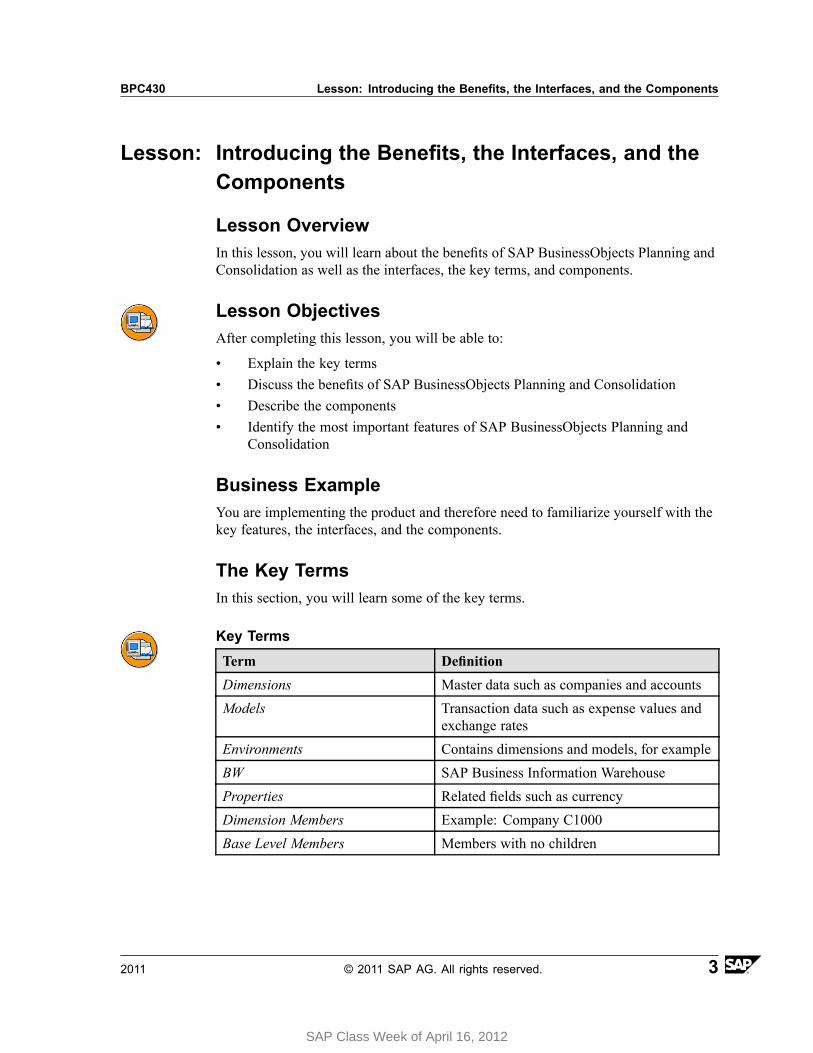
The Key TermsIn this section, you will learn some of the key terms.
Key Terms
Term Definition
Dimensions Master data such as companies and accounts
Models Transaction data such as expense values andexchange rates
Environments Contains dimensions and models, for example
BW SAP Business Information Warehouse
Properties Related fields such as currency
Dimension Members Example: Company C1000
Base Level Members Members with no children
2011 © 2011 SAP AG. All rights reserved. 3
SAP Class Week of April 16, 2012
Unit 1: SAP BusinessObjects Planning and Consolidation – Overview BPC430
Prior Versions versus 10.0 (1) Terms
Previous Term 10.0 Term
Applications Models
AppSets Environments
Owner Performer
DataSource Dimension Type Audit Trail Dimension Type
Group Dimension Type Scope Dimension Type
Live Reports Web Reports / Input Forms
Dynamic Hierarchy Editor Ownership Manager
Current View Context
Member Access Profile Data Access Profile
Apshell EnvironmentShell
Validations Controls
Note: The terms above apply to both platforms (listed below).
(1) SAP BusinessObjects Planning and Consolidation 10.0, version for SAPNetWeaver
(1) SAP BusinessObjects Planning and Consolidation 10.0, version for the Microsoftplatform
Planning and Consolidation is part of Enterprise Performance Management
4 © 2011 SAP AG. All rights reserved. 2011
SAP Class Week of April 16, 2012
BPC430 Lesson: Introducing the Benefits, the Interfaces, and the Components
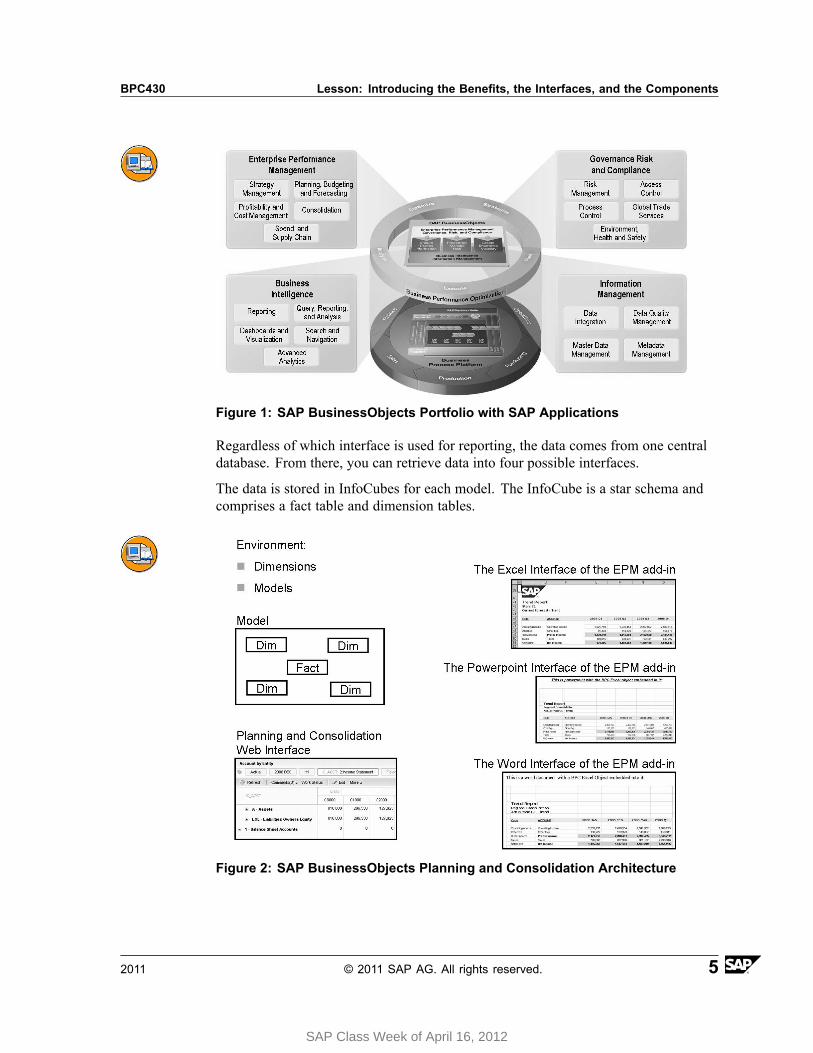
Figure 1: SAP BusinessObjects Portfolio with SAP Applications
Regardless of which interface is used for reporting, the data comes from one centraldatabase. From there, you can retrieve data into four possible interfaces.
The data is stored in InfoCubes for each model. The InfoCube is a star schema andcomprises a fact table and dimension tables.
Figure 2: SAP BusinessObjects Planning and Consolidation Architecture
2011 © 2011 SAP AG. All rights reserved. 5
SAP Class Week of April 16, 2012
Unit 1: SAP BusinessObjects Planning and Consolidation – Overview BPC430
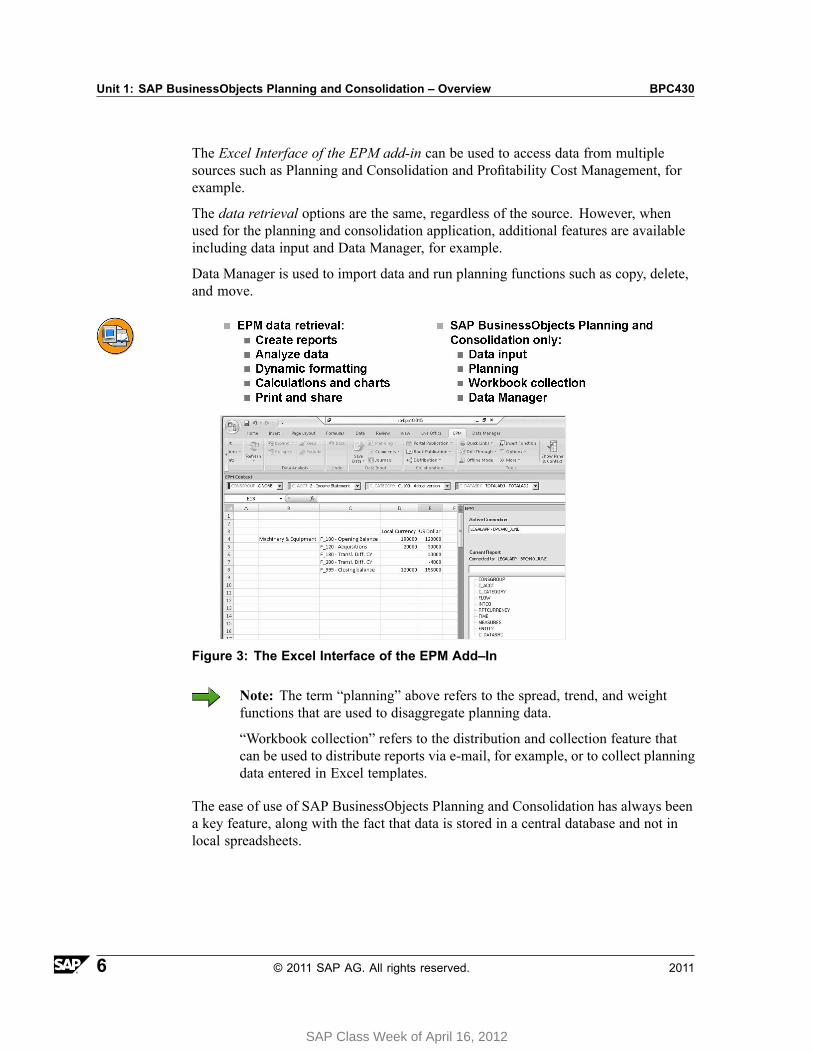
The Excel Interface of the EPM add-in can be used to access data from multiplesources such as Planning and Consolidation and Profitability Cost Management, forexample.
The data retrieval options are the same, regardless of the source. However, whenused for the planning and consolidation application, additional features are availableincluding data input and Data Manager, for example.
Data Manager is used to import data and run planning functions such as copy, delete,and move.
Figure 3: The Excel Interface of the EPM Add–In
Note: The term “planning” above refers to the spread, trend, and weightfunctions that are used to disaggregate planning data.
“Workbook collection” refers to the distribution and collection feature thatcan be used to distribute reports via e-mail, for example, or to collect planningdata entered in Excel templates.
The ease of use of SAP BusinessObjects Planning and Consolidation has always beena key feature, along with the fact that data is stored in a central database and not inlocal spreadsheets.
6 © 2011 SAP AG. All rights reserved. 2011
SAP Class Week of April 16, 2012
BPC430 Lesson: Introducing the Benefits, the Interfaces, and the Components
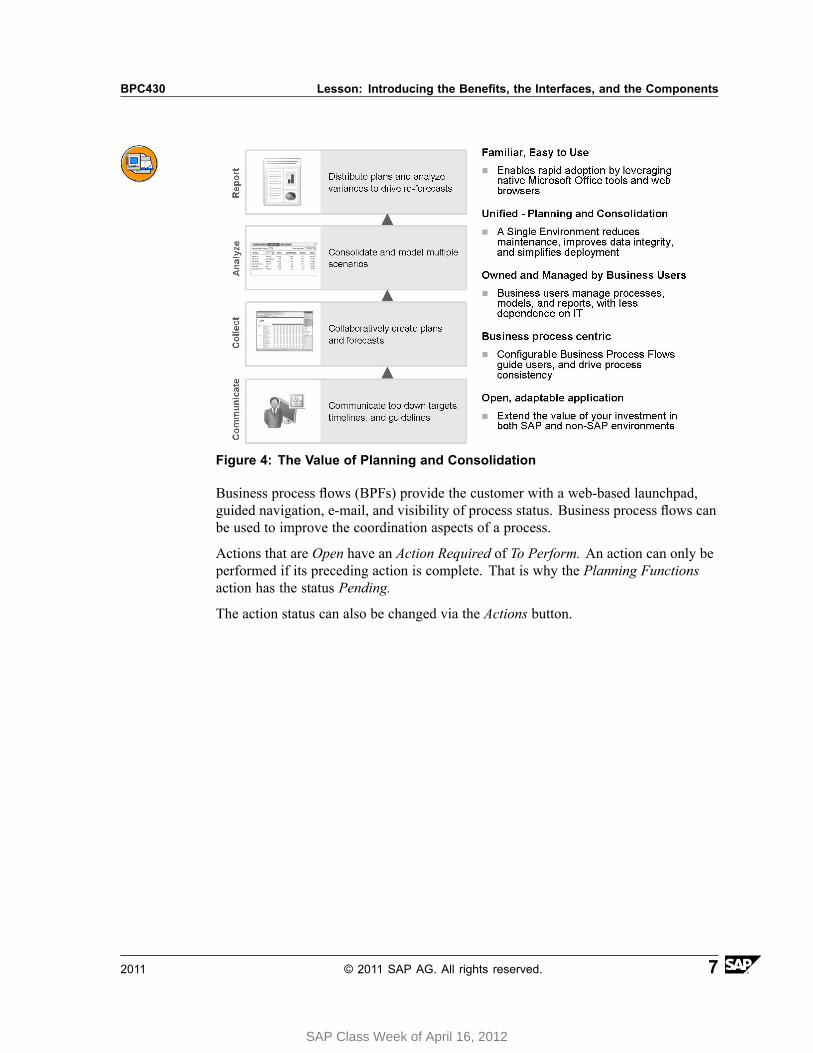
Figure 4: The Value of Planning and Consolidation
Business process flows (BPFs) provide the customer with a web-based launchpad,guided navigation, e-mail, and visibility of process status. Business process flows canbe used to improve the coordination aspects of a process.
Actions that are Open have an Action Required of To Perform. An action can only beperformed if its preceding action is complete. That is why the Planning Functionsaction has the status Pending.
The action status can also be changed via the Actions button.
2011 © 2011 SAP AG. All rights reserved. 7
SAP Class Week of April 16, 2012

Unit 1: SAP BusinessObjects Planning and Consolidation – Overview BPC430
Figure 5: Process-Centric
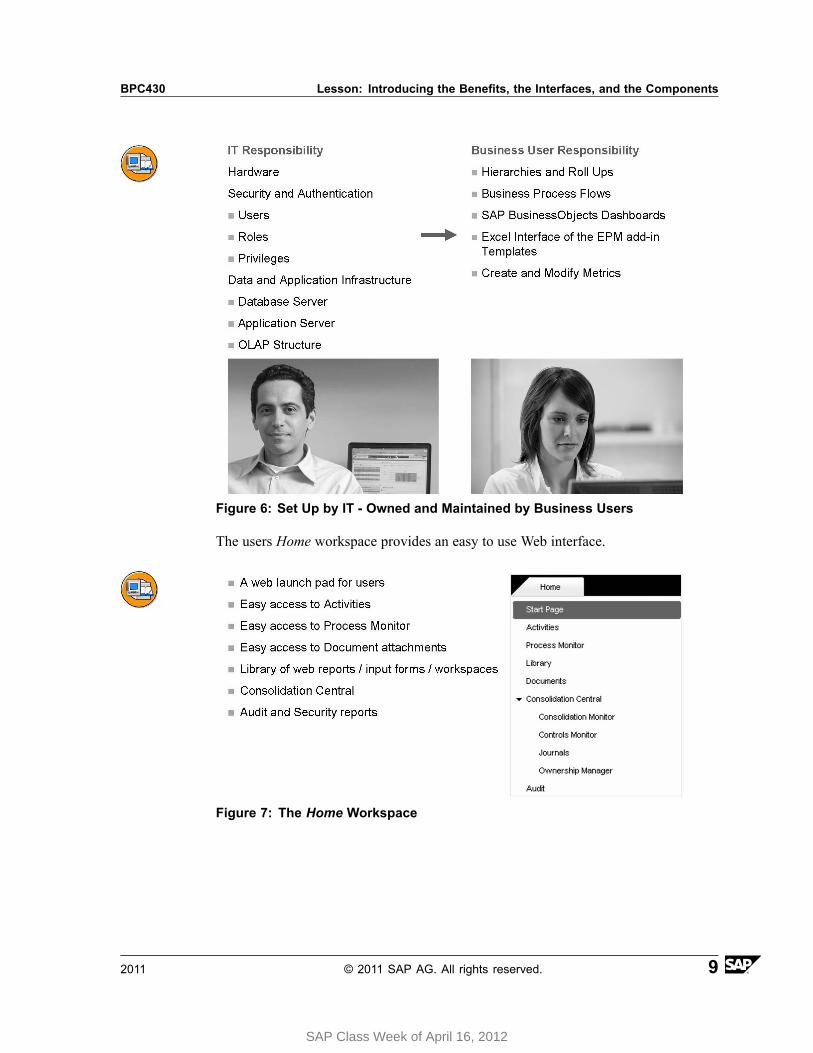
Since it is easy to use, IT does not always need to be involved in the configurationof SAP BusinessObjects Planning and Consolidation.
8 © 2011 SAP AG. All rights reserved. 2011
SAP Class Week of April 16, 2012
BPC430 Lesson: Introducing the Benefits, the Interfaces, and the Components
Figure 6: Set Up by IT - Owned and Maintained by Business Users
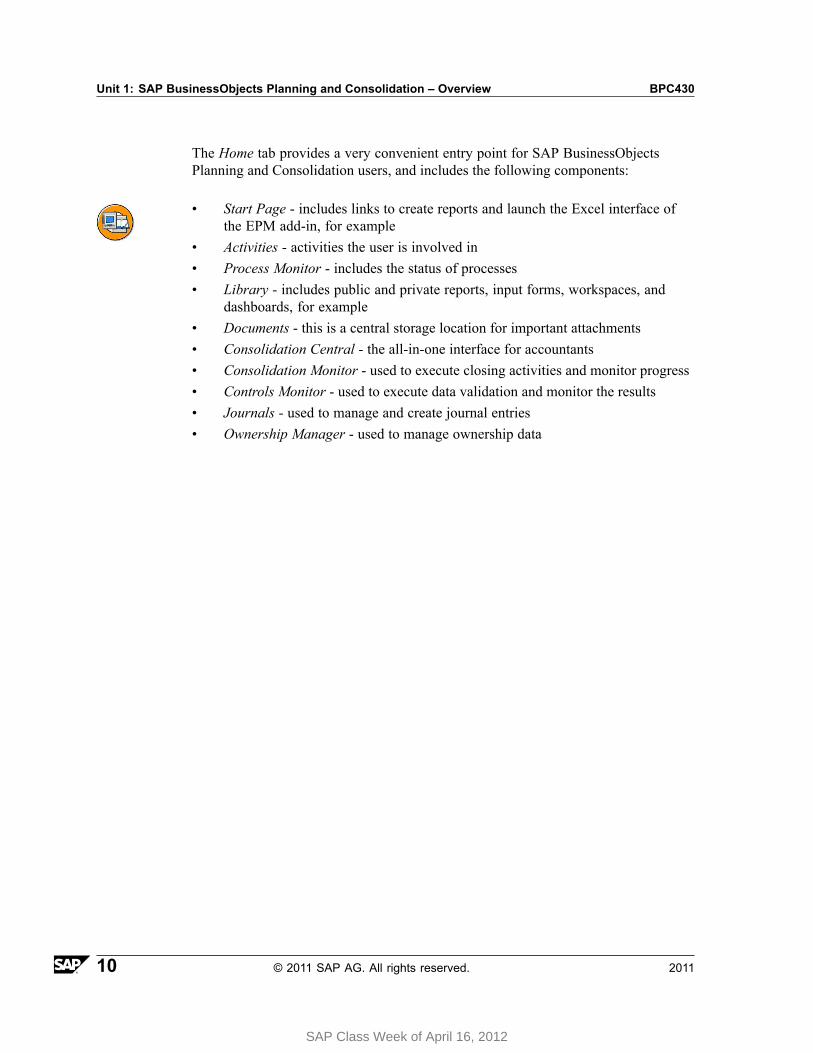
The users Home workspace provides an easy to use Web interface.
Figure 7: The Home Workspace
2011 © 2011 SAP AG. All rights reserved. 9
SAP Class Week of April 16, 2012
Unit 1: SAP BusinessObjects Planning and Consolidation – Overview BPC430
The Home tab provides a very convenient entry point for SAP BusinessObjectsPlanning and Consolidation users, and includes the following components:
• Start Page - includes links to create reports and launch the Excel interface ofthe EPM add-in, for example
• Activities - activities the user is involved in• Process Monitor - includes the status of processes• Library - includes public and private reports, input forms, workspaces, and
dashboards, for example• Documents - this is a central storage location for important attachments• Consolidation Central - the all-in-one interface for accountants• Consolidation Monitor - used to execute closing activities and monitor progress• Controls Monitor - used to execute data validation and monitor the results• Journals - used to manage and create journal entries• Ownership Manager - used to manage ownership data
10 © 2011 SAP AG. All rights reserved. 2011
SAP Class Week of April 16, 2012
BPC430 Lesson: Introducing the Benefits, the Interfaces, and the Components
Lesson Summary
You should now be able to:• Explain the key terms• Discuss the benefits of SAP BusinessObjects Planning and Consolidation• Describe the components• Identify the most important features of SAP BusinessObjects Planning and
Consolidation
2011 © 2011 SAP AG. All rights reserved. 11
SAP Class Week of April 16, 2012
Unit 1: SAP BusinessObjects Planning and Consolidation – Overview BPC430
Lesson: Introducing the Excel Interface of the EPM add-in
Lesson OverviewThis lesson shows you how to connect to the Excel Interface of the EPM add-in, usethe EPM Context Bar, set user options, and work with reports and input schedules.
Lesson ObjectivesAfter completing this lesson, you will be able to:
• Create an EPM add-in connection• Describe the features of the EPM add-in ribbon• Define default values for dimensions with the EPM Context Bar• Build a simple report
Business ExampleNow that your company or client has implemented SAP BusinessObjects Planningand Consolidation, you need to learn how to work with the new EPM add-in.
Overview of the EPM add-inIn this section, we will learn about the EPM add-in and how to connect to it.
The EPM add-in is an Office Add-in for Excel, Word, and PowerPoint.
12 © 2011 SAP AG. All rights reserved. 2011
SAP Class Week of April 16, 2012
BPC430 Lesson: Introducing the Excel Interface of the EPM add-in
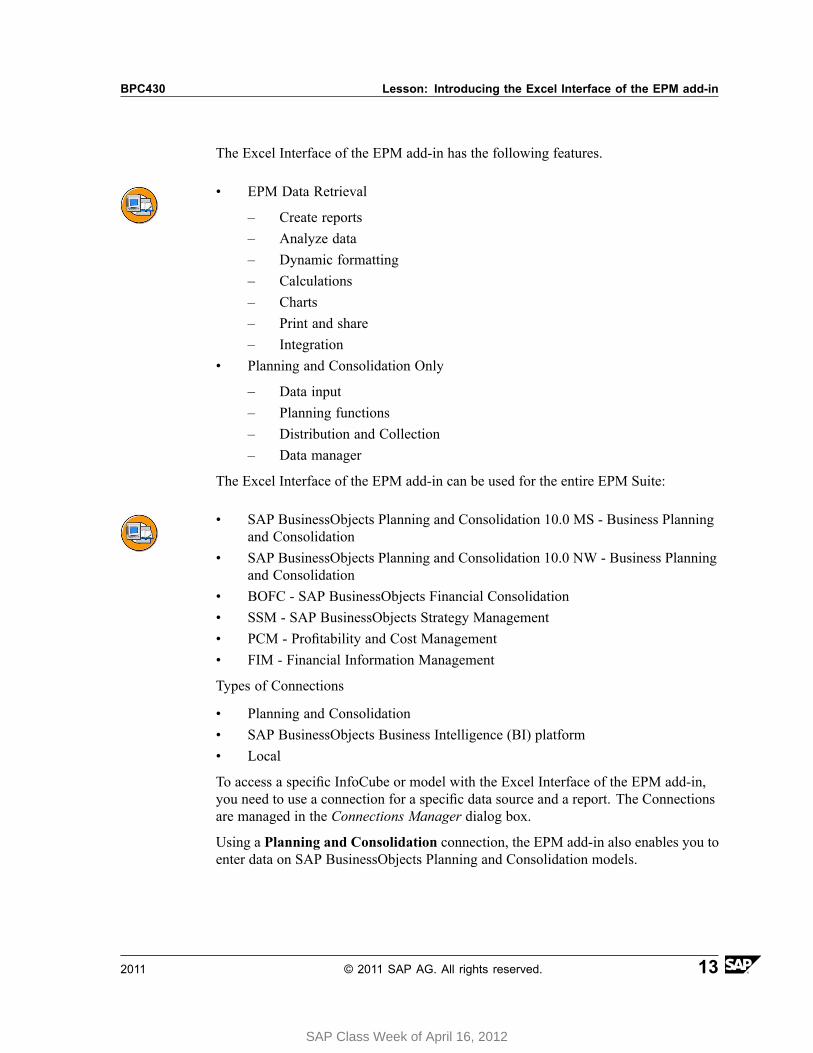
The Excel Interface of the EPM add-in has the following features.
• EPM Data Retrieval
– Create reports– Analyze data– Dynamic formatting– Calculations– Charts– Print and share– Integration
• Planning and Consolidation Only
– Data input– Planning functions– Distribution and Collection– Data manager
The Excel Interface of the EPM add-in can be used for the entire EPM Suite:
• SAP BusinessObjects Planning and Consolidation 10.0 MS - Business Planningand Consolidation
• SAP BusinessObjects Planning and Consolidation 10.0 NW - Business Planningand Consolidation
• BOFC - SAP BusinessObjects Financial Consolidation• SSM - SAP BusinessObjects Strategy Management• PCM - Profitability and Cost Management• FIM - Financial Information Management
Types of Connections
• Planning and Consolidation• SAP BusinessObjects Business Intelligence (BI) platform• Local
To access a specific InfoCube or model with the Excel Interface of the EPM add-in,you need to use a connection for a specific data source and a report. The Connectionsare managed in the Connections Manager dialog box.
Using a Planning and Consolidation connection, the EPM add-in also enables you toenter data on SAP BusinessObjects Planning and Consolidation models.
2011 © 2011 SAP AG. All rights reserved. 13
SAP Class Week of April 16, 2012
Unit 1: SAP BusinessObjects Planning and Consolidation – Overview BPC430
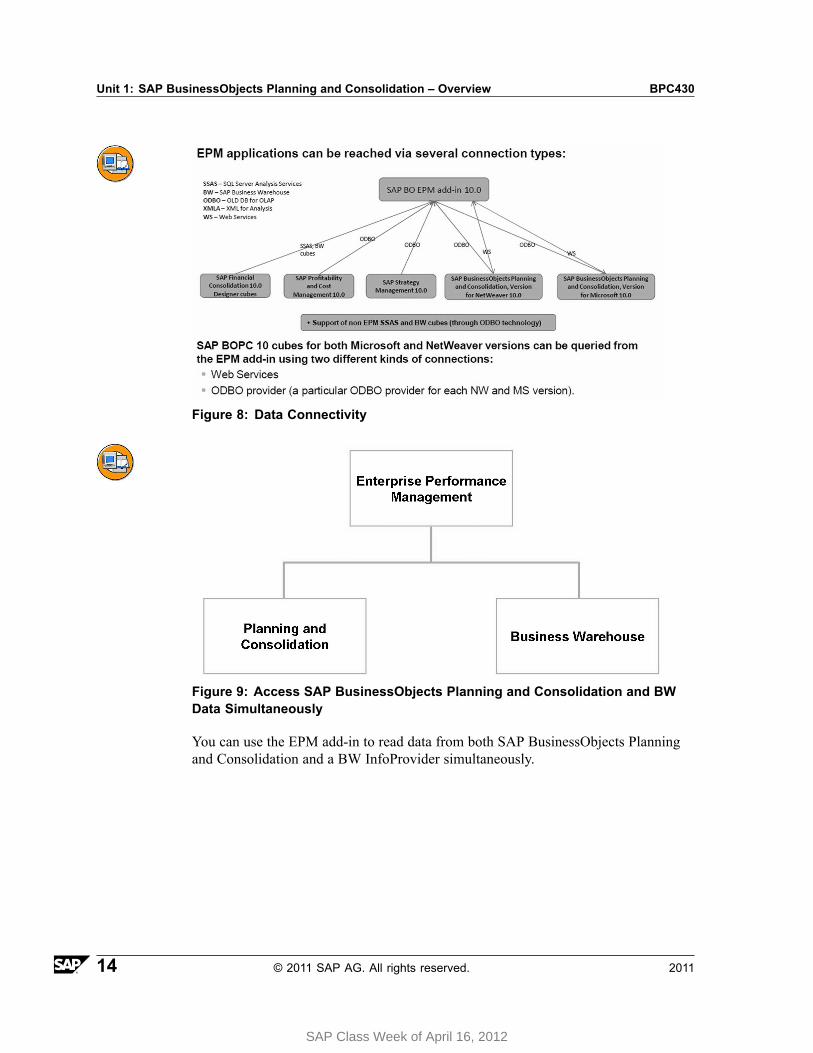
Figure 8: Data Connectivity
Figure 9: Access SAP BusinessObjects Planning and Consolidation and BWData Simultaneously
You can use the EPM add-in to read data from both SAP BusinessObjects Planningand Consolidation and a BW InfoProvider simultaneously.
14 © 2011 SAP AG. All rights reserved. 2011
SAP Class Week of April 16, 2012
BPC430 Lesson: Introducing the Excel Interface of the EPM add-in
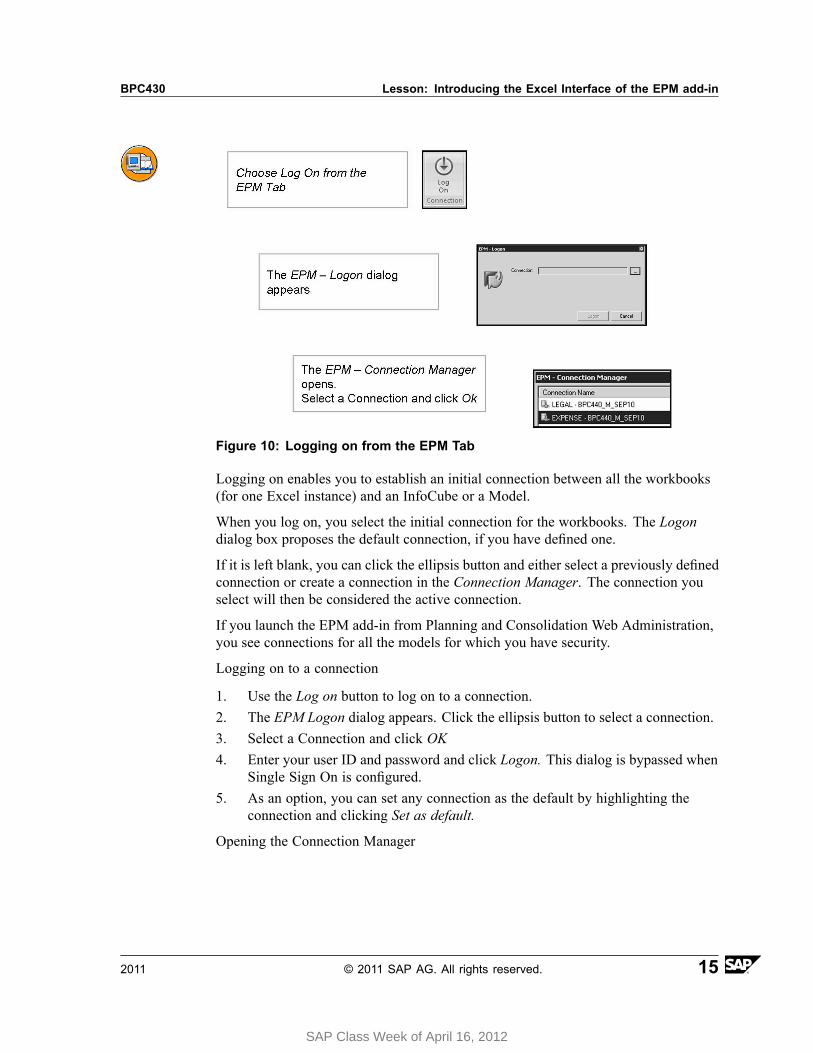
Figure 10: Logging on from the EPM Tab
Logging on enables you to establish an initial connection between all the workbooks(for one Excel instance) and an InfoCube or a Model.
When you log on, you select the initial connection for the workbooks. The Logondialog box proposes the default connection, if you have defined one.
If it is left blank, you can click the ellipsis button and either select a previously definedconnection or create a connection in the Connection Manager. The connection youselect will then be considered the active connection.
If you launch the EPM add-in from Planning and Consolidation Web Administration,you see connections for all the models for which you have security.
Logging on to a connection
1. Use the Log on button to log on to a connection.2. The EPM Logon dialog appears. Click the ellipsis button to select a connection.3. Select a Connection and click OK4. Enter your user ID and password and click Logon. This dialog is bypassed when
Single Sign On is configured.5. As an option, you can set any connection as the default by highlighting the
connection and clicking Set as default.
Opening the Connection Manager
2011 © 2011 SAP AG. All rights reserved. 15
SAP Class Week of April 16, 2012
Unit 1: SAP BusinessObjects Planning and Consolidation – Overview BPC430
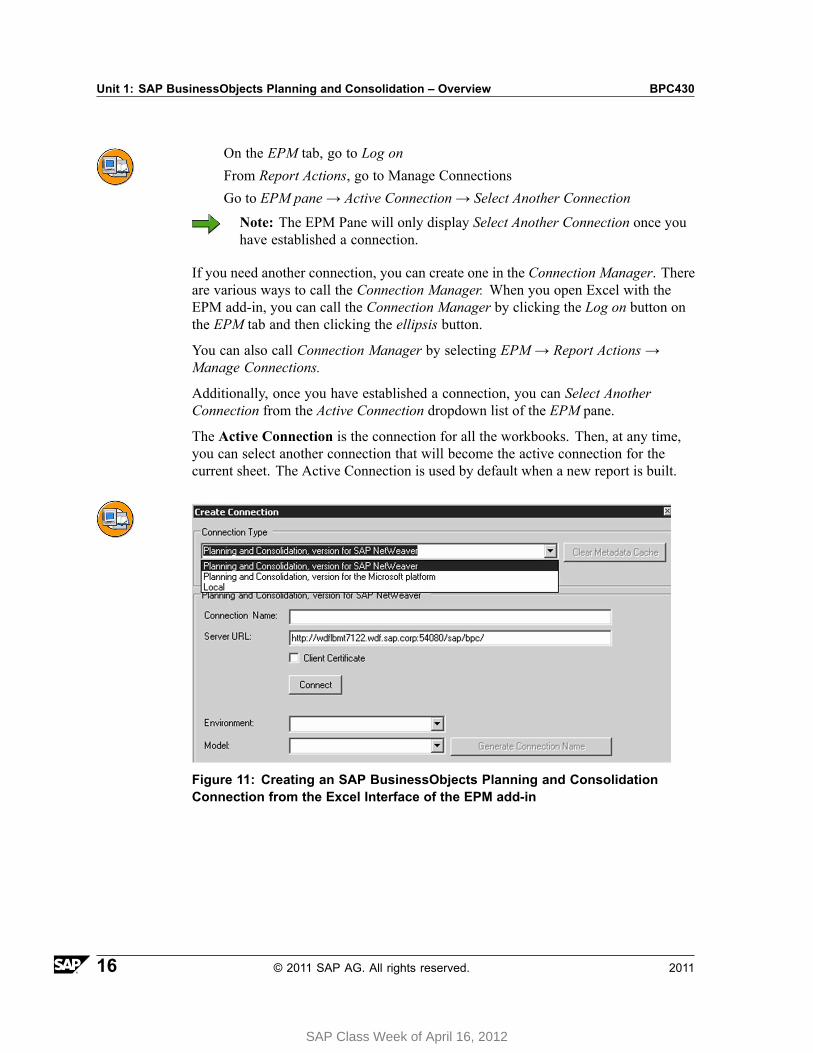
On the EPM tab, go to Log onFrom Report Actions, go to Manage ConnectionsGo to EPM pane → Active Connection → Select Another Connection
Note: The EPM Pane will only display Select Another Connection once youhave established a connection.
If you need another connection, you can create one in the Connection Manager. Thereare various ways to call the Connection Manager. When you open Excel with theEPM add-in, you can call the Connection Manager by clicking the Log on button onthe EPM tab and then clicking the ellipsis button.
You can also call Connection Manager by selecting EPM → Report Actions →Manage Connections.
Additionally, once you have established a connection, you can Select AnotherConnection from the Active Connection dropdown list of the EPM pane.
The Active Connection is the connection for all the workbooks. Then, at any time,you can select another connection that will become the active connection for thecurrent sheet. The Active Connection is used by default when a new report is built.
Figure 11: Creating an SAP BusinessObjects Planning and ConsolidationConnection from the Excel Interface of the EPM add-in
16 © 2011 SAP AG. All rights reserved. 2011
SAP Class Week of April 16, 2012
BPC430 Lesson: Introducing the Excel Interface of the EPM add-in
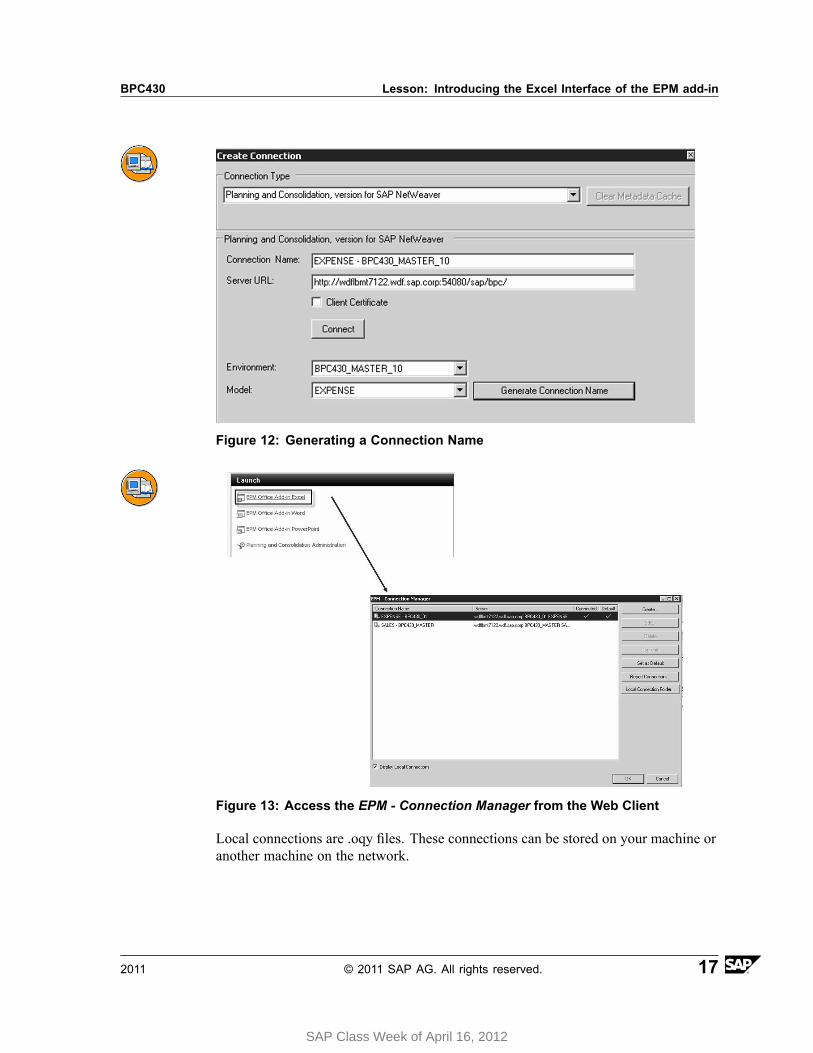
Figure 12: Generating a Connection Name
Figure 13: Access the EPM - Connection Manager from the Web Client
Local connections are .oqy files. These connections can be stored on your machine oranother machine on the network.
2011 © 2011 SAP AG. All rights reserved. 17
SAP Class Week of April 16, 2012
Unit 1: SAP BusinessObjects Planning and Consolidation – Overview BPC430
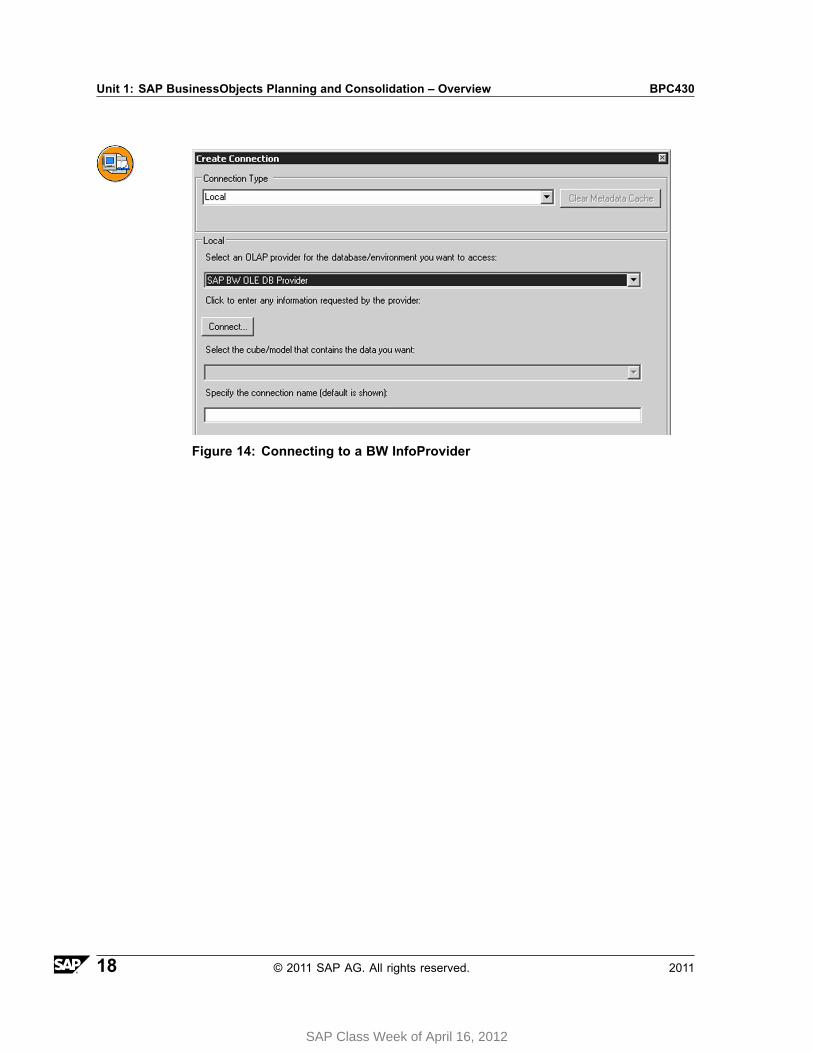
Figure 14: Connecting to a BW InfoProvider
18 © 2011 SAP AG. All rights reserved. 2011
SAP Class Week of April 16, 2012
BPC430 Lesson: Introducing the Excel Interface of the EPM add-in
Connecting to a BW InfoProvider
1. In the EPM Connection Manager, choose Create
2. From the Create Connection window, choose Local. Then, from the LocalConnections dropdown, select SAP BWOLE DB Provider. Then choose Connect.
3. In the window, enter your system credentials and then choose Next.
4. In the EPM-Logon window, enter your user name and password andchoose Log on.
5. In the Create New OLE DB Data Source window, choose $INFOCUBE andchoose Finish.
6. In the Create Connection window, choose the BW InfoProvider from the Selectthe cube/model that contains the data you want dropdown box and then chooseOK
7. In the Browse for Folder window, select the folder where you would like to savethis local connection and choose OK
2011 © 2011 SAP AG. All rights reserved. 19
SAP Class Week of April 16, 2012
Unit 1: SAP BusinessObjects Planning and Consolidation – Overview BPC430
Enabling the EPM add-inUseIf the Excel Interface of the EPM add-in has been disabled, you can enable it byfollowing the steps below:
Procedure1. In Microsoft Office Excel 2007, choose the Office button, then choose the Excel
Options button.
2. In the Excel Options window, choose Add-ins.
3. Choose Disabled Items from the Manage drop-down menu and choose the Gobutton.
4. In the Disabled Items window, choose the SAP BusinessObjects EPM Solutions,Add-in for Microsoft Office and choose the Enable button.
5. Choose the Close button.
The EPM RibbonIn this section, you will learn how to use the EPM add-in Ribbon.
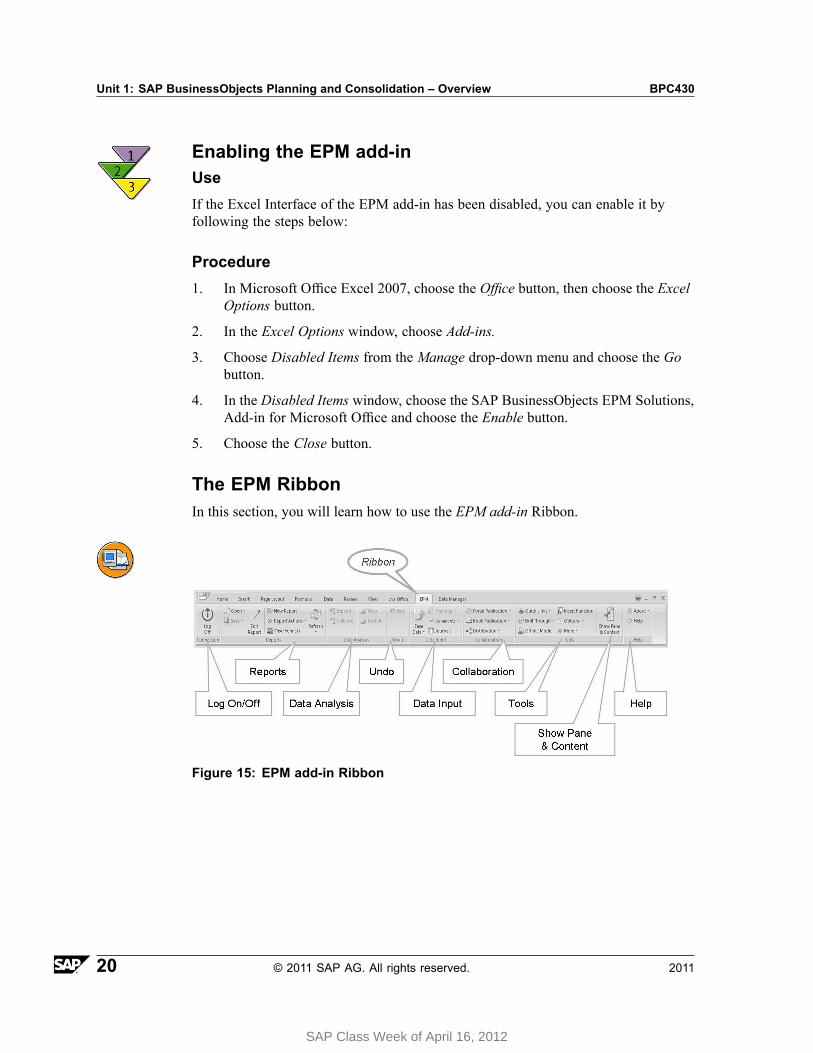
Figure 15: EPM add-in Ribbon
20 © 2011 SAP AG. All rights reserved. 2011
SAP Class Week of April 16, 2012
BPC430 Lesson: Introducing the Excel Interface of the EPM add-in
The EPM add-in for Microsoft Office contains an EPM tab with a ribbon. The EPMtab is the main entry point to perform reporting and data input actions. Depending onthe Microsoft Office application (Excel, Work, PowerPoint), the EPM tab does notcontain all the same commands.
Note: When installing the EPM add-in, you specify the applications you use.For example, if you specified you would use Financial Consolidation, theData Input group in the ribbon is not displayed since it is not relevant for thisapplication. If you want to use Planning and Consolidation later on, you candisplay the commands that are related to Planning and Consolidation.
When positioning your cursor on a command in the EPM tab, a tooltip appears,explaining the command.
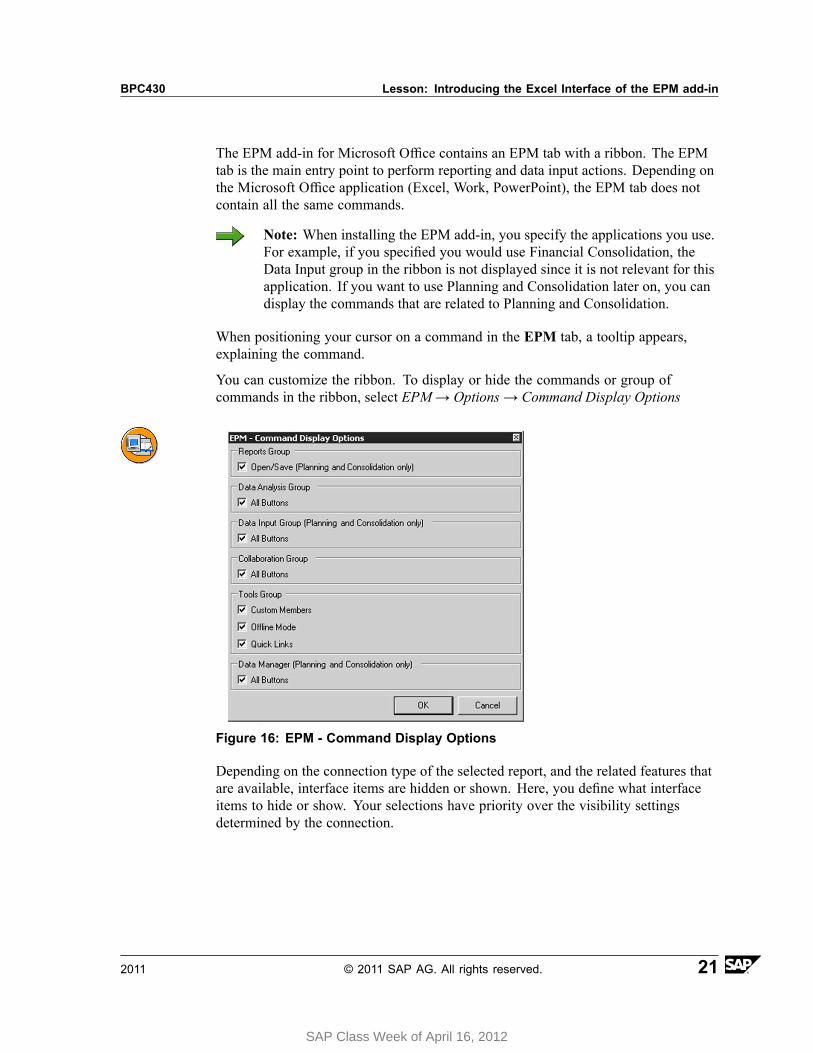
You can customize the ribbon. To display or hide the commands or group ofcommands in the ribbon, select EPM→ Options → Command Display Options
Figure 16: EPM - Command Display Options
Depending on the connection type of the selected report, and the related features thatare available, interface items are hidden or shown. Here, you define what interfaceitems to hide or show. Your selections have priority over the visibility settingsdetermined by the connection.
2011 © 2011 SAP AG. All rights reserved. 21
SAP Class Week of April 16, 2012
Unit 1: SAP BusinessObjects Planning and Consolidation – Overview BPC430
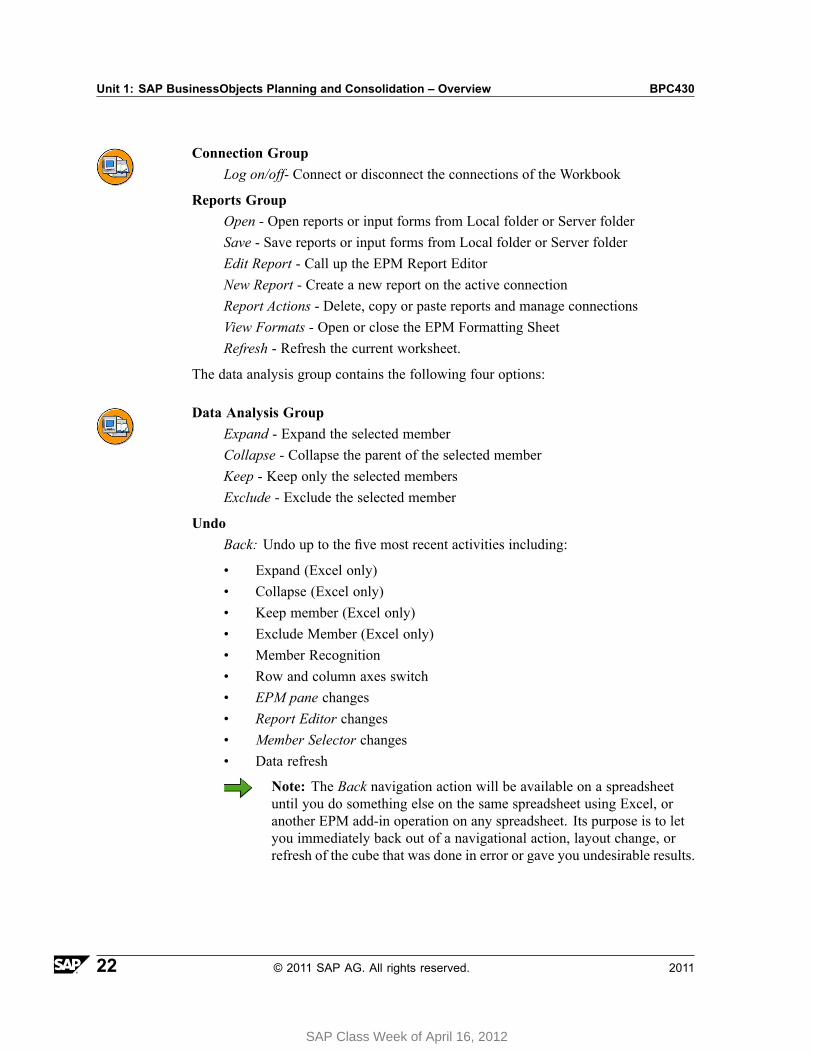
Connection GroupLog on/off- Connect or disconnect the connections of the Workbook
Reports GroupOpen - Open reports or input forms from Local folder or Server folderSave - Save reports or input forms from Local folder or Server folderEdit Report - Call up the EPM Report EditorNew Report - Create a new report on the active connectionReport Actions - Delete, copy or paste reports and manage connectionsView Formats - Open or close the EPM Formatting SheetRefresh - Refresh the current worksheet.
The data analysis group contains the following four options:
Data Analysis GroupExpand - Expand the selected memberCollapse - Collapse the parent of the selected memberKeep - Keep only the selected membersExclude - Exclude the selected member
UndoBack: Undo up to the five most recent activities including:
• Expand (Excel only)• Collapse (Excel only)• Keep member (Excel only)• Exclude Member (Excel only)• Member Recognition• Row and column axes switch• EPM pane changes• Report Editor changes• Member Selector changes• Data refresh
Note: The Back navigation action will be available on a spreadsheetuntil you do something else on the same spreadsheet using Excel, oranother EPM add-in operation on any spreadsheet. Its purpose is to letyou immediately back out of a navigational action, layout change, orrefresh of the cube that was done in error or gave you undesirable results.
22 © 2011 SAP AG. All rights reserved. 2011
SAP Class Week of April 16, 2012
BPC430 Lesson: Introducing the Excel Interface of the EPM add-in
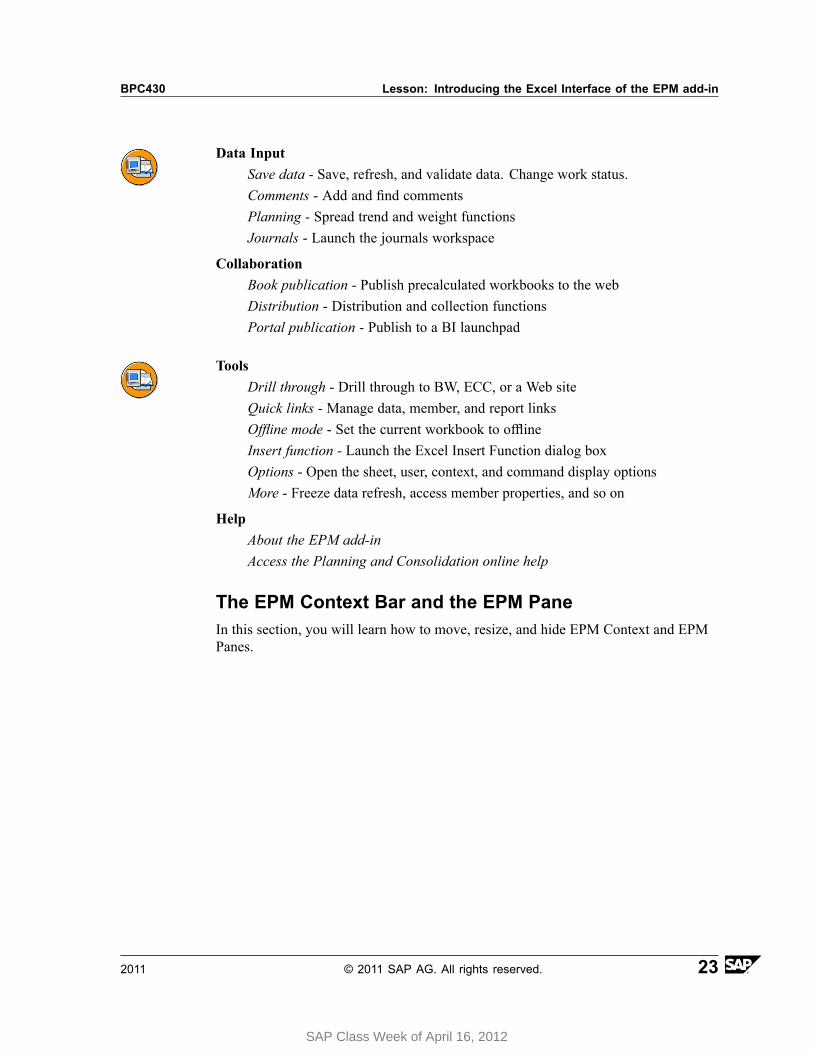
Data InputSave data - Save, refresh, and validate data. Change work status.Comments - Add and find commentsPlanning - Spread trend and weight functionsJournals - Launch the journals workspace
CollaborationBook publication - Publish precalculated workbooks to the webDistribution - Distribution and collection functionsPortal publication - Publish to a BI launchpad
ToolsDrill through - Drill through to BW, ECC, or a Web siteQuick links - Manage data, member, and report linksOffline mode - Set the current workbook to offlineInsert function - Launch the Excel Insert Function dialog boxOptions - Open the sheet, user, context, and command display optionsMore - Freeze data refresh, access member properties, and so on
HelpAbout the EPM add-inAccess the Planning and Consolidation online help
The EPM Context Bar and the EPM PaneIn this section, you will learn how to move, resize, and hide EPM Context and EPMPanes.
2011 © 2011 SAP AG. All rights reserved. 23
SAP Class Week of April 16, 2012
Unit 1: SAP BusinessObjects Planning and Consolidation – Overview BPC430
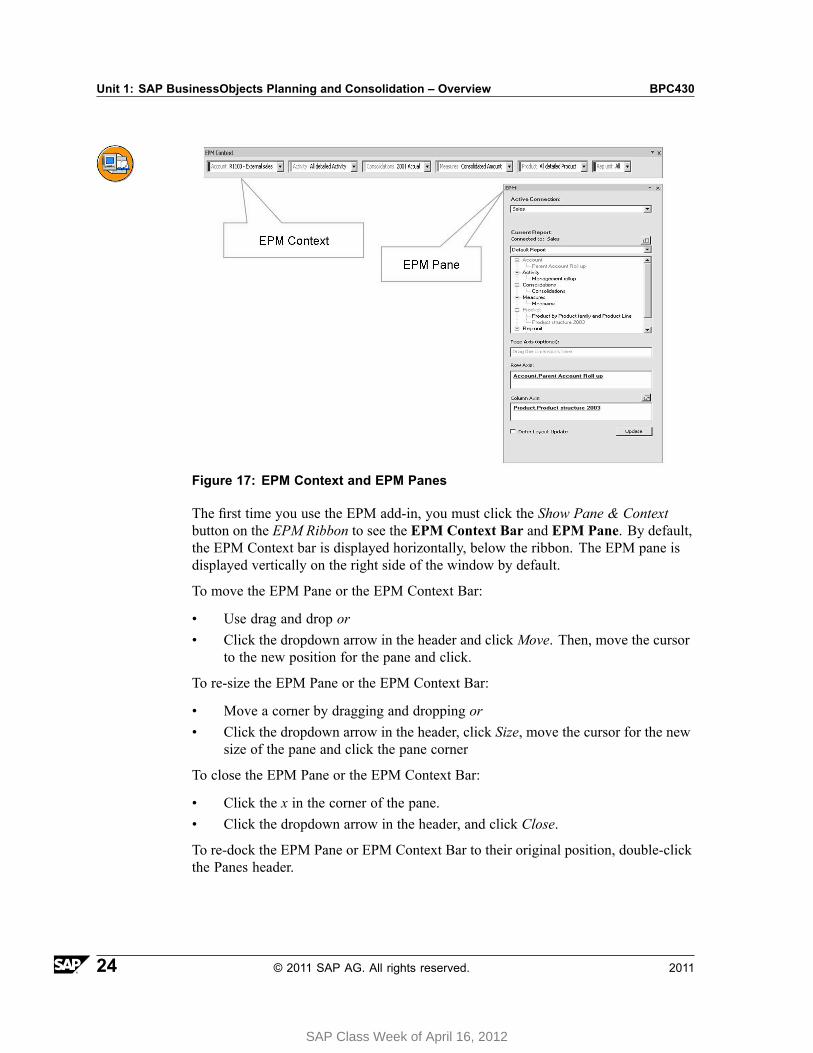
Figure 17: EPM Context and EPM Panes
The first time you use the EPM add-in, you must click the Show Pane & Contextbutton on the EPM Ribbon to see the EPM Context Bar and EPM Pane. By default,the EPM Context bar is displayed horizontally, below the ribbon. The EPM pane isdisplayed vertically on the right side of the window by default.
To move the EPM Pane or the EPM Context Bar:
• Use drag and drop or• Click the dropdown arrow in the header and click Move. Then, move the cursor
to the new position for the pane and click.
To re-size the EPM Pane or the EPM Context Bar:
• Move a corner by dragging and dropping or• Click the dropdown arrow in the header, click Size, move the cursor for the new
size of the pane and click the pane corner
To close the EPM Pane or the EPM Context Bar:
• Click the x in the corner of the pane.• Click the dropdown arrow in the header, and click Close.
To re-dock the EPM Pane or EPM Context Bar to their original position, double-clickthe Panes header.
24 © 2011 SAP AG. All rights reserved. 2011
SAP Class Week of April 16, 2012
BPC430 Lesson: Introducing the Excel Interface of the EPM add-in
To hide the EPM Pane or the EPM Context Bar:
• On the EPM Ribbon Tools group, select the Options → User Options. Go to theOthers tab, and deselect the Display EPM Context Bar and Display EPM Panecheckboxes in the lower right-hand corner.
• Use the toggle button Show Pane & Context in the EPM Ribbon. (This willshow or hide both panes.)
Note: The Show Pane & Context toggle button will only work if you haveyour User Options set to display these panes.
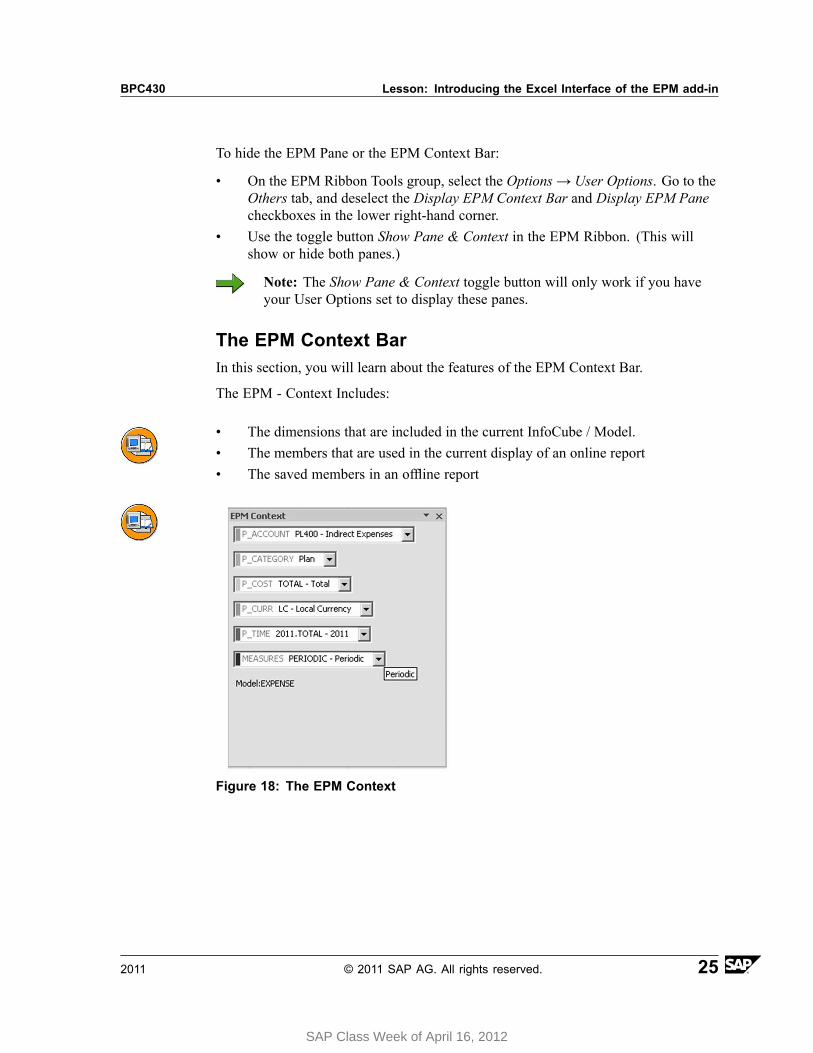
The EPM Context BarIn this section, you will learn about the features of the EPM Context Bar.
The EPM - Context Includes:
• The dimensions that are included in the current InfoCube / Model.• The members that are used in the current display of an online report• The saved members in an offline report
Figure 18: The EPM Context
2011 © 2011 SAP AG. All rights reserved. 25
SAP Class Week of April 16, 2012
Unit 1: SAP BusinessObjects Planning and Consolidation – Overview BPC430
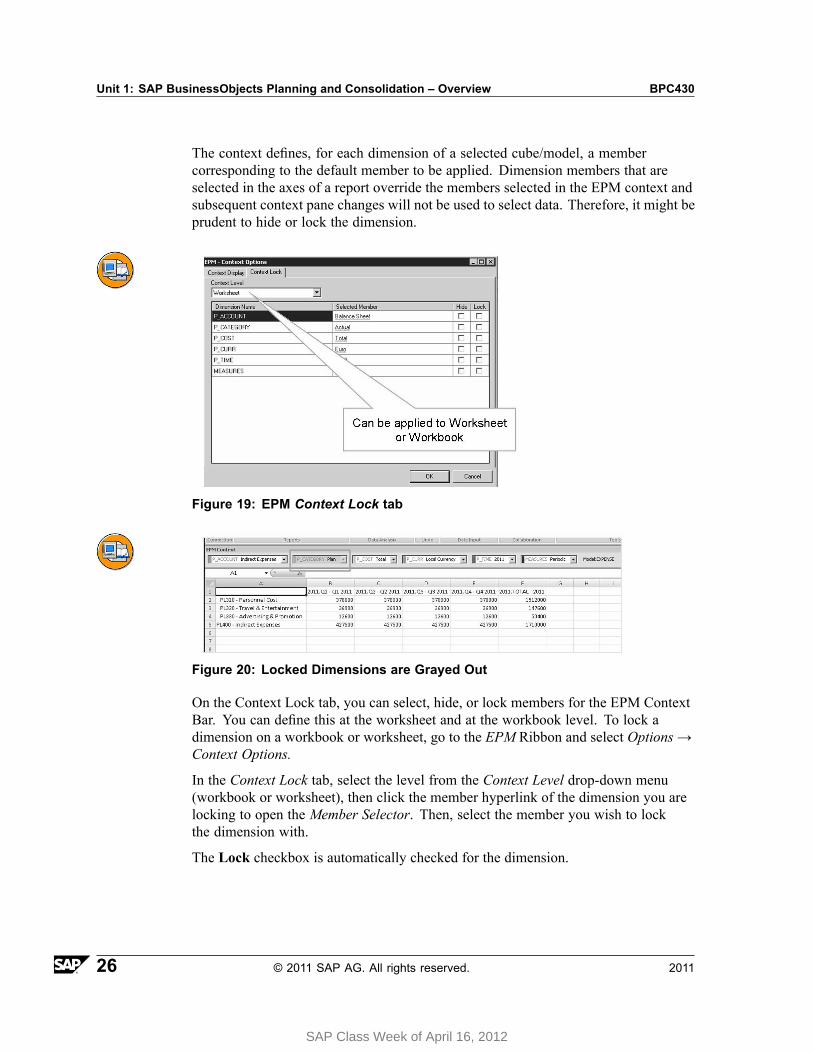
The context defines, for each dimension of a selected cube/model, a membercorresponding to the default member to be applied. Dimension members that areselected in the axes of a report override the members selected in the EPM context andsubsequent context pane changes will not be used to select data. Therefore, it might beprudent to hide or lock the dimension.
Figure 19: EPM Context Lock tab
Figure 20: Locked Dimensions are Grayed Out
On the Context Lock tab, you can select, hide, or lock members for the EPM ContextBar. You can define this at the worksheet and at the workbook level. To lock adimension on a workbook or worksheet, go to the EPM Ribbon and select Options →Context Options.
In the Context Lock tab, select the level from the Context Level drop-down menu(workbook or worksheet), then click the member hyperlink of the dimension you arelocking to open the Member Selector. Then, select the member you wish to lockthe dimension with.
The Lock checkbox is automatically checked for the dimension.
26 © 2011 SAP AG. All rights reserved. 2011
SAP Class Week of April 16, 2012
BPC430 Lesson: Introducing the Excel Interface of the EPM add-in
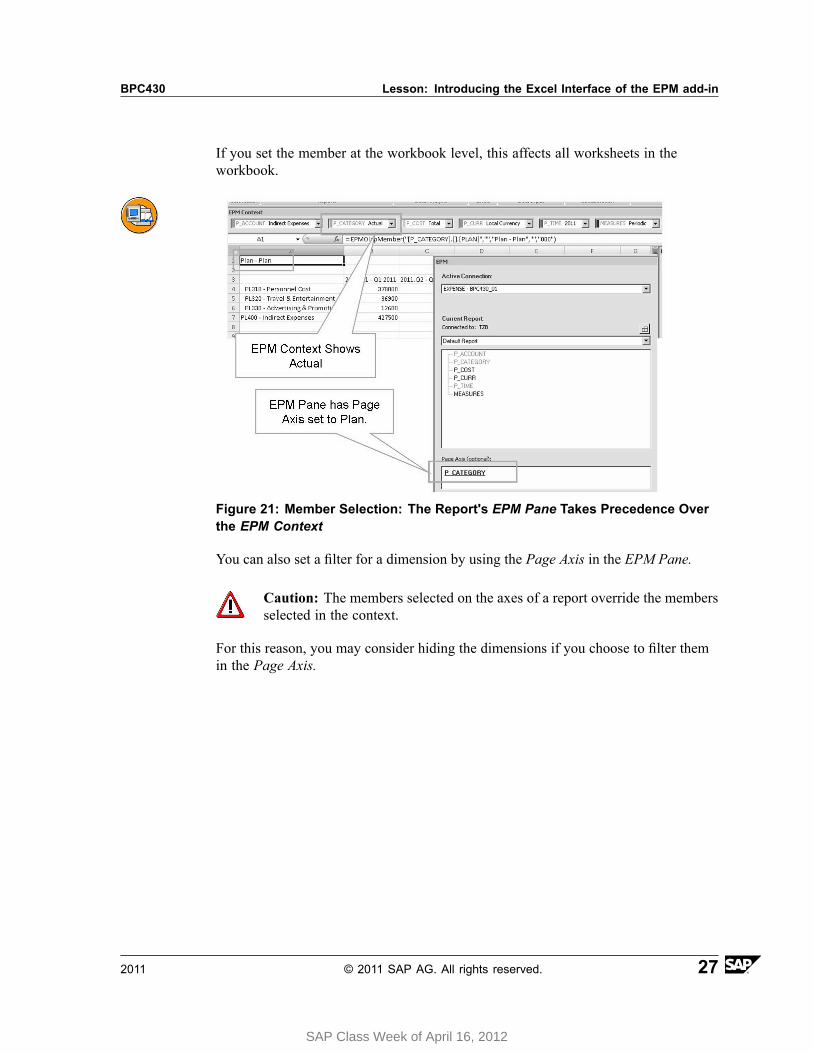
If you set the member at the workbook level, this affects all worksheets in theworkbook.
Figure 21: Member Selection: The Report's EPM Pane Takes Precedence Overthe EPM Context
You can also set a filter for a dimension by using the Page Axis in the EPM Pane.
Caution: The members selected on the axes of a report override the membersselected in the context.
For this reason, you may consider hiding the dimensions if you choose to filter themin the Page Axis.
2011 © 2011 SAP AG. All rights reserved. 27
SAP Class Week of April 16, 2012
Unit 1: SAP BusinessObjects Planning and Consolidation – Overview BPC430
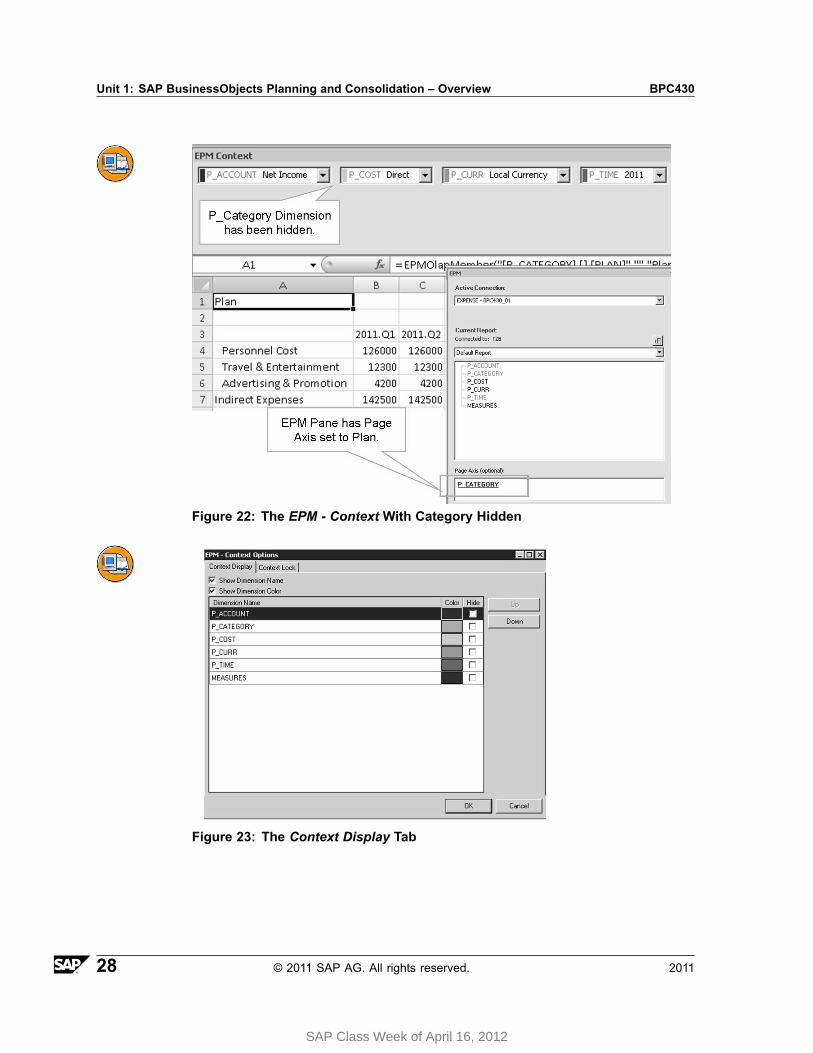
Figure 22: The EPM - Context With Category Hidden
Figure 23: The Context Display Tab
28 © 2011 SAP AG. All rights reserved. 2011
SAP Class Week of April 16, 2012
BPC430 Lesson: Introducing the Excel Interface of the EPM add-in
Here, you define the EPM Context Bar options. The list of dimensions changes fromone worksheet to another. In the Context Display tab, you define the display of theEPM Context Bar.
You can specify display settings for the context by selecting EPM → Options →Context Options.
The following options are available on the Context Display Options tab:
• Hiding Dimensions: You can decide not to display a dimension in the EPMContext bar by selecting the Hide checkbox. This checkbox is available on boththe Context Display and Context Lock tabs. This is helpful if you have locked adimension on the worksheet or if you decide to filter using the Page Axis andwant to hide it from the EPM Context bar.
• Dimension and Member Name Display: The name of the dimension and thename of the member are displayed in the EPM Context bar by default. If youprefer to only show the member name, and not the dimension name, you canuncheck the Show Dimension Name option.
• Dimension Color: Colors are displayed by default in the EPM Context bar. Youcan choose not to display the colors by unchecking the Show Dimension Coloroption. Additionally, you can define the colors you want by clicking the coloredarea in the Color column and selecting a color from the palette.
• Dimension Order: You can modify the default order of the dimensions as theyappear in the EPM Context bar by selecting a dimension and clicking the Upor Down button.
The EPM PaneSAP BusinessObjects EPM solutions 10.0, Add-in for Microsoft Office (the EPMadd-in) provides multiple ways to create a new report including:
• EPM Report Editor• Entering members directly in a sheet• EPM Pane• Report creation using copy and paste.• Drag and Drop
This section will show how to create a report using the EPM Pane.
2011 © 2011 SAP AG. All rights reserved. 29
SAP Class Week of April 16, 2012
Unit 1: SAP BusinessObjects Planning and Consolidation – Overview BPC430
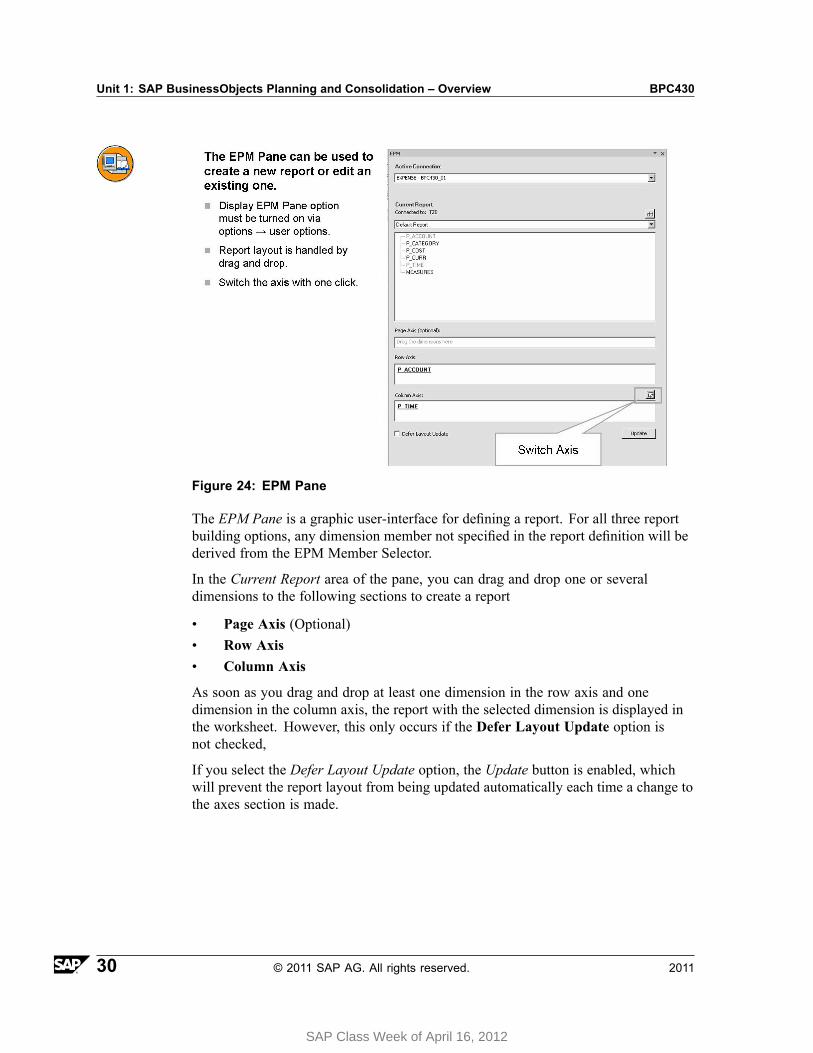
Figure 24: EPM Pane
The EPM Pane is a graphic user-interface for defining a report. For all three reportbuilding options, any dimension member not specified in the report definition will bederived from the EPM Member Selector.
In the Current Report area of the pane, you can drag and drop one or severaldimensions to the following sections to create a report
• Page Axis (Optional)• Row Axis• Column Axis
As soon as you drag and drop at least one dimension in the row axis and onedimension in the column axis, the report with the selected dimension is displayed inthe worksheet. However, this only occurs if the Defer Layout Update option isnot checked,
If you select the Defer Layout Update option, the Update button is enabled, whichwill prevent the report layout from being updated automatically each time a change tothe axes section is made.
30 © 2011 SAP AG. All rights reserved. 2011
SAP Class Week of April 16, 2012
BPC430 Lesson: Introducing the Excel Interface of the EPM add-in
This can help improve performance when you are accessing a large amount of data.This will allow you to quickly add, move, and remove dimensions from the dimensionssection to the axes sections. Then you can select Update when you are finished.
By default, the member taken into account for a dimension is the one defined in thecontext, with theMember and Children relationship. Once a dimension has beenadded to an axis section, you can select another member for the dimension by clickingthe dimension name that appears as a link. TheMember Selector opens and youcan select the member you want.
When placing several dimensions on one axis, you can reorder the dimensions byselecting a dimension row (click to the right of the dimension link, not the linkitself) and dragging and dropping it. This can also be accomplished by selectinga dimension, and using the dropdown.
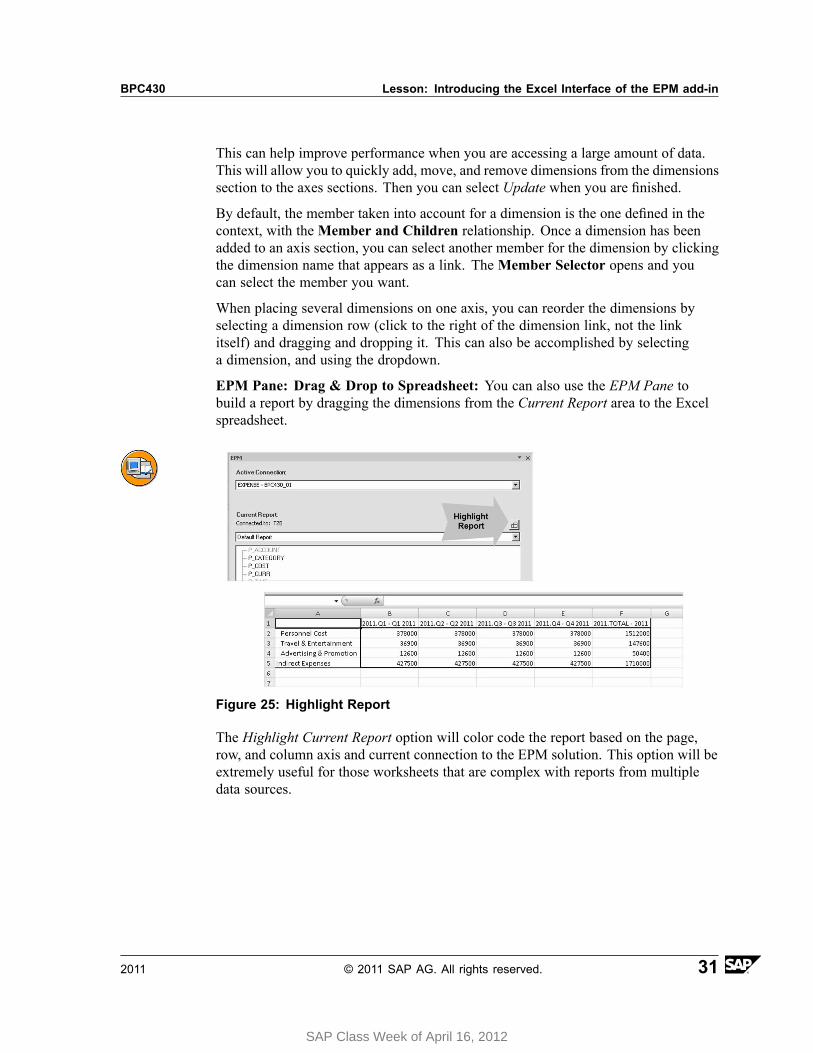
EPM Pane: Drag & Drop to Spreadsheet: You can also use the EPM Pane tobuild a report by dragging the dimensions from the Current Report area to the Excelspreadsheet.
Figure 25: Highlight Report
The Highlight Current Report option will color code the report based on the page,row, and column axis and current connection to the EPM solution. This option will beextremely useful for those worksheets that are complex with reports from multipledata sources.
2011 © 2011 SAP AG. All rights reserved. 31
SAP Class Week of April 16, 2012
Unit 1: SAP BusinessObjects Planning and Consolidation – Overview BPC430
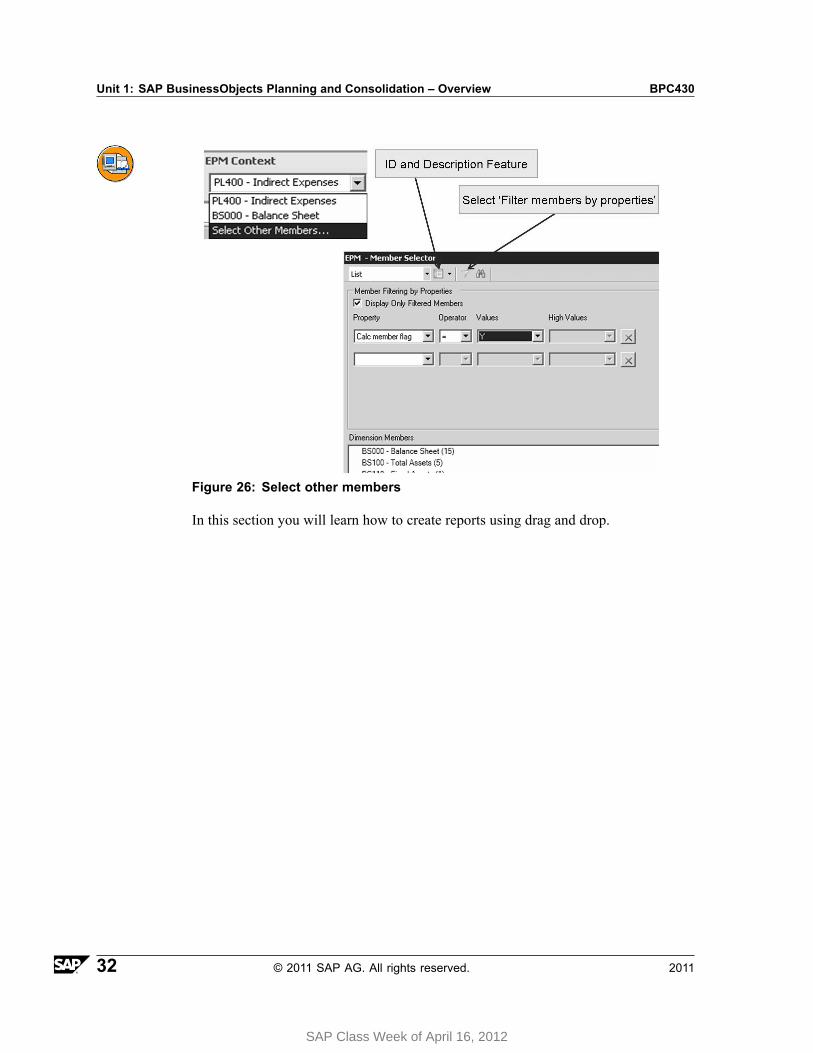
Figure 26: Select other members
In this section you will learn how to create reports using drag and drop.
32 © 2011 SAP AG. All rights reserved. 2011
SAP Class Week of April 16, 2012
BPC430 Lesson: Introducing the Excel Interface of the EPM add-in
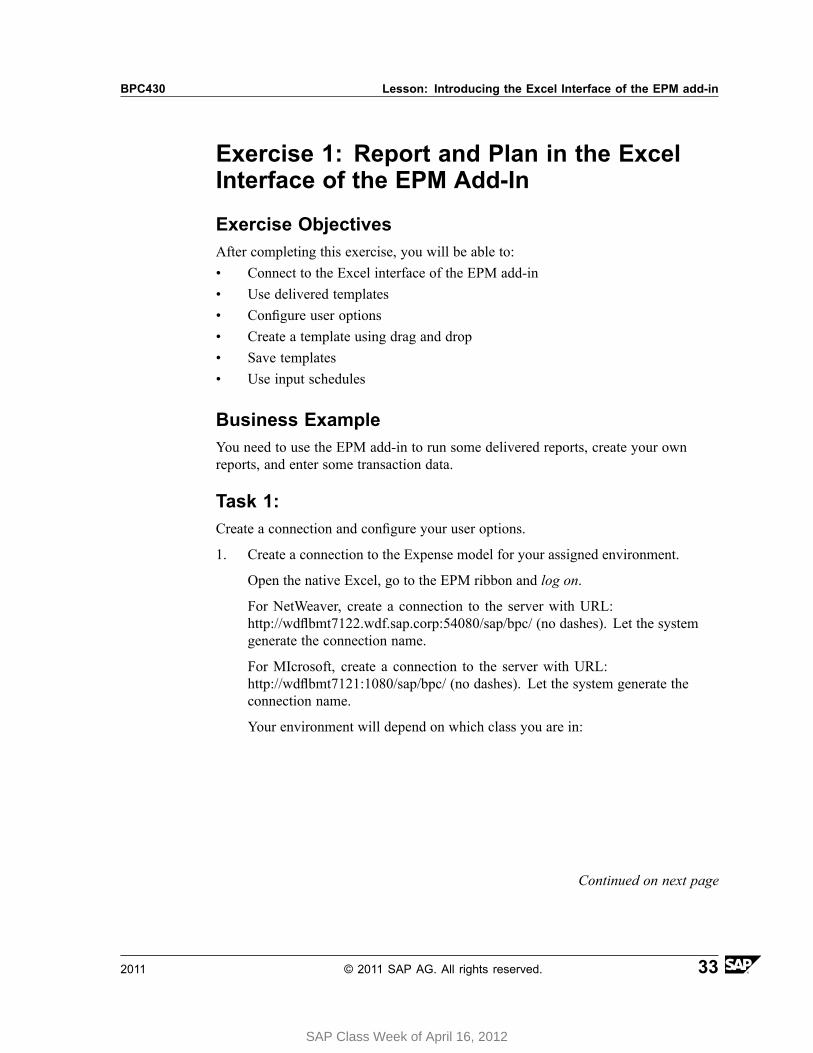
Exercise 1: Report and Plan in the ExcelInterface of the EPM Add-In
Exercise ObjectivesAfter completing this exercise, you will be able to:• Connect to the Excel interface of the EPM add-in• Use delivered templates• Configure user options• Create a template using drag and drop• Save templates• Use input schedules
Business ExampleYou need to use the EPM add-in to run some delivered reports, create your ownreports, and enter some transaction data.
Task 1:Create a connection and configure your user options.
1. Create a connection to the Expense model for your assigned environment.
Open the native Excel, go to the EPM ribbon and log on.
For NetWeaver, create a connection to the server with URL:http://wdflbmt7122.wdf.sap.corp:54080/sap/bpc/ (no dashes). Let the systemgenerate the connection name.
For MIcrosoft, create a connection to the server with URL:http://wdflbmt7121:1080/sap/bpc/ (no dashes). Let the system generate theconnection name.
Your environment will depend on which class you are in:
Continued on next page
2011 © 2011 SAP AG. All rights reserved. 33
SAP Class Week of April 16, 2012
Unit 1: SAP BusinessObjects Planning and Consolidation – Overview BPC430
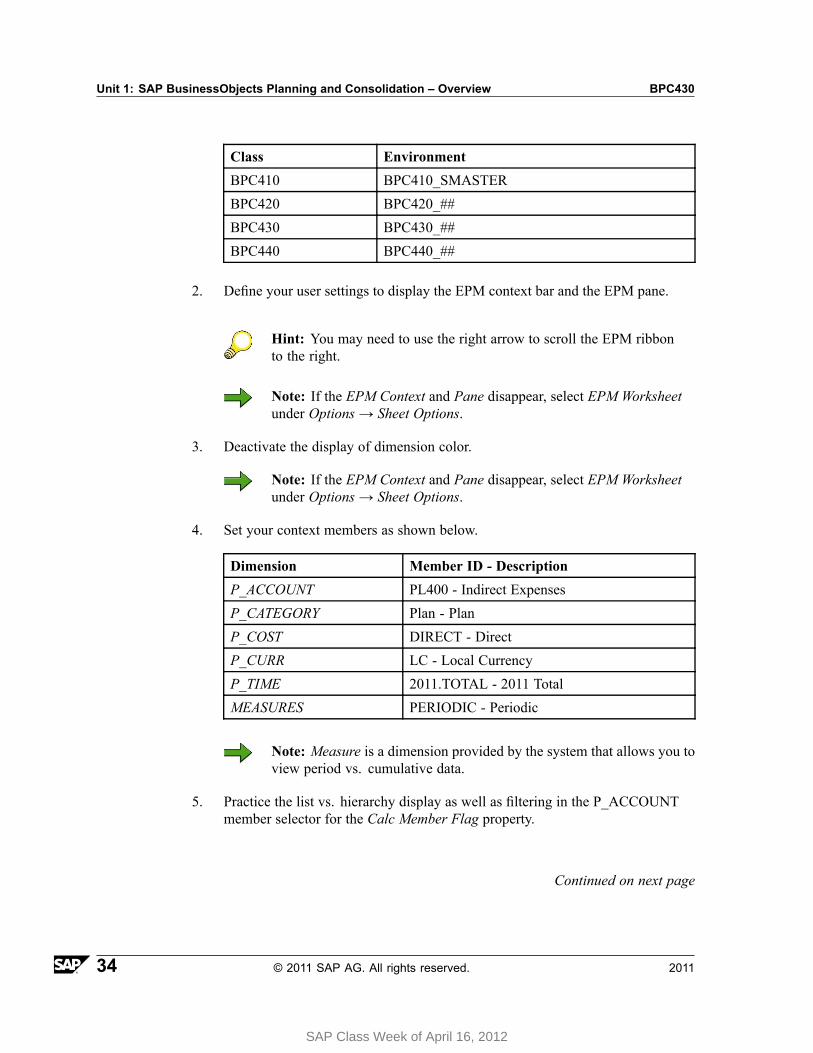
Class Environment
BPC410 BPC410_SMASTER
BPC420 BPC420_##
BPC430 BPC430_##
BPC440 BPC440_##
2. Define your user settings to display the EPM context bar and the EPM pane.
Hint: You may need to use the right arrow to scroll the EPM ribbonto the right.
Note: If the EPM Context and Pane disappear, select EPM Worksheetunder Options → Sheet Options.
3. Deactivate the display of dimension color.
Note: If the EPM Context and Pane disappear, select EPM Worksheetunder Options → Sheet Options.
4. Set your context members as shown below.
Dimension Member ID - Description
P_ACCOUNT PL400 - Indirect Expenses
P_CATEGORY Plan - Plan
P_COST DIRECT - Direct
P_CURR LC - Local Currency
P_TIME 2011.TOTAL - 2011 Total
MEASURES PERIODIC - Periodic
Note: Measure is a dimension provided by the system that allows you toview period vs. cumulative data.
5. Practice the list vs. hierarchy display as well as filtering in the P_ACCOUNTmember selector for the Calc Member Flag property.
Continued on next page
34 © 2011 SAP AG. All rights reserved. 2011
SAP Class Week of April 16, 2012

BPC430 Lesson: Introducing the Excel Interface of the EPM add-in
To Practice Do This
The List vs.Hierarchy display
Choose the down arrow next to the field and select List
Member Filteringby Properties 1. Select the filter icon to display members based on
their Calc Member Flag property.2. To deactivate the filter, choose the red X.
Task 2:Use a delivered template to analyze data, modify the context member selections, andpractice the drill down and back options to view the data at the level of detail you need.
1. Open the Dynamic Report with Nested Rows to view the data for indirectexpenses.
2. Drill down to the months for Q1. Then use the Back option in the Undo panel.
Hint: You may need to use the left arrow to scroll the EPM ribbon to theleft in the next step.
3. Swap the axis.
Task 3:Create a report via drag and drop, then save it to the company folder for later use.
1. In the Expense model, create a new workbook and use drag and drop to build areport with account by entity in the rows and time in the columns.
2. Define the P_ACCOUNT members as base members for the net income parent.
Hint: You may need to maximize your screen.
3. Hide the empty rows.
4. Restrict the time members to Base Level for 2011 and the entity members toMember and Children for the TOTAL ID.
5. Save the report as the Account by Entity Trend ## in the Company REPORTSfolder.
Continued on next page
2011 © 2011 SAP AG. All rights reserved. 35
SAP Class Week of April 16, 2012
Unit 1: SAP BusinessObjects Planning and Consolidation – Overview BPC430
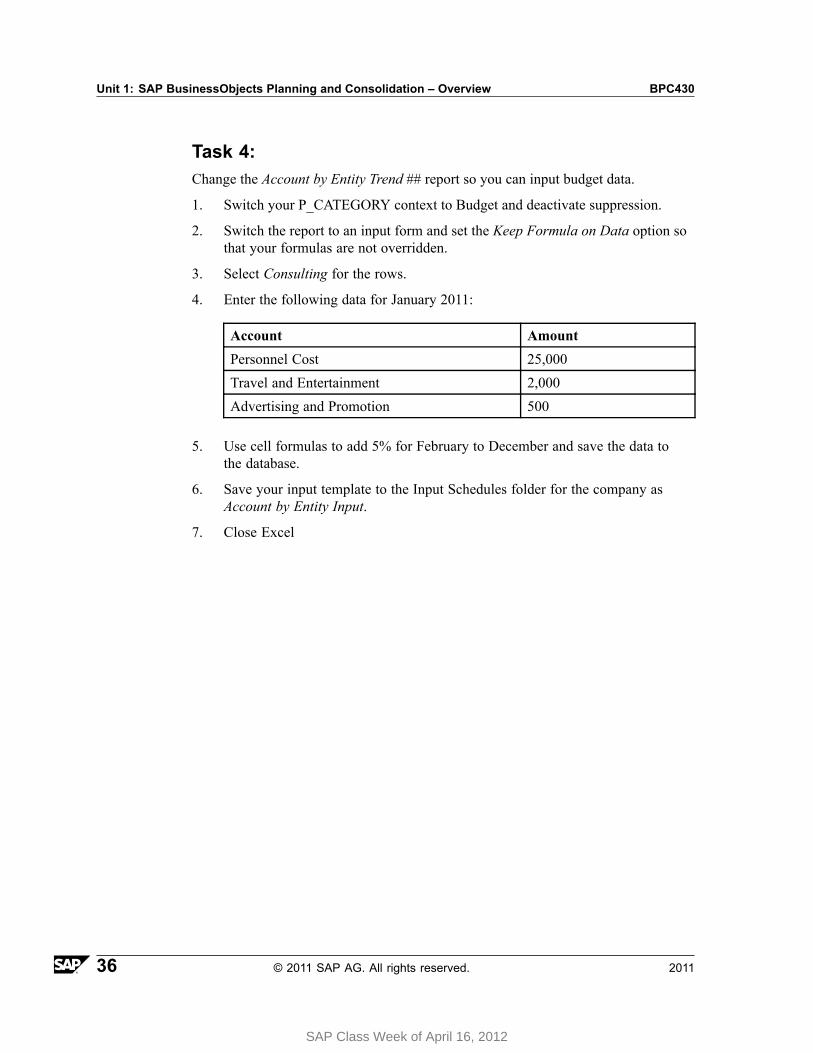
Task 4:Change the Account by Entity Trend ## report so you can input budget data.
1. Switch your P_CATEGORY context to Budget and deactivate suppression.
2. Switch the report to an input form and set the Keep Formula on Data option sothat your formulas are not overridden.
3. Select Consulting for the rows.
4. Enter the following data for January 2011:
Account Amount
Personnel Cost 25,000
Travel and Entertainment 2,000
Advertising and Promotion 500
5. Use cell formulas to add 5% for February to December and save the data tothe database.
6. Save your input template to the Input Schedules folder for the company asAccount by Entity Input.
7. Close Excel
36 © 2011 SAP AG. All rights reserved. 2011
SAP Class Week of April 16, 2012
BPC430 Lesson: Introducing the Excel Interface of the EPM add-in
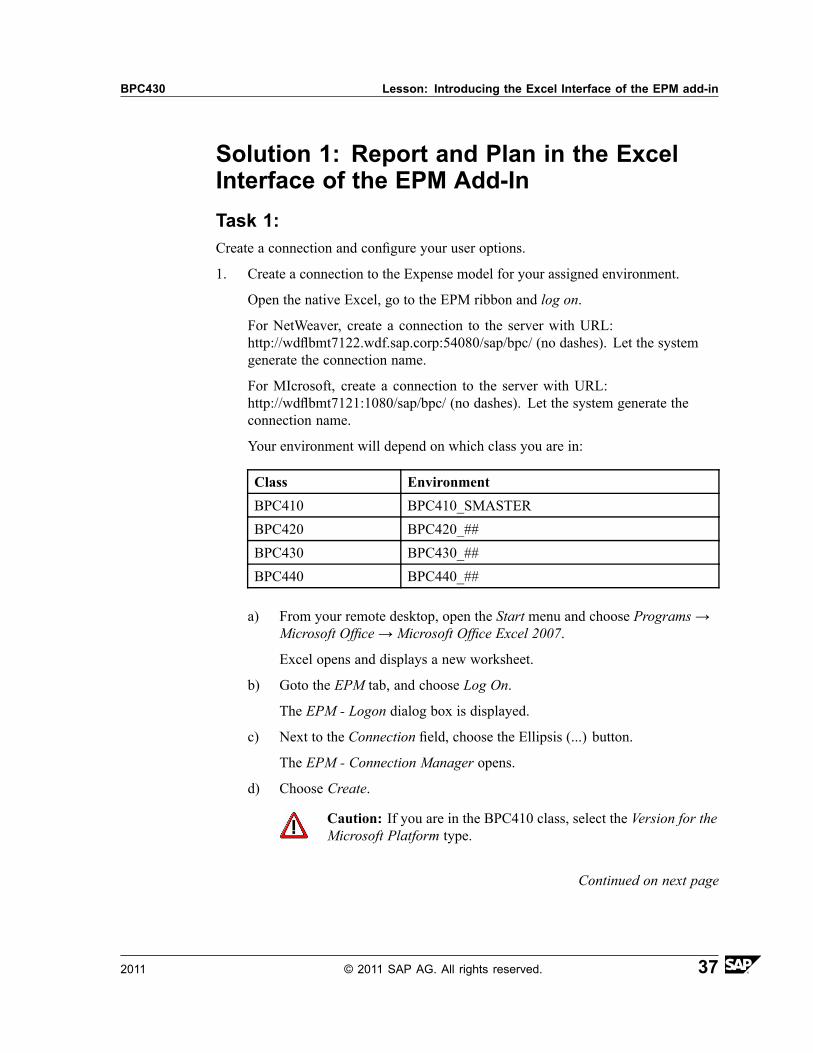
Solution 1: Report and Plan in the ExcelInterface of the EPM Add-InTask 1:Create a connection and configure your user options.
1. Create a connection to the Expense model for your assigned environment.
Open the native Excel, go to the EPM ribbon and log on.
For NetWeaver, create a connection to the server with URL:http://wdflbmt7122.wdf.sap.corp:54080/sap/bpc/ (no dashes). Let the systemgenerate the connection name.
For MIcrosoft, create a connection to the server with URL:http://wdflbmt7121:1080/sap/bpc/ (no dashes). Let the system generate theconnection name.
Your environment will depend on which class you are in:
Class Environment
BPC410 BPC410_SMASTER
BPC420 BPC420_##
BPC430 BPC430_##
BPC440 BPC440_##
a) From your remote desktop, open the Start menu and choose Programs →Microsoft Office → Microsoft Office Excel 2007.
Excel opens and displays a new worksheet.
b) Goto the EPM tab, and choose Log On.
The EPM - Logon dialog box is displayed.
c) Next to the Connection field, choose the Ellipsis (...) button.
The EPM - Connection Manager opens.
d) Choose Create.
Caution: If you are in the BPC410 class, select the Version for theMicrosoft Platform type.
Continued on next page
2011 © 2011 SAP AG. All rights reserved. 37
Unit 1: SAP BusinessObjects Planning and Consolidation – Overview BPC430
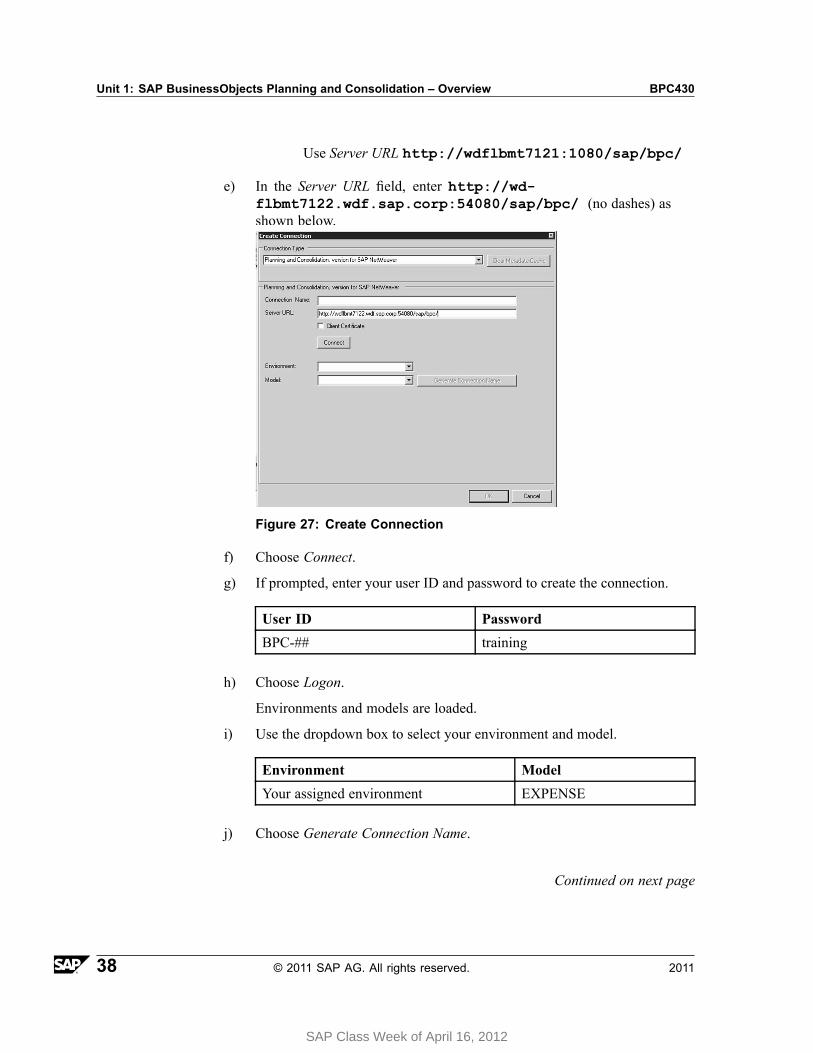
Use Server URL http://wdflbmt7121:1080/sap/bpc/
e) In the Server URL field, enter http://wd-flbmt7122.wdf.sap.corp:54080/sap/bpc/ (no dashes) asshown below.
Figure 27: Create Connection
f) Choose Connect.
g) If prompted, enter your user ID and password to create the connection.
User ID Password
BPC-## training
h) Choose Logon.
Environments and models are loaded.
i) Use the dropdown box to select your environment and model.
Environment Model
Your assigned environment EXPENSE
j) Choose Generate Connection Name.
Continued on next page
38 © 2011 SAP AG. All rights reserved. 2011
SAP Class Week of April 16, 2012
BPC430 Lesson: Introducing the Excel Interface of the EPM add-in
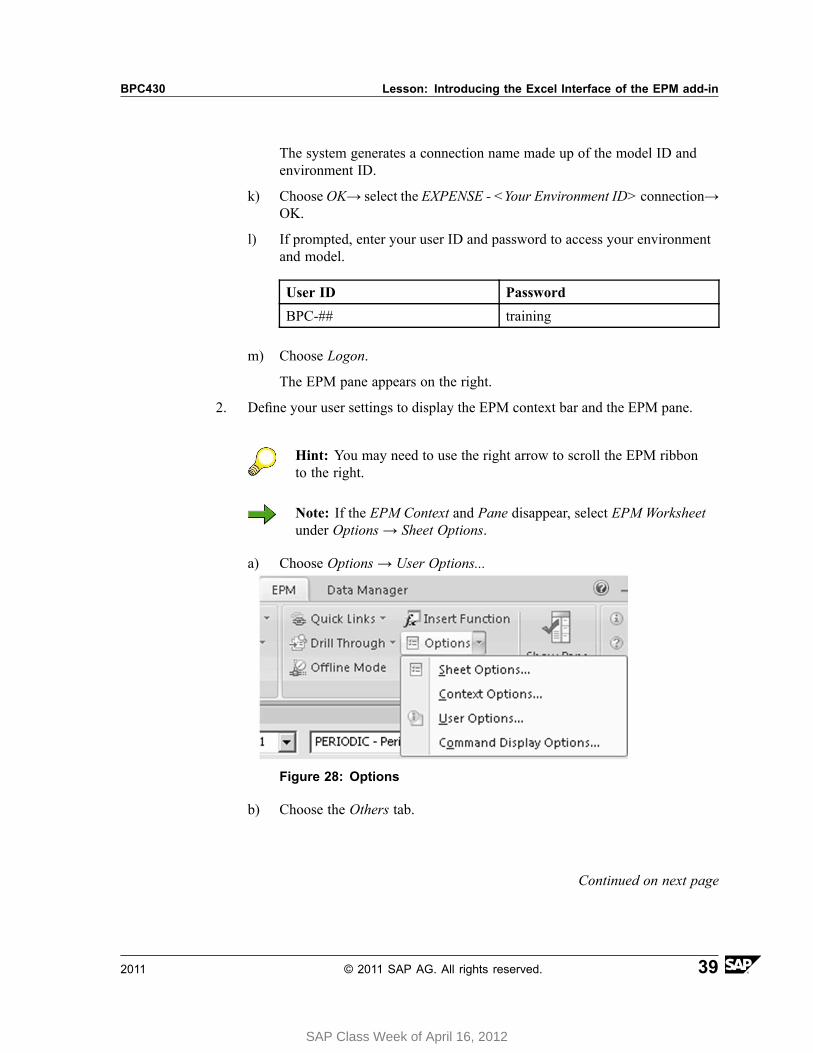
The system generates a connection name made up of the model ID andenvironment ID.
k) ChooseOK→ select the EXPENSE - <Your Environment ID> connection→OK.
l) If prompted, enter your user ID and password to access your environmentand model.
User ID Password
BPC-## training
m) Choose Logon.
The EPM pane appears on the right.
2. Define your user settings to display the EPM context bar and the EPM pane.
Hint: You may need to use the right arrow to scroll the EPM ribbonto the right.
Note: If the EPM Context and Pane disappear, select EPM Worksheetunder Options → Sheet Options.
a) Choose Options → User Options...
Figure 28: Options
b) Choose the Others tab.
Continued on next page
2011 © 2011 SAP AG. All rights reserved. 39
SAP Class Week of April 16, 2012
Unit 1: SAP BusinessObjects Planning and Consolidation – Overview BPC430
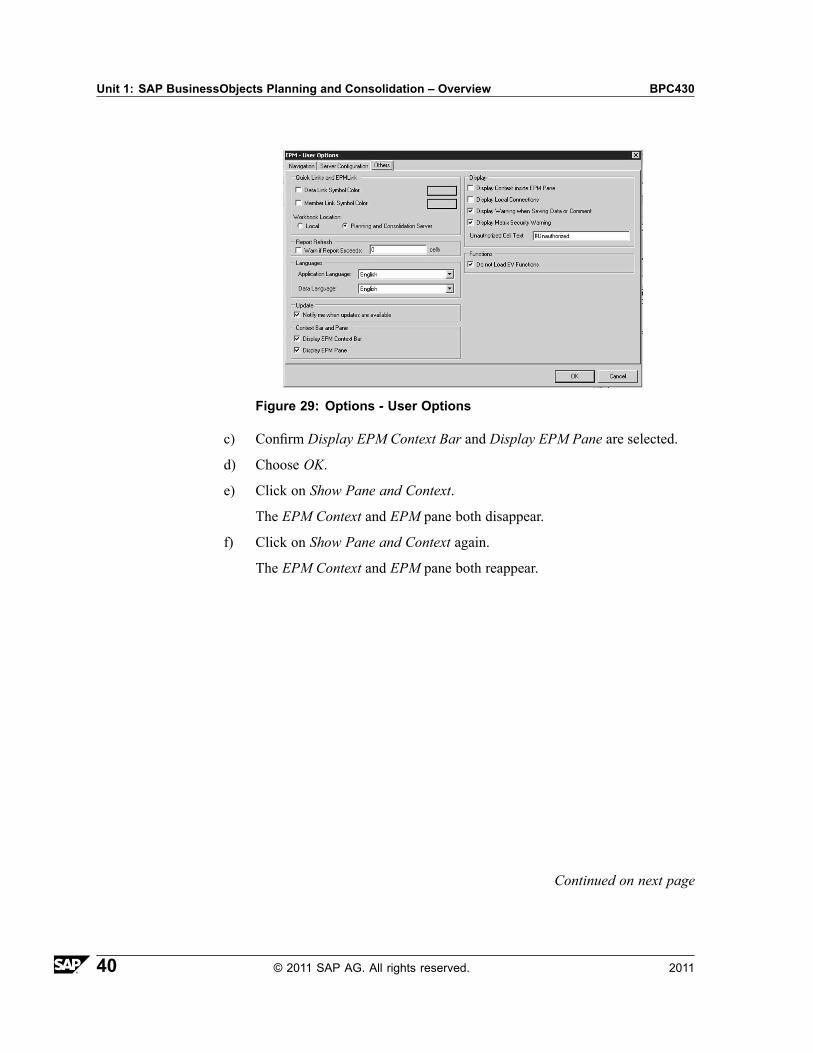
Figure 29: Options - User Options
c) Confirm Display EPM Context Bar and Display EPM Pane are selected.
d) Choose OK.
e) Click on Show Pane and Context.
The EPM Context and EPM pane both disappear.
f) Click on Show Pane and Context again.
The EPM Context and EPM pane both reappear.
Continued on next page
40 © 2011 SAP AG. All rights reserved. 2011
BPC430 Lesson: Introducing the Excel Interface of the EPM add-in
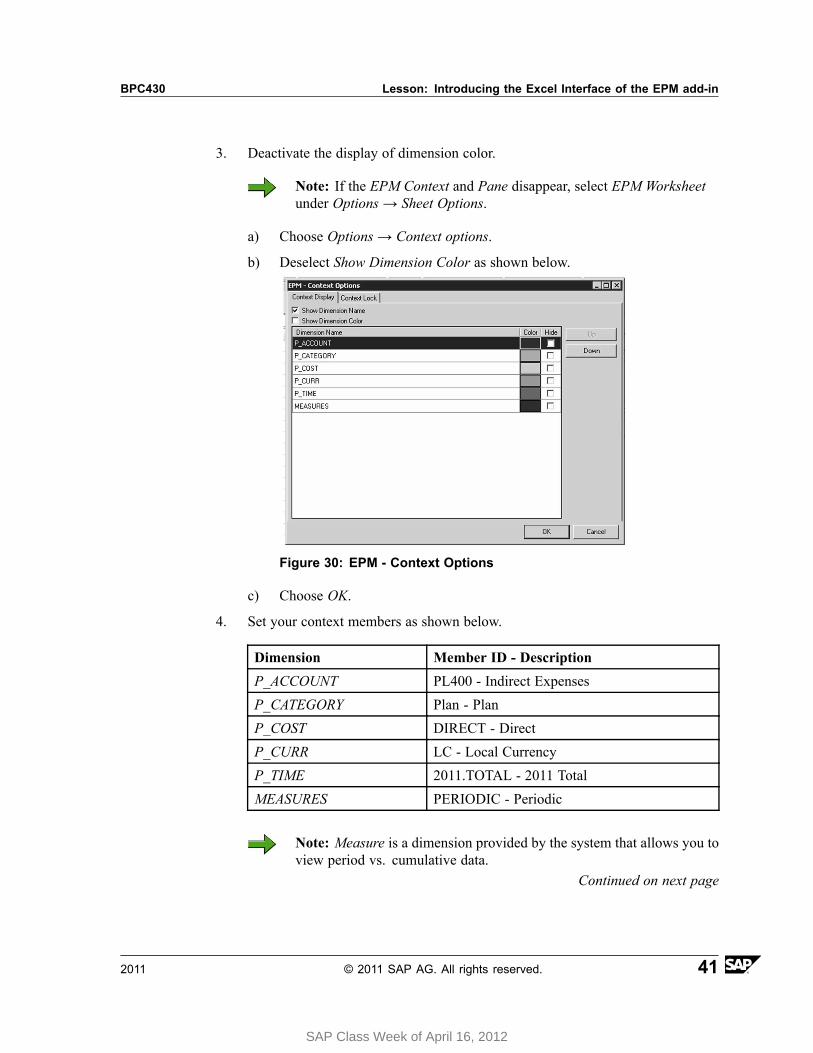
3. Deactivate the display of dimension color.
Note: If the EPM Context and Pane disappear, select EPM Worksheetunder Options → Sheet Options.
a) Choose Options → Context options.
b) Deselect Show Dimension Color as shown below.
Figure 30: EPM - Context Options
c) Choose OK.
4. Set your context members as shown below.
Dimension Member ID - Description
P_ACCOUNT PL400 - Indirect Expenses
P_CATEGORY Plan - Plan
P_COST DIRECT - Direct
P_CURR LC - Local Currency
P_TIME 2011.TOTAL - 2011 Total
MEASURES PERIODIC - Periodic
Note: Measure is a dimension provided by the system that allows you toview period vs. cumulative data.
Continued on next page
2011 © 2011 SAP AG. All rights reserved. 41
SAP Class Week of April 16, 2012

Unit 1: SAP BusinessObjects Planning and Consolidation – Overview BPC430
a) Click in the EPM Context field for P_ACCOUNT, and choose Select OtherMembers... from the dropdown list.
The EPM - Member Selector opens.
b) Under Select member names to display (blue box to the left of thedropdown), select Description from the dropdown list.
Hint: You may need to maximize your screen to see the OK buttonin the next step.
Figure 31: EPM - Member Selector
c) Expand Net Income and Operating Income → Select Indirect Expenses→ Choose OK.
Your P_ACCOUNT context is now set to Indirect Expenses.
d) Use the same method to select your remaining context members as shownbelow.
Continued on next page
42 © 2011 SAP AG. All rights reserved. 2011
SAP Class Week of April 16, 2012
BPC430 Lesson: Introducing the Excel Interface of the EPM add-in
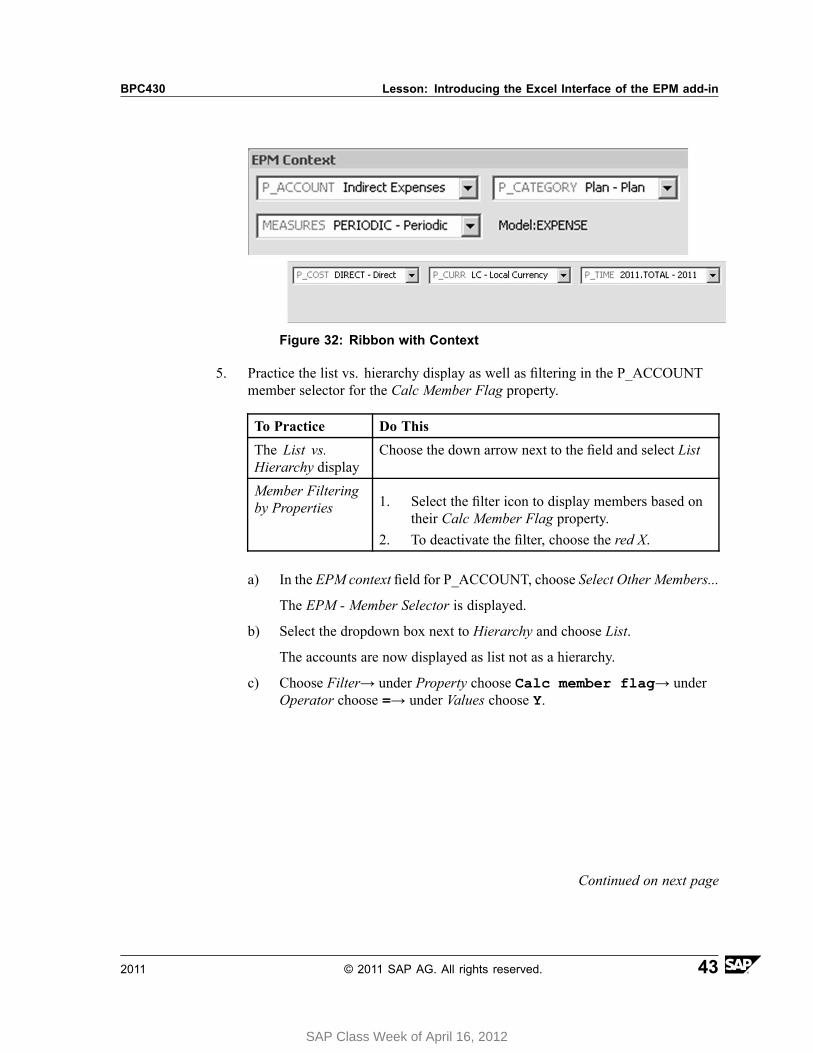
Figure 32: Ribbon with Context
5. Practice the list vs. hierarchy display as well as filtering in the P_ACCOUNTmember selector for the Calc Member Flag property.
To Practice Do This
The List vs.Hierarchy display
Choose the down arrow next to the field and select List
Member Filteringby Properties 1. Select the filter icon to display members based on
their Calc Member Flag property.2. To deactivate the filter, choose the red X.
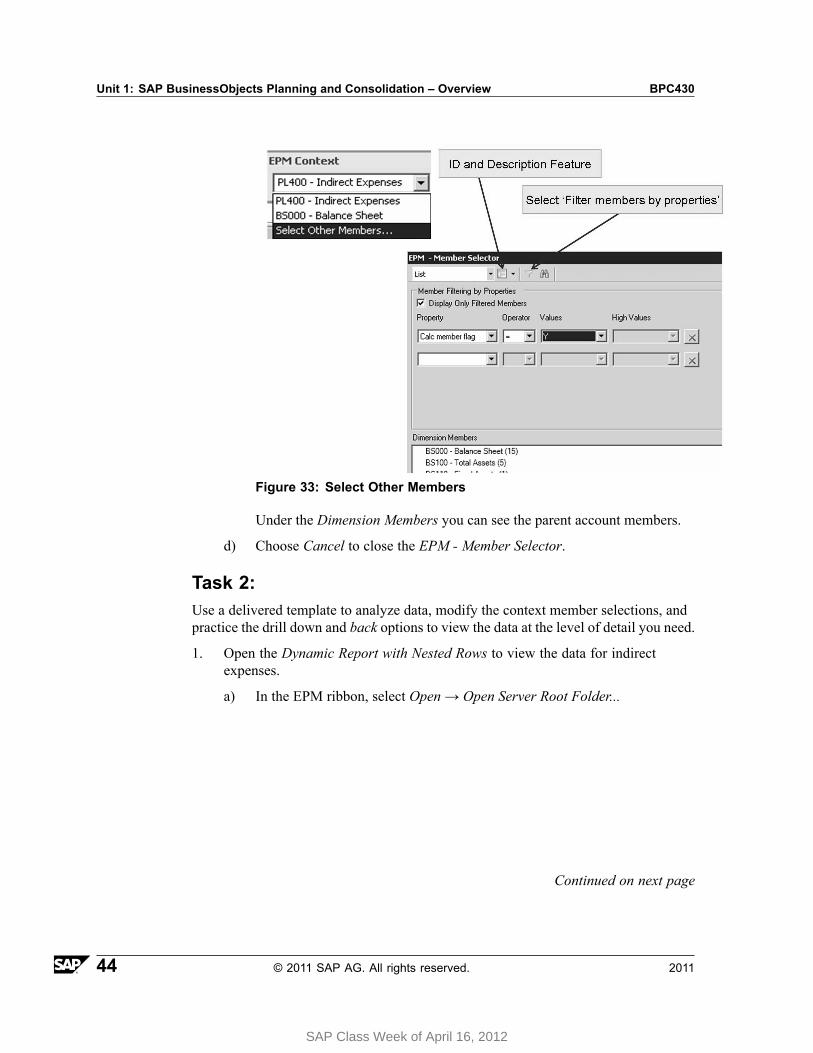
a) In the EPM context field for P_ACCOUNT, choose Select Other Members...
The EPM - Member Selector is displayed.
b) Select the dropdown box next to Hierarchy and choose List.
The accounts are now displayed as list not as a hierarchy.
c) Choose Filter→ under Property choose Calc member flag→ underOperator choose =→ under Values choose Y.
Continued on next page
2011 © 2011 SAP AG. All rights reserved. 43
SAP Class Week of April 16, 2012
Unit 1: SAP BusinessObjects Planning and Consolidation – Overview BPC430
Figure 33: Select Other Members
Under the Dimension Members you can see the parent account members.
d) Choose Cancel to close the EPM - Member Selector.
Task 2:Use a delivered template to analyze data, modify the context member selections, andpractice the drill down and back options to view the data at the level of detail you need.
1. Open the Dynamic Report with Nested Rows to view the data for indirectexpenses.
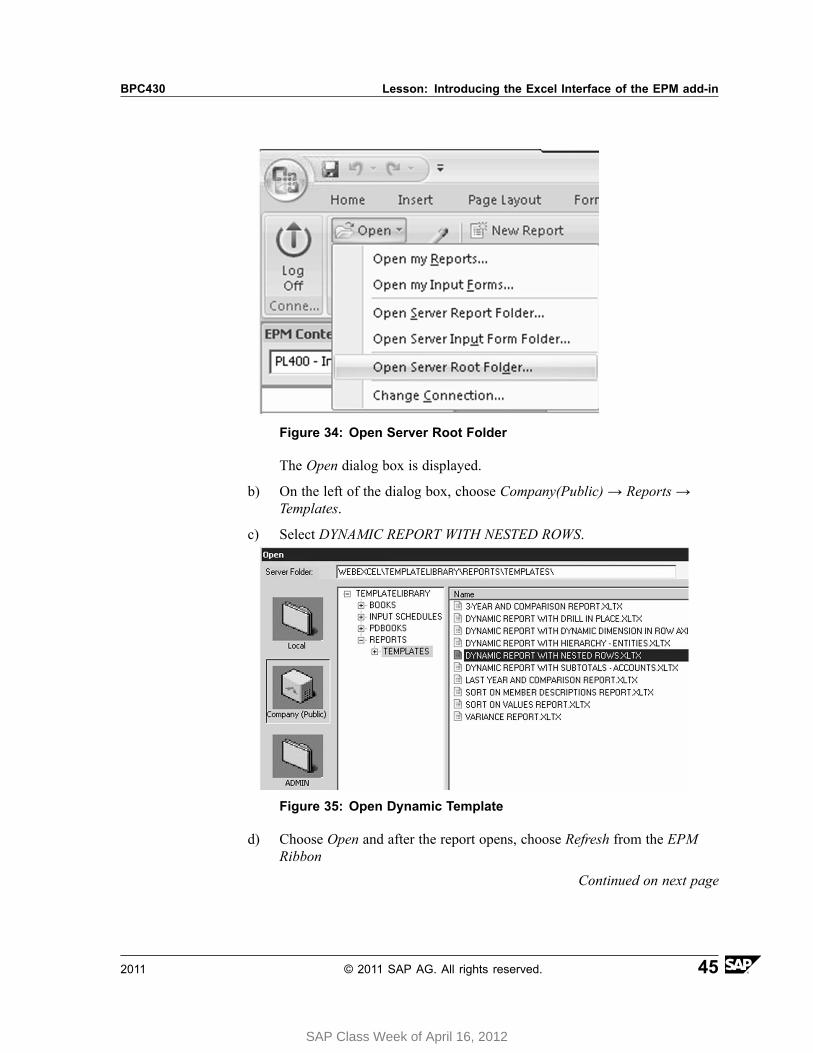
a) In the EPM ribbon, select Open → Open Server Root Folder...
Continued on next page
44 © 2011 SAP AG. All rights reserved. 2011
SAP Class Week of April 16, 2012
BPC430 Lesson: Introducing the Excel Interface of the EPM add-in
Figure 34: Open Server Root Folder
The Open dialog box is displayed.
b) On the left of the dialog box, choose Company(Public) → Reports →Templates.
c) Select DYNAMIC REPORT WITH NESTED ROWS.
Figure 35: Open Dynamic Template
d) Choose Open and after the report opens, choose Refresh from the EPMRibbon
Continued on next page
2011 © 2011 SAP AG. All rights reserved. 45
SAP Class Week of April 16, 2012
Unit 1: SAP BusinessObjects Planning and Consolidation – Overview BPC430
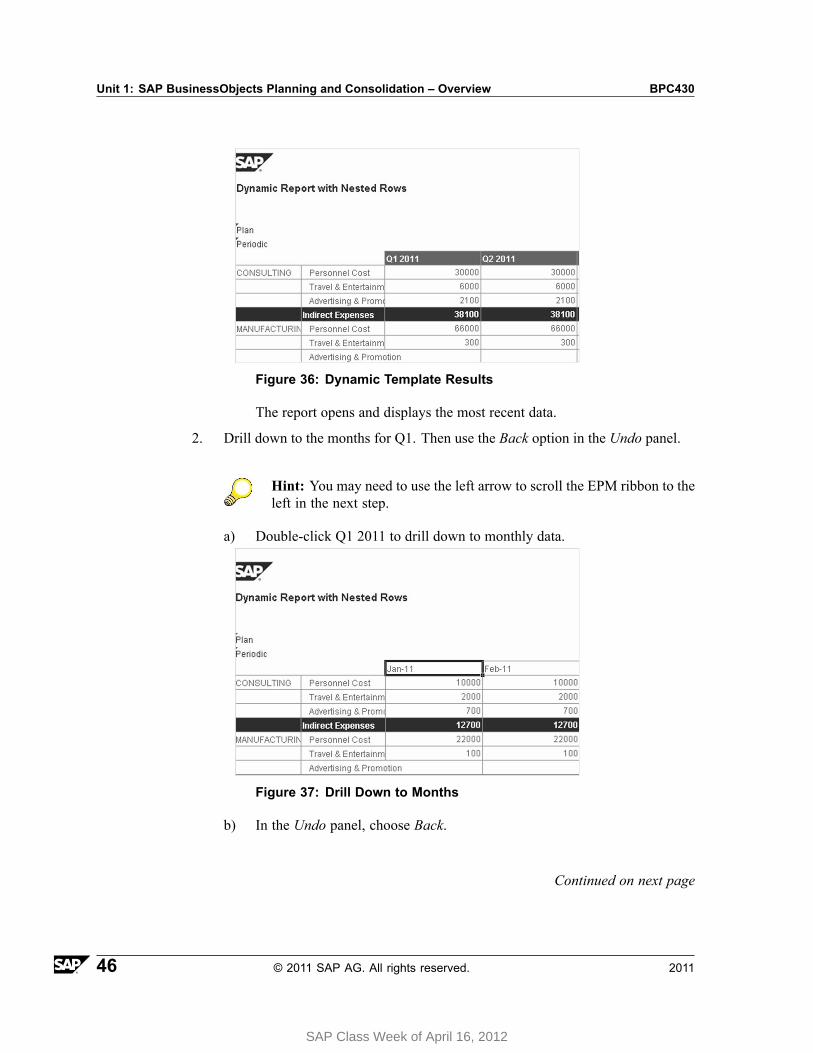
Figure 36: Dynamic Template Results
The report opens and displays the most recent data.
2. Drill down to the months for Q1. Then use the Back option in the Undo panel.
Hint: You may need to use the left arrow to scroll the EPM ribbon to theleft in the next step.
a) Double-click Q1 2011 to drill down to monthly data.
Figure 37: Drill Down to Months
b) In the Undo panel, choose Back.
Continued on next page
46 © 2011 SAP AG. All rights reserved. 2011
SAP Class Week of April 16, 2012
BPC430 Lesson: Introducing the Excel Interface of the EPM add-in
3. Swap the axis.
a) On the lower right, next to Column Axis, select Switch Axis.
Now time is in the rows and accounts are in the columns.
b) Choose Back.
Task 3:Create a report via drag and drop, then save it to the company folder for later use.
1. In the Expense model, create a new workbook and use drag and drop to build areport with account by entity in the rows and time in the columns.
a) Choose the Office Button → New.
The Template dialog box opens.
b) Choose Create or OK.
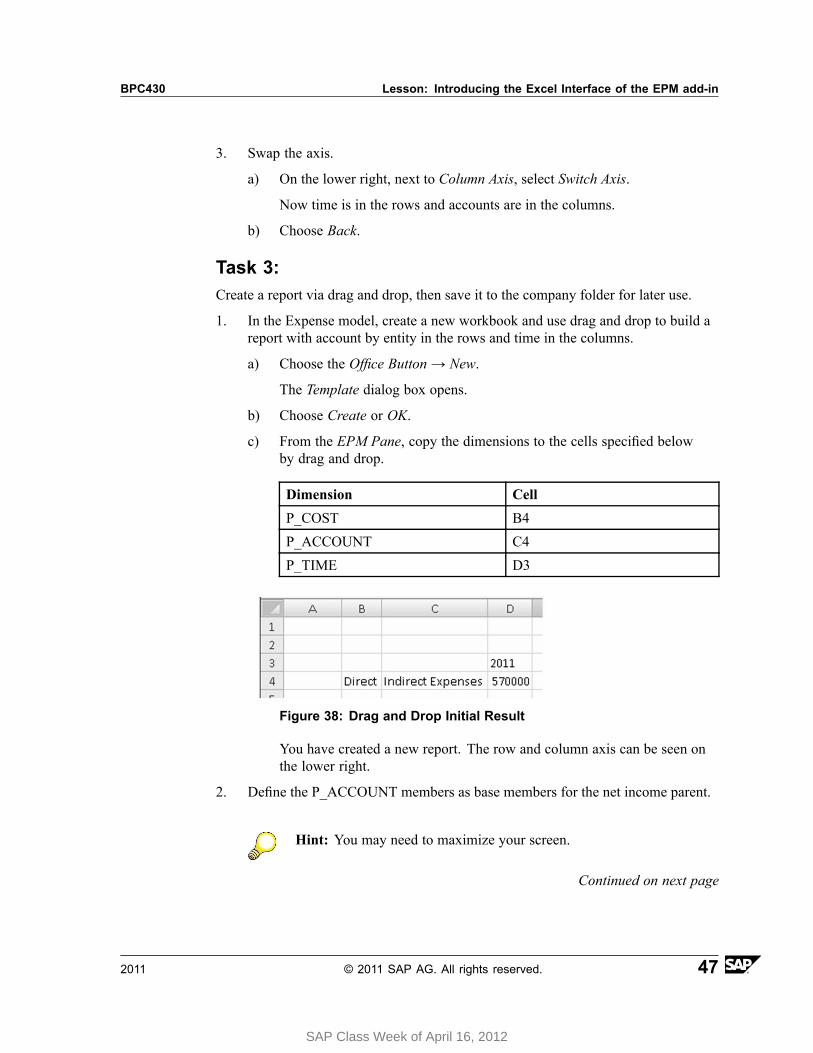
c) From the EPM Pane, copy the dimensions to the cells specified belowby drag and drop.
Dimension Cell
P_COST B4
P_ACCOUNT C4
P_TIME D3
Figure 38: Drag and Drop Initial Result
You have created a new report. The row and column axis can be seen onthe lower right.
2. Define the P_ACCOUNT members as base members for the net income parent.
Hint: You may need to maximize your screen.
Continued on next page
2011 © 2011 SAP AG. All rights reserved. 47
SAP Class Week of April 16, 2012
Unit 1: SAP BusinessObjects Planning and Consolidation – Overview BPC430
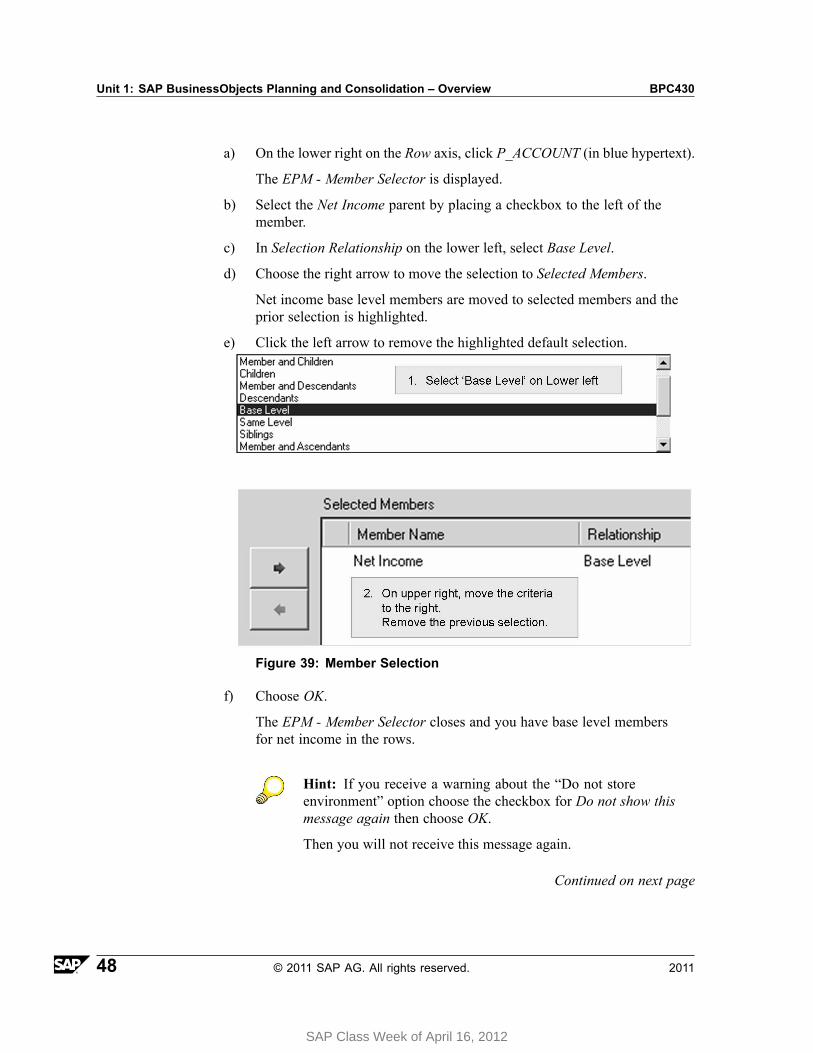
a) On the lower right on the Row axis, click P_ACCOUNT (in blue hypertext).
The EPM - Member Selector is displayed.
b) Select the Net Income parent by placing a checkbox to the left of themember.
c) In Selection Relationship on the lower left, select Base Level.
d) Choose the right arrow to move the selection to Selected Members.
Net income base level members are moved to selected members and theprior selection is highlighted.
e) Click the left arrow to remove the highlighted default selection.
Figure 39: Member Selection
f) Choose OK.
The EPM - Member Selector closes and you have base level membersfor net income in the rows.
Hint: If you receive a warning about the “Do not storeenvironment” option choose the checkbox for Do not show thismessage again then choose OK.
Then you will not receive this message again.
Continued on next page
48 © 2011 SAP AG. All rights reserved. 2011
SAP Class Week of April 16, 2012

BPC430 Lesson: Introducing the Excel Interface of the EPM add-in
This option allows you to save a report without storing theconnection with the report so you will be able to use this reportwith other connections for Models with the same Dimensions.
Continued on next page
2011 © 2011 SAP AG. All rights reserved. 49
SAP Class Week of April 16, 2012
Unit 1: SAP BusinessObjects Planning and Consolidation – Overview BPC430
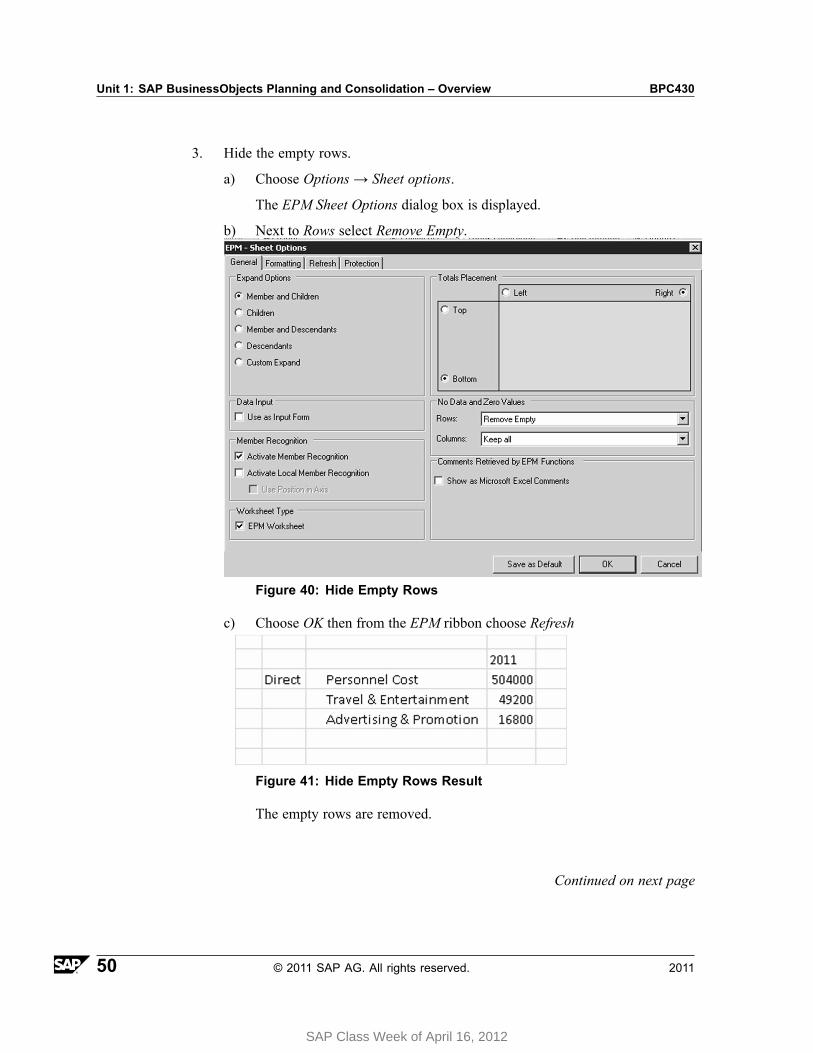
3. Hide the empty rows.
a) Choose Options → Sheet options.
The EPM Sheet Options dialog box is displayed.
b) Next to Rows select Remove Empty.
Figure 40: Hide Empty Rows
c) Choose OK then from the EPM ribbon choose Refresh
Figure 41: Hide Empty Rows Result
The empty rows are removed.
Continued on next page
50 © 2011 SAP AG. All rights reserved. 2011
SAP Class Week of April 16, 2012
BPC430 Lesson: Introducing the Excel Interface of the EPM add-in
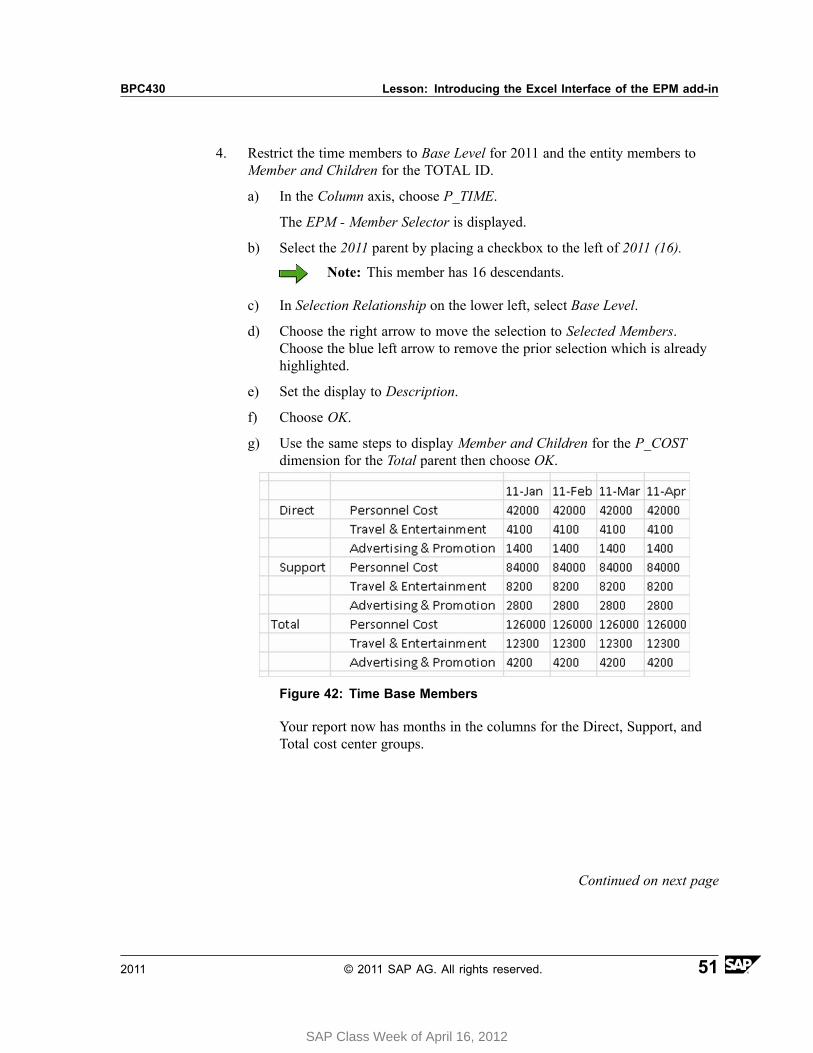
4. Restrict the time members to Base Level for 2011 and the entity members toMember and Children for the TOTAL ID.
a) In the Column axis, choose P_TIME.
The EPM - Member Selector is displayed.
b) Select the 2011 parent by placing a checkbox to the left of 2011 (16).
Note: This member has 16 descendants.
c) In Selection Relationship on the lower left, select Base Level.
d) Choose the right arrow to move the selection to Selected Members.Choose the blue left arrow to remove the prior selection which is alreadyhighlighted.
e) Set the display to Description.
f) Choose OK.
g) Use the same steps to display Member and Children for the P_COSTdimension for the Total parent then choose OK.
Figure 42: Time Base Members
Your report now has months in the columns for the Direct, Support, andTotal cost center groups.
Continued on next page
2011 © 2011 SAP AG. All rights reserved. 51
SAP Class Week of April 16, 2012
Unit 1: SAP BusinessObjects Planning and Consolidation – Overview BPC430
5. Save the report as the Account by Entity Trend ## in the Company REPORTSfolder.
a) In the EPM menu, choose Save → Save to Server Root Folder.
The Save dialog box is displayed.
b) Choose Company (Public) → REPORTS.
In the File Name field, enter Account by Entity Trend ##.
c) Choose Save.
Task 4:Change the Account by Entity Trend ## report so you can input budget data.
1. Switch your P_CATEGORY context to Budget and deactivate suppression.
a) In the EPM Context for P_CATEGORY, left click Plan → Select OtherMembers.
b) Select Budget → OK.
c) Choose Options → Sheet options.
d) Next to Rows select Keep All → OK.
e) Choose Refresh.
The report should display blank rows since no budget data exists.
Continued on next page
52 © 2011 SAP AG. All rights reserved. 2011
SAP Class Week of April 16, 2012
BPC430 Lesson: Introducing the Excel Interface of the EPM add-in
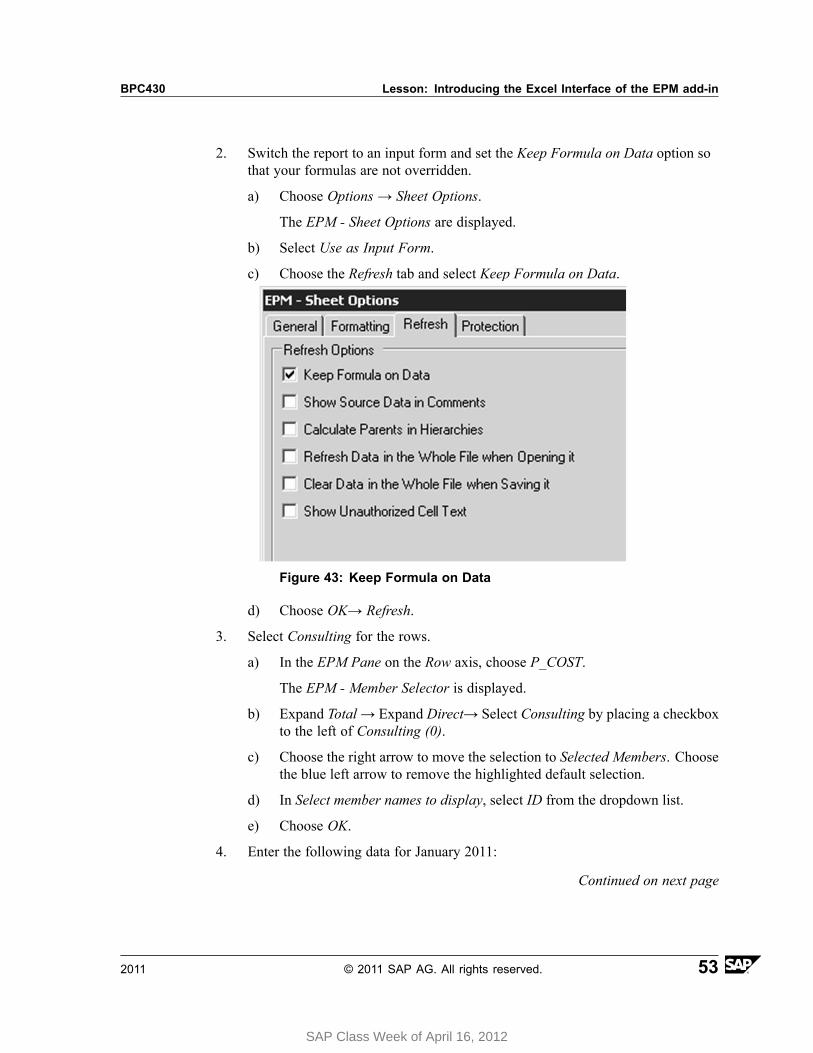
2. Switch the report to an input form and set the Keep Formula on Data option sothat your formulas are not overridden.
a) Choose Options → Sheet Options.
The EPM - Sheet Options are displayed.
b) Select Use as Input Form.
c) Choose the Refresh tab and select Keep Formula on Data.
Figure 43: Keep Formula on Data
d) Choose OK→ Refresh.
3. Select Consulting for the rows.
a) In the EPM Pane on the Row axis, choose P_COST.
The EPM - Member Selector is displayed.
b) Expand Total → Expand Direct→ Select Consulting by placing a checkboxto the left of Consulting (0).
c) Choose the right arrow to move the selection to Selected Members. Choosethe blue left arrow to remove the highlighted default selection.
d) In Select member names to display, select ID from the dropdown list.
e) Choose OK.
4. Enter the following data for January 2011:
Continued on next page
2011 © 2011 SAP AG. All rights reserved. 53
SAP Class Week of April 16, 2012
Unit 1: SAP BusinessObjects Planning and Consolidation – Overview BPC430
Account Amount
Personnel Cost 25,000
Travel and Entertainment 2,000
Advertising and Promotion 500
a) Enter the values as shown above.
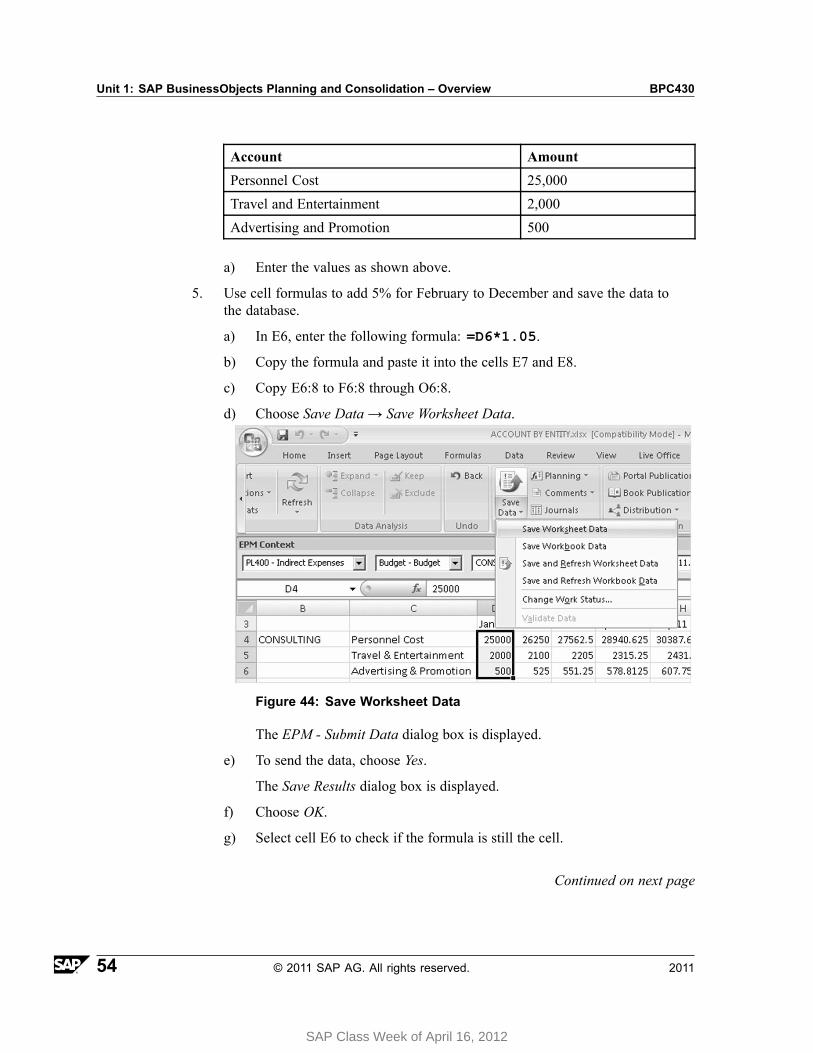
5. Use cell formulas to add 5% for February to December and save the data tothe database.
a) In E6, enter the following formula: =D6*1.05.
b) Copy the formula and paste it into the cells E7 and E8.
c) Copy E6:8 to F6:8 through O6:8.
d) Choose Save Data → Save Worksheet Data.
Figure 44: Save Worksheet Data
The EPM - Submit Data dialog box is displayed.
e) To send the data, choose Yes.
The Save Results dialog box is displayed.
f) Choose OK.
g) Select cell E6 to check if the formula is still the cell.
Continued on next page
54 © 2011 SAP AG. All rights reserved. 2011
SAP Class Week of April 16, 2012

BPC430 Lesson: Introducing the Excel Interface of the EPM add-in
6. Save your input template to the Input Schedules folder for the company asAccount by Entity Input.
a) In the EPM ribbon, choose Save → Save to Server Root Folder.
The Save dialog box appears.
b) Choose Company (Public) → Input Schedules.
c) In the File Name field, enter Account by Entity Input ##.
d) Choose Save.
7. Close Excel
a) Choose the Office button → Exit Excel
b) Do not save any workbooks.
2011 © 2011 SAP AG. All rights reserved. 55
SAP Class Week of April 16, 2012
Unit 1: SAP BusinessObjects Planning and Consolidation – Overview BPC430
Lesson Summary
You should now be able to:• Create an EPM add-in connection• Describe the features of the EPM add-in ribbon• Define default values for dimensions with the EPM Context Bar• Build a simple report
56 © 2011 SAP AG. All rights reserved. 2011
SAP Class Week of April 16, 2012
BPC430 Lesson: Implementing SAP BusinessObjects Planning and Consolidation
Lesson: Implementing SAP BusinessObjects Planning andConsolidation
Lesson OverviewIn this lesson, you will learn about implementing SAP BusinessObjects Planningand Consolidation.
Lesson ObjectivesAfter completing this lesson, you will be able to:
• Discuss the implementation process• Describe general business requirements for the planning and consolidation
application
Business ExampleYour company or your client has purchased SAP BusinessObjects Planning andConsolidation, so you need to learn how to implement it.
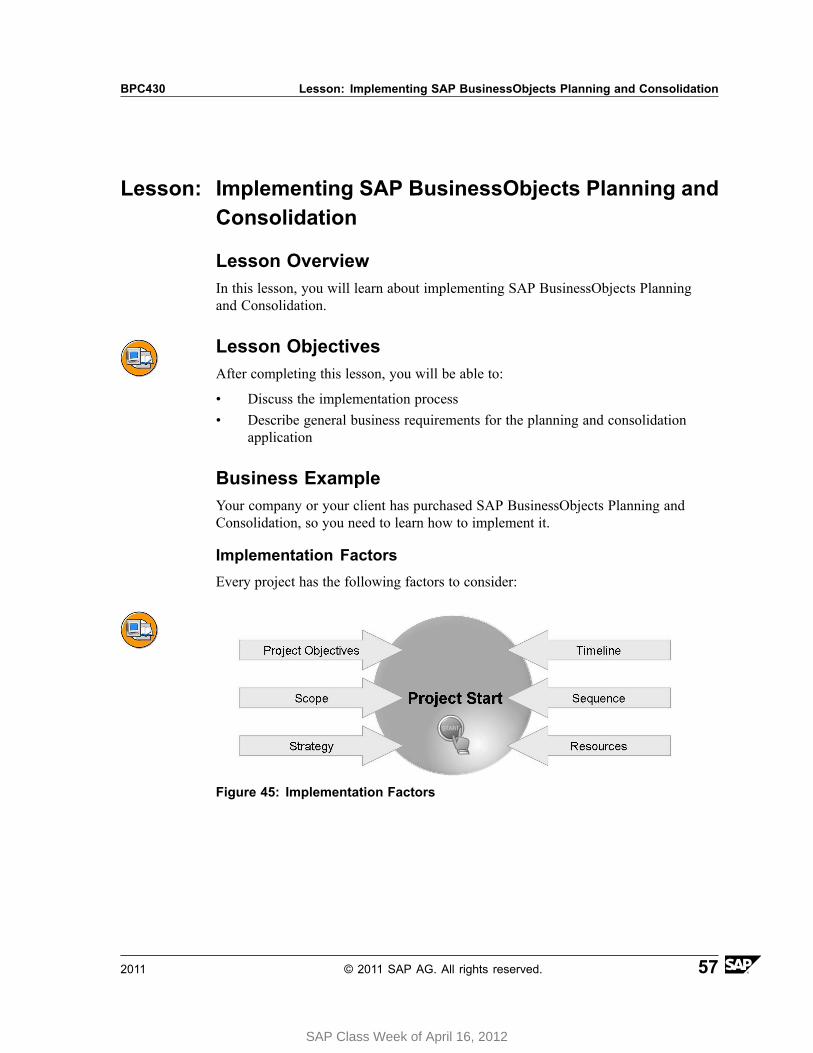
Implementation FactorsEvery project has the following factors to consider:
Figure 45: Implementation Factors
2011 © 2011 SAP AG. All rights reserved. 57
SAP Class Week of April 16, 2012

Unit 1: SAP BusinessObjects Planning and Consolidation – Overview BPC430
The Most Important Success Factors for BPC Implementations:
• Product expertise.• A structured project delivery using best practices
– Method Based Scoping (ASAP 7.1 BPC Add-on).– Blueprinting– Project Quality Assurance
Note: ASAP Methodology for Implementation 7.1 has the add-on for BPC.
Performance is a very important component in a project and it should be addressedright from the beginning of the project.
Pushing the performance topic to the end of a project will, in most cases, cause delaysin the project.
Possible Reasons for Performance Issues:
• Lack of data in the development system (reports were built on completely emptyapplications), so the performance of the reports could not be assessed up front(some dummy data should be generated in the development system)
• Lack of stress testing activities in the project plan, in a system with large numberof concurrent users
• Design errors: An application, calculation, or report was designed in a waythat they could not be high-performing
Factors to consider
Factor Example
Project Objectives Define the project objectives. For example,implement cost center planning.
Scope Determine the scope of the implementation. Forexample, the scope may only be for North Americaand Europe.
Strategy Define the project strategy. For example, performmost cost center planning using Planning andConsolidation.
58 © 2011 SAP AG. All rights reserved. 2011
SAP Class Week of April 16, 2012
BPC430 Lesson: Implementing SAP BusinessObjects Planning and Consolidation
Timeline Define both the timeline for the entire project andthe implementation sequence.
Sequence Determine the sequence of events from a projectplanning perspective.
Resources Identify the internal project team members andconsultants required.
The Roadmap to Success
SAP and its partners have implementation methodologies that are used to standardizethe process.
The roadmap includes the key steps in the process of implementing a solution.
1. SAP BI Strategic Decision: For the planning and consolidation application, youmay need to decide whether to use an existing BW server or install a standaloneserver, for example.
2. Pilot Project: A pilot phase may be beneficial to help determine your “to-be”solution.
3. Project: Once your “to-be” solution has been determined, you proceed with theimplementation.
The Implementation Roadmap forms the methodical framework for the steps that yourequire to implement SAP BusinessObjects Planning and Consolidation. It includesthe necessary project management, the configuration for the business processes, aswell as the technical features, the test procedure, and the training concepts.
The methodology of the Implementation Roadmap supports the inclusion of thoserequirements that are used as the basis for installing the application.
2011 © 2011 SAP AG. All rights reserved. 59
SAP Class Week of April 16, 2012
Unit 1: SAP BusinessObjects Planning and Consolidation – Overview BPC430
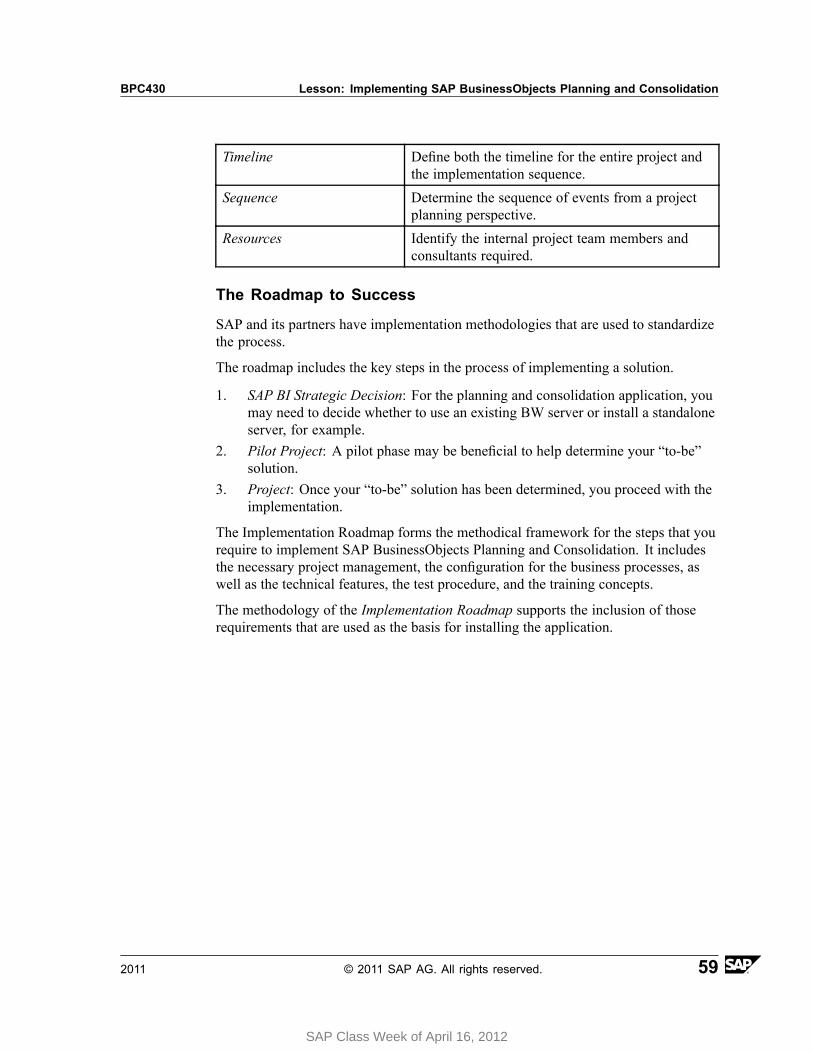
Figure 46: The Roadmap to Success
• Project Preparation - initial project planning, project procedures, landscapestrategy
• Business Blueprint - project planning, architecture• Realization - configure the initial solution• Final Preparation - test the solution, conduct training• Go Live and Support - cut over to the new system, follow up on possible go
live issues
Below, you can see the recommended resources by phase.
60 © 2011 SAP AG. All rights reserved. 2011
SAP Class Week of April 16, 2012
BPC430 Lesson: Implementing SAP BusinessObjects Planning and Consolidation
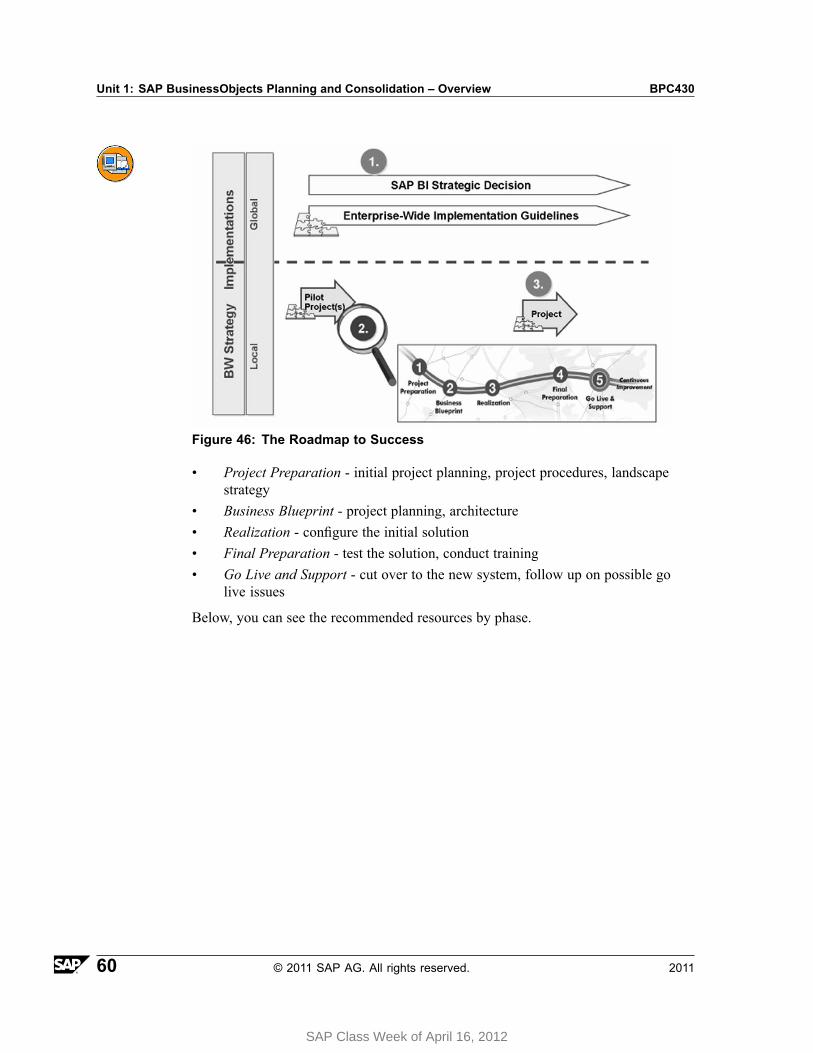
Figure 47: Method-Based Role Allocation
BPC is a very versatile tool and can be used to cover many different businessprocesses. A BPC Business Blueprint document can therefore look quite different,depending on the type of project and on the client as well. Due to the nature of BPC,there is not a single template that will fit all requirements.
The blueprinting activity is a key activity in any BPC project. It is important not tounderestimate the time required for this task (at least 20 to 30 percent of the total timeof the project – depends on the availability of documented requirements).
Prototyping is key for early user involvement and to prove designs. It reduces changemanagement efforts during Go-Live Preparation (lean implementation model)
Business requirements lie at the center of the project. The scope of your initiativemust be driven by business requirements. A key ingredient is to gather accuraterequirements in the information gathering process.
2011 © 2011 SAP AG. All rights reserved. 61
SAP Class Week of April 16, 2012
Unit 1: SAP BusinessObjects Planning and Consolidation – Overview BPC430
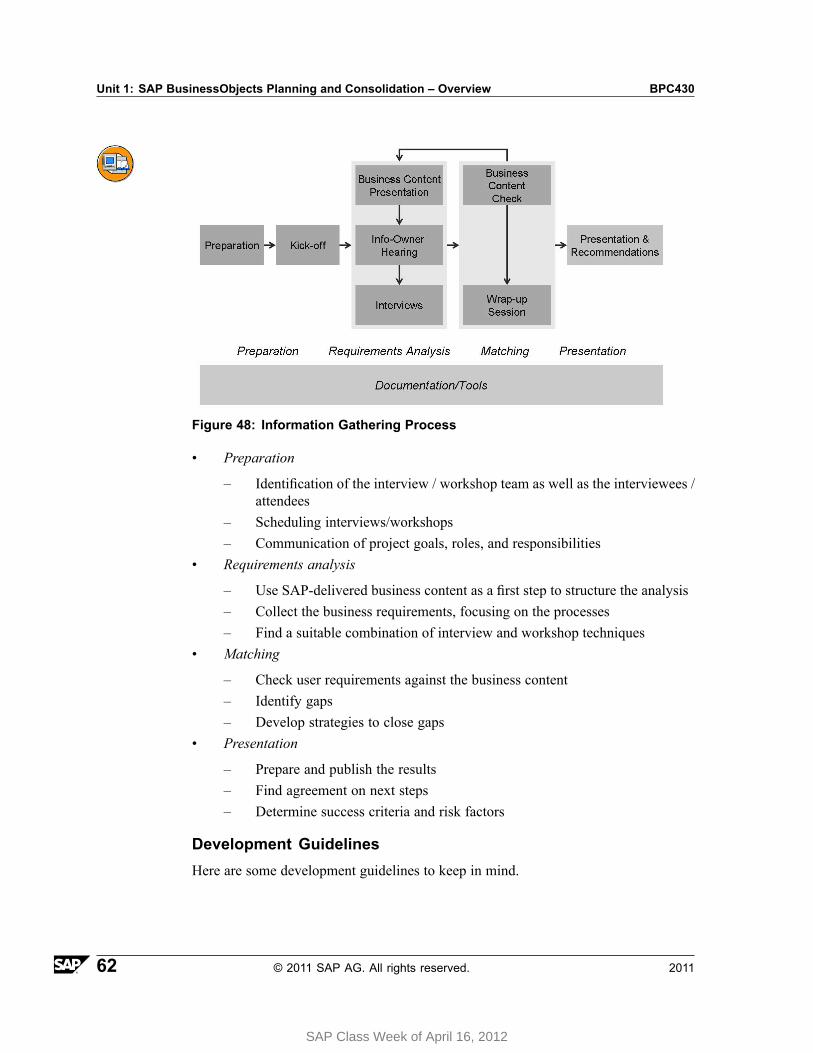
Figure 48: Information Gathering Process
• Preparation
– Identification of the interview / workshop team as well as the interviewees /attendees
– Scheduling interviews/workshops– Communication of project goals, roles, and responsibilities
• Requirements analysis
– Use SAP-delivered business content as a first step to structure the analysis– Collect the business requirements, focusing on the processes– Find a suitable combination of interview and workshop techniques
• Matching
– Check user requirements against the business content– Identify gaps– Develop strategies to close gaps
• Presentation
– Prepare and publish the results– Find agreement on next steps– Determine success criteria and risk factors
Development GuidelinesHere are some development guidelines to keep in mind.
62 © 2011 SAP AG. All rights reserved. 2011
SAP Class Week of April 16, 2012
BPC430 Lesson: Implementing SAP BusinessObjects Planning and Consolidation
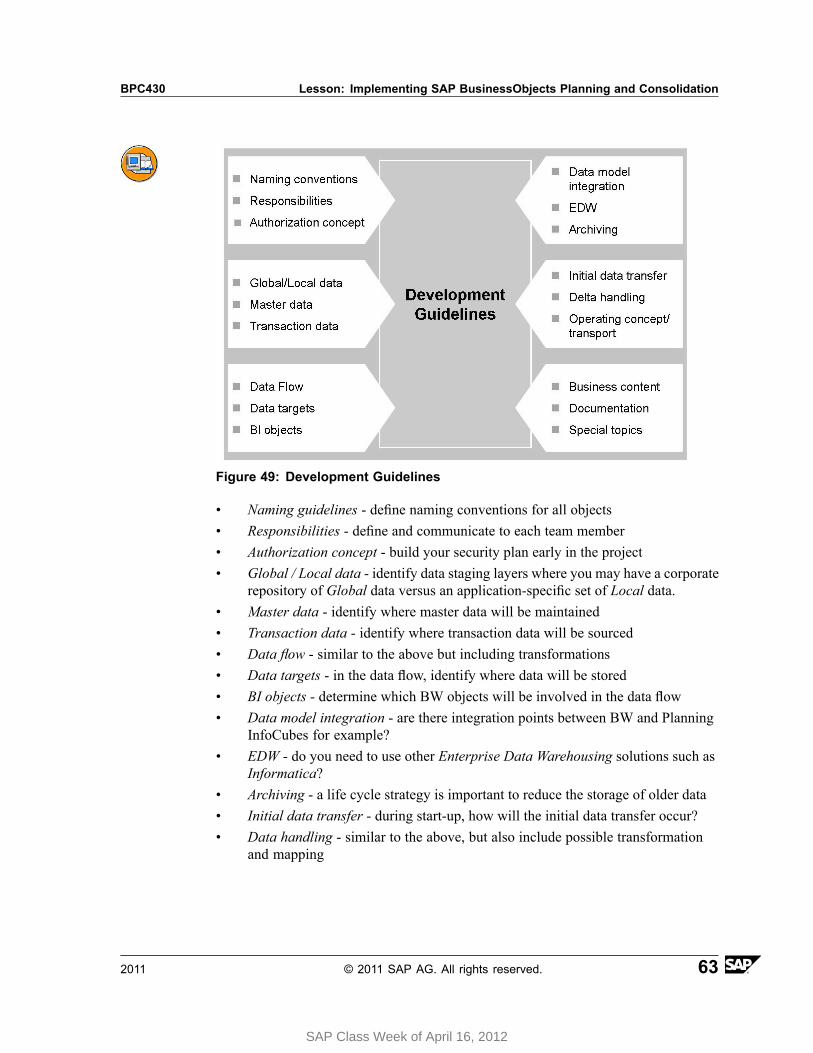
Figure 49: Development Guidelines
• Naming guidelines - define naming conventions for all objects• Responsibilities - define and communicate to each team member• Authorization concept - build your security plan early in the project• Global / Local data - identify data staging layers where you may have a corporate
repository of Global data versus an application-specific set of Local data.• Master data - identify where master data will be maintained• Transaction data - identify where transaction data will be sourced• Data flow - similar to the above but including transformations• Data targets - in the data flow, identify where data will be stored• BI objects - determine which BW objects will be involved in the data flow• Data model integration - are there integration points between BW and Planning
InfoCubes for example?• EDW - do you need to use other Enterprise Data Warehousing solutions such as
Informatica?• Archiving - a life cycle strategy is important to reduce the storage of older data• Initial data transfer - during start-up, how will the initial data transfer occur?• Data handling - similar to the above, but also include possible transformation
and mapping
2011 © 2011 SAP AG. All rights reserved. 63
SAP Class Week of April 16, 2012

Unit 1: SAP BusinessObjects Planning and Consolidation – Overview BPC430
• Operating concept / transports - where will new objects be created and how willthe transport process work?
• Business content - during the gathering of business requirements, check to see ifyou can use any delivered business content
• Documentation - document why your solution and objects are built the way theyare so that subsequent team members can follow what you did, for example
• Special topics
• List of all applications• List of dimensions per application (and dimension type)• List of properties for each dimension• High level content for each dimension• Description of internal data flows between applications• Data sources for master data and transaction data• Central / De-central data load• Automatic / Manual trigger• Full versus. Incremental load• Technology used for data load (out-of-the box, development in ABAP, ...)
Requirements AnalysisGathering business requirements may be the most important part of a project, and themost challenging!
64 © 2011 SAP AG. All rights reserved. 2011
SAP Class Week of April 16, 2012
BPC430 Lesson: Implementing SAP BusinessObjects Planning and Consolidation
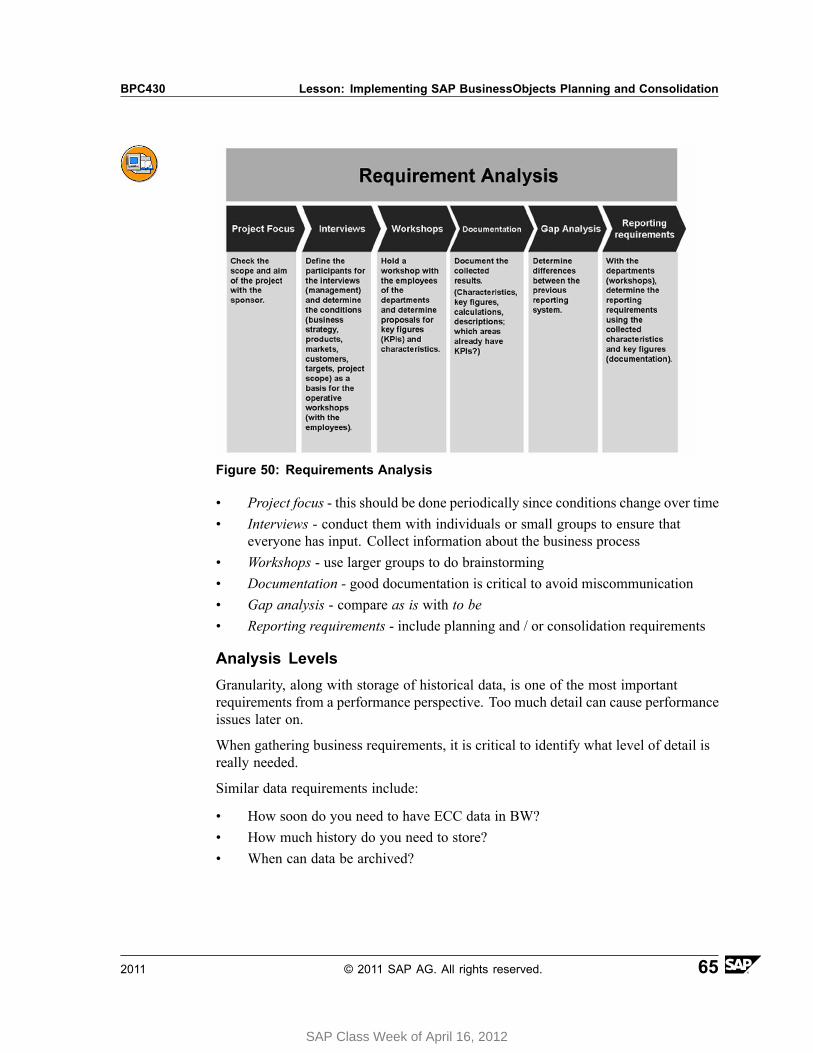
Figure 50: Requirements Analysis
• Project focus - this should be done periodically since conditions change over time• Interviews - conduct them with individuals or small groups to ensure that
everyone has input. Collect information about the business process• Workshops - use larger groups to do brainstorming• Documentation - good documentation is critical to avoid miscommunication• Gap analysis - compare as is with to be• Reporting requirements - include planning and / or consolidation requirements
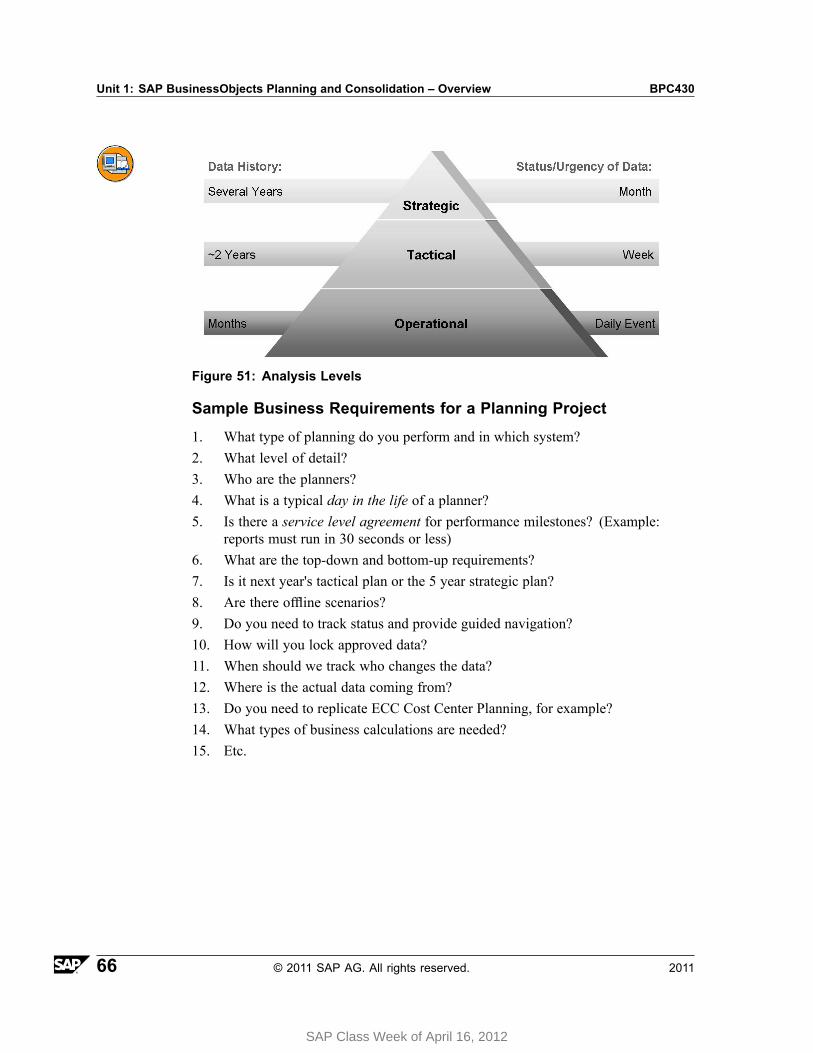
Analysis LevelsGranularity, along with storage of historical data, is one of the most importantrequirements from a performance perspective. Too much detail can cause performanceissues later on.
When gathering business requirements, it is critical to identify what level of detail isreally needed.
Similar data requirements include:
• How soon do you need to have ECC data in BW?• How much history do you need to store?• When can data be archived?
2011 © 2011 SAP AG. All rights reserved. 65
SAP Class Week of April 16, 2012
Unit 1: SAP BusinessObjects Planning and Consolidation – Overview BPC430
Figure 51: Analysis Levels
Sample Business Requirements for a Planning Project
1. What type of planning do you perform and in which system?2. What level of detail?3. Who are the planners?4. What is a typical day in the life of a planner?5. Is there a service level agreement for performance milestones? (Example:
reports must run in 30 seconds or less)6. What are the top-down and bottom-up requirements?7. Is it next year's tactical plan or the 5 year strategic plan?8. Are there offline scenarios?9. Do you need to track status and provide guided navigation?10. How will you lock approved data?11. When should we track who changes the data?12. Where is the actual data coming from?13. Do you need to replicate ECC Cost Center Planning, for example?14. What types of business calculations are needed?15. Etc.
66 © 2011 SAP AG. All rights reserved. 2011
SAP Class Week of April 16, 2012
BPC430 Lesson: Implementing SAP BusinessObjects Planning and Consolidation
Sample Implementation Steps for a Planning ProjectA planning project could involve the following steps.
• Gather the business requirements• Compare as is with to be• Consider delivered content• Specify the required architecture• Develop the data flow requirements• Create the environment• Create dimensions and properties• Create models and set up security• Set up Data Manager packages, logic scripts / BAdIs, business rules• Update exchange rates• Set up work status and a business process flow• Create new reports and input schedules
Note: BAdI stands for Business Add-In.
2011 © 2011 SAP AG. All rights reserved. 67
SAP Class Week of April 16, 2012
Unit 1: SAP BusinessObjects Planning and Consolidation – Overview BPC430
Lesson Summary
You should now be able to:• Discuss the implementation process• Describe general business requirements for the planning and consolidation
application
68 © 2011 SAP AG. All rights reserved. 2011
SAP Class Week of April 16, 2012
BPC430 Unit Summary
Unit SummaryYou should now be able to:• Explain the key terms• Discuss the benefits of SAP BusinessObjects Planning and Consolidation• Describe the components• Identify the most important features of SAP BusinessObjects Planning and
Consolidation• Create an EPM add-in connection• Describe the features of the EPM add-in ribbon• Define default values for dimensions with the EPM Context Bar• Build a simple report• Discuss the implementation process• Describe general business requirements for the planning and consolidation
application
2011 © 2011 SAP AG. All rights reserved. 69
SAP Class Week of April 16, 2012

Unit Summary BPC430
70 © 2011 SAP AG. All rights reserved. 2011
SAP Class Week of April 16, 2012

SAP Class Week of April 16, 2012

SAP Class Week of April 16, 2012

Unit Summary BPC430
71 © 2011 SAP AG. All rights reserved. 2011
SAP Class Week of April 16, 2012

Unit Summary BPC430
72 © 2011 SAP AG. All rights reserved. 2011
SAP Class Week of April 16, 2012
Unit 2The Excel Interface of the EPM add-in
Unit OverviewThis unit includes everything you need to know about the Excel Interface of theEPM add-in.
Unit ObjectivesAfter completing this unit, you will be able to:
• Use the EPM add-in Report Editor features, such as the Layout, Options, Sort,Rank, and Filter.
• Explain member relationships• Describe expansions• Efficiently control members displayed in result sets• Create a report using Member Recognition• Create a report using Local Member Recognition• Use data links• Use member links• Use report links• Work with the formatting style sheet to create more attractive reports.• Create a workbook with two different reports from two different connections.• Create two reports that share a row axis.• Use EPM functions to pull in descriptions and properties into your reports• Create reports and input forms from scratch• Discuss the most important delivered EPM functions• Perform smart variance calculations• Use the time offset function• Set up a push button• Use delivered input schedules• Use delivered reports
2011 © 2011 SAP AG. All rights reserved. 73
SAP Class Week of April 16, 2012
Unit 2: The Excel Interface of the EPM add-in BPC430
• Use EvDRE templates in the EPM add-in• Describe the key features of EvDRE templates• Identify how EvDRE features are provided in the EPM Reports• Migrate EvDRE templates.
Unit ContentsLesson: Using the Report Editor .. . . . . . . . . . . . . . . . . . . . . . . . . . . . . . . . . . . . . . . . . . . . . . . . . 75
Procedure: How to Create a Report From the Report Editor .. . . . . . . . . . . . . 85Exercise 2: Data Analysis: Expand, Collapse, Keep, Exclude ... . . . . . . . .105Exercise 3: Sorting, Filtering, and Ranking. .. . . . . . . . . . . . . . . . . . . . . . . . . . . . . . . 113Exercise 4: Excluding and Renaming Members ... . . . . . . . . . . . . . . . . . . . . . . . .123
Lesson: Using The Member Selector .. . . . . . . . . . . . . . . . . . . . . . . . . . . . . . . . . . . . . . . . . . .130Lesson: Working With Member Recognition ... . . . . . . . . . . . . . . . . . . . . . . . . . . . . . . . . .138
Exercise 5: Member Recognition... . . . . . . . . . . . . . . . . . . . . . . . . . . . . . . . . . . . . . . . . . .141Lesson: Linking Reports .. . . . . . . . . . . . . . . . . . . . . . . . . . . . . . . . . . . . . . . . . . . . . . . . . . . . . . . . . .149Lesson: Formatting ... . . . . . . . . . . . . . . . . . . . . . . . . . . . . . . . . . . . . . . . . . . . . . . . . . . . . . . . . . . . . .154
Procedure: How to Format for Hierarchies... . . . . . . . . . . . . . . . . . . . . . . . . . . . . . . .158Procedure: Applying a Default Dynamic Formatting Template to aWorksheet .. . . . . . . . . . . . . . . . . . . . . . . . . . . . . . . . . . . . . . . . . . . . . . . . . . . . . . . . . . . . . . . . . . . . . .163Procedure: Applying a Default Dynamic Formatting Template to aReport . . . . . . . . . . . . . . . . . . . . . . . . . . . . . . . . . . . . . . . . . . . . . . . . . . . . . . . . . . . . . . . . . . . . . . . . . . . .164Exercise 6: Apply Dynamic Formatting ... . . . . . . . . . . . . . . . . . . . . . . . . . . . . . . . . . . .165
Lesson: Multi-Source Reporting ... . . . . . . . . . . . . . . . . . . . . . . . . . . . . . . . . . . . . . . . . . . . . . . .178Exercise 7: Multi-Source Reporting ... . . . . . . . . . . . . . . . . . . . . . . . . . . . . . . . . . . . . . . .183
Lesson: Using Basic and Advanced EPM Functions & Creating Cell BasedReports .. . . . . . . . . . . . . . . . . . . . . . . . . . . . . . . . . . . . . . . . . . . . . . . . . . . . . . . . . . . . . . . . . . . . . . . . . . . . . .196
Exercise 8: Using Basic EPM Functions ... . . . . . . . . . . . . . . . . . . . . . . . . . . . . . . . . .213Exercise 9: Using Advanced EPM Functions... . . . . . . . . . . . . . . . . . . . . . . . . . . . .225Exercise 10: Using VBA in Buttons ... . . . . . . . . . . . . . . . . . . . . . . . . . . . . . . . . . . . . . . .245
Lesson: Using Delivered Templates... . . . . . . . . . . . . . . . . . . . . . . . . . . . . . . . . . . . . . . . . . . .254Lesson: Comparing EvDRE to EPM Reports .. . . . . . . . . . . . . . . . . . . . . . . . . . . . . . . . . .258Lesson: Migrating EvDRE Templates ... . . . . . . . . . . . . . . . . . . . . . . . . . . . . . . . . . . . . . . . .275
Exercise 11: Migrating EvDRE Templates ... . . . . . . . . . . . . . . . . . . . . . . . . . . . . . . .287
74 © 2011 SAP AG. All rights reserved. 2011
SAP Class Week of April 16, 2012

BPC430 Lesson: Using the Report Editor
Lesson: Using the Report Editor
Lesson OverviewSet up reports and schedules.
Lesson ObjectivesAfter completing this lesson, you will be able to:
• Use the EPM add-in Report Editor features, such as the Layout, Options, Sort,Rank, and Filter.
Business ExampleReporting is usually the most important feature of an application like this. In this unitwe will go over all of the features of the most important reporting tool: the EPMReport Editor.
Sheet OptionsSheet Options apply to the current worksheet, with the exception of Refreshing dataupon open and Clearing data upon save, which apply to the entire workbook.
Sheet options can be accessed from the EPM Ribbon Options → Sheet options. Someof these options (noted in bold) are inherited into the Report Editor Options tab.
However, note that, when in the EPM Report Editor Options tab, the Inherit SheetOptions checkbox can be deselected and some of these options can be overridden.
Sheet Option - General tab
Expand Options Controls what type of member expansion occurs on anExpand. For example: Member and Children
Data Input Allows you to enter and save data.
Member Recognition Allows you to enter members directly in a cell of a report.
2011 © 2011 SAP AG. All rights reserved. 75
SAP Class Week of April 16, 2012
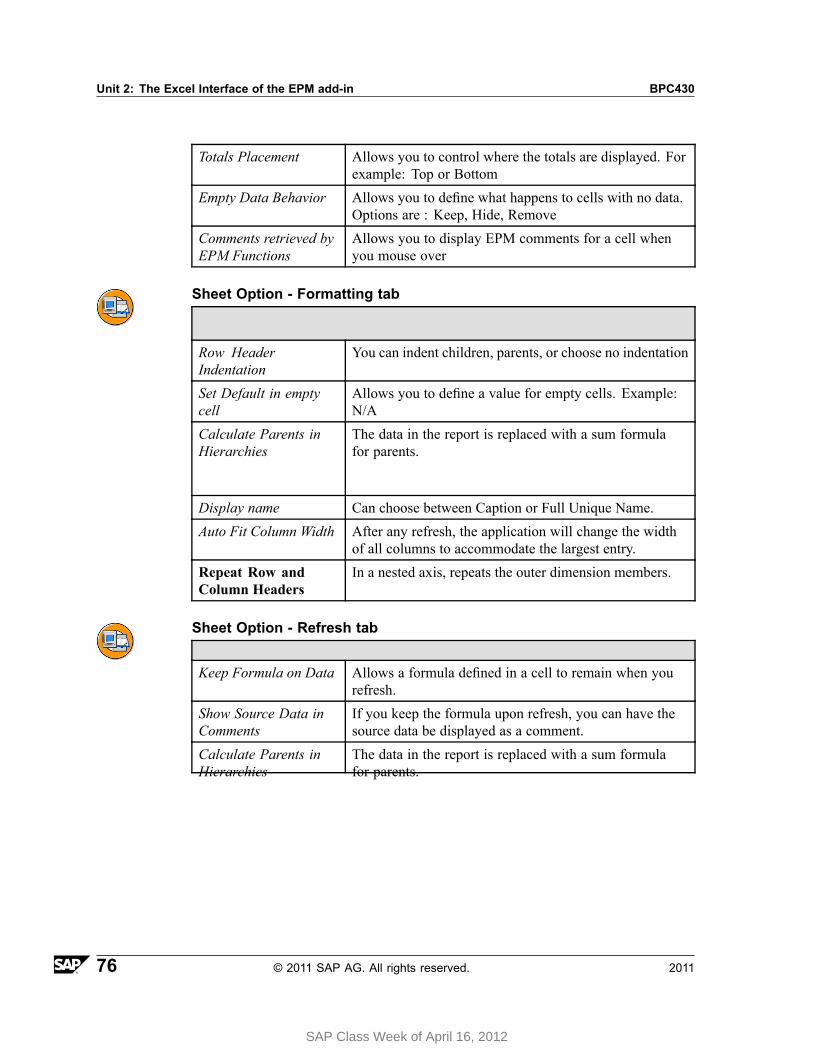
Unit 2: The Excel Interface of the EPM add-in BPC430
Totals Placement Allows you to control where the totals are displayed. Forexample: Top or Bottom
Empty Data Behavior Allows you to define what happens to cells with no data.Options are : Keep, Hide, Remove
Comments retrieved byEPM Functions
Allows you to display EPM comments for a cell whenyou mouse over
Sheet Option - Formatting tab
Row HeaderIndentation
You can indent children, parents, or choose no indentation
Set Default in emptycell
Allows you to define a value for empty cells. Example:N/A
Calculate Parents inHierarchies
The data in the report is replaced with a sum formulafor parents.
Display name Can choose between Caption or Full Unique Name.
Auto Fit Column Width After any refresh, the application will change the widthof all columns to accommodate the largest entry.
Repeat Row andColumn Headers
In a nested axis, repeats the outer dimension members.
Sheet Option - Refresh tab
Keep Formula on Data Allows a formula defined in a cell to remain when yourefresh.
Show Source Data inComments
If you keep the formula upon refresh, you can have thesource data be displayed as a comment.
Calculate Parents inHierarchies
The data in the report is replaced with a sum formulafor parents.
76 © 2011 SAP AG. All rights reserved. 2011
SAP Class Week of April 16, 2012
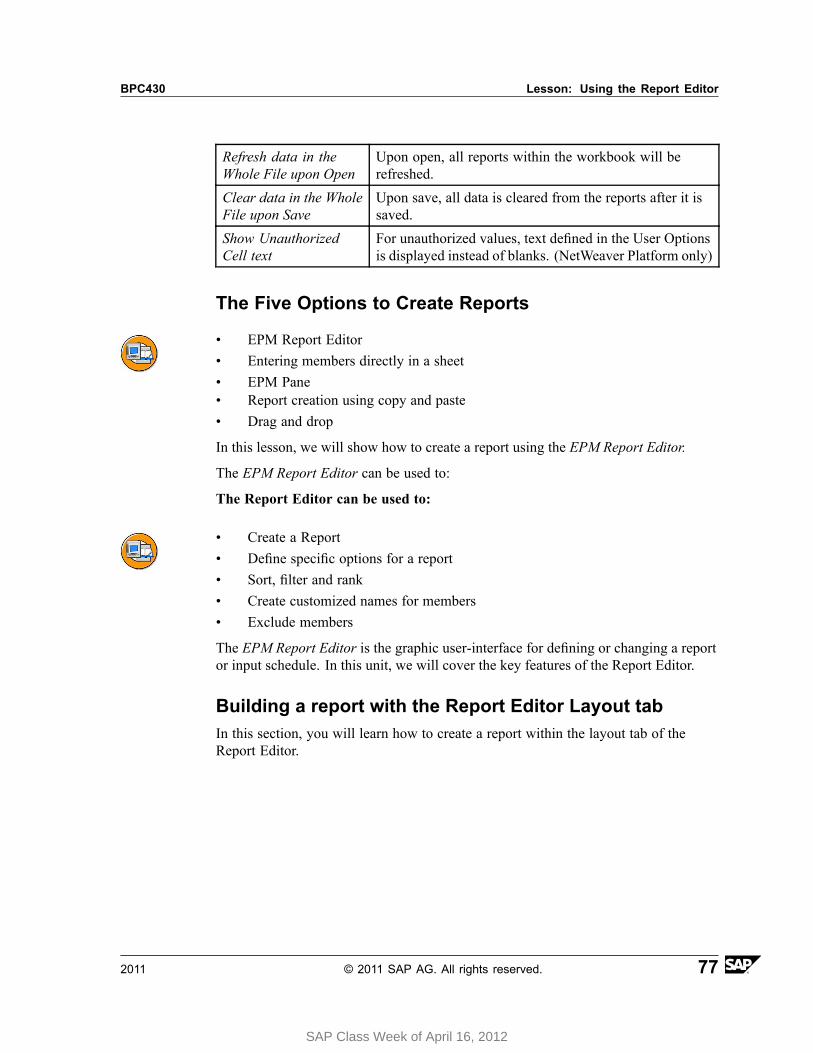
BPC430 Lesson: Using the Report Editor
Refresh data in theWhole File upon Open
Upon open, all reports within the workbook will berefreshed.
Clear data in the WholeFile upon Save
Upon save, all data is cleared from the reports after it issaved.
Show UnauthorizedCell text
For unauthorized values, text defined in the User Optionsis displayed instead of blanks. (NetWeaver Platform only)
The Five Options to Create Reports
• EPM Report Editor• Entering members directly in a sheet• EPM Pane• Report creation using copy and paste• Drag and drop
In this lesson, we will show how to create a report using the EPM Report Editor.
The EPM Report Editor can be used to:
The Report Editor can be used to:
• Create a Report• Define specific options for a report• Sort, filter and rank• Create customized names for members• Exclude members
The EPM Report Editor is the graphic user-interface for defining or changing a reportor input schedule. In this unit, we will cover the key features of the Report Editor.
Building a report with the Report Editor Layout tabIn this section, you will learn how to create a report within the layout tab of theReport Editor.
2011 © 2011 SAP AG. All rights reserved. 77
SAP Class Week of April 16, 2012
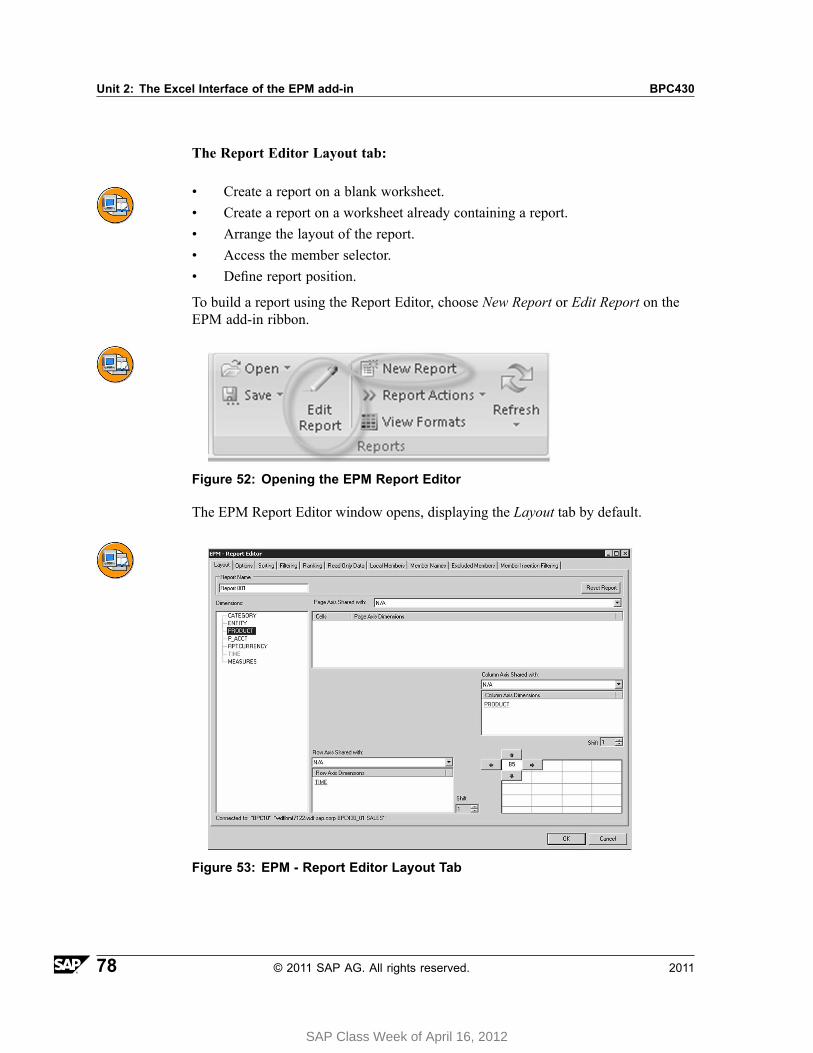
Unit 2: The Excel Interface of the EPM add-in BPC430
The Report Editor Layout tab:
• Create a report on a blank worksheet.• Create a report on a worksheet already containing a report.• Arrange the layout of the report.• Access the member selector.• Define report position.
To build a report using the Report Editor, choose New Report or Edit Report on theEPM add-in ribbon.
Figure 52: Opening the EPM Report Editor
The EPM Report Editor window opens, displaying the Layout tab by default.
Figure 53: EPM - Report Editor Layout Tab
78 © 2011 SAP AG. All rights reserved. 2011
SAP Class Week of April 16, 2012
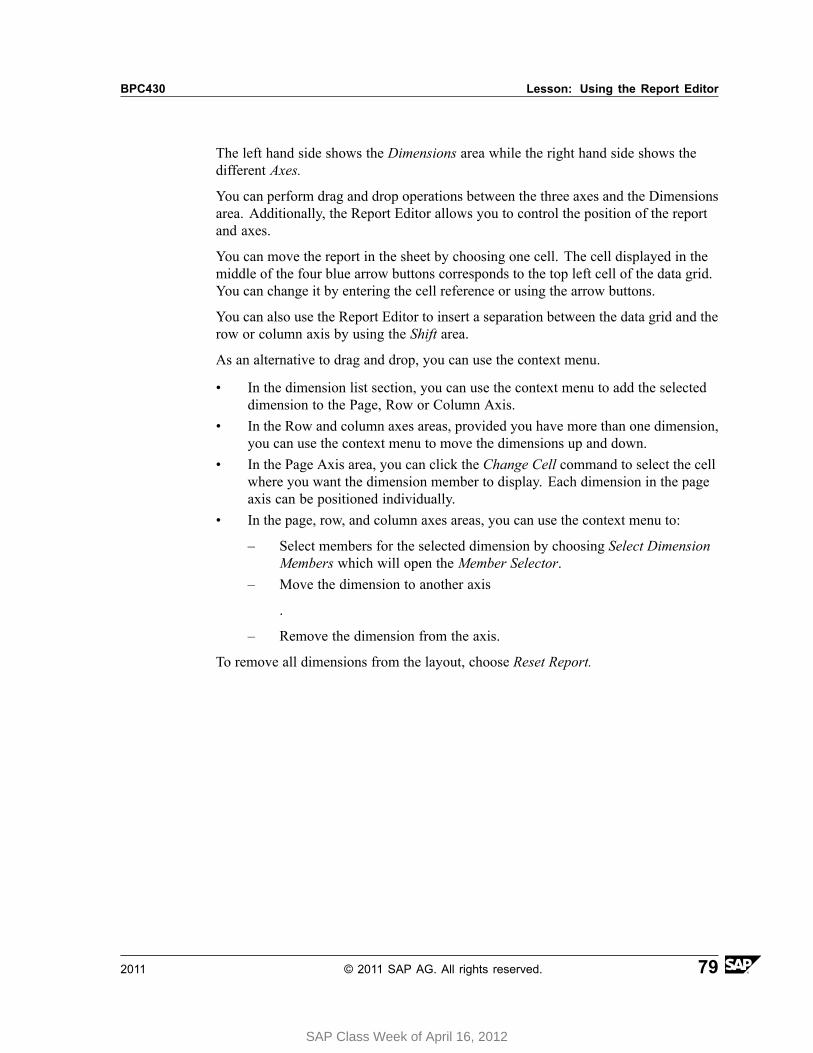
BPC430 Lesson: Using the Report Editor
The left hand side shows the Dimensions area while the right hand side shows thedifferent Axes.
You can perform drag and drop operations between the three axes and the Dimensionsarea. Additionally, the Report Editor allows you to control the position of the reportand axes.
You can move the report in the sheet by choosing one cell. The cell displayed in themiddle of the four blue arrow buttons corresponds to the top left cell of the data grid.You can change it by entering the cell reference or using the arrow buttons.
You can also use the Report Editor to insert a separation between the data grid and therow or column axis by using the Shift area.
As an alternative to drag and drop, you can use the context menu.
• In the dimension list section, you can use the context menu to add the selecteddimension to the Page, Row or Column Axis.
• In the Row and column axes areas, provided you have more than one dimension,you can use the context menu to move the dimensions up and down.
• In the Page Axis area, you can click the Change Cell command to select the cellwhere you want the dimension member to display. Each dimension in the pageaxis can be positioned individually.
• In the page, row, and column axes areas, you can use the context menu to:
– Select members for the selected dimension by choosing Select DimensionMembers which will open the Member Selector.
– Move the dimension to another axis
.
– Remove the dimension from the axis.
To remove all dimensions from the layout, choose Reset Report.
2011 © 2011 SAP AG. All rights reserved. 79
SAP Class Week of April 16, 2012
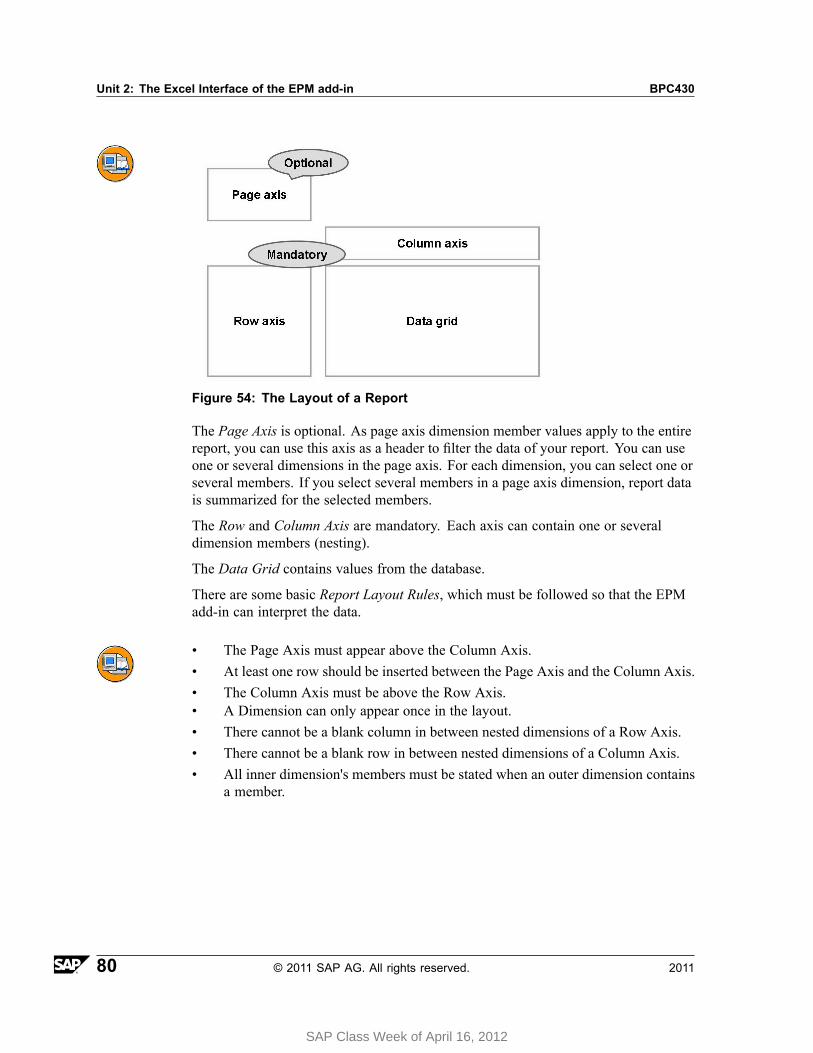
Unit 2: The Excel Interface of the EPM add-in BPC430
Figure 54: The Layout of a Report
The Page Axis is optional. As page axis dimension member values apply to the entirereport, you can use this axis as a header to filter the data of your report. You can useone or several dimensions in the page axis. For each dimension, you can select one orseveral members. If you select several members in a page axis dimension, report datais summarized for the selected members.
The Row and Column Axis are mandatory. Each axis can contain one or severaldimension members (nesting).
The Data Grid contains values from the database.
There are some basic Report Layout Rules, which must be followed so that the EPMadd-in can interpret the data.
• The Page Axis must appear above the Column Axis.• At least one row should be inserted between the Page Axis and the Column Axis.• The Column Axis must be above the Row Axis.• A Dimension can only appear once in the layout.• There cannot be a blank column in between nested dimensions of a Row Axis.• There cannot be a blank row in between nested dimensions of a Column Axis.• All inner dimension's members must be stated when an outer dimension contains
a member.
80 © 2011 SAP AG. All rights reserved. 2011
SAP Class Week of April 16, 2012

BPC430 Lesson: Using the Report Editor
Figure 55: Page Axis Layout Rules: Blank row between Page Axis and ColumnAxis
Below you can see three examples of the Row Axis, two of which are incorrect.
The Nesting 2 example is incorrect because the inner dimension member, the account,is not stated.
The Nesting 3 example is incorrect because there is a blank column between thetwo dimensions.
2011 © 2011 SAP AG. All rights reserved. 81
SAP Class Week of April 16, 2012
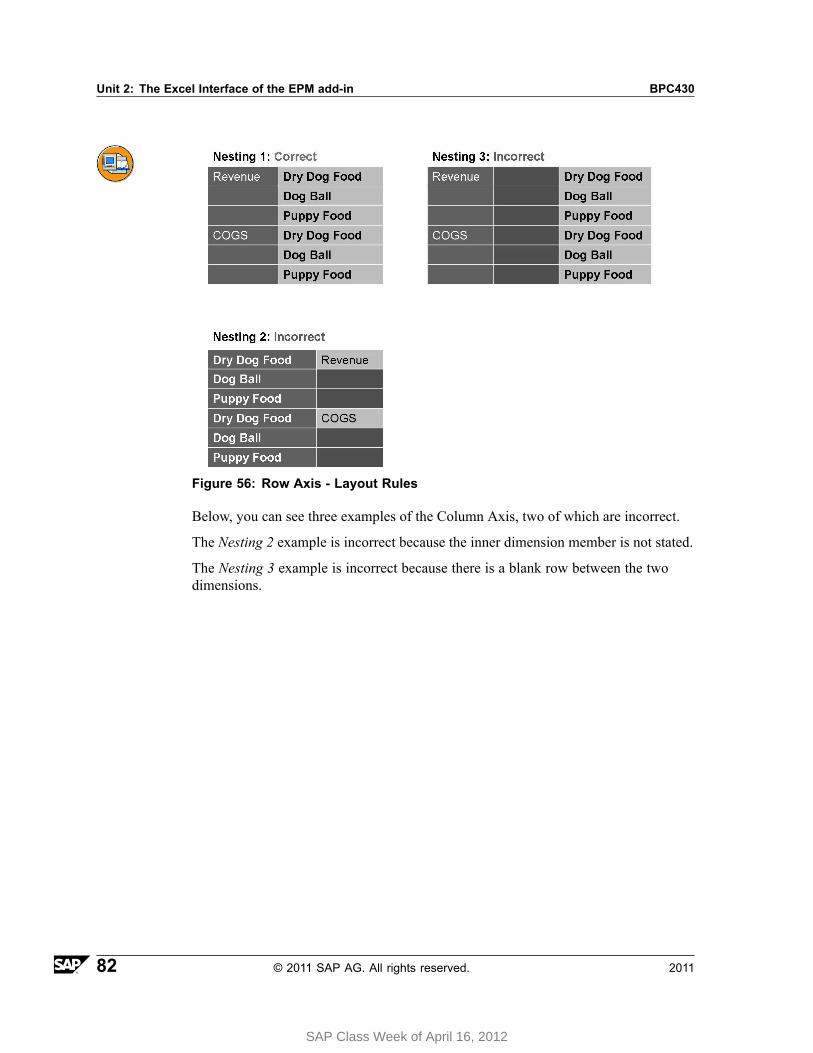
Unit 2: The Excel Interface of the EPM add-in BPC430
Figure 56: Row Axis - Layout Rules
Below, you can see three examples of the Column Axis, two of which are incorrect.
The Nesting 2 example is incorrect because the inner dimension member is not stated.
The Nesting 3 example is incorrect because there is a blank row between the twodimensions.
82 © 2011 SAP AG. All rights reserved. 2011
SAP Class Week of April 16, 2012

BPC430 Lesson: Using the Report Editor
Figure 57: Column Axis - Layout Rules
Blank rows or columns between members are allowed. As are local excel formulas.
Figure 58: Report Layout Possibilities
By default, a report is created on the Active Connection of the worksheet. The ActiveConnection can be displayed on the EPM Pane and on the Report Editors' Layout tab.
2011 © 2011 SAP AG. All rights reserved. 83
SAP Class Week of April 16, 2012
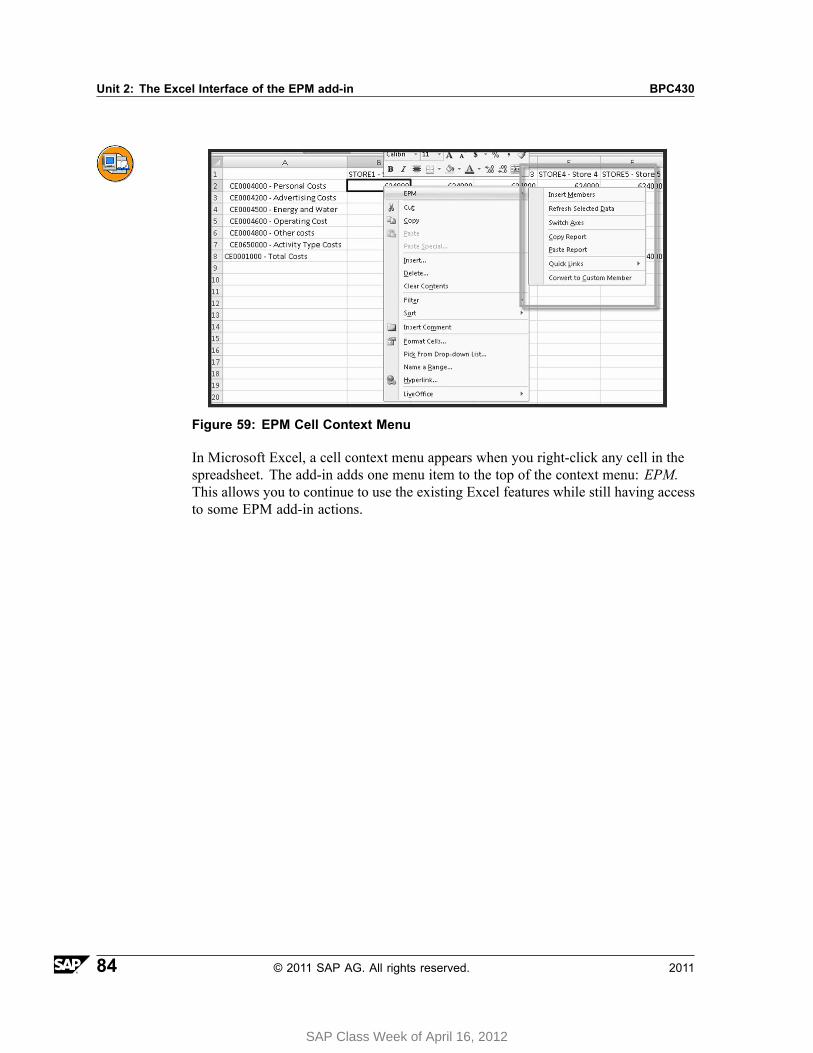
Unit 2: The Excel Interface of the EPM add-in BPC430
Figure 59: EPM Cell Context Menu
In Microsoft Excel, a cell context menu appears when you right-click any cell in thespreadsheet. The add-in adds one menu item to the top of the context menu: EPM.This allows you to continue to use the existing Excel features while still having accessto some EPM add-in actions.
84 © 2011 SAP AG. All rights reserved. 2011
SAP Class Week of April 16, 2012
BPC430 Lesson: Using the Report Editor
How to Create a Report From the Report Editor
1. From the EPM add-in ribbon, choose New Report or Edit Report.
The EPM - Report Editor window will display on the Layout tab by default.
2. If you want a filter the report data, drag and drop the one or more dimensions tothe Page Axis. Click the dimension to call the EPM - Member Selector window.Choose the member/members for the filter and choose OK.
3. On the Layout tab, drag and drop one or several dimensions to the Row Axis.
4. On the Layout tab, drag and drop one or several dimensions to the Column Axis.
5. Optional: On the bottom right hand side of the EPM - Report Editor window,you can decide the position of the top left cell of the data grid.
6. Optional: A shift between the data grid of the report and its row and columnheaders can be defined. To do so, enter a number greater than 1 if the Row Axisshould remain to the left of the Column Axis. Enter a number less then 0 if theRow Axis should appear to the right of the Column Axis.
Continued on next page
2011 © 2011 SAP AG. All rights reserved. 85
SAP Class Week of April 16, 2012
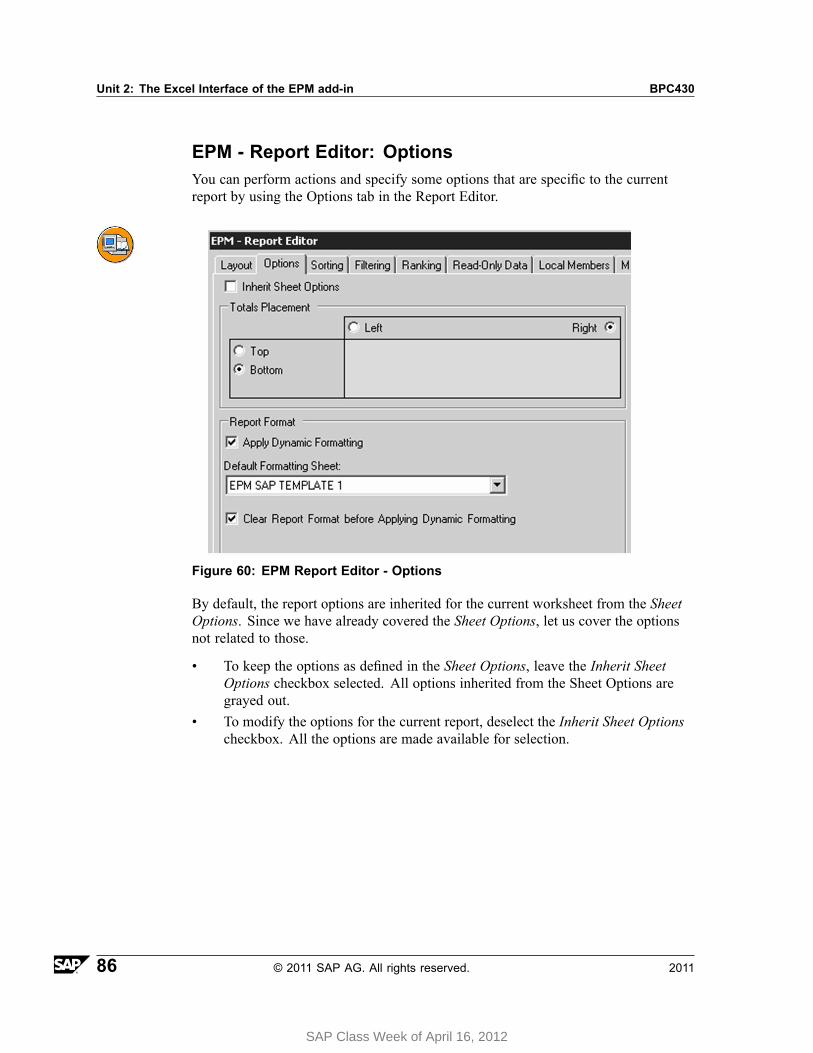
Unit 2: The Excel Interface of the EPM add-in BPC430
EPM - Report Editor: OptionsYou can perform actions and specify some options that are specific to the currentreport by using the Options tab in the Report Editor.
Figure 60: EPM Report Editor - Options
By default, the report options are inherited for the current worksheet from the SheetOptions. Since we have already covered the Sheet Options, let us cover the optionsnot related to those.
• To keep the options as defined in the Sheet Options, leave the Inherit SheetOptions checkbox selected. All options inherited from the Sheet Options aregrayed out.
• To modify the options for the current report, deselect the Inherit Sheet Optionscheckbox. All the options are made available for selection.
86 © 2011 SAP AG. All rights reserved. 2011
SAP Class Week of April 16, 2012
BPC430 Lesson: Using the Report Editor
Options not related to the Sheet Options:
• Freeze Data Refresh: For Planning and Consolidation connections, this optionwill allow you to navigate in a report without having data loaded from the datasource. When you are finished navigating in the report, you can activate therefresh and retrieve the latest data.
Note: This option is also available in the User Options
• Freeze Data Save: For Planning and Consolidation connections, this option willdeactivate the data save for a specific input form. When you are sure of the datayou want to save, you can activate again and save the data.
• Do not Store Connection: For Planning and Consolidation connections, thisoption will allow you to save a report without storing the connection used tocreate the report.
Note: Since the connection is not stored, the dimensions are identifiedby their types (for example, E for Entity) and not by their names.Members are identified by their relationships and not with their names.
• Display on Base Level Data: For Planning and Consolidation connections,version for the Microsoft platform connections only, this option will only displaythe data that is not aggregated. The data calculations will not be performed andthe data for base level members will be displayed quicker.
Refresh Options
EPM Button Action
Refresh - Select Report To update a selected report
Refresh - Worksheet To update a sheet of the EPMWorkbook
Refresh - Workbook To update the EPMWorkbook
Refresh - Selected Data To update selected data
On the EPM Ribbon, there are various sheet options. You can choose to refresh thereport, a sheet of the Workbook, the entire workbook, or just some of the data.
SortingIn this section you will learn about sorting the data of the current report.
2011 © 2011 SAP AG. All rights reserved. 87
SAP Class Week of April 16, 2012
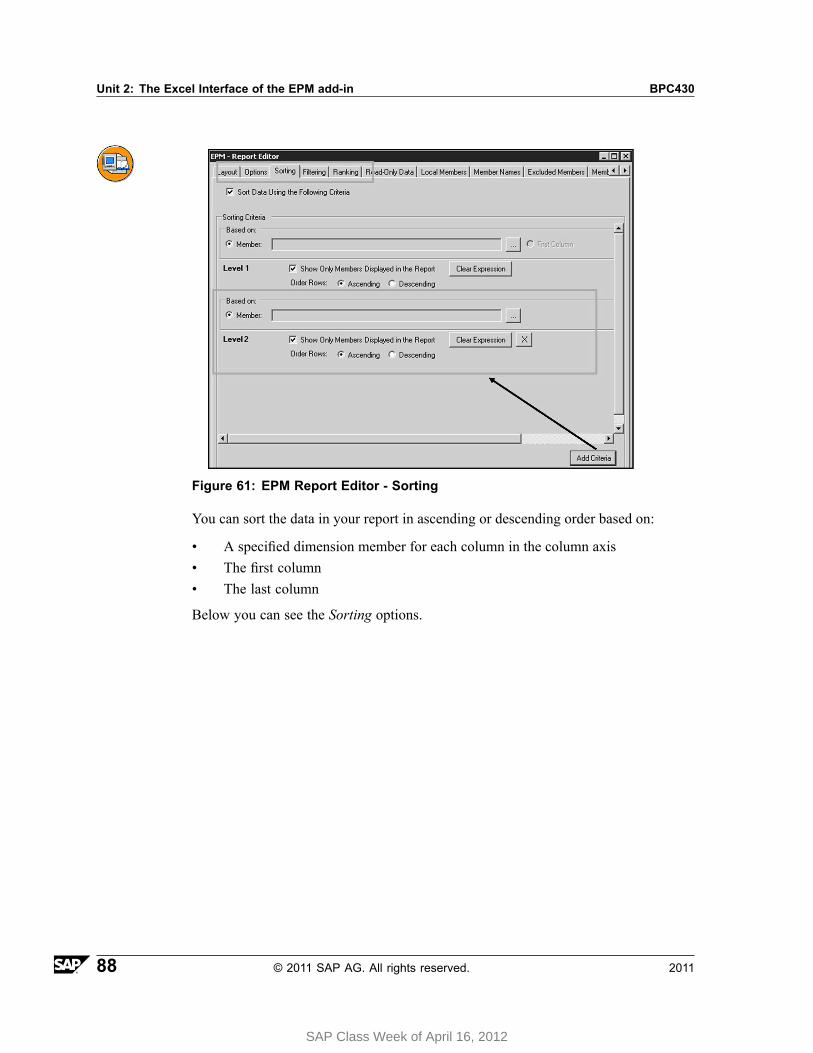
Unit 2: The Excel Interface of the EPM add-in BPC430
Figure 61: EPM Report Editor - Sorting
You can sort the data in your report in ascending or descending order based on:
• A specified dimension member for each column in the column axis• The first column• The last column
Below you can see the Sorting options.
88 © 2011 SAP AG. All rights reserved. 2011
SAP Class Week of April 16, 2012
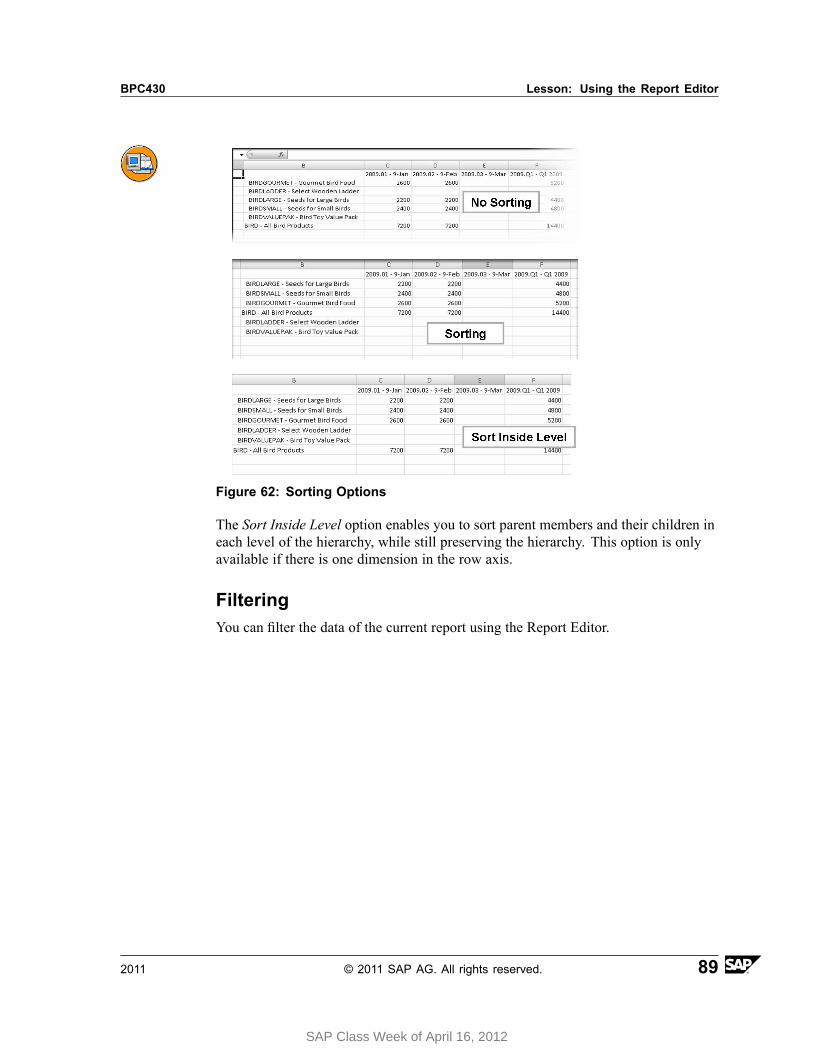
BPC430 Lesson: Using the Report Editor
Figure 62: Sorting Options
The Sort Inside Level option enables you to sort parent members and their children ineach level of the hierarchy, while still preserving the hierarchy. This option is onlyavailable if there is one dimension in the row axis.
FilteringYou can filter the data of the current report using the Report Editor.
2011 © 2011 SAP AG. All rights reserved. 89
SAP Class Week of April 16, 2012

Unit 2: The Excel Interface of the EPM add-in BPC430
Figure 63: Filtering
You can specify one or more conditional dimension member value filters on thereport. Only the members that meet the filtering criteria will be displayed in thereport results. However, you have the following additional functionality to meet yourbusiness requirements:
90 © 2011 SAP AG. All rights reserved. 2011
SAP Class Week of April 16, 2012
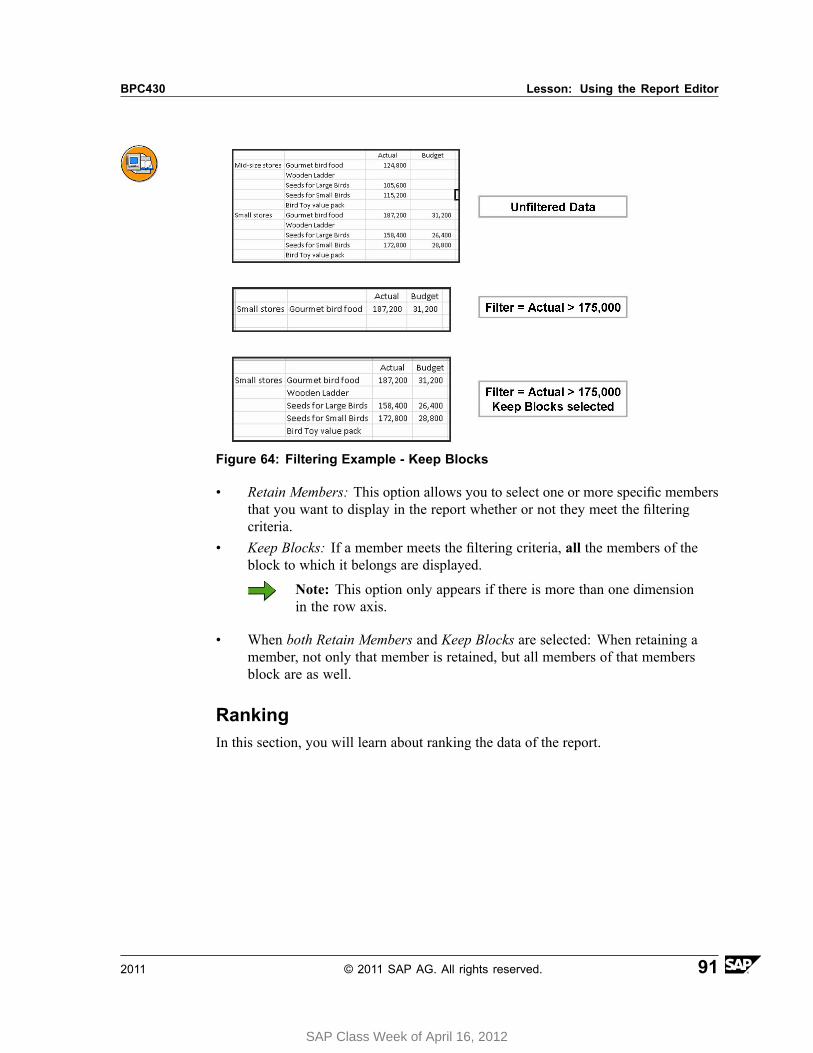
BPC430 Lesson: Using the Report Editor
Figure 64: Filtering Example - Keep Blocks
• Retain Members: This option allows you to select one or more specific membersthat you want to display in the report whether or not they meet the filteringcriteria.
• Keep Blocks: If a member meets the filtering criteria, all the members of theblock to which it belongs are displayed.
Note: This option only appears if there is more than one dimensionin the row axis.
• When both Retain Members and Keep Blocks are selected: When retaining amember, not only that member is retained, but all members of that membersblock are as well.
RankingIn this section, you will learn about ranking the data of the report.
2011 © 2011 SAP AG. All rights reserved. 91
SAP Class Week of April 16, 2012

Unit 2: The Excel Interface of the EPM add-in BPC430
Figure 65: EPM Report Editor - Ranking
You can specify top or bottom N ranking based on a specified dimension member. Ifthere is more than one dimension in the column axis, you can select one memberfor each dimension.
If you also define a filtering on data on the Filtering tab, to avoid conflict, the filteringtakes precedence over the ranking. (The Perform Filtering, then Ranking checkbox isset on the Filtering tab by default).
If you prefer, you can select the Perform Ranking, then Filtering option on theRanking tab. This will deselect the Perform Filtering, then Ranking checkbox onthe Filtering tab.
92 © 2011 SAP AG. All rights reserved. 2011
SAP Class Week of April 16, 2012
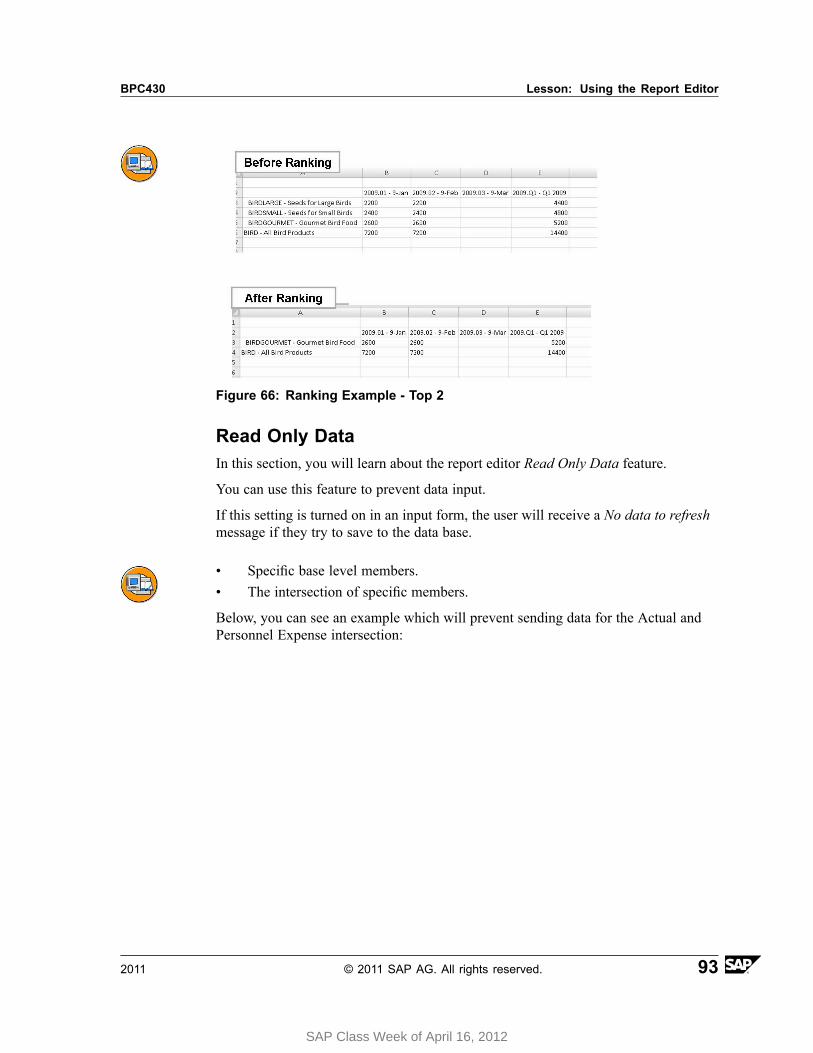
BPC430 Lesson: Using the Report Editor
Figure 66: Ranking Example - Top 2
Read Only DataIn this section, you will learn about the report editor Read Only Data feature.
You can use this feature to prevent data input.
If this setting is turned on in an input form, the user will receive a No data to refreshmessage if they try to save to the data base.
• Specific base level members.• The intersection of specific members.
Below, you can see an example which will prevent sending data for the Actual andPersonnel Expense intersection:
2011 © 2011 SAP AG. All rights reserved. 93
SAP Class Week of April 16, 2012
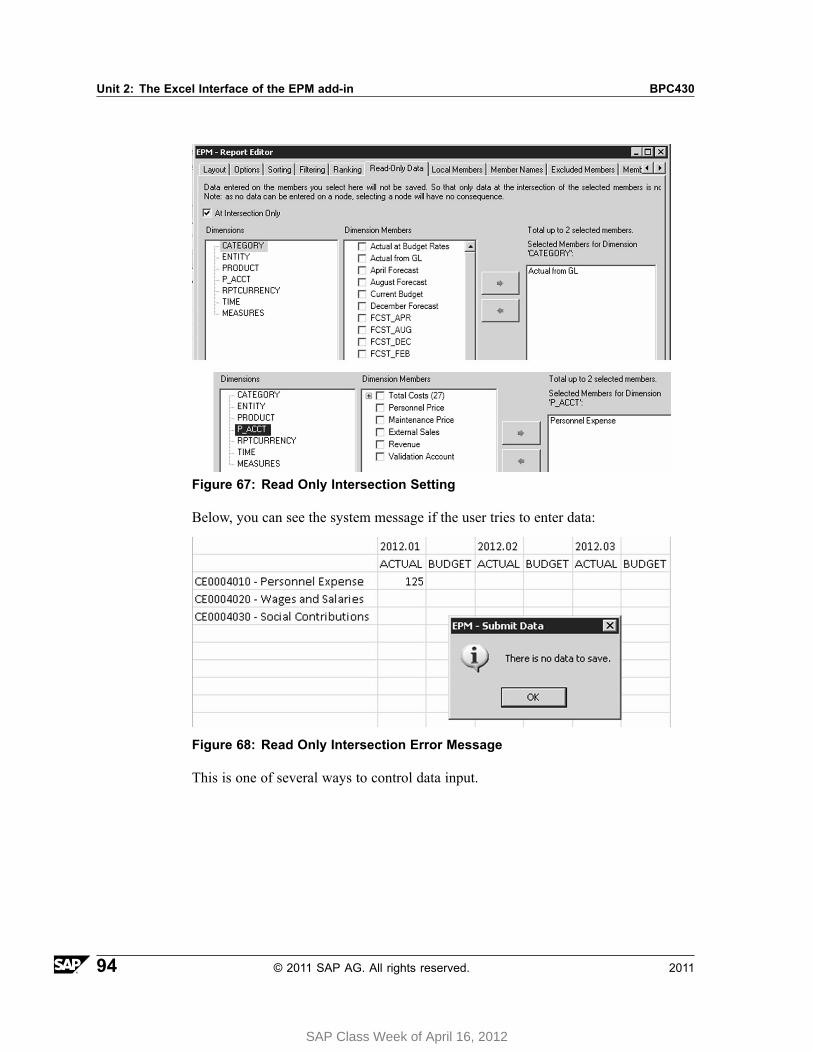
Unit 2: The Excel Interface of the EPM add-in BPC430
Figure 67: Read Only Intersection Setting
Below, you can see the system message if the user tries to enter data:
Figure 68: Read Only Intersection Error Message
This is one of several ways to control data input.
94 © 2011 SAP AG. All rights reserved. 2011
SAP Class Week of April 16, 2012
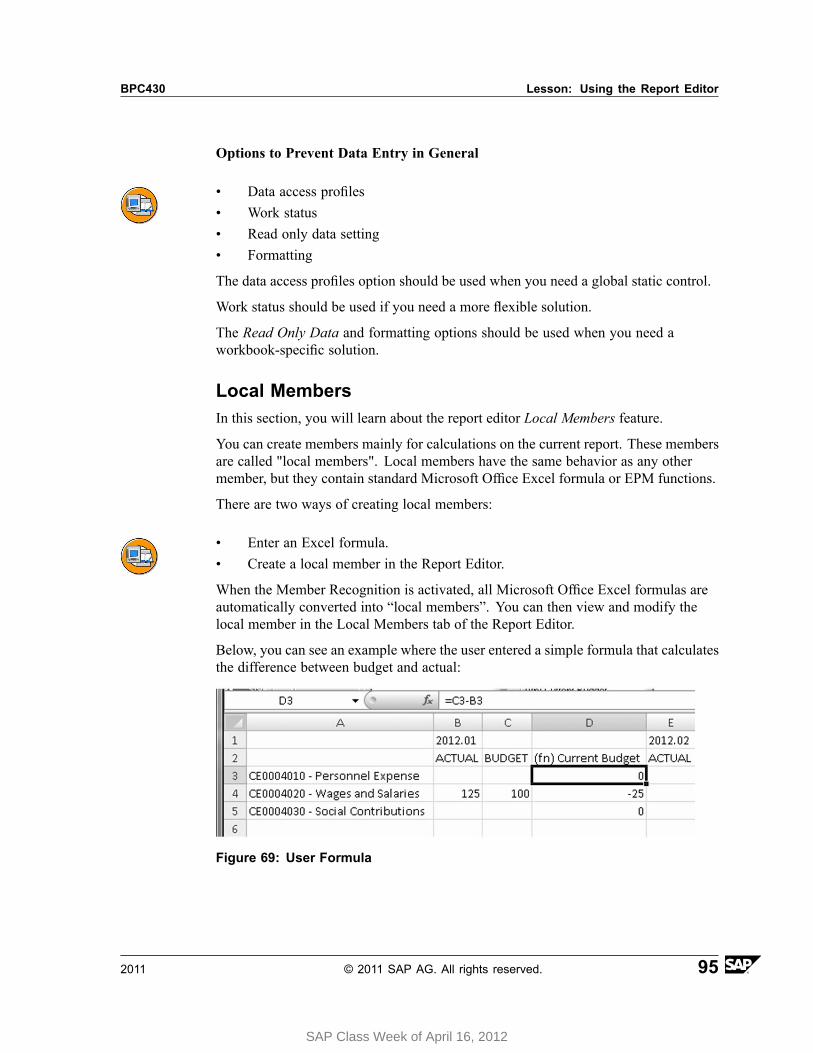
BPC430 Lesson: Using the Report Editor
Options to Prevent Data Entry in General
• Data access profiles• Work status• Read only data setting• Formatting
The data access profiles option should be used when you need a global static control.
Work status should be used if you need a more flexible solution.
The Read Only Data and formatting options should be used when you need aworkbook-specific solution.
Local MembersIn this section, you will learn about the report editor Local Members feature.
You can create members mainly for calculations on the current report. These membersare called "local members". Local members have the same behavior as any othermember, but they contain standard Microsoft Office Excel formula or EPM functions.
There are two ways of creating local members:
• Enter an Excel formula.• Create a local member in the Report Editor.
When the Member Recognition is activated, all Microsoft Office Excel formulas areautomatically converted into “local members”. You can then view and modify thelocal member in the Local Members tab of the Report Editor.
Below, you can see an example where the user entered a simple formula that calculatesthe difference between budget and actual:
Figure 69: User Formula
2011 © 2011 SAP AG. All rights reserved. 95
SAP Class Week of April 16, 2012
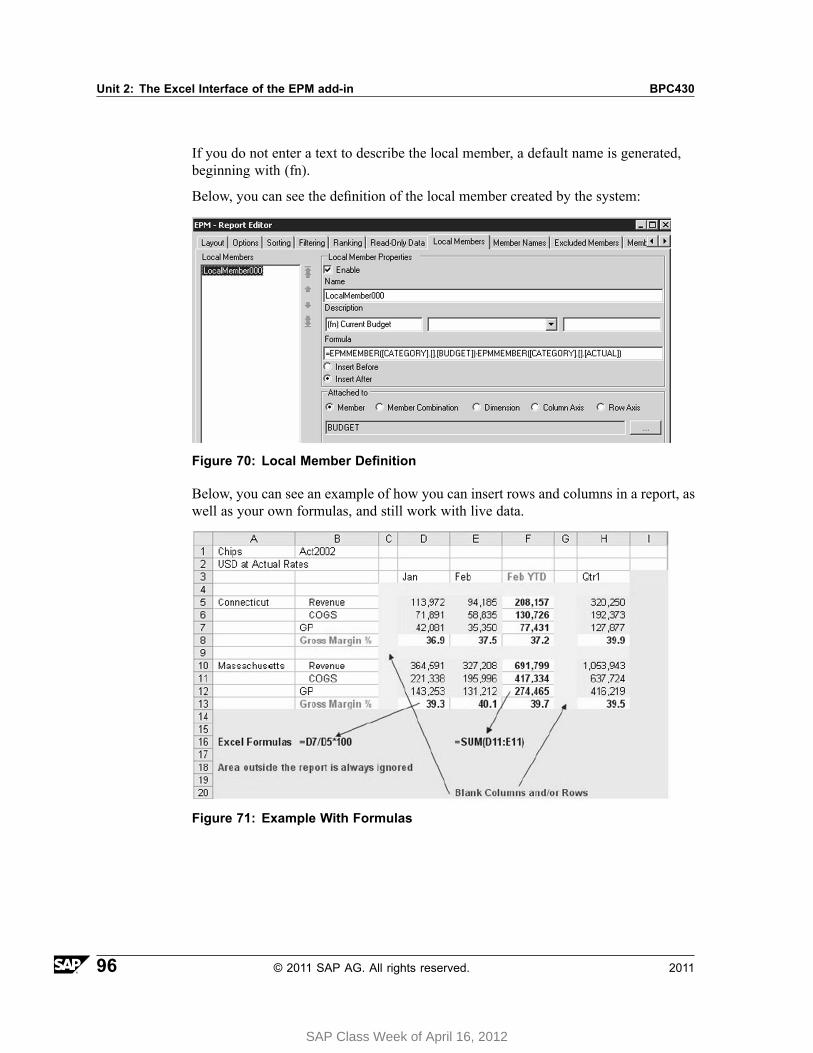
Unit 2: The Excel Interface of the EPM add-in BPC430
If you do not enter a text to describe the local member, a default name is generated,beginning with (fn).
Below, you can see the definition of the local member created by the system:
Figure 70: Local Member Definition
Below, you can see an example of how you can insert rows and columns in a report, aswell as your own formulas, and still work with live data.
Figure 71: Example With Formulas
96 © 2011 SAP AG. All rights reserved. 2011
SAP Class Week of April 16, 2012
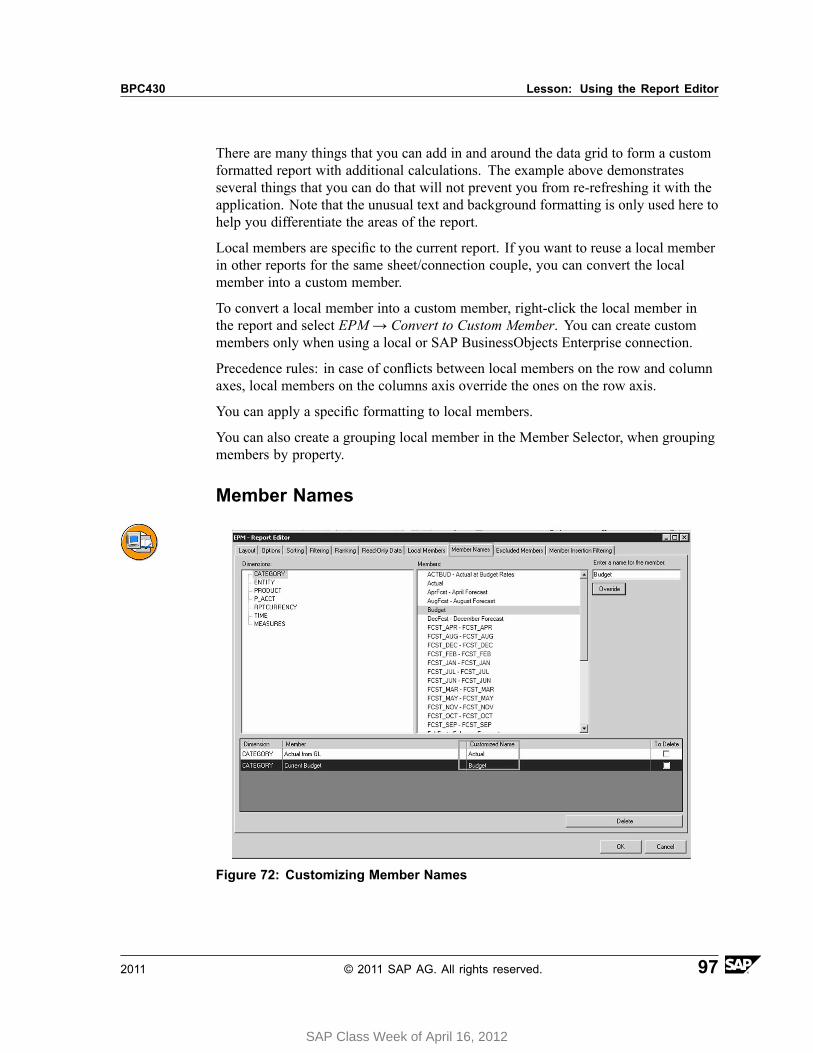
BPC430 Lesson: Using the Report Editor
There are many things that you can add in and around the data grid to form a customformatted report with additional calculations. The example above demonstratesseveral things that you can do that will not prevent you from re-refreshing it with theapplication. Note that the unusual text and background formatting is only used here tohelp you differentiate the areas of the report.
Local members are specific to the current report. If you want to reuse a local memberin other reports for the same sheet/connection couple, you can convert the localmember into a custom member.
To convert a local member into a custom member, right-click the local member inthe report and select EPM → Convert to Custom Member. You can create custommembers only when using a local or SAP BusinessObjects Enterprise connection.
Precedence rules: in case of conflicts between local members on the row and columnaxes, local members on the columns axis override the ones on the row axis.
You can apply a specific formatting to local members.
You can also create a grouping local member in the Member Selector, when groupingmembers by property.
Member Names
Figure 72: Customizing Member Names
2011 © 2011 SAP AG. All rights reserved. 97
SAP Class Week of April 16, 2012
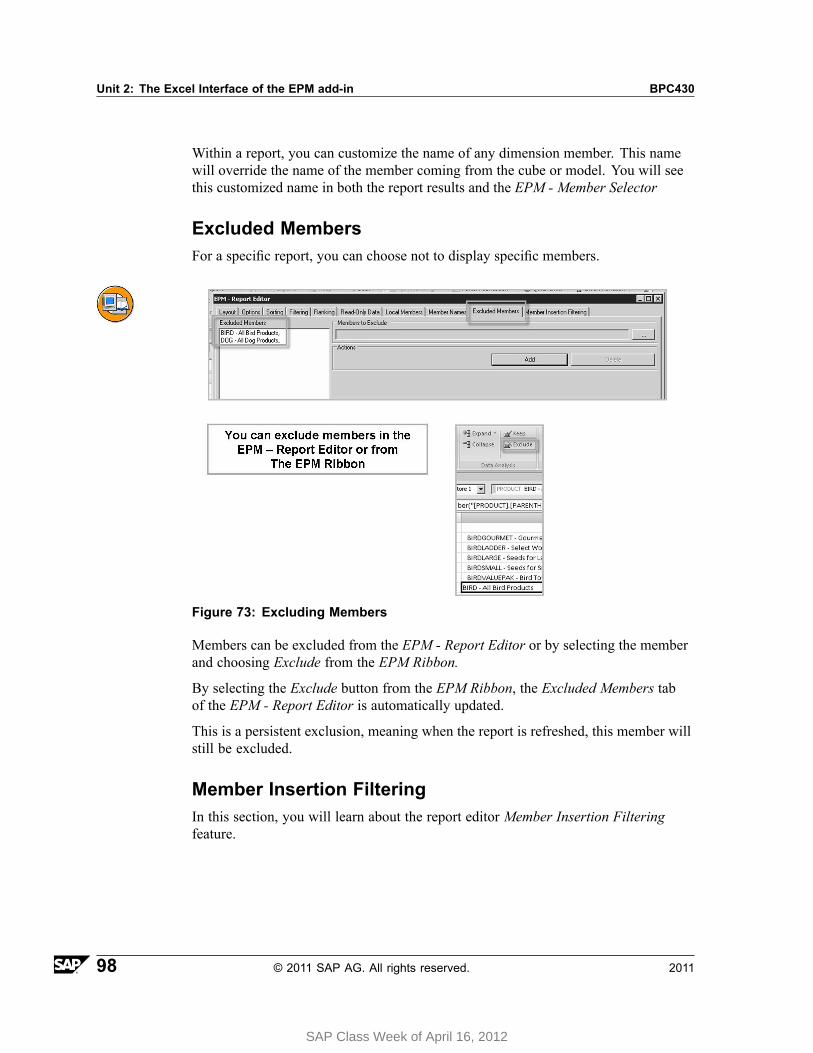
Unit 2: The Excel Interface of the EPM add-in BPC430
Within a report, you can customize the name of any dimension member. This namewill override the name of the member coming from the cube or model. You will seethis customized name in both the report results and the EPM - Member Selector
Excluded MembersFor a specific report, you can choose not to display specific members.
Figure 73: Excluding Members
Members can be excluded from the EPM - Report Editor or by selecting the memberand choosing Exclude from the EPM Ribbon.
By selecting the Exclude button from the EPM Ribbon, the Excluded Members tabof the EPM - Report Editor is automatically updated.
This is a persistent exclusion, meaning when the report is refreshed, this member willstill be excluded.
Member Insertion FilteringIn this section, you will learn about the report editor Member Insertion Filteringfeature.
98 © 2011 SAP AG. All rights reserved. 2011
SAP Class Week of April 16, 2012
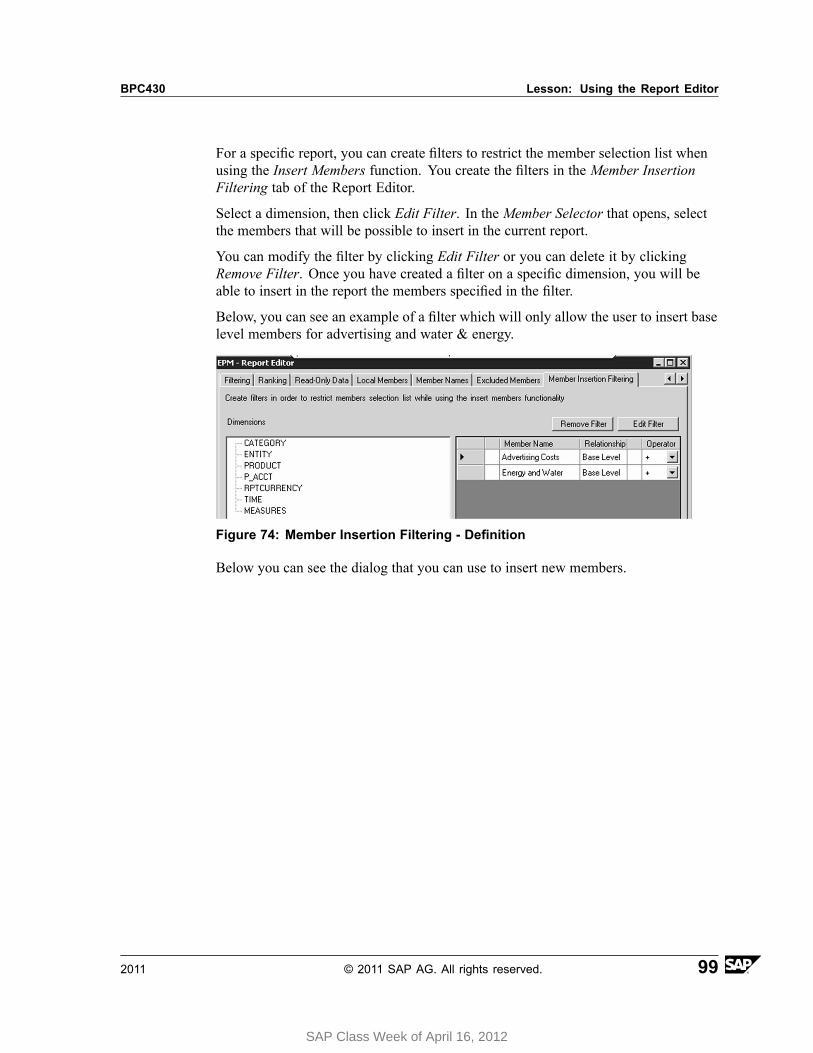
BPC430 Lesson: Using the Report Editor
For a specific report, you can create filters to restrict the member selection list whenusing the Insert Members function. You create the filters in the Member InsertionFiltering tab of the Report Editor.
Select a dimension, then click Edit Filter. In the Member Selector that opens, selectthe members that will be possible to insert in the current report.
You can modify the filter by clicking Edit Filter or you can delete it by clickingRemove Filter. Once you have created a filter on a specific dimension, you will beable to insert in the report the members specified in the filter.
Below, you can see an example of a filter which will only allow the user to insert baselevel members for advertising and water & energy.
Figure 74: Member Insertion Filtering - Definition
Below you can see the dialog that you can use to insert new members.
2011 © 2011 SAP AG. All rights reserved. 99
SAP Class Week of April 16, 2012
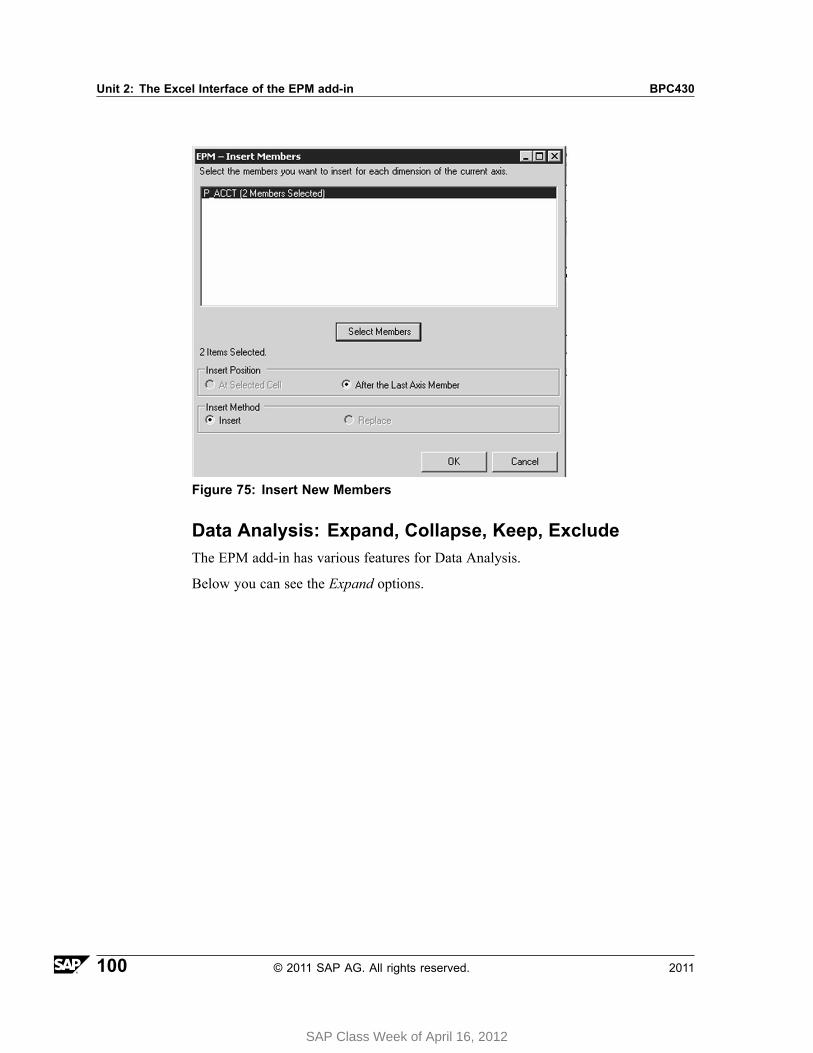
Unit 2: The Excel Interface of the EPM add-in BPC430
Figure 75: Insert New Members
Data Analysis: Expand, Collapse, Keep, ExcludeThe EPM add-in has various features for Data Analysis.
Below you can see the Expand options.
100 © 2011 SAP AG. All rights reserved. 2011
SAP Class Week of April 16, 2012
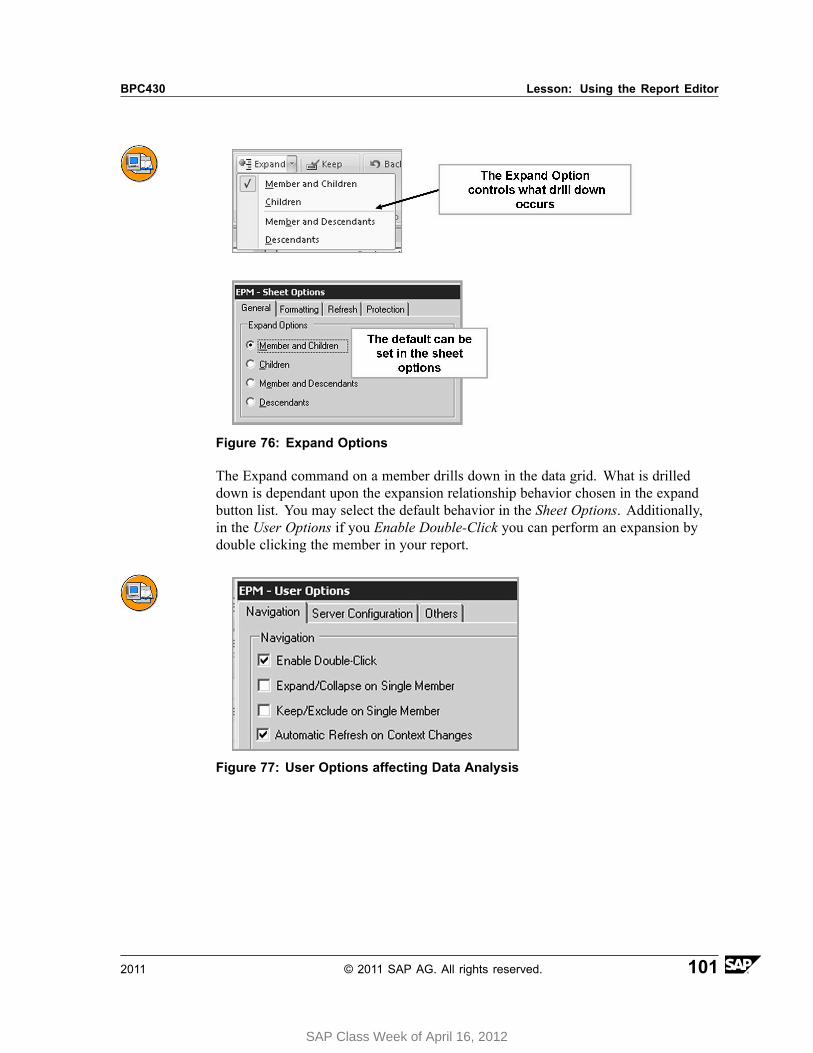
BPC430 Lesson: Using the Report Editor
Figure 76: Expand Options
The Expand command on a member drills down in the data grid. What is drilleddown is dependant upon the expansion relationship behavior chosen in the expandbutton list. You may select the default behavior in the Sheet Options. Additionally,in the User Options if you Enable Double-Click you can perform an expansion bydouble clicking the member in your report.
Figure 77: User Options affecting Data Analysis
2011 © 2011 SAP AG. All rights reserved. 101
SAP Class Week of April 16, 2012

Unit 2: The Excel Interface of the EPM add-in BPC430
Note the following regarding the Expand feature:
• Expand will not work on a page axis dimension member.• When the data sorting, ranking and filtering are activated, the expand works in
the column axis only if the following options are selected: Member and Childrenor Member and Descendants
• When the data sorting, ranking and filtering are activated, the expand neverworks in the row axis.
• When the data sorting, ranking and filtering are activated, the way the Expandworks also applies to the Collapse feature.
Figure 78: Expand with Nested Axis
Expansion with Nested Axis: When you expand within a nested axis' inner dimension,you can decide one of the following behaviors:
• All child members will be repeated for each member of the outer dimension.This is called a symmetrical expand.
• Only the child member for the selected member of the outer dimension will bedisplayed. This is called an asymmetrical expand.
The expansion on an outer dimension is the same as a simple axis.
Below you can see the Collapse options.
102 © 2011 SAP AG. All rights reserved. 2011
SAP Class Week of April 16, 2012
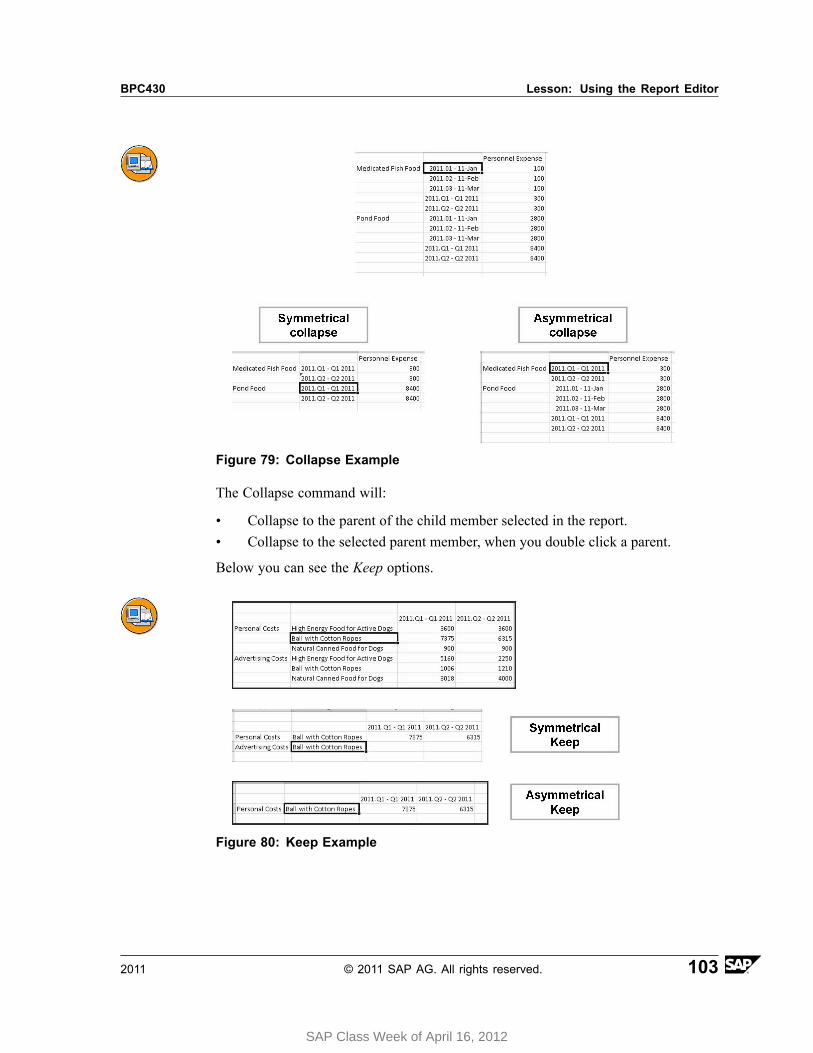
BPC430 Lesson: Using the Report Editor
Figure 79: Collapse Example
The Collapse command will:
• Collapse to the parent of the child member selected in the report.• Collapse to the selected parent member, when you double click a parent.
Below you can see the Keep options.
Figure 80: Keep Example
2011 © 2011 SAP AG. All rights reserved. 103
SAP Class Week of April 16, 2012
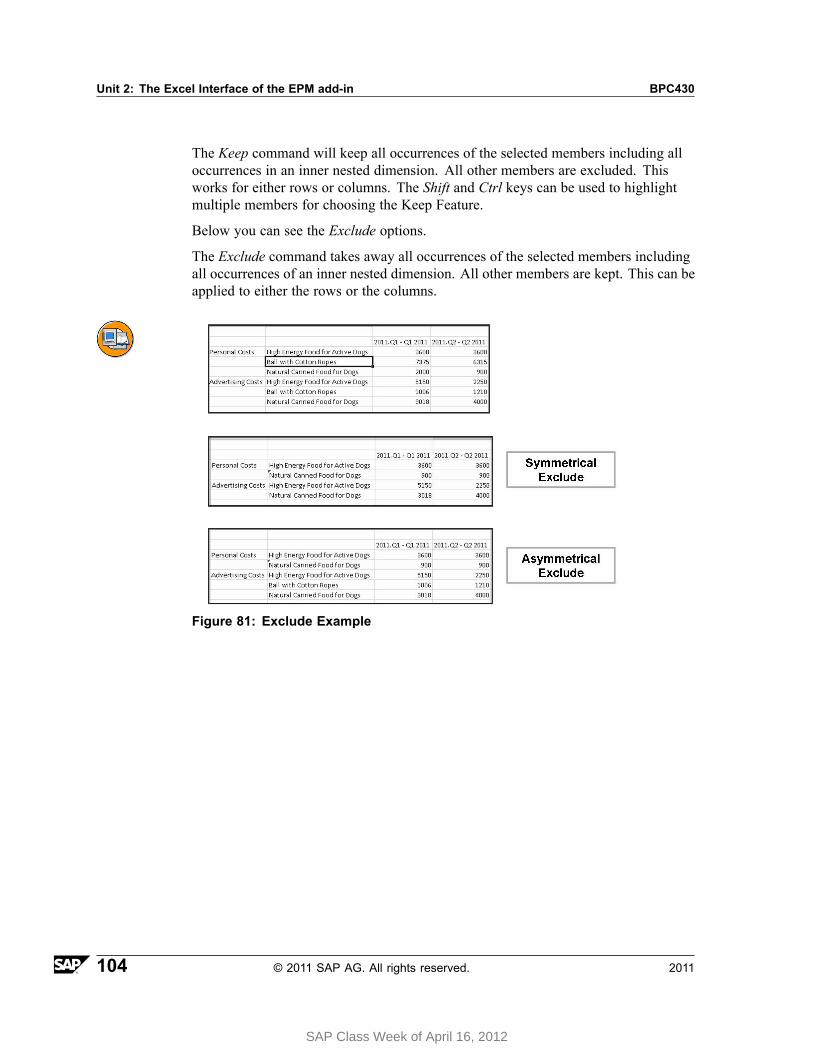
Unit 2: The Excel Interface of the EPM add-in BPC430
The Keep command will keep all occurrences of the selected members including alloccurrences in an inner nested dimension. All other members are excluded. Thisworks for either rows or columns. The Shift and Ctrl keys can be used to highlightmultiple members for choosing the Keep Feature.
Below you can see the Exclude options.
The Exclude command takes away all occurrences of the selected members includingall occurrences of an inner nested dimension. All other members are kept. This can beapplied to either the rows or the columns.
Figure 81: Exclude Example
104 © 2011 SAP AG. All rights reserved. 2011
SAP Class Week of April 16, 2012
BPC430 Lesson: Using the Report Editor
Exercise 2: Data Analysis: Expand,Collapse, Keep, Exclude
Exercise ObjectivesAfter completing this exercise, you will be able to:• You want to learn how to work with the Data Analysis features on the EPM
add-in ribbon.
Business ExampleThe users want a quick way to analyze different dimension members as they workwith the data.
Task:You will work with the Data Analysis options of the EPM add-in ribbon.
1. Create a connection to the Sales Model for your assigned Environment and makesure your EPM Context bar and EPM Pane are displayed.
Open native Excel. Go to the EPM ribbon and Log On.
Create a connection with server URL: http://wd-flbmt7122.wdf.sap.corp:54080/sap/bpc/ (no dashes). Let the system generateyour connection name.
2. Ensure the Sales Connection is selected.
3. Set your context:
4. Use the EPM Pane to create a new report.
5. Display only the IDs in the result set.
6. Set your defaults in the Sheet Options to expand to Children and the UserOptions to Expand/Collapse on Single Member and Keep/Exclude on SingleMember.
7. Work with the Expand and Collapse features for 2009 Q1.
8. Work with the Keep feature for 2009 Q1.
9. Work with the Exclude feature for 2009 Q1.
10. Change your User options so that when you Expand, Collapse, Keep, or Exclude,you do so for all like members for that dimension.
Continued on next page
2011 © 2011 SAP AG. All rights reserved. 105
SAP Class Week of April 16, 2012

Unit 2: The Excel Interface of the EPM add-in BPC430
11. Use the Expand and Collapse features with the new User Options for 2009 Q1.
12. Use the Keep feature with the new User Options for 2009 Q2.
13. Save your Report.
106 © 2011 SAP AG. All rights reserved. 2011
SAP Class Week of April 16, 2012
BPC430 Lesson: Using the Report Editor
Solution 2: Data Analysis: Expand,Collapse, Keep, ExcludeTask:You will work with the Data Analysis options of the EPM add-in ribbon.
1. Create a connection to the Sales Model for your assigned Environment and makesure your EPM Context bar and EPM Pane are displayed.
Open native Excel. Go to the EPM ribbon and Log On.
Create a connection with server URL: http://wd-flbmt7122.wdf.sap.corp:54080/sap/bpc/ (no dashes). Let the system generateyour connection name.
a) From your remote desktop, choose the Start menu, and choose: Programs→ Microsoft Office → Microsoft Office Excel 2007
Excel opens and displays a new worksheet.
b) Choose the EPM tab → Log On.
The EPM - Logon window is displayed.
c) To the right of the Connection field, choose the Ellipse (...) button.
The EPM - Connection Manager window opens.
d) Choose the Create button.
The Create Connection window appears.
e) In the Server URL field, type: http://wd-flbmt7122.wdf.sap.corp:54080/sap/bpc/ (no dashes) as shown below.
Continued on next page
2011 © 2011 SAP AG. All rights reserved. 107
SAP Class Week of April 16, 2012

Unit 2: The Excel Interface of the EPM add-in BPC430
Figure 82: Create Connection
f) Choose Connect.
g) Enter your user ID and password to create the connection.
User ID Password
BPC-## training
h) Choose Logon.
Environments and Models are loaded.
i) Use the dropdown to select your Environment and Model.
Environment Model
Your assigned Environment Sales
j) Choose Generate Connection Name.Continued on next page
108 © 2011 SAP AG. All rights reserved. 2011
SAP Class Week of April 16, 2012
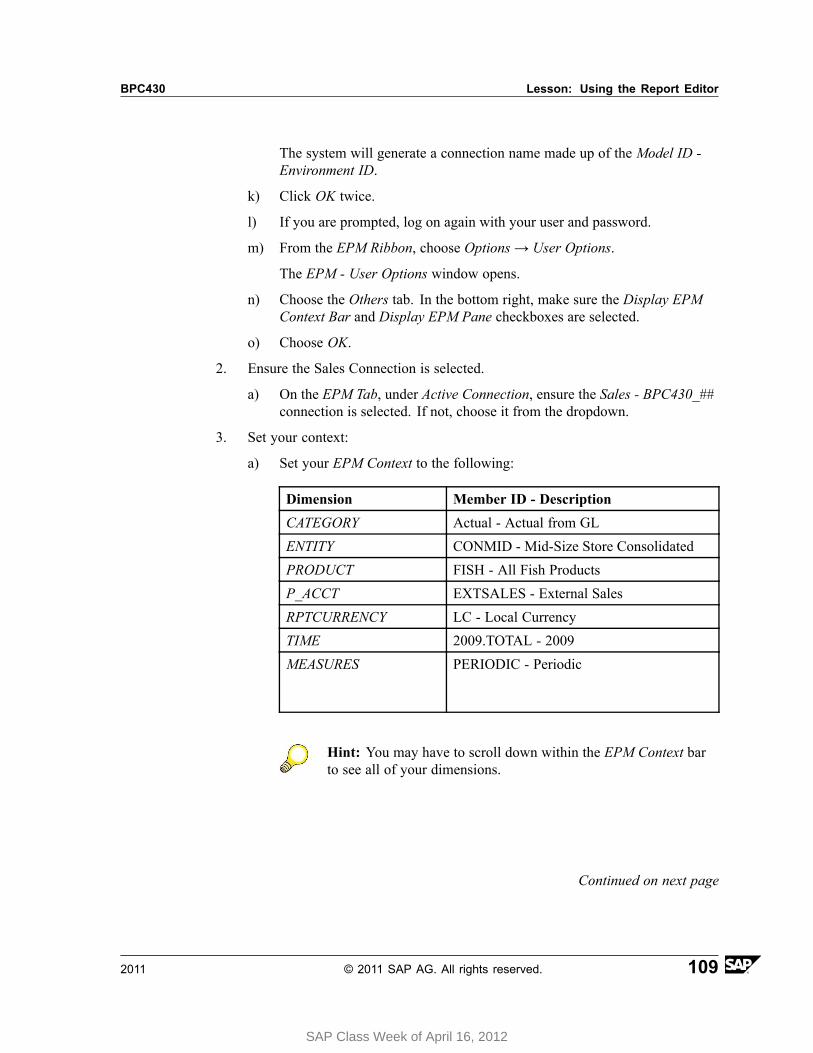
BPC430 Lesson: Using the Report Editor
The system will generate a connection name made up of the Model ID -Environment ID.
k) Click OK twice.
l) If you are prompted, log on again with your user and password.
m) From the EPM Ribbon, choose Options → User Options.
The EPM - User Options window opens.
n) Choose the Others tab. In the bottom right, make sure the Display EPMContext Bar and Display EPM Pane checkboxes are selected.
o) Choose OK.
2. Ensure the Sales Connection is selected.
a) On the EPM Tab, under Active Connection, ensure the Sales - BPC430_##connection is selected. If not, choose it from the dropdown.
3. Set your context:
a) Set your EPM Context to the following:
Dimension Member ID - Description
CATEGORY Actual - Actual from GL
ENTITY CONMID - Mid-Size Store Consolidated
PRODUCT FISH - All Fish Products
P_ACCT EXTSALES - External Sales
RPTCURRENCY LC - Local Currency
TIME 2009.TOTAL - 2009
MEASURES PERIODIC - Periodic
Hint: You may have to scroll down within the EPM Context barto see all of your dimensions.
Continued on next page
2011 © 2011 SAP AG. All rights reserved. 109
SAP Class Week of April 16, 2012
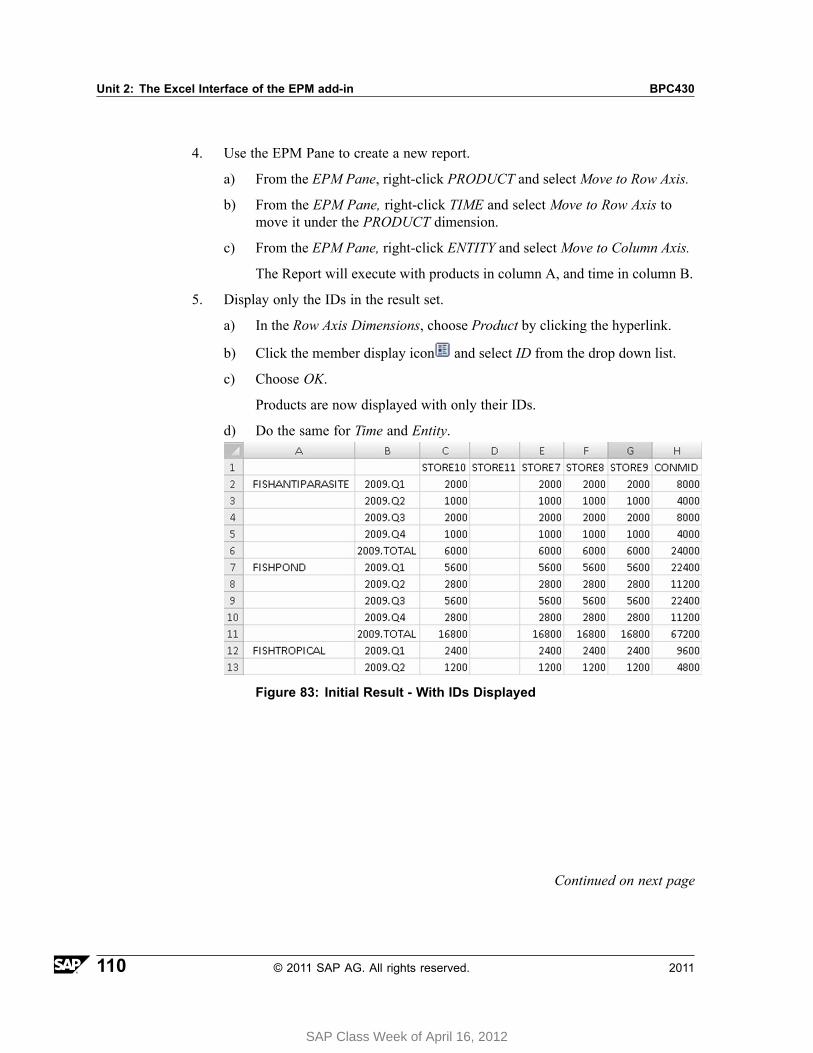
Unit 2: The Excel Interface of the EPM add-in BPC430
4. Use the EPM Pane to create a new report.
a) From the EPM Pane, right-click PRODUCT and select Move to Row Axis.
b) From the EPM Pane, right-click TIME and select Move to Row Axis tomove it under the PRODUCT dimension.
c) From the EPM Pane, right-click ENTITY and select Move to Column Axis.
The Report will execute with products in column A, and time in column B.
5. Display only the IDs in the result set.
a) In the Row Axis Dimensions, choose Product by clicking the hyperlink.
b) Click the member display icon and select ID from the drop down list.
c) Choose OK.
Products are now displayed with only their IDs.
d) Do the same for Time and Entity.
Figure 83: Initial Result - With IDs Displayed
Continued on next page
110 © 2011 SAP AG. All rights reserved. 2011
SAP Class Week of April 16, 2012
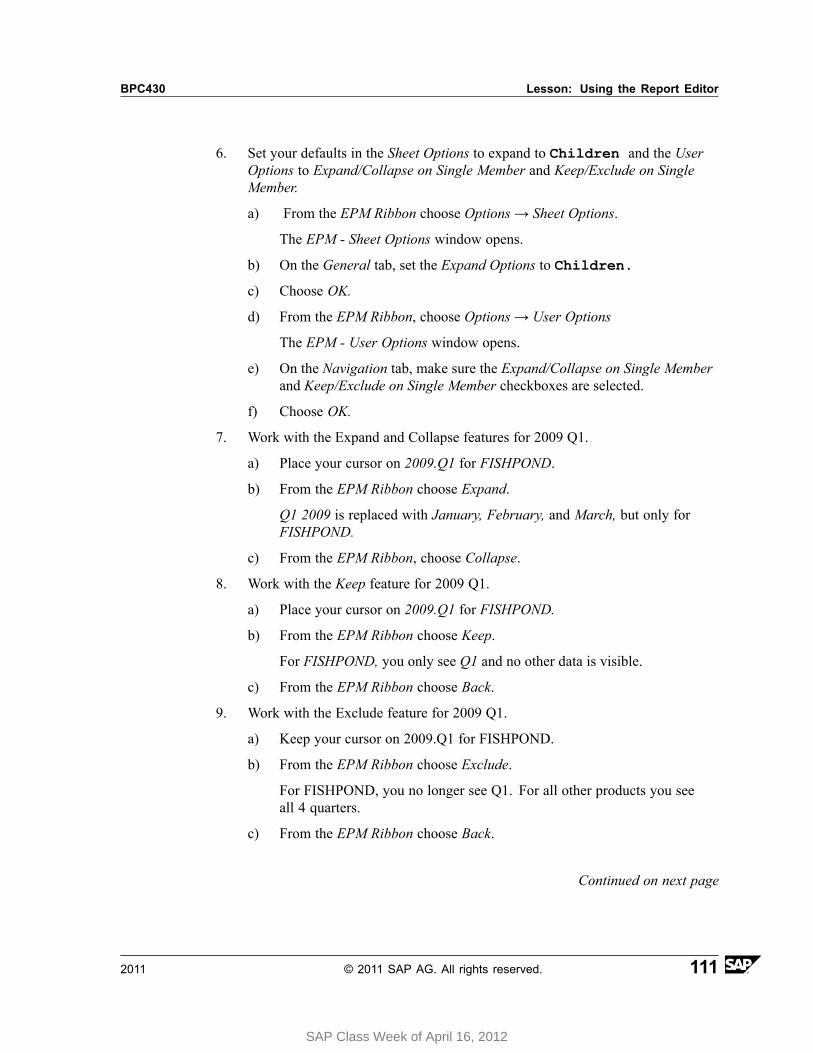
BPC430 Lesson: Using the Report Editor
6. Set your defaults in the Sheet Options to expand to Children and the UserOptions to Expand/Collapse on Single Member and Keep/Exclude on SingleMember.
a) From the EPM Ribbon choose Options → Sheet Options.
The EPM - Sheet Options window opens.
b) On the General tab, set the Expand Options to Children.
c) Choose OK.
d) From the EPM Ribbon, choose Options → User Options
The EPM - User Options window opens.
e) On the Navigation tab, make sure the Expand/Collapse on Single Memberand Keep/Exclude on Single Member checkboxes are selected.
f) Choose OK.
7. Work with the Expand and Collapse features for 2009 Q1.
a) Place your cursor on 2009.Q1 for FISHPOND.
b) From the EPM Ribbon choose Expand.
Q1 2009 is replaced with January, February, and March, but only forFISHPOND.
c) From the EPM Ribbon, choose Collapse.
8. Work with the Keep feature for 2009 Q1.
a) Place your cursor on 2009.Q1 for FISHPOND.
b) From the EPM Ribbon choose Keep.
For FISHPOND, you only see Q1 and no other data is visible.
c) From the EPM Ribbon choose Back.
9. Work with the Exclude feature for 2009 Q1.
a) Keep your cursor on 2009.Q1 for FISHPOND.
b) From the EPM Ribbon choose Exclude.
For FISHPOND, you no longer see Q1. For all other products you seeall 4 quarters.
c) From the EPM Ribbon choose Back.
Continued on next page
2011 © 2011 SAP AG. All rights reserved. 111
SAP Class Week of April 16, 2012
Unit 2: The Excel Interface of the EPM add-in BPC430
10. Change your User options so that when you Expand, Collapse, Keep, or Exclude,you do so for all like members for that dimension.
a) From the EPM Ribbon choose Options → User Options.
The EPM - User Options window opens on the Navigation tab.
b) Deselect Expand/Collapse on Single Member.
c) Deselect the Keep/Exclude on Single Member.
d) Select the Enable Double Click checkbox. (It may already be selected.)
e) Choose OK.
11. Use the Expand and Collapse features with the new User Options for 2009 Q1.
a) Place your cursor on 2009.Q1 for FISHPOND and double click.
Q1 2009 is replaced with January, February, and March for all products.
b) Choose Back.
12. Use the Keep feature with the new User Options for 2009 Q2.
a) Place your cursor on 2009.Q2 for FISHPOND.
b) Choose Keep.
You will see Q2 for all FISH products.
Figure 84: Q2 For All Fish Products
13. Save your Report.
a) From the EPM Ribbon choose Save → Save to Server Root Folder.
b) Choose Company (Public) then Reports
c) For the File Name, enter GR## Report Editor.
d) Choose Save.
112 © 2011 SAP AG. All rights reserved. 2011
SAP Class Week of April 16, 2012
BPC430 Lesson: Using the Report Editor
Exercise 3: Sorting, Filtering, and Ranking.
Exercise ObjectivesAfter completing this exercise, you will be able to:• Use the Sorting, Filtering, and Ranking options in your report.
Business ExampleYou would like to analyze the results of your report by sorting, filtering, and ranking.
Task 1:Sort the results of your previously created report based on the 2011 total sales.
1. Go to the Excel client for your Sales model in your BPC430_## environment.
Note: If you do not have a connection for the Sales model, use theinstructions in Exercise #2 to create it.
Note: If you are ALREADY in Excel, go to Step #2.
2. Create a new blank workbook.
3. Choose the Sales - BPC430_## Connection
4. Set your context for the Sales model.
5. Create a new report with product in the rows, and time in the columns, usingthe EPM Pane.
6. From the EPM Pane, select Member and Children for the Bird and Dog parents.
7. From the EPM Pane, select Member and Children for Time.
8. Open the EPM - Report Editor to sort the results of your report.
9. You realize the dog products are mixed in with the bird products. You would liketo sort the values, but keep the products within their groups.
10. Stay in the report for the next Task.
Continued on next page
2011 © 2011 SAP AG. All rights reserved. 113
SAP Class Week of April 16, 2012
Unit 2: The Excel Interface of the EPM add-in BPC430
Task 2:Filter the results of your report based on the products that have greater than 200,000 insales in 2011.
1. Open the EPM - Report Editor to filter the results of your report.
2. Remove the filter
Task 3:Rank the results of your report to determine the top 3 selling products in 2011.
1. Open the EPM - Report Editor to rank the results of your report.
2. Save your Report.
114 © 2011 SAP AG. All rights reserved. 2011
SAP Class Week of April 16, 2012
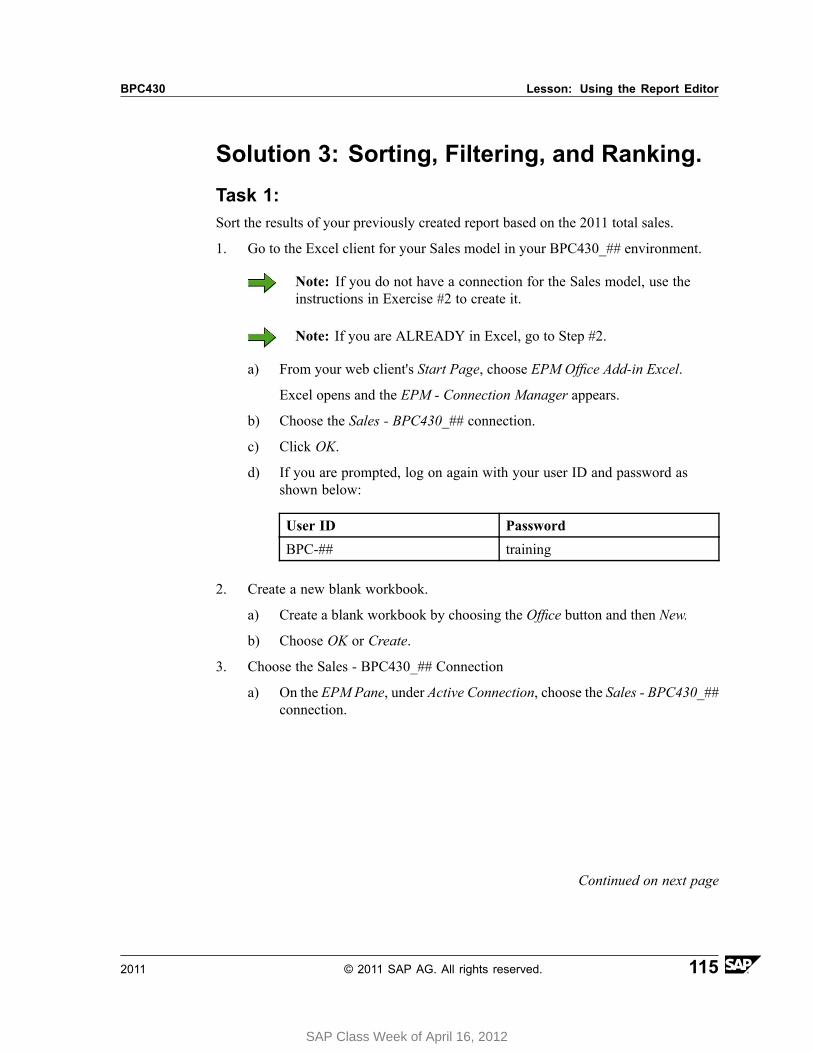
BPC430 Lesson: Using the Report Editor
Solution 3: Sorting, Filtering, and Ranking.Task 1:Sort the results of your previously created report based on the 2011 total sales.
1. Go to the Excel client for your Sales model in your BPC430_## environment.
Note: If you do not have a connection for the Sales model, use theinstructions in Exercise #2 to create it.
Note: If you are ALREADY in Excel, go to Step #2.
a) From your web client's Start Page, choose EPM Office Add-in Excel.
Excel opens and the EPM - Connection Manager appears.
b) Choose the Sales - BPC430_## connection.
c) Click OK.
d) If you are prompted, log on again with your user ID and password asshown below:
User ID Password
BPC-## training
2. Create a new blank workbook.
a) Create a blank workbook by choosing the Office button and then New.
b) Choose OK or Create.
3. Choose the Sales - BPC430_## Connection
a) On the EPM Pane, under Active Connection, choose the Sales - BPC430_##connection.
Continued on next page
2011 © 2011 SAP AG. All rights reserved. 115
SAP Class Week of April 16, 2012

Unit 2: The Excel Interface of the EPM add-in BPC430
4. Set your context for the Sales model.
a) Set your EPM Context to the following:
Dimension Member ID - Description
CATEGORY Actual - Actual from GL
ENTITY CONMID - Mid-Size Store Consolidated
PRODUCT FISH - All Fish Products
P_ACCT EXTSALES - External Sales
RPTCURRENCY LC - Local Currency
TIME 2011.TOTAL - 2011
MEASURES PERIODIC - Periodic
5. Create a new report with product in the rows, and time in the columns, usingthe EPM Pane.
a) In the EPM Pane, right-click Product and select Move to Row Axis.
b) Right-click Time and select Move to Column Axis.
The Report is executed.
6. From the EPM Pane, select Member and Children for the Bird and Dog parents.
a) In the Row Axis , choose Product.
The EPM - Member Selector opens.
b) Click the member display icon, and select ID.
When you run the report with this setting, only the IDs will appear in thereport.
c) Select BIRD and DOG by selecting the checkbox to the left of each of them.
d) Under Selection Relationship, select Member and Children.
e) Choose the blue right arrow to move the selection to Selected Members.Choose the blue left arrow to remove the prior selection which is alreadyhighlighted.
f) Choose OK.
Continued on next page
116 © 2011 SAP AG. All rights reserved. 2011
SAP Class Week of April 16, 2012

BPC430 Lesson: Using the Report Editor
7. From the EPM Pane, select Member and Children for Time.
a) In the Column Axis, choose Time.
The EPM - Member Selector opens.
b) Click the member display icon, and select ID.
c) Select 2011 by selecting the checkbox to the left of it.
d) Under Selection Relationship, select Member and Children.
e) Choose the right arrow to move the selection to Selected Members.Choose the blue left arrow to remove the prior selection which is alreadyhighlighted.
f) Choose OK.
The report is executed with the new selections.
8. Open the EPM - Report Editor to sort the results of your report.
a) From the EPM Ribbon, choose Edit Report.
b) Choose the Sorting tab.
c) Select Sort data Using the Following Criteria.
d) Under Sorting Criteria, select the radio button for Last Column
e) Leave the checkbox for Show Only Members Displayed in the Reportselected as well as the radio button Ascending selections.
Figure 85: Sorting Criteria
f) Choose OK.
Your report is now in ascending order according to the product sales for2011.
Continued on next page
2011 © 2011 SAP AG. All rights reserved. 117
SAP Class Week of April 16, 2012
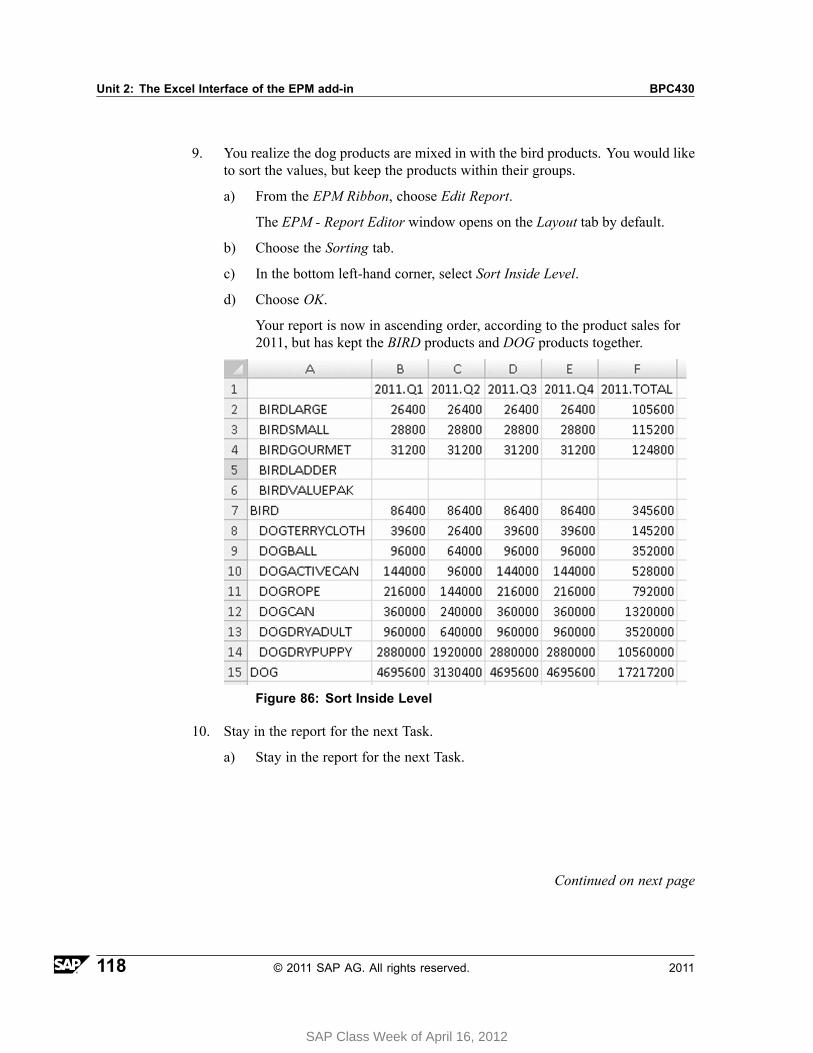
Unit 2: The Excel Interface of the EPM add-in BPC430
9. You realize the dog products are mixed in with the bird products. You would liketo sort the values, but keep the products within their groups.
a) From the EPM Ribbon, choose Edit Report.
The EPM - Report Editor window opens on the Layout tab by default.
b) Choose the Sorting tab.
c) In the bottom left-hand corner, select Sort Inside Level.
d) Choose OK.
Your report is now in ascending order, according to the product sales for2011, but has kept the BIRD products and DOG products together.
Figure 86: Sort Inside Level
10. Stay in the report for the next Task.
a) Stay in the report for the next Task.
Continued on next page
118 © 2011 SAP AG. All rights reserved. 2011
SAP Class Week of April 16, 2012
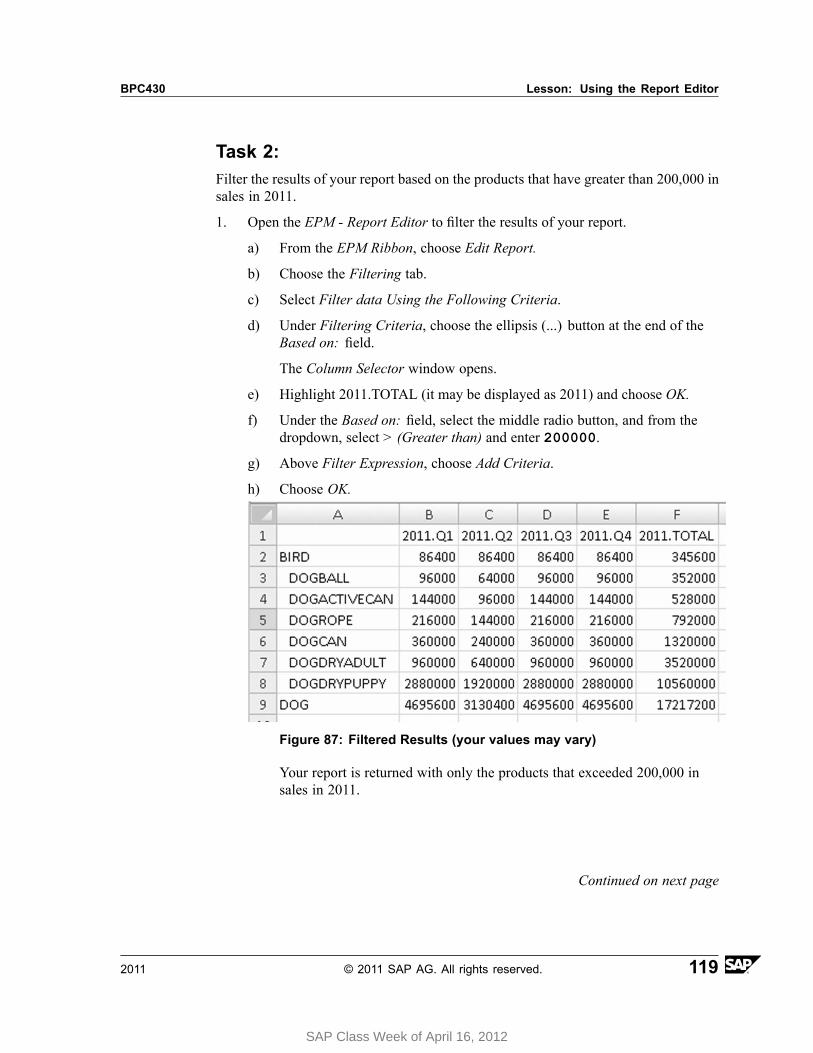
BPC430 Lesson: Using the Report Editor
Task 2:Filter the results of your report based on the products that have greater than 200,000 insales in 2011.
1. Open the EPM - Report Editor to filter the results of your report.
a) From the EPM Ribbon, choose Edit Report.
b) Choose the Filtering tab.
c) Select Filter data Using the Following Criteria.
d) Under Filtering Criteria, choose the ellipsis (...) button at the end of theBased on: field.
The Column Selector window opens.
e) Highlight 2011.TOTAL (it may be displayed as 2011) and choose OK.
f) Under the Based on: field, select the middle radio button, and from thedropdown, select > (Greater than) and enter 200000.
g) Above Filter Expression, choose Add Criteria.
h) Choose OK.
Figure 87: Filtered Results (your values may vary)
Your report is returned with only the products that exceeded 200,000 insales in 2011.
Continued on next page
2011 © 2011 SAP AG. All rights reserved. 119
SAP Class Week of April 16, 2012

Unit 2: The Excel Interface of the EPM add-in BPC430
2. Remove the filter
a) From the EPM Ribbon, choose Edit Report.
b) Choose the Filtering tab.
c) Deselect Filter Data Using the Following Criteria.
d) Choose OK.
Your report is no longer filtered.
Continued on next page
120 © 2011 SAP AG. All rights reserved. 2011
SAP Class Week of April 16, 2012
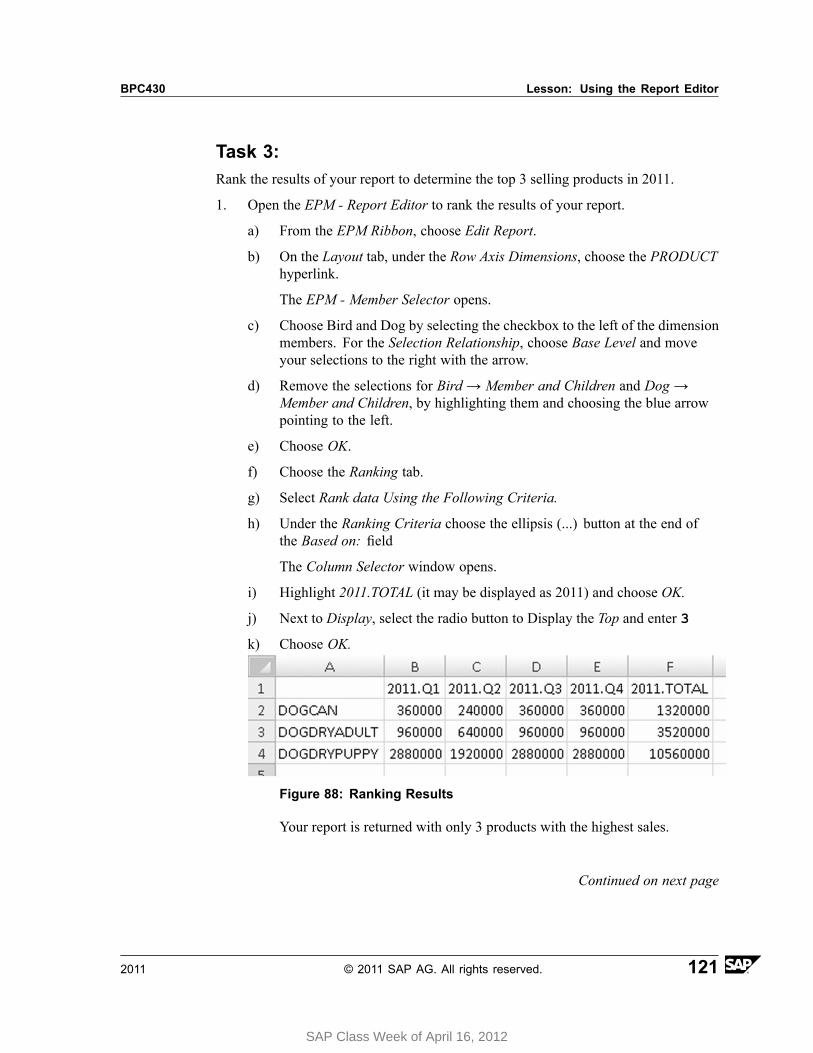
BPC430 Lesson: Using the Report Editor
Task 3:Rank the results of your report to determine the top 3 selling products in 2011.
1. Open the EPM - Report Editor to rank the results of your report.
a) From the EPM Ribbon, choose Edit Report.
b) On the Layout tab, under the Row Axis Dimensions, choose the PRODUCThyperlink.
The EPM - Member Selector opens.
c) Choose Bird and Dog by selecting the checkbox to the left of the dimensionmembers. For the Selection Relationship, choose Base Level and moveyour selections to the right with the arrow.
d) Remove the selections for Bird → Member and Children and Dog →Member and Children, by highlighting them and choosing the blue arrowpointing to the left.
e) Choose OK.
f) Choose the Ranking tab.
g) Select Rank data Using the Following Criteria.
h) Under the Ranking Criteria choose the ellipsis (...) button at the end ofthe Based on: field
The Column Selector window opens.
i) Highlight 2011.TOTAL (it may be displayed as 2011) and choose OK.
j) Next to Display, select the radio button to Display the Top and enter 3
k) Choose OK.
Figure 88: Ranking Results
Your report is returned with only 3 products with the highest sales.
Continued on next page
2011 © 2011 SAP AG. All rights reserved. 121
SAP Class Week of April 16, 2012

Unit 2: The Excel Interface of the EPM add-in BPC430
2. Save your Report.
a) From the EPM Ribbon, choose Save → Save to Server Root Folder
b) Choose Company(Public), then choose Reports.
c) For the File Name, enter GR## Top 3 Products.
d) Choose Save.
122 © 2011 SAP AG. All rights reserved. 2011
SAP Class Week of April 16, 2012
BPC430 Lesson: Using the Report Editor
Exercise 4: Excluding and RenamingMembers
Exercise ObjectivesAfter completing this exercise, you will be able to:• Use the EPM - Report Editor to change member names and exclude members.
Business ExampleThe users of your reports request that you change the member names to somethingmore meaningful. Additionally, for certain data analysis, you require the exclusion ofcertain members.
Task 1:Open your previously created report to use the exclude members feature.
1. Go to the Excel client for your Sales model in your BPC430_## environment.
Note: If you do not have a connection for the Sales model, use theinstructions in Exercise #2 to create it.
Note: If you are ALREADY in Excel, go to Step #2.
2. Open the GR## Top 3 Products report.
3. Open the EPM - Report Editor and exclude DOGDRYPUPPY.
Task 2:In this exercise, you will create a new report and change some dimension membernames using the EPM - Report Editor.
1. Create a new blank workbook.
2. On the EPM - Pane, select the Sales - BPC430_## connection.
3. Set your context:
4. Use the EPM Report Editor to create a new report and change the Categoryand P_ACCT dimension member names to be more meaningful to your users.Change the Category member Actual from GL to Actual and theP_ACCT member from External Sales to Revenue.
5. Close the report without saving.
2011 © 2011 SAP AG. All rights reserved. 123
SAP Class Week of April 16, 2012
Unit 2: The Excel Interface of the EPM add-in BPC430
Solution 4: Excluding and RenamingMembersTask 1:Open your previously created report to use the exclude members feature.
1. Go to the Excel client for your Sales model in your BPC430_## environment.
Note: If you do not have a connection for the Sales model, use theinstructions in Exercise #2 to create it.
Note: If you are ALREADY in Excel, go to Step #2.
a) From your web client's Start Page, choose EPM Office Add-in Excel.
Excel opens and the EPM - Connection Manager appears.
b) Choose the Sales - BPC430_## connection.
c) Click OK.
d) If you are prompted, log on again with your user ID and password asshown below:
User ID Password
BPC-## training
Continued on next page
124 © 2011 SAP AG. All rights reserved. 2011
SAP Class Week of April 16, 2012
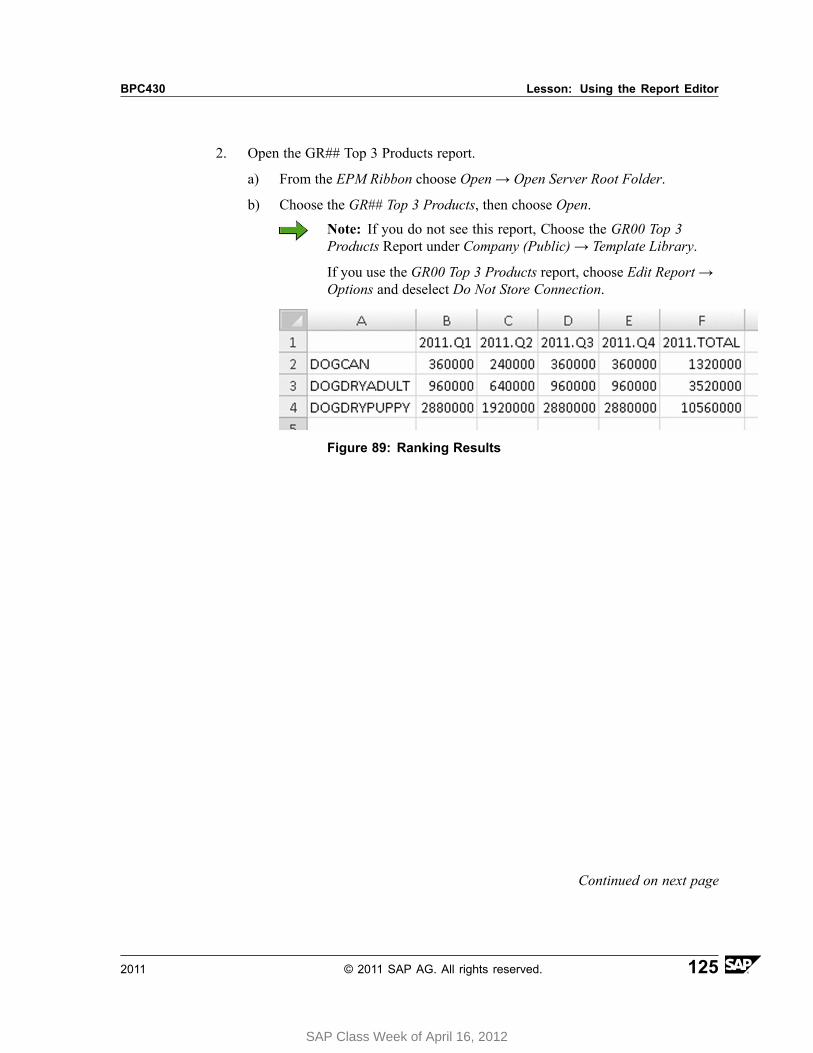
BPC430 Lesson: Using the Report Editor
2. Open the GR## Top 3 Products report.
a) From the EPM Ribbon choose Open → Open Server Root Folder.
b) Choose the GR## Top 3 Products, then choose Open.
Note: If you do not see this report, Choose the GR00 Top 3Products Report under Company (Public) → Template Library.
If you use the GR00 Top 3 Products report, choose Edit Report →Options and deselect Do Not Store Connection.
Figure 89: Ranking Results
Continued on next page
2011 © 2011 SAP AG. All rights reserved. 125
SAP Class Week of April 16, 2012
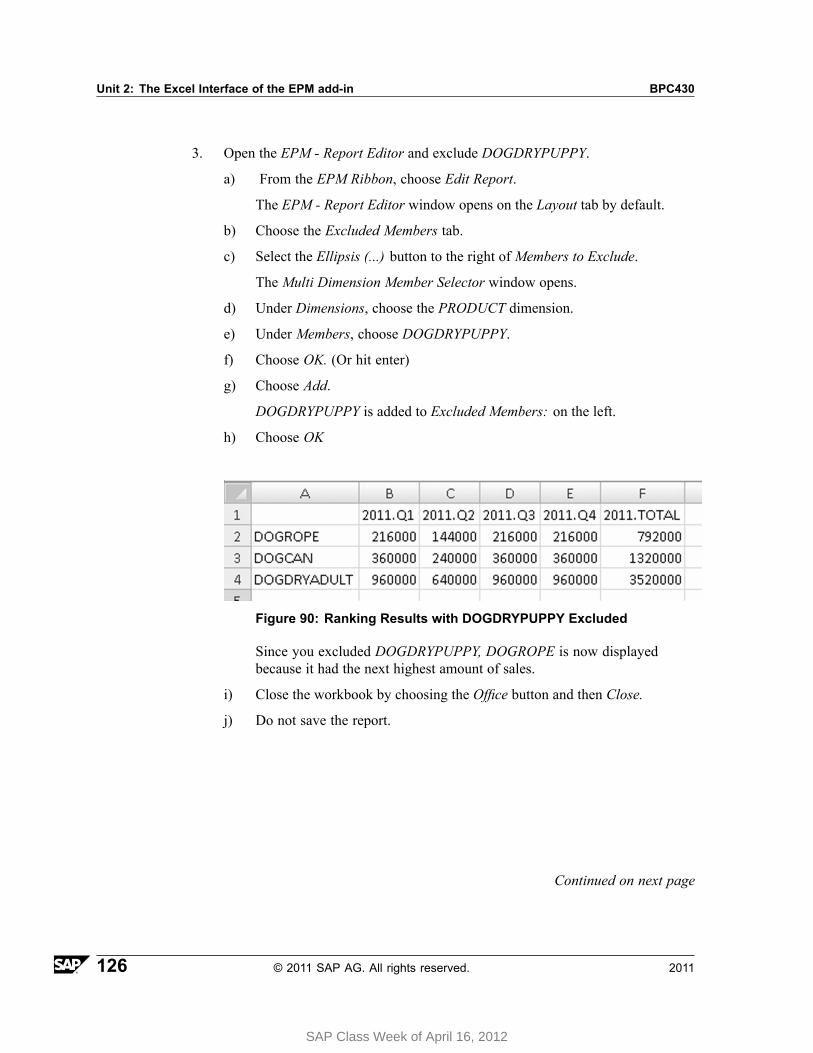
Unit 2: The Excel Interface of the EPM add-in BPC430
3. Open the EPM - Report Editor and exclude DOGDRYPUPPY.
a) From the EPM Ribbon, choose Edit Report.
The EPM - Report Editor window opens on the Layout tab by default.
b) Choose the Excluded Members tab.
c) Select the Ellipsis (...) button to the right of Members to Exclude.
The Multi Dimension Member Selector window opens.
d) Under Dimensions, choose the PRODUCT dimension.
e) Under Members, choose DOGDRYPUPPY.
f) Choose OK. (Or hit enter)
g) Choose Add.
DOGDRYPUPPY is added to Excluded Members: on the left.
h) Choose OK
Figure 90: Ranking Results with DOGDRYPUPPY Excluded
Since you excluded DOGDRYPUPPY, DOGROPE is now displayedbecause it had the next highest amount of sales.
i) Close the workbook by choosing the Office button and then Close.
j) Do not save the report.
Continued on next page
126 © 2011 SAP AG. All rights reserved. 2011
SAP Class Week of April 16, 2012
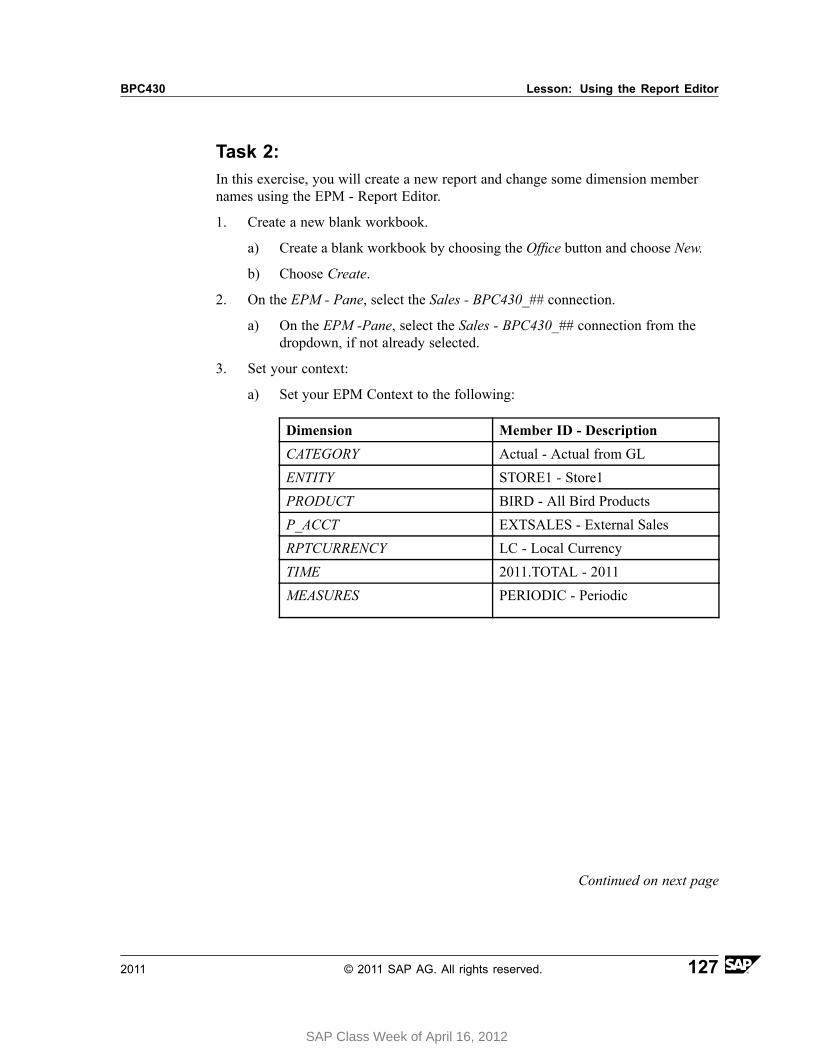
BPC430 Lesson: Using the Report Editor
Task 2:In this exercise, you will create a new report and change some dimension membernames using the EPM - Report Editor.
1. Create a new blank workbook.
a) Create a blank workbook by choosing the Office button and choose New.
b) Choose Create.
2. On the EPM - Pane, select the Sales - BPC430_## connection.
a) On the EPM -Pane, select the Sales - BPC430_## connection from thedropdown, if not already selected.
3. Set your context:
a) Set your EPM Context to the following:
Dimension Member ID - Description
CATEGORY Actual - Actual from GL
ENTITY STORE1 - Store1
PRODUCT BIRD - All Bird Products
P_ACCT EXTSALES - External Sales
RPTCURRENCY LC - Local Currency
TIME 2011.TOTAL - 2011
MEASURES PERIODIC - Periodic
Continued on next page
2011 © 2011 SAP AG. All rights reserved. 127
SAP Class Week of April 16, 2012
Unit 2: The Excel Interface of the EPM add-in BPC430
4. Use the EPM Report Editor to create a new report and change the Categoryand P_ACCT dimension member names to be more meaningful to your users.Change the Category member Actual from GL to Actual and theP_ACCT member from External Sales to Revenue.
a) From the EPM Ribbon, choose New Report.
The EPM - Report Editor window opens on the Layout tab by default.
b) Drag and drop the P_ACCT dimension to the Row Axis Dimensions.
c) Drag and drop the Category dimension to the Column Axis Dimensions.
d) Choose the Member Names tab.
e) Under the Dimensions area, highlight CATEGORY and under the Membersarea highlight ACTUAL - Actual from GL.
f) In the Enter a name for the member: field, enter Actual.
g) Choose Override.
Under Members, the value changes to Actual and is listed below with itsoriginal and customized name.
h) Under the Dimensions area highlight P_ACCT and under theMembers areahighlight EXTSALES - External Sales
i) In the Enter a name for the member: field type Revenue.
j) Choose Override.
Under Members, the value changes to Revenue.
k) Choose OK.
The Report is executed and your customized names are shown.
5. Close the report without saving.
a) Choose the Office button then choose Close.
b) Do not save the report.
128 © 2011 SAP AG. All rights reserved. 2011
SAP Class Week of April 16, 2012

BPC430 Lesson: Using the Report Editor
Lesson Summary
You should now be able to:• Use the EPM add-in Report Editor features, such as the Layout, Options, Sort,
Rank, and Filter.
2011 © 2011 SAP AG. All rights reserved. 129
SAP Class Week of April 16, 2012
Unit 2: The Excel Interface of the EPM add-in BPC430
Lesson: Using The Member Selector
Lesson OverviewThis lesson will deal with the Member Selector.
Lesson ObjectivesAfter completing this lesson, you will be able to:
• Explain member relationships• Describe expansions• Efficiently control members displayed in result sets
Business ExampleYou want to determine how to control what dimension members appear in your report.
Member SelectorThe Member Selector determines what members appear in the rows and columnsof your report.
Opening the EPM - Member Selector window.
• From the EPM Pane• From the EPM Report Editor window• From the EPM Context bar• From the worksheet for dimensions in the page axis
By default, the member taken into account for a dimension is the one defined in theEPM Context, with theMember and Children relationship. Once a dimension hasbeen added to an axis section, you can select another member or relationship forthe dimension by clicking the dimension name that appears as a link. The MemberSelector window opens and you can select the member and relationship for whichyou want the report to display.
There are various ways to open the Member Selector.
130 © 2011 SAP AG. All rights reserved. 2011
SAP Class Week of April 16, 2012
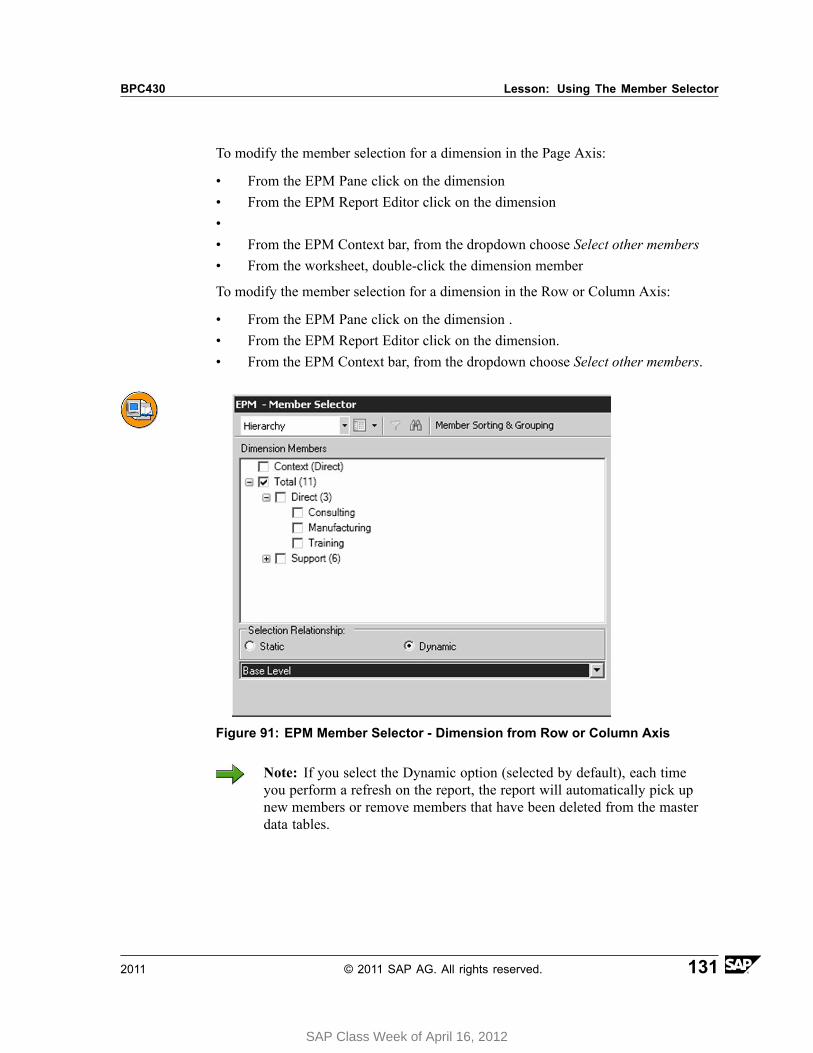
BPC430 Lesson: Using The Member Selector
To modify the member selection for a dimension in the Page Axis:
• From the EPM Pane click on the dimension• From the EPM Report Editor click on the dimension•• From the EPM Context bar, from the dropdown choose Select other members• From the worksheet, double-click the dimension member
To modify the member selection for a dimension in the Row or Column Axis:
• From the EPM Pane click on the dimension .• From the EPM Report Editor click on the dimension.• From the EPM Context bar, from the dropdown choose Select other members.
Figure 91: EPM Member Selector - Dimension from Row or Column Axis
Note: If you select the Dynamic option (selected by default), each timeyou perform a refresh on the report, the report will automatically pick upnew members or remove members that have been deleted from the masterdata tables.
2011 © 2011 SAP AG. All rights reserved. 131
SAP Class Week of April 16, 2012
Unit 2: The Excel Interface of the EPM add-in BPC430
The Member Selector is made up of the following:
• Hierarchy or List display: A dropdown list, which allows you to choose howyou would like to view the members
• Member names: How you would like to see the members. This depends on yourmodel/cube. For Planning and Consolidation: ID, Description, ID - Description
• Member filtering by properties: To help you select members, you can filter themembers by property value.
• Member Search: To search for a specific member• Member Sorting & Grouping button: Allows you to sort and group the selected
members base on the property values.• Dimension Members List: All the members/hierarchies of the current dimension.• Selected Members: Where you select and order the members of the currently
selected dimension to appear in your report• Selected Relationship: A dropdown list that allows you to select many members
at once, based on their relationship to the selected (checked) member.
Note: The dynamic radio button option will automatically pick upnew members or remove members each time you perform a refresh onthe report. For example, for the Entity Dimension, if you choose theHierarchy member US stores, and a new store is added to this hierarchymember, you will get this store automatically. If you select static, youwill only receive the original stores. Dynamic is selected by default.
• Hierarchy Levels: For some dynamic relationships, you can define the levels ofthe hierarchy you want to display in the Member Selector itself.
Members can be placed or removed from the Selected Members list using the buttonsrepresenting arrows. The arrow to the right button will copy the checked members,and any related members depending on the Selection Relationship choice, to thebottom of the selected members list. The left arrow button will remove the selectedmembers from the Selected Members list.
Note: From the Selected Members list you can use the Shift and Ctrlkeys to select multiple members for removal. You can also delete members byselecting them and hitting the delete key.
When selecting several members, the items will be displayed in the Selected Memberslist as the + operator (=OR) by default. You can select the & operator (=AND) so thatonly the members at the intersection of the different items are displayed in your report.
132 © 2011 SAP AG. All rights reserved. 2011
SAP Class Week of April 16, 2012
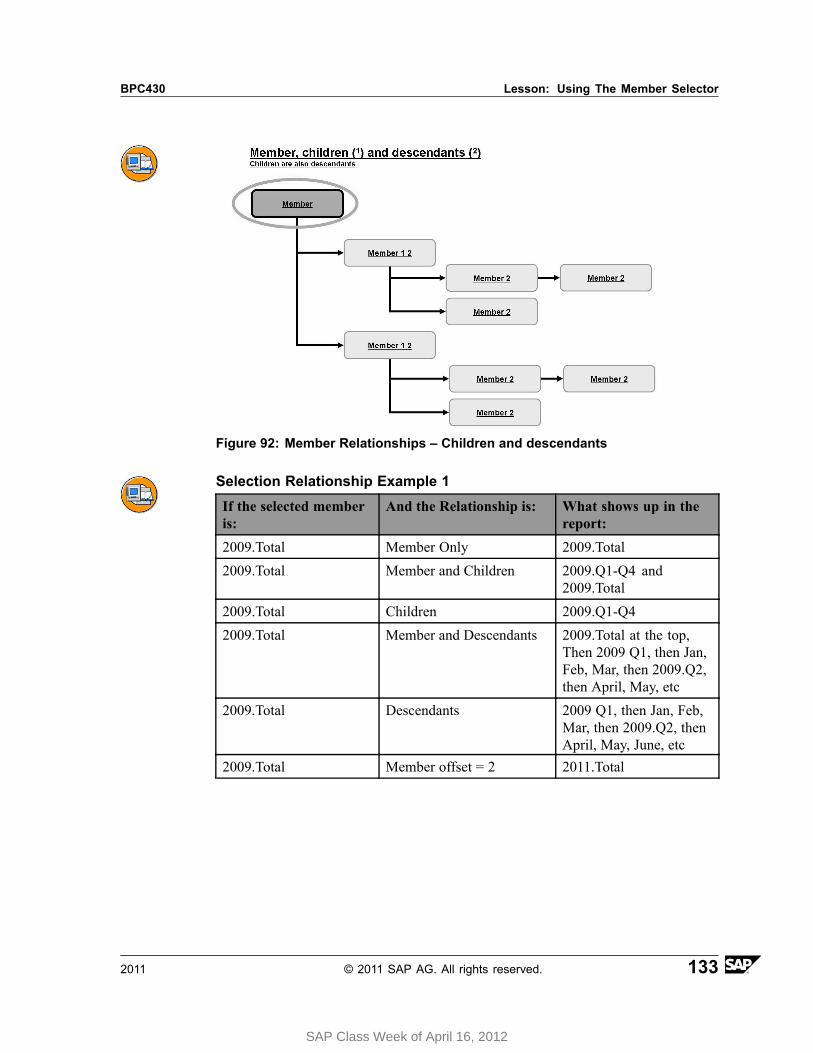
BPC430 Lesson: Using The Member Selector
Figure 92: Member Relationships – Children and descendants
Selection Relationship Example 1
If the selected memberis:
And the Relationship is: What shows up in thereport:
2009.Total Member Only 2009.Total
2009.Total Member and Children 2009.Q1-Q4 and2009.Total
2009.Total Children 2009.Q1-Q4
2009.Total Member and Descendants 2009.Total at the top,Then 2009 Q1, then Jan,Feb, Mar, then 2009.Q2,then April, May, etc
2009.Total Descendants 2009 Q1, then Jan, Feb,Mar, then 2009.Q2, thenApril, May, June, etc
2009.Total Member offset = 2 2011.Total
2011 © 2011 SAP AG. All rights reserved. 133
SAP Class Week of April 16, 2012
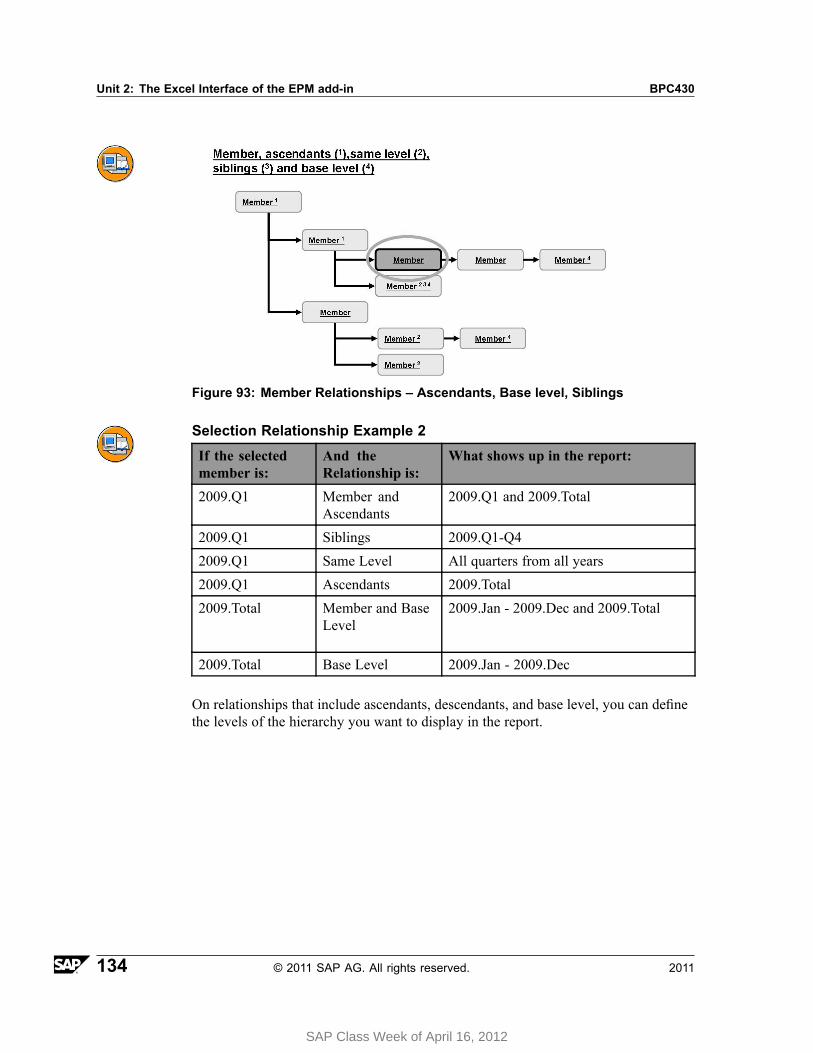
Unit 2: The Excel Interface of the EPM add-in BPC430
Figure 93: Member Relationships – Ascendants, Base level, Siblings
Selection Relationship Example 2
If the selectedmember is:
And theRelationship is:
What shows up in the report:
2009.Q1 Member andAscendants
2009.Q1 and 2009.Total
2009.Q1 Siblings 2009.Q1-Q4
2009.Q1 Same Level All quarters from all years
2009.Q1 Ascendants 2009.Total
2009.Total Member and BaseLevel
2009.Jan - 2009.Dec and 2009.Total
2009.Total Base Level 2009.Jan - 2009.Dec
On relationships that include ascendants, descendants, and base level, you can definethe levels of the hierarchy you want to display in the report.
134 © 2011 SAP AG. All rights reserved. 2011
SAP Class Week of April 16, 2012
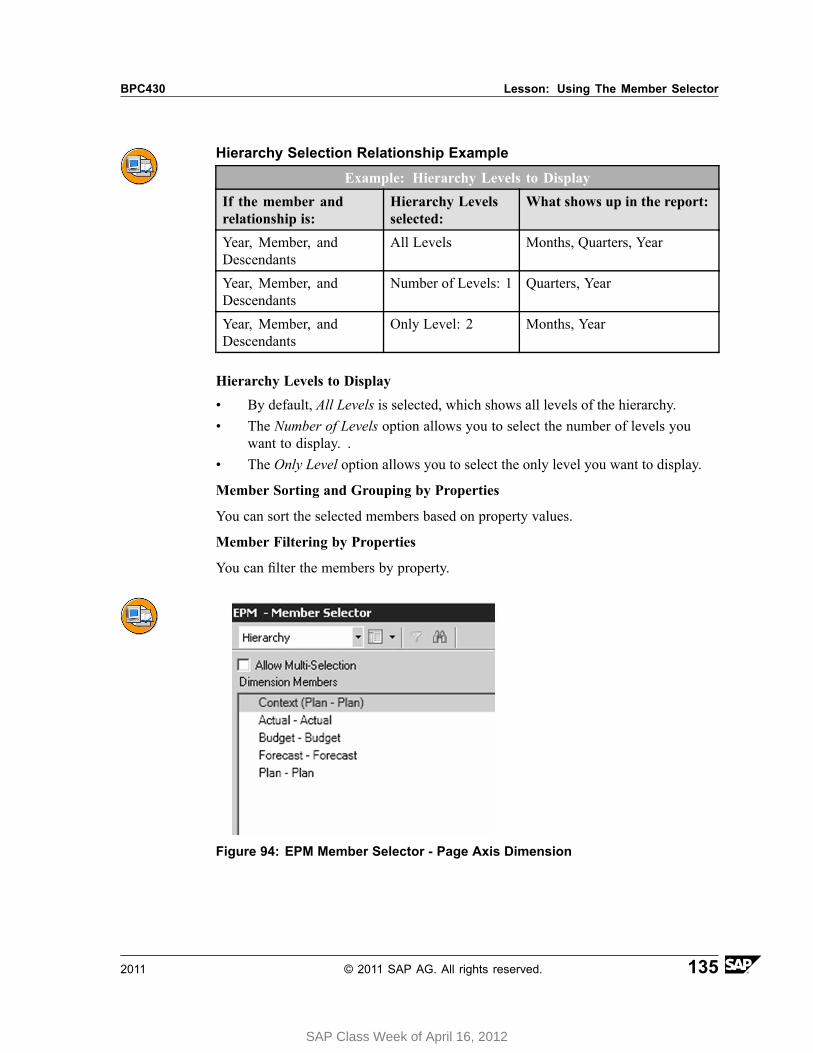
BPC430 Lesson: Using The Member Selector
Hierarchy Selection Relationship Example
Example: Hierarchy Levels to Display
If the member andrelationship is:
Hierarchy Levelsselected:
What shows up in the report:
Year, Member, andDescendants
All Levels Months, Quarters, Year
Year, Member, andDescendants
Number of Levels: 1 Quarters, Year
Year, Member, andDescendants
Only Level: 2 Months, Year
Hierarchy Levels to Display
• By default, All Levels is selected, which shows all levels of the hierarchy.• The Number of Levels option allows you to select the number of levels you
want to display. .• The Only Level option allows you to select the only level you want to display.
Member Sorting and Grouping by Properties
You can sort the selected members based on property values.
Member Filtering by Properties
You can filter the members by property.
Figure 94: EPM Member Selector - Page Axis Dimension
2011 © 2011 SAP AG. All rights reserved. 135
SAP Class Week of April 16, 2012
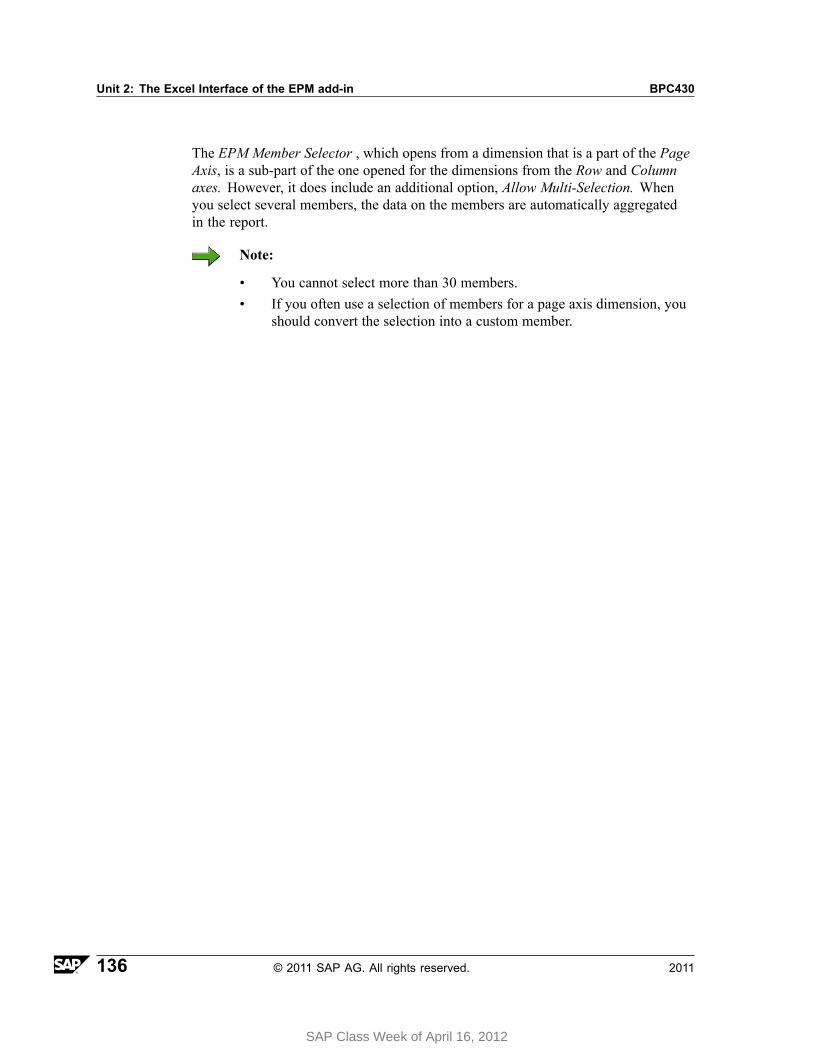
Unit 2: The Excel Interface of the EPM add-in BPC430
The EPM Member Selector , which opens from a dimension that is a part of the PageAxis, is a sub-part of the one opened for the dimensions from the Row and Columnaxes. However, it does include an additional option, Allow Multi-Selection. Whenyou select several members, the data on the members are automatically aggregatedin the report.
Note:
• You cannot select more than 30 members.• If you often use a selection of members for a page axis dimension, you
should convert the selection into a custom member.
136 © 2011 SAP AG. All rights reserved. 2011
SAP Class Week of April 16, 2012
BPC430 Lesson: Using The Member Selector
Lesson Summary
You should now be able to:• Explain member relationships• Describe expansions• Efficiently control members displayed in result sets
2011 © 2011 SAP AG. All rights reserved. 137
SAP Class Week of April 16, 2012

Unit 2: The Excel Interface of the EPM add-in BPC430
Lesson: Working With Member Recognition
Lesson OverviewThis lesson will explain how to use the Local Member Recognition and MemberRecognition functions.
Lesson ObjectivesAfter completing this lesson, you will be able to:
• Create a report using Member Recognition• Create a report using Local Member Recognition
Business ExampleIn addition to creating a report with the EPM Report Editor and the EPM Pane, youwould like to use the additional functionality available using automatic MemberRecognition. You would also like to add a local member to your created report so youcan retrieve the Account Type property for each Account displayed in your report.
Member RecognitionOn the EPM - Sheet Options window, you can turn on Member Recognition bychoosing the checkboxes for Activate Member Recognition and Activate LocalMember Recognition.
138 © 2011 SAP AG. All rights reserved. 2011
SAP Class Week of April 16, 2012
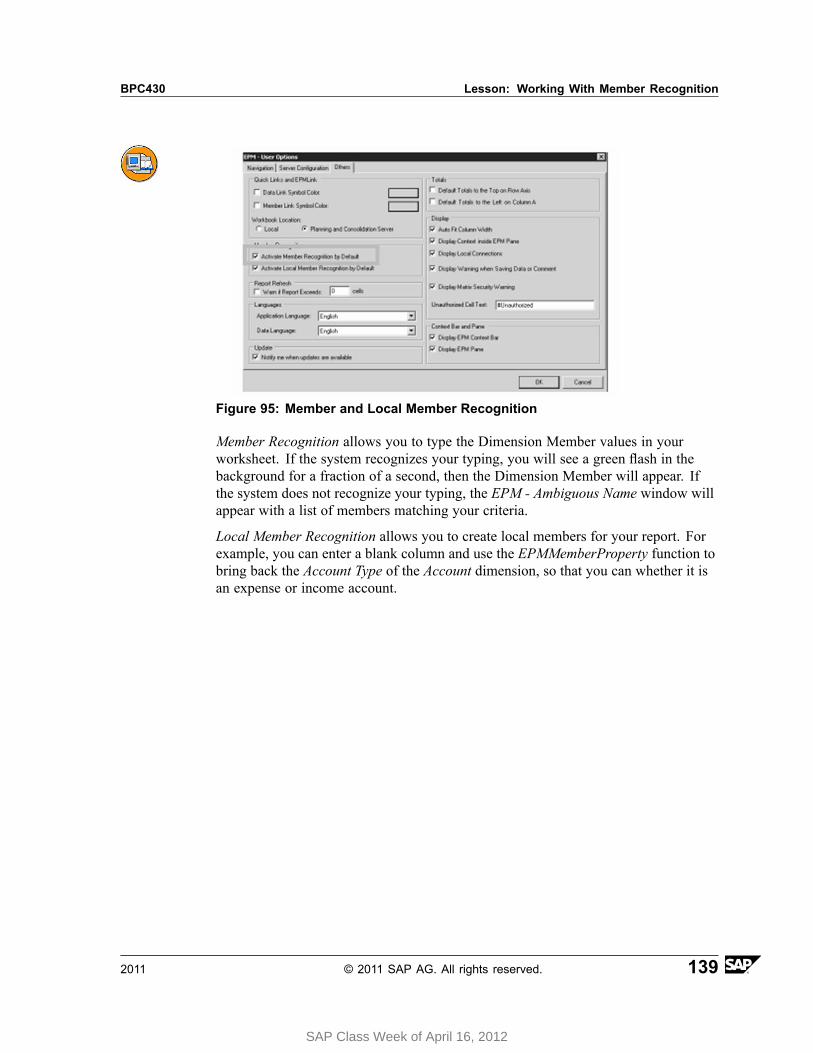
BPC430 Lesson: Working With Member Recognition
Figure 95: Member and Local Member Recognition
Member Recognition allows you to type the Dimension Member values in yourworksheet. If the system recognizes your typing, you will see a green flash in thebackground for a fraction of a second, then the Dimension Member will appear. Ifthe system does not recognize your typing, the EPM - Ambiguous Name window willappear with a list of members matching your criteria.
Local Member Recognition allows you to create local members for your report. Forexample, you can enter a blank column and use the EPMMemberProperty function tobring back the Account Type of the Account dimension, so that you can whether it isan expense or income account.
2011 © 2011 SAP AG. All rights reserved. 139
SAP Class Week of April 16, 2012

Unit 2: The Excel Interface of the EPM add-in BPC430
140 © 2011 SAP AG. All rights reserved. 2011
SAP Class Week of April 16, 2012
BPC430 Lesson: Working With Member Recognition
Exercise 5: Member Recognition
Exercise ObjectivesAfter completing this exercise, you will be able to:• Select members based on a property.• Use Local Member Recognition.• Create a report using Member Recognition.
Business ExampleYou have created reports with the EPM add-in and the EPM Pane. Now you want touse the Member Recognition functionality.
Task 1:In this exercise, you will select members based on a property and use Local MemberRecognition.
1. Go to the Excel client for your Sales model in your BPC430_## environment.
Note: If you do not have a connection for the Sales model, use theinstructions in Exercise #2 to create it.
Note: If you are ALREADY in Excel, go to Step #2.
2. Create a new blank workbook.
3. Choose the Sales - BPC430_## Connection.
4. Set your EPM Context.
5. Create a report with the P_ACCT dimension in the Row Axis and Time in theColumn Axis.
6. For the P_ACCT dimension, use the properties filter to select only EXP andINC accounts.
7. Turn on Local Member Recognition.
8. Insert an empty column and place your EPM Member Property formula there.
9. Close the report without saving
Continued on next page
2011 © 2011 SAP AG. All rights reserved. 141
SAP Class Week of April 16, 2012
Unit 2: The Excel Interface of the EPM add-in BPC430
Task 2:Use Member Recognition to create a report
1. Create a blank worksheet
2. Choose the Sales - BPC430_## Connection
3. Turn on Member Recognition
4. Create a report for Dogball and 2011.
5. Close the report without saving
142 © 2011 SAP AG. All rights reserved. 2011
SAP Class Week of April 16, 2012
BPC430 Lesson: Working With Member Recognition
Solution 5: Member RecognitionTask 1:In this exercise, you will select members based on a property and use Local MemberRecognition.
1. Go to the Excel client for your Sales model in your BPC430_## environment.
Note: If you do not have a connection for the Sales model, use theinstructions in Exercise #2 to create it.
Note: If you are ALREADY in Excel, go to Step #2.
a) From your web client's Start Page, choose EPM Office Add-in Excel.
Excel opens and the EPM - Connection Manager appears.
b) Choose the Sales - BPC430_## connection.
c) Click OK.
d) If you are prompted, logon again with your user Id and password as shownbelow:
User ID Password
BPC-## training
2. Create a new blank workbook.
a) Create a blank workbook by choosing the Office button and choose New.
b) Choose OK or Create.
3. Choose the Sales - BPC430_## Connection.
a) On the EPM Pane, under Active Connection choose the Sales - BPC430_##connection.
Continued on next page
2011 © 2011 SAP AG. All rights reserved. 143
SAP Class Week of April 16, 2012

Unit 2: The Excel Interface of the EPM add-in BPC430
4. Set your EPM Context.
a) Set your EPM Context to the following:
Dimension Member ID - Description
CATEGORY Actual - Actual from GL
ENTITY STORE1 - Store1
PRODUCT FISH - All Fish Products
P_ACCT EXTSALES - External Sales
RPTCURRENCY LC - Local Currency
TIME 2011.TOTAL - 2011
MEASURES PERIODIC - Periodic
5. Create a report with the P_ACCT dimension in the Row Axis and Time in theColumn Axis.
a) From the EPM Ribbon choose New Report.
The EPM - Report Editor window opens on the Layout tab by default.
b) Drag and drop the P_ACCT dimension to the Row Axis Dimensions.
c) Drag and drop the Time dimension to the Column Axis Dimensions.
6. For the P_ACCT dimension, use the properties filter to select only EXP andINC accounts.
a) Open the EPM - Member Selector by clicking on the P_ACCT dimension.
The EPM - Member Selector window opens.
b) Deselect the current selection under Selected Members on the right byhighlighting Context (External Sales), with the RelationshipMember and Children and move it to the left with the blue arrowpointing left.
c) Choose the yellow icon.
The Member Filtering by Properties area appears.
d) In the first row, under Property choose Account Type.
e) Under Operator choose = .
Continued on next page
144 © 2011 SAP AG. All rights reserved. 2011
SAP Class Week of April 16, 2012
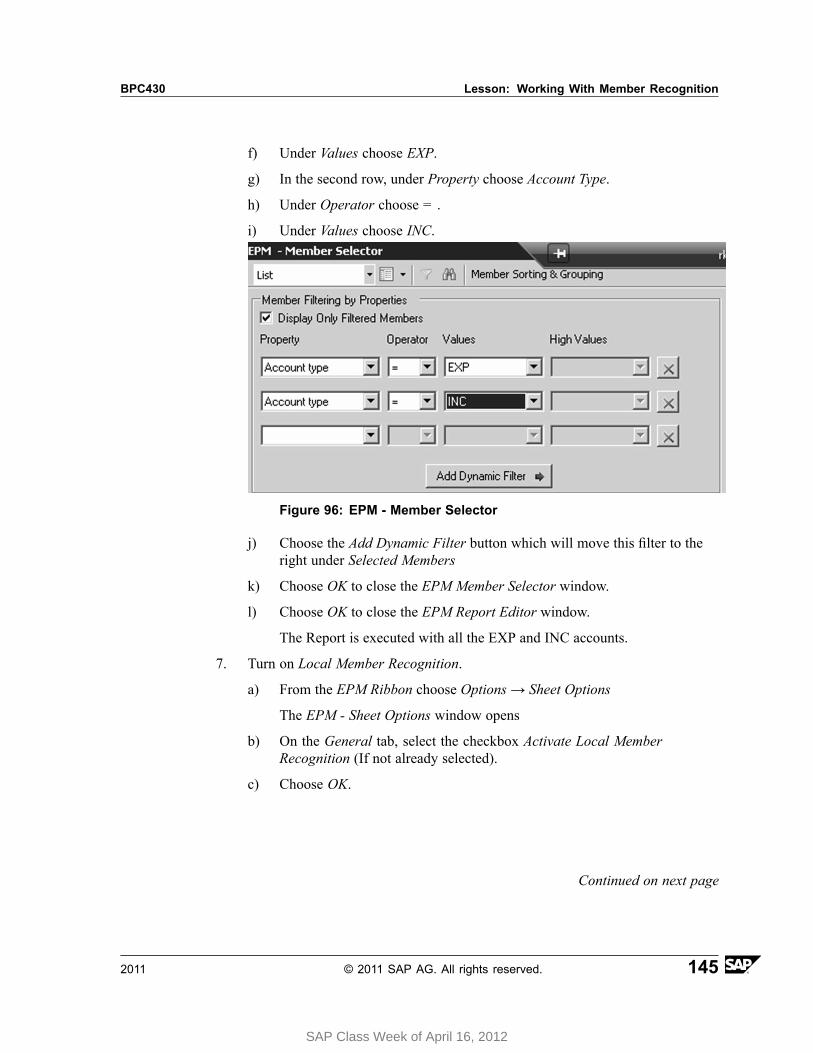
BPC430 Lesson: Working With Member Recognition
f) Under Values choose EXP.
g) In the second row, under Property choose Account Type.
h) Under Operator choose = .
i) Under Values choose INC.
Figure 96: EPM - Member Selector
j) Choose the Add Dynamic Filter button which will move this filter to theright under Selected Members
k) Choose OK to close the EPM Member Selector window.
l) Choose OK to close the EPM Report Editor window.
The Report is executed with all the EXP and INC accounts.
7. Turn on Local Member Recognition.
a) From the EPM Ribbon choose Options → Sheet Options
The EPM - Sheet Options window opens
b) On the General tab, select the checkbox Activate Local MemberRecognition (If not already selected).
c) Choose OK.
Continued on next page
2011 © 2011 SAP AG. All rights reserved. 145
SAP Class Week of April 16, 2012
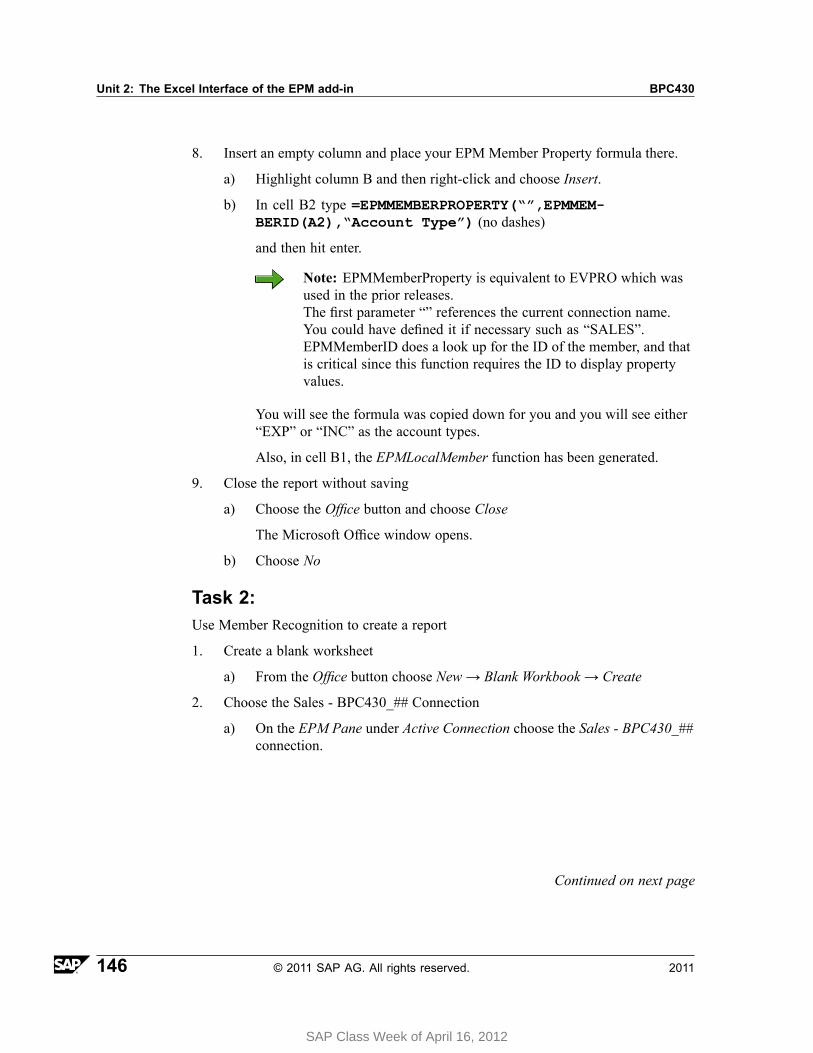
Unit 2: The Excel Interface of the EPM add-in BPC430
8. Insert an empty column and place your EPM Member Property formula there.
a) Highlight column B and then right-click and choose Insert.
b) In cell B2 type =EPMMEMBERPROPERTY(“”,EPMMEM-BERID(A2),“Account Type”) (no dashes)
and then hit enter.
Note: EPMMemberProperty is equivalent to EVPRO which wasused in the prior releases.The first parameter “” references the current connection name.You could have defined it if necessary such as “SALES”.EPMMemberID does a look up for the ID of the member, and thatis critical since this function requires the ID to display propertyvalues.
You will see the formula was copied down for you and you will see either“EXP” or “INC” as the account types.
Also, in cell B1, the EPMLocalMember function has been generated.
9. Close the report without saving
a) Choose the Office button and choose Close
The Microsoft Office window opens.
b) Choose No
Task 2:Use Member Recognition to create a report
1. Create a blank worksheet
a) From the Office button choose New → Blank Workbook → Create
2. Choose the Sales - BPC430_## Connection
a) On the EPM Pane under Active Connection choose the Sales - BPC430_##connection.
Continued on next page
146 © 2011 SAP AG. All rights reserved. 2011
SAP Class Week of April 16, 2012
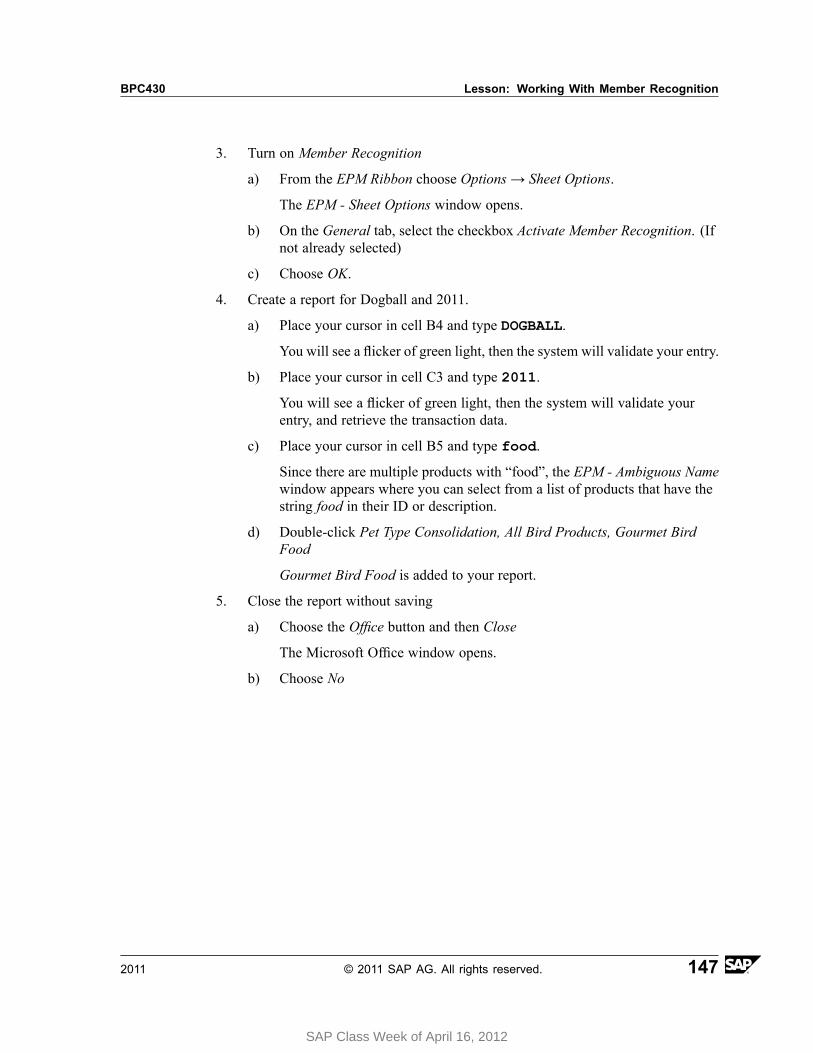
BPC430 Lesson: Working With Member Recognition
3. Turn on Member Recognition
a) From the EPM Ribbon choose Options → Sheet Options.
The EPM - Sheet Options window opens.
b) On the General tab, select the checkbox Activate Member Recognition. (Ifnot already selected)
c) Choose OK.
4. Create a report for Dogball and 2011.
a) Place your cursor in cell B4 and type DOGBALL.
You will see a flicker of green light, then the system will validate your entry.
b) Place your cursor in cell C3 and type 2011.
You will see a flicker of green light, then the system will validate yourentry, and retrieve the transaction data.
c) Place your cursor in cell B5 and type food.
Since there are multiple products with “food”, the EPM - Ambiguous Namewindow appears where you can select from a list of products that have thestring food in their ID or description.
d) Double-click Pet Type Consolidation, All Bird Products, Gourmet BirdFood
Gourmet Bird Food is added to your report.
5. Close the report without saving
a) Choose the Office button and then Close
The Microsoft Office window opens.
b) Choose No
2011 © 2011 SAP AG. All rights reserved. 147
SAP Class Week of April 16, 2012
Unit 2: The Excel Interface of the EPM add-in BPC430
Lesson Summary
You should now be able to:• Create a report using Member Recognition• Create a report using Local Member Recognition
Related Information
148 © 2011 SAP AG. All rights reserved. 2011

BPC430 Lesson: Linking Reports
Lesson: Linking Reports
Lesson OverviewIn this lesson, you will learn how to use Quick Links.
Lesson ObjectivesAfter completing this lesson, you will be able to:
• Use data links• Use member links• Use report links
Business ExampleYour business users need to link to related data while performing analysis in the ExcelInterface of the EPM Interface and so you need to know how to set up Quick Links.
Quick Link OptionsYou can create quick links in a report to another report contained in another Workbook.Quick links can be used to guide you through ad-hoc analysis.
The three Microsoft Office options are shown below.
• Microsoft Word document• Microsoft Excel workbook• Microsoft PowerPoint presentation
2011 © 2011 SAP AG. All rights reserved. 149
SAP Class Week of April 16, 2012
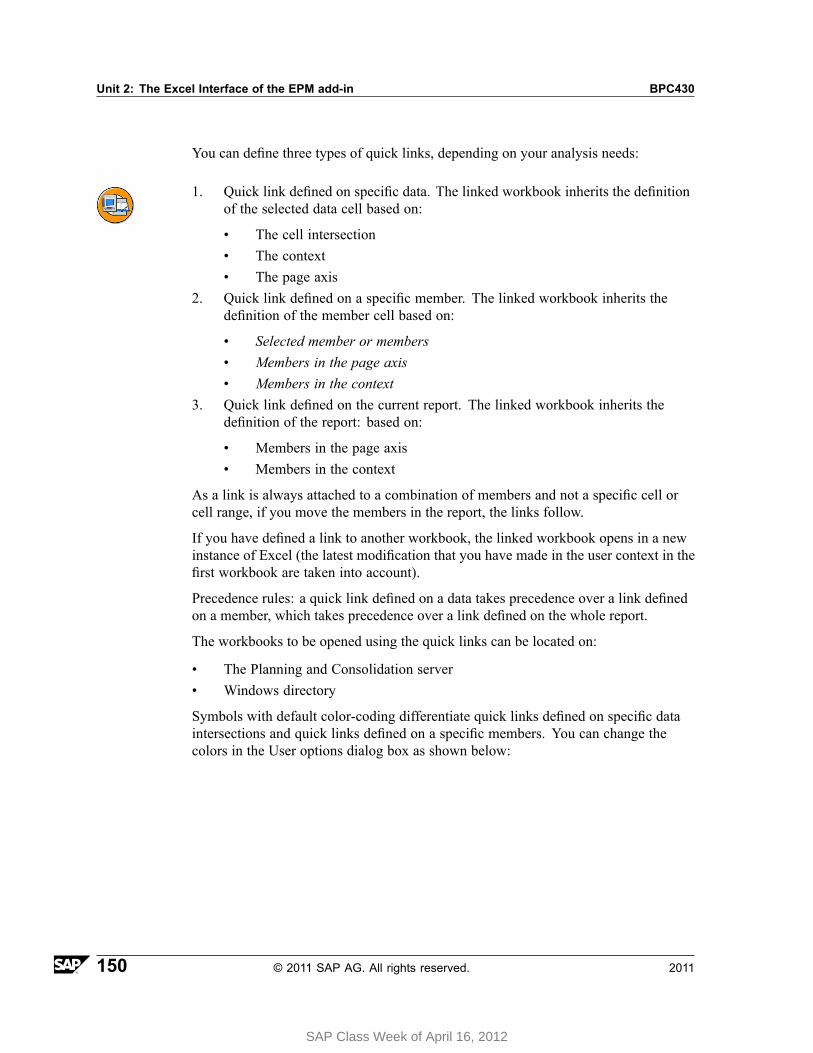
Unit 2: The Excel Interface of the EPM add-in BPC430
You can define three types of quick links, depending on your analysis needs:
1. Quick link defined on specific data. The linked workbook inherits the definitionof the selected data cell based on:
• The cell intersection• The context• The page axis
2. Quick link defined on a specific member. The linked workbook inherits thedefinition of the member cell based on:
• Selected member or members• Members in the page axis• Members in the context
3. Quick link defined on the current report. The linked workbook inherits thedefinition of the report: based on:
• Members in the page axis• Members in the context
As a link is always attached to a combination of members and not a specific cell orcell range, if you move the members in the report, the links follow.
If you have defined a link to another workbook, the linked workbook opens in a newinstance of Excel (the latest modification that you have made in the user context in thefirst workbook are taken into account).
Precedence rules: a quick link defined on a data takes precedence over a link definedon a member, which takes precedence over a link defined on the whole report.
The workbooks to be opened using the quick links can be located on:
• The Planning and Consolidation server• Windows directory
Symbols with default color-coding differentiate quick links defined on specific dataintersections and quick links defined on a specific members. You can change thecolors in the User options dialog box as shown below:
150 © 2011 SAP AG. All rights reserved. 2011
SAP Class Week of April 16, 2012
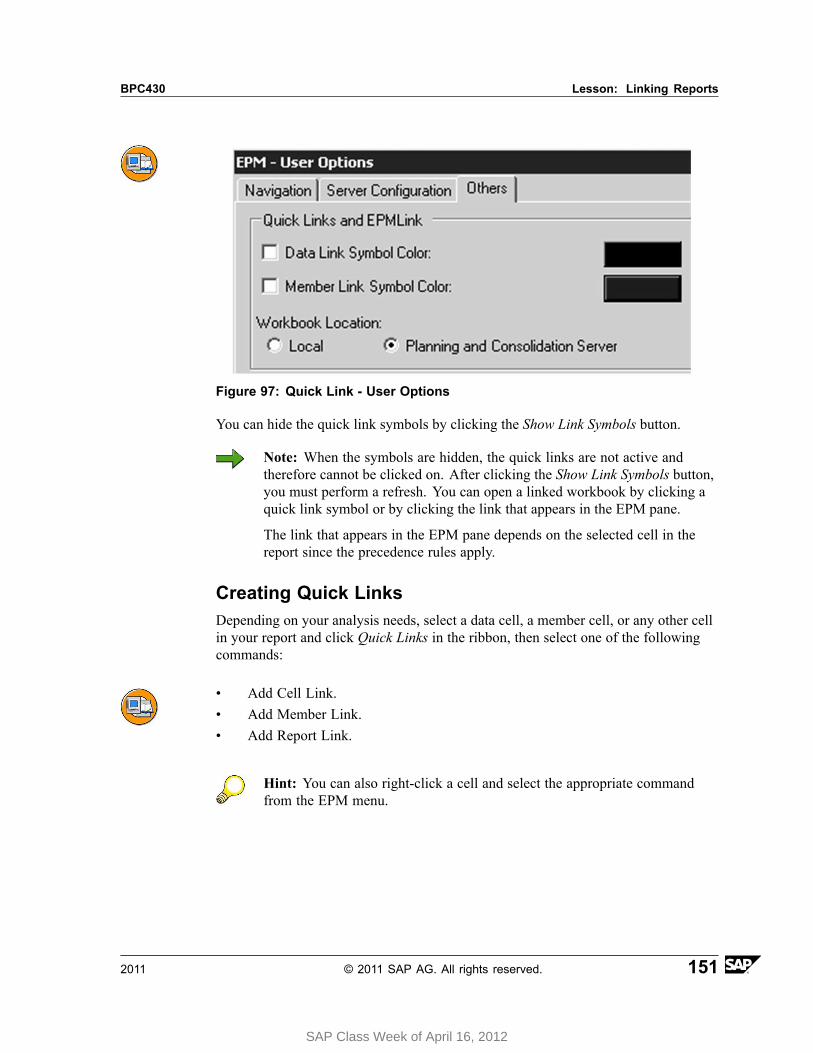
BPC430 Lesson: Linking Reports
Figure 97: Quick Link - User Options
You can hide the quick link symbols by clicking the Show Link Symbols button.
Note: When the symbols are hidden, the quick links are not active andtherefore cannot be clicked on. After clicking the Show Link Symbols button,you must perform a refresh. You can open a linked workbook by clicking aquick link symbol or by clicking the link that appears in the EPM pane.
The link that appears in the EPM pane depends on the selected cell in thereport since the precedence rules apply.
Creating Quick LinksDepending on your analysis needs, select a data cell, a member cell, or any other cellin your report and click Quick Links in the ribbon, then select one of the followingcommands:
• Add Cell Link.• Add Member Link.• Add Report Link.
Hint: You can also right-click a cell and select the appropriate commandfrom the EPM menu.
2011 © 2011 SAP AG. All rights reserved. 151
SAP Class Week of April 16, 2012
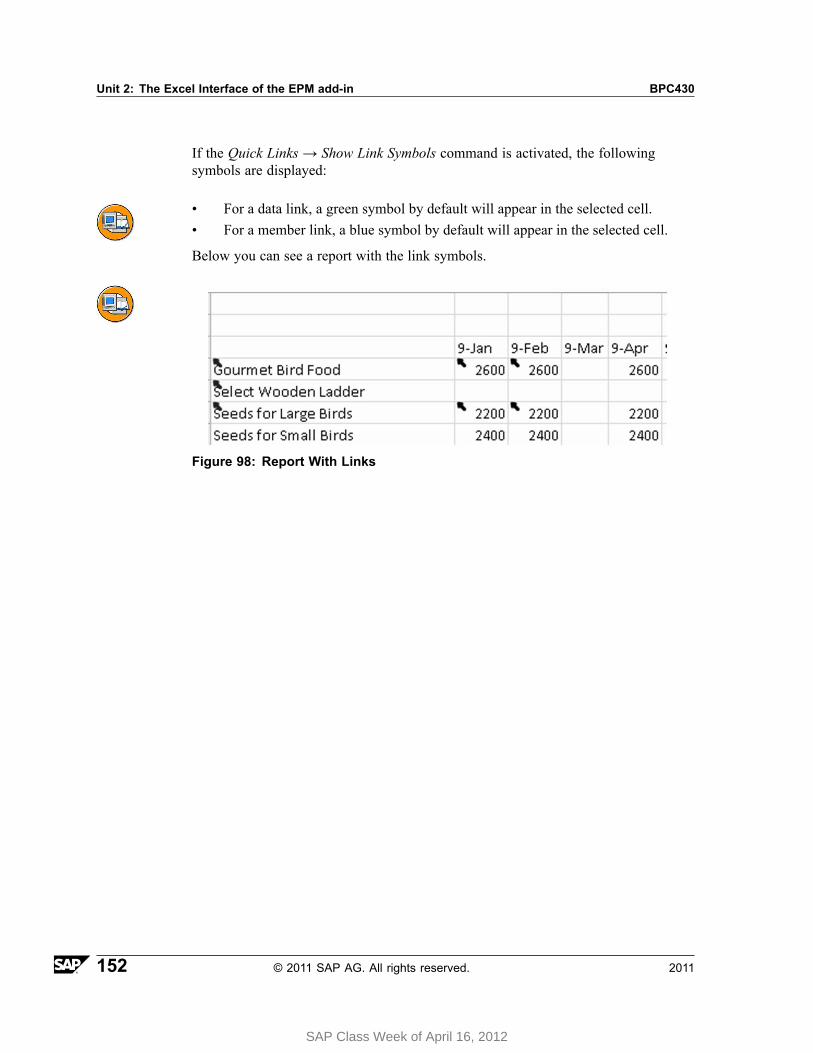
Unit 2: The Excel Interface of the EPM add-in BPC430
If the Quick Links → Show Link Symbols command is activated, the followingsymbols are displayed:
• For a data link, a green symbol by default will appear in the selected cell.• For a member link, a blue symbol by default will appear in the selected cell.
Below you can see a report with the link symbols.
Figure 98: Report With Links
152 © 2011 SAP AG. All rights reserved. 2011
SAP Class Week of April 16, 2012

BPC430 Lesson: Linking Reports
Lesson Summary
You should now be able to:• Use data links• Use member links• Use report links
2011 © 2011 SAP AG. All rights reserved. 153
SAP Class Week of April 16, 2012
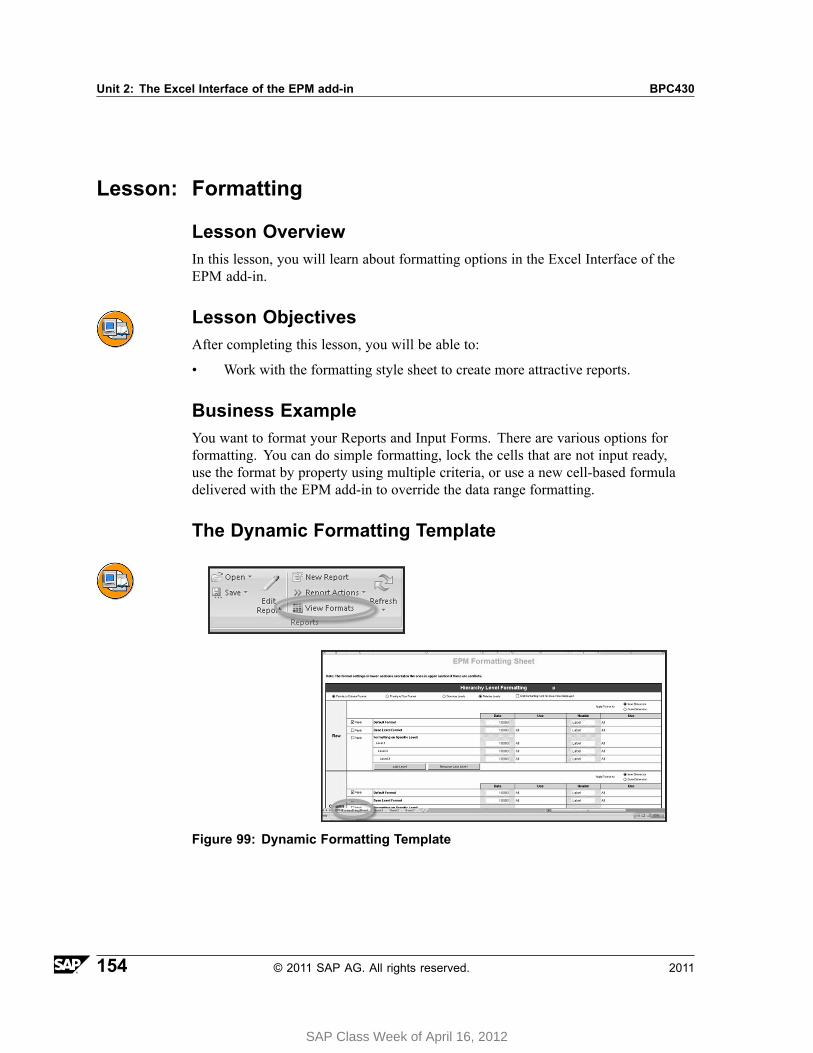
Unit 2: The Excel Interface of the EPM add-in BPC430
Lesson: Formatting
Lesson OverviewIn this lesson, you will learn about formatting options in the Excel Interface of theEPM add-in.
Lesson ObjectivesAfter completing this lesson, you will be able to:
• Work with the formatting style sheet to create more attractive reports.
Business ExampleYou want to format your Reports and Input Forms. There are various options forformatting. You can do simple formatting, lock the cells that are not input ready,use the format by property using multiple criteria, or use a new cell-based formuladelivered with the EPM add-in to override the data range formatting.
The Dynamic Formatting Template
Figure 99: Dynamic Formatting Template
154 © 2011 SAP AG. All rights reserved. 2011
SAP Class Week of April 16, 2012
BPC430 Lesson: Formatting
In this section, you will learn about the Dynamic Formatting Template in the EPMadd-in. Dynamic formatting is defined in a dedicated sheet. Formats can be appliedto levels of a hierarchy, types of members, odd/even rows, or columns and page axisdimensions. Since the EPMFormattingSheet is an excel sheet, it can be copied andchanged to be applied to other reports, worksheets.
Common Actions to Several Formatting SectionsThere are various sections on the EPM Formatting Sheet
• Hierarchy Level Formatting• Dimension Member/Property Formatting• Row and Column Banding• Page Axis Formatting
There are certain settings that are common to all sections:
• Checkboxes• Priority to Column or Row Format• Data and Use Columns/Cells• Header and Use Columns/Cells
Actions relevant to several formatting sections
Checkboxes: Enable you to specify the formatting sections, or formatting itemsinside a section, that you want to apply to the reports.
Priority to Column or row format: Enable you to specify which one of the definedformats for row or columns will be applied first in case of conflicts. For example, ifyou select Priority to Column Format the Column section will appear below the RowSection, and the precedence rules apply.
Formatting: Allows you to use the standard Microsoft Office Excel cell formattingfeatures in the Data and Header Columns to define the formatting. Also gives you theability to directly enter the format settings in the Use cell. By double clicking the Usecell, you will open the EPM Formatting Sheet - Cell Format window which will allowyou to override certain format settings.
Cell Protection: However, you can unlock cells or lock cells as necessary. Right-clickon one or more cells, and from the context menu select EPM → Unlock SelectedCells. When you are finished, if you'd like, you can re-lock by choosing EPM →Lock Selected Cells.
2011 © 2011 SAP AG. All rights reserved. 155
SAP Class Week of April 16, 2012
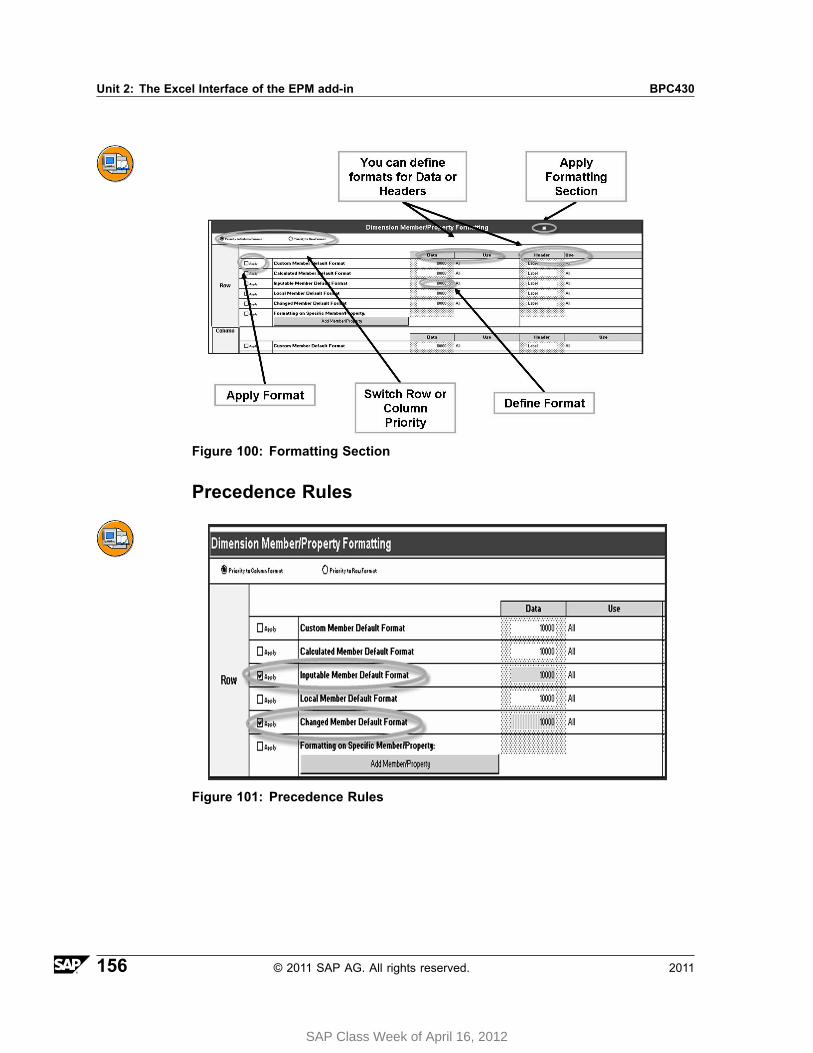
Unit 2: The Excel Interface of the EPM add-in BPC430
Figure 100: Formatting Section
Precedence Rules
Figure 101: Precedence Rules
156 © 2011 SAP AG. All rights reserved. 2011
SAP Class Week of April 16, 2012
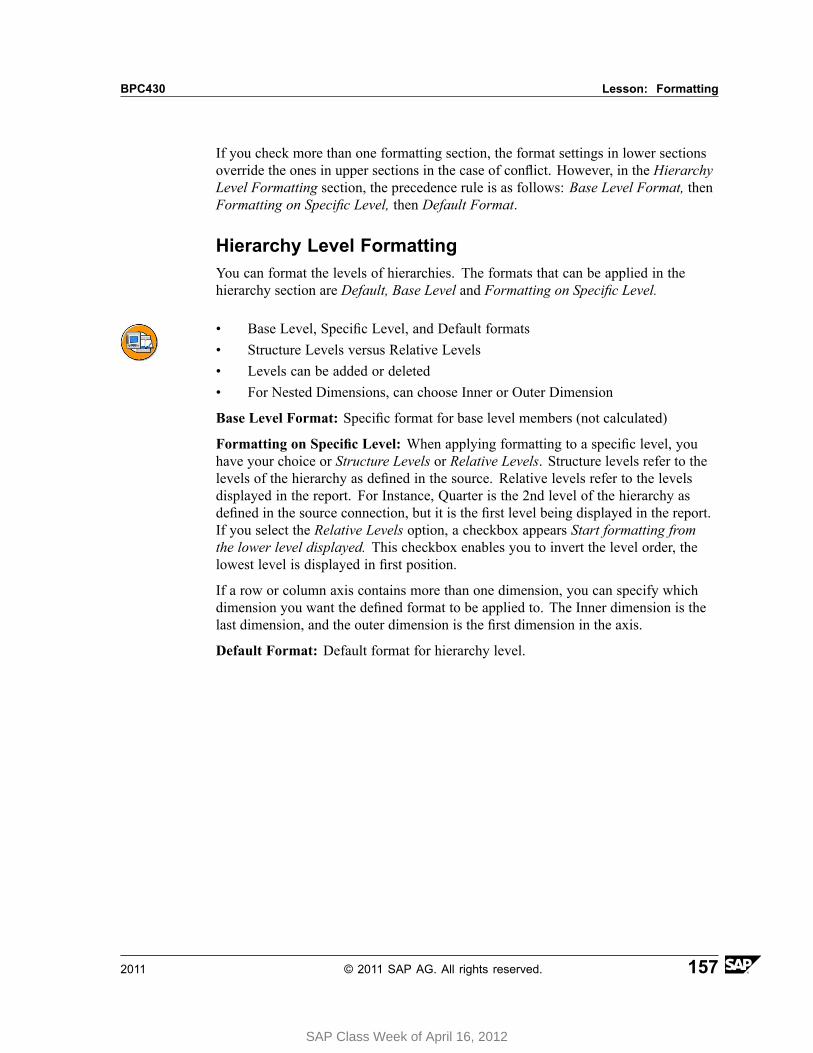
BPC430 Lesson: Formatting
If you check more than one formatting section, the format settings in lower sectionsoverride the ones in upper sections in the case of conflict. However, in the HierarchyLevel Formatting section, the precedence rule is as follows: Base Level Format, thenFormatting on Specific Level, then Default Format.
Hierarchy Level FormattingYou can format the levels of hierarchies. The formats that can be applied in thehierarchy section are Default, Base Level and Formatting on Specific Level.
• Base Level, Specific Level, and Default formats• Structure Levels versus Relative Levels• Levels can be added or deleted• For Nested Dimensions, can choose Inner or Outer Dimension
Base Level Format: Specific format for base level members (not calculated)
Formatting on Specific Level: When applying formatting to a specific level, youhave your choice or Structure Levels or Relative Levels. Structure levels refer to thelevels of the hierarchy as defined in the source. Relative levels refer to the levelsdisplayed in the report. For Instance, Quarter is the 2nd level of the hierarchy asdefined in the source connection, but it is the first level being displayed in the report.If you select the Relative Levels option, a checkbox appears Start formatting fromthe lower level displayed. This checkbox enables you to invert the level order, thelowest level is displayed in first position.
If a row or column axis contains more than one dimension, you can specify whichdimension you want the defined format to be applied to. The Inner dimension is thelast dimension, and the outer dimension is the first dimension in the axis.
Default Format: Default format for hierarchy level.
2011 © 2011 SAP AG. All rights reserved. 157
SAP Class Week of April 16, 2012
Unit 2: The Excel Interface of the EPM add-in BPC430
How to Format for Hierarchies
1. From the EPM Ribbon, choose View Formats.
The EPMFormattingSheet will open in your Workbook.
2. For the Hierarchy Level Formatting section, choose the checkbox to apply theformatting section.
3. Choose either the radio button for Priority to Column Format or Priority toRow Format.
Note: The lowest set of formats in the section takes precedence.
4. For the formats you want to apply, choose the checkbox to the left of Apply.
Note: The precedence is Base Level, Formatting on Specific Level,then Default.
5. If you are using Formatting on Specific Level, choose either the Structure Levelsradio button or the Relative Levels. If you choose Relative Levels, you can alsodecide if you want the formatting to start from the lowest level displayed byselecting the checkbox Start formatting from the lowest level displayed.
6. Additionally, if you are using Formatting on Specific Level, you can chooseeither the Add Level button or the Remove Last Level button as necessary.
7. For the formats you are applying, place your cursor on either the 10000 field, ifyou are attempting to change the Data formats, and/or the Label field if you areattempting to format Headers.
The format palette will open as well as the Excel Context Menu. Set your formatseither from the palette or by choosing Format Cells to select your formats there.
8. If you have more then one dimension in an axis, you can choose where theformats are applied by selecting the radio button Inner Dimension or OuterDimension to the left of the Apply Format To: area.
9. Return to the sheet where your report is and be sure the Apply DynamicFormatting checkbox is selected. This can be found on either the EPM Ribbon→ Options → Sheet Options Formatting tab (applies to the worksheet) or fromEPM - Report Editor (EPM Ribbon → Edit Report ) Options tab. (appliesto the report)
158 © 2011 SAP AG. All rights reserved. 2011
SAP Class Week of April 16, 2012
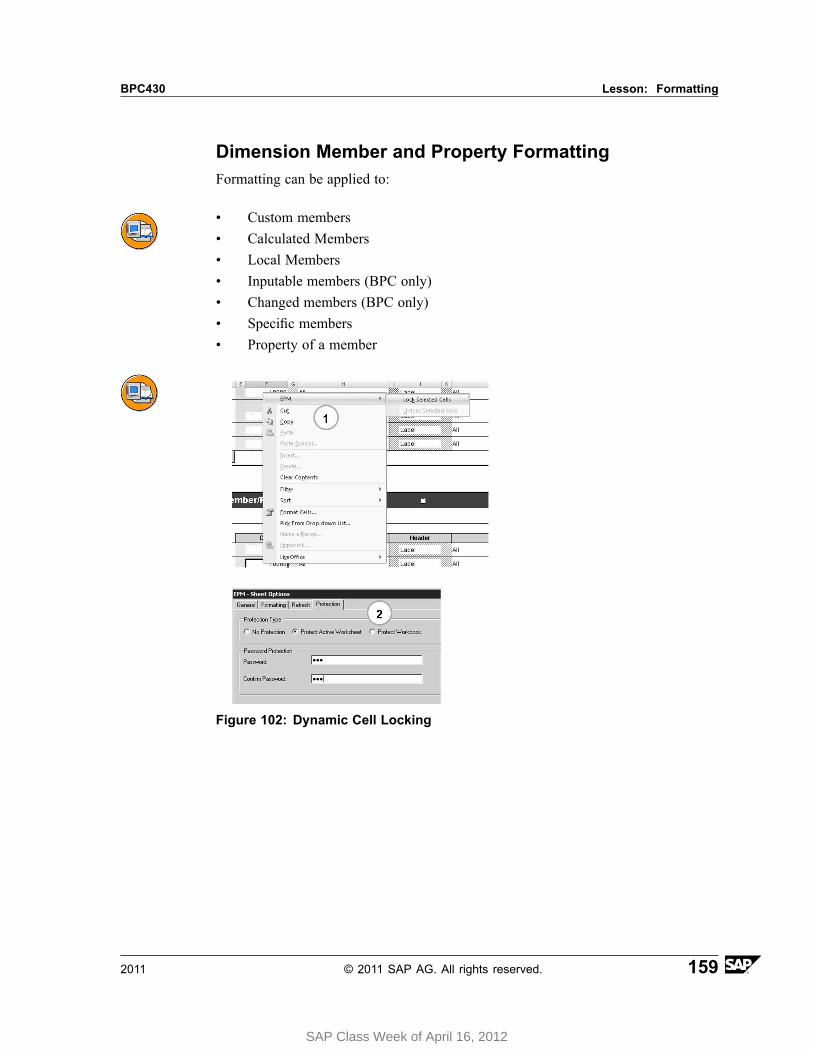
BPC430 Lesson: Formatting
Dimension Member and Property FormattingFormatting can be applied to:
• Custom members• Calculated Members• Local Members• Inputable members (BPC only)• Changed members (BPC only)• Specific members• Property of a member
Figure 102: Dynamic Cell Locking
2011 © 2011 SAP AG. All rights reserved. 159
SAP Class Week of April 16, 2012

Unit 2: The Excel Interface of the EPM add-in BPC430
Figure 103: Member Property Formatting
Row and Column Banding Section and Page AxisFormatting SectionOther Formatting Sections
• Row and Column Banding:Allows you to choose one or two alternating formatsApplies to Data or HeadersRows or Columns
• Page Axis Formatting:Formatting for all dimensions of the Page Axis
160 © 2011 SAP AG. All rights reserved. 2011
SAP Class Week of April 16, 2012
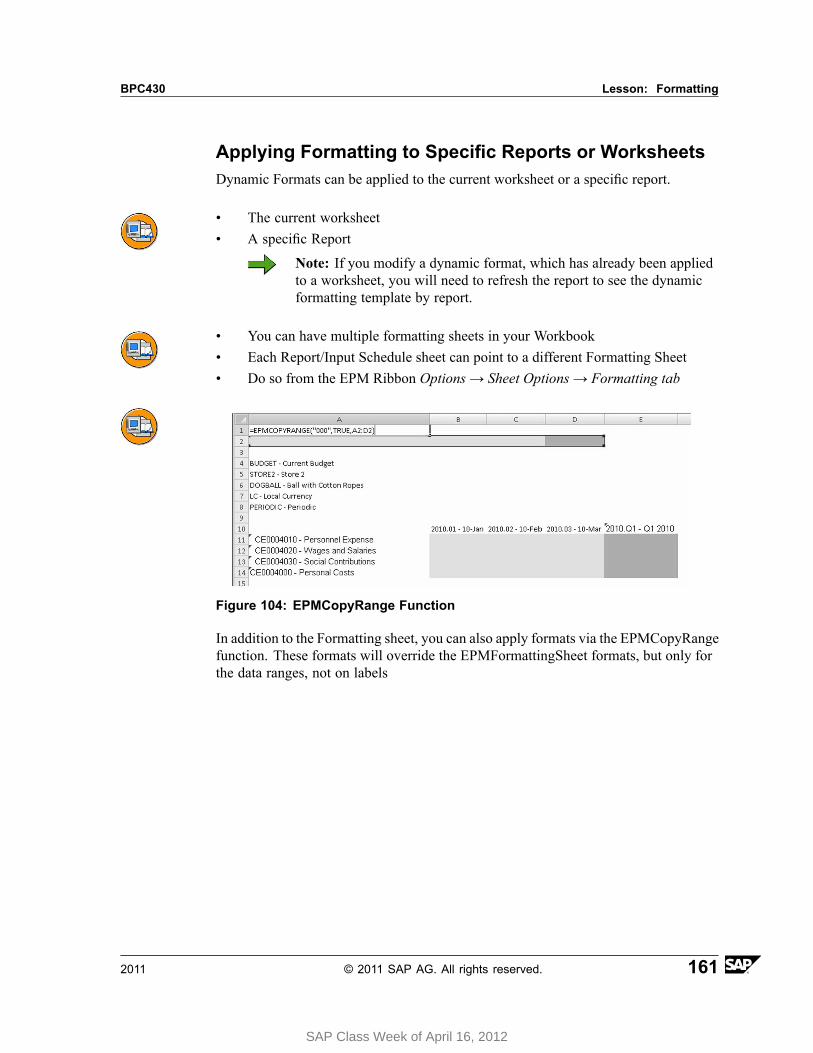
BPC430 Lesson: Formatting
Applying Formatting to Specific Reports or WorksheetsDynamic Formats can be applied to the current worksheet or a specific report.
• The current worksheet• A specific Report
Note: If you modify a dynamic format, which has already been appliedto a worksheet, you will need to refresh the report to see the dynamicformatting template by report.
• You can have multiple formatting sheets in your Workbook• Each Report/Input Schedule sheet can point to a different Formatting Sheet• Do so from the EPM Ribbon Options → Sheet Options → Formatting tab
Figure 104: EPMCopyRange Function
In addition to the Formatting sheet, you can also apply formats via the EPMCopyRangefunction. These formats will override the EPMFormattingSheet formats, but only forthe data ranges, not on labels
2011 © 2011 SAP AG. All rights reserved. 161
SAP Class Week of April 16, 2012
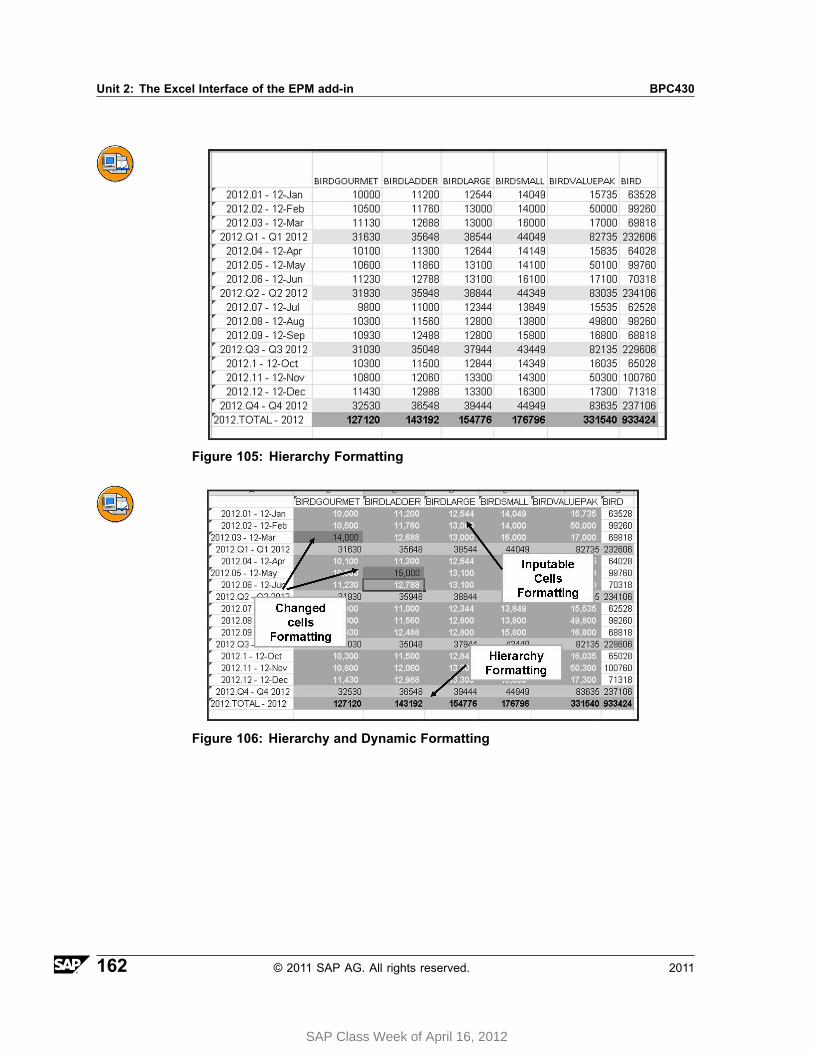
Unit 2: The Excel Interface of the EPM add-in BPC430
Figure 105: Hierarchy Formatting
Figure 106: Hierarchy and Dynamic Formatting
162 © 2011 SAP AG. All rights reserved. 2011
SAP Class Week of April 16, 2012
BPC430 Lesson: Formatting
Applying a Default Dynamic Formatting Template to aWorksheet
1. From the EPM Ribbon choose Options → Sheet Options.
2. Select the Formatting tab.
3. Select the Apply Dynamic Formatting checkbox.
4. Select the template you want to apply to the worksheet from the DefaultFormatting Sheet list.
5. If the reports that the users want to apply dynamic formatting to already containformatting applied by an add-in other than the EPM add-in, take one of thefollowing actions:
• To clear the existing formatting and override it with the dynamic formatting,select the Clear report format before applying dynamic formatting option.
• To keep the existing formatting and override it with the dynamic formatting,deselect the Clear report format before applying dynamic formatting option.
6. Choose OK
2011 © 2011 SAP AG. All rights reserved. 163
SAP Class Week of April 16, 2012
Unit 2: The Excel Interface of the EPM add-in BPC430
Applying a Default Dynamic Formatting Template to aReport
1. Select a cell in the report to which you want to apply a dynamic formattingtemplate.
2. From the EPM Ribbon choose Edit Report
The EPM - Report Editor opens
3. Select the Options tab
4. If the Default Dynamic Formatting template has been selected for the worksheetin the Sheet Options, then the Apply Dynamic Formatting checkbox is alreadyset. If not, choose it.
5. Select the template you want to apply to the report from the Default FormattingSheet list.
6. If the reports the users want to apply dynamic formatting to already containformatting applied by an add-in other than the EPM add-in, take one of thefollowing actions:
• To clear the existing formatting and override it with the dynamic formatting,select the Clear report format before applying dynamic formatting option.
• To keep the existing formatting and override it with the dynamic formatting,deselect the Clear report format before applying dynamic formatting option.
7. Choose OK
164 © 2011 SAP AG. All rights reserved. 2011
SAP Class Week of April 16, 2012
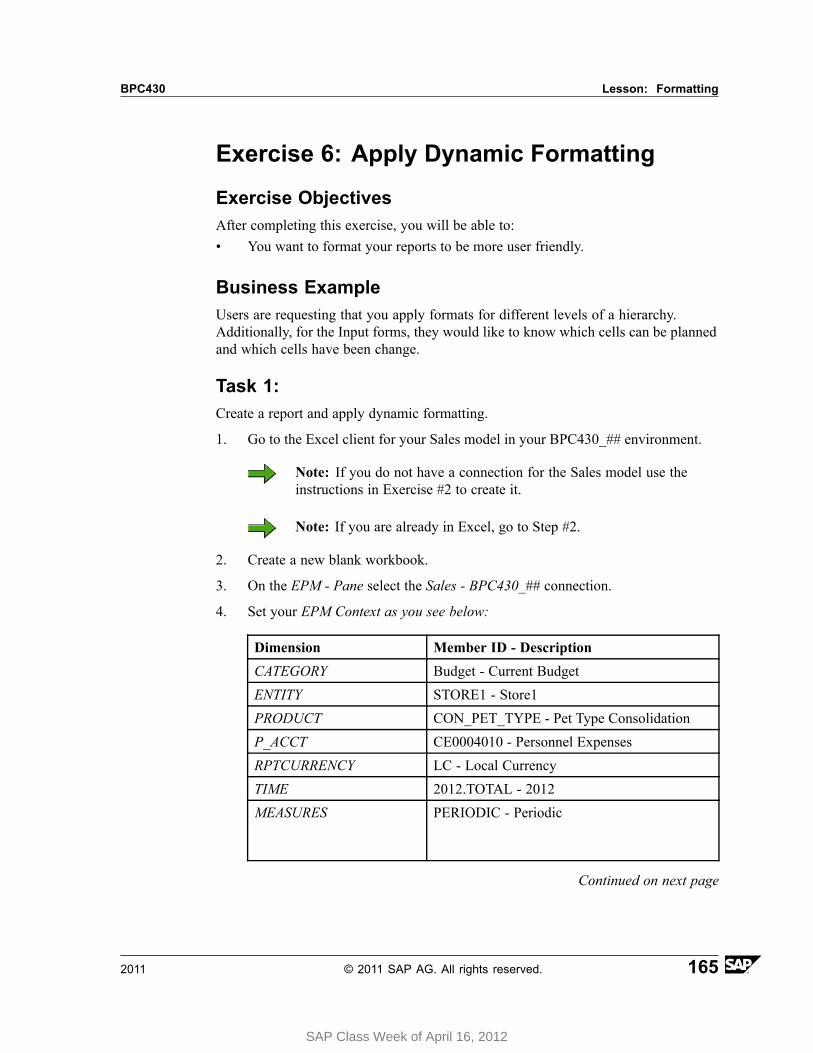
BPC430 Lesson: Formatting
Exercise 6: Apply Dynamic Formatting
Exercise ObjectivesAfter completing this exercise, you will be able to:• You want to format your reports to be more user friendly.
Business ExampleUsers are requesting that you apply formats for different levels of a hierarchy.Additionally, for the Input forms, they would like to know which cells can be plannedand which cells have been change.
Task 1:Create a report and apply dynamic formatting.
1. Go to the Excel client for your Sales model in your BPC430_## environment.
Note: If you do not have a connection for the Sales model use theinstructions in Exercise #2 to create it.
Note: If you are already in Excel, go to Step #2.
2. Create a new blank workbook.
3. On the EPM - Pane select the Sales - BPC430_## connection.
4. Set your EPM Context as you see below:
Dimension Member ID - Description
CATEGORY Budget - Current Budget
ENTITY STORE1 - Store1
PRODUCT CON_PET_TYPE - Pet Type Consolidation
P_ACCT CE0004010 - Personnel Expenses
RPTCURRENCY LC - Local Currency
TIME 2012.TOTAL - 2012
MEASURES PERIODIC - Periodic
Continued on next page
2011 © 2011 SAP AG. All rights reserved. 165
SAP Class Week of April 16, 2012
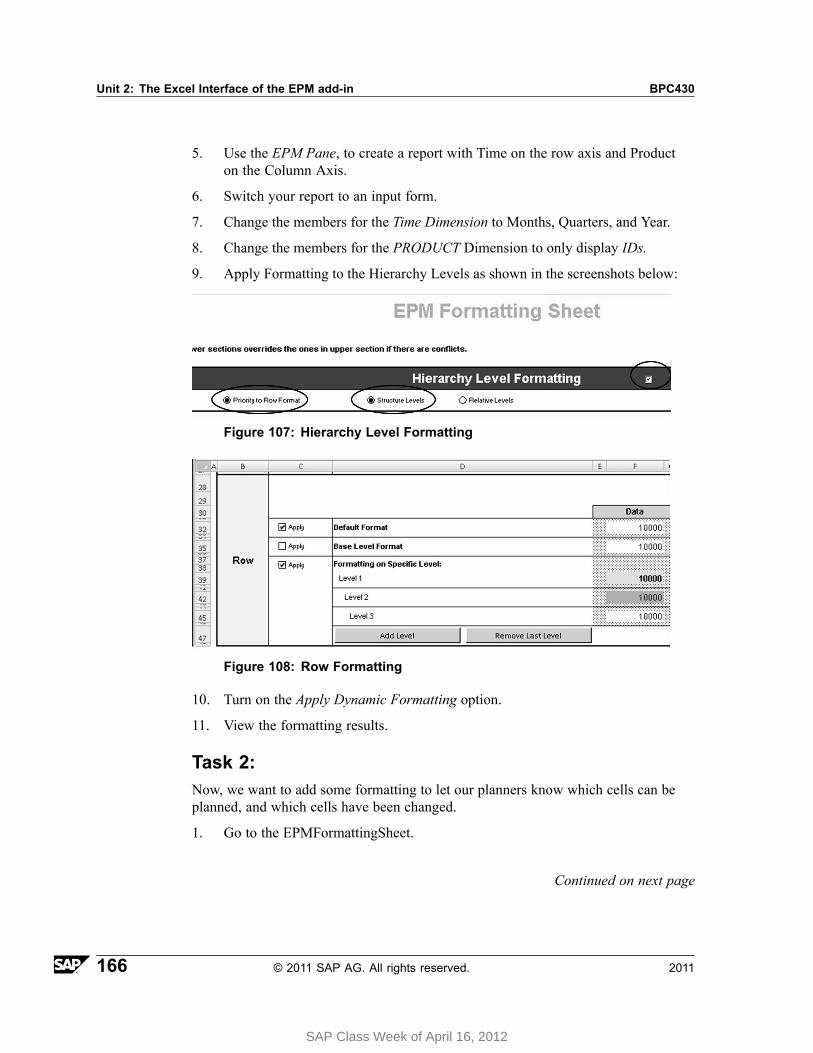
Unit 2: The Excel Interface of the EPM add-in BPC430
5. Use the EPM Pane, to create a report with Time on the row axis and Producton the Column Axis.
6. Switch your report to an input form.
7. Change the members for the Time Dimension to Months, Quarters, and Year.
8. Change the members for the PRODUCT Dimension to only display IDs.
9. Apply Formatting to the Hierarchy Levels as shown in the screenshots below:
Figure 107: Hierarchy Level Formatting
Figure 108: Row Formatting
10. Turn on the Apply Dynamic Formatting option.
11. View the formatting results.
Task 2:Now, we want to add some formatting to let our planners know which cells can beplanned, and which cells have been changed.
1. Go to the EPMFormattingSheet.
Continued on next page
166 © 2011 SAP AG. All rights reserved. 2011
SAP Class Week of April 16, 2012
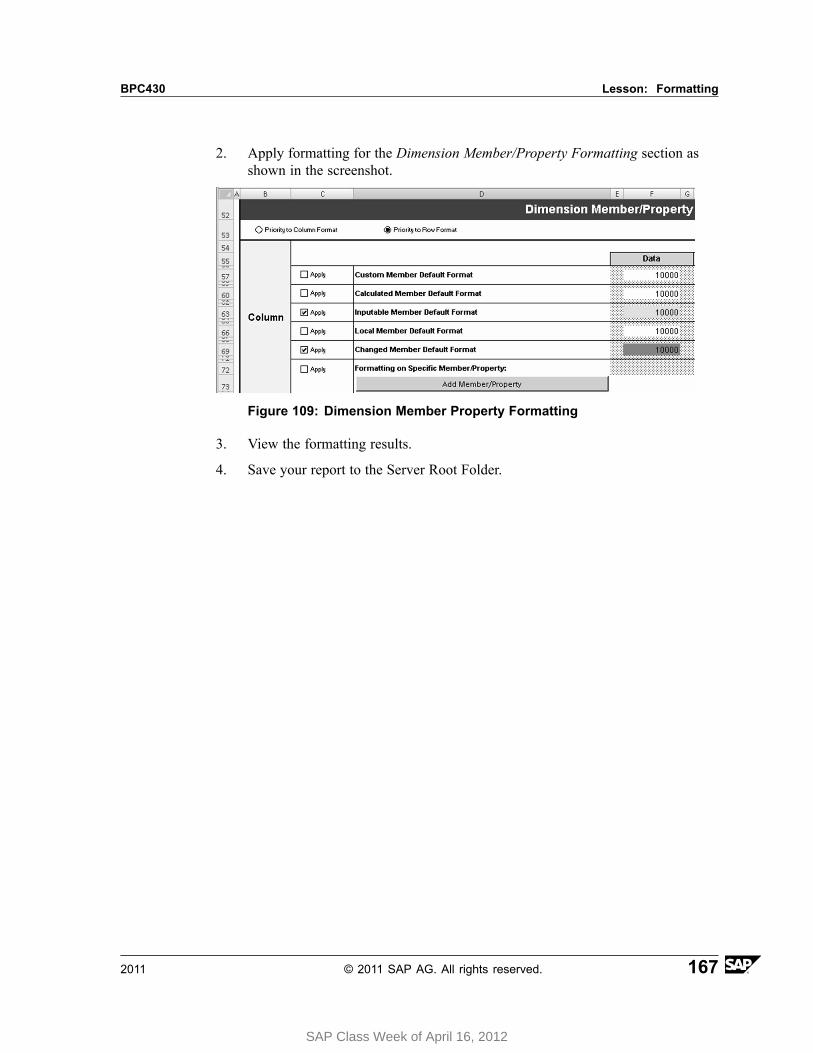
BPC430 Lesson: Formatting
2. Apply formatting for the Dimension Member/Property Formatting section asshown in the screenshot.
Figure 109: Dimension Member Property Formatting
3. View the formatting results.
4. Save your report to the Server Root Folder.
2011 © 2011 SAP AG. All rights reserved. 167
SAP Class Week of April 16, 2012
Unit 2: The Excel Interface of the EPM add-in BPC430
Solution 6: Apply Dynamic FormattingTask 1:Create a report and apply dynamic formatting.
1. Go to the Excel client for your Sales model in your BPC430_## environment.
Note: If you do not have a connection for the Sales model use theinstructions in Exercise #2 to create it.
Note: If you are already in Excel, go to Step #2.
a) From your web client's Start Page, choose EPM Office Add-in Excel.
Excel opens and the EPM - Connection Manager appears.
b) Choose the Sales - BPC430_## connection.
c) Click OK.
d) If you are prompted, log on again with your user ID and password asshown below:
User ID Password
BPC-## training
2. Create a new blank workbook.
a) Create a blank workbook by choosing the Office button and choose New.
b) Choose Create.
3. On the EPM - Pane select the Sales - BPC430_## connection.
a) On the EPM -Pane, select the Sales - BPC430_## connection from thedropdown, if not already selected.
4. Set your EPM Context as you see below:
Dimension Member ID - Description
CATEGORY Budget - Current Budget
ENTITY STORE1 - Store1
PRODUCT CON_PET_TYPE - Pet Type Consolidation
Continued on next page
168 © 2011 SAP AG. All rights reserved. 2011
SAP Class Week of April 16, 2012
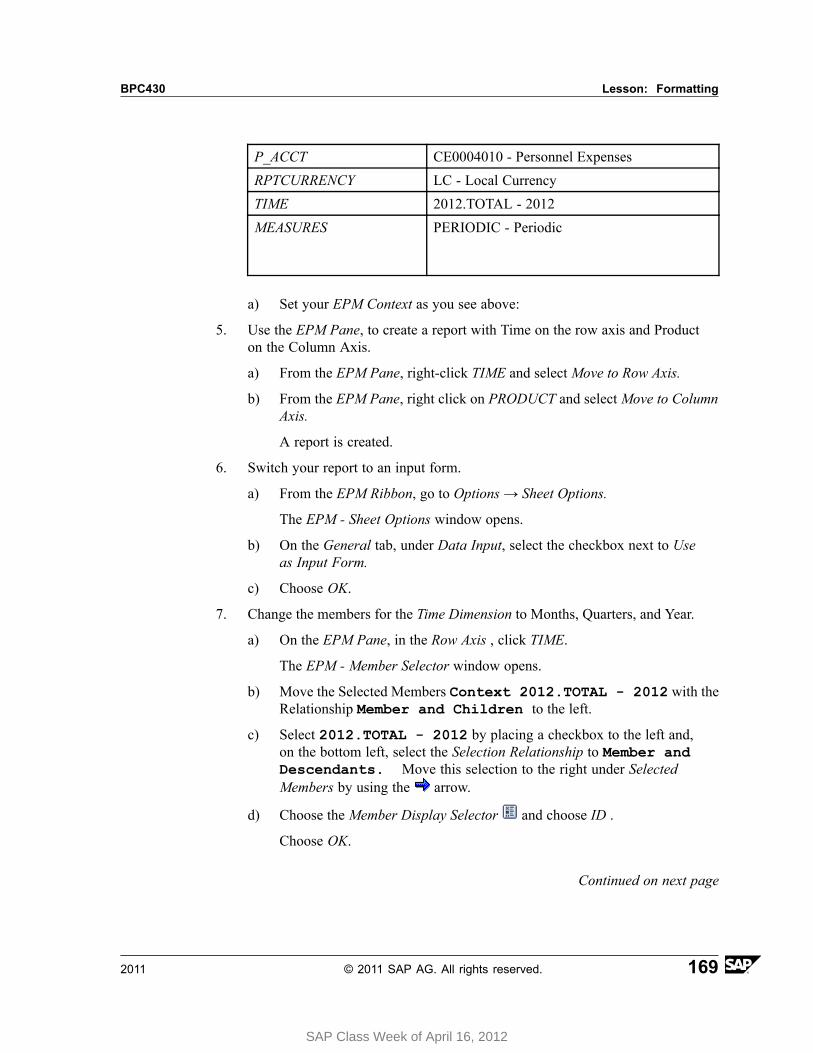
BPC430 Lesson: Formatting
P_ACCT CE0004010 - Personnel Expenses
RPTCURRENCY LC - Local Currency
TIME 2012.TOTAL - 2012
MEASURES PERIODIC - Periodic
a) Set your EPM Context as you see above:
5. Use the EPM Pane, to create a report with Time on the row axis and Producton the Column Axis.
a) From the EPM Pane, right-click TIME and select Move to Row Axis.
b) From the EPM Pane, right click on PRODUCT and select Move to ColumnAxis.
A report is created.
6. Switch your report to an input form.
a) From the EPM Ribbon, go to Options → Sheet Options.
The EPM - Sheet Options window opens.
b) On the General tab, under Data Input, select the checkbox next to Useas Input Form.
c) Choose OK.
7. Change the members for the Time Dimension to Months, Quarters, and Year.
a) On the EPM Pane, in the Row Axis , click TIME.
The EPM - Member Selector window opens.
b) Move the Selected Members Context 2012.TOTAL - 2012 with theRelationship Member and Children to the left.
c) Select 2012.TOTAL - 2012 by placing a checkbox to the left and,on the bottom left, select the Selection Relationship to Member andDescendants. Move this selection to the right under SelectedMembers by using the arrow.
d) Choose the Member Display Selector and choose ID .
Choose OK.
Continued on next page
2011 © 2011 SAP AG. All rights reserved. 169
SAP Class Week of April 16, 2012
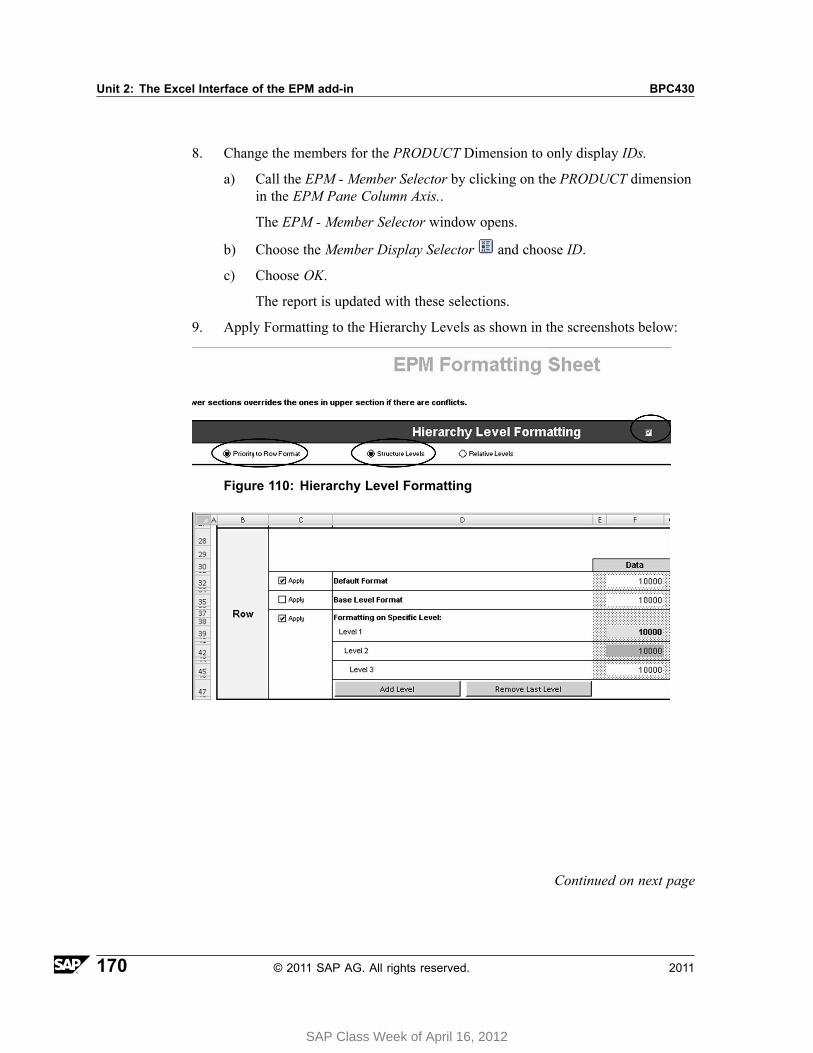
Unit 2: The Excel Interface of the EPM add-in BPC430
8. Change the members for the PRODUCT Dimension to only display IDs.
a) Call the EPM - Member Selector by clicking on the PRODUCT dimensionin the EPM Pane Column Axis..
The EPM - Member Selector window opens.
b) Choose the Member Display Selector and choose ID.
c) Choose OK.
The report is updated with these selections.
9. Apply Formatting to the Hierarchy Levels as shown in the screenshots below:
Figure 110: Hierarchy Level Formatting
Continued on next page
170 © 2011 SAP AG. All rights reserved. 2011
SAP Class Week of April 16, 2012
BPC430 Lesson: Formatting
Figure 111: Row Formatting
a) From the EPM Ribbon choose View Formats.
The EPMFormattingSheet opens.
Hint: If the sheet does not open, select it from the available sheetsin your workbook. It will be the first sheet.
b) In the Hierarchy Level Formatting section, note that Hierarchy LevelFormatting is already selected in cell H5.
c) At the top of the section, choose the radio buttons for Priority to RowFormat and Structure Levels in D6.
d) In the Row Section, select Apply to the left of Formatting on Specific Levelaround cell C37 and C38.
e) Also, in the Row Section, click in the cell under the Data column forLevel 1 in F39.
You have selected the cell to apply formats to the rows containing the totalfor the year which is the 1st level of the hierarchy.
f) Right-click on cell F39.
The palette opens to change the format.
g) Choose a fill color of your choice and set that to Bold.
h) Also, in the Row Section, click in the cell under the Data column forLevel 2 in F42.
You have selected the cell to apply formats to the rows for the 2nd levelof the hierarchy.
i) Right-click on that cell.
The palette opens to change the format.
j) Choose a fill color of your choice.
Continued on next page
2011 © 2011 SAP AG. All rights reserved. 171
SAP Class Week of April 16, 2012
Unit 2: The Excel Interface of the EPM add-in BPC430
10. Turn on the Apply Dynamic Formatting option.
a) Click on Sheet 1.
b) From the EPM ribbon, choose Options → Sheet Options.
c) Choose the Formatting tab.
d) Select Apply Dynamic Formatting and confirm that theEPMFormattingSheet is the Default Formatting Sheet. Then choose OK.
Note: If you cannot select Apply Dynamic Formatting, choose OKand choose→ View Formats to display the formatting template.Choose View Formats again to close it.
Choose Options → Sheet Options → Formatting and select ApplyDynamic Formatting and confirm that the EPMFormattingSheet isthe Default Formatting Sheet and choose OK.
Continued on next page
172 © 2011 SAP AG. All rights reserved. 2011
SAP Class Week of April 16, 2012
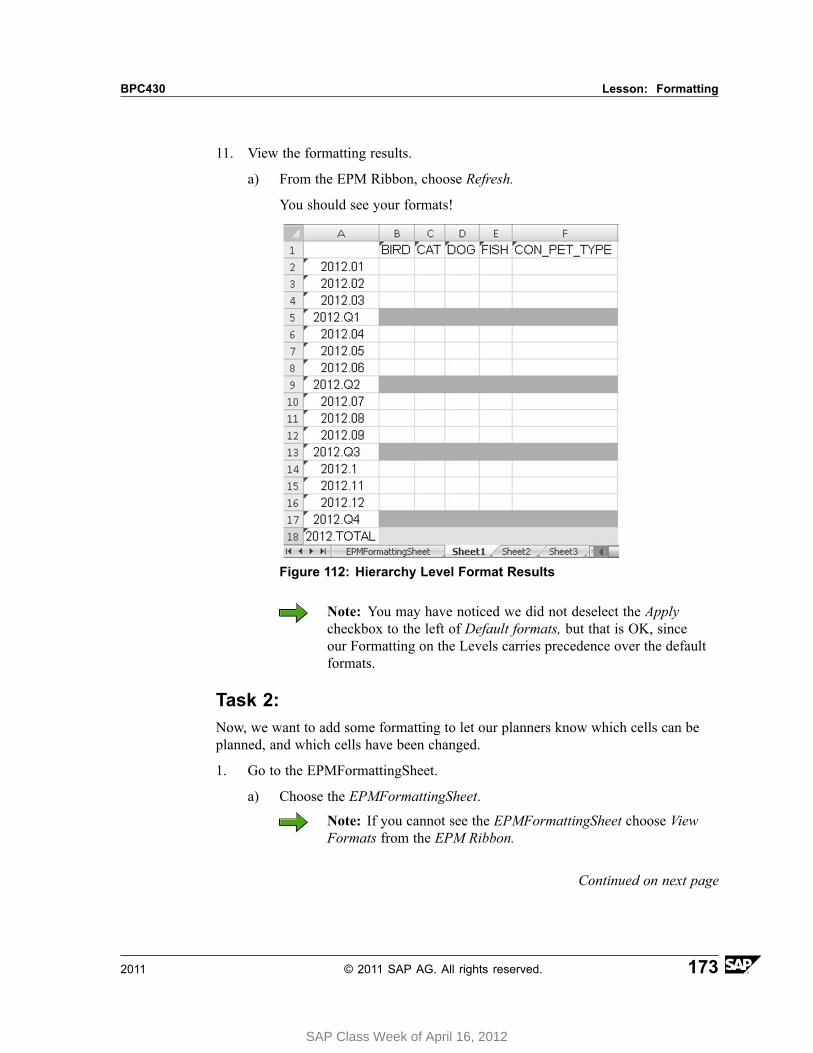
BPC430 Lesson: Formatting
11. View the formatting results.
a) From the EPM Ribbon, choose Refresh.
You should see your formats!
Figure 112: Hierarchy Level Format Results
Note: You may have noticed we did not deselect the Applycheckbox to the left of Default formats, but that is OK, sinceour Formatting on the Levels carries precedence over the defaultformats.
Task 2:Now, we want to add some formatting to let our planners know which cells can beplanned, and which cells have been changed.
1. Go to the EPMFormattingSheet.
a) Choose the EPMFormattingSheet.
Note: If you cannot see the EPMFormattingSheet choose ViewFormats from the EPM Ribbon.
Continued on next page
2011 © 2011 SAP AG. All rights reserved. 173
SAP Class Week of April 16, 2012

Unit 2: The Excel Interface of the EPM add-in BPC430
2. Apply formatting for the Dimension Member/Property Formatting section asshown in the screenshot.
Continued on next page
174 © 2011 SAP AG. All rights reserved. 2011
SAP Class Week of April 16, 2012
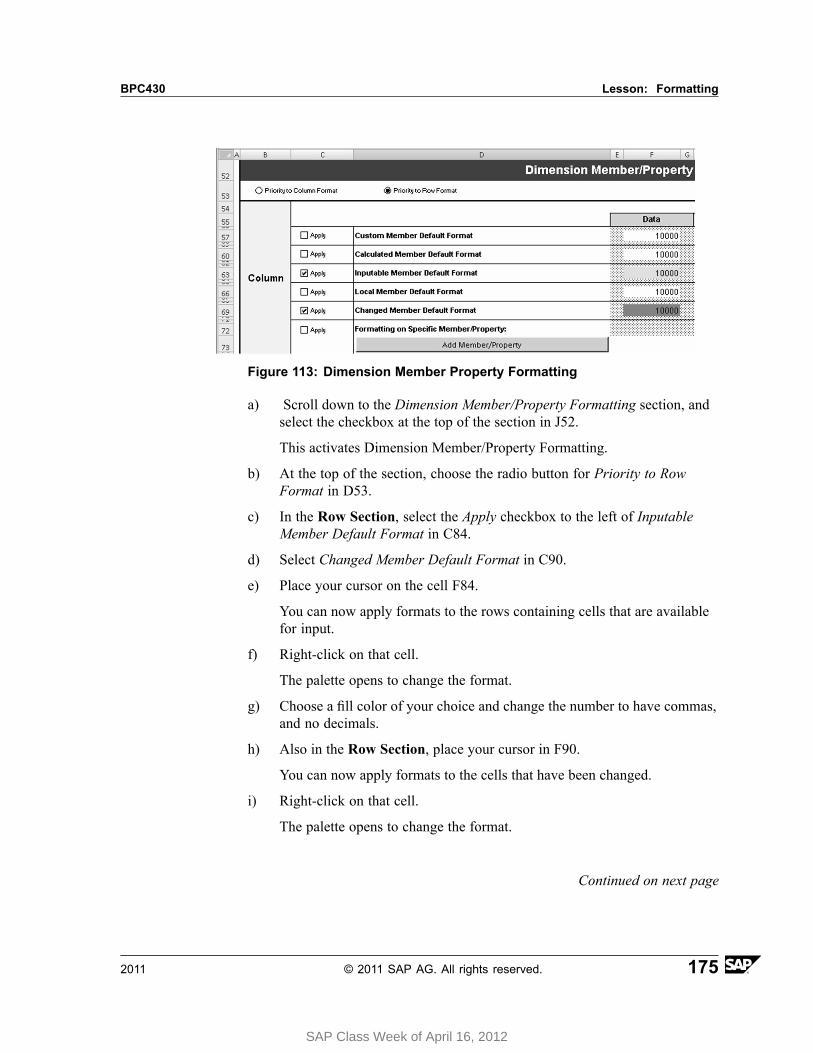
BPC430 Lesson: Formatting
Figure 113: Dimension Member Property Formatting
a) Scroll down to the Dimension Member/Property Formatting section, andselect the checkbox at the top of the section in J52.
This activates Dimension Member/Property Formatting.
b) At the top of the section, choose the radio button for Priority to RowFormat in D53.
c) In the Row Section, select the Apply checkbox to the left of InputableMember Default Format in C84.
d) Select Changed Member Default Format in C90.
e) Place your cursor on the cell F84.
You can now apply formats to the rows containing cells that are availablefor input.
f) Right-click on that cell.
The palette opens to change the format.
g) Choose a fill color of your choice and change the number to have commas,and no decimals.
h) Also in the Row Section, place your cursor in F90.
You can now apply formats to the cells that have been changed.
i) Right-click on that cell.
The palette opens to change the format.
Continued on next page
2011 © 2011 SAP AG. All rights reserved. 175
SAP Class Week of April 16, 2012
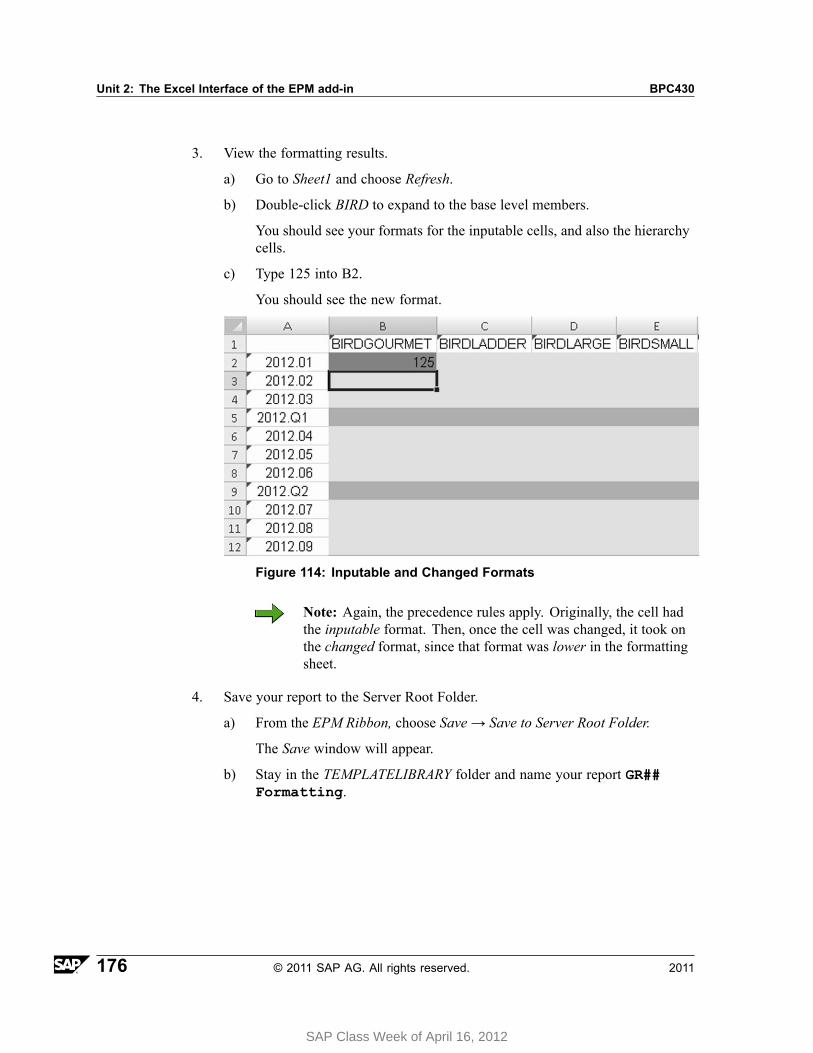
Unit 2: The Excel Interface of the EPM add-in BPC430
3. View the formatting results.
a) Go to Sheet1 and choose Refresh.
b) Double-click BIRD to expand to the base level members.
You should see your formats for the inputable cells, and also the hierarchycells.
c) Type 125 into B2.
You should see the new format.
Figure 114: Inputable and Changed Formats
Note: Again, the precedence rules apply. Originally, the cell hadthe inputable format. Then, once the cell was changed, it took onthe changed format, since that format was lower in the formattingsheet.
4. Save your report to the Server Root Folder.
a) From the EPM Ribbon, choose Save → Save to Server Root Folder.
The Save window will appear.
b) Stay in the TEMPLATELIBRARY folder and name your report GR##Formatting.
176 © 2011 SAP AG. All rights reserved. 2011
SAP Class Week of April 16, 2012

BPC430 Lesson: Formatting
Lesson Summary
You should now be able to:• Work with the formatting style sheet to create more attractive reports.
2011 © 2011 SAP AG. All rights reserved. 177
SAP Class Week of April 16, 2012
Unit 2: The Excel Interface of the EPM add-in BPC430
Lesson: Multi-Source Reporting
Lesson OverviewIn the EPM add-in, you can create multi-reporting spreadsheets, based on severaldata sources.
Lesson ObjectivesAfter completing this lesson, you will be able to:
• Create a workbook with two different reports from two different connections.• Create two reports that share a row axis.
Business ExampleYou need to know how to combine data from multiples sources into one workbook.
Multi-Source ReportingIn the EPM add-in, you can create multi-reporting spreadsheets, based on severalconnections (data sources). For instance, in a single worksheet, you can displaydifferent reports. The first report can be connected to a Planning and Consolidationdata source and a second report can be connected to a BW InfoCube using a LocalODBO Provider Connection.
178 © 2011 SAP AG. All rights reserved. 2011
SAP Class Week of April 16, 2012

BPC430 Lesson: Multi-Source Reporting
Figure 115: Multi-Source Reporting
Reporting Using Axis SharingYour worksheet can also contain 2 reports that share an axis. For instance, you cancreate one report that contains the Account dimension in the Row Axis, and the Timedimension in the Column Axis. The second report can share the Row Axis or ColumnAxis by using the Row or Column Axis Share with: dropdown where you will pointto the report that you want to share the axis with. This is referred to as a “Butterfly”report.
2011 © 2011 SAP AG. All rights reserved. 179
SAP Class Week of April 16, 2012
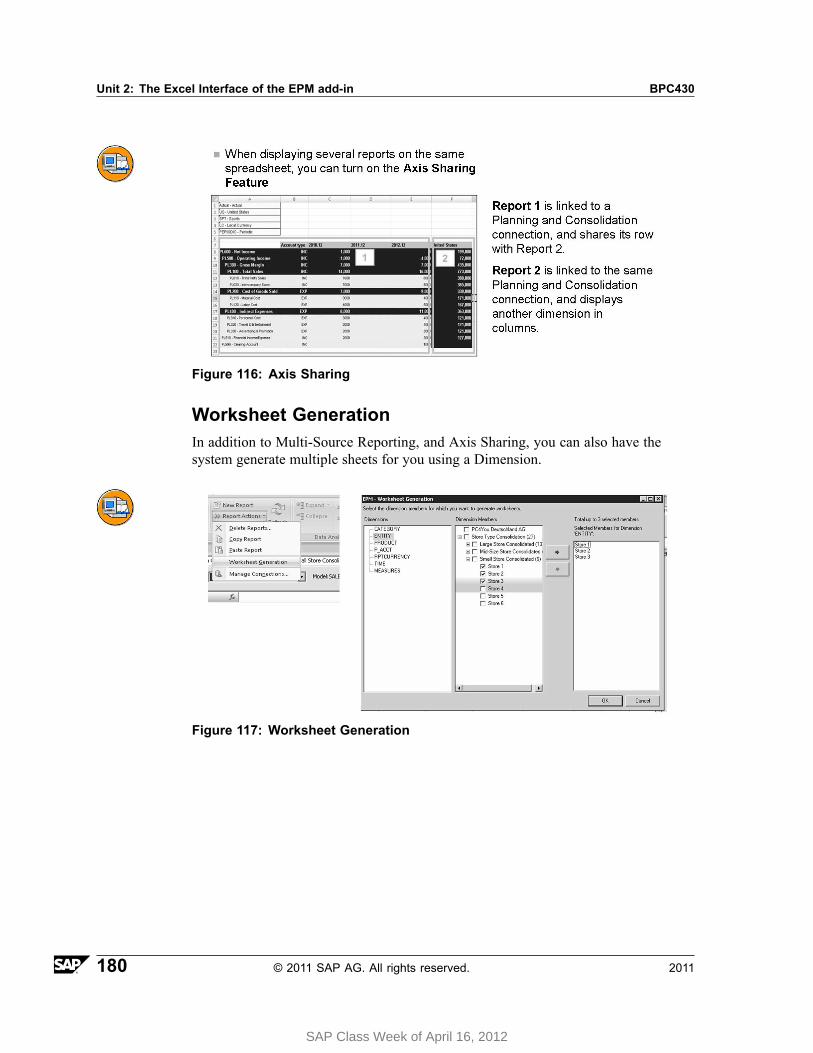
Unit 2: The Excel Interface of the EPM add-in BPC430
Figure 116: Axis Sharing
Worksheet GenerationIn addition to Multi-Source Reporting, and Axis Sharing, you can also have thesystem generate multiple sheets for you using a Dimension.
Figure 117: Worksheet Generation
180 © 2011 SAP AG. All rights reserved. 2011
SAP Class Week of April 16, 2012
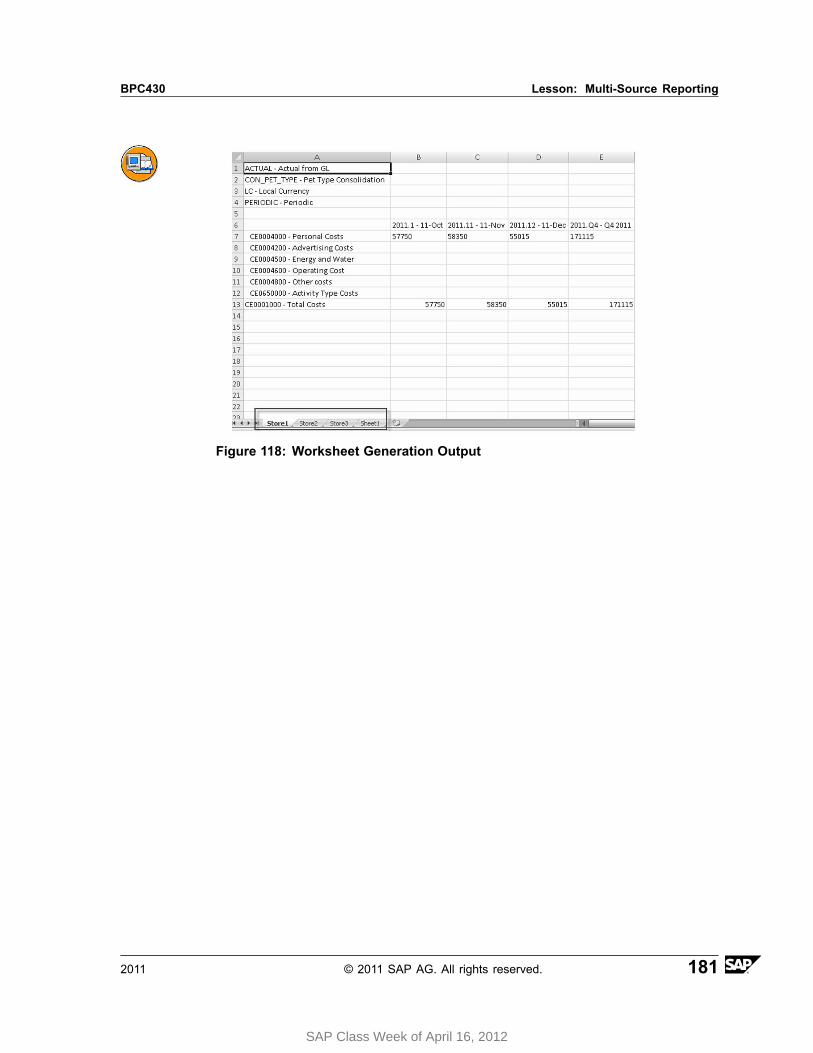
BPC430 Lesson: Multi-Source Reporting
Figure 118: Worksheet Generation Output
2011 © 2011 SAP AG. All rights reserved. 181
SAP Class Week of April 16, 2012

Unit 2: The Excel Interface of the EPM add-in BPC430
182 © 2011 SAP AG. All rights reserved. 2011
SAP Class Week of April 16, 2012

BPC430 Lesson: Multi-Source Reporting
Exercise 7: Multi-Source Reporting
Exercise ObjectivesAfter completing this exercise, you will be able to:• Create a multi-source workbook, an axis sharing workbook, and a multiple
sheet workbook.
Business ExampleYou would like to see how to create multiple reports within your Excel Workbook.
Task 1:In this exercise, you will use the Multi-Source reporting feature available for yourinput form within the EPM add-in.
1. Go to the Excel client for your Sales model in your BPC430_## environment.
Note: If you do not have a connection for the Sales model, use theinstructions in Exercise #2 to create it.
Note: If you are ALREADY in Excel, go to Step #2.
2. If you do not have a blank workbook, create one. If you have one, move to Step 3.
3. On the EPM - Pane, make sure the Sales - BPC430_## connection is selected.
4. Set your EPM Context.
5. Create a report with the Product dimension in the Row Axis and Time in theColumn Axis.
For the Product dimension, set the members to All Dog Products, member andchildren.
For the Time dimension, set the member to 2011, children.
6. Save this report in the Server root folder. Name it GR## Multi.
7. Create another connection to the Expense Model for your assigned Environment.
8. Create another report on the Expense Connection.
9. Close the report without saving.
Continued on next page
2011 © 2011 SAP AG. All rights reserved. 183
SAP Class Week of April 16, 2012
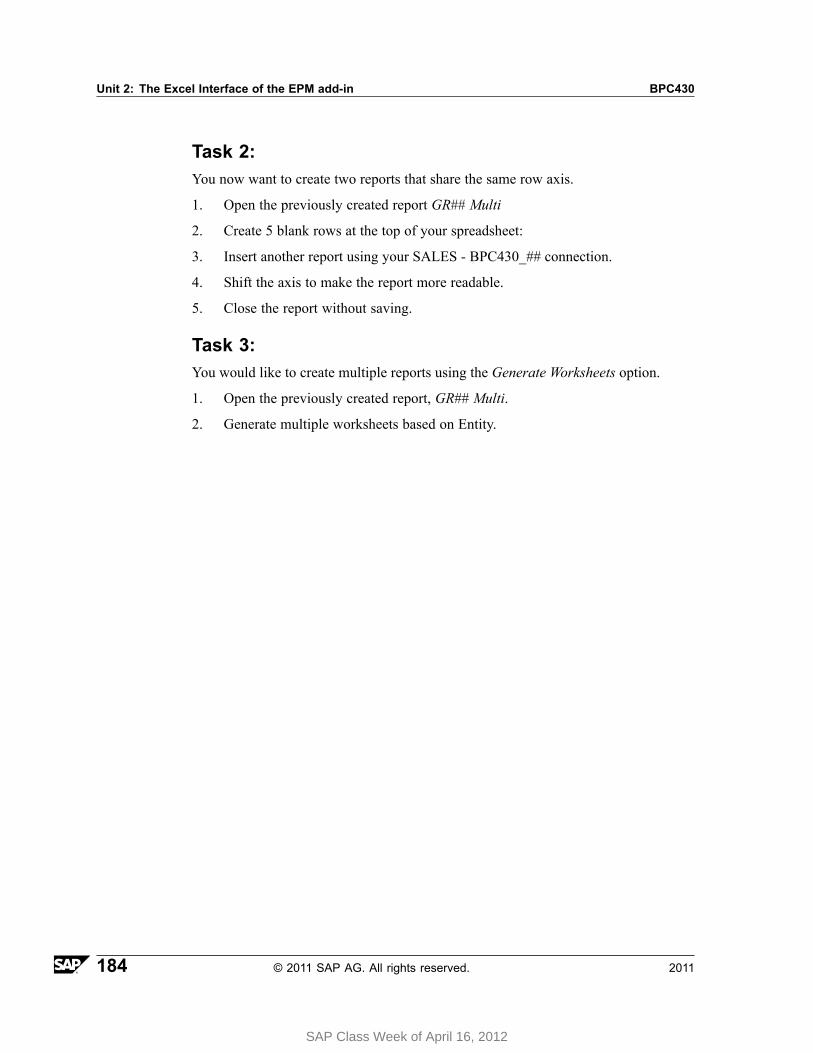
Unit 2: The Excel Interface of the EPM add-in BPC430
Task 2:You now want to create two reports that share the same row axis.
1. Open the previously created report GR## Multi
2. Create 5 blank rows at the top of your spreadsheet:
3. Insert another report using your SALES - BPC430_## connection.
4. Shift the axis to make the report more readable.
5. Close the report without saving.
Task 3:You would like to create multiple reports using the Generate Worksheets option.
1. Open the previously created report, GR## Multi.
2. Generate multiple worksheets based on Entity.
184 © 2011 SAP AG. All rights reserved. 2011
SAP Class Week of April 16, 2012
BPC430 Lesson: Multi-Source Reporting
Solution 7: Multi-Source ReportingTask 1:In this exercise, you will use the Multi-Source reporting feature available for yourinput form within the EPM add-in.
1. Go to the Excel client for your Sales model in your BPC430_## environment.
Note: If you do not have a connection for the Sales model, use theinstructions in Exercise #2 to create it.
Note: If you are ALREADY in Excel, go to Step #2.
a) From your web client's Start Page, choose EPM Office Add-in Excel.
Excel opens and the EPM - Connection Manager appears.
b) Choose the Sales - BPC430_## connection.
c) Click OK.
2. If you do not have a blank workbook, create one. If you have one, move to Step 3.
a) Create a blank workbook by choosing the Office button and choose New.
b) Choose Create.
3. On the EPM - Pane, make sure the Sales - BPC430_## connection is selected.
a) On the EPM -Pane, select the Sales - BPC430_## connection from thedropdown, if not already selected.
4. Set your EPM Context.
a) Set your EPM Context to the following:
Dimension Member ID - Description
CATEGORY Actual - Actual from GL
ENTITY STORE1 - Store1
PRODUCT DOG - All Dog Products
P_ACCT CE0001000 - Total Costs
RPTCURRENCY LC - Local Currency
Continued on next page
2011 © 2011 SAP AG. All rights reserved. 185
SAP Class Week of April 16, 2012

Unit 2: The Excel Interface of the EPM add-in BPC430
TIME 2011.TOTAL - 2011
MEASURES PERIODIC - Periodic
5. Create a report with the Product dimension in the Row Axis and Time in theColumn Axis.
For the Product dimension, set the members to All Dog Products, member andchildren.
For the Time dimension, set the member to 2011, children.
a) From the EPM Ribbon, choose New Report.
The EPM - Report Editor window opens.
b) Drag and drop the PRODUCT dimension to the Row Axis Dimensions.
c) Drag and drop the TIME dimension to the Column Axis Dimensions.
d) Verify that B2 is the first cell to return the data range.
e) Open the EPM - Member Selector by clicking on the Time in the ColumnAxis.
The EPM - Member Selector window opens.
f) Move the Selected Members Context 2011.TOTAL - 2011, withthe Relationship Member and Children to the left.
g) Choose 2011.TOTAL - 2011 by placing a checkbox to the left ofthe member. On the bottom left, set your Selection Relationship toChildren. Move this selection to the right under Selected Membersby using the arrow.
h) Select ID as the display for TIME.
i) Choose OK to close the EPM - Member Selector.
j) In the row axis, click PRODUCT.
The EPM - Member Selector window opens.
k) Select ID as the display for PRODUCT.
l) Choose OK to close the EPM - Member Selector.
m) Choose OK again to close the EPM - Report Editor.
Continued on next page
186 © 2011 SAP AG. All rights reserved. 2011
SAP Class Week of April 16, 2012

BPC430 Lesson: Multi-Source Reporting
The Report is executed.
6. Save this report in the Server root folder. Name it GR## Multi.
a) From the EPM Ribbon choose Save → Save to Server Root Folder
The Save window opens.
b) On the left choose the Company (Public) folder.
c) Under the Template Library choose Reports
d) Type the File Name GR## Multi.
e) Choose Save.
f) Remain in this report for the next step.
7. Create another connection to the Expense Model for your assigned Environment.
a) From the EPM Pane, under Active Connection, select the dropdown andchoose Select Another Connection.
Note: If you already have the EXPENSE - BPC430_## connection,select it as the Active Connection in the EPM Pane and move onto Step #8 below.
The EPM - Connection Manager window is displayed.
b) Choose the Create button.
The Create Connection window appears.
c) In the Server URL field, type: http://wd-flbmt7122.wdf.sap.corp:54080/sap/bpc/ (no dashes) as shown below.
Continued on next page
2011 © 2011 SAP AG. All rights reserved. 187
SAP Class Week of April 16, 2012
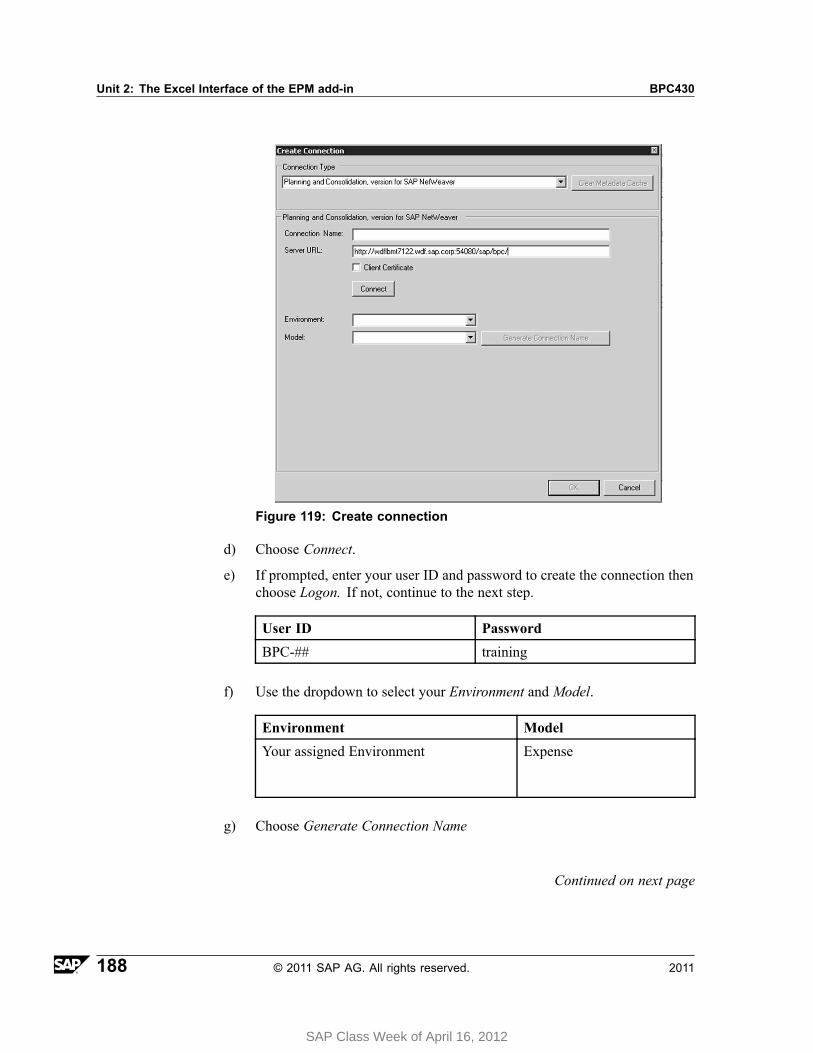
Unit 2: The Excel Interface of the EPM add-in BPC430
Figure 119: Create connection
d) Choose Connect.
e) If prompted, enter your user ID and password to create the connection thenchoose Logon. If not, continue to the next step.
User ID Password
BPC-## training
f) Use the dropdown to select your Environment and Model.
Environment Model
Your assigned Environment Expense
g) Choose Generate Connection Name
Continued on next page
188 © 2011 SAP AG. All rights reserved. 2011
SAP Class Week of April 16, 2012
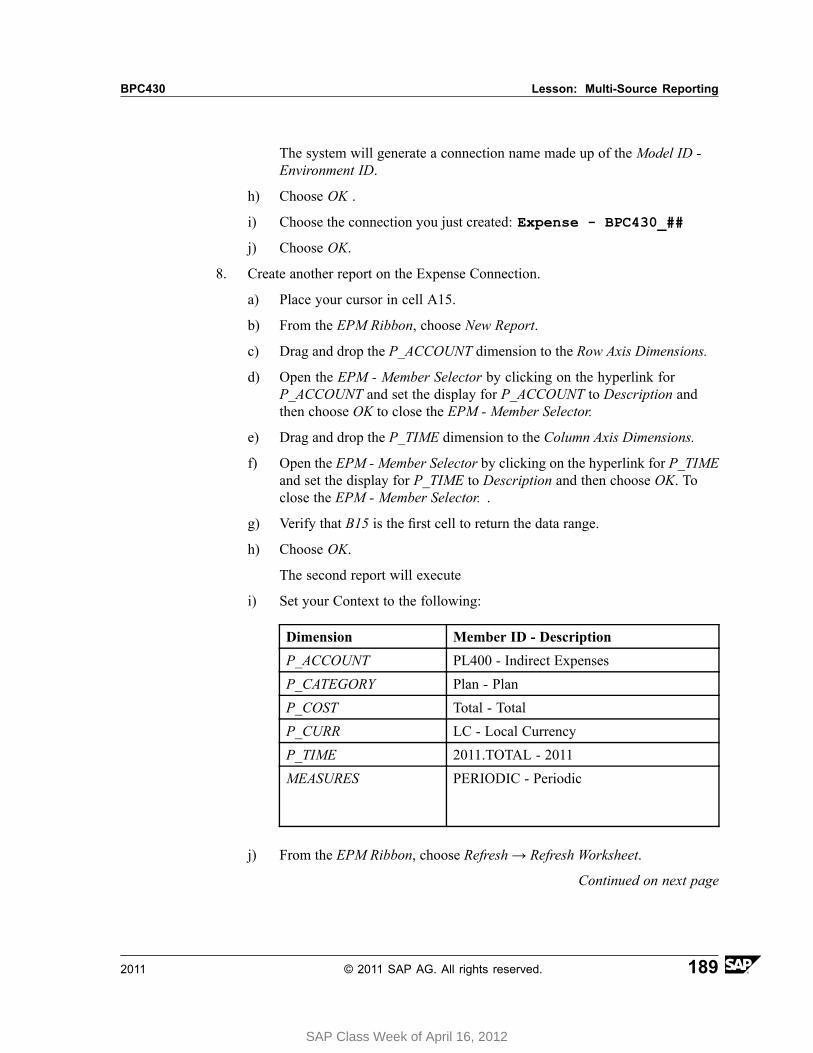
BPC430 Lesson: Multi-Source Reporting
The system will generate a connection name made up of the Model ID -Environment ID.
h) Choose OK .
i) Choose the connection you just created: Expense - BPC430_##
j) Choose OK.
8. Create another report on the Expense Connection.
a) Place your cursor in cell A15.
b) From the EPM Ribbon, choose New Report.
c) Drag and drop the P_ACCOUNT dimension to the Row Axis Dimensions.
d) Open the EPM - Member Selector by clicking on the hyperlink forP_ACCOUNT and set the display for P_ACCOUNT to Description andthen choose OK to close the EPM - Member Selector.
e) Drag and drop the P_TIME dimension to the Column Axis Dimensions.
f) Open the EPM - Member Selector by clicking on the hyperlink for P_TIMEand set the display for P_TIME to Description and then choose OK. Toclose the EPM - Member Selector. .
g) Verify that B15 is the first cell to return the data range.
h) Choose OK.
The second report will execute
i) Set your Context to the following:
Dimension Member ID - Description
P_ACCOUNT PL400 - Indirect Expenses
P_CATEGORY Plan - Plan
P_COST Total - Total
P_CURR LC - Local Currency
P_TIME 2011.TOTAL - 2011
MEASURES PERIODIC - Periodic
j) From the EPM Ribbon, choose Refresh → Refresh Worksheet.
Continued on next page
2011 © 2011 SAP AG. All rights reserved. 189
SAP Class Week of April 16, 2012
Unit 2: The Excel Interface of the EPM add-in BPC430
Both reports will refresh. You now have data from two different modelsfrom your environment. However, you could have selected from anotherEnvironment, or even a BW InfoCube. See the Procedure within this bookto connect to a BW InfoCube.
9. Close the report without saving.
a) From the Office Button, choose Close.
The Microsoft Office Excel window will open.
b) Choose No. (We do not want to save).
Task 2:You now want to create two reports that share the same row axis.
1. Open the previously created report GR## Multi
a) From the EPM Ribbon, choose Open → Open Server Root Folder →Reports
b) Choose GR## Multi and choose Open.
2. Create 5 blank rows at the top of your spreadsheet:
a) Create 5 blank rows at the top by selecting rows 1 through 5, thenright-click and choose Insert.
Your data in your report should now begin in cell B7.
Continued on next page
190 © 2011 SAP AG. All rights reserved. 2011
SAP Class Week of April 16, 2012
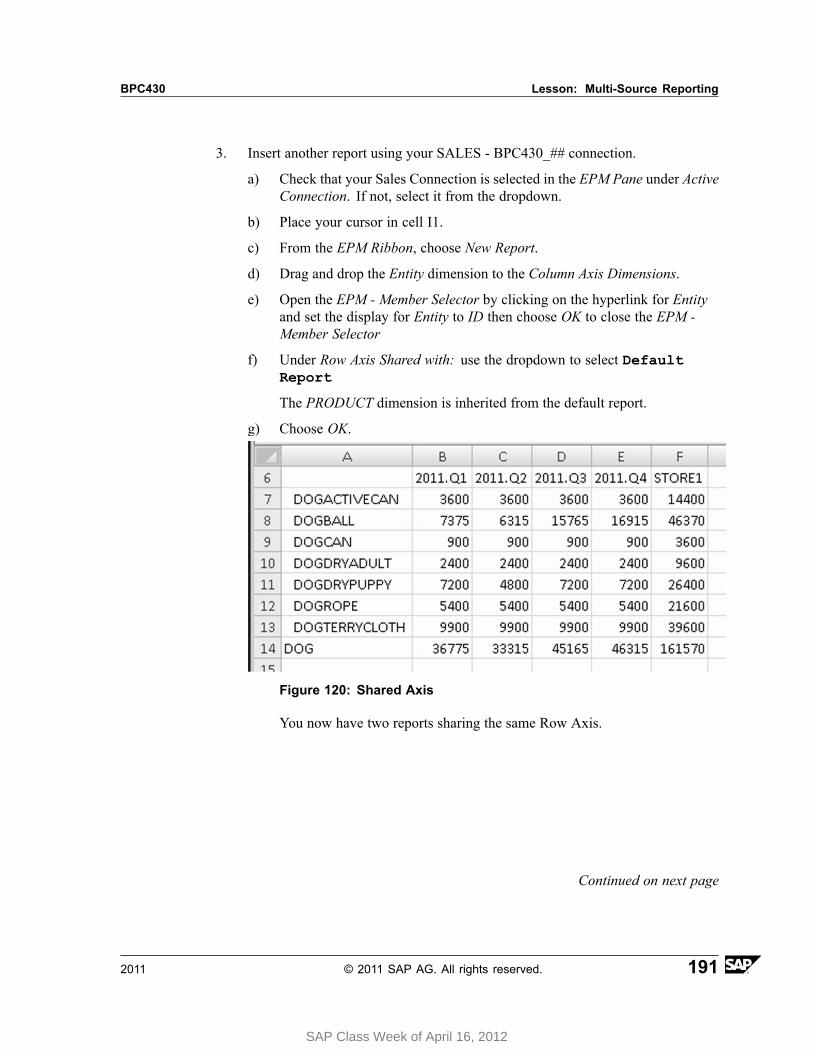
BPC430 Lesson: Multi-Source Reporting
3. Insert another report using your SALES - BPC430_## connection.
a) Check that your Sales Connection is selected in the EPM Pane under ActiveConnection. If not, select it from the dropdown.
b) Place your cursor in cell I1.
c) From the EPM Ribbon, choose New Report.
d) Drag and drop the Entity dimension to the Column Axis Dimensions.
e) Open the EPM - Member Selector by clicking on the hyperlink for Entityand set the display for Entity to ID then choose OK to close the EPM -Member Selector
f) Under Row Axis Shared with: use the dropdown to select DefaultReport
The PRODUCT dimension is inherited from the default report.
g) Choose OK.
Figure 120: Shared Axis
You now have two reports sharing the same Row Axis.
Continued on next page
2011 © 2011 SAP AG. All rights reserved. 191
SAP Class Week of April 16, 2012

Unit 2: The Excel Interface of the EPM add-in BPC430
4. Shift the axis to make the report more readable.
a) From the EPM Pane, under Current Report, choose Default Report fromthe dropdown. (This is the 1st report)
b) From the EPM Ribbon, choose Edit Report.
The EPM - Report Editor should open. Make sure you are in DefaultReport. (This will be in the upper left.) If not, close the EPM - ReportEditor and select it from the dropdown again.
c) For the Row Axis Dimensions, choose a shift of -1 by clicking the downarrow once.
The Column Axis shifts to the left and the Row Axis shifts to the right.
d) Choose OK to close the EPM - Report Editor.
Figure 121: Shared Axis with a Shift
The Row Axis is now between the two reports.
5. Close the report without saving.
a) From the Office Button, choose Close.
The Microsoft Office Excel window will open.
b) Choose No. (We do not want to save.)
Continued on next page
192 © 2011 SAP AG. All rights reserved. 2011
SAP Class Week of April 16, 2012
BPC430 Lesson: Multi-Source Reporting
Task 3:You would like to create multiple reports using the Generate Worksheets option.
1. Open the previously created report, GR## Multi.
a) From the EPM Ribbon, choose Open → Open from Server Report Folder.
b) Choose Company(Public) → Reports then GR## Multi and choose Open.
2. Generate multiple worksheets based on Entity.
a) From the EPM Ribbon, choose Report Actions → Worksheet Generation.
The EPM - Worksheet Generation window opens.
b) Under Dimensions, choose Entity.
c) Then choose the Select Members button.
The EPM - Member Selector opens.
d) Under Dimension Members, place a checkbox next to Store1,Store2, and Store3. (You will find this under Store TypeConsolidation → Small Store Consolidated... but the Store numbers maynot be in order!)
e) Move these entries using the blue arrow pointing right.
f) Then choose OK.
Note: If you receive the Dynamic Relationship - Warning chooseYes.
g) Then choose OK to close the EPM - Worksheet Generation window.
Continued on next page
2011 © 2011 SAP AG. All rights reserved. 193
SAP Class Week of April 16, 2012
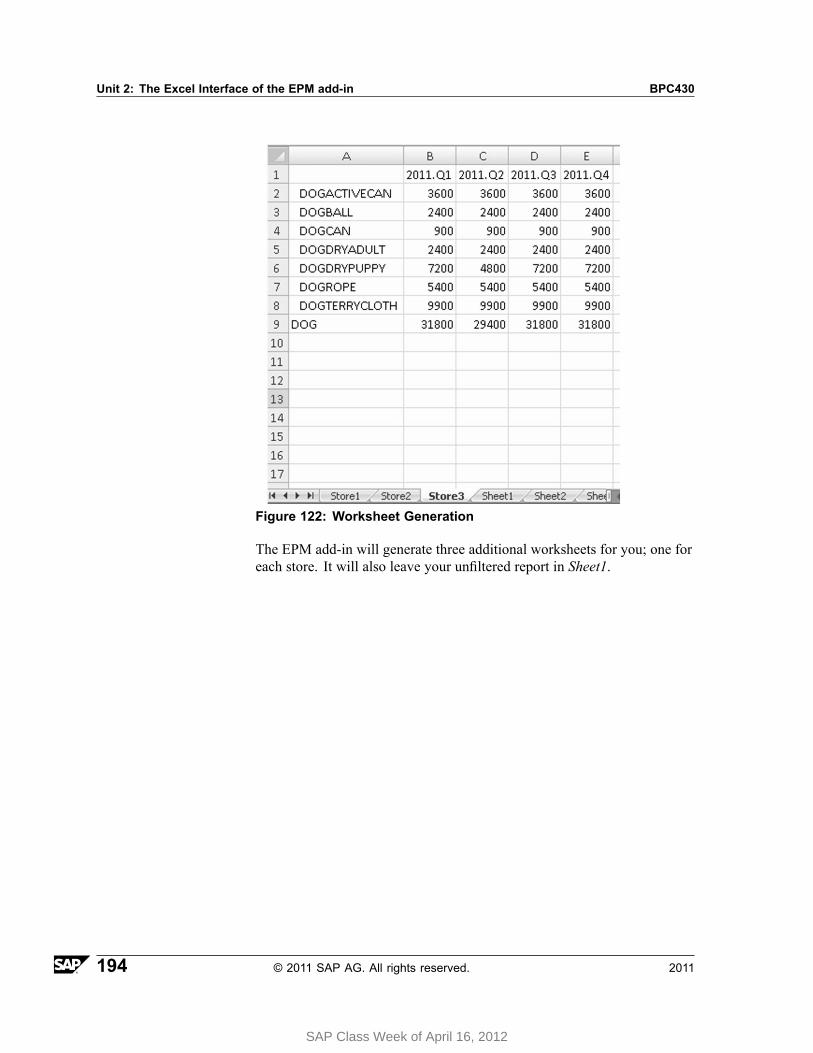
Unit 2: The Excel Interface of the EPM add-in BPC430
Figure 122: Worksheet Generation
The EPM add-in will generate three additional worksheets for you; one foreach store. It will also leave your unfiltered report in Sheet1.
194 © 2011 SAP AG. All rights reserved. 2011
SAP Class Week of April 16, 2012

BPC430 Lesson: Multi-Source Reporting
Lesson Summary
You should now be able to:• Create a workbook with two different reports from two different connections.• Create two reports that share a row axis.
2011 © 2011 SAP AG. All rights reserved. 195
SAP Class Week of April 16, 2012
Unit 2: The Excel Interface of the EPM add-in BPC430
Lesson: Using Basic and Advanced EPM Functions &Creating Cell Based Reports
Lesson OverviewIn this lesson, you will learn how to use the EPM Functions and how to do cell basedreporting.
Lesson ObjectivesAfter completing this lesson, you will be able to:
• Use EPM functions to pull in descriptions and properties into your reports• Create reports and input forms from scratch• Discuss the most important delivered EPM functions• Perform smart variance calculations• Use the time offset function• Set up a push button
Business ExampleYou need to add header information to your reports and you also need to convert anexisting planning excel spreadsheet so you can use it against the central database.
Function CategoriesThere are three function categories for EPM:
1. EVFunctions (Deprecated) - obsolete EV functions2. EPMFunctions - delivered EPM functions3. FPMXLClient.TechnicalCategory - system internal use
If you work with reports that have been created with former versions of Planning andConsolidation (before version 10), some functions beginning with EV continue towork but their names are not automatically converted into EPM. From version 10, thenames of the functions begin with EPM.
All the functions beginning with EV are gathered under the EVFunctions (Deprecated)category.
196 © 2011 SAP AG. All rights reserved. 2011
SAP Class Week of April 16, 2012
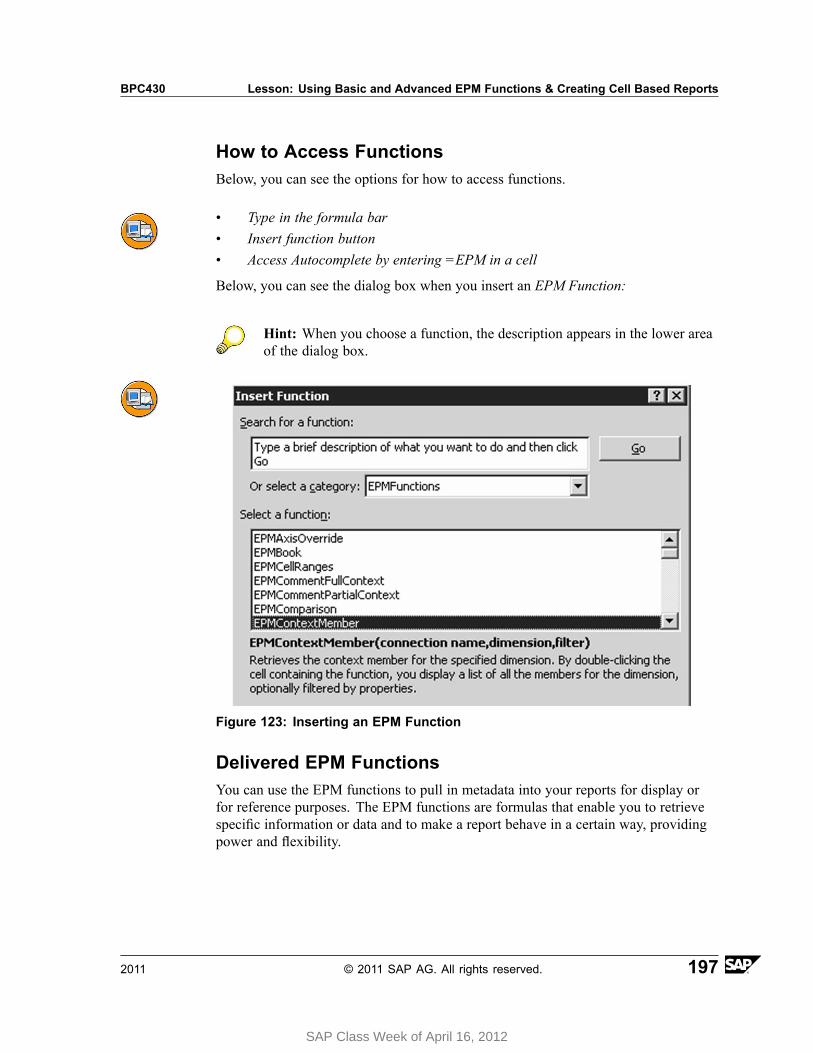
BPC430 Lesson: Using Basic and Advanced EPM Functions & Creating Cell Based Reports
How to Access FunctionsBelow, you can see the options for how to access functions.
• Type in the formula bar• Insert function button• Access Autocomplete by entering =EPM in a cell
Below, you can see the dialog box when you insert an EPM Function:
Hint: When you choose a function, the description appears in the lower areaof the dialog box.
Figure 123: Inserting an EPM Function
Delivered EPM FunctionsYou can use the EPM functions to pull in metadata into your reports for display orfor reference purposes. The EPM functions are formulas that enable you to retrievespecific information or data and to make a report behave in a certain way, providingpower and flexibility.
2011 © 2011 SAP AG. All rights reserved. 197
SAP Class Week of April 16, 2012
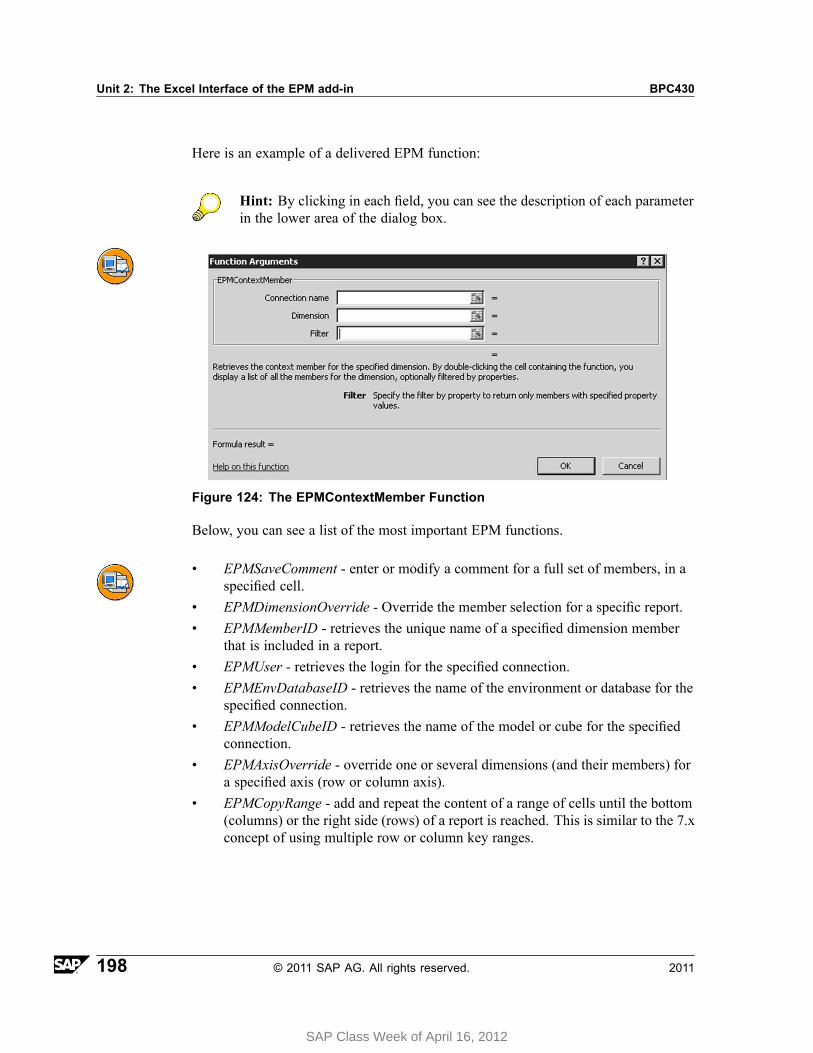
Unit 2: The Excel Interface of the EPM add-in BPC430
Here is an example of a delivered EPM function:
Hint: By clicking in each field, you can see the description of each parameterin the lower area of the dialog box.
Figure 124: The EPMContextMember Function
Below, you can see a list of the most important EPM functions.
• EPMSaveComment - enter or modify a comment for a full set of members, in aspecified cell.
• EPMDimensionOverride - Override the member selection for a specific report.• EPMMemberID - retrieves the unique name of a specified dimension member
that is included in a report.• EPMUser - retrieves the login for the specified connection.• EPMEnvDatabaseID - retrieves the name of the environment or database for the
specified connection.• EPMModelCubeID - retrieves the name of the model or cube for the specified
connection.• EPMAxisOverride - override one or several dimensions (and their members) for
a specified axis (row or column axis).• EPMCopyRange - add and repeat the content of a range of cells until the bottom
(columns) or the right side (rows) of a report is reached. This is similar to the 7.xconcept of using multiple row or column key ranges.
198 © 2011 SAP AG. All rights reserved. 2011
SAP Class Week of April 16, 2012
BPC430 Lesson: Using Basic and Advanced EPM Functions & Creating Cell Based Reports
• EPMInsertCellsBeforeAfterBlock - insert cells before or after a block of membersfor a specified dimension.
Note: This is similar to the 7.x concept of the before range.
• EPMReportOptions - override the options for one or more reports.
The override applies to a report only if the Inherit Sheet Options option is notselected in the Options tab of the Report Editor.
• EPMDimensionProperty - retrieves the properties of a specified dimension ina specified cell range.
• EPMMemberDesc - retrieves the description of the specified dimension member.• EPMMemberOffset - retrieves a member related to another member by specifying
an offset from a given member to retrieve the previous or subsequent member.• EPMSelectMember - retrieves a specified dimension member when you
double-click the cell containing the function.• EPMScaleData - retrieves data for a full set of members, and scales the data.• EPMSaveComment - enter or modify a comment for a full set of members.• EPMSaveData - enter or modify a data for a full set of members• EPMWorkStatus - retrieves the work status for a model and data intersection.• EPMComparison - calculates variances with a sign dependant to the relevant
account's acctype property. For example, if the actual is above the plan value fora revenue account, the variance is positive.
• EPMURL - launches the specified web client component.• EPMBook - retrieves a specified text you can double-click to open a book
published in Planning and Consolidation web client.• EPMLink - retrieves a specified text on which you double-click to open a report
contained in another file, that is a Microsoft Excel workbook, a Word documentor a PowerPoint presentation. The context is passed along.
• EPMExecuteAPI - execute API's (application programming interface) directlyfrom a worksheet cell.
EPMDimensionOverride ParametersOverride the member selection for a specified dimension in one or several reports.The dimension member selection performed in the Member Selector is replaced by aspecific cell or range of cells.
2011 © 2011 SAP AG. All rights reserved. 199
SAP Class Week of April 16, 2012
Unit 2: The Excel Interface of the EPM add-in BPC430
Below, you can see the relevant parameters for this function.
• ReportID - ID of one or several reports.• Dimension - Specify the dimension name.• Members - Members you want to select for the specified dimension. The
members will override the members selected in the report.
EPMAxisOverride ParametersThis function enables you to override one or several dimensions (and their members)for a specified axis (row or column axis). When you enter the function and then clickEnter, the member override is reflected in the EPM pane, but not in the report. Toreflect the override, refresh the report.
Below, you can see the relevant parameters for this function.
• ReportID - ID of one or several reports.• Row axis - Specify which axis will be overridden. Enter TRUE to override the
row axis, FALSE to override the column axis.• Dimensions - On a Planning and Consolidation connection, specify the
dimension name.• Members - Members that will override the members currently in the report(s).
Note: If you enter EUR,,USD and empty row will be inserted between themembers.
You can also use 7.5 memberset keywords such as BAS, which means baselevel members.
The master report takes precedence over the other reports.
To specify a dimension, you can select the cell in which a dropdown list retrieves thedimensions, with the EPMDimensionList function.
If another dimension is selected from the dropdown list, the dimension change will betaken into account in the EPMAxisOverride function.
You should not use the EPMAxisOverride function more than once on the same axisand the same report.
If you enter one function for the row axis and one for the column axis, the row axistakes precedence over the column axis.
200 © 2011 SAP AG. All rights reserved. 2011
SAP Class Week of April 16, 2012
BPC430 Lesson: Using Basic and Advanced EPM Functions & Creating Cell Based Reports
EPMReportOptions ParametersThis function enables you to override the options for one or more reports. Theoverride applies to a report only if the Inherit Sheet Options option is not selectedin the Options tab of the Report Editor.
• ReportID - ID of one or several reports.• Options - Specify the options that will override the existing report options.
In the options parameter, you can specify one or more options. Use a semicolon, “;”to separate the options.
Here is an example:
To activate this FreezeDataRefresh option, enter: FreezeDataRefresh=true.To deactivate it, enter: FreezeDataRefresh=false.
EPMMemberSortingOverride ParametersOverride the member sorting and grouping that has been previously defined using theinterface (Member Sorting and Grouping area in the Member Selector), for a specifieddimension, in one or several reports.
• ReportID - ID of one or several reports.• Dimension - Specify the dimension name.• Sort - Specify if you want to enable the member sorting. Enter TRUE to enable
the sorting, FALSE if you do not want to enable the sorting.• AscendingOrder - Specify if you want to sort the members by ascending or
descending order. Enter TRUE to sort members by ascending order, FALSEto sort members by descending order.
• Property - Name of the property to sort the members on. The values of thespecified property will be by ascending or descending order, depending on theparameter.
In the Property parameter, you can reference the cell in which theEPMDimension- Property function has been entered.
• AddLocalMember- Before - Specify if you want to insert a grouping localmember the before the set of members. Enter TRUE to insert the grouping localmember. Optional.
• AddLocalMember- After - Specify if you want to insert a grouping local memberthe after the set of members. Enter TRUE to insert the grouping local member.Optional.
2011 © 2011 SAP AG. All rights reserved. 201
SAP Class Week of April 16, 2012
Unit 2: The Excel Interface of the EPM add-in BPC430
EPMContextMember ParametersThis function retrieves the context member for the specified dimension. When youdouble-click the cell containing the function, a dialog box opens, displaying all themembers for the specified dimension.
You can select another member and the context is changed. The list of members canbe optionally filtered, using the dimension properties.
• Name of the connection - Optional. If not specified, the active connection istaken into account.
• Dimension - Dimension name• Filter - Optional. Filter by property to return only members with specified
property values.
Example: EPMContextMember("Finance","Entity","CALC=N;GROUP=SALES").For the Finance connection, the context member of the dimension Entity is displayedin the cell. If you double-click the cell, a dialog box displays a list of all entitymembers filtered by CALC=N and by GROUP=SALES
EPMDimensionProperty ParametersThis function retrieves the properties of a specified dimension in a specified cell range.
• Name of the connection - Optional. If not specified, the active connection istaken into account.
• Dimension - Name of the dimension for which you want to return the properties.• Destination range - Cell range in which the properties will be displayed.
EPMMemberProperty ParametersThis function retrieves the value of a specified property for a specified member.
• Name of the connection - Optional. If not specified, the active connection istaken into account.
• Member - Member name. Mandatory.• Property - Property name. Mandatory.
EPMMemberOffset ParametersThis function retrieves a member related to another member by specifying an offsetfrom a given member to retrieve the previous or subsequent member.
202 © 2011 SAP AG. All rights reserved. 2011
SAP Class Week of April 16, 2012
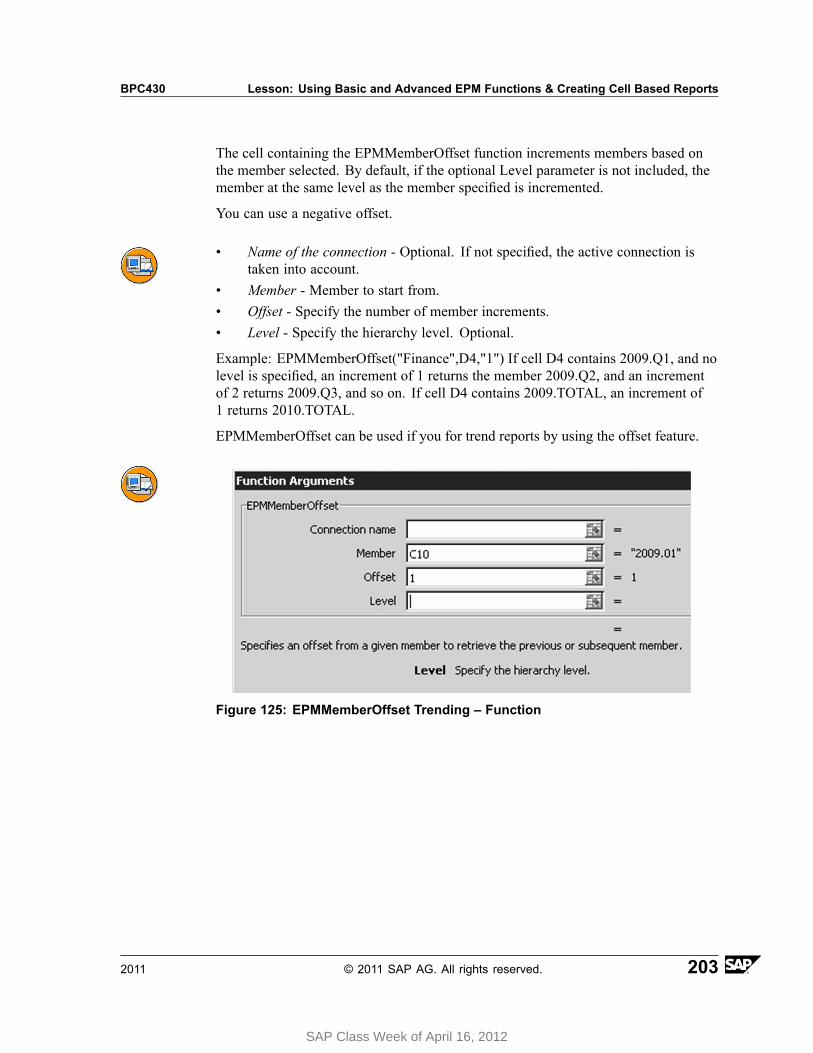
BPC430 Lesson: Using Basic and Advanced EPM Functions & Creating Cell Based Reports
The cell containing the EPMMemberOffset function increments members based onthe member selected. By default, if the optional Level parameter is not included, themember at the same level as the member specified is incremented.
You can use a negative offset.
• Name of the connection - Optional. If not specified, the active connection istaken into account.
• Member - Member to start from.• Offset - Specify the number of member increments.• Level - Specify the hierarchy level. Optional.
Example: EPMMemberOffset("Finance",D4,"1") If cell D4 contains 2009.Q1, and nolevel is specified, an increment of 1 returns the member 2009.Q2, and an incrementof 2 returns 2009.Q3, and so on. If cell D4 contains 2009.TOTAL, an increment of1 returns 2010.TOTAL.
EPMMemberOffset can be used if you for trend reports by using the offset feature.
Figure 125: EPMMemberOffset Trending – Function
2011 © 2011 SAP AG. All rights reserved. 203
SAP Class Week of April 16, 2012
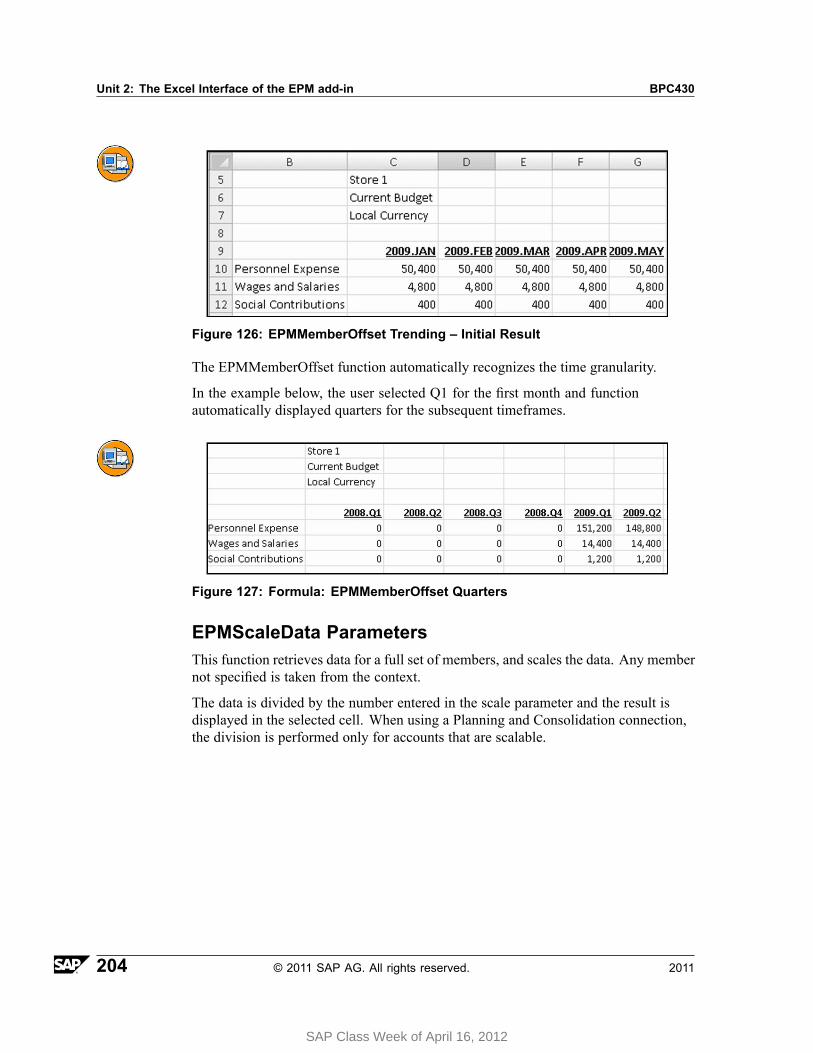
Unit 2: The Excel Interface of the EPM add-in BPC430
Figure 126: EPMMemberOffset Trending – Initial Result
The EPMMemberOffset function automatically recognizes the time granularity.
In the example below, the user selected Q1 for the first month and functionautomatically displayed quarters for the subsequent timeframes.
Figure 127: Formula: EPMMemberOffset Quarters
EPMScaleData ParametersThis function retrieves data for a full set of members, and scales the data. Any membernot specified is taken from the context.
The data is divided by the number entered in the scale parameter and the result isdisplayed in the selected cell. When using a Planning and Consolidation connection,the division is performed only for accounts that are scalable.
204 © 2011 SAP AG. All rights reserved. 2011
SAP Class Week of April 16, 2012
BPC430 Lesson: Using Basic and Advanced EPM Functions & Creating Cell Based Reports
If an account is not scalable, the original amount is displayed in the cell.
• Name of the connection - Optional. If not specified, the active connection istaken into account.
• Scale - Scale value such as 1000.• Name of the connection - Optional. If not specified, the active connection is
taken into account.• Member - Member name. Optional.
Note: You can view the scaling property of an account by selecting it in thesheet and then selecting EPM → More → Member Properties.
Member id's are inherited from the context if not specified in the function.
EPMSaveData ParametersThis function enables you to enter or modify a data for a full set of members, in aspecified cell. Any member not specified is taken from the context. Once you haveentered or modified a data, you can perform a save, using the Save Data button. Themodified data is saved to the server.
• Cell - Cell in which the data will be retrieved.• Name of the connection - Optional.• Member - Member name. Optional.
EPMDimensionList ParametersThis function retrieves the list of all the dimensions of the model for the specifiedconnection.
2011 © 2011 SAP AG. All rights reserved. 205
SAP Class Week of April 16, 2012
Unit 2: The Excel Interface of the EPM add-in BPC430
You can display a list of the dimensions in the current cell or a drop down list.
• Connection Name - Optional
If blank the current connection is used.
• Range - Optional
Specify the cell or cells for the drop down list.
If blank, the dimensions will be listed horizontally in the current cell.
• Separator - Optional
Add a separator such as a comma if the dimensions will be listed horizontallyin the current cell.
If blank, the list separator from your local settings will be used.
EPMInsertCellsBeforeAfterBack ParametersThis function inserts cells before or after a block of members for a specified dimension.
• Report ID - Mandatory
ID of one or several reports.
• Dimension - Mandatory
Specify the dimension name.
• Before - Mandatory
TRUE - insert the cells before.
FALSE - insert the cells after.
• Range - Mandatory
Specify the cell range containing the content to be inserted such as formulasand styles.
Below you can see an example where the difference between Budget and Actual isinserted in the gray columns. In this case, the extra columns were inserted after theblock of category members.
206 © 2011 SAP AG. All rights reserved. 2011
SAP Class Week of April 16, 2012
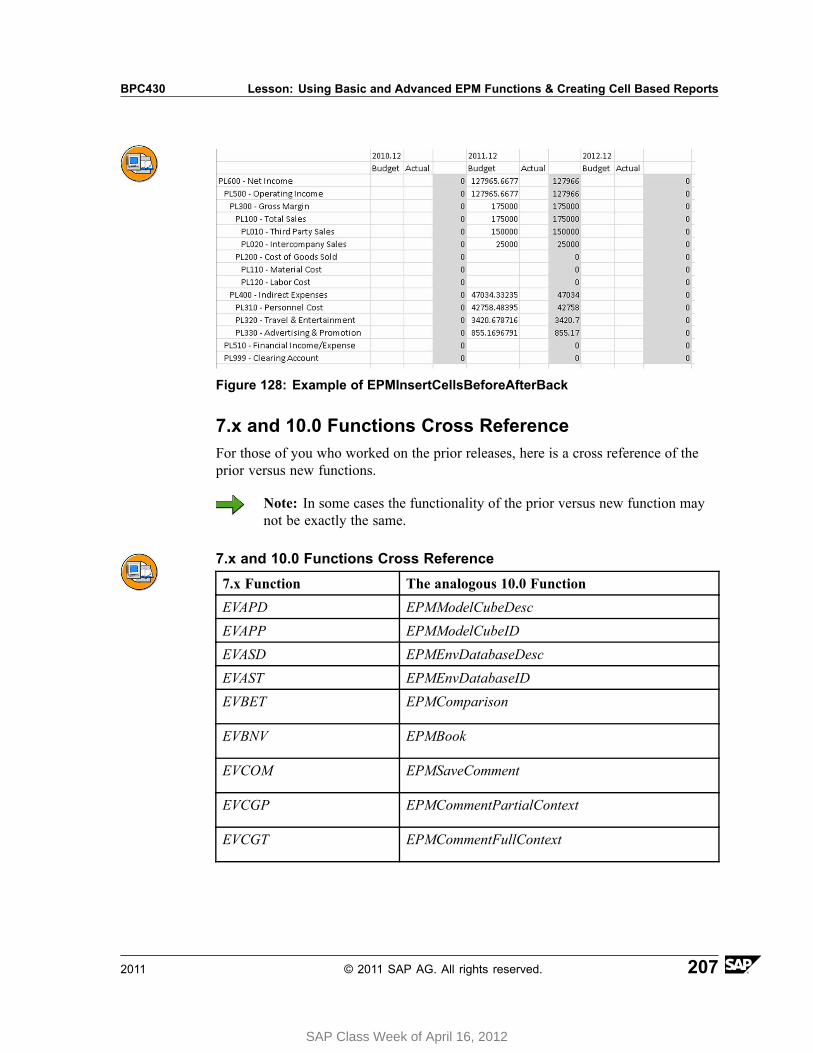
BPC430 Lesson: Using Basic and Advanced EPM Functions & Creating Cell Based Reports
Figure 128: Example of EPMInsertCellsBeforeAfterBack
7.x and 10.0 Functions Cross ReferenceFor those of you who worked on the prior releases, here is a cross reference of theprior versus new functions.
Note: In some cases the functionality of the prior versus new function maynot be exactly the same.
7.x and 10.0 Functions Cross Reference
7.x Function The analogous 10.0 Function
EVAPD EPMModelCubeDesc
EVAPP EPMModelCubeID
EVASD EPMEnvDatabaseDesc
EVAST EPMEnvDatabaseID
EVBET EPMComparison
EVBNV EPMBook
EVCOM EPMSaveComment
EVCGP EPMCommentPartialContext
EVCGT EPMCommentFullContext
2011 © 2011 SAP AG. All rights reserved. 207
SAP Class Week of April 16, 2012
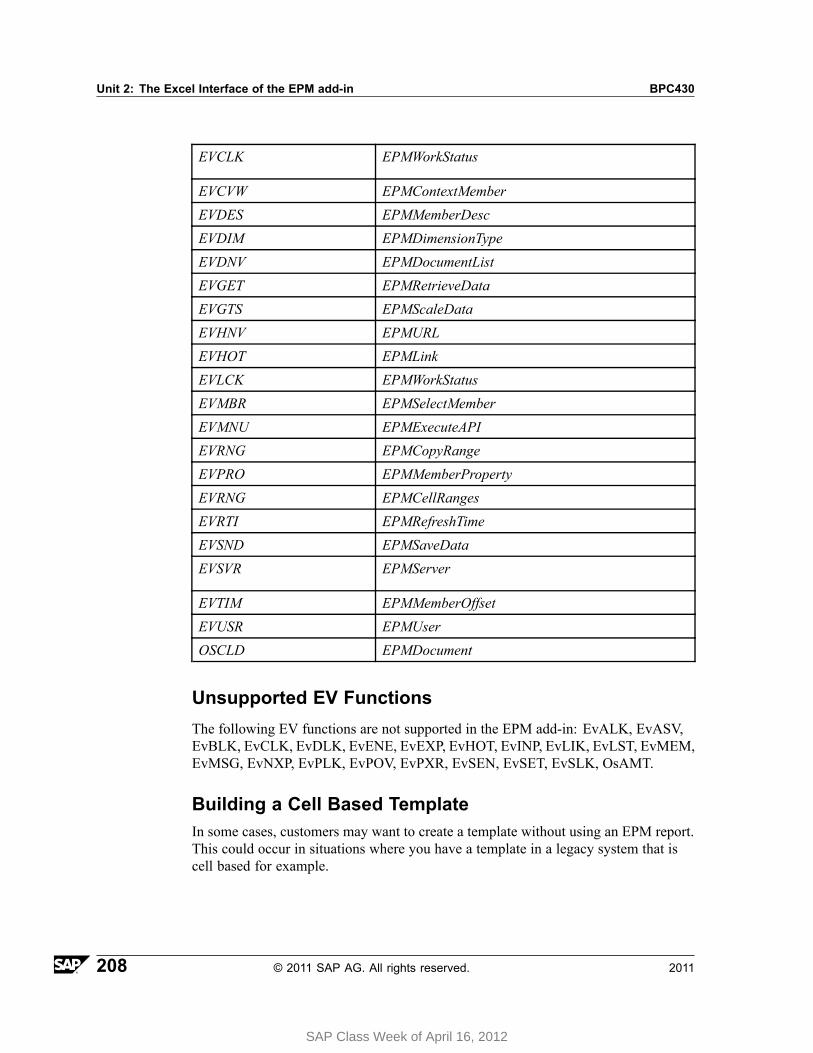
Unit 2: The Excel Interface of the EPM add-in BPC430
EVCLK EPMWorkStatus
EVCVW EPMContextMember
EVDES EPMMemberDesc
EVDIM EPMDimensionType
EVDNV EPMDocumentList
EVGET EPMRetrieveData
EVGTS EPMScaleData
EVHNV EPMURL
EVHOT EPMLink
EVLCK EPMWorkStatus
EVMBR EPMSelectMember
EVMNU EPMExecuteAPI
EVRNG EPMCopyRange
EVPRO EPMMemberProperty
EVRNG EPMCellRanges
EVRTI EPMRefreshTime
EVSND EPMSaveData
EVSVR EPMServer
EVTIM EPMMemberOffset
EVUSR EPMUser
OSCLD EPMDocument
Unsupported EV FunctionsThe following EV functions are not supported in the EPM add-in: EvALK, EvASV,EvBLK, EvCLK, EvDLK, EvENE, EvEXP, EvHOT, EvINP, EvLIK, EvLST, EvMEM,EvMSG, EvNXP, EvPLK, EvPOV, EvPXR, EvSEN, EvSET, EvSLK, OsAMT.
Building a Cell Based TemplateIn some cases, customers may want to create a template without using an EPM report.This could occur in situations where you have a template in a legacy system that iscell based for example.
208 © 2011 SAP AG. All rights reserved. 2011
SAP Class Week of April 16, 2012
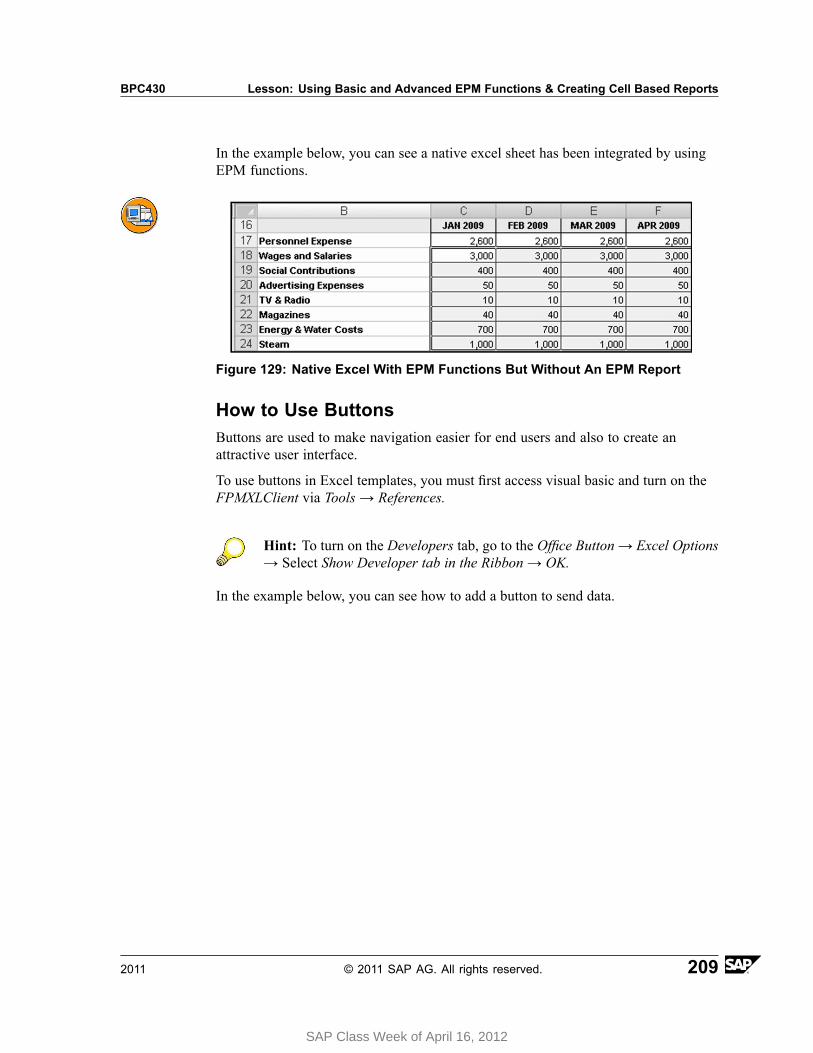
BPC430 Lesson: Using Basic and Advanced EPM Functions & Creating Cell Based Reports
In the example below, you can see a native excel sheet has been integrated by usingEPM functions.
Figure 129: Native Excel With EPM Functions But Without An EPM Report
How to Use ButtonsButtons are used to make navigation easier for end users and also to create anattractive user interface.
To use buttons in Excel templates, you must first access visual basic and turn on theFPMXLClient via Tools → References.
Hint: To turn on the Developers tab, go to the Office Button → Excel Options→ Select Show Developer tab in the Ribbon → OK.
In the example below, you can see how to add a button to send data.
2011 © 2011 SAP AG. All rights reserved. 209
SAP Class Week of April 16, 2012
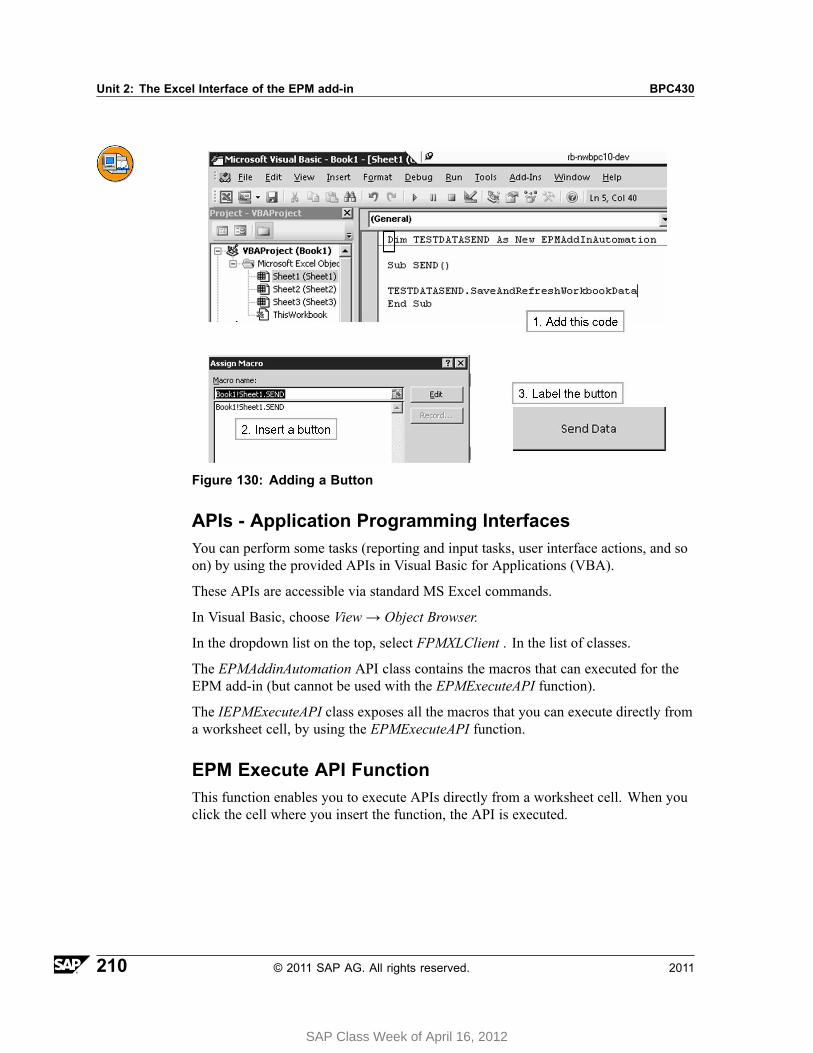
Unit 2: The Excel Interface of the EPM add-in BPC430
Figure 130: Adding a Button
APIs - Application Programming InterfacesYou can perform some tasks (reporting and input tasks, user interface actions, and soon) by using the provided APIs in Visual Basic for Applications (VBA).
These APIs are accessible via standard MS Excel commands.
In Visual Basic, choose View → Object Browser.
In the dropdown list on the top, select FPMXLClient . In the list of classes.
The EPMAddinAutomation API class contains the macros that can executed for theEPM add-in (but cannot be used with the EPMExecuteAPI function).
The IEPMExecuteAPI class exposes all the macros that you can execute directly froma worksheet cell, by using the EPMExecuteAPI function.
EPM Execute API FunctionThis function enables you to execute APIs directly from a worksheet cell. When youclick the cell where you insert the function, the API is executed.
210 © 2011 SAP AG. All rights reserved. 2011
SAP Class Week of April 16, 2012
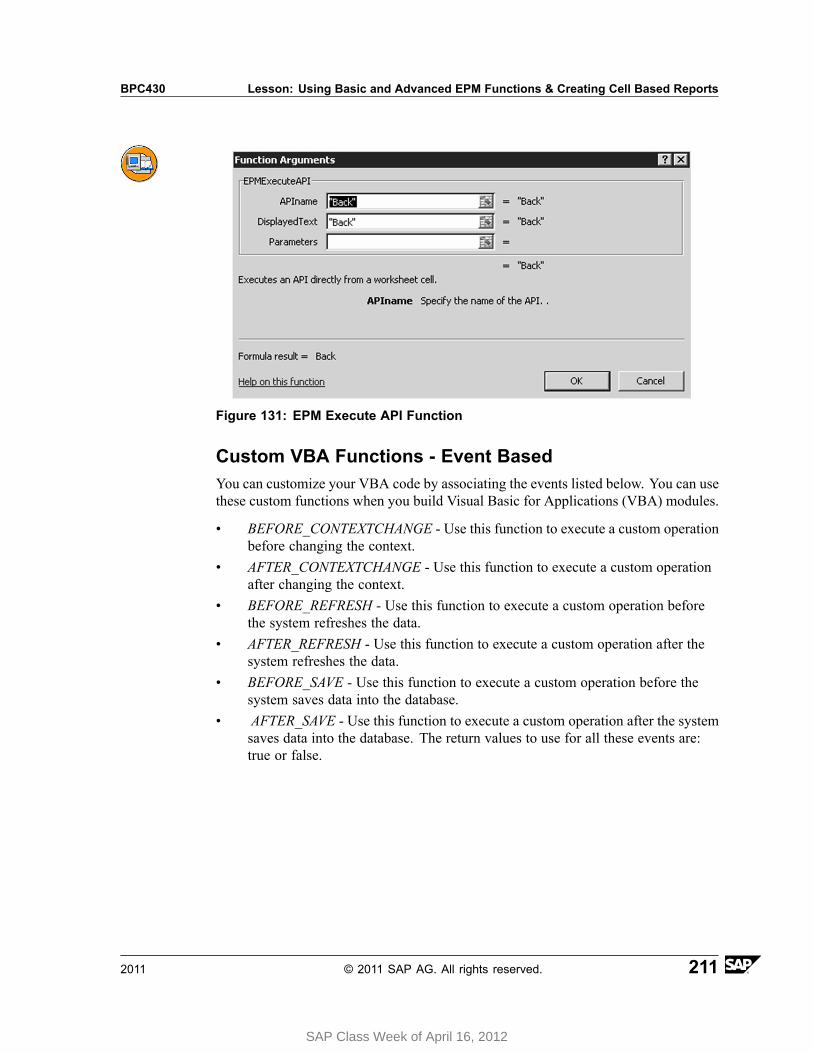
BPC430 Lesson: Using Basic and Advanced EPM Functions & Creating Cell Based Reports
Figure 131: EPM Execute API Function
Custom VBA Functions - Event BasedYou can customize your VBA code by associating the events listed below. You can usethese custom functions when you build Visual Basic for Applications (VBA) modules.
• BEFORE_CONTEXTCHANGE - Use this function to execute a custom operationbefore changing the context.
• AFTER_CONTEXTCHANGE - Use this function to execute a custom operationafter changing the context.
• BEFORE_REFRESH - Use this function to execute a custom operation beforethe system refreshes the data.
• AFTER_REFRESH - Use this function to execute a custom operation after thesystem refreshes the data.
• BEFORE_SAVE - Use this function to execute a custom operation before thesystem saves data into the database.
• AFTER_SAVE - Use this function to execute a custom operation after the systemsaves data into the database. The return values to use for all these events are:true or false.
2011 © 2011 SAP AG. All rights reserved. 211
SAP Class Week of April 16, 2012

Unit 2: The Excel Interface of the EPM add-in BPC430
212 © 2011 SAP AG. All rights reserved. 2011
SAP Class Week of April 16, 2012
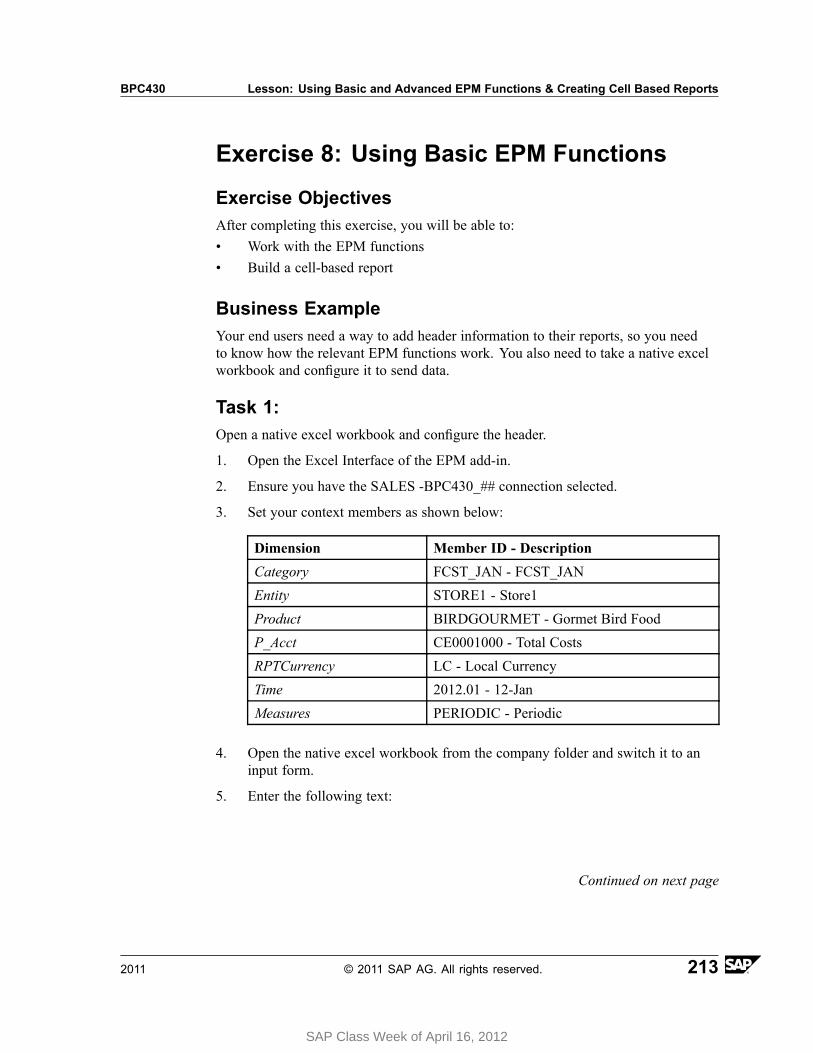
BPC430 Lesson: Using Basic and Advanced EPM Functions & Creating Cell Based Reports
Exercise 8: Using Basic EPM Functions
Exercise ObjectivesAfter completing this exercise, you will be able to:• Work with the EPM functions• Build a cell-based report
Business ExampleYour end users need a way to add header information to their reports, so you needto know how the relevant EPM functions work. You also need to take a native excelworkbook and configure it to send data.
Task 1:Open a native excel workbook and configure the header.
1. Open the Excel Interface of the EPM add-in.
2. Ensure you have the SALES -BPC430_## connection selected.
3. Set your context members as shown below:
Dimension Member ID - Description
Category FCST_JAN - FCST_JAN
Entity STORE1 - Store1
Product BIRDGOURMET - Gormet Bird Food
P_Acct CE0001000 - Total Costs
RPTCurrency LC - Local Currency
Time 2012.01 - 12-Jan
Measures PERIODIC - Periodic
4. Open the native excel workbook from the company folder and switch it to aninput form.
5. Enter the following text:
Continued on next page
2011 © 2011 SAP AG. All rights reserved. 213
SAP Class Week of April 16, 2012

Unit 2: The Excel Interface of the EPM add-in BPC430
Cell Text
A1 Environment
A2 Model
A3 Model Description
A4 Server
6. Use the EPM function EPMEnvDatabaseID to display the Environment ID in B1.
7. Use the EPM function EPMModelCubeID to display the Model ID in B2.
8. Use the EPM function EPMModelCubeDesc to display the model descriptionin B3.
9. Use the EPM function, EPMServer, to display the Server URL in B4.
10. Use the EPM function, EPMDimensionType, to display the currency dimensionin A5.
11. Use the EPM function, EPMDimensionType, to display the entity dimension inA6.
12. Use the EPM function, EPMDimensionType, to display the category dimensionin A7.
13. Use the EPM function, EPMContextMember, to display the currency contextmember in B5.
14. Use the EPM function, EPMContextMember, to display the entity contextmember in B6.
15. Use the EPM function, EPMContextMember, to display the category contextmember in B7.
Task 2:Configure the column headers and report description.
1. Use the EPM function, EPMContextMember, to display the entity contextmember in G13.
2. Use the EPM function, EPMContextMember, to display the category contextmember in G14.
3. Use the EPM function, EPMContextMember, to display the time context memberin C16.
Continued on next page
214 © 2011 SAP AG. All rights reserved. 2011
SAP Class Week of April 16, 2012
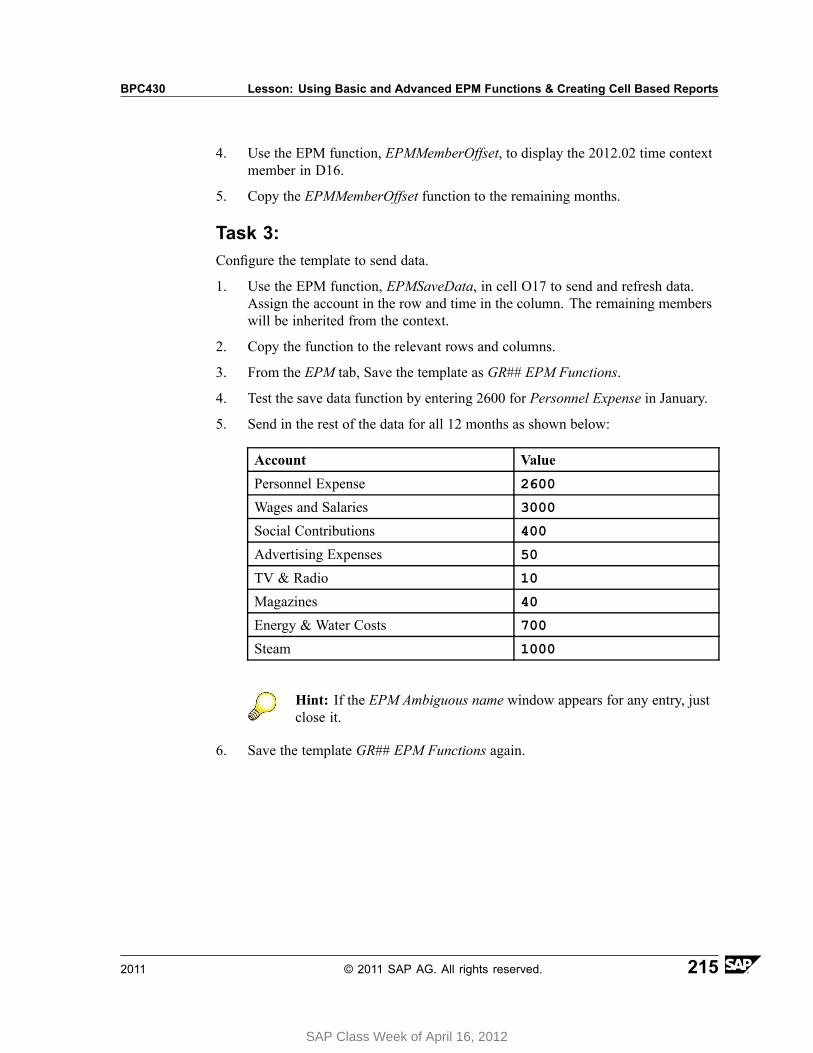
BPC430 Lesson: Using Basic and Advanced EPM Functions & Creating Cell Based Reports
4. Use the EPM function, EPMMemberOffset, to display the 2012.02 time contextmember in D16.
5. Copy the EPMMemberOffset function to the remaining months.
Task 3:Configure the template to send data.
1. Use the EPM function, EPMSaveData, in cell O17 to send and refresh data.Assign the account in the row and time in the column. The remaining memberswill be inherited from the context.
2. Copy the function to the relevant rows and columns.
3. From the EPM tab, Save the template as GR## EPM Functions.
4. Test the save data function by entering 2600 for Personnel Expense in January.
5. Send in the rest of the data for all 12 months as shown below:
Account Value
Personnel Expense 2600
Wages and Salaries 3000
Social Contributions 400
Advertising Expenses 50
TV & Radio 10
Magazines 40
Energy & Water Costs 700
Steam 1000
Hint: If the EPM Ambiguous name window appears for any entry, justclose it.
6. Save the template GR## EPM Functions again.
2011 © 2011 SAP AG. All rights reserved. 215
SAP Class Week of April 16, 2012
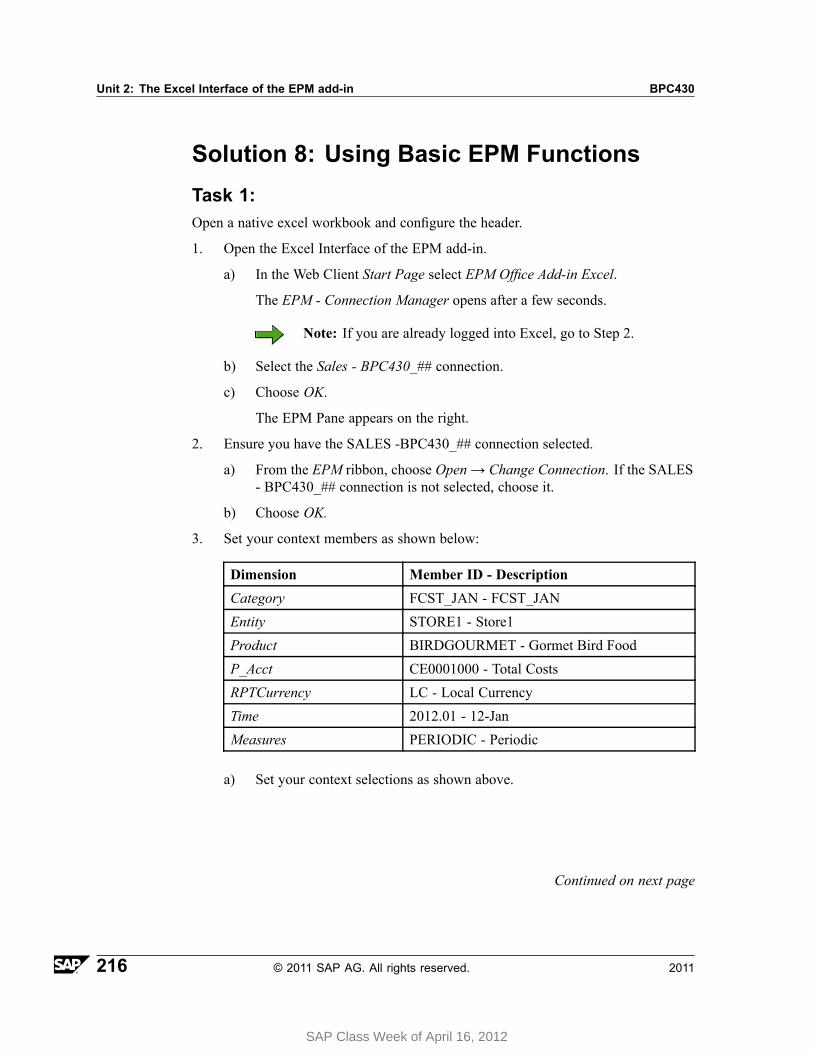
Unit 2: The Excel Interface of the EPM add-in BPC430
Solution 8: Using Basic EPM FunctionsTask 1:Open a native excel workbook and configure the header.
1. Open the Excel Interface of the EPM add-in.
a) In the Web Client Start Page select EPM Office Add-in Excel.
The EPM - Connection Manager opens after a few seconds.
Note: If you are already logged into Excel, go to Step 2.
b) Select the Sales - BPC430_## connection.
c) Choose OK.
The EPM Pane appears on the right.
2. Ensure you have the SALES -BPC430_## connection selected.
a) From the EPM ribbon, choose Open → Change Connection. If the SALES- BPC430_## connection is not selected, choose it.
b) Choose OK.
3. Set your context members as shown below:
Dimension Member ID - Description
Category FCST_JAN - FCST_JAN
Entity STORE1 - Store1
Product BIRDGOURMET - Gormet Bird Food
P_Acct CE0001000 - Total Costs
RPTCurrency LC - Local Currency
Time 2012.01 - 12-Jan
Measures PERIODIC - Periodic
a) Set your context selections as shown above.
Continued on next page
216 © 2011 SAP AG. All rights reserved. 2011
SAP Class Week of April 16, 2012

BPC430 Lesson: Using Basic and Advanced EPM Functions & Creating Cell Based Reports
4. Open the native excel workbook from the company folder and switch it to aninput form.
a) In the EPM tab, choose Open → Open Server Root Folder → NativeExcel → Open
A native excel workbook opens with accounts in the rows and monthsin the columns.
b) Choose Options → Sheet Options .
c) Select Use as Input Form→ OK.
5. Enter the following text:
Cell Text
A1 Environment
A2 Model
A3 Model Description
A4 Server
a) In cell A1, enter Environment.
b) In cell A2, enter Model.
c) In cell A3, enter Model Description.
d) In cell A4, enter Server.
6. Use the EPM function EPMEnvDatabaseID to display the Environment ID in B1.
a) In Excel, choose the Formulas tab.
b) In cell B1, choose the Excel Insert Function button.
c) Next to the Or select a category field, select EPMFunctions
d) Under Select a Function, double-click EPMEnvDatabaseID
e) Leave the Connection name blank:
Note: By leaving the Connection Name blank, the activeconnection will be inherited.
f) Choose OK
The Environment Id is displayed in cell B1.
Continued on next page
2011 © 2011 SAP AG. All rights reserved. 217
SAP Class Week of April 16, 2012
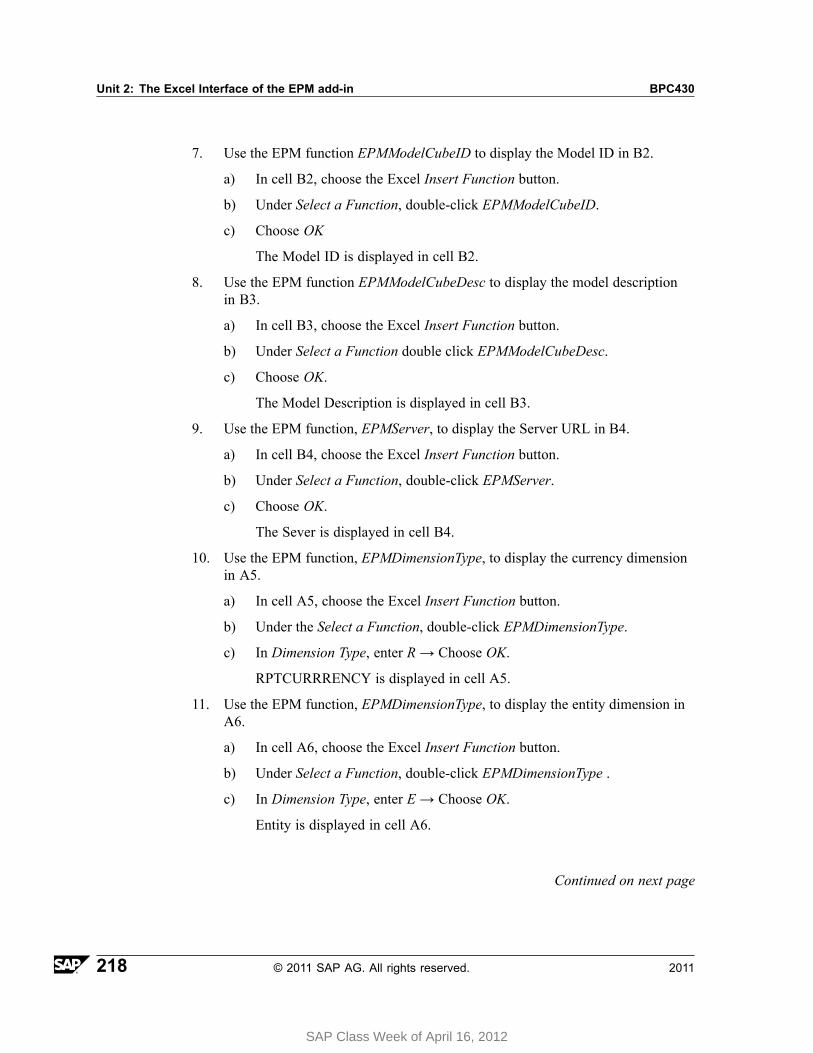
Unit 2: The Excel Interface of the EPM add-in BPC430
7. Use the EPM function EPMModelCubeID to display the Model ID in B2.
a) In cell B2, choose the Excel Insert Function button.
b) Under Select a Function, double-click EPMModelCubeID.
c) Choose OK
The Model ID is displayed in cell B2.
8. Use the EPM function EPMModelCubeDesc to display the model descriptionin B3.
a) In cell B3, choose the Excel Insert Function button.
b) Under Select a Function double click EPMModelCubeDesc.
c) Choose OK.
The Model Description is displayed in cell B3.
9. Use the EPM function, EPMServer, to display the Server URL in B4.
a) In cell B4, choose the Excel Insert Function button.
b) Under Select a Function, double-click EPMServer.
c) Choose OK.
The Sever is displayed in cell B4.
10. Use the EPM function, EPMDimensionType, to display the currency dimensionin A5.
a) In cell A5, choose the Excel Insert Function button.
b) Under the Select a Function, double-click EPMDimensionType.
c) In Dimension Type, enter R → Choose OK.
RPTCURRRENCY is displayed in cell A5.
11. Use the EPM function, EPMDimensionType, to display the entity dimension inA6.
a) In cell A6, choose the Excel Insert Function button.
b) Under Select a Function, double-click EPMDimensionType .
c) In Dimension Type, enter E → Choose OK.
Entity is displayed in cell A6.
Continued on next page
218 © 2011 SAP AG. All rights reserved. 2011
SAP Class Week of April 16, 2012

BPC430 Lesson: Using Basic and Advanced EPM Functions & Creating Cell Based Reports
12. Use the EPM function, EPMDimensionType, to display the category dimensionin A7.
a) In cell A7, choose the Excel Insert Function button.
b) Under Select a Function, double-click EPMDimensionType.
c) In Dimension Type, enter C → Choose OK.
CATEGORY is displayed in cell A7.
13. Use the EPM function, EPMContextMember, to display the currency contextmember in B5.
a) In cell B5, choose the Excel Insert Function button.
b) Under Select a Function, double-click EPMContextMember.
c) In the Dimension parameter, enter A5 → Choose OK
The current context member LC is displayed in cell B5.
14. Use the EPM function, EPMContextMember, to display the entity contextmember in B6.
a) In cell B6, choose the Excel Insert Function button.
b) Under Select a Function, double-click EPMContextMember.
c) In the Dimension parameter, enter A6 → Choose OK.
The current context member STORE1 is displayed in cell B6. You can alsodouble-click in cell B5 to change the context.
Note: The Filter List can be used provide a filtered default listwhen the cell is double-clicked. For example, a parameter such asCURRENCY=CHF could be used to return a default list of entitiesthat have the currency property value of CHF.
Continued on next page
2011 © 2011 SAP AG. All rights reserved. 219
SAP Class Week of April 16, 2012
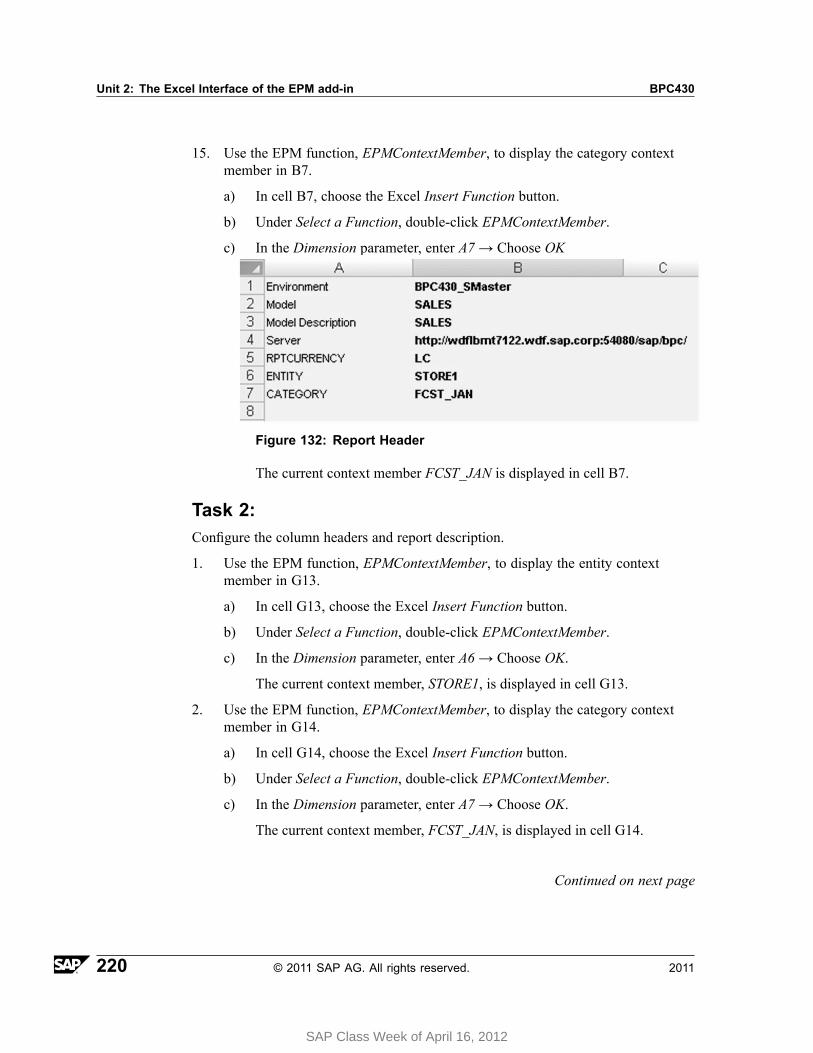
Unit 2: The Excel Interface of the EPM add-in BPC430
15. Use the EPM function, EPMContextMember, to display the category contextmember in B7.
a) In cell B7, choose the Excel Insert Function button.
b) Under Select a Function, double-click EPMContextMember.
c) In the Dimension parameter, enter A7 → Choose OK
Figure 132: Report Header
The current context member FCST_JAN is displayed in cell B7.
Task 2:Configure the column headers and report description.
1. Use the EPM function, EPMContextMember, to display the entity contextmember in G13.
a) In cell G13, choose the Excel Insert Function button.
b) Under Select a Function, double-click EPMContextMember.
c) In the Dimension parameter, enter A6 → Choose OK.
The current context member, STORE1, is displayed in cell G13.
2. Use the EPM function, EPMContextMember, to display the category contextmember in G14.
a) In cell G14, choose the Excel Insert Function button.
b) Under Select a Function, double-click EPMContextMember.
c) In the Dimension parameter, enter A7 → Choose OK.
The current context member, FCST_JAN, is displayed in cell G14.
Continued on next page
220 © 2011 SAP AG. All rights reserved. 2011
SAP Class Week of April 16, 2012
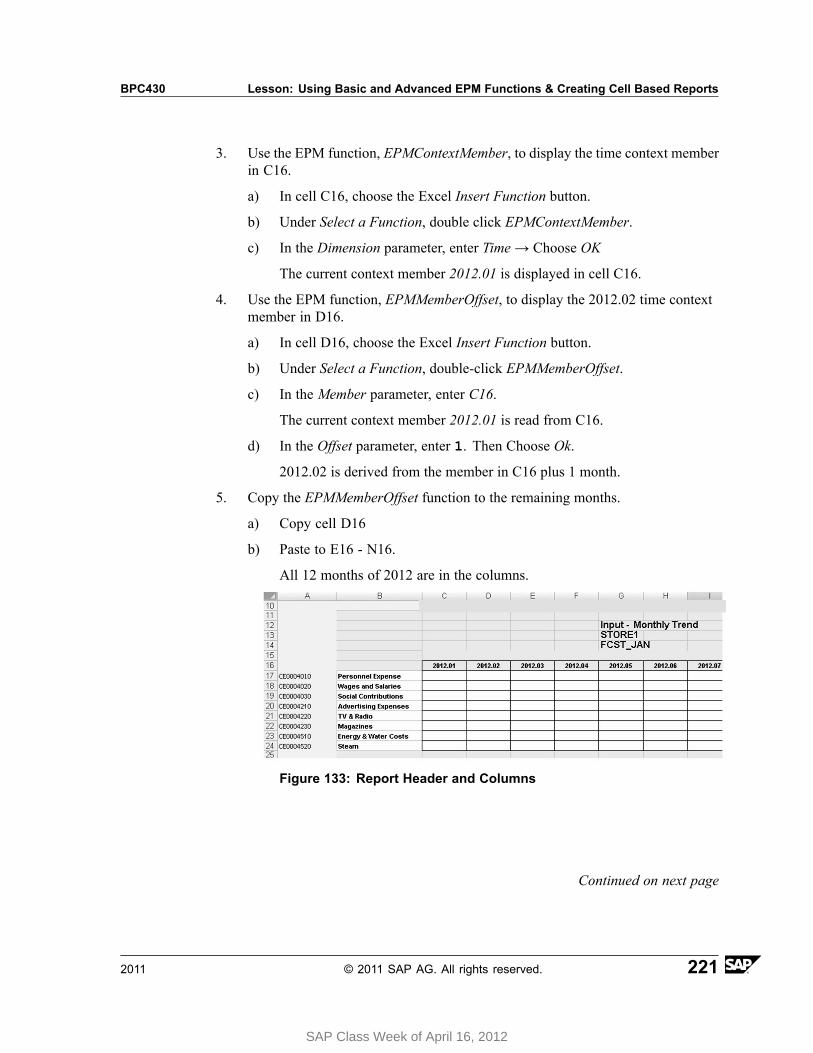
BPC430 Lesson: Using Basic and Advanced EPM Functions & Creating Cell Based Reports
3. Use the EPM function, EPMContextMember, to display the time context memberin C16.
a) In cell C16, choose the Excel Insert Function button.
b) Under Select a Function, double click EPMContextMember.
c) In the Dimension parameter, enter Time → Choose OK
The current context member 2012.01 is displayed in cell C16.
4. Use the EPM function, EPMMemberOffset, to display the 2012.02 time contextmember in D16.
a) In cell D16, choose the Excel Insert Function button.
b) Under Select a Function, double-click EPMMemberOffset.
c) In the Member parameter, enter C16.
The current context member 2012.01 is read from C16.
d) In the Offset parameter, enter 1. Then Choose Ok.
2012.02 is derived from the member in C16 plus 1 month.
5. Copy the EPMMemberOffset function to the remaining months.
a) Copy cell D16
b) Paste to E16 - N16.
All 12 months of 2012 are in the columns.
Figure 133: Report Header and Columns
Continued on next page
2011 © 2011 SAP AG. All rights reserved. 221
SAP Class Week of April 16, 2012
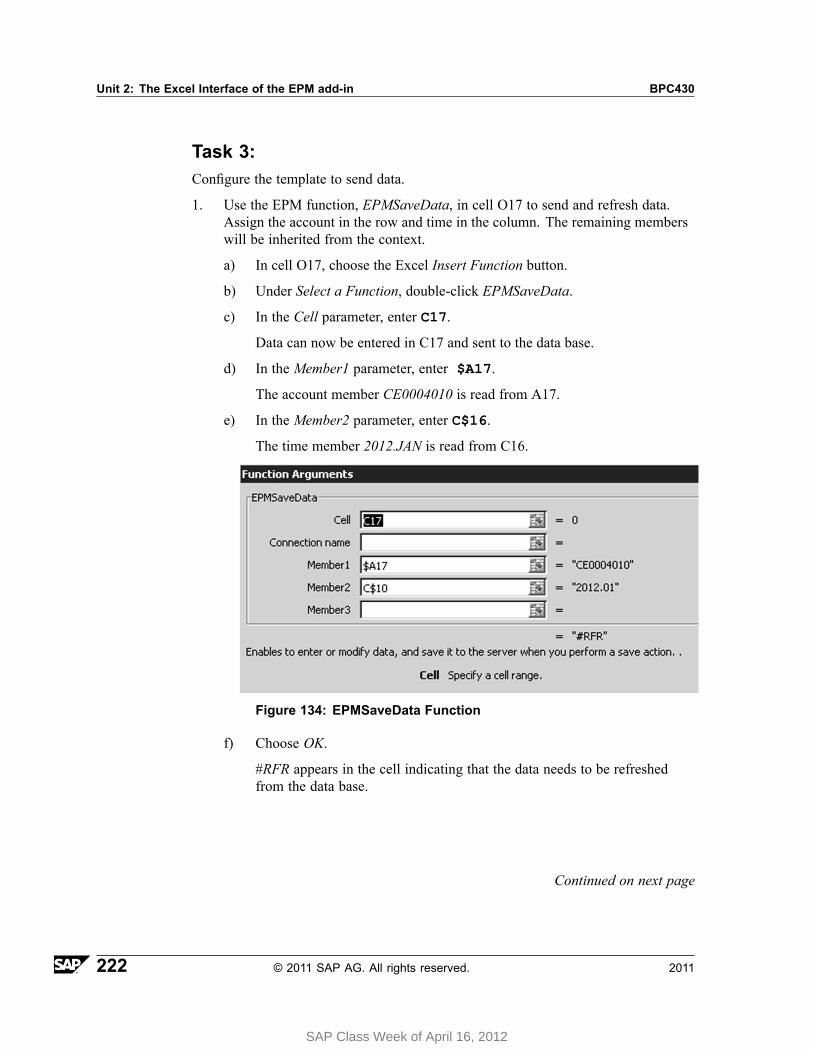
Unit 2: The Excel Interface of the EPM add-in BPC430
Task 3:Configure the template to send data.
1. Use the EPM function, EPMSaveData, in cell O17 to send and refresh data.Assign the account in the row and time in the column. The remaining memberswill be inherited from the context.
a) In cell O17, choose the Excel Insert Function button.
b) Under Select a Function, double-click EPMSaveData.
c) In the Cell parameter, enter C17.
Data can now be entered in C17 and sent to the data base.
d) In the Member1 parameter, enter $A17.
The account member CE0004010 is read from A17.
e) In the Member2 parameter, enter C$16.
The time member 2012.JAN is read from C16.
Figure 134: EPMSaveData Function
f) Choose OK.
#RFR appears in the cell indicating that the data needs to be refreshedfrom the data base.
Continued on next page
222 © 2011 SAP AG. All rights reserved. 2011
SAP Class Week of April 16, 2012
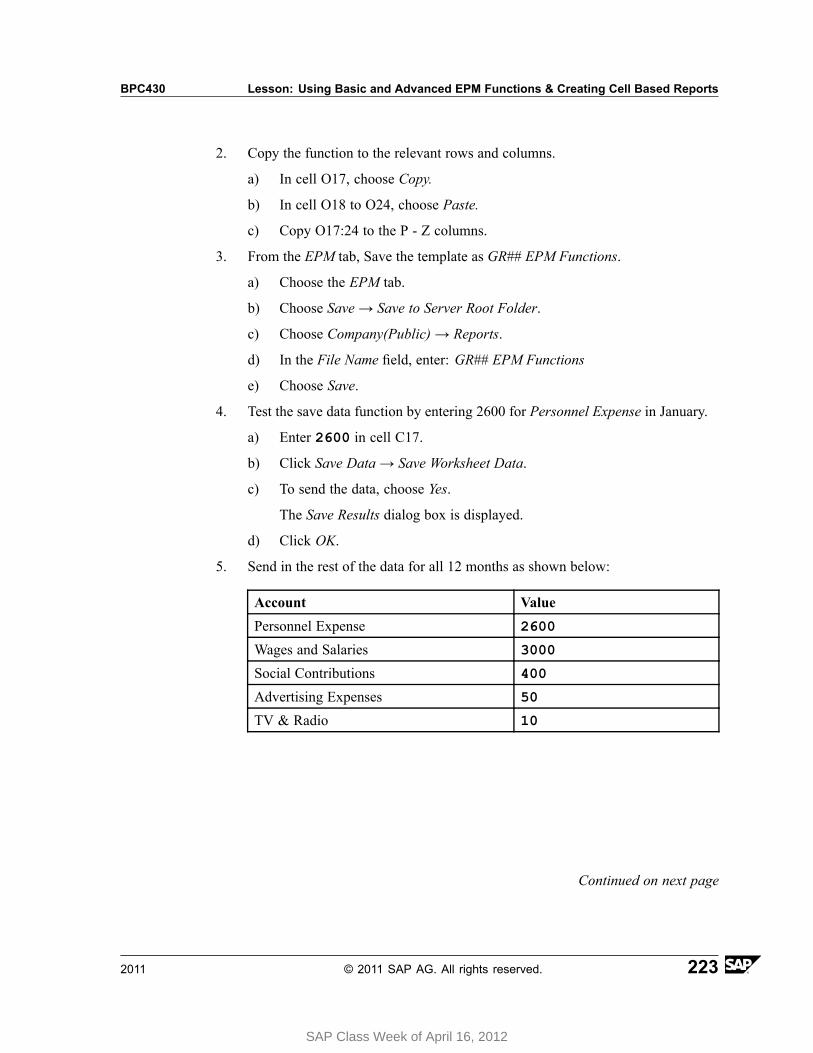
BPC430 Lesson: Using Basic and Advanced EPM Functions & Creating Cell Based Reports
2. Copy the function to the relevant rows and columns.
a) In cell O17, choose Copy.
b) In cell O18 to O24, choose Paste.
c) Copy O17:24 to the P - Z columns.
3. From the EPM tab, Save the template as GR## EPM Functions.
a) Choose the EPM tab.
b) Choose Save → Save to Server Root Folder.
c) Choose Company(Public) → Reports.
d) In the File Name field, enter: GR## EPM Functions
e) Choose Save.
4. Test the save data function by entering 2600 for Personnel Expense in January.
a) Enter 2600 in cell C17.
b) Click Save Data → Save Worksheet Data.
c) To send the data, choose Yes.
The Save Results dialog box is displayed.
d) Click OK.
5. Send in the rest of the data for all 12 months as shown below:
Account Value
Personnel Expense 2600
Wages and Salaries 3000
Social Contributions 400
Advertising Expenses 50
TV & Radio 10
Continued on next page
2011 © 2011 SAP AG. All rights reserved. 223
SAP Class Week of April 16, 2012
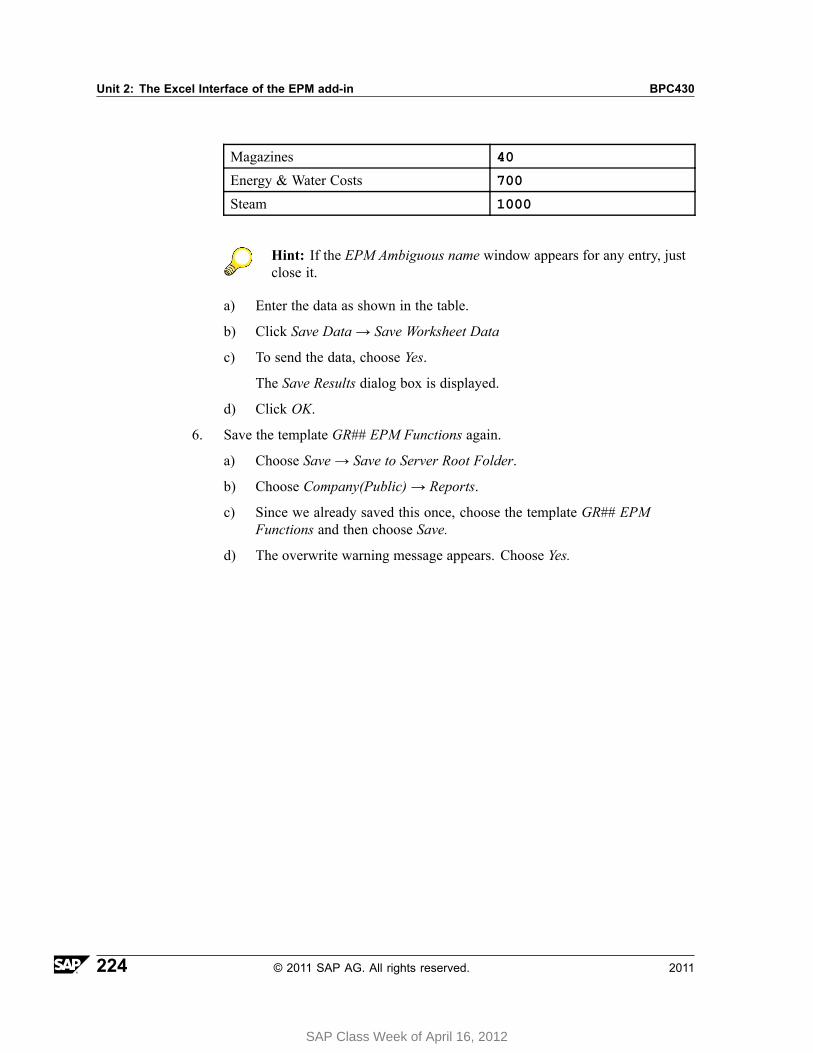
Unit 2: The Excel Interface of the EPM add-in BPC430
Magazines 40
Energy & Water Costs 700
Steam 1000
Hint: If the EPM Ambiguous name window appears for any entry, justclose it.
a) Enter the data as shown in the table.
b) Click Save Data → Save Worksheet Data
c) To send the data, choose Yes.
The Save Results dialog box is displayed.
d) Click OK.
6. Save the template GR## EPM Functions again.
a) Choose Save → Save to Server Root Folder.
b) Choose Company(Public) → Reports.
c) Since we already saved this once, choose the template GR## EPMFunctions and then choose Save.
d) The overwrite warning message appears. Choose Yes.
224 © 2011 SAP AG. All rights reserved. 2011
SAP Class Week of April 16, 2012
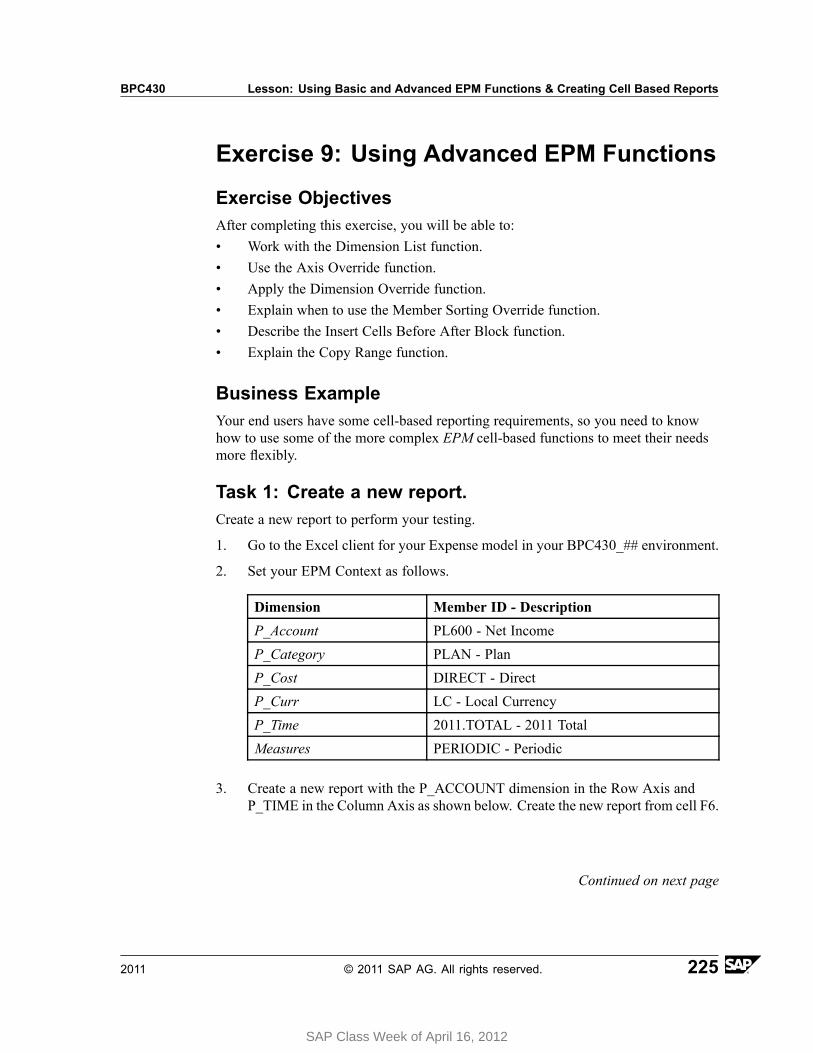
BPC430 Lesson: Using Basic and Advanced EPM Functions & Creating Cell Based Reports
Exercise 9: Using Advanced EPM Functions
Exercise ObjectivesAfter completing this exercise, you will be able to:• Work with the Dimension List function.• Use the Axis Override function.• Apply the Dimension Override function.• Explain when to use the Member Sorting Override function.• Describe the Insert Cells Before After Block function.• Explain the Copy Range function.
Business ExampleYour end users have some cell-based reporting requirements, so you need to knowhow to use some of the more complex EPM cell-based functions to meet their needsmore flexibly.
Task 1: Create a new report.Create a new report to perform your testing.
1. Go to the Excel client for your Expense model in your BPC430_## environment.
2. Set your EPM Context as follows.
Dimension Member ID - Description
P_Account PL600 - Net Income
P_Category PLAN - Plan
P_Cost DIRECT - Direct
P_Curr LC - Local Currency
P_Time 2011.TOTAL - 2011 Total
Measures PERIODIC - Periodic
3. Create a new report with the P_ACCOUNT dimension in the Row Axis andP_TIME in the Column Axis as shown below. Create the new report from cell F6.
Continued on next page
2011 © 2011 SAP AG. All rights reserved. 225
SAP Class Week of April 16, 2012
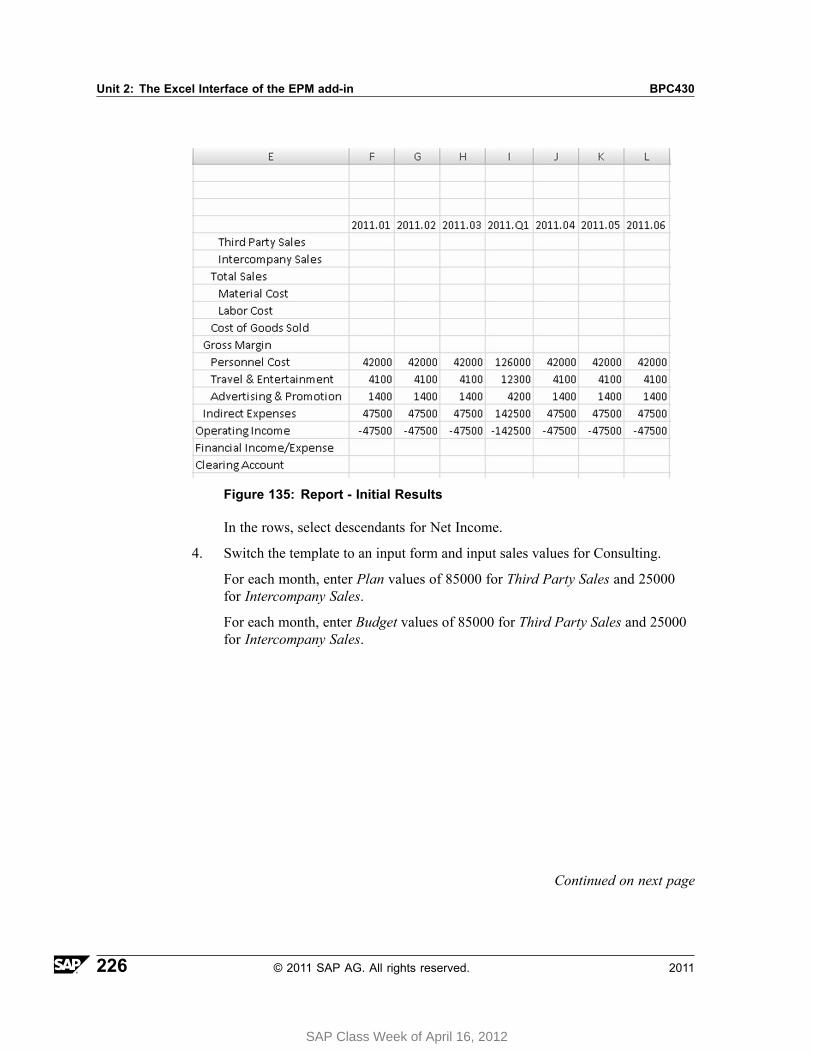
Unit 2: The Excel Interface of the EPM add-in BPC430
Figure 135: Report - Initial Results
In the rows, select descendants for Net Income.
4. Switch the template to an input form and input sales values for Consulting.
For each month, enter Plan values of 85000 for Third Party Sales and 25000for Intercompany Sales.
For each month, enter Budget values of 85000 for Third Party Sales and 25000for Intercompany Sales.
Continued on next page
226 © 2011 SAP AG. All rights reserved. 2011
SAP Class Week of April 16, 2012
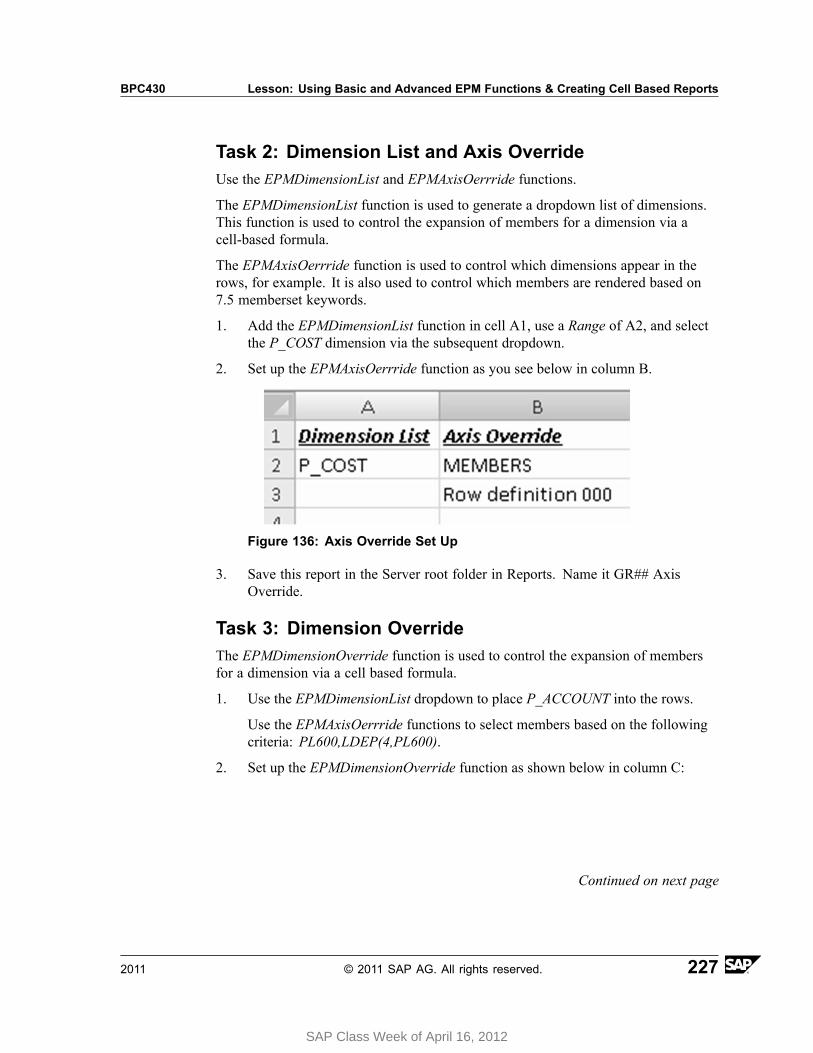
BPC430 Lesson: Using Basic and Advanced EPM Functions & Creating Cell Based Reports
Task 2: Dimension List and Axis OverrideUse the EPMDimensionList and EPMAxisOerrride functions.
The EPMDimensionList function is used to generate a dropdown list of dimensions.This function is used to control the expansion of members for a dimension via acell-based formula.
The EPMAxisOerrride function is used to control which dimensions appear in therows, for example. It is also used to control which members are rendered based on7.5 memberset keywords.
1. Add the EPMDimensionList function in cell A1, use a Range of A2, and selectthe P_COST dimension via the subsequent dropdown.
2. Set up the EPMAxisOerrride function as you see below in column B.
Figure 136: Axis Override Set Up
3. Save this report in the Server root folder in Reports. Name it GR## AxisOverride.
Task 3: Dimension OverrideThe EPMDimensionOverride function is used to control the expansion of membersfor a dimension via a cell based formula.
1. Use the EPMDimensionList dropdown to place P_ACCOUNT into the rows.
Use the EPMAxisOerrride functions to select members based on the followingcriteria: PL600,LDEP(4,PL600).
2. Set up the EPMDimensionOverride function as shown below in column C:
Continued on next page
2011 © 2011 SAP AG. All rights reserved. 227
SAP Class Week of April 16, 2012
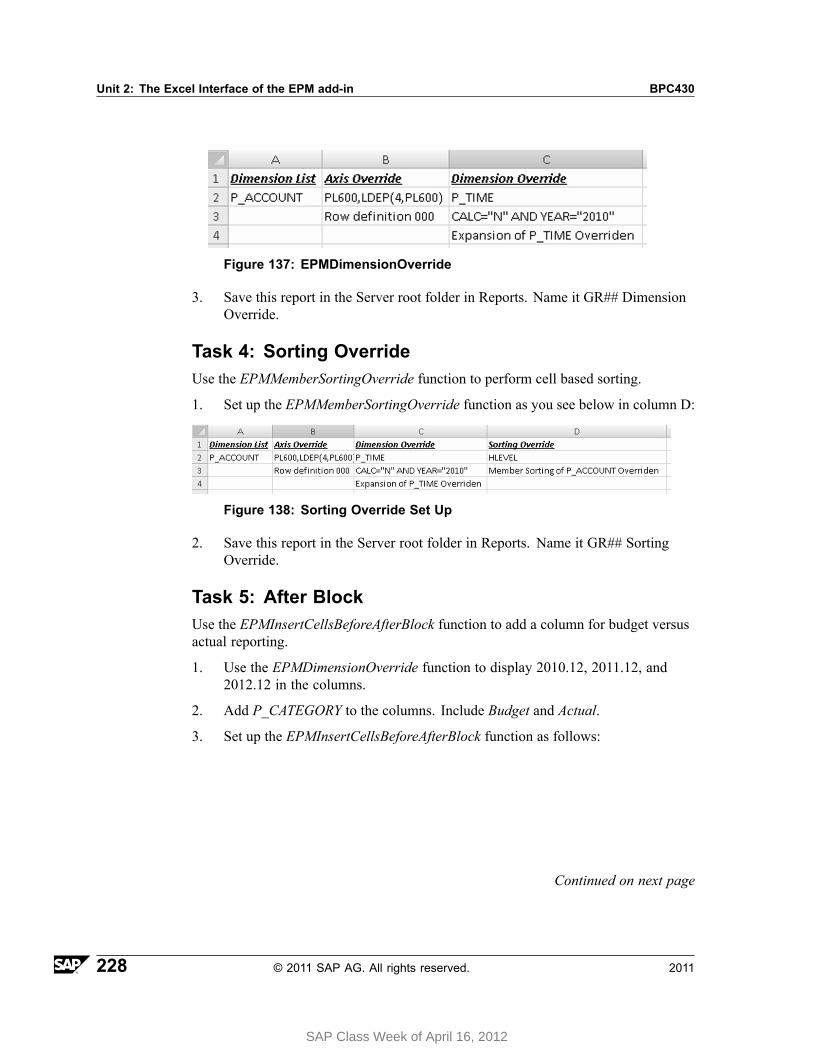
Unit 2: The Excel Interface of the EPM add-in BPC430
Figure 137: EPMDimensionOverride
3. Save this report in the Server root folder in Reports. Name it GR## DimensionOverride.
Task 4: Sorting OverrideUse the EPMMemberSortingOverride function to perform cell based sorting.
1. Set up the EPMMemberSortingOverride function as you see below in column D:
Figure 138: Sorting Override Set Up
2. Save this report in the Server root folder in Reports. Name it GR## SortingOverride.
Task 5: After BlockUse the EPMInsertCellsBeforeAfterBlock function to add a column for budget versusactual reporting.
1. Use the EPMDimensionOverride function to display 2010.12, 2011.12, and2012.12 in the columns.
2. Add P_CATEGORY to the columns. Include Budget and Actual.
3. Set up the EPMInsertCellsBeforeAfterBlock function as follows:
Continued on next page
228 © 2011 SAP AG. All rights reserved. 2011
SAP Class Week of April 16, 2012
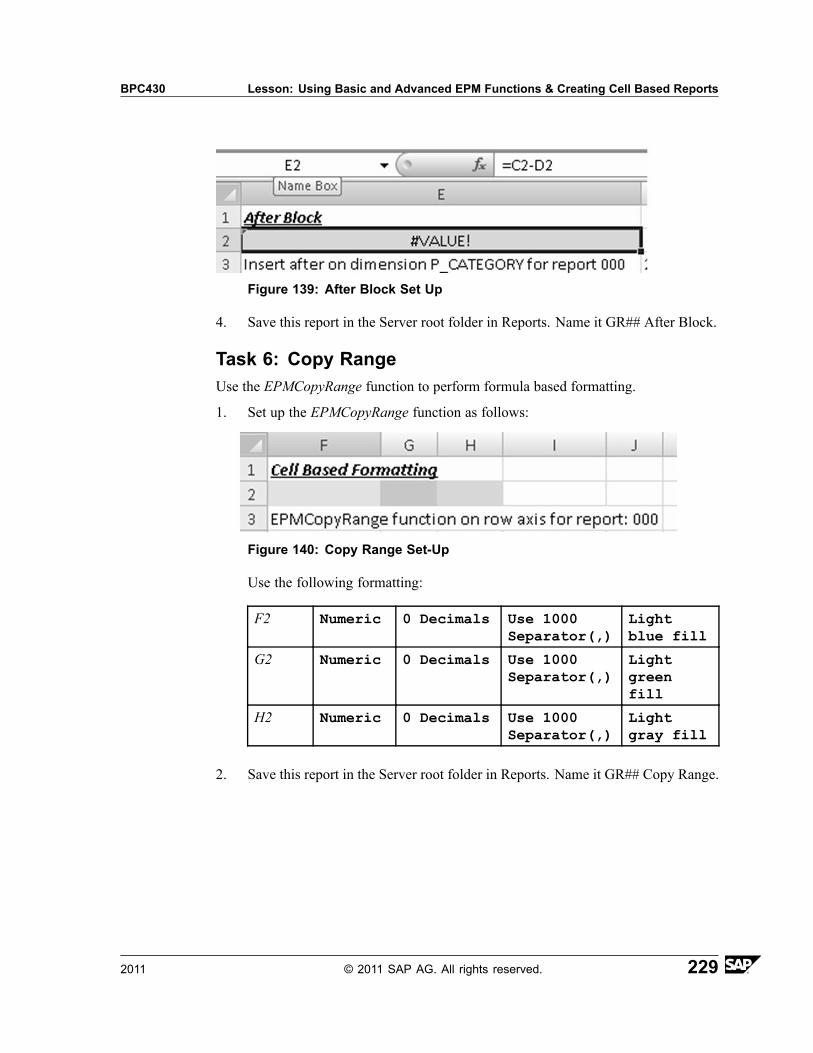
BPC430 Lesson: Using Basic and Advanced EPM Functions & Creating Cell Based Reports
Figure 139: After Block Set Up
4. Save this report in the Server root folder in Reports. Name it GR## After Block.
Task 6: Copy RangeUse the EPMCopyRange function to perform formula based formatting.
1. Set up the EPMCopyRange function as follows:
Figure 140: Copy Range Set-Up
Use the following formatting:
F2 Numeric 0 Decimals Use 1000Separator(,)
Lightblue fill
G2 Numeric 0 Decimals Use 1000Separator(,)
Lightgreenfill
H2 Numeric 0 Decimals Use 1000Separator(,)
Lightgray fill
2. Save this report in the Server root folder in Reports. Name it GR## Copy Range.
2011 © 2011 SAP AG. All rights reserved. 229
Unit 2: The Excel Interface of the EPM add-in BPC430
Solution 9: Using Advanced EPM FunctionsTask 1: Create a new report.Create a new report to perform your testing.
1. Go to the Excel client for your Expense model in your BPC430_## environment.
a) From your web client's Start Page, choose EPM Office Add-in Excel.
b) Choose the Expense - BPC430_## connection.
c) Choose OK.
2. Set your EPM Context as follows.
Dimension Member ID - Description
P_Account PL600 - Net Income
P_Category PLAN - Plan
P_Cost DIRECT - Direct
P_Curr LC - Local Currency
P_Time 2011.TOTAL - 2011 Total
Measures PERIODIC - Periodic
a) Set your EPM Context as you see above.
3. Create a new report with the P_ACCOUNT dimension in the Row Axis andP_TIME in the Column Axis as shown below. Create the new report from cell F6.
Continued on next page
230 © 2011 SAP AG. All rights reserved. 2011
SAP Class Week of April 16, 2012
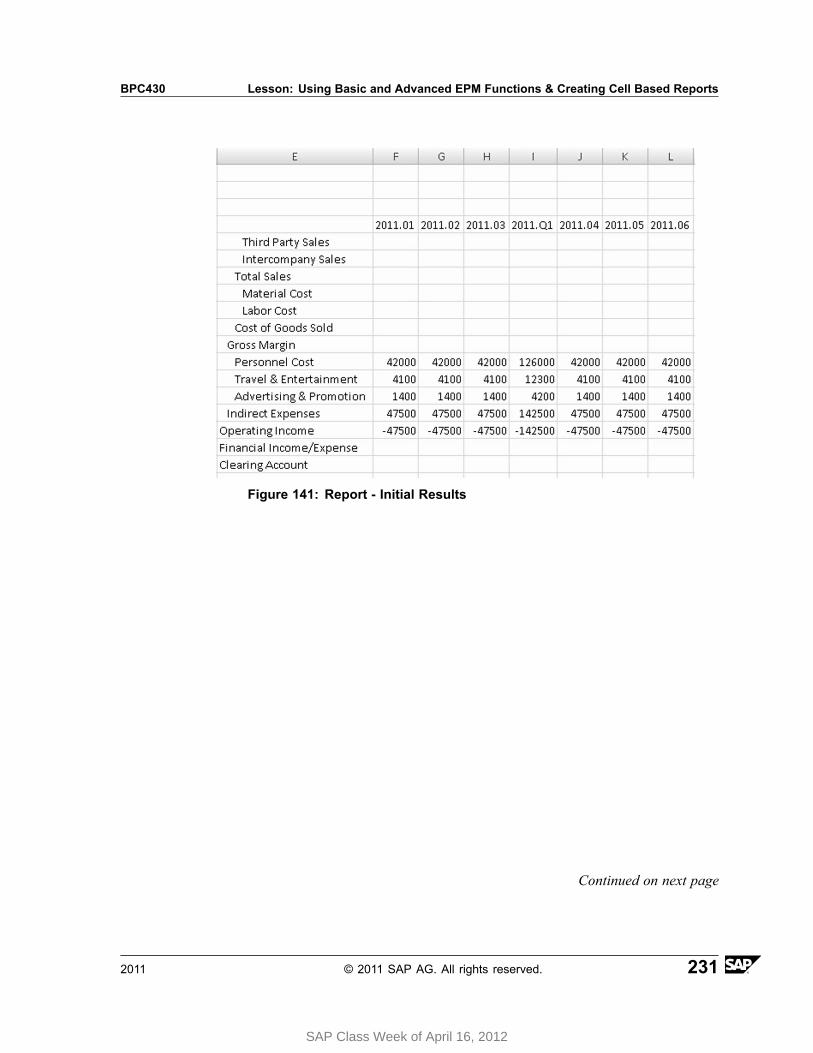
BPC430 Lesson: Using Basic and Advanced EPM Functions & Creating Cell Based Reports
Figure 141: Report - Initial Results
Continued on next page
2011 © 2011 SAP AG. All rights reserved. 231
SAP Class Week of April 16, 2012
Unit 2: The Excel Interface of the EPM add-in BPC430
In the rows, select descendants for Net Income.
a) In the EPM tab, choose Options → Sheet Options.
b) Deselect Activate Member Recognition→ OK.
c) Place your cursor in cell F6.
d) From the EPM Ribbon, choose New Report.
The EPM - Report Editor window opens.
e) On the Options tab, deselect Do not Store Environment in the Connection.
f) On the Layout tab, drag and drop the P_ACCOUNT dimension to the RowAxis Dimensions.
g) Drag and drop the P_TIME dimension to the Column Axis Dimensions.
h) Choose P_TIME in the Column Axis Dimensions.
i) Select ID as the display.
j) Select 2011.TOTAL.
k) In Selection Relationship on the lower left, select Base Level.
l) Choose the right arrow to move the selection to Selected Members.
m) Similarly, choose the left arrow to remove the highlighted default selection.
n) Choose OK to close the EPM - Member Selector.
o) In the Row Axis Dimensions, click P_ACCOUNT.
p) Select Net Income.
q) In Selection Relationship on the lower left, select Descendants.
r) Choose the right arrow to move the selection to Selected Members.
s) Similarly, choose the left arrow to remove the highlighted default selection.
t) Choose OK to close the EPM - Member Selector.
u) Choose OK again to close the EPM - Report Editor.
The Report is executed.
4. Switch the template to an input form and input sales values for Consulting.
For each month, enter Plan values of 85000 for Third Party Sales and 25000for Intercompany Sales.
Continued on next page
232 © 2011 SAP AG. All rights reserved. 2011
SAP Class Week of April 16, 2012
BPC430 Lesson: Using Basic and Advanced EPM Functions & Creating Cell Based Reports
For each month, enter Budget values of 85000 for Third Party Sales and 25000for Intercompany Sales.
a) Go to Options → Sheet Options.
b) Select Use as Input Form.
c) Choose OK.
d) Set the context for P_COST to Consulting.
e) Choose Refresh.
f) For Jan to Dec, enter 150000 for Third Party Sales.
g) For Jan to Dec, enter 25000 for InterComapny Sales.
h) Select Save Data→ Yes → OK.
i) Set the context for P_CATEGORY to Budget.
j) Choose Refresh.
k) For Jan to Dec, enter 150000 for Third Party Sales.
l) For Jan to Dec, enter 25000 for InterComapny Sales.
m) Select Save Data→ Yes → OK.
n) Set the context for P_COST back to Direct.
o) Set the context for P_CATEGORY back to Plan.
p) Choose Refresh.
Continued on next page
2011 © 2011 SAP AG. All rights reserved. 233
SAP Class Week of April 16, 2012
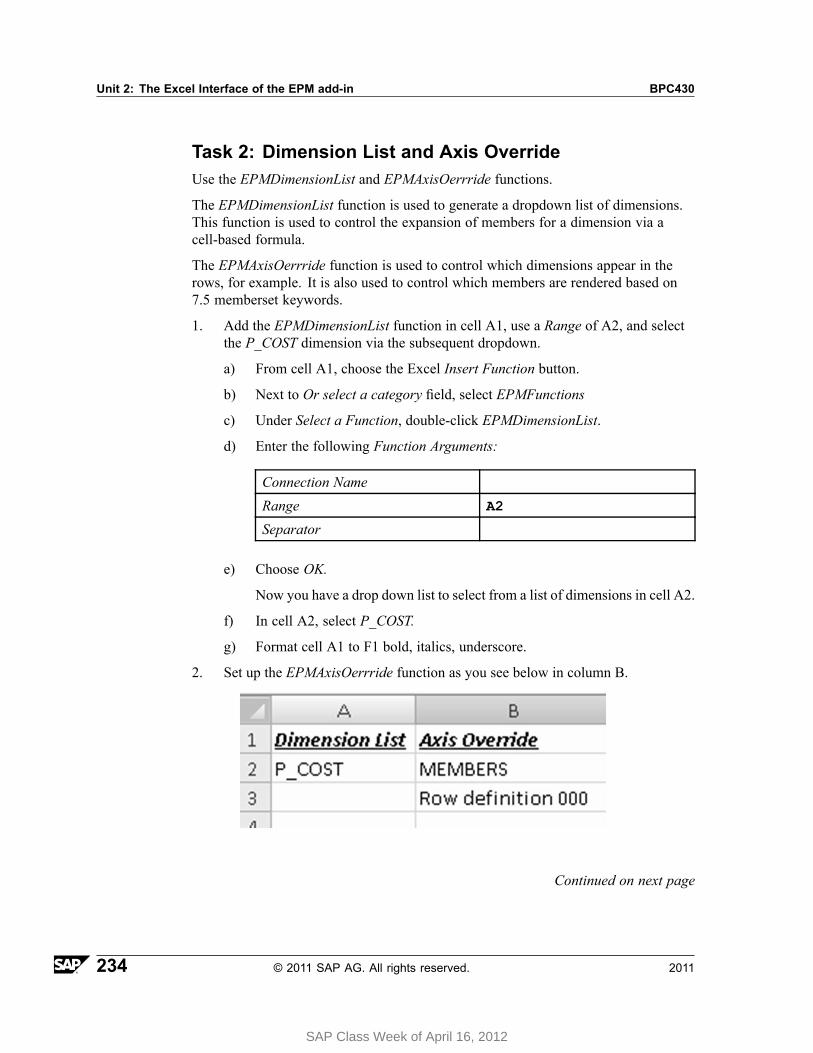
Unit 2: The Excel Interface of the EPM add-in BPC430
Task 2: Dimension List and Axis OverrideUse the EPMDimensionList and EPMAxisOerrride functions.
The EPMDimensionList function is used to generate a dropdown list of dimensions.This function is used to control the expansion of members for a dimension via acell-based formula.
The EPMAxisOerrride function is used to control which dimensions appear in therows, for example. It is also used to control which members are rendered based on7.5 memberset keywords.
1. Add the EPMDimensionList function in cell A1, use a Range of A2, and selectthe P_COST dimension via the subsequent dropdown.
a) From cell A1, choose the Excel Insert Function button.
b) Next to Or select a category field, select EPMFunctions
c) Under Select a Function, double-click EPMDimensionList.
d) Enter the following Function Arguments:
Connection Name
Range A2
Separator
e) Choose OK.
Now you have a drop down list to select from a list of dimensions in cell A2.
f) In cell A2, select P_COST.
g) Format cell A1 to F1 bold, italics, underscore.
2. Set up the EPMAxisOerrride function as you see below in column B.
Continued on next page
234 © 2011 SAP AG. All rights reserved. 2011
SAP Class Week of April 16, 2012
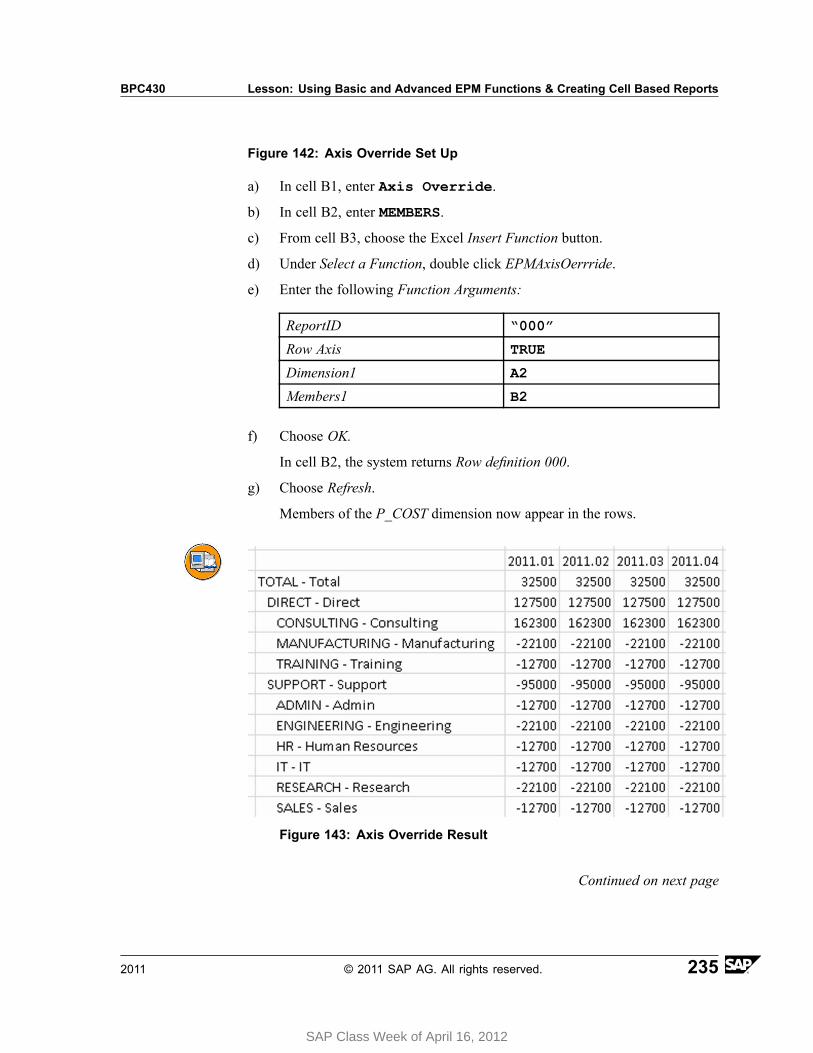
BPC430 Lesson: Using Basic and Advanced EPM Functions & Creating Cell Based Reports
Figure 142: Axis Override Set Up
a) In cell B1, enter Axis Override.
b) In cell B2, enter MEMBERS.
c) From cell B3, choose the Excel Insert Function button.
d) Under Select a Function, double click EPMAxisOerrride.
e) Enter the following Function Arguments:
ReportID “000”
Row Axis TRUE
Dimension1 A2
Members1 B2
f) Choose OK.
In cell B2, the system returns Row definition 000.
g) Choose Refresh.
Members of the P_COST dimension now appear in the rows.
Figure 143: Axis Override Result
Continued on next page
2011 © 2011 SAP AG. All rights reserved. 235
SAP Class Week of April 16, 2012
Unit 2: The Excel Interface of the EPM add-in BPC430
3. Save this report in the Server root folder in Reports. Name it GR## AxisOverride.
a) From the EPM Ribbon, choose Save → Save to Server Root Folder.
The Save window opens.
b) On the left, choose the Company (Public) folder.
c) Under the Template Library, choose Reports.
d) Type the File Name GR## Axis Override.
e) Choose Save.
f) Remain in this report for the next step.
Task 3: Dimension OverrideThe EPMDimensionOverride function is used to control the expansion of membersfor a dimension via a cell based formula.
1. Use the EPMDimensionList dropdown to place P_ACCOUNT into the rows.
Use the EPMAxisOerrride functions to select members based on the followingcriteria: PL600,LDEP(4,PL600).
a) In cell A2, select P_ACCOUNT.
b) In cell B2, enter PL600,LDEP(4,PL600).
The parent account PL600 will appear first.
Under PL600, the level dependent members of PL600 four levels downwill be listed.
c) Choose Refresh.
2. Set up the EPMDimensionOverride function as shown below in column C:
Continued on next page
236 © 2011 SAP AG. All rights reserved. 2011
SAP Class Week of April 16, 2012
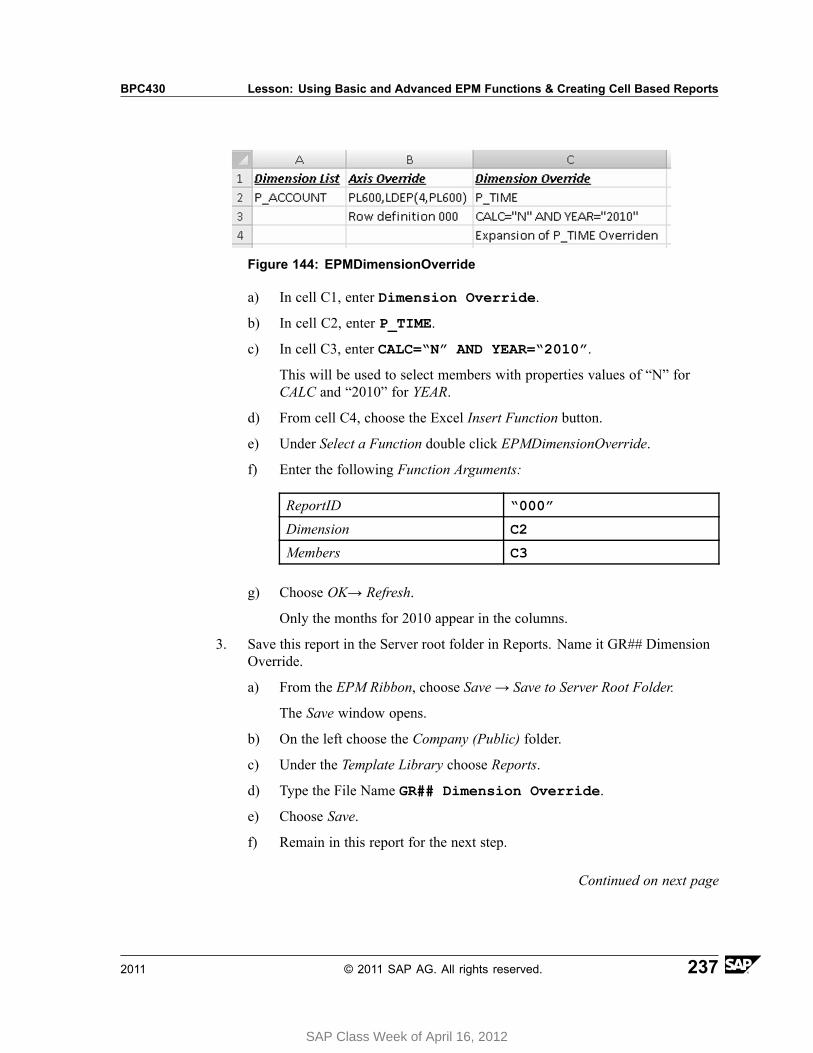
BPC430 Lesson: Using Basic and Advanced EPM Functions & Creating Cell Based Reports
Figure 144: EPMDimensionOverride
a) In cell C1, enter Dimension Override.
b) In cell C2, enter P_TIME.
c) In cell C3, enter CALC=“N” AND YEAR=“2010”.
This will be used to select members with properties values of “N” forCALC and “2010” for YEAR.
d) From cell C4, choose the Excel Insert Function button.
e) Under Select a Function double click EPMDimensionOverride.
f) Enter the following Function Arguments:
ReportID “000”
Dimension C2
Members C3
g) Choose OK→ Refresh.
Only the months for 2010 appear in the columns.
3. Save this report in the Server root folder in Reports. Name it GR## DimensionOverride.
a) From the EPM Ribbon, choose Save → Save to Server Root Folder.
The Save window opens.
b) On the left choose the Company (Public) folder.
c) Under the Template Library choose Reports.
d) Type the File Name GR## Dimension Override.
e) Choose Save.
f) Remain in this report for the next step.
Continued on next page
2011 © 2011 SAP AG. All rights reserved. 237
SAP Class Week of April 16, 2012
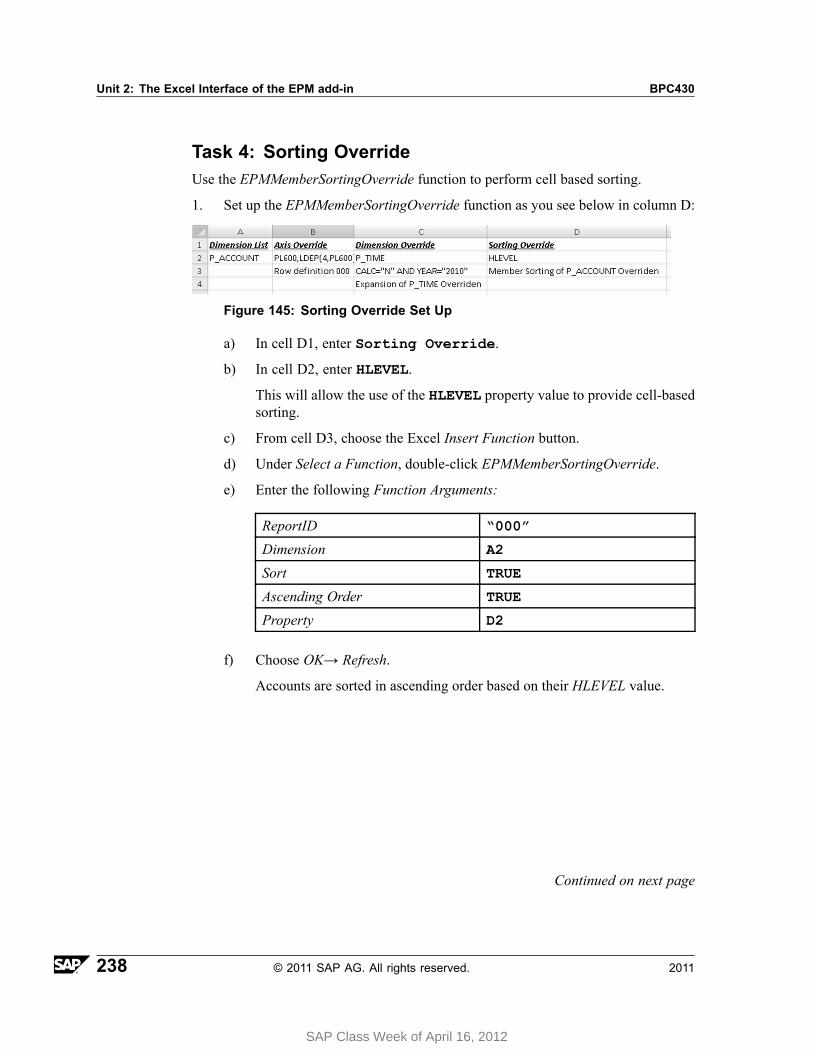
Unit 2: The Excel Interface of the EPM add-in BPC430
Task 4: Sorting OverrideUse the EPMMemberSortingOverride function to perform cell based sorting.
1. Set up the EPMMemberSortingOverride function as you see below in column D:
Figure 145: Sorting Override Set Up
a) In cell D1, enter Sorting Override.
b) In cell D2, enter HLEVEL.
This will allow the use of the HLEVEL property value to provide cell-basedsorting.
c) From cell D3, choose the Excel Insert Function button.
d) Under Select a Function, double-click EPMMemberSortingOverride.
e) Enter the following Function Arguments:
ReportID “000”
Dimension A2
Sort TRUE
Ascending Order TRUE
Property D2
f) Choose OK→ Refresh.
Accounts are sorted in ascending order based on their HLEVEL value.
Continued on next page
238 © 2011 SAP AG. All rights reserved. 2011
SAP Class Week of April 16, 2012
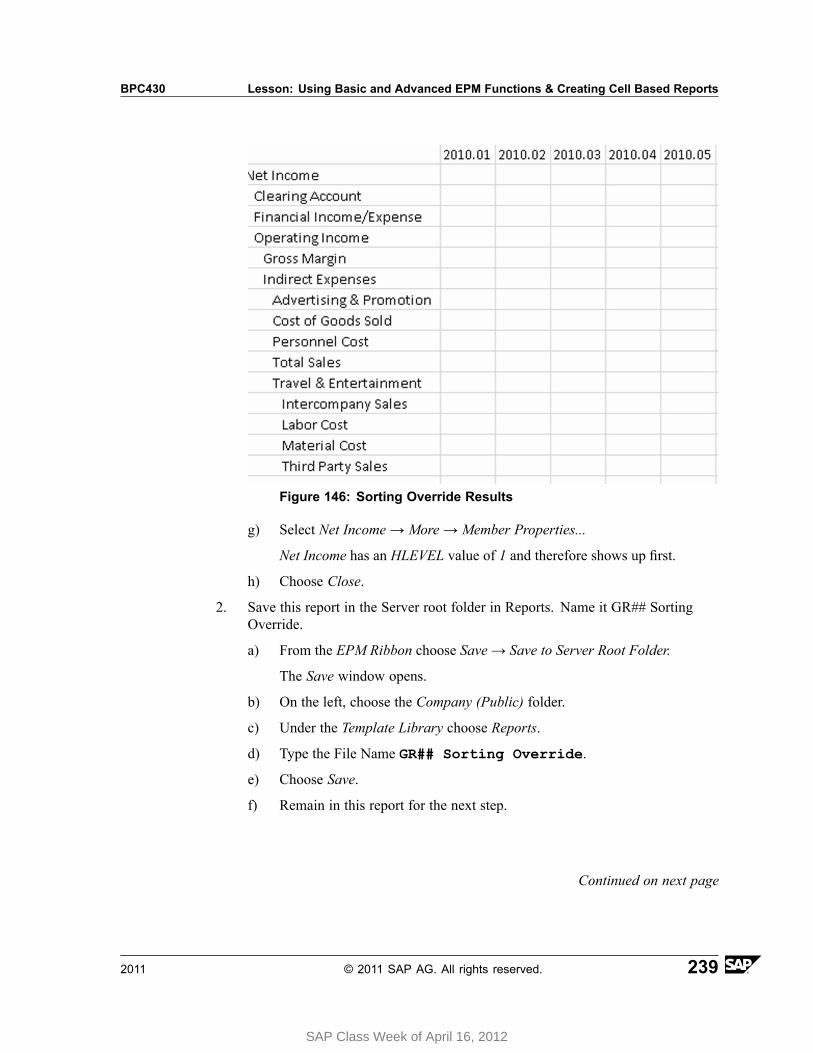
BPC430 Lesson: Using Basic and Advanced EPM Functions & Creating Cell Based Reports
Figure 146: Sorting Override Results
g) Select Net Income → More → Member Properties...
Net Income has an HLEVEL value of 1 and therefore shows up first.
h) Choose Close.
2. Save this report in the Server root folder in Reports. Name it GR## SortingOverride.
a) From the EPM Ribbon choose Save → Save to Server Root Folder.
The Save window opens.
b) On the left, choose the Company (Public) folder.
c) Under the Template Library choose Reports.
d) Type the File Name GR## Sorting Override.
e) Choose Save.
f) Remain in this report for the next step.
Continued on next page
2011 © 2011 SAP AG. All rights reserved. 239
SAP Class Week of April 16, 2012
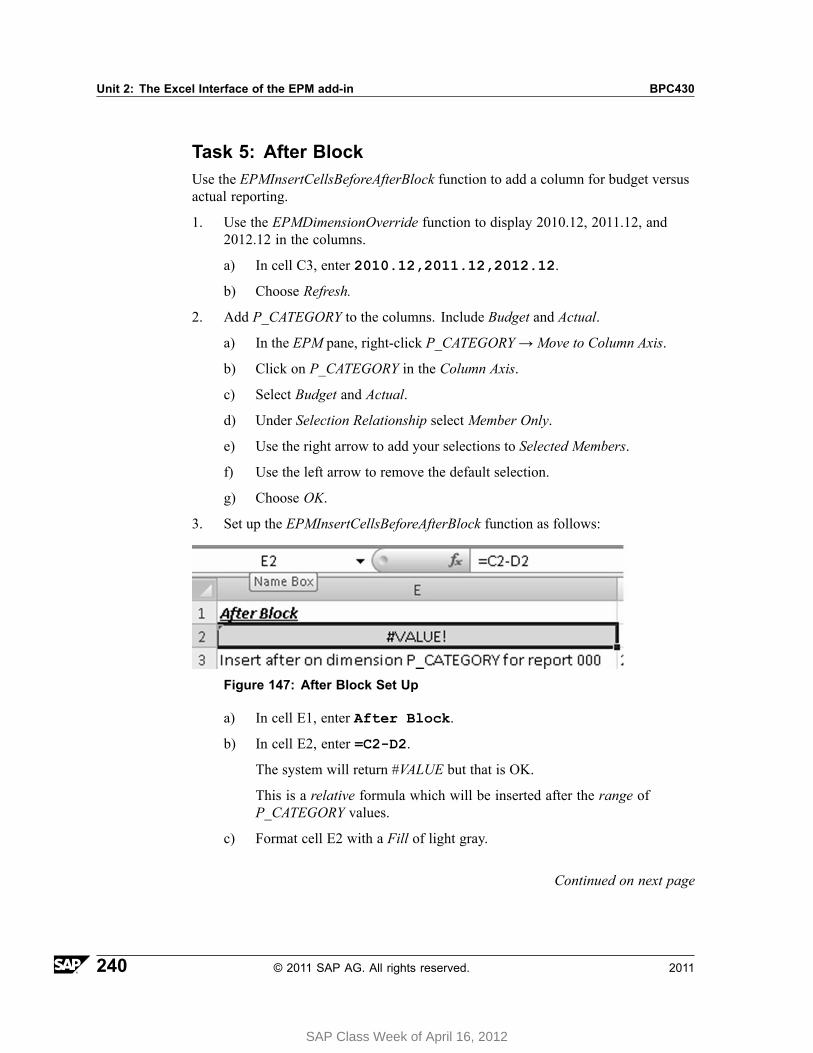
Unit 2: The Excel Interface of the EPM add-in BPC430
Task 5: After BlockUse the EPMInsertCellsBeforeAfterBlock function to add a column for budget versusactual reporting.
1. Use the EPMDimensionOverride function to display 2010.12, 2011.12, and2012.12 in the columns.
a) In cell C3, enter 2010.12,2011.12,2012.12.
b) Choose Refresh.
2. Add P_CATEGORY to the columns. Include Budget and Actual.
a) In the EPM pane, right-click P_CATEGORY → Move to Column Axis.
b) Click on P_CATEGORY in the Column Axis.
c) Select Budget and Actual.
d) Under Selection Relationship select Member Only.
e) Use the right arrow to add your selections to Selected Members.
f) Use the left arrow to remove the default selection.
g) Choose OK.
3. Set up the EPMInsertCellsBeforeAfterBlock function as follows:
Figure 147: After Block Set Up
a) In cell E1, enter After Block.
b) In cell E2, enter =C2-D2.
The system will return #VALUE but that is OK.
This is a relative formula which will be inserted after the range ofP_CATEGORY values.
c) Format cell E2 with a Fill of light gray.
Continued on next page
240 © 2011 SAP AG. All rights reserved. 2011
SAP Class Week of April 16, 2012
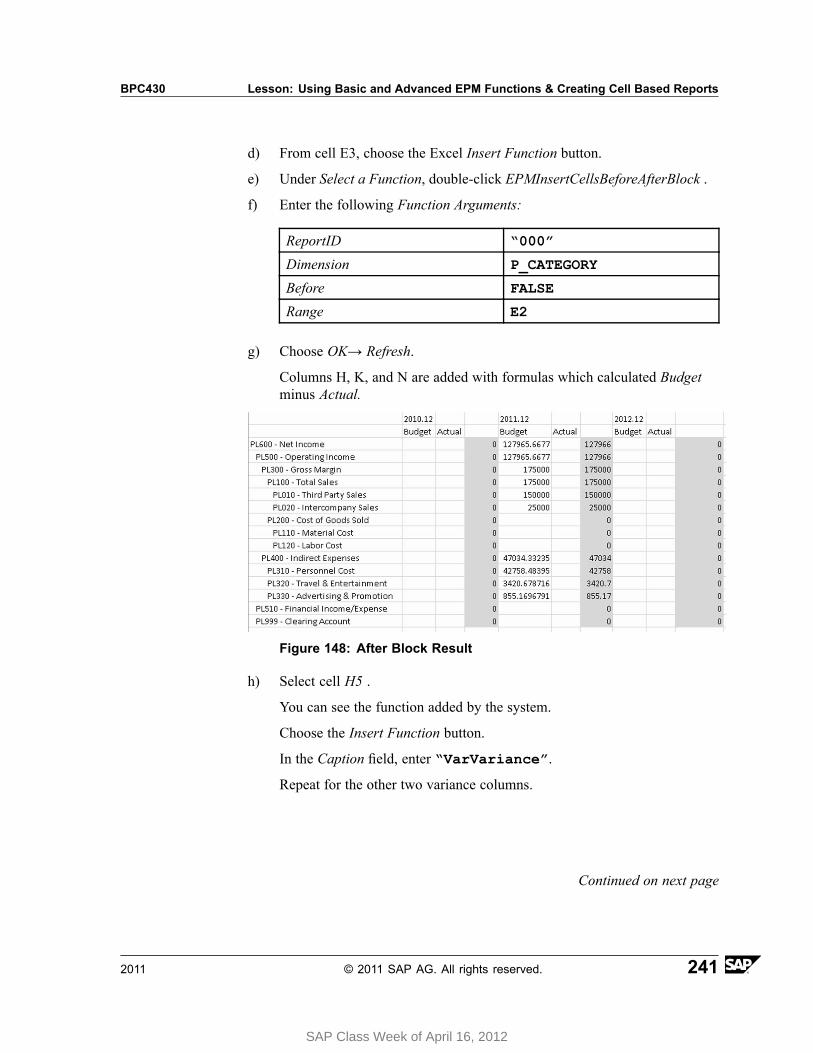
BPC430 Lesson: Using Basic and Advanced EPM Functions & Creating Cell Based Reports
d) From cell E3, choose the Excel Insert Function button.
e) Under Select a Function, double-click EPMInsertCellsBeforeAfterBlock .
f) Enter the following Function Arguments:
ReportID “000”
Dimension P_CATEGORY
Before FALSE
Range E2
g) Choose OK→ Refresh.
Columns H, K, and N are added with formulas which calculated Budgetminus Actual.
Figure 148: After Block Result
h) Select cell H5 .
You can see the function added by the system.
Choose the Insert Function button.
In the Caption field, enter “VarVariance”.
Repeat for the other two variance columns.
Continued on next page
2011 © 2011 SAP AG. All rights reserved. 241
SAP Class Week of April 16, 2012

Unit 2: The Excel Interface of the EPM add-in BPC430
4. Save this report in the Server root folder in Reports. Name it GR## After Block.
a) From the EPM Ribbon, choose Save → Save to Server Root Folder.
b) On the left, choose the Company (Public) folder.
c) Under the Template Library, choose Reports.
d) Type the File Name GR## After Block.
e) Choose Save.
Task 6: Copy RangeUse the EPMCopyRange function to perform formula based formatting.
1. Set up the EPMCopyRange function as follows:
Figure 149: Copy Range Set-Up
Use the following formatting:
F2 Numeric 0 Decimals Use 1000Separator(,)
Lightblue fill
G2 Numeric 0 Decimals Use 1000Separator(,)
Lightgreenfill
H2 Numeric 0 Decimals Use 1000Separator(,)
Lightgray fill
a) In cell F1, enter Cell Based Formatting.
b) Format F2 - H2 as shown above.
c) From cell F3, choose the Excel Insert Function button.
d) Under Select a Function, double-click EPMCopyRange.
e) Enter the following Function Arguments:
Continued on next page
242 © 2011 SAP AG. All rights reserved. 2011
SAP Class Week of April 16, 2012
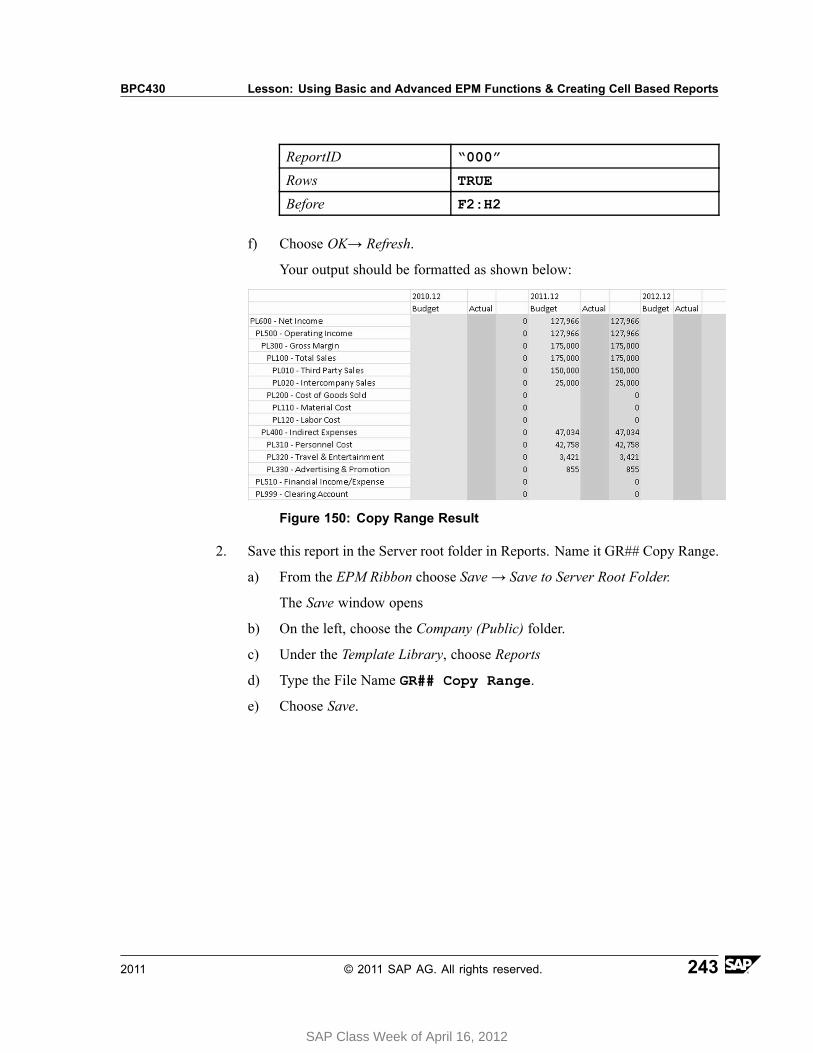
BPC430 Lesson: Using Basic and Advanced EPM Functions & Creating Cell Based Reports
ReportID “000”
Rows TRUE
Before F2:H2
f) Choose OK→ Refresh.
Your output should be formatted as shown below:
Figure 150: Copy Range Result
2. Save this report in the Server root folder in Reports. Name it GR## Copy Range.
a) From the EPM Ribbon choose Save → Save to Server Root Folder.
The Save window opens
b) On the left, choose the Company (Public) folder.
c) Under the Template Library, choose Reports
d) Type the File Name GR## Copy Range.
e) Choose Save.
2011 © 2011 SAP AG. All rights reserved. 243
SAP Class Week of April 16, 2012

Unit 2: The Excel Interface of the EPM add-in BPC430
244 © 2011 SAP AG. All rights reserved. 2011
SAP Class Week of April 16, 2012
BPC430 Lesson: Using Basic and Advanced EPM Functions & Creating Cell Based Reports
Exercise 10: Using VBA in Buttons
Exercise ObjectivesAfter completing this exercise, you will be able to:• Use a button to send data.
Business ExampleYour end users need a way send data via a button.
Task 1:Open a delivered input template.
1. Open the Excel Interface of the EPM add-in.
Note: If you already have Excel open go to Step 2.
2. Set your context members as shown below:
Dimension Member ID - Description
Category FCST_JAN - FCST_JAN
Entity STORE1 - Store1
PRODUCT BIRDGOURMET - Gormet Bird Food
P_Acct CE0001000 - Total Costs
RPTCurrency LC - Local Currency
Time 2012.01 - 12.Jan
Measures PERIODIC - Periodic
3. Open the Dynamic Report with Nested Rows to view the data for indirectexpenses.
4. Go to Visual Basic and turn on the FPMXLClient.
5. Enter the following VBA in the workspace as shown below.
Continued on next page
2011 © 2011 SAP AG. All rights reserved. 245
SAP Class Week of April 16, 2012
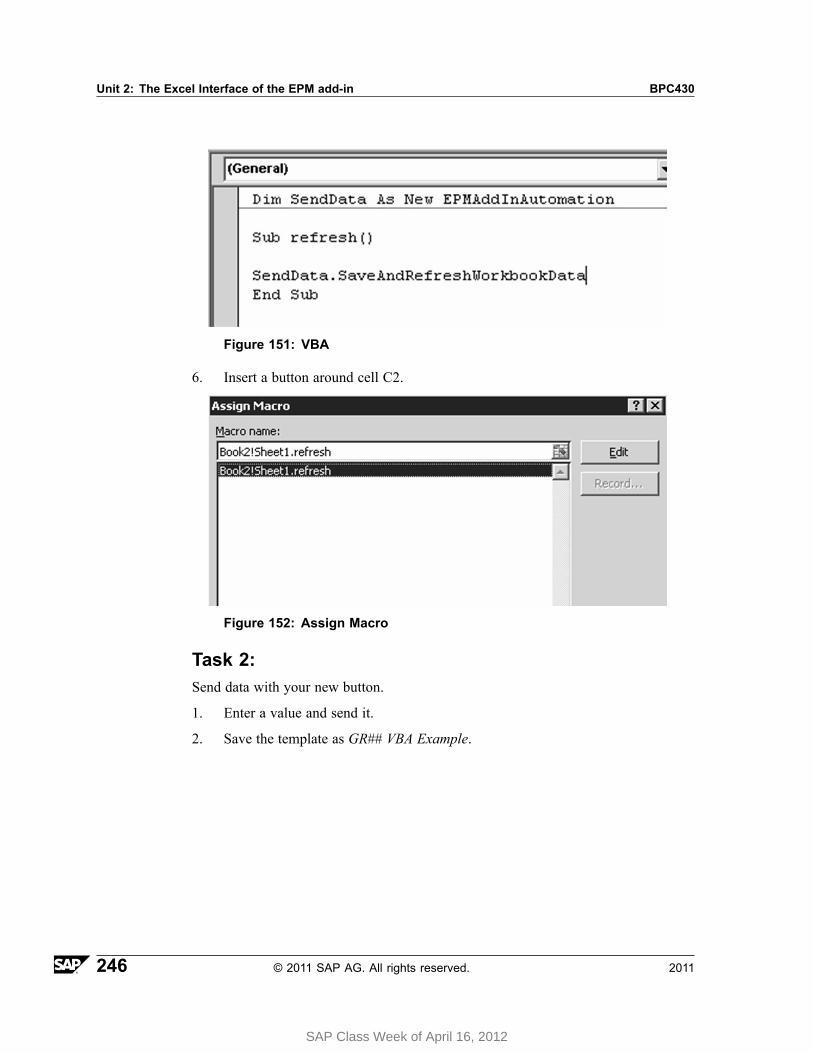
Unit 2: The Excel Interface of the EPM add-in BPC430
Figure 151: VBA
6. Insert a button around cell C2.
Figure 152: Assign Macro
Task 2:Send data with your new button.
1. Enter a value and send it.
2. Save the template as GR## VBA Example.
246 © 2011 SAP AG. All rights reserved. 2011
SAP Class Week of April 16, 2012
BPC430 Lesson: Using Basic and Advanced EPM Functions & Creating Cell Based Reports
Solution 10: Using VBA in ButtonsTask 1:Open a delivered input template.
1. Open the Excel Interface of the EPM add-in.
Note: If you already have Excel open go to Step 2.
a) In the Web Client Start Page select EPM Office Add-in Excel
The EPM - Connection Manager opens after a few seconds
b) Select the Sales - BPC430_## connection.
c) Choose OK.
The EPM Pane appears on the right.
2. Set your context members as shown below:
Dimension Member ID - Description
Category FCST_JAN - FCST_JAN
Entity STORE1 - Store1
PRODUCT BIRDGOURMET - Gormet Bird Food
P_Acct CE0001000 - Total Costs
RPTCurrency LC - Local Currency
Time 2012.01 - 12.Jan
Measures PERIODIC - Periodic
a) Set your context selections as shown in the table.
Continued on next page
2011 © 2011 SAP AG. All rights reserved. 247
SAP Class Week of April 16, 2012
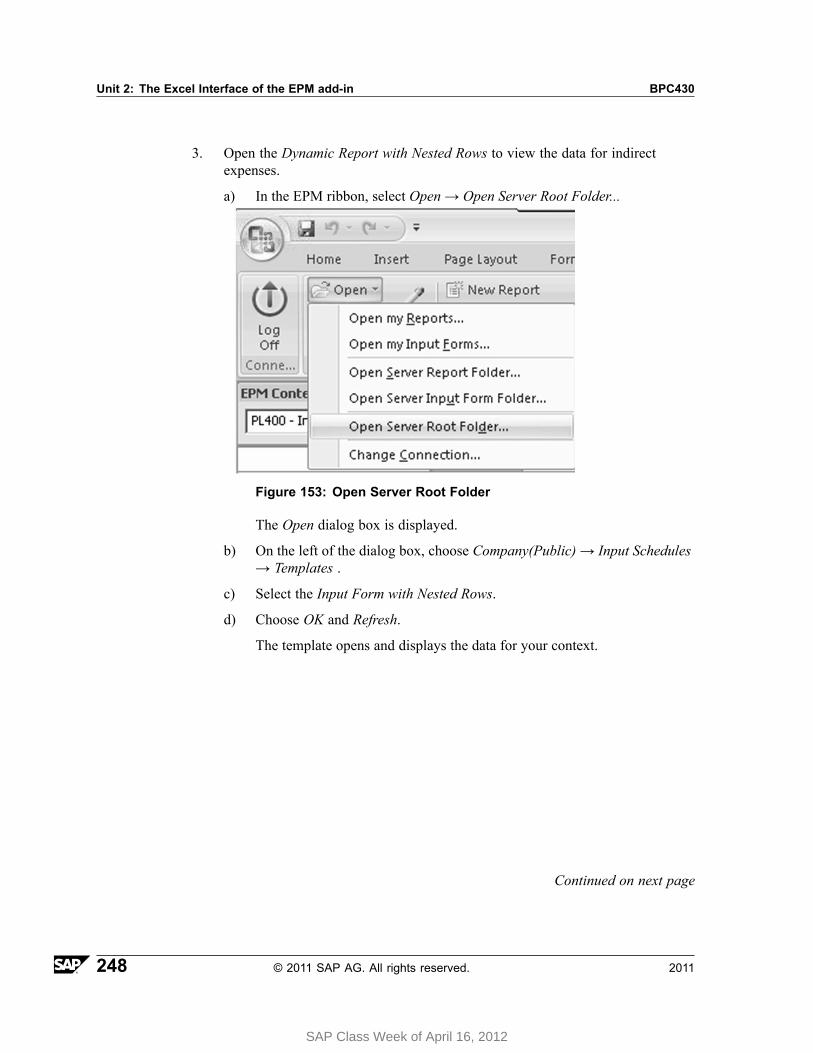
Unit 2: The Excel Interface of the EPM add-in BPC430
3. Open the Dynamic Report with Nested Rows to view the data for indirectexpenses.
a) In the EPM ribbon, select Open → Open Server Root Folder...
Figure 153: Open Server Root Folder
The Open dialog box is displayed.
b) On the left of the dialog box, choose Company(Public) → Input Schedules→ Templates .
c) Select the Input Form with Nested Rows.
d) Choose OK and Refresh.
The template opens and displays the data for your context.
Continued on next page
248 © 2011 SAP AG. All rights reserved. 2011
SAP Class Week of April 16, 2012
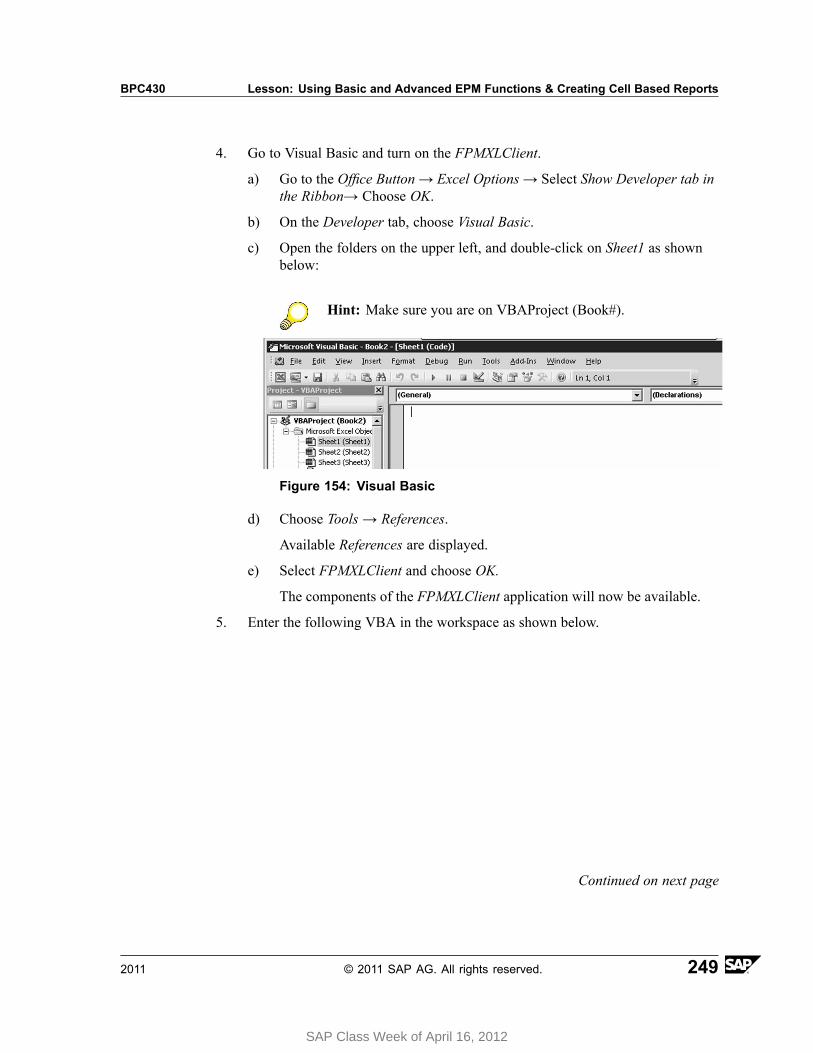
BPC430 Lesson: Using Basic and Advanced EPM Functions & Creating Cell Based Reports
4. Go to Visual Basic and turn on the FPMXLClient.
a) Go to the Office Button → Excel Options → Select Show Developer tab inthe Ribbon→ Choose OK.
b) On the Developer tab, choose Visual Basic.
c) Open the folders on the upper left, and double-click on Sheet1 as shownbelow:
Hint: Make sure you are on VBAProject (Book#).
Figure 154: Visual Basic
d) Choose Tools → References.
Available References are displayed.
e) Select FPMXLClient and choose OK.
The components of the FPMXLClient application will now be available.
5. Enter the following VBA in the workspace as shown below.
Continued on next page
2011 © 2011 SAP AG. All rights reserved. 249
SAP Class Week of April 16, 2012
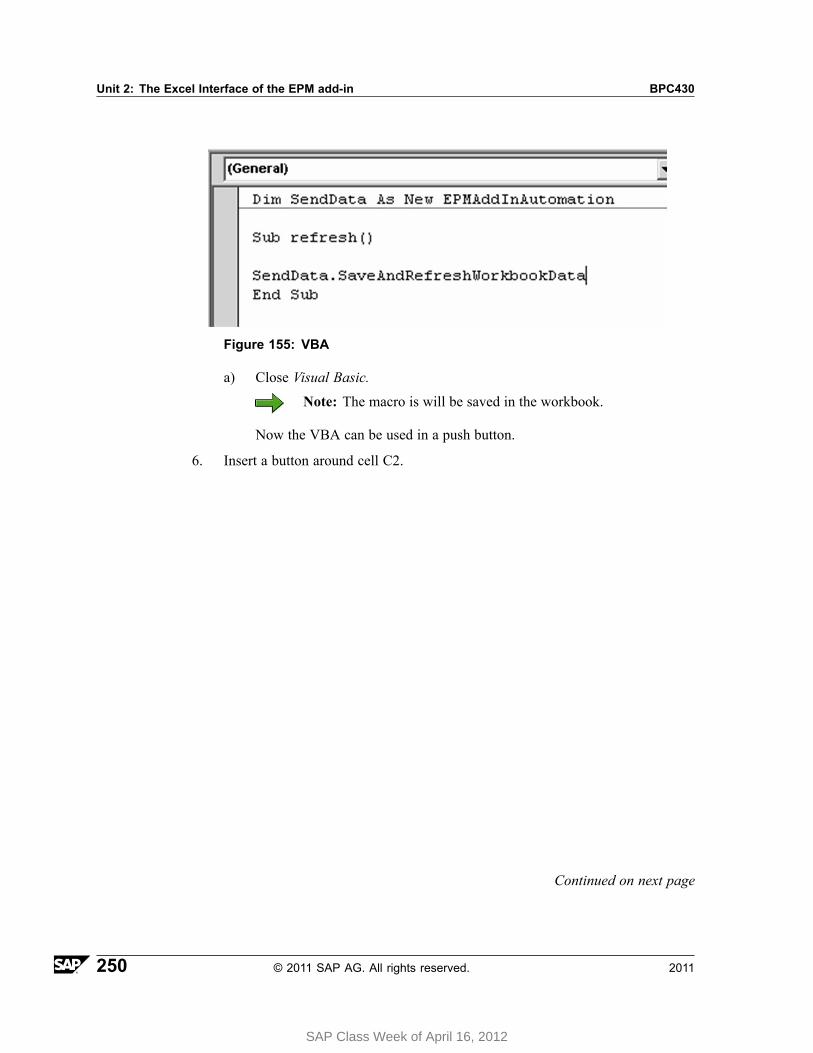
Unit 2: The Excel Interface of the EPM add-in BPC430
Figure 155: VBA
a) Close Visual Basic.
Note: The macro is will be saved in the workbook.
Now the VBA can be used in a push button.
6. Insert a button around cell C2.
Continued on next page
250 © 2011 SAP AG. All rights reserved. 2011
SAP Class Week of April 16, 2012

BPC430 Lesson: Using Basic and Advanced EPM Functions & Creating Cell Based Reports
Figure 156: Assign Macro
a) On the Developer tab, choose Insert → Button (Form Control).
b) Draw a button around cell C2.
c) Choose the macro as shown above.
d) Choose OK.
The macro is assigned to the push button and now you can enter adescription.
e) Type Send Data
f) Left click in a cell away from the push button.
The button is ready to be used.
Task 2:Send data with your new button.
1. Enter a value and send it.
a) Double-click on Personal Costs.
b) Enter a value that is higher by 1 for January Personnel Expenses.
c) Click the Send Data button.
d) To send the data, choose Yes.
The Save Results dialog box is displayed.
e) Choose OK.
Continued on next page
2011 © 2011 SAP AG. All rights reserved. 251
SAP Class Week of April 16, 2012

Unit 2: The Excel Interface of the EPM add-in BPC430
2. Save the template as GR## VBA Example.
a) On the EPM tab, choose Save → Save to Server Root Folder
b) Choose Company(Public) → Input Schedules.
c) In the File Name field enter: GR## VBA Example.
d) Choose Save.
252 © 2011 SAP AG. All rights reserved. 2011
SAP Class Week of April 16, 2012
BPC430 Lesson: Using Basic and Advanced EPM Functions & Creating Cell Based Reports
Lesson Summary
You should now be able to:• Use EPM functions to pull in descriptions and properties into your reports• Create reports and input forms from scratch• Discuss the most important delivered EPM functions• Perform smart variance calculations• Use the time offset function• Set up a push button
2011 © 2011 SAP AG. All rights reserved. 253
SAP Class Week of April 16, 2012
Unit 2: The Excel Interface of the EPM add-in BPC430
Lesson: Using Delivered Templates
Lesson OverviewIn this lesson, you will learn about the delivered reports and input schedules in theExcel Interface of the EPM Add-in.
Lesson ObjectivesAfter completing this lesson, you will be able to:
• Use delivered input schedules• Use delivered reports
Business ExampleYou need to know about the delivered templates, because you want to use them tomeet your business requirements.
Delivered Reports and Input TemplatesIn this section, you will learn about the delivered reports in the EPM add-in.
254 © 2011 SAP AG. All rights reserved. 2011
SAP Class Week of April 16, 2012
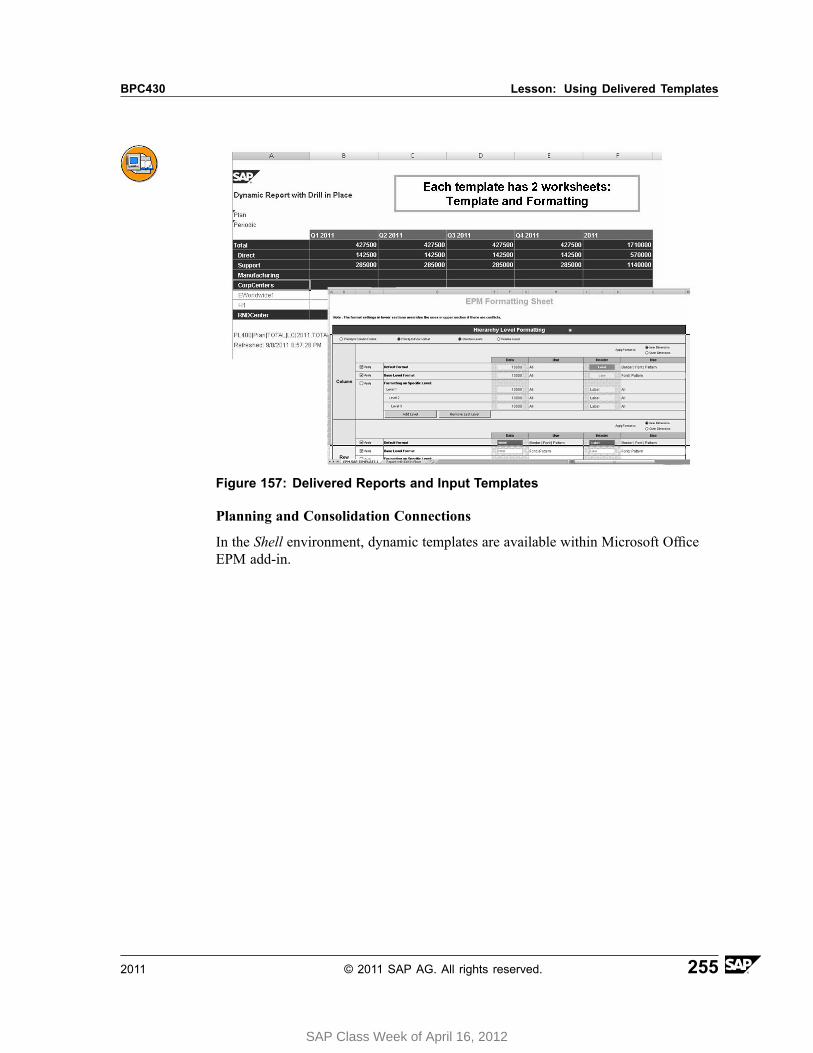
BPC430 Lesson: Using Delivered Templates
Figure 157: Delivered Reports and Input Templates
Planning and Consolidation Connections
In the Shell environment, dynamic templates are available within Microsoft OfficeEPM add-in.
2011 © 2011 SAP AG. All rights reserved. 255
SAP Class Week of April 16, 2012
Unit 2: The Excel Interface of the EPM add-in BPC430
For the Finance model:
• 10 templates designed for reports.• 5 templates designed for input forms.
For the Rate model:
• 4 templates designed for reports.• 3 templates designed for input forms.
For the Ownership model:
• 2 templates designed for reports.• No templates designed for input forms.
You can find the templates in the following folders on the Planning and Consolidationserver:
• Templates for input forms are stored in the Templates folder of the “InputSchedules” folder.
• Templates for reports are stored in the Templates of the Reports folder.
Each workbook contains two worksheets:
• One sheet contains the template. You can connect the template to any model,then change the context members and the template continues to be valid.
• One sheet contains a dynamic formatting sheet that is applied to the template.
These templates are XLTX files and therefore can be opened by more than one userat a time.
Note: As a template can be used with various connections, the Do not StoreConnection option in the EPM → Edit Report → Options is selected bydefault.
256 © 2011 SAP AG. All rights reserved. 2011
SAP Class Week of April 16, 2012

BPC430 Lesson: Using Delivered Templates
Lesson Summary
You should now be able to:• Use delivered input schedules• Use delivered reports
2011 © 2011 SAP AG. All rights reserved. 257
SAP Class Week of April 16, 2012
Unit 2: The Excel Interface of the EPM add-in BPC430
Lesson: Comparing EvDRE to EPM Reports
Lesson OverviewIn this lesson, we will review the key EvDRE features and identify how they arehandled in EPM Reports.
Lesson ObjectivesAfter completing this lesson, you will be able to:
• Use EvDRE templates in the EPM add-in• Describe the key features of EvDRE templates• Identify how EvDRE features are provided in the EPM Reports
Business ExampleYou have been using EvDRE templates and now you need to know how to performthe same reporting techniques in EPM Reports.
EvDRE Overview• Stands for Everest Data Range Exchange• Performs range-based sending and retrieval of data• Used for both reports and input schedules
The EvDRE function was used to generate large reports and input schedules withoptimal performance.
258 © 2011 SAP AG. All rights reserved. 2011
SAP Class Week of April 16, 2012
BPC430 Lesson: Comparing EvDRE to EPM Reports
Figure 158: Introduction to EvDRE
• By accepting cell ranges as parameters, EvDRE workbooks are faster todownload and upload because there are no send or retrieve functions in the datacells.
• You can use EvDRE to build static workbooks (without expansions) as well asdynamic workbooks (with expansions), or workbooks where some dimensionsare defined using static members while others dynamically expand.
• You can define one or more expansions on the rows, columns, or bothsimultaneously.
• Workbook options determine how EvDRE sends data.
If the workbook option Type is set to Report, you cannot send data. If the optionis set to Input Schedule, the template can retrieve and send data. Allows for easycreation of reports with multiple expansions.
The EvDRE BuilderThe figure below shows the first step to create a report or input schedule using EvDREin prior releases.
EvDRE templates cannot be created in the EPM add-in without creating rangesmanually.
2011 © 2011 SAP AG. All rights reserved. 259
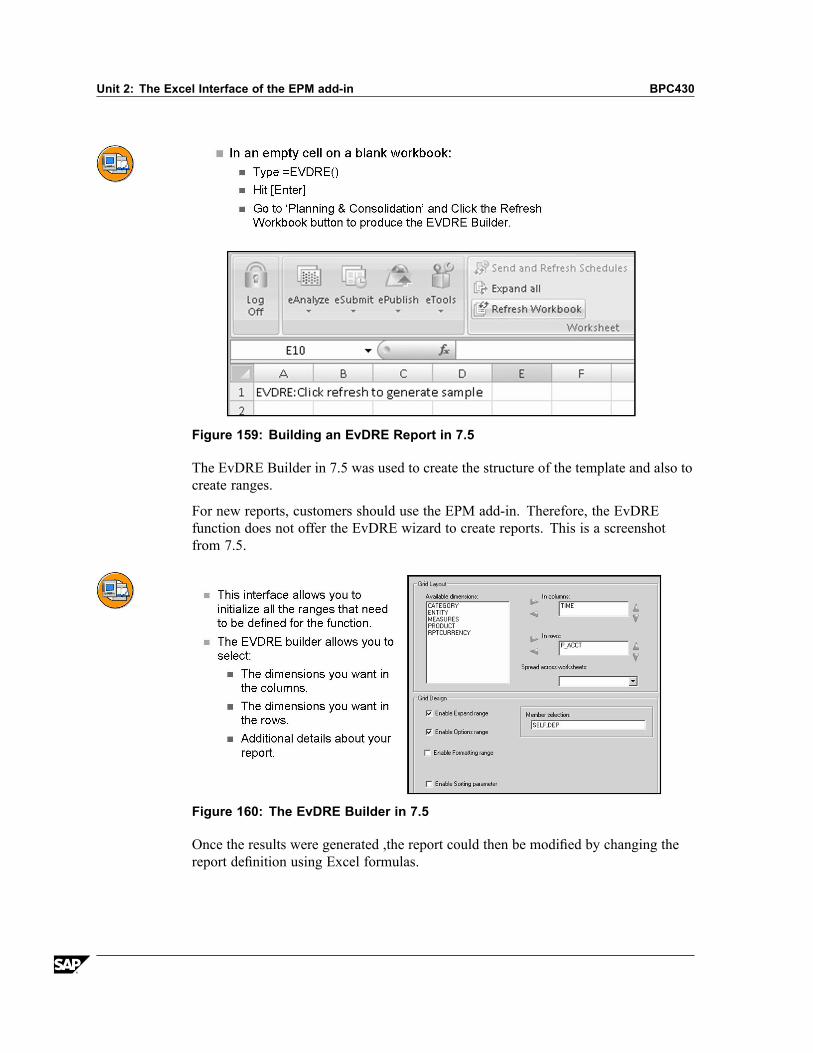
Unit 2: The Excel Interface of the EPM add-in BPC430
Figure 159: Building an EvDRE Report in 7.5
The EvDRE Builder in 7.5 was used to create the structure of the template and also tocreate ranges.
For new reports, customers should use the EPM add-in. Therefore, the EvDREfunction does not offer the EvDRE wizard to create reports. This is a screenshotfrom 7.5.
Figure 160: The EvDRE Builder in 7.5
Once the results were generated ,the report could then be modified by changing thereport definition using Excel formulas.
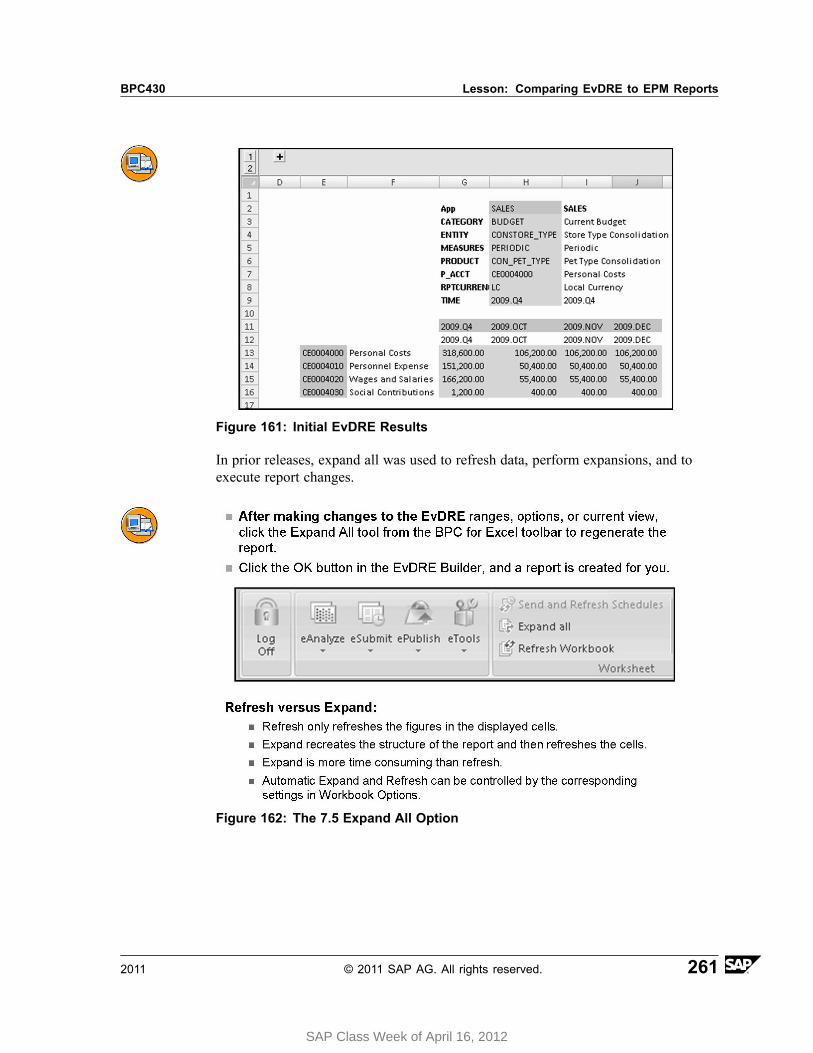
BPC430 Lesson: Comparing EvDRE to EPM Reports
Figure 161: Initial EvDRE Results
In prior releases, expand all was used to refresh data, perform expansions, and toexecute report changes.
Figure 162: The 7.5 Expand All Option
2011 © 2011 SAP AG. All rights reserved. 261
SAP Class Week of April 16, 2012
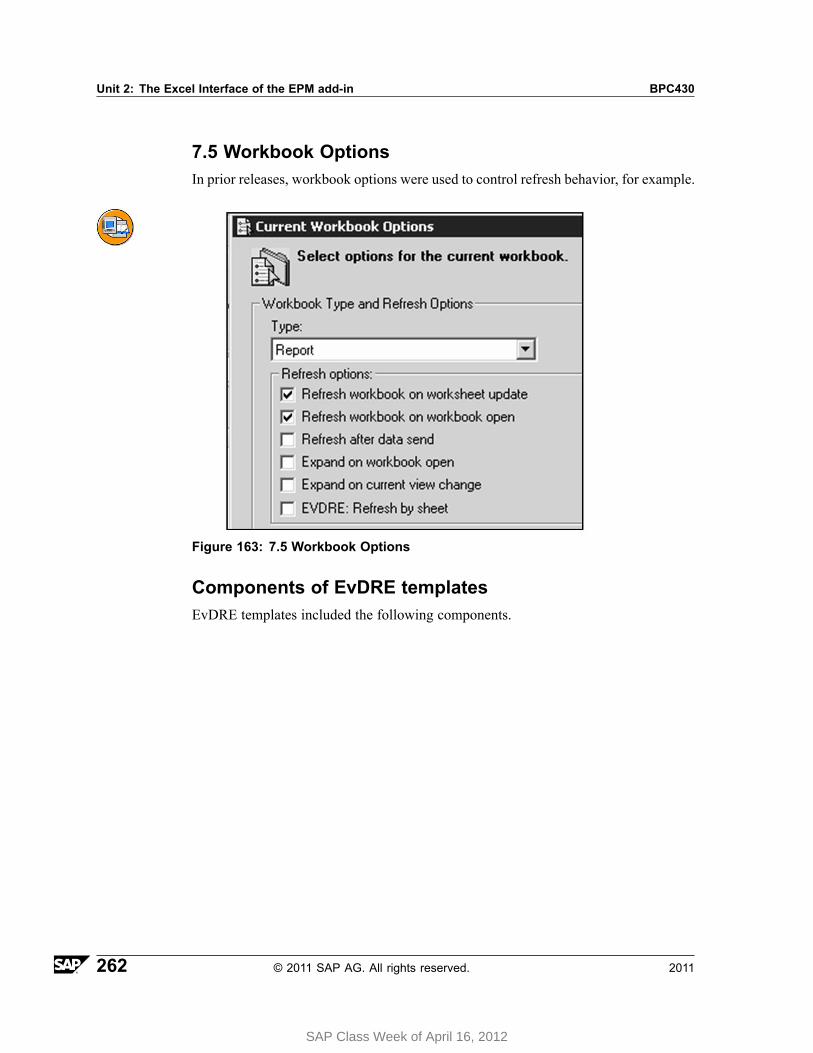
Unit 2: The Excel Interface of the EPM add-in BPC430
7.5 Workbook OptionsIn prior releases, workbook options were used to control refresh behavior, for example.
Figure 163: 7.5 Workbook Options
Components of EvDRE templatesEvDRE templates included the following components.
262 © 2011 SAP AG. All rights reserved. 2011
SAP Class Week of April 16, 2012
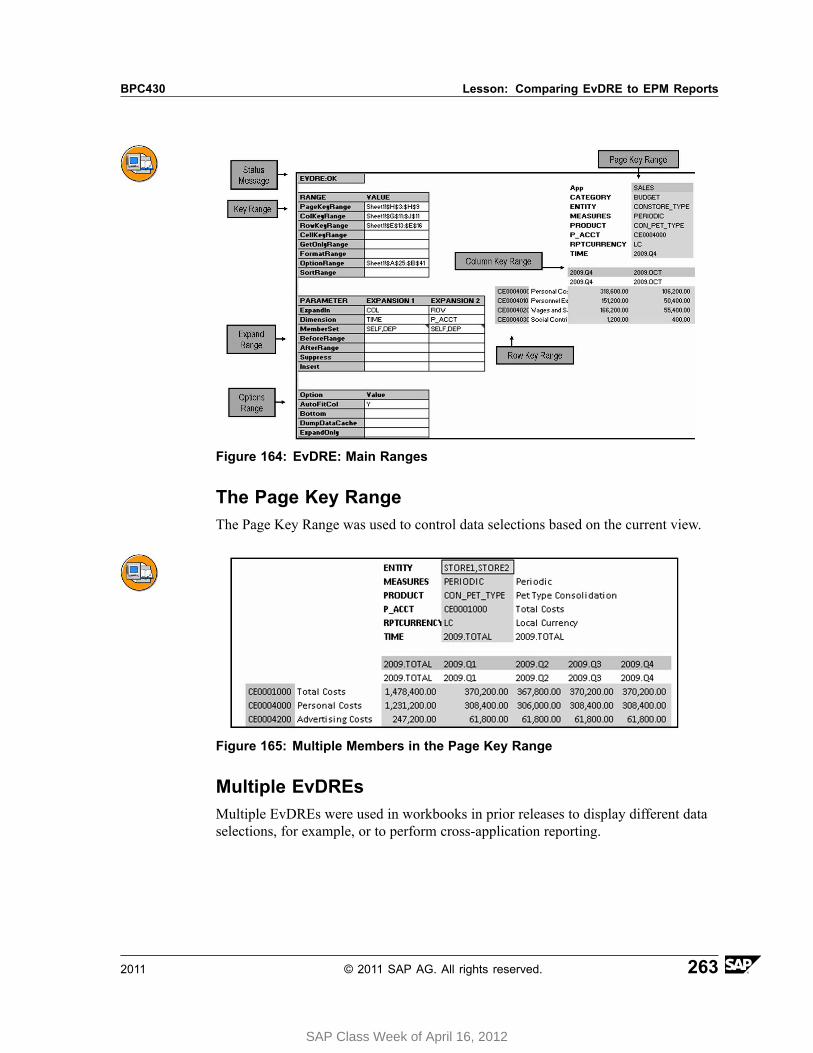
BPC430 Lesson: Comparing EvDRE to EPM Reports
Figure 164: EvDRE: Main Ranges
The Page Key RangeThe Page Key Range was used to control data selections based on the current view.
Figure 165: Multiple Members in the Page Key Range
Multiple EvDREsMultiple EvDREs were used in workbooks in prior releases to display different dataselections, for example, or to perform cross-application reporting.
2011 © 2011 SAP AG. All rights reserved. 263
SAP Class Week of April 16, 2012
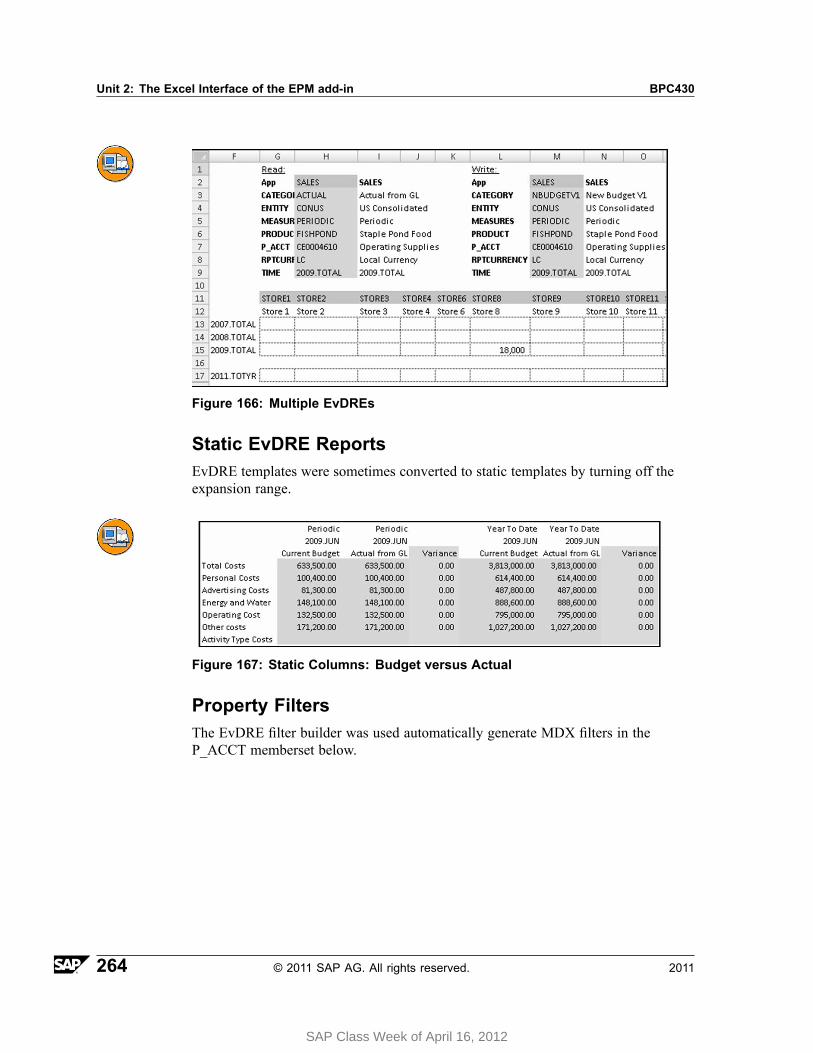
Unit 2: The Excel Interface of the EPM add-in BPC430
Figure 166: Multiple EvDREs
Static EvDRE ReportsEvDRE templates were sometimes converted to static templates by turning off theexpansion range.
Figure 167: Static Columns: Budget versus Actual
Property FiltersThe EvDRE filter builder was used automatically generate MDX filters in theP_ACCT memberset below.
264 © 2011 SAP AG. All rights reserved. 2011
SAP Class Week of April 16, 2012
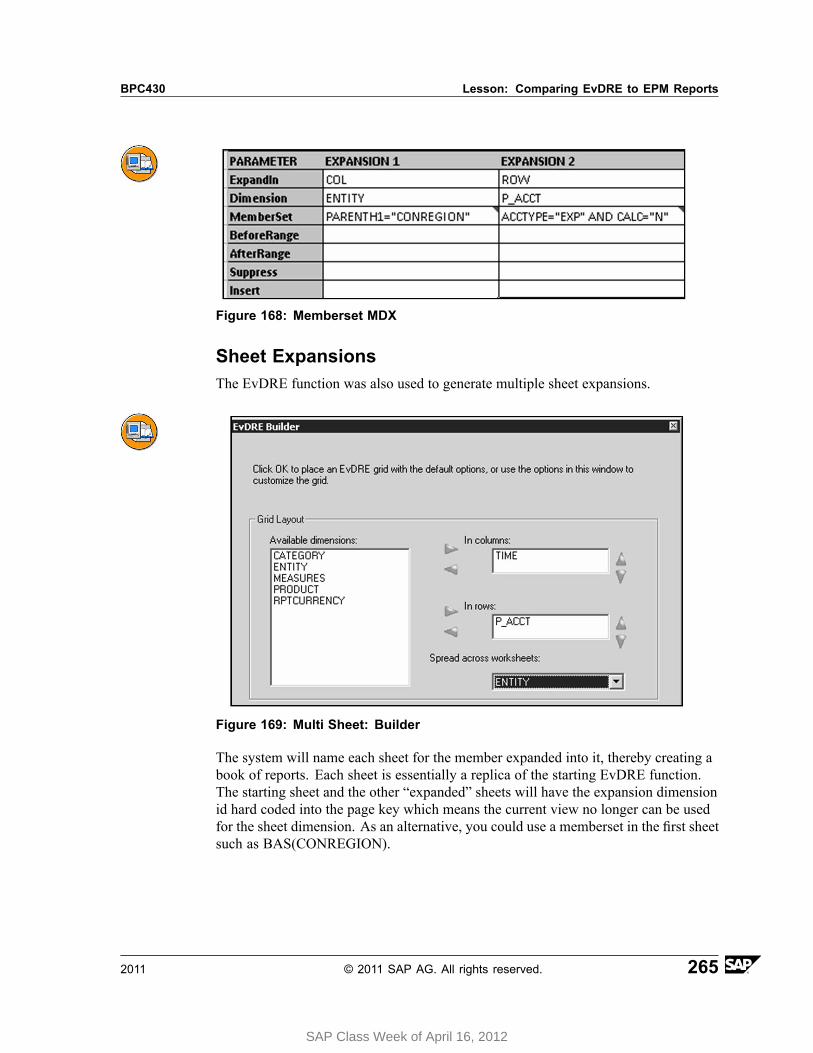
BPC430 Lesson: Comparing EvDRE to EPM Reports
Figure 168: Memberset MDX
Sheet ExpansionsThe EvDRE function was also used to generate multiple sheet expansions.
Figure 169: Multi Sheet: Builder
The system will name each sheet for the member expanded into it, thereby creating abook of reports. Each sheet is essentially a replica of the starting EvDRE function.The starting sheet and the other “expanded” sheets will have the expansion dimensionid hard coded into the page key which means the current view no longer can be usedfor the sheet dimension. As an alternative, you could use a memberset in the first sheetsuch as BAS(CONREGION).
2011 © 2011 SAP AG. All rights reserved. 265
SAP Class Week of April 16, 2012

Unit 2: The Excel Interface of the EPM add-in BPC430
OptionsEvDRE reports with the enable options range selected use the EVRNG function toreference the generated option range shown below.
Figure 170: Option Table
The 7.5 options are described below:
AutofitCol
Automatically adjusts the size of the columns containing the EvDRE ranges to fitthe content after refreshing data.
Bottom n
Shows only the specified number (n) of the lowest values in the entire data range.
DumpDataCache
The content of the data cache is written in the log file EvDRE_log.txt.
ExpandOnly
Disables the refresh action and performs only an expansion, when requested. Thesystem does not retrieve data from the database.
GroupExpansion
If you use dynamic hierarchies, you can expand on Entity and Group at the same time.Any fixed group dimension structure used in statutory dynamic hierarchies remainsintact in EvDRE reporting.
266 © 2011 SAP AG. All rights reserved. 2011
SAP Class Week of April 16, 2012
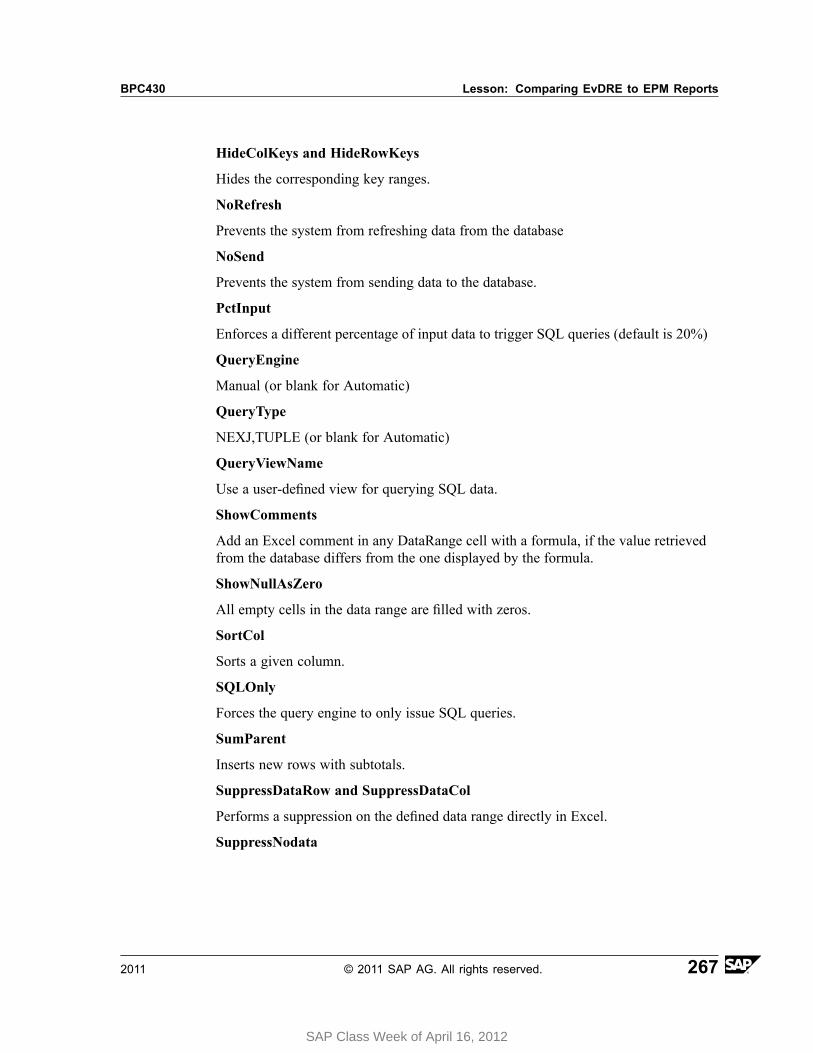
BPC430 Lesson: Comparing EvDRE to EPM Reports
HideColKeys and HideRowKeys
Hides the corresponding key ranges.
NoRefresh
Prevents the system from refreshing data from the database
NoSend
Prevents the system from sending data to the database.
PctInput
Enforces a different percentage of input data to trigger SQL queries (default is 20%)
QueryEngine
Manual (or blank for Automatic)
QueryType
NEXJ,TUPLE (or blank for Automatic)
QueryViewName
Use a user-defined view for querying SQL data.
ShowComments
Add an Excel comment in any DataRange cell with a formula, if the value retrievedfrom the database differs from the one displayed by the formula.
ShowNullAsZero
All empty cells in the data range are filled with zeros.
SortCol
Sorts a given column.
SQLOnly
Forces the query engine to only issue SQL queries.
SumParent
Inserts new rows with subtotals.
SuppressDataRow and SuppressDataCol
Performs a suppression on the defined data range directly in Excel.
SuppressNodata
2011 © 2011 SAP AG. All rights reserved. 267
SAP Class Week of April 16, 2012
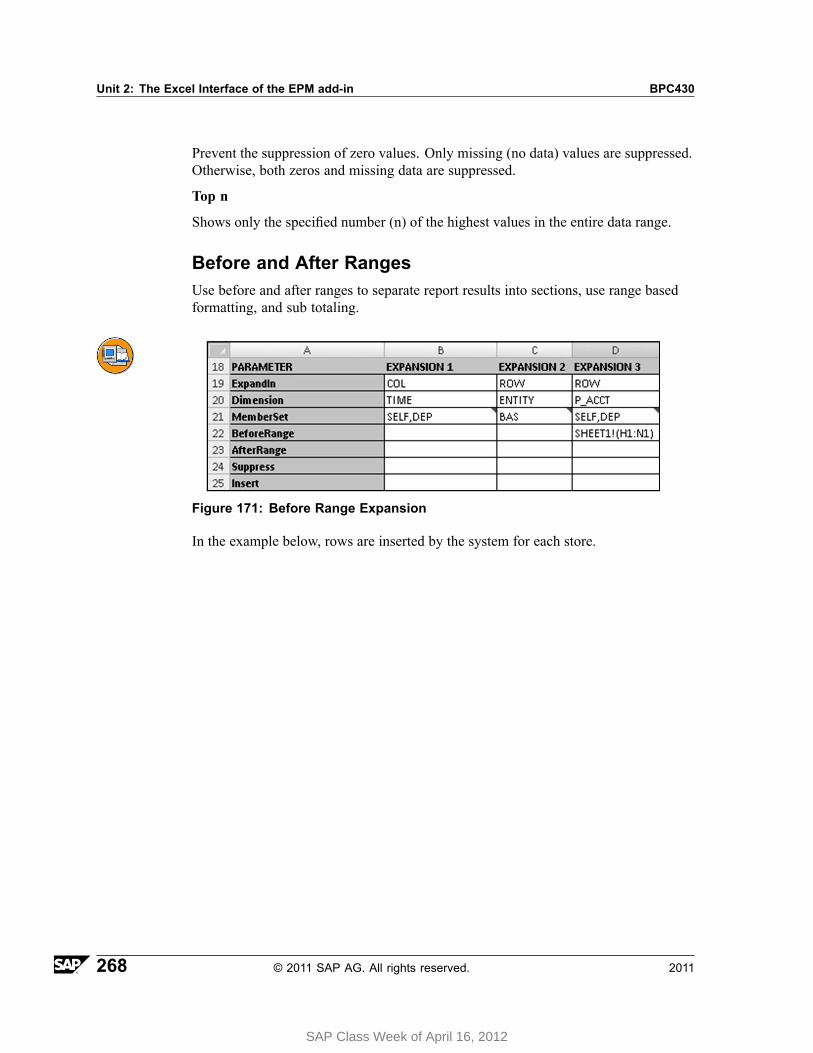
Unit 2: The Excel Interface of the EPM add-in BPC430
Prevent the suppression of zero values. Only missing (no data) values are suppressed.Otherwise, both zeros and missing data are suppressed.
Top n
Shows only the specified number (n) of the highest values in the entire data range.
Before and After RangesUse before and after ranges to separate report results into sections, use range basedformatting, and sub totaling.
Figure 171: Before Range Expansion
In the example below, rows are inserted by the system for each store.
268 © 2011 SAP AG. All rights reserved. 2011
SAP Class Week of April 16, 2012
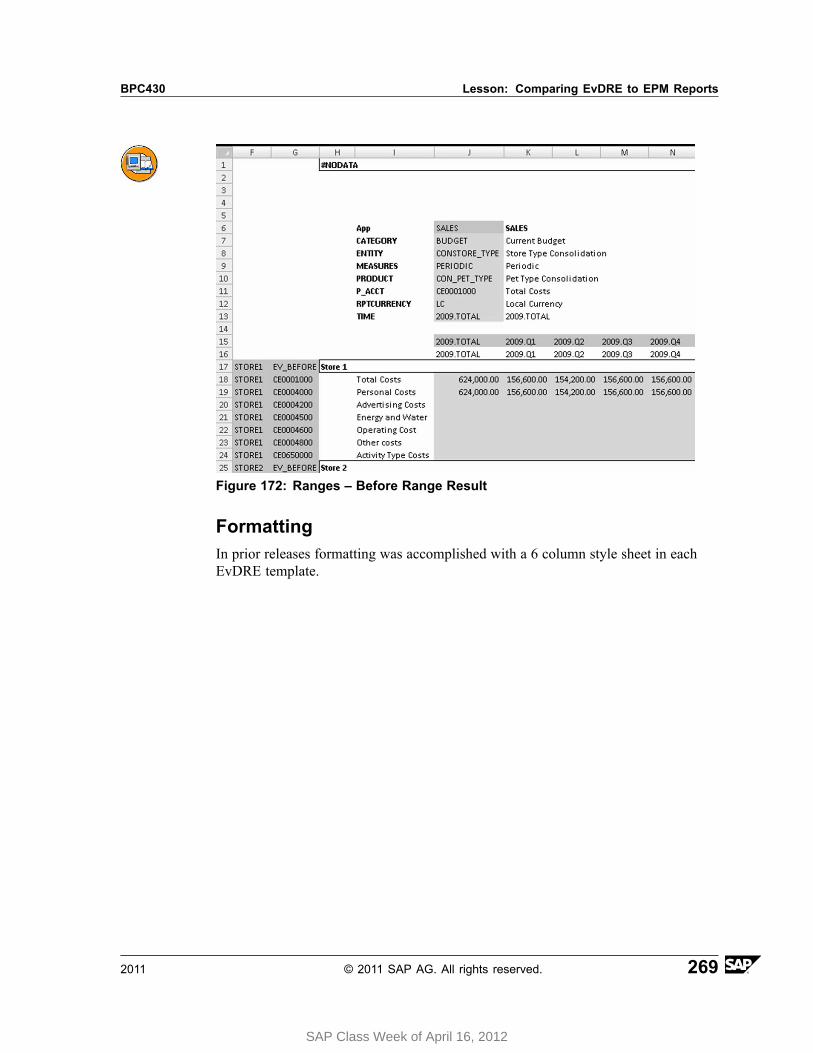
BPC430 Lesson: Comparing EvDRE to EPM Reports
Figure 172: Ranges – Before Range Result
FormattingIn prior releases formatting was accomplished with a 6 column style sheet in eachEvDRE template.
2011 © 2011 SAP AG. All rights reserved. 269
SAP Class Week of April 16, 2012
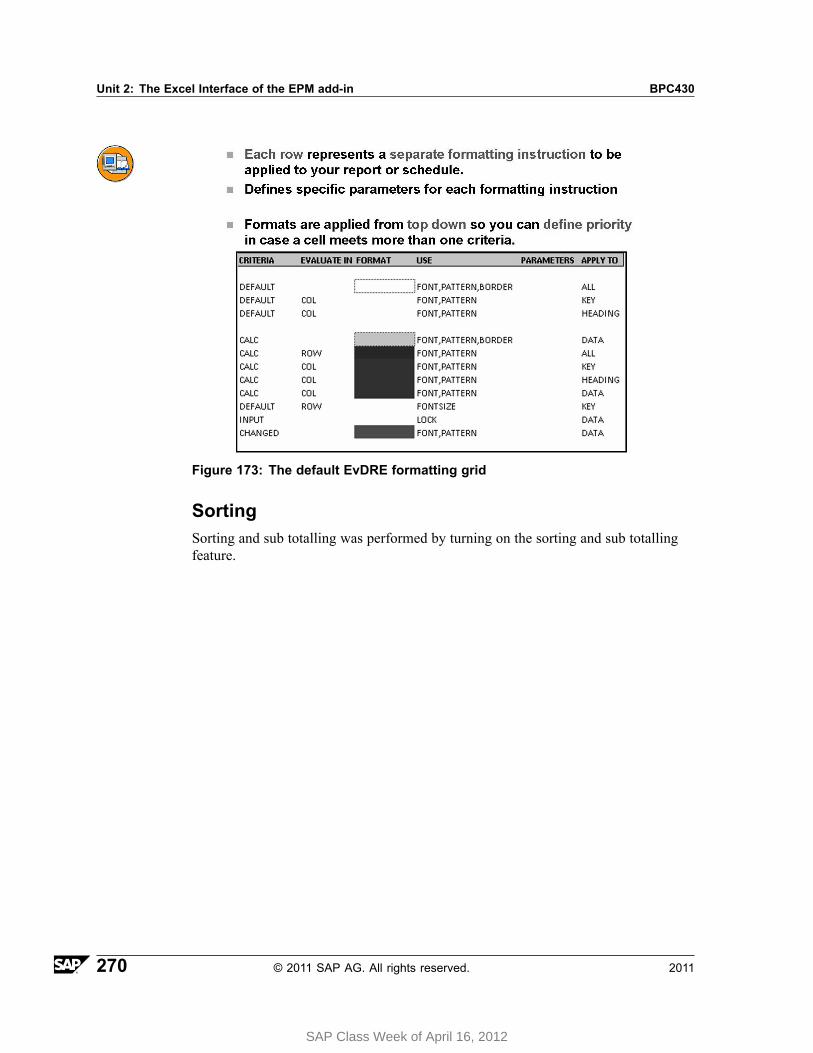
Unit 2: The Excel Interface of the EPM add-in BPC430
Figure 173: The default EvDRE formatting grid
SortingSorting and sub totalling was performed by turning on the sorting and sub totallingfeature.
270 © 2011 SAP AG. All rights reserved. 2011
SAP Class Week of April 16, 2012

BPC430 Lesson: Comparing EvDRE to EPM Reports
Figure 174: Sorting with a break total in the EvDRE Builder
Multiple Row and Column Key RangesSince EvDRE is an array-based tool, it will generate a continuous set of row andcolumn data. However, that may make it difficult to do your analysis. You can usemultiple row and column key ranges to break the results up into blocks for easieranalysis. As an example, what if you wanted a report that shows account by entitysuch as the one below?
Figure 175: Row Key Range: Result
2011 © 2011 SAP AG. All rights reserved. 271
SAP Class Week of April 16, 2012
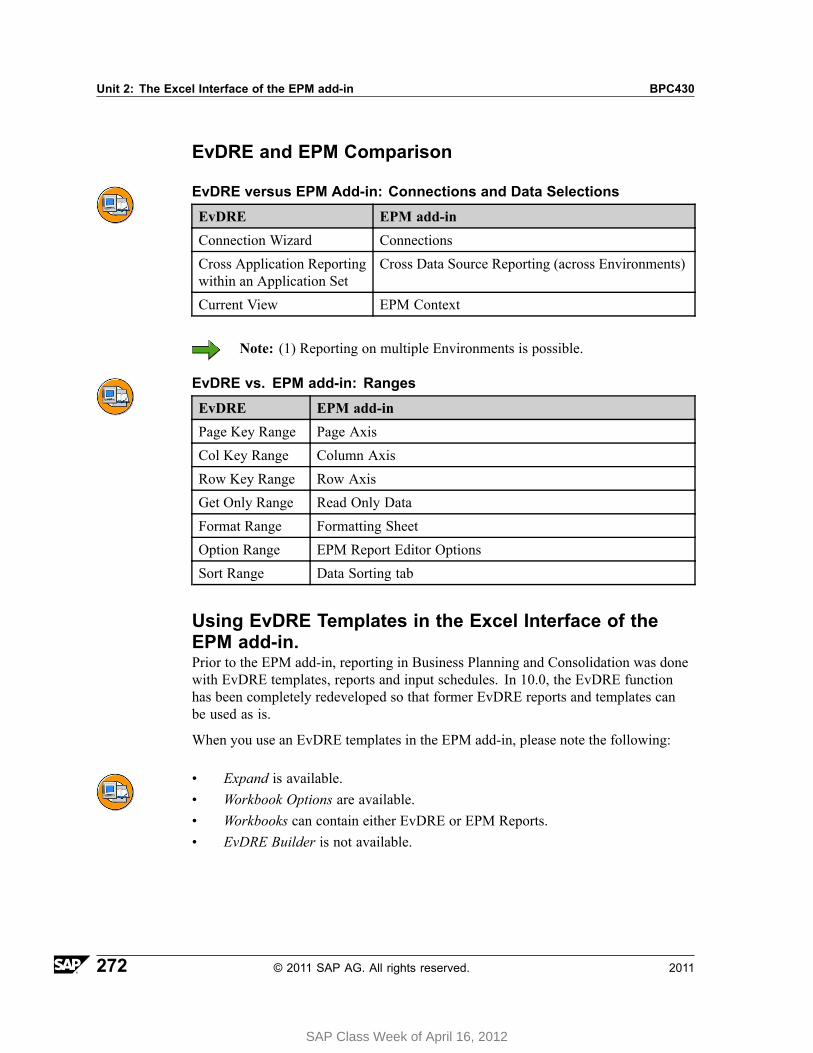
Unit 2: The Excel Interface of the EPM add-in BPC430
EvDRE and EPM Comparison
EvDRE versus EPM Add-in: Connections and Data Selections
EvDRE EPM add-in
Connection Wizard Connections
Cross Application Reportingwithin an Application Set
Cross Data Source Reporting (across Environments)
Current View EPM Context
Note: (1) Reporting on multiple Environments is possible.
EvDRE vs. EPM add-in: Ranges
EvDRE EPM add-in
Page Key Range Page Axis
Col Key Range Column Axis
Row Key Range Row Axis
Get Only Range Read Only Data
Format Range Formatting Sheet
Option Range EPM Report Editor Options
Sort Range Data Sorting tab
Using EvDRE Templates in the Excel Interface of theEPM add-in.Prior to the EPM add-in, reporting in Business Planning and Consolidation was donewith EvDRE templates, reports and input schedules. In 10.0, the EvDRE functionhas been completely redeveloped so that former EvDRE reports and templates canbe used as is.
When you use an EvDRE templates in the EPM add-in, please note the following:
• Expand is available.• Workbook Options are available.• Workbooks can contain either EvDRE or EPM Reports.• EvDRE Builder is not available.
272 © 2011 SAP AG. All rights reserved. 2011
SAP Class Week of April 16, 2012
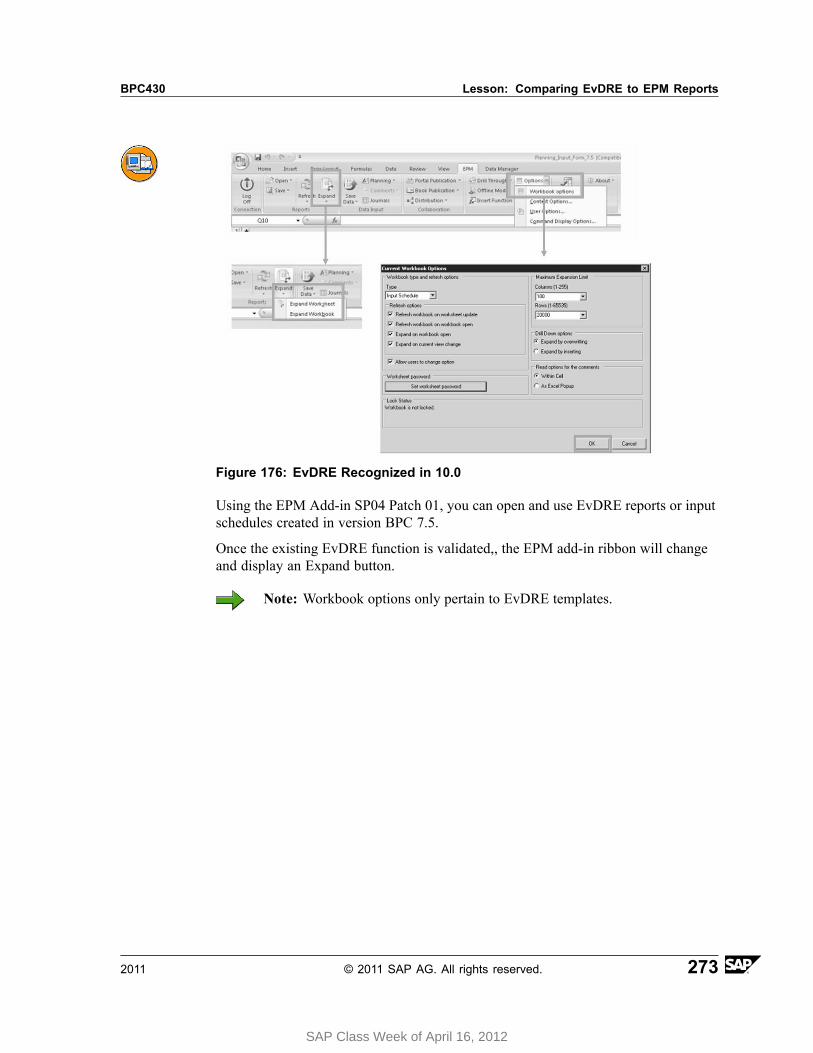
BPC430 Lesson: Comparing EvDRE to EPM Reports
Figure 176: EvDRE Recognized in 10.0
Using the EPM Add-in SP04 Patch 01, you can open and use EvDRE reports or inputschedules created in version BPC 7.5.
Once the existing EvDRE function is validated,, the EPM add-in ribbon will changeand display an Expand button.
Note: Workbook options only pertain to EvDRE templates.
2011 © 2011 SAP AG. All rights reserved. 273
SAP Class Week of April 16, 2012
Unit 2: The Excel Interface of the EPM add-in BPC430
Lesson Summary
You should now be able to:• Use EvDRE templates in the EPM add-in• Describe the key features of EvDRE templates• Identify how EvDRE features are provided in the EPM Reports
274 © 2011 SAP AG. All rights reserved. 2011
SAP Class Week of April 16, 2012
BPC430 Lesson: Migrating EvDRE Templates
Lesson: Migrating EvDRE Templates
Lesson OverviewThe new SAP Business Objects EPM Solutions add-in for Microsoft Office 10.0 hasbeen completely developed from scratch. Thus, the former Application ProgrammingInterface (API) used in SAP Business Objects Planning and Consolidation 7.5 is notusable anymore. For this reason, you want to know what steps are necessary to useyour existing EvDRE reports and input templates.
Lesson ObjectivesAfter completing this lesson, you will be able to:
• Migrate EvDRE templates.
Business ExampleYour company or client still uses EvDRE templates so you need to know how migratethem.
Migration optionsBoth EvDRE input schedules as well as reports from 7.5 can be migrated.
2011 © 2011 SAP AG. All rights reserved. 275
SAP Class Week of April 16, 2012
Unit 2: The Excel Interface of the EPM add-in BPC430
When you migrate an EvDRE template, the following actions occur:
• Row and column expansions are migrated.• EV functions are retained.• Empty rows and columns are migrated.• A formatting sheet is created with the original styles.• Sorting, ranking, suppressing, insert options, and column shifts are not migrated.• VBA is not migrated.• A copy of the original template is created if migrated from the application server.• A Log is generated.
Hint: You can find the log under the More button. It includes items thatare not migrated as well.
• Protected workbooks/sheets are not migrated.
If an EvDRE contains several report ranges, the RowKeyRange contains more thanone range and the ColKeyRange also; the lowest number of ranges determines thenumber of reports to be migrated.
For example, if the RowKeyRange contains 2 ranges and the ColKeyRange contains 3ranges, 2 reports will be created.
The first report will use the first range of the RowKeyRange and the first range ofthe ColKeyRange.
The second report will use the second range of the RowKeyRange and the second andthird ranges of the ColKeyRange, if the ranges are on the same row, or the secondrange of the ColKeyRange (and the third range is not migrated), if the ranges are noton the same row.
As a general rule, the EPM add-in supports the share of an entire axe (that is the exactsame range of cells), not just a part of it. Also, an axis can be shared only if the reportsthat share the axis are on the same model.
The ranges for BeforeRange and AfterRange are migrated, based on the EPM functioncalled "EPMInsertCellsBeforeAfterBlock". After migration, in the BeforeRange orAfterRange row, the cell that contains the EPMInsertCellsBeforeAfterBlock functionappears in yellow. So that the migrated report continues to function, do not delete thecell in yellow. You can move it to another cell in the sheet.
276 © 2011 SAP AG. All rights reserved. 2011
SAP Class Week of April 16, 2012
BPC430 Lesson: Migrating EvDRE Templates
Caution: The migration of a worksheet or a workbook can only be performedonce. For this reason, it is recommended that you make a copy of your 7.5workbooks before migrating.
The following ranges are not migrated:
• CellKeyRange You can use the EPM add-in equivalent features, depending onwhat you want to do: the Keep Formula on Data option, or local members.
• GetOnlyRange You can use the EPM add-in equivalent feature: Read-only Data.• SortRange You can use the EPM add-in equivalent feature: Data Sorting. .
In an EPM add-in report (on a Planning and Consolidation connection), a dimensioncan be used only in one of the three axes (page, row or column).
Therefore, if a dimension is used in the RowKeyRange or the ColKeyRange, and alsoin the PageKeyRange, once migrated, the dimension remains in the row or columnaxis, and the dimension is displayed in the page axis range just for your information,but it is not used and its member is not identified by a formula beginning with=EPMOlapMember(.
For each KeyRange, the keys are migrated into EPMOlapMember. In the keys cells,the descriptions of members are displayed by default. You will then be able to chooseanother display name for members in the Member Selector dialog box.
The headings are left in the sheet just for information (they are not identified asEPMOlapMember). After the migration, they will be automatically deleted as soon asyou perform a refresh that changes the members displayed in the report. There is noequivalent to headings in the EPM add-in.
Migration Prerequisites
• The EvDRE formula, the KeysRange and the ExpansionsRange must be onthe same sheet
• PageKeyRange must be above the RowKeyRange and ColKeyRange• ColKeyRange must be above the RowKeyRange• RowKeyRange must be to the left of the ColKeyRange• ExpandOnly option is not set to Y• All the models are on the same environment in cases where you have several
EvDRE's in one workbook
2011 © 2011 SAP AG. All rights reserved. 277
SAP Class Week of April 16, 2012
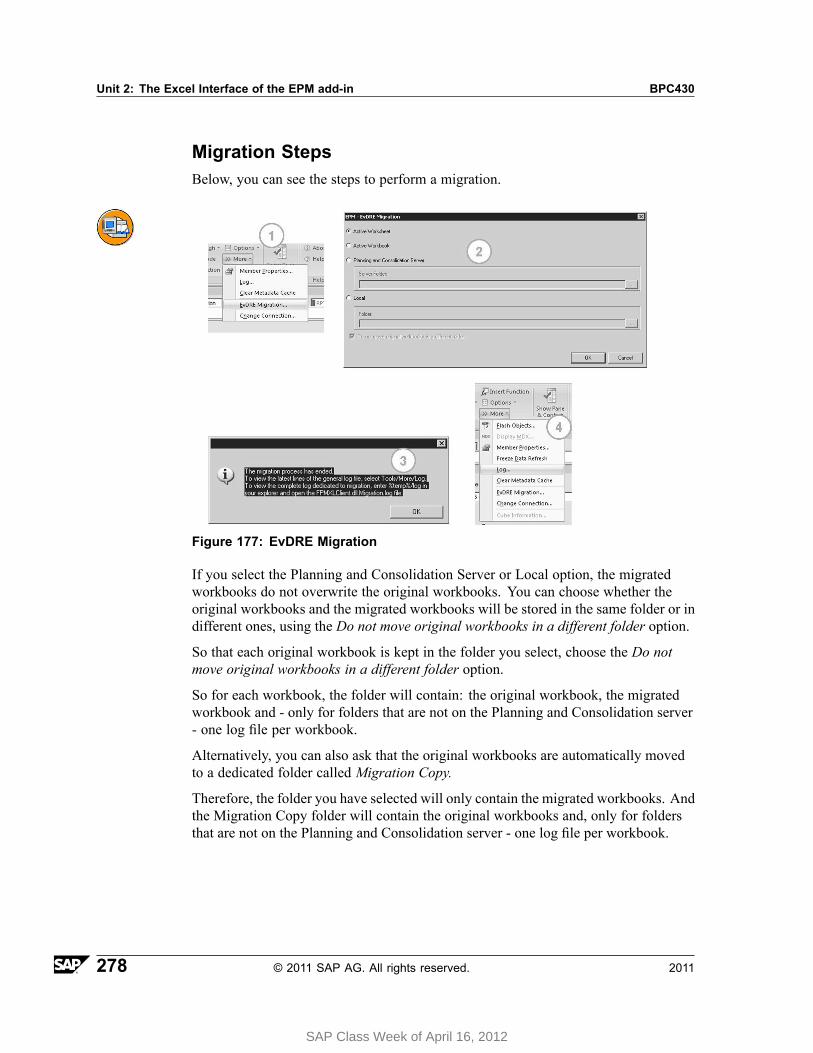
Unit 2: The Excel Interface of the EPM add-in BPC430
Migration StepsBelow, you can see the steps to perform a migration.
Figure 177: EvDRE Migration
If you select the Planning and Consolidation Server or Local option, the migratedworkbooks do not overwrite the original workbooks. You can choose whether theoriginal workbooks and the migrated workbooks will be stored in the same folder or indifferent ones, using the Do not move original workbooks in a different folder option.
So that each original workbook is kept in the folder you select, choose the Do notmove original workbooks in a different folder option.
So for each workbook, the folder will contain: the original workbook, the migratedworkbook and - only for folders that are not on the Planning and Consolidation server- one log file per workbook.
Alternatively, you can also ask that the original workbooks are automatically movedto a dedicated folder called Migration Copy.
Therefore, the folder you have selected will only contain the migrated workbooks. Andthe Migration Copy folder will contain the original workbooks and, only for foldersthat are not on the Planning and Consolidation server - one log file per workbook.
278 © 2011 SAP AG. All rights reserved. 2011
SAP Class Week of April 16, 2012
BPC430 Lesson: Migrating EvDRE Templates
To do so, simply deselect the Do not move original workbooks in a different folderoption.
Note: An original workbook is automatically renamed the following way:#Copy of Original#[original name]
Page Key AxisThe EvDRE Page Key Axis is migrated according to the following criteria:
Page Key Axis Migration
Member Migrated or Not
Identified by a formula beginning with=EVCVW(
Is not taken into account. The formularemains after migration but is notmigrated into a formula beginning with=EPMOlapMember(.
Identified by a formula different from=EVCVW(
Is migrated. The member isidentified by a formula beginningwith =EPMOlapMember(
Hard-coded member For example:2010.TOTAL
Is migrated. The member isidentified by a formula beginningwith =EPMOlapMember(
Several members separatedby a comma For example:2008.TOTAL,2009.TOTAL,2010.TOTAL
Is migrated. The members all togetherare identified by a formula beginningwith =EPMOlapMultiMember(. Whenseveral members are selected for thesame dimension in the page axis, thedata on the members are automaticallyaggregated in the report.
If the PageKeyRange references several ranges, all the ranges will be migrated intoonly one page axis for all the EvDRE reports Following this rule: if several membersof the same dimension appear in the different ranges, only the first one read by themigration process is migrated. The other members of the dimension are still displayedbut they are not recognized as an EPMOlapMember.
In some cases, members are not recognized as valid members or simply not migrated.When a member is not recognized in the page axis (for example, a member has beendeleted from the environment):
2011 © 2011 SAP AG. All rights reserved. 279
SAP Class Week of April 16, 2012
Unit 2: The Excel Interface of the EPM add-in BPC430
The following sentence is displayed in the log: The member '{0}' at position [{1},{2}]is not valid.
The member remains in the page axis range just for your information, but it is notidentified by a formula beginning with =EPMOlapMember(.
RowKeyRange and ColKeyRange Members
RowKeyRange and ColKeyRange Members Migration
Member Migrated or Not
Identified by any formula Is migrated. The member is identifiedby a formula beginning with =EPMOlapMember(
Hard-coded member For example:2010.TOTAL
Is migrated. The member isidentified by a formula beginningwith =EPMOlapMember(
ev_before and ev_after parameters Is migrated. The member is identifiedby a formula beginning with =EPMInsertedMember(
All member formulas are migrated. The formulas that reference other cells are alsomigrated and continue to reference the same cell.
Members whose formulas begin with =EPMInsertedMember( are "fake" members,meaning that they do not have the standard behavior of members in the EPM add-in.These members ensure the continuity of the row or column axis.
When there is more than one dimension in a row or in a column axis and if onemember is not recognized, the entire row or column is not valid. See below.
When migrated, the Microsoft Office Excel "General" number format is automaticallyapplied to all the cells of the row and column axes.
All the merged cells in the row and column axes are automatically unmerged duringthe migration process. If at least one of the row or column axes does not containany member, the report is not migrated.
In some cases, members are not recognized as valid members or simply not migrated.When a member is not recognized in a row or page axis (for example, a member hasbeen deleted from the database).
The following sentence is displayed in the log: The member '{0}' at position [{1},{2}]is not valid for the dimension '{3}'
280 © 2011 SAP AG. All rights reserved. 2011
SAP Class Week of April 16, 2012
BPC430 Lesson: Migrating EvDRE Templates
The member cell is colored in magenta on a row or column created temporarily. Youcan easily spot the members that you will not find in your report. As soon as youperform a refresh on the report, the temporary rows and columns for the unrecognizedmembers are deleted.
ExpansionsRangeThe EXPANDIN parameters below are migrated:
• COL• ROW
SHEET is not migrated. If reports have already been generated based on the SHEETparameter, the reports can be migrated.
The EPM add-in equivalent feature is: Workbook Sheets Automatic Generation.
The values below are not migrated:
• Suppress You can use the EPM add-in equivalent feature: the Remove EmptyRows and Remove Empty Columns options.
• Insert You can use the EPM add-in equivalent feature: entering members directlyin a sheet or using the Member Selector dialog box.
During the migration process, the ExpansionsRange is read from left to right. Whenthere are several dimensions in an axis, the inner and outer dimensions are thereforekept in the original order.
EPM - EvDRE Migration Options
• Active worksheets can be migrated.• An Active Workbook can be migrated.• Workbooks can be migrated from the Planning and Consolidation Server.• Workbooks can be migrated from the Local drive.• A copy of the original template is created if migrated from the application server.• A Log is generated.
Hint: You can find the log under the More button.
2011 © 2011 SAP AG. All rights reserved. 281
SAP Class Week of April 16, 2012
Unit 2: The Excel Interface of the EPM add-in BPC430
OptionsRangeThe following options are migrated:
• AutoFitCol - Equivalent feature in the EPM add-in: Auto Fit Column Width.• NoRefresh - Equivalent feature in the EPM add-in: Freeze Data Refresh.• NoSend - Equivalent feature in the EPM add-in: Use as Input Form.• ShowComments - Equivalent feature in the EPM add-in: Keep Formula on Data
and Show Source Data in Comments .• SQLOnly - Equivalent feature in the EPM add-in: Display only Base Level Data.• ShowNullAsZero - Equivalent feature in the EPM add-in: Empty Cell Default
Value .• SumParent - Equivalent feature in the EPM add-in: Calculate Parents in
Hierarchies.• SuppressNodata - When the value is N or No, after migration, the Remove
Empty Rows and Remove Empty Columns options are selected in the EPMadd-in. When the value is Y or Yes, after migration, in the EPM add-in, theRemove Empty Rows and Remove Empty Columns options are selected and afilter on rows that contain 0 is created so that rows with zero are not displayedin the report.
The following options are not migrated:
• Bottom - Equivalent feature in the EPM add-in: Data Ranking.• DumpDataCache - Equivalent feature in the EPM add-in: Metadata Cache.• ExpandOnly• GroupExpansion - Equivalent feature in the EPM add-in: Ownership-based
Hierarchies.• HideColKeys - In the EPM add-in, you can choose the name you want to display
for members. Member Name to Display• HideRowKeys - In the EPM add-in: you can choose the name you want to
display for members. Member Name to Display• PctInput• QueryEngine• QueryType• QueryViewName• SortCo- Equivalent feature in the EPM add-in: Member Sorting and Grouping
feature in the Member Selector.• SuppressDataCol - Equivalent feature in the EPM add-in: Excluding Members.• SuppressDataRow - Equivalent feature in the EPM add-in: Excluding Members.
282 © 2011 SAP AG. All rights reserved. 2011
SAP Class Week of April 16, 2012
BPC430 Lesson: Migrating EvDRE Templates
• Top Equivalent feature in the EPM add-in: Data Ranking.
The Migration LogThe migration log lists the migration steps and the items that are migrated or not.
The latest lines of the log file can be displayed by selecting EPM→More → Log.
Main Steps displayed in the log Explanations
The EvDRE migration for the sheet[SheetName] is starting.
Indicate the beginning of the analysis fora sheet. For each sheet migrated, thistext appears.
There are [number] EvDRE functionsIndicate the number of EvDRE detected.detected in the sheet.
Indicate the number of EvDRE detected.
Start reading EvDRE options. Check that the ExpandOnly option is notset to Y or YES. If it is set to Y or YES,the EvDRE is not migrated.
Start analyzing EvDRE functions. The analysis will determine the numberof reports that will be migrated. If anEvDRE or a report will not be migrated,this information is written below thisstep.
Start process with EvDRE number[number]...
The migration process starts for theEvDRE. For each EvDRE, this textappears.
Start reading page axis. The page axis is read. Valid membersare migrated. For each member that isnot migrated, a text is displayed withinthis step.
Start reading member definition. The page axis members are read fromthe ExpansionRange if there is one.
Start reading formatting sheet... The format settings are analyzed.
Start reading the report 000... The report is read. For each report,this text appears. The row axis is read.Valid members are migrated. For eachmember that is not migrated, a text isdisplayed within this step.
2011 © 2011 SAP AG. All rights reserved. 283
SAP Class Week of April 16, 2012
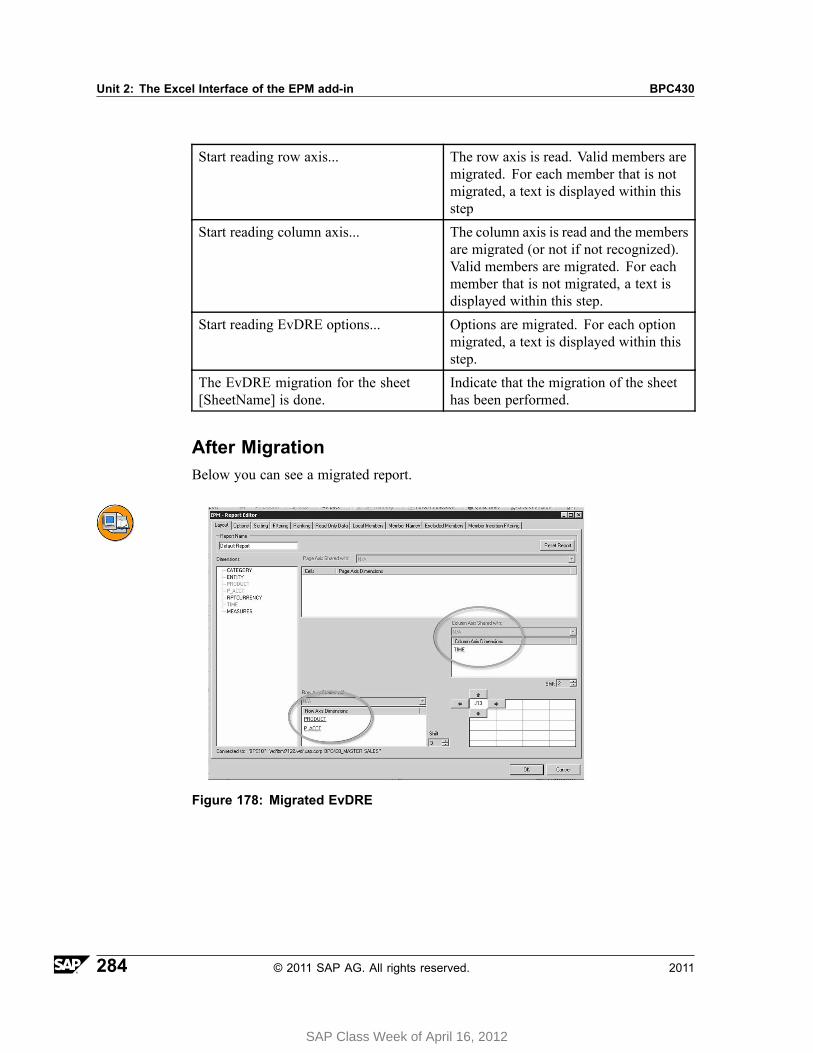
Unit 2: The Excel Interface of the EPM add-in BPC430
Start reading row axis... The row axis is read. Valid members aremigrated. For each member that is notmigrated, a text is displayed within thisstep
Start reading column axis... The column axis is read and the membersare migrated (or not if not recognized).Valid members are migrated. For eachmember that is not migrated, a text isdisplayed within this step.
Start reading EvDRE options... Options are migrated. For each optionmigrated, a text is displayed within thisstep.
The EvDRE migration for the sheet[SheetName] is done.
Indicate that the migration of the sheethas been performed.
After MigrationBelow you can see a migrated report.
Figure 178: Migrated EvDRE
284 © 2011 SAP AG. All rights reserved. 2011
SAP Class Week of April 16, 2012

BPC430 Lesson: Migrating EvDRE Templates
If you have migrated the active worksheet or workbook (using the Active Worksheetor Active Workbook option) and you are not satisfied with the migration: Closeyour file without saving it. Open it again, make your modifications and launch themigration again.
If you have migrated all the workbooks contained in a specified folder (using thePlanning and Consolidation Server or Local option) and you are not satisfied withthe migration of one or more files: Delete the migrated workbook(s). Make a copyof the original workbook(s). Rename the worbook(s), deleting the prefix #Copy ofOriginal# (to be able to launch a migration again). Make your modifications andlaunch the migration again.
If you are satisfied with the migration, perform the following actions:
• If cells appear in magenta, indicating unrecognized members, be sure that you donot want to use these members anymore. For more information on unrecognizedmembers, see RowKeyRange and ColKeyRange Members and PageKeyRangeMembers
• Once you are sure that you want to validate the migration process, perform arefresh: row and columns containing cells in magenta are deleted.
• If cells appear in yellow, indicating EPM functions, move the EPM functions toother cells in the sheet and do not delete them.
• Always leave a blank row or column between a function and a report.• Also, it is recommended that you move the function above all the reports.• You can then delete all the ranges that are linked to the EvDRE and that are
not used by the EPM add-in. Do not delete the cells containing formulabeginning with =EPMOlapMember( or =EPMOlapMultiMember( or=EPMInsertedMember(.
2011 © 2011 SAP AG. All rights reserved. 285
SAP Class Week of April 16, 2012

Unit 2: The Excel Interface of the EPM add-in BPC430
286 © 2011 SAP AG. All rights reserved. 2011
SAP Class Week of April 16, 2012
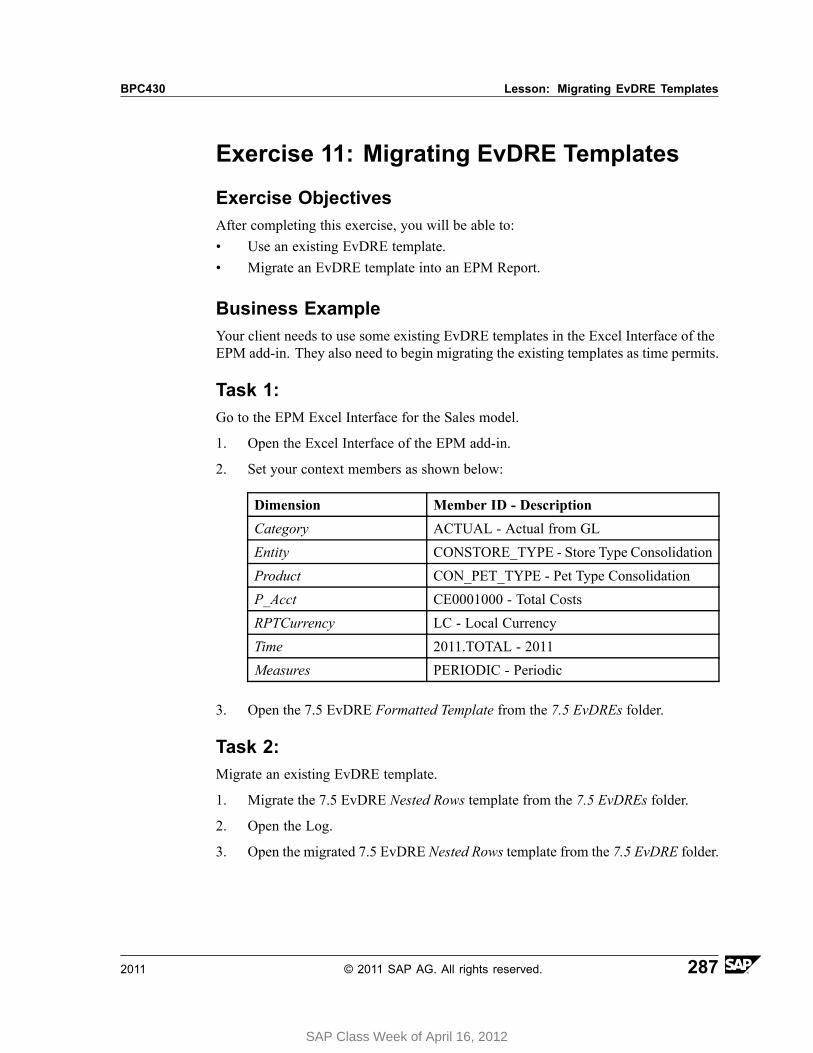
BPC430 Lesson: Migrating EvDRE Templates
Exercise 11: Migrating EvDRE Templates
Exercise ObjectivesAfter completing this exercise, you will be able to:• Use an existing EvDRE template.• Migrate an EvDRE template into an EPM Report.
Business ExampleYour client needs to use some existing EvDRE templates in the Excel Interface of theEPM add-in. They also need to begin migrating the existing templates as time permits.
Task 1:Go to the EPM Excel Interface for the Sales model.
1. Open the Excel Interface of the EPM add-in.
2. Set your context members as shown below:
Dimension Member ID - Description
Category ACTUAL - Actual from GL
Entity CONSTORE_TYPE - Store Type Consolidation
Product CON_PET_TYPE - Pet Type Consolidation
P_Acct CE0001000 - Total Costs
RPTCurrency LC - Local Currency
Time 2011.TOTAL - 2011
Measures PERIODIC - Periodic
3. Open the 7.5 EvDRE Formatted Template from the 7.5 EvDREs folder.
Task 2:Migrate an existing EvDRE template.
1. Migrate the 7.5 EvDRE Nested Rows template from the 7.5 EvDREs folder.
2. Open the Log.
3. Open the migrated 7.5 EvDRE Nested Rows template from the 7.5 EvDRE folder.
2011 © 2011 SAP AG. All rights reserved. 287
SAP Class Week of April 16, 2012
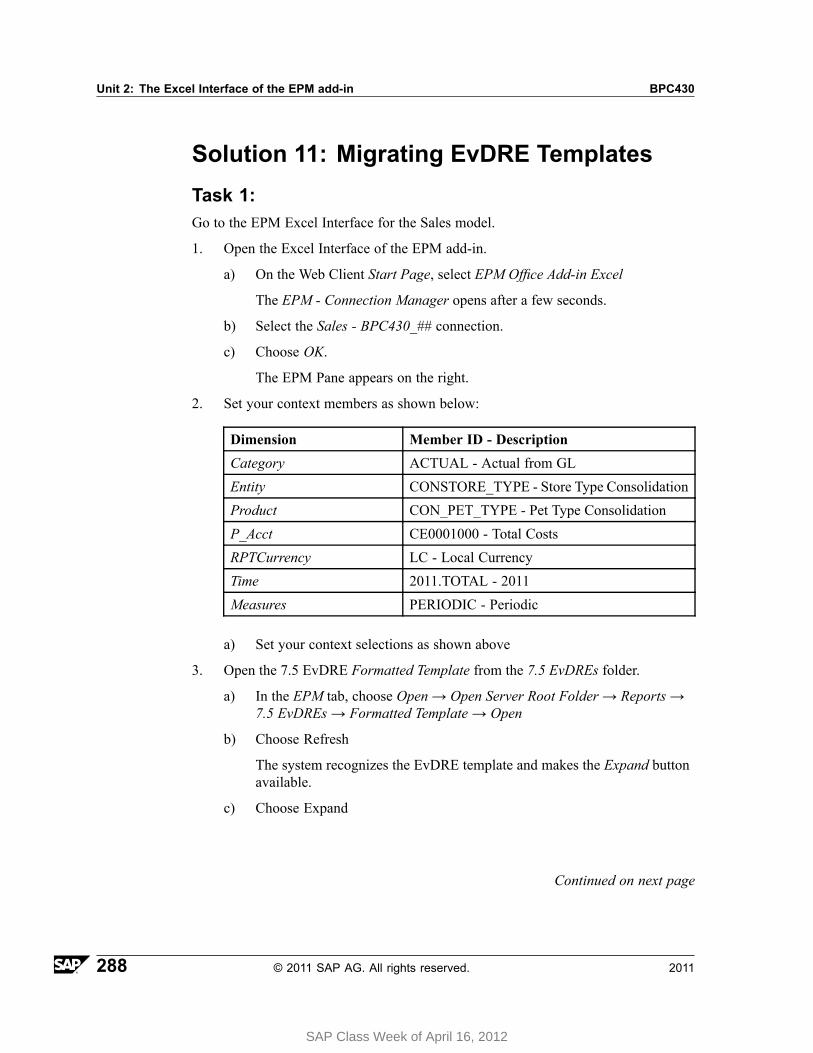
Unit 2: The Excel Interface of the EPM add-in BPC430
Solution 11: Migrating EvDRE TemplatesTask 1:Go to the EPM Excel Interface for the Sales model.
1. Open the Excel Interface of the EPM add-in.
a) On the Web Client Start Page, select EPM Office Add-in Excel
The EPM - Connection Manager opens after a few seconds.
b) Select the Sales - BPC430_## connection.
c) Choose OK.
The EPM Pane appears on the right.
2. Set your context members as shown below:
Dimension Member ID - Description
Category ACTUAL - Actual from GL
Entity CONSTORE_TYPE - Store Type Consolidation
Product CON_PET_TYPE - Pet Type Consolidation
P_Acct CE0001000 - Total Costs
RPTCurrency LC - Local Currency
Time 2011.TOTAL - 2011
Measures PERIODIC - Periodic
a) Set your context selections as shown above
3. Open the 7.5 EvDRE Formatted Template from the 7.5 EvDREs folder.
a) In the EPM tab, choose Open → Open Server Root Folder → Reports →7.5 EvDREs → Formatted Template → Open
b) Choose Refresh
The system recognizes the EvDRE template and makes the Expand buttonavailable.
c) Choose Expand
Continued on next page
288 © 2011 SAP AG. All rights reserved. 2011
SAP Class Week of April 16, 2012
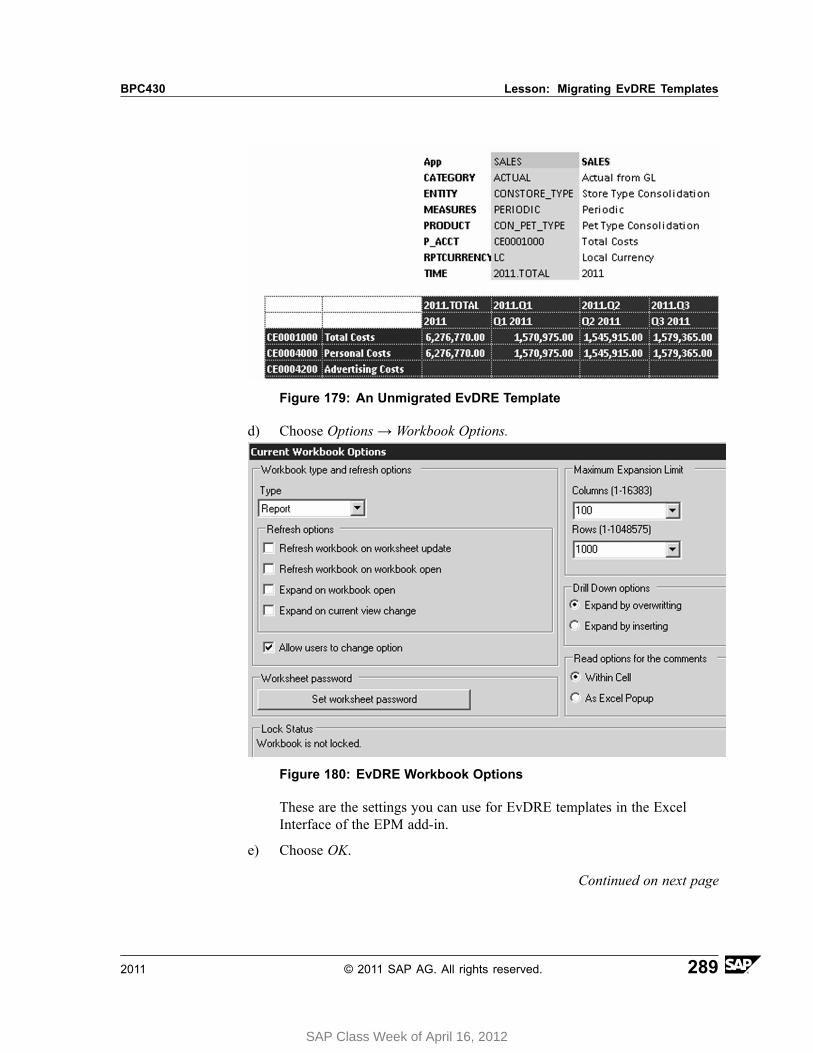
BPC430 Lesson: Migrating EvDRE Templates
Figure 179: An Unmigrated EvDRE Template
d) Choose Options → Workbook Options.
Figure 180: EvDRE Workbook Options
These are the settings you can use for EvDRE templates in the ExcelInterface of the EPM add-in.
e) Choose OK.
Continued on next page
2011 © 2011 SAP AG. All rights reserved. 289
SAP Class Week of April 16, 2012
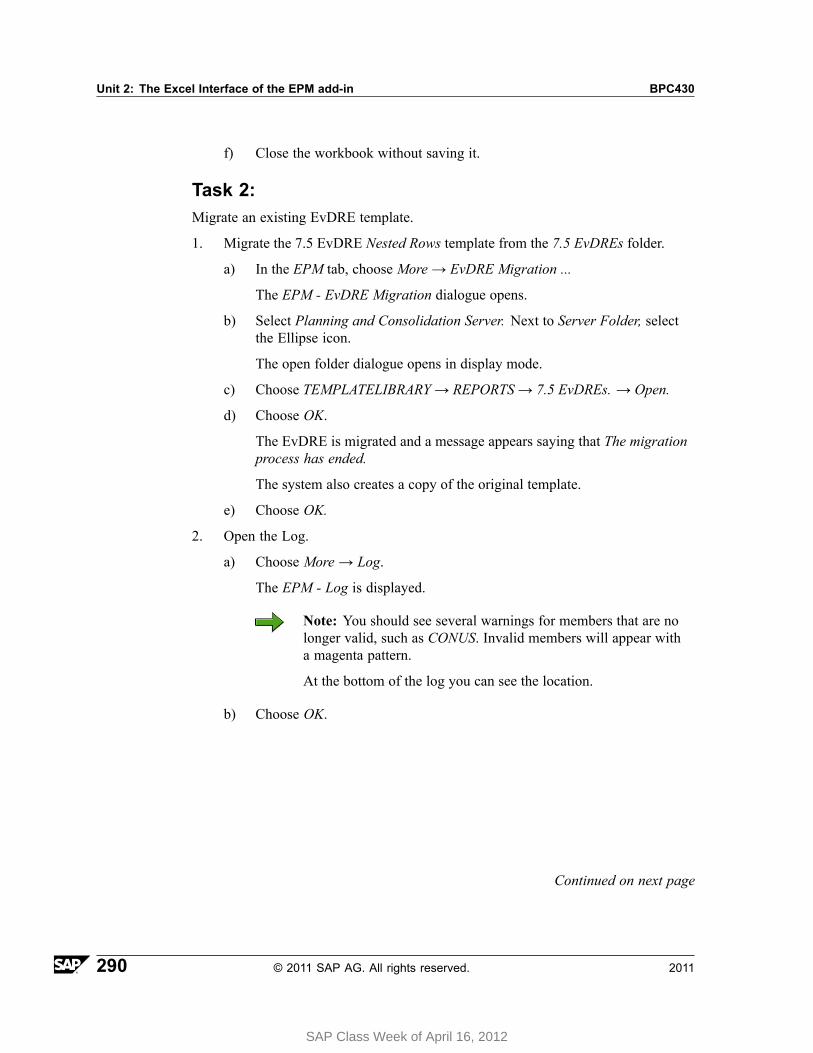
Unit 2: The Excel Interface of the EPM add-in BPC430
f) Close the workbook without saving it.
Task 2:Migrate an existing EvDRE template.
1. Migrate the 7.5 EvDRE Nested Rows template from the 7.5 EvDREs folder.
a) In the EPM tab, choose More → EvDRE Migration ...
The EPM - EvDRE Migration dialogue opens.
b) Select Planning and Consolidation Server. Next to Server Folder, selectthe Ellipse icon.
The open folder dialogue opens in display mode.
c) Choose TEMPLATELIBRARY → REPORTS → 7.5 EvDREs. → Open.
d) Choose OK.
The EvDRE is migrated and a message appears saying that The migrationprocess has ended.
The system also creates a copy of the original template.
e) Choose OK.
2. Open the Log.
a) Choose More → Log.
The EPM - Log is displayed.
Note: You should see several warnings for members that are nolonger valid, such as CONUS. Invalid members will appear witha magenta pattern.
At the bottom of the log you can see the location.
b) Choose OK.
Continued on next page
290 © 2011 SAP AG. All rights reserved. 2011
SAP Class Week of April 16, 2012

BPC430 Lesson: Migrating EvDRE Templates
3. Open the migrated 7.5 EvDRE Nested Rows template from the 7.5 EvDRE folder.
a) In the EPM tab, choose Open → Open Server Root Folder → Reports→ 7.5 EvDREs.
You can see the migrated as well as copies of the original templates.
b) Choose Nested Rows → Open.
Figure 181: A Migrated EvDRE Template
c) Choose Refresh
The system refreshes the new EPM Report and removes the invalidmembers in magenta.
d) Close the template without saving it.
2011 © 2011 SAP AG. All rights reserved. 291
SAP Class Week of April 16, 2012
Unit 2: The Excel Interface of the EPM add-in BPC430
Lesson Summary
You should now be able to:• Migrate EvDRE templates.
292 © 2011 SAP AG. All rights reserved. 2011
SAP Class Week of April 16, 2012


Unit Summary BPC430


SAP Class Week of April 16, 2012

Unit Summary BPC430
295 © 2011 SAP AG. All rights reserved. 2011
SAP Class Week of April 16, 2012

Unit Summary BPC430
296 © 2011 SAP AG. All rights reserved. 2011
SAP Class Week of April 16, 2012
Unit 3Distribution and Collection, Comments,
and Planning Functions
Unit OverviewThis unit covers Distribution and Collection, Comments, and the Planning Tools;Spread, Trend, and Weight.
Unit ObjectivesAfter completing this unit, you will be able to:
• Distribute static reports to file directories• Distribute static reports via e-mail• Collect off line data• Describe the features of comments• Save comments with the EPMSaveComment function• Save comments with the ribbon command• Report on comments• Evaluate the features of spread, trend, and weight to see if they will meet some
of your business requirements.
Unit ContentsLesson: Using the Distribution and Collection Wizard ... . . . . . . . . . . . . . . . . . . . . . .298
Procedure: How to Set Up and Use Distribution and Collection ... . . . . . .301Exercise 12: Use the Distribution and Collection Wizard ... . . . . . . . . . . . . . . 311
Lesson: Using the Comment Feature ... . . . . . . . . . . . . . . . . . . . . . . . . . . . . . . . . . . . . . . . .330Procedure: How to Look Up Comment Data for TroubleshootingPurposes... . . . . . . . . . . . . . . . . . . . . . . . . . . . . . . . . . . . . . . . . . . . . . . . . . . . . . . . . . . . . . . . . . . . . . .341Exercise 13: Configuring Comments .. . . . . . . . . . . . . . . . . . . . . . . . . . . . . . . . . . . . . . .343
Lesson: Using the Spread, Trend, and Weight Manual Planning Functions 359Exercise 14: Spread, Trend, And Weight .. . . . . . . . . . . . . . . . . . . . . . . . . . . . . . . . . .361
2011 © 2011 SAP AG. All rights reserved. 297
SAP Class Week of April 16, 2012

Unit 3: Distribution and Collection, Comments, and Planning Functions BPC430
Lesson: Using the Distribution and Collection Wizard
Lesson OverviewIn this lesson, you will use the distribution and collection wizard to distributetemplates and also to collect planning data.
Lesson ObjectivesAfter completing this lesson, you will be able to:
• Distribute static reports to file directories• Distribute static reports via e-mail• Collect off line data
Business ExampleYour management team wants to have their cash flow and profit and loss statementse-mailed to them every night. Also, you have a large of number of planners workingoffline and you need to use the collection wizard to store their data in the model.
OverviewYou can make static workbooks (containing reports or input forms) available to a setof users.
The workbooks can be stored on a share file, for example, or they can be sent bye-mail to the recipients you have specified in the template.
• Excel templates can be distributed to Microsoft Office Outlook e-mail addresses• Excel templates can be distributed to network folders• You can also collect data from offline templates send it to the database
Below, you can see the Distribution options in the EPM Ribbon.
298 © 2011 SAP AG. All rights reserved. 2011
SAP Class Week of April 16, 2012
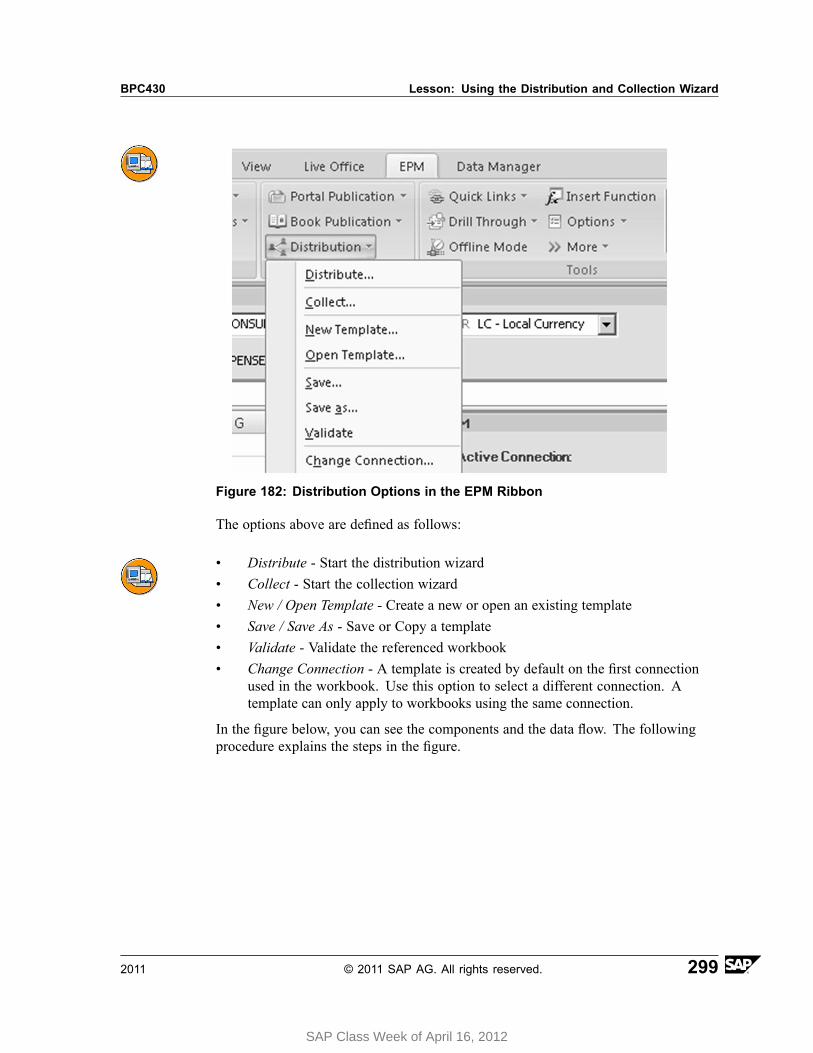
BPC430 Lesson: Using the Distribution and Collection Wizard
Figure 182: Distribution Options in the EPM Ribbon
The options above are defined as follows:
• Distribute - Start the distribution wizard• Collect - Start the collection wizard• New / Open Template - Create a new or open an existing template• Save / Save As - Save or Copy a template• Validate - Validate the referenced workbook• Change Connection - A template is created by default on the first connection
used in the workbook. Use this option to select a different connection. Atemplate can only apply to workbooks using the same connection.
In the figure below, you can see the components and the data flow. The followingprocedure explains the steps in the figure.
2011 © 2011 SAP AG. All rights reserved. 299
SAP Class Week of April 16, 2012
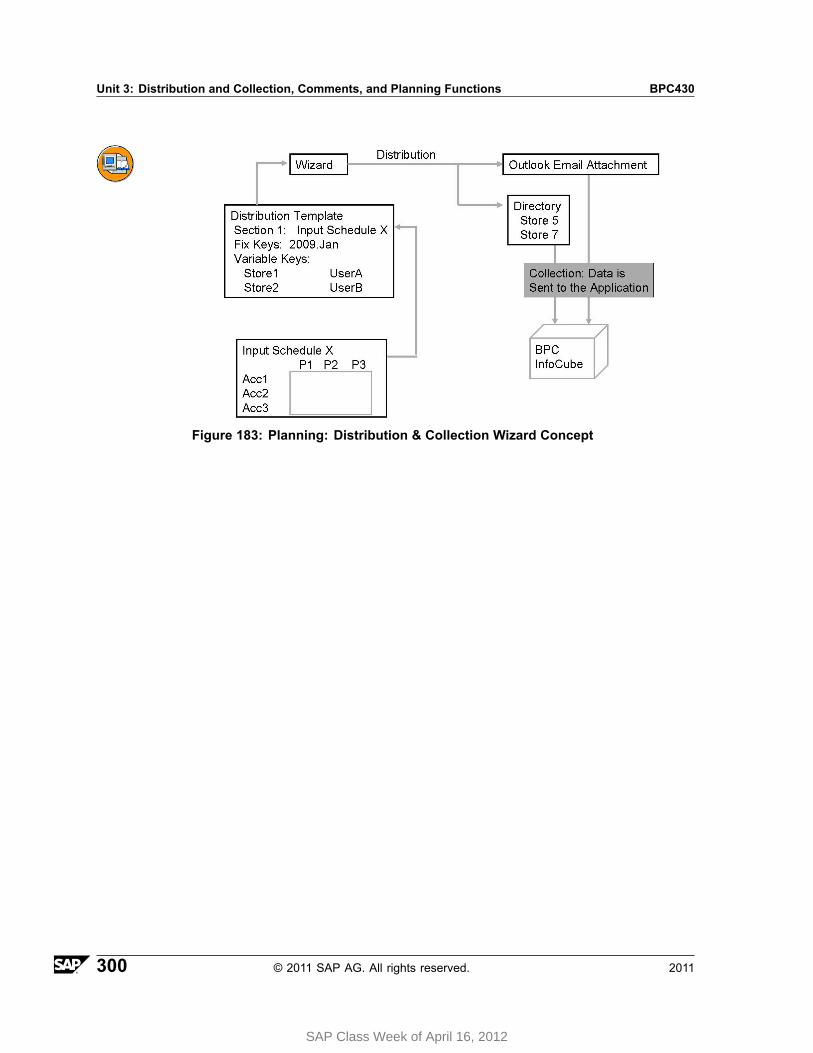
Unit 3: Distribution and Collection, Comments, and Planning Functions BPC430
Figure 183: Planning: Distribution & Collection Wizard Concept
300 © 2011 SAP AG. All rights reserved. 2011
SAP Class Week of April 16, 2012
BPC430 Lesson: Using the Distribution and Collection Wizard
How to Set Up and Use Distribution and Collection
1. Create a template to use as the Input Schedule.
2. Save it to the PDBOOKS folder for example.
Caution: Close the workbook.
3. Create a new distribution template.
• Enter the naming and select the workbook.
– Enter a Template Name– Enter a Section Name– Select the Workbook– Enter a Workbook Description
• Dimension Member Selection
– Select the fixed dimensions– Select the variable dimensions
• Variable Members
– Select the variable dimension members– Enter a user name for each variable dimension member
• Save the template
Caution: Close the template
4. Run the distribution wizard
• Choose Distribution → Distribute Now.• Select Switch to offline mode and save to folder
Note: The workbooks are automatically switched to offline,meaning that the users will be able to work with a workbook in adisconnected state without using the EPM add-in.
• Select the folder location• Select the Template and Section• View the log
The template has been distributed to an intranet folder or share drive.
Continued on next page
2011 © 2011 SAP AG. All rights reserved. 301
SAP Class Week of April 16, 2012
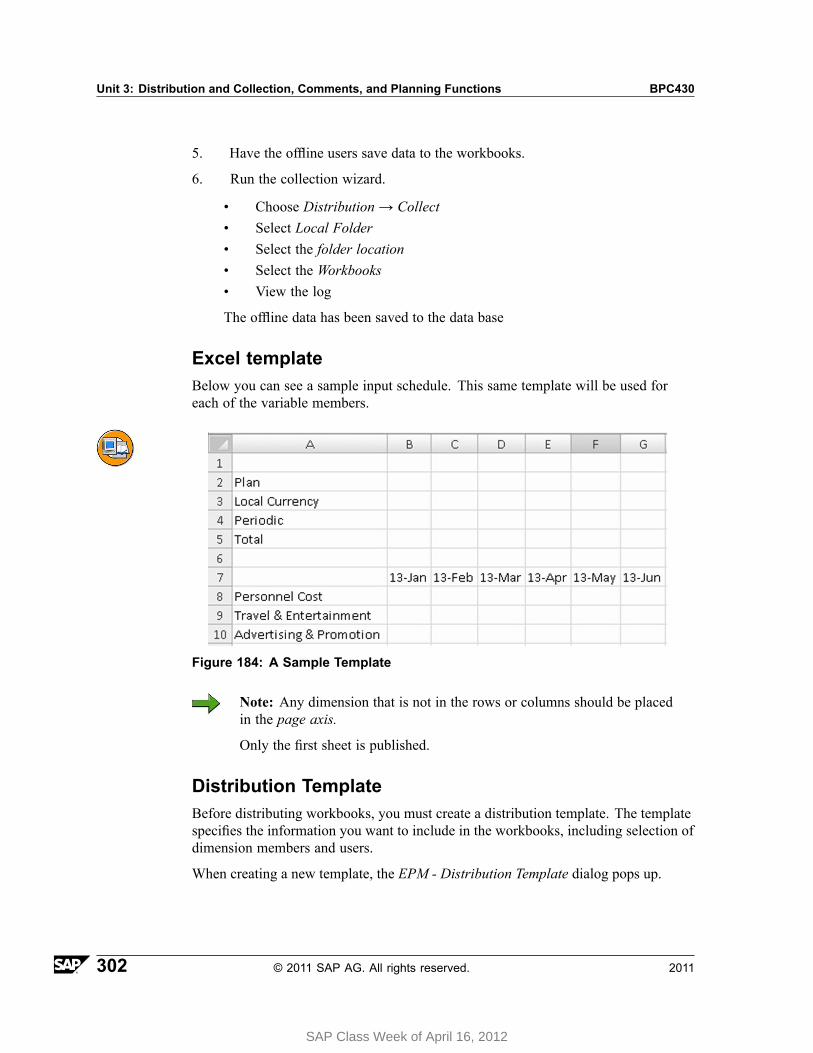
Unit 3: Distribution and Collection, Comments, and Planning Functions BPC430
5. Have the offline users save data to the workbooks.
6. Run the collection wizard.
• Choose Distribution → Collect• Select Local Folder• Select the folder location• Select the Workbooks• View the log
The offline data has been saved to the data base
Excel templateBelow you can see a sample input schedule. This same template will be used foreach of the variable members.
Figure 184: A Sample Template
Note: Any dimension that is not in the rows or columns should be placedin the page axis.
Only the first sheet is published.
Distribution TemplateBefore distributing workbooks, you must create a distribution template. The templatespecifies the information you want to include in the workbooks, including selection ofdimension members and users.
When creating a new template, the EPM - Distribution Template dialog pops up.
302 © 2011 SAP AG. All rights reserved. 2011
SAP Class Week of April 16, 2012
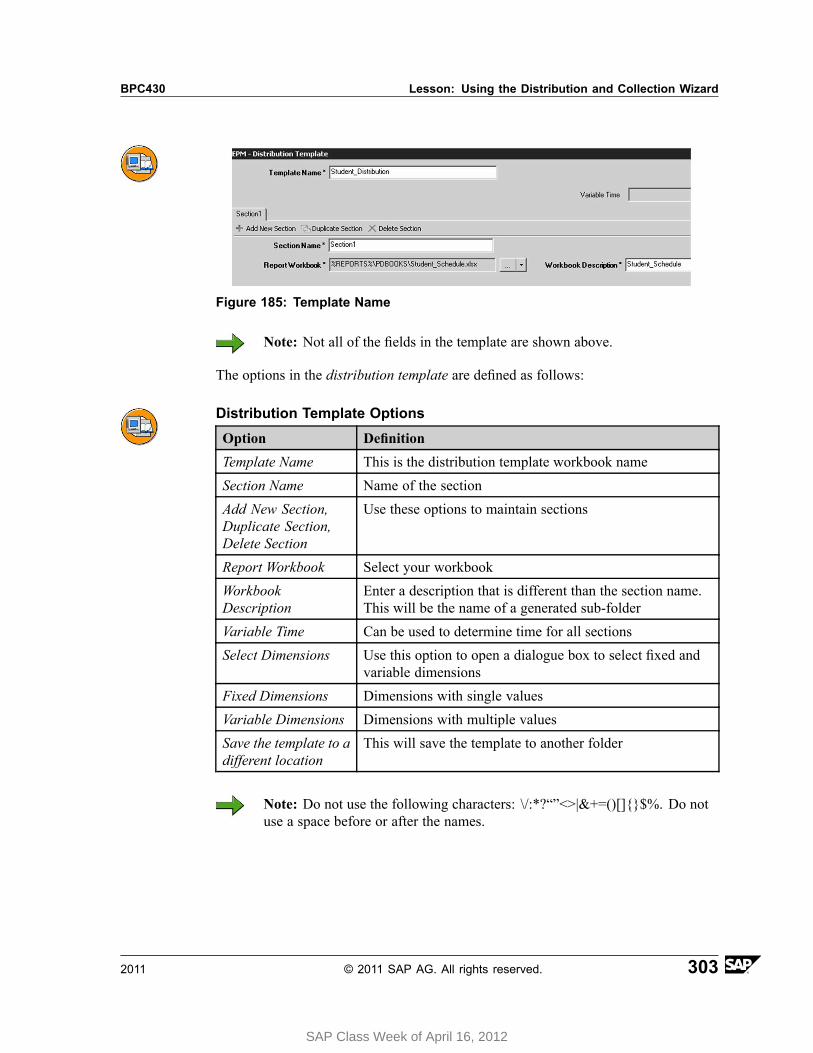
BPC430 Lesson: Using the Distribution and Collection Wizard
Figure 185: Template Name
Note: Not all of the fields in the template are shown above.
The options in the distribution template are defined as follows:
Distribution Template Options
Option Definition
Template Name This is the distribution template workbook name
Section Name Name of the section
Add New Section,Duplicate Section,Delete Section
Use these options to maintain sections
Report Workbook Select your workbook
WorkbookDescription
Enter a description that is different than the section name.This will be the name of a generated sub-folder
Variable Time Can be used to determine time for all sections
Select Dimensions Use this option to open a dialogue box to select fixed andvariable dimensions
Fixed Dimensions Dimensions with single values
Variable Dimensions Dimensions with multiple values
Save the template to adifferent location
This will save the template to another folder
Note: Do not use the following characters: \/:*?“”<>|&+=()[]{}$%. Do notuse a space before or after the names.
2011 © 2011 SAP AG. All rights reserved. 303
SAP Class Week of April 16, 2012
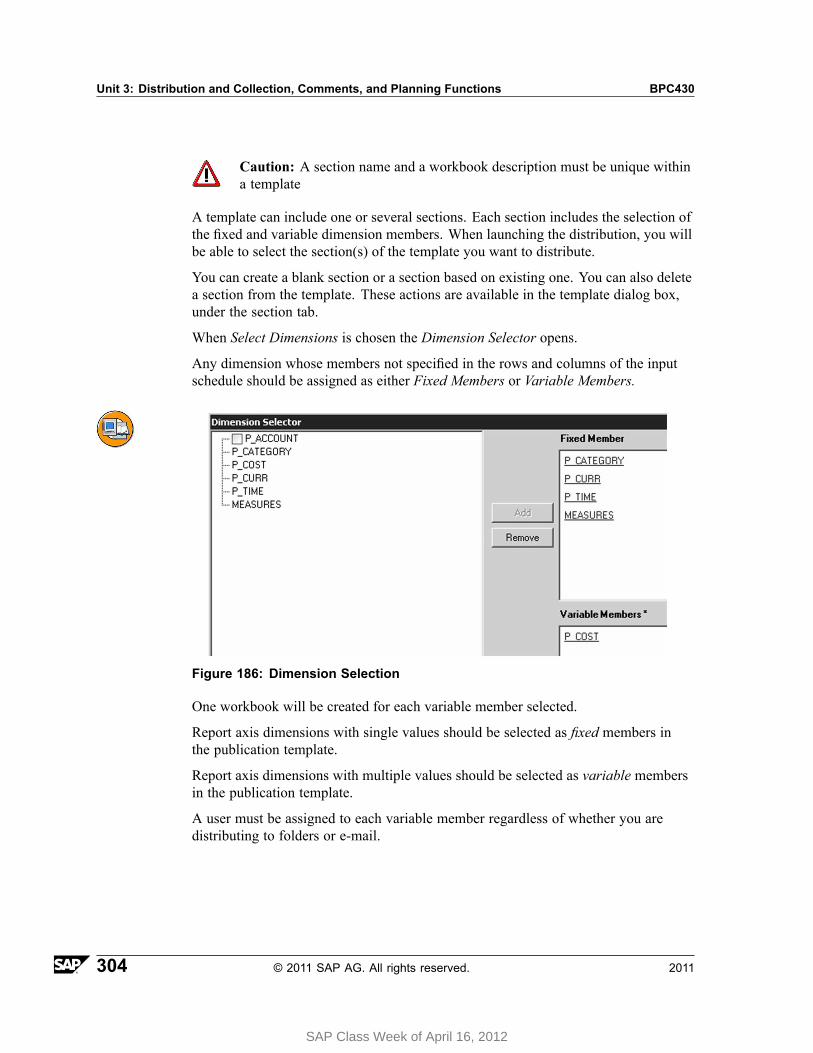
Unit 3: Distribution and Collection, Comments, and Planning Functions BPC430
Caution: A section name and a workbook description must be unique withina template
A template can include one or several sections. Each section includes the selection ofthe fixed and variable dimension members. When launching the distribution, you willbe able to select the section(s) of the template you want to distribute.
You can create a blank section or a section based on existing one. You can also deletea section from the template. These actions are available in the template dialog box,under the section tab.
When Select Dimensions is chosen the Dimension Selector opens.
Any dimension whose members not specified in the rows and columns of the inputschedule should be assigned as either Fixed Members or Variable Members.
Figure 186: Dimension Selection
One workbook will be created for each variable member selected.
Report axis dimensions with single values should be selected as fixed members inthe publication template.
Report axis dimensions with multiple values should be selected as variable membersin the publication template.
A user must be assigned to each variable member regardless of whether you aredistributing to folders or e-mail.
304 © 2011 SAP AG. All rights reserved. 2011
SAP Class Week of April 16, 2012
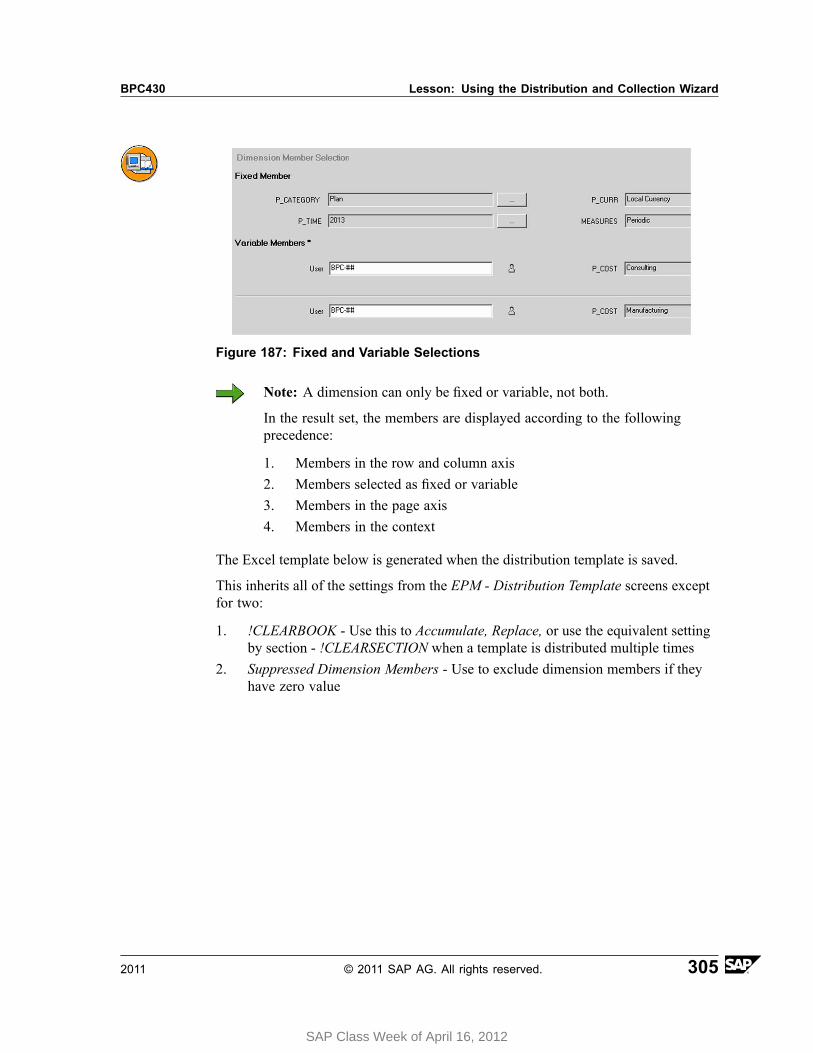
BPC430 Lesson: Using the Distribution and Collection Wizard
Figure 187: Fixed and Variable Selections
Note: A dimension can only be fixed or variable, not both.
In the result set, the members are displayed according to the followingprecedence:
1. Members in the row and column axis2. Members selected as fixed or variable3. Members in the page axis4. Members in the context
The Excel template below is generated when the distribution template is saved.
This inherits all of the settings from the EPM - Distribution Template screens exceptfor two:
1. !CLEARBOOK - Use this to Accumulate, Replace, or use the equivalent settingby section - !CLEARSECTION when a template is distributed multiple times
2. Suppressed Dimension Members - Use to exclude dimension members if theyhave zero value
2011 © 2011 SAP AG. All rights reserved. 305
SAP Class Week of April 16, 2012
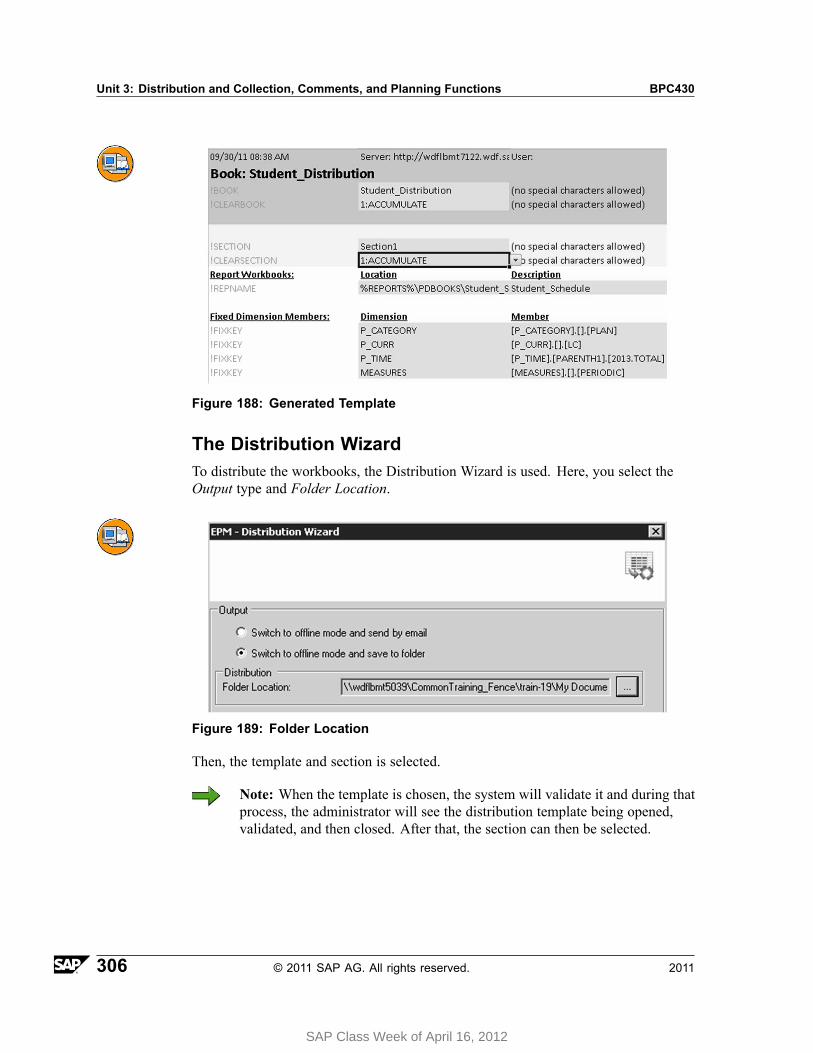
Unit 3: Distribution and Collection, Comments, and Planning Functions BPC430
Figure 188: Generated Template
The Distribution WizardTo distribute the workbooks, the Distribution Wizard is used. Here, you select theOutput type and Folder Location.
Figure 189: Folder Location
Then, the template and section is selected.
Note: When the template is chosen, the system will validate it and during thatprocess, the administrator will see the distribution template being opened,validated, and then closed. After that, the section can then be selected.
306 © 2011 SAP AG. All rights reserved. 2011
SAP Class Week of April 16, 2012
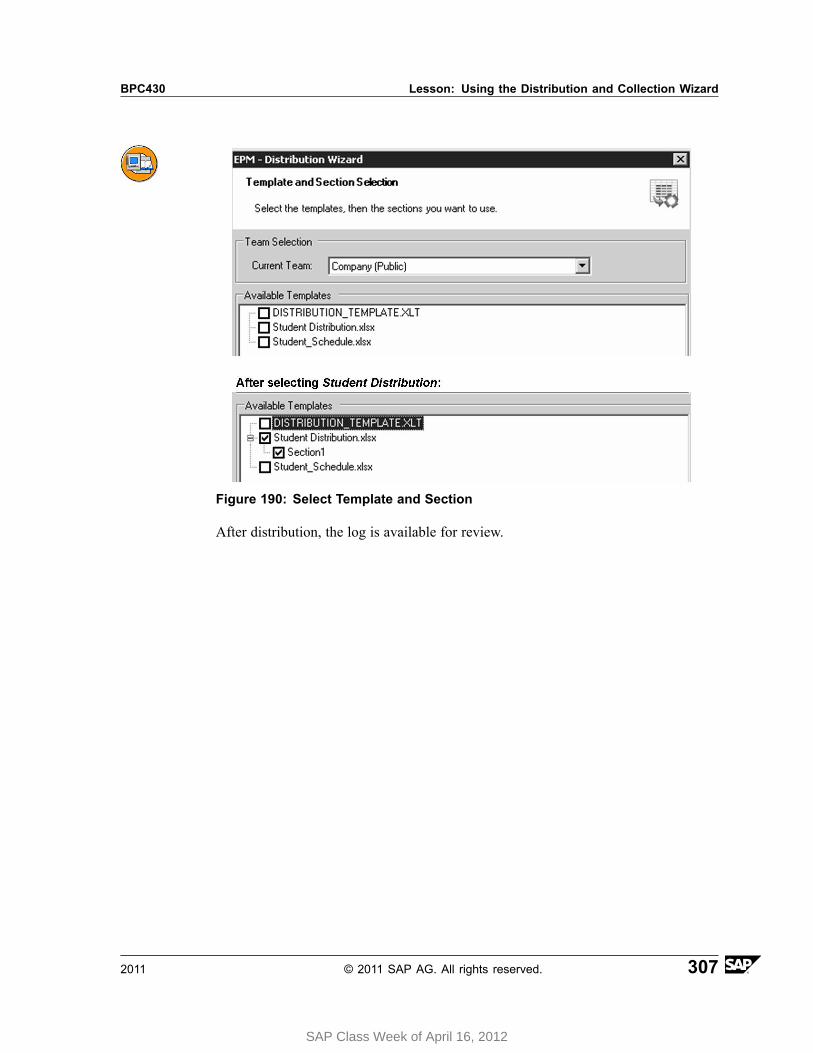
BPC430 Lesson: Using the Distribution and Collection Wizard
Figure 190: Select Template and Section
After distribution, the log is available for review.
2011 © 2011 SAP AG. All rights reserved. 307
SAP Class Week of April 16, 2012
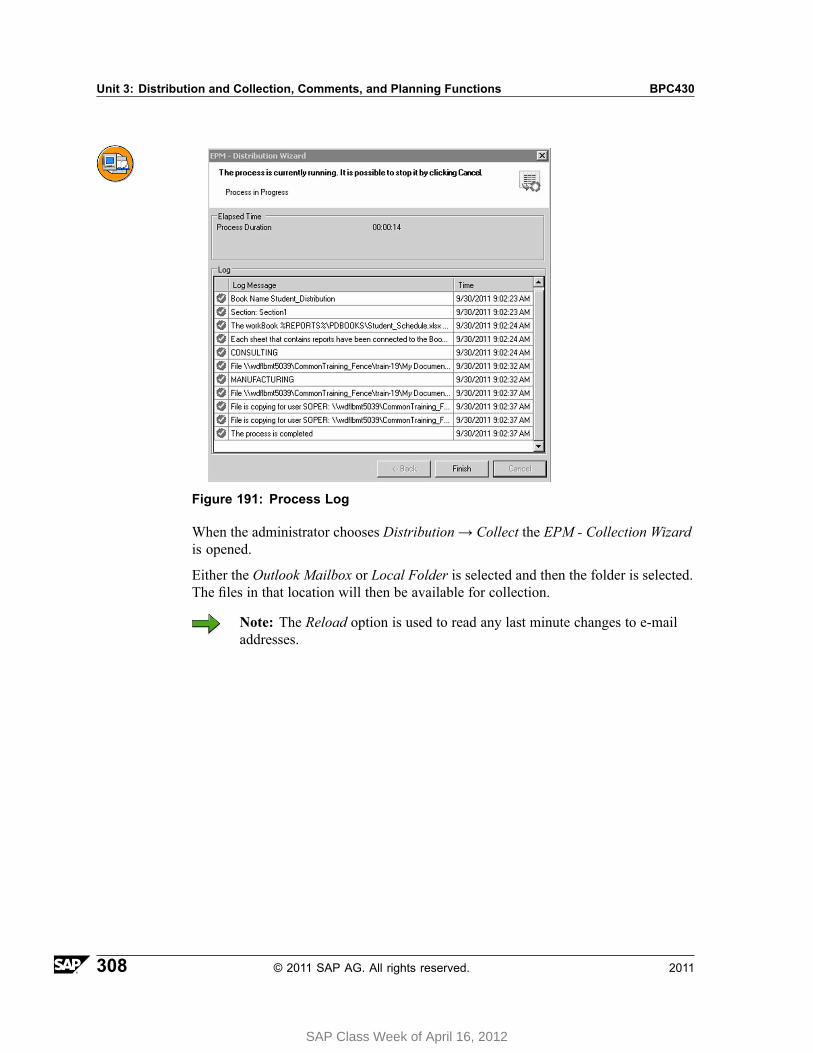
Unit 3: Distribution and Collection, Comments, and Planning Functions BPC430
Figure 191: Process Log
When the administrator chooses Distribution → Collect the EPM - Collection Wizardis opened.
Either the Outlook Mailbox or Local Folder is selected and then the folder is selected.The files in that location will then be available for collection.
Note: The Reload option is used to read any last minute changes to e-mailaddresses.
308 © 2011 SAP AG. All rights reserved. 2011
SAP Class Week of April 16, 2012
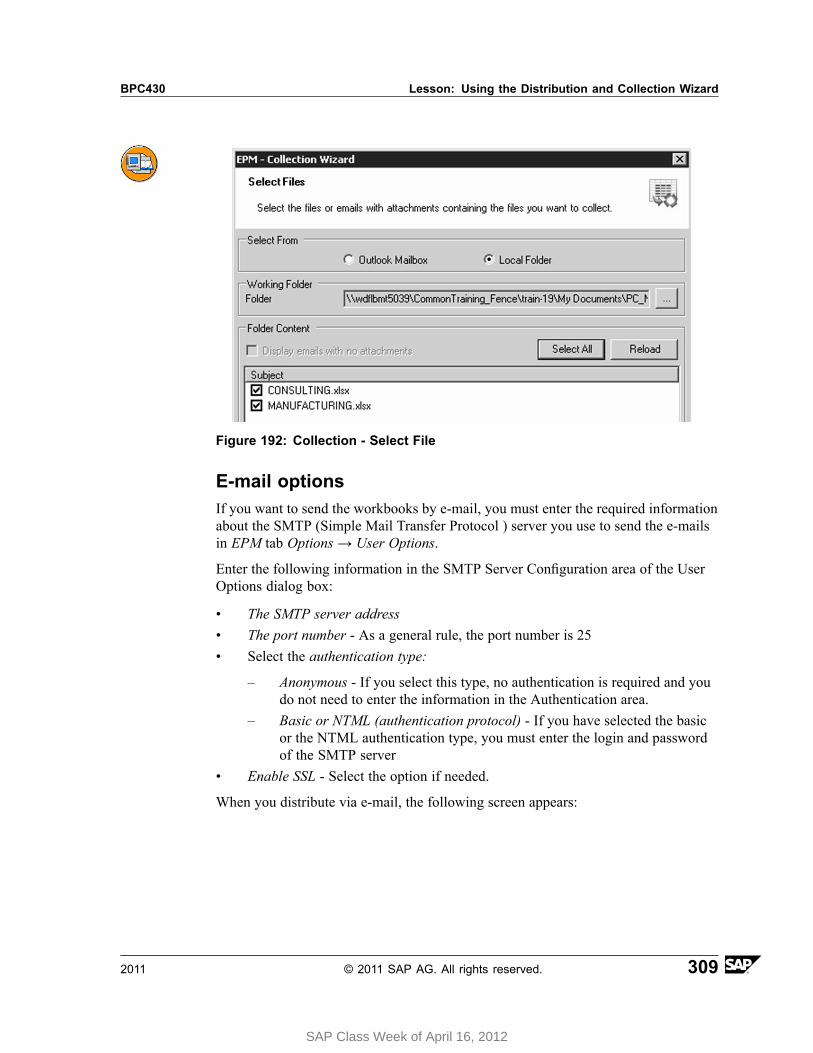
BPC430 Lesson: Using the Distribution and Collection Wizard
Figure 192: Collection - Select File
E-mail optionsIf you want to send the workbooks by e-mail, you must enter the required informationabout the SMTP (Simple Mail Transfer Protocol ) server you use to send the e-mailsin EPM tab Options → User Options.
Enter the following information in the SMTP Server Configuration area of the UserOptions dialog box:
• The SMTP server address• The port number - As a general rule, the port number is 25• Select the authentication type:
– Anonymous - If you select this type, no authentication is required and youdo not need to enter the information in the Authentication area.
– Basic or NTML (authentication protocol) - If you have selected the basicor the NTML authentication type, you must enter the login and passwordof the SMTP server
• Enable SSL - Select the option if needed.
When you distribute via e-mail, the following screen appears:
2011 © 2011 SAP AG. All rights reserved. 309
SAP Class Week of April 16, 2012
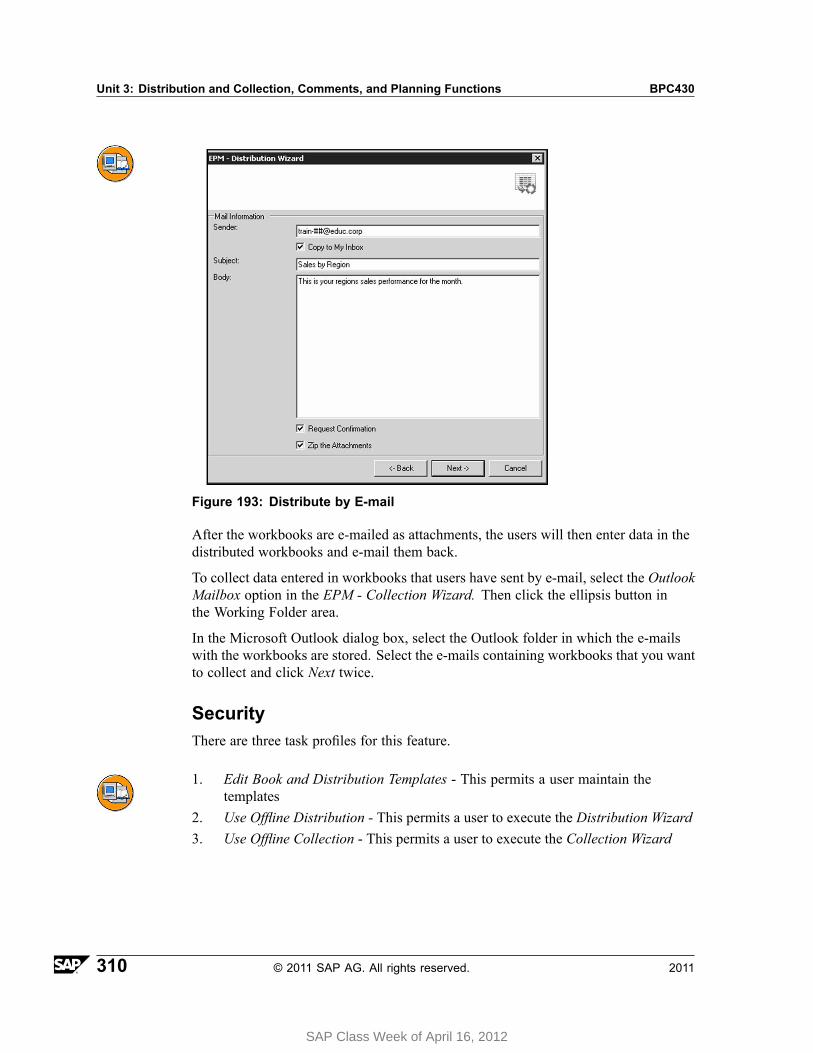
Unit 3: Distribution and Collection, Comments, and Planning Functions BPC430
Figure 193: Distribute by E-mail
After the workbooks are e-mailed as attachments, the users will then enter data in thedistributed workbooks and e-mail them back.
To collect data entered in workbooks that users have sent by e-mail, select the OutlookMailbox option in the EPM - Collection Wizard. Then click the ellipsis button inthe Working Folder area.
In the Microsoft Outlook dialog box, select the Outlook folder in which the e-mailswith the workbooks are stored. Select the e-mails containing workbooks that you wantto collect and click Next twice.
SecurityThere are three task profiles for this feature.
1. Edit Book and Distribution Templates - This permits a user maintain thetemplates
2. Use Offline Distribution - This permits a user to execute the Distribution Wizard3. Use Offline Collection - This permits a user to execute the Collection Wizard
310 © 2011 SAP AG. All rights reserved. 2011
SAP Class Week of April 16, 2012
BPC430 Lesson: Using the Distribution and Collection Wizard
Exercise 12: Use the Distribution andCollection Wizard
Exercise ObjectivesAfter completing this exercise, you will be able to:• Create and save an input schedule to be distributed.• Create a new distribution list.• Distribute and then collect the data using the wizard.
Business ExampleYou have some users who have not been trained to use Planning and Consolidation,and they will therefore work offline. After they have updated their excel templates andsaved them to an offline directory, use the wizard to collect the data.
Task 1:Prepare an input schedule to use as the form to be distributed for Consulting andManufacturing. Use the BPC430_## Environment and the Expense Model.
1. Open the Excel Interface of the EPM add-in.
2. Set your context members as shown below:
Dimension Member ID - Description
P_Account PL400 -Indirect Expenses
P_Category Plan - Plan
P_Cost TOTAL - Total
P_Curr LC - Local Currency
P_Time 2013.TOTAL - 2013 Total
Measures PERIODIC - Periodic
3. In the Expense Model, use drag and drop to build a report with P_Account in therows and P_Time in the columns to create the input form.
4. Display the P_Account base members for Indirect Expenses in the rows.
5. Display the months for 2013 in the columns
Continued on next page
2011 © 2011 SAP AG. All rights reserved. 311
SAP Class Week of April 16, 2012
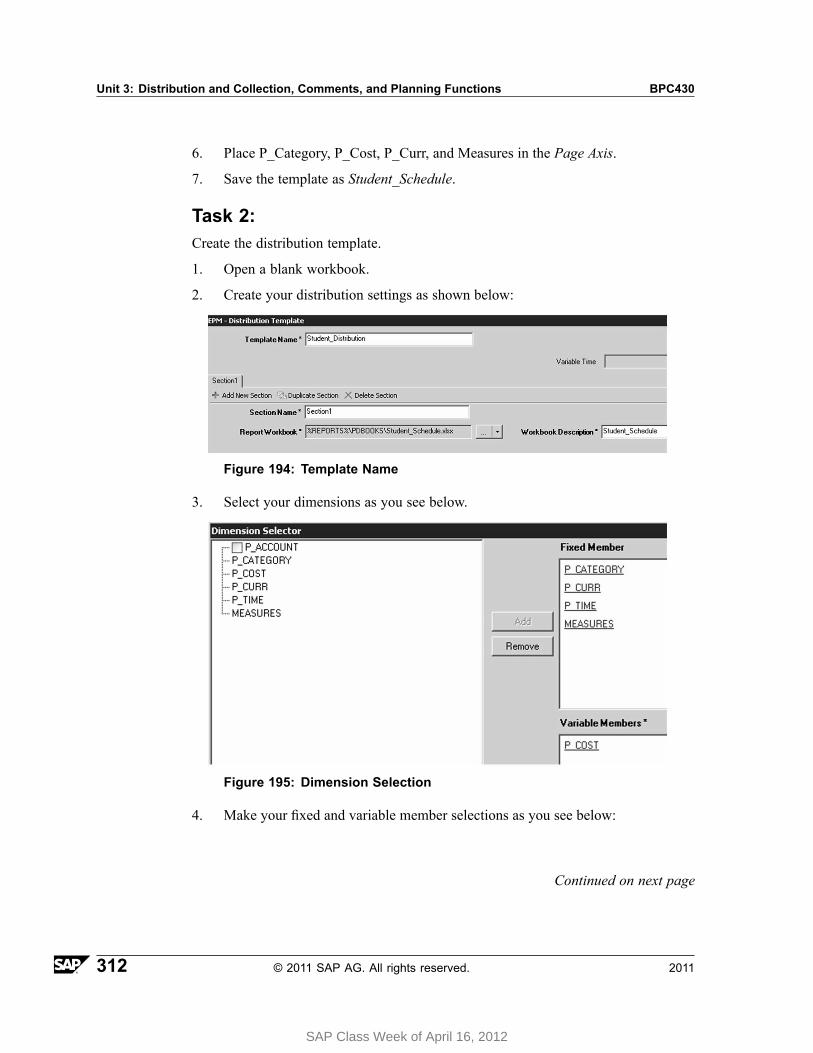
Unit 3: Distribution and Collection, Comments, and Planning Functions BPC430
6. Place P_Category, P_Cost, P_Curr, and Measures in the Page Axis.
7. Save the template as Student_Schedule.
Task 2:Create the distribution template.
1. Open a blank workbook.
2. Create your distribution settings as shown below:
Figure 194: Template Name
3. Select your dimensions as you see below.
Figure 195: Dimension Selection
4. Make your fixed and variable member selections as you see below:
Continued on next page
312 © 2011 SAP AG. All rights reserved. 2011
SAP Class Week of April 16, 2012
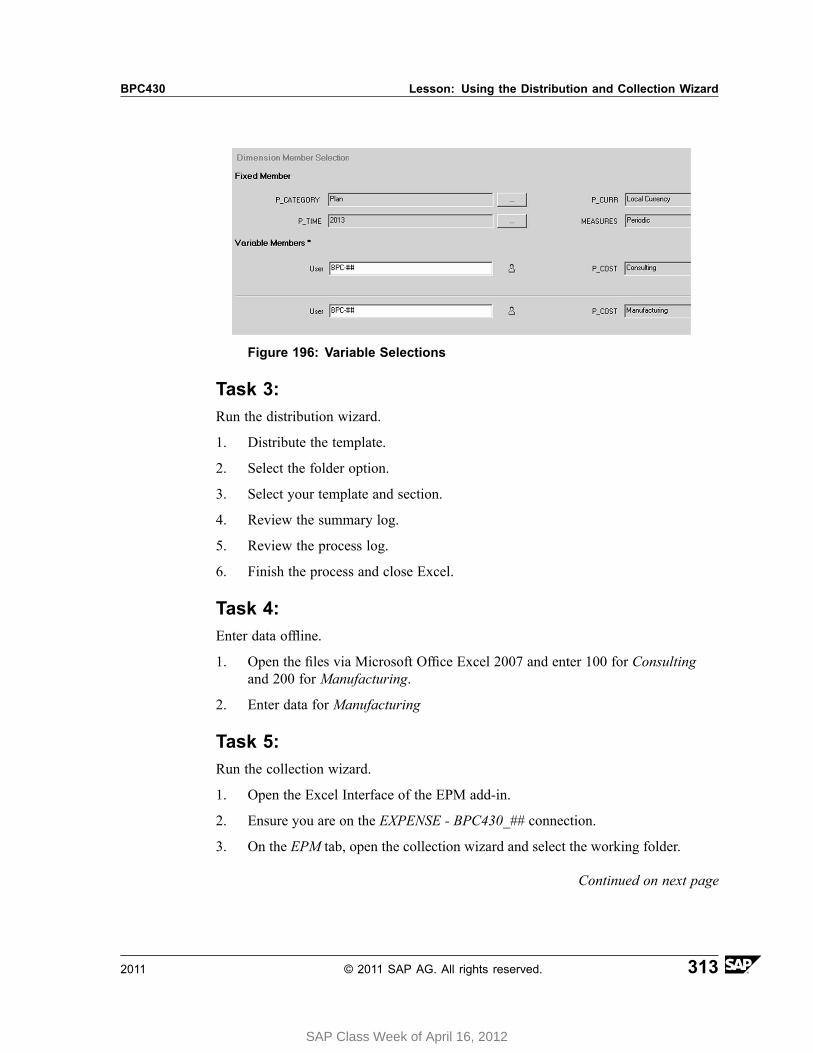
BPC430 Lesson: Using the Distribution and Collection Wizard
Figure 196: Variable Selections
Task 3:Run the distribution wizard.
1. Distribute the template.
2. Select the folder option.
3. Select your template and section.
4. Review the summary log.
5. Review the process log.
6. Finish the process and close Excel.
Task 4:Enter data offline.
1. Open the files via Microsoft Office Excel 2007 and enter 100 for Consultingand 200 for Manufacturing.
2. Enter data for Manufacturing
Task 5:Run the collection wizard.
1. Open the Excel Interface of the EPM add-in.
2. Ensure you are on the EXPENSE - BPC430_## connection.
3. On the EPM tab, open the collection wizard and select the working folder.
Continued on next page
2011 © 2011 SAP AG. All rights reserved. 313
SAP Class Week of April 16, 2012
Unit 3: Distribution and Collection, Comments, and Planning Functions BPC430
4. Select the file location.
5. Select both files.
6. Review the process log.
7. Complete the process.
Task 6:Confirm that the data is in the data base.
1. Use the Student_Schedule to verify that your data was saved to the data base.
2. View the Manufacturing data.
314 © 2011 SAP AG. All rights reserved. 2011
SAP Class Week of April 16, 2012
BPC430 Lesson: Using the Distribution and Collection Wizard
Solution 12: Use the Distribution andCollection WizardTask 1:Prepare an input schedule to use as the form to be distributed for Consulting andManufacturing. Use the BPC430_## Environment and the Expense Model.
1. Open the Excel Interface of the EPM add-in.
a) In the Web Client Start Page select EPM Office Add-in Excel.
The EPM - Connection Manager opens after a few seconds.
b) Select the Expense - BPC430_## connection.
c) Choose OK
The EPM Pane appears on the right.
d) Choose the EPM tab.
2. Set your context members as shown below:
Dimension Member ID - Description
P_Account PL400 -Indirect Expenses
P_Category Plan - Plan
P_Cost TOTAL - Total
P_Curr LC - Local Currency
P_Time 2013.TOTAL - 2013 Total
Measures PERIODIC - Periodic
a) Set your context selections as shown in the table.
Continued on next page
2011 © 2011 SAP AG. All rights reserved. 315
SAP Class Week of April 16, 2012
Unit 3: Distribution and Collection, Comments, and Planning Functions BPC430
3. In the Expense Model, use drag and drop to build a report with P_Account in therows and P_Time in the columns to create the input form.
a) On the EPM tab, choose Options → Sheet Options.
b) Select Use as Input Form.
c) Choose OK.
d) From the EPM Pane, drag the dimensions to the cells specified below.
Dimension Cell
P_Account A5
P_Time B4
The Report is executed.
4. Display the P_Account base members for Indirect Expenses in the rows.
a) On the lower right in the Row Axis, click on P_Account (in blue hypertext).
The EPM-Member Selector opens.
b) Select Indirect Expenses (Under Net Income → Operating Income) byplacing a checkbox to the left of the member.
c) Under Selection Relationship choose Base Level.
d) Click the right arrow button to move the selection to Selected Members.
e) Similarly, click the left arrow button to remove the prior selection which isalready highlighted.
f) Choose OK.
Continued on next page
316 © 2011 SAP AG. All rights reserved. 2011
SAP Class Week of April 16, 2012

BPC430 Lesson: Using the Distribution and Collection Wizard
5. Display the months for 2013 in the columns
a) On the lower right in the Column Axis, click on P_Time (in blue hypertext).
The EPM-Member Selector opens.
b) Select 2013.TOTAL (It may say 2013) by placing a checkbox to the leftof the member.
c) Under Selection Relationship choose Base Level.
d) Click the right arrow button to move the selection to Selected Members.
e) Similarly, click the left arrow button to remove the prior selection which isalready highlighted.
f) Choose OK.
6. Place P_Category, P_Cost, P_Curr, and Measures in the Page Axis.
a) Choose Edit Report.
b) Drag P_Category, P_Cost, P_Curr, and Measures to the Page Axis.
c) Select OK.
Your worksheet should appear as follows:
Figure 197: Input Sheet
Continued on next page
2011 © 2011 SAP AG. All rights reserved. 317
SAP Class Week of April 16, 2012

Unit 3: Distribution and Collection, Comments, and Planning Functions BPC430
7. Save the template as Student_Schedule.
a) Choose Save → Save to Server Root Folder.
b) Choose Company(Public) → PDBOOKS.
c) In the File Name field, enter: Student_Schedule.
d) Choose Save.
e) Choose the Office Button and Select Close .
Task 2:Create the distribution template.
1. Open a blank workbook.
a) Choose the Office Button.
b) Choose New → Create.
2. Create your distribution settings as shown below:
Figure 198: Template Name
a) Choose Distribution → New Template
b) Next to Template Name*, enter Student_Distribution
c) Next to Section Name*, enter Section1
d) Next to Report Workbook*, select Student_Schedule by choosing theEllipsis button.
The Open window appears. Choose Company(Public) → PDBooks →Sutdent_Schedule then choose Open
e) Next to Workbook Description*, enter Student_Schedule.
3. Select your dimensions as you see below.
Continued on next page
318 © 2011 SAP AG. All rights reserved. 2011
SAP Class Week of April 16, 2012
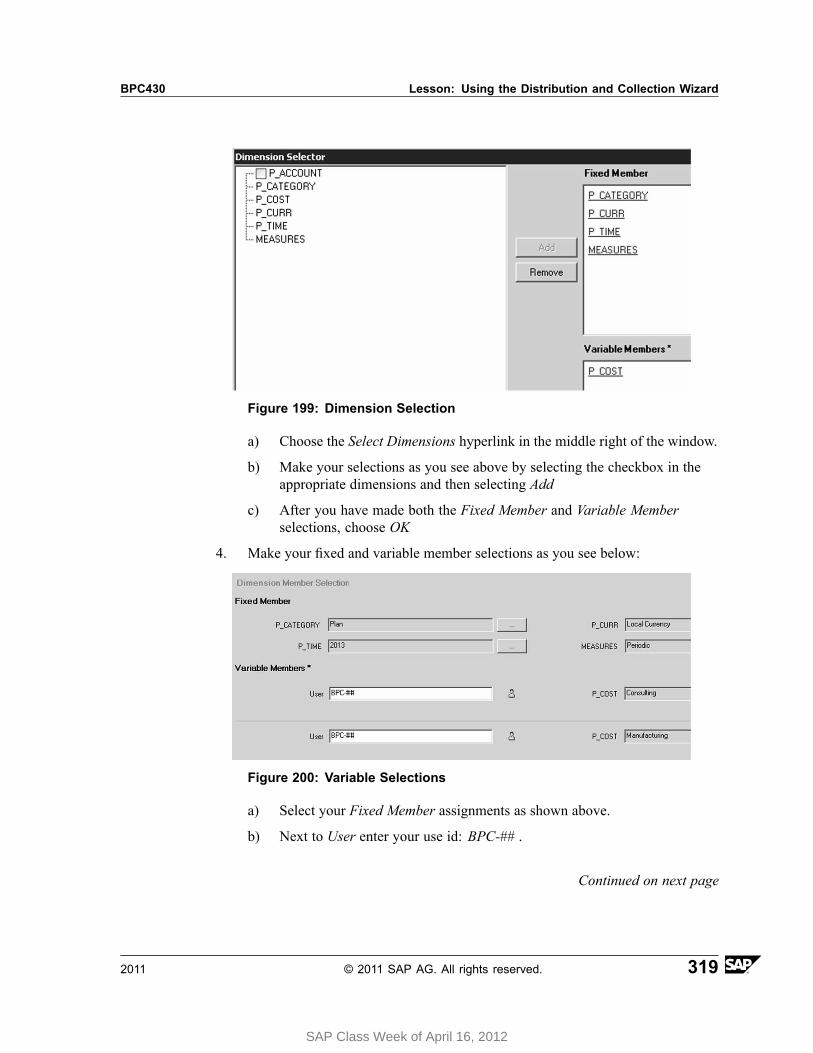
BPC430 Lesson: Using the Distribution and Collection Wizard
Figure 199: Dimension Selection
a) Choose the Select Dimensions hyperlink in the middle right of the window.
b) Make your selections as you see above by selecting the checkbox in theappropriate dimensions and then selecting Add
c) After you have made both the Fixed Member and Variable Memberselections, choose OK
4. Make your fixed and variable member selections as you see below:
Figure 200: Variable Selections
a) Select your Fixed Member assignments as shown above.
b) Next to User enter your use id: BPC-## .
Continued on next page
2011 © 2011 SAP AG. All rights reserved. 319
SAP Class Week of April 16, 2012
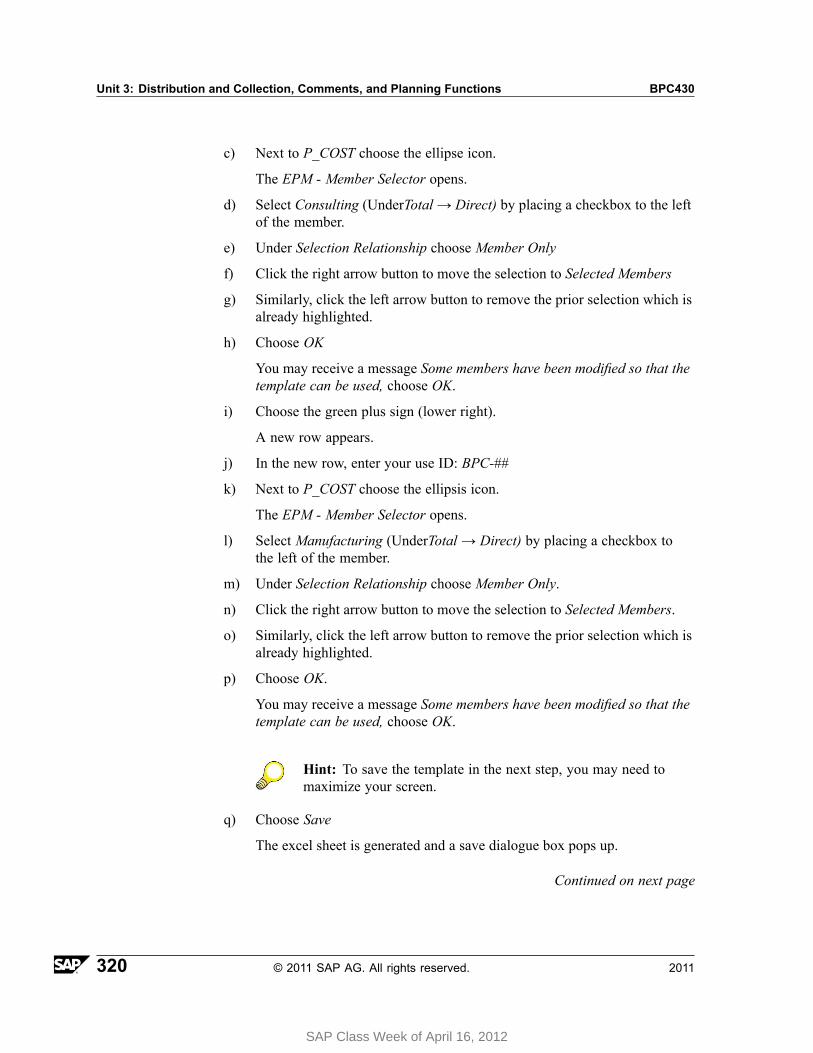
Unit 3: Distribution and Collection, Comments, and Planning Functions BPC430
c) Next to P_COST choose the ellipse icon.
The EPM - Member Selector opens.
d) Select Consulting (UnderTotal → Direct) by placing a checkbox to the leftof the member.
e) Under Selection Relationship choose Member Only
f) Click the right arrow button to move the selection to Selected Members
g) Similarly, click the left arrow button to remove the prior selection which isalready highlighted.
h) Choose OK
You may receive a message Some members have been modified so that thetemplate can be used, choose OK.
i) Choose the green plus sign (lower right).
A new row appears.
j) In the new row, enter your use ID: BPC-##
k) Next to P_COST choose the ellipsis icon.
The EPM - Member Selector opens.
l) Select Manufacturing (UnderTotal → Direct) by placing a checkbox tothe left of the member.
m) Under Selection Relationship choose Member Only.
n) Click the right arrow button to move the selection to Selected Members.
o) Similarly, click the left arrow button to remove the prior selection which isalready highlighted.
p) Choose OK.
You may receive a message Some members have been modified so that thetemplate can be used, choose OK.
Hint: To save the template in the next step, you may need tomaximize your screen.
q) Choose Save
The excel sheet is generated and a save dialogue box pops up.
Continued on next page
320 © 2011 SAP AG. All rights reserved. 2011
SAP Class Week of April 16, 2012
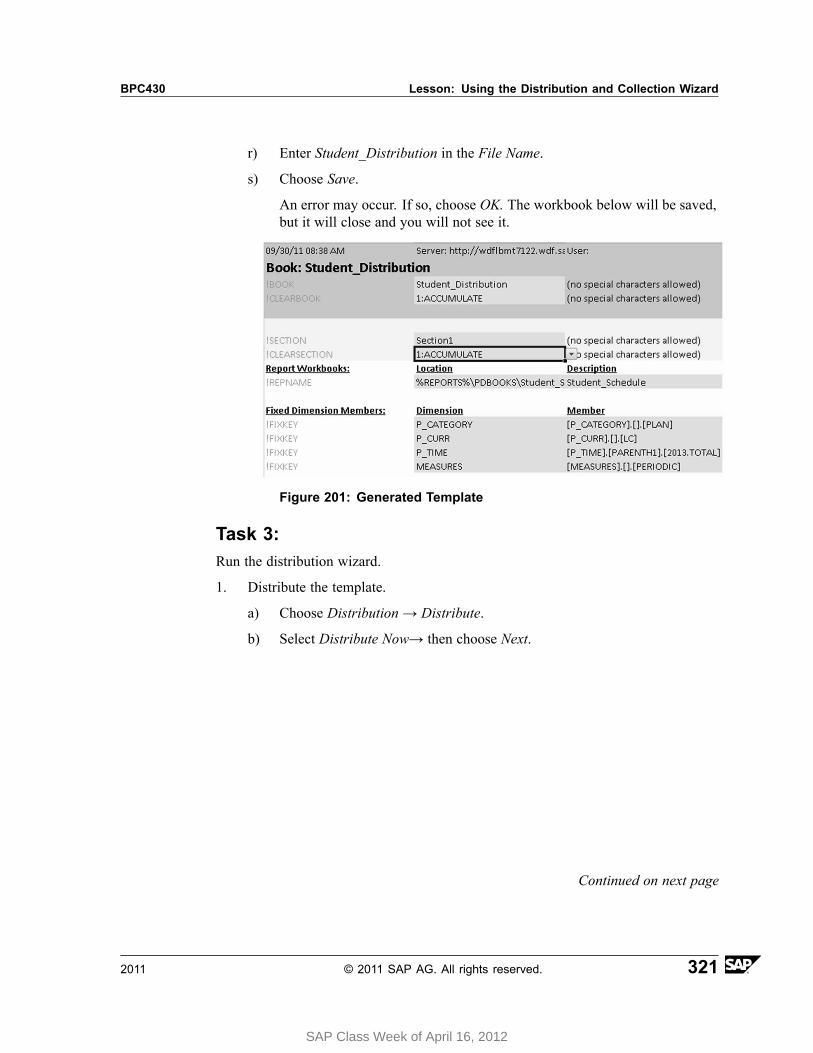
BPC430 Lesson: Using the Distribution and Collection Wizard
r) Enter Student_Distribution in the File Name.
s) Choose Save.
An error may occur. If so, choose OK. The workbook below will be saved,but it will close and you will not see it.
Figure 201: Generated Template
Task 3:Run the distribution wizard.
1. Distribute the template.
a) Choose Distribution → Distribute.
b) Select Distribute Now→ then choose Next.
Continued on next page
2011 © 2011 SAP AG. All rights reserved. 321
SAP Class Week of April 16, 2012
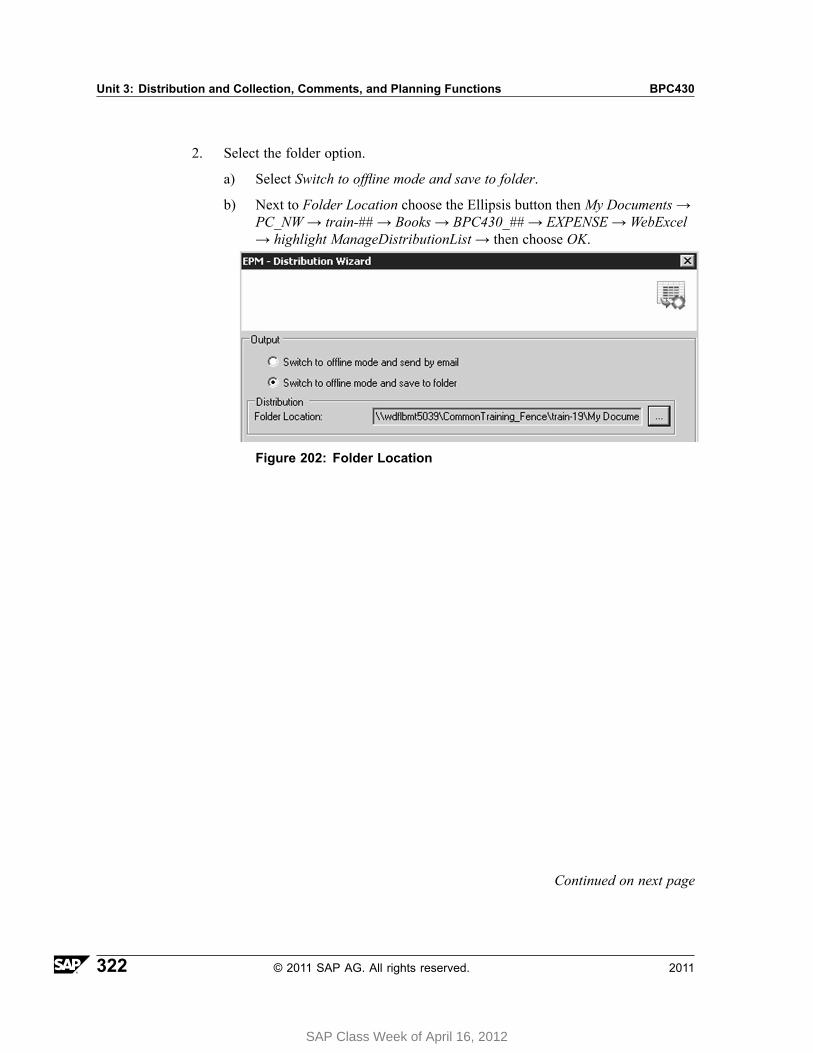
Unit 3: Distribution and Collection, Comments, and Planning Functions BPC430
2. Select the folder option.
a) Select Switch to offline mode and save to folder.
b) Next to Folder Location choose the Ellipsis button then My Documents →PC_NW→ train-## → Books → BPC430_## → EXPENSE → WebExcel→ highlight ManageDistributionList → then choose OK.
Figure 202: Folder Location
Continued on next page
322 © 2011 SAP AG. All rights reserved. 2011
SAP Class Week of April 16, 2012
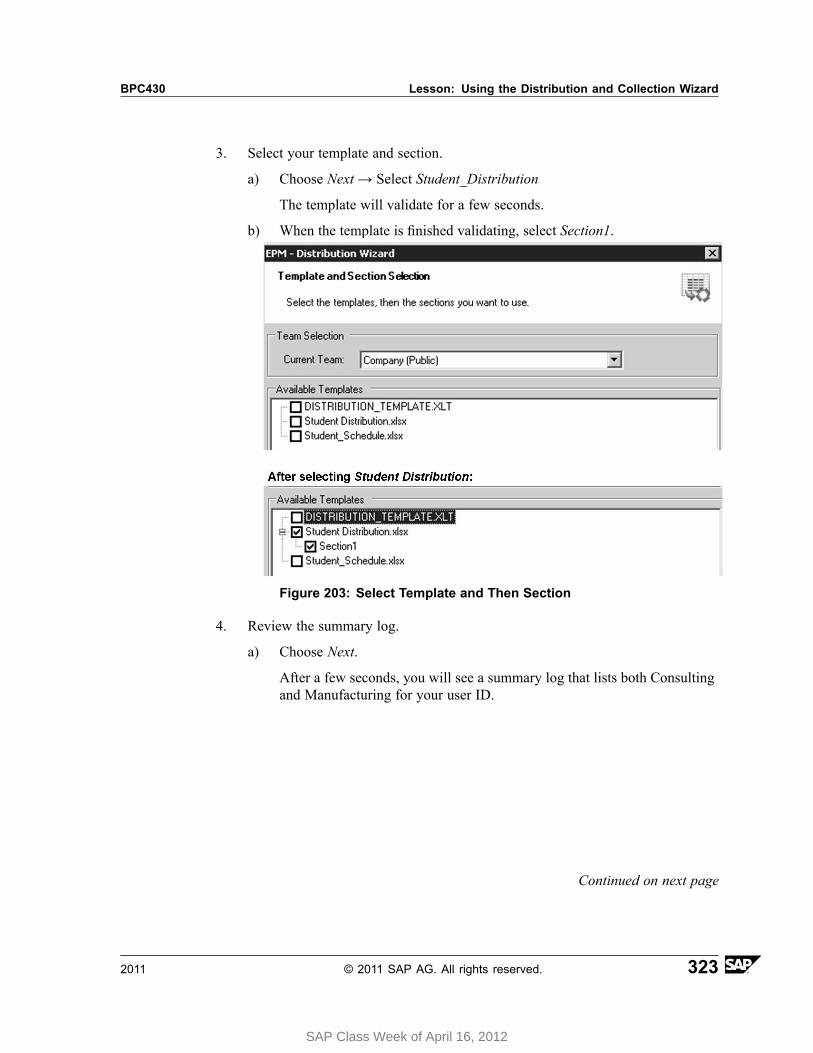
BPC430 Lesson: Using the Distribution and Collection Wizard
3. Select your template and section.
a) Choose Next → Select Student_Distribution
The template will validate for a few seconds.
b) When the template is finished validating, select Section1.
Figure 203: Select Template and Then Section
4. Review the summary log.
a) Choose Next.
After a few seconds, you will see a summary log that lists both Consultingand Manufacturing for your user ID.
Continued on next page
2011 © 2011 SAP AG. All rights reserved. 323
SAP Class Week of April 16, 2012
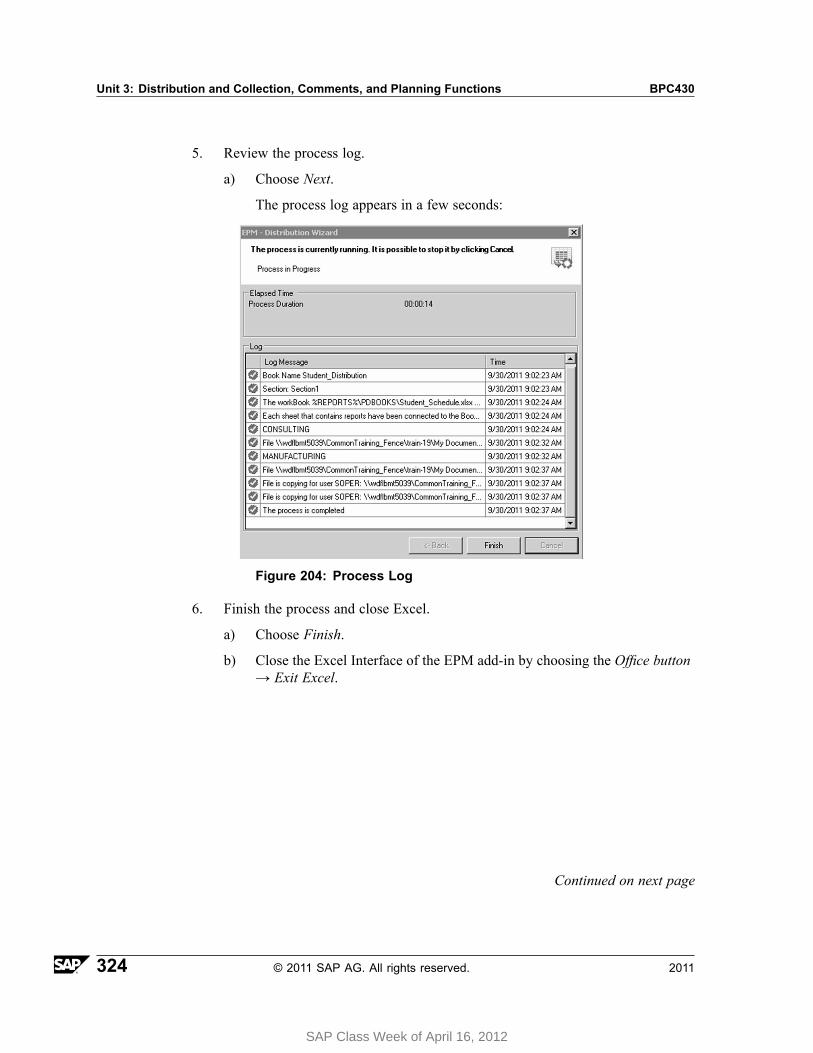
Unit 3: Distribution and Collection, Comments, and Planning Functions BPC430
5. Review the process log.
a) Choose Next.
The process log appears in a few seconds:
Figure 204: Process Log
6. Finish the process and close Excel.
a) Choose Finish.
b) Close the Excel Interface of the EPM add-in by choosing the Office button→ Exit Excel.
Continued on next page
324 © 2011 SAP AG. All rights reserved. 2011
SAP Class Week of April 16, 2012
BPC430 Lesson: Using the Distribution and Collection Wizard
Task 4:Enter data offline.
1. Open the files via Microsoft Office Excel 2007 and enter 100 for Consultingand 200 for Manufacturing.
a) Open Microsoft Office Excel 2007 Start → Program → Microsoft Office→ Microsoft Excel.
b) Choose the Office Button → Open → My Documents → PC_NW→ train-## → Books → BPC430_## → EXPENSE → WebExcel →ManageDistributionList → BPC-## → Student_Schedule → Consulting→ Open.
c) Enter 100 for Personnel Cost in 13 - Jan → Choose Office Button → Save.
The data is saved in native excel.
2. Enter data for Manufacturing
a) Open the Manufacturing workbook Office Button → Open
b) Enter 200 for Personnel Cost in 13 - Jan → Choose Save
The data is saved in native excel.
c) Close the two spreadsheets by choosing Office → Close.
Task 5:Run the collection wizard.
1. Open the Excel Interface of the EPM add-in.
a) On the Web Client Start Page, select EPM Office Add-in Excel.
The EPM - Connection Manager opens after a few seconds.
b) Select the Expense - BPC430_## connection.
c) Choose OK.
The EPM Pane appears on the right.
d) Choose the EPM tab.
2. Ensure you are on the EXPENSE - BPC430_## connection.
a) From the EPM ribbon, choose Open → Change Connection If theEXPENSE - BPC430_## connection is not chosen, choose it. Choose OK.
Continued on next page
2011 © 2011 SAP AG. All rights reserved. 325
SAP Class Week of April 16, 2012
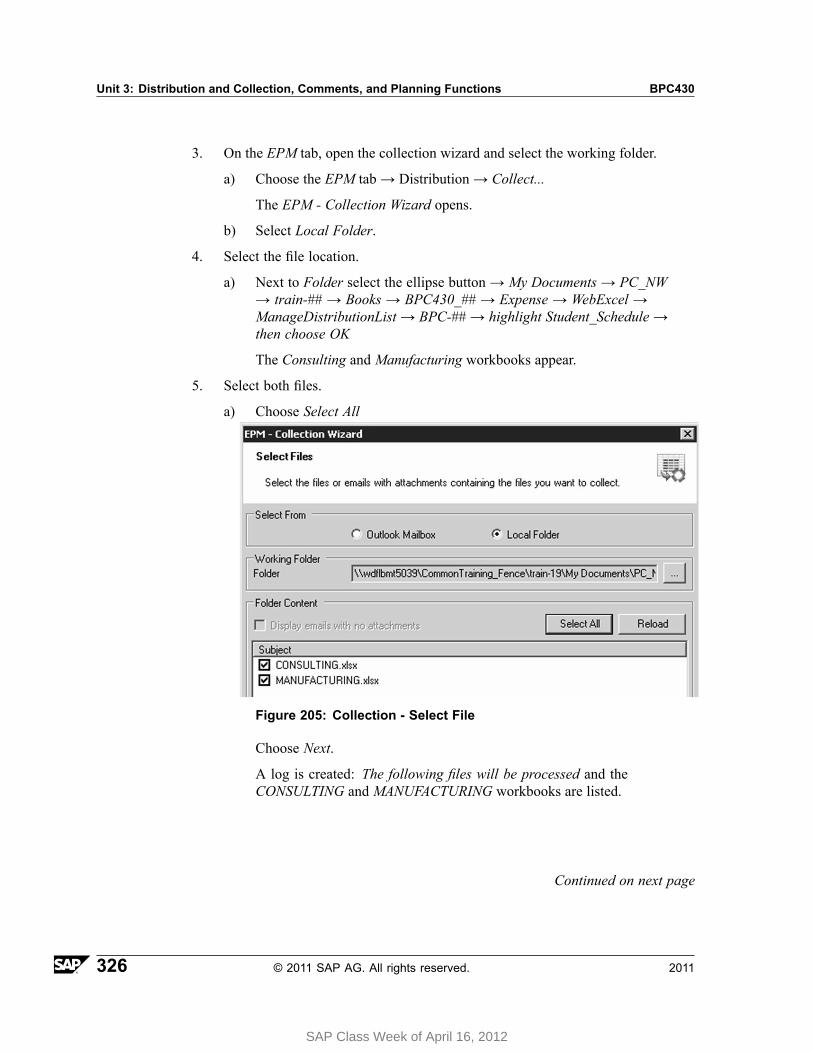
Unit 3: Distribution and Collection, Comments, and Planning Functions BPC430
3. On the EPM tab, open the collection wizard and select the working folder.
a) Choose the EPM tab→ Distribution→ Collect...
The EPM - Collection Wizard opens.
b) Select Local Folder.
4. Select the file location.
a) Next to Folder select the ellipse button→ My Documents → PC_NW→ train-## → Books → BPC430_## → Expense → WebExcel →ManageDistributionList → BPC-## → highlight Student_Schedule →then choose OK
The Consulting and Manufacturing workbooks appear.
5. Select both files.
a) Choose Select All
Figure 205: Collection - Select File
Choose Next.
A log is created: The following files will be processed and theCONSULTING and MANUFACTURING workbooks are listed.
Continued on next page
326 © 2011 SAP AG. All rights reserved. 2011
SAP Class Week of April 16, 2012
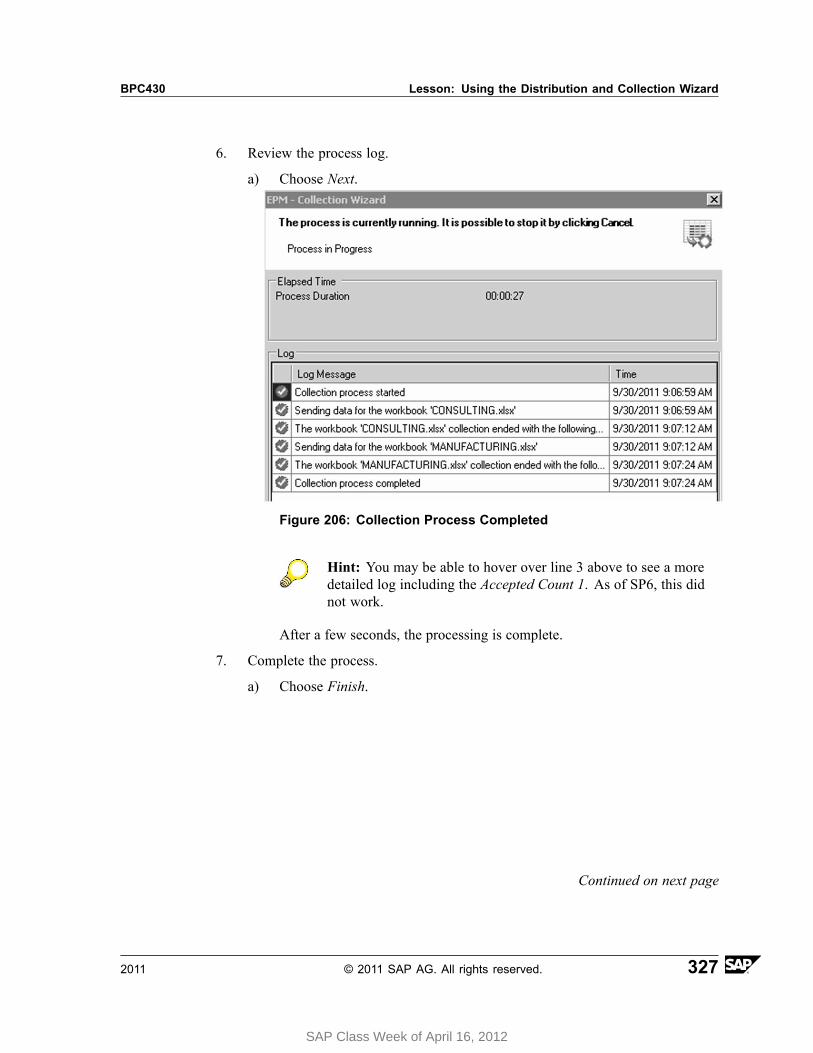
BPC430 Lesson: Using the Distribution and Collection Wizard
6. Review the process log.
a) Choose Next.
Figure 206: Collection Process Completed
Hint: You may be able to hover over line 3 above to see a moredetailed log including the Accepted Count 1. As of SP6, this didnot work.
After a few seconds, the processing is complete.
7. Complete the process.
a) Choose Finish.
Continued on next page
2011 © 2011 SAP AG. All rights reserved. 327
SAP Class Week of April 16, 2012
Unit 3: Distribution and Collection, Comments, and Planning Functions BPC430
Task 6:Confirm that the data is in the data base.
1. Use the Student_Schedule to verify that your data was saved to the data base.
a) From the EPM ribbon choose Open → Open Server Root Folder.
b) Choose Company(Public) → PDBooks.
c) Select Student_Schedule → Open.
d) Set your P_COST context to Consulting.
e) Choose Refresh.
You should see 100 appear for 2013.01.
2. View the Manufacturing data.
a) Set your P_COST context to Manufacturing.
b) Choose Refresh.
You should see 200 appear for 2013.01.
c) Close the template.
328 © 2011 SAP AG. All rights reserved. 2011
SAP Class Week of April 16, 2012

BPC430 Lesson: Using the Distribution and Collection Wizard
Lesson Summary
You should now be able to:• Distribute static reports to file directories• Distribute static reports via e-mail• Collect off line data
2011 © 2011 SAP AG. All rights reserved. 329
SAP Class Week of April 16, 2012
Unit 3: Distribution and Collection, Comments, and Planning Functions BPC430
Lesson: Using the Comment Feature
Lesson OverviewIn this lesson, you will use the commenting feature from the menu and also withthe EPMSaveComment function.
Lesson ObjectivesAfter completing this lesson, you will be able to:
• Describe the features of comments• Save comments with the EPMSaveComment function• Save comments with the ribbon command• Report on comments
Business ExampleYour planners need to record planning assumptions and explaining variances in thedatabase and so they are interested in the comment feature.
Business Scenarios for Using CommentsHere are a few ways of how you can use comments:
• Use the EPMSaveComment function• Use the Add Comment ribbon command
PrerequisitesTo use comments, the Enable Comments must be turned on by model.
This is done in administration.
330 © 2011 SAP AG. All rights reserved. 2011
SAP Class Week of April 16, 2012

BPC430 Lesson: Using the Comment Feature
Figure 207: Turning on Comments
Note: In the SAP BusinessObjects Planning and Consolidation, version forMicrosoft Platform, Models are comment enabled when their web parameterCOMMENT is set to ON.
2011 © 2011 SAP AG. All rights reserved. 331
SAP Class Week of April 16, 2012
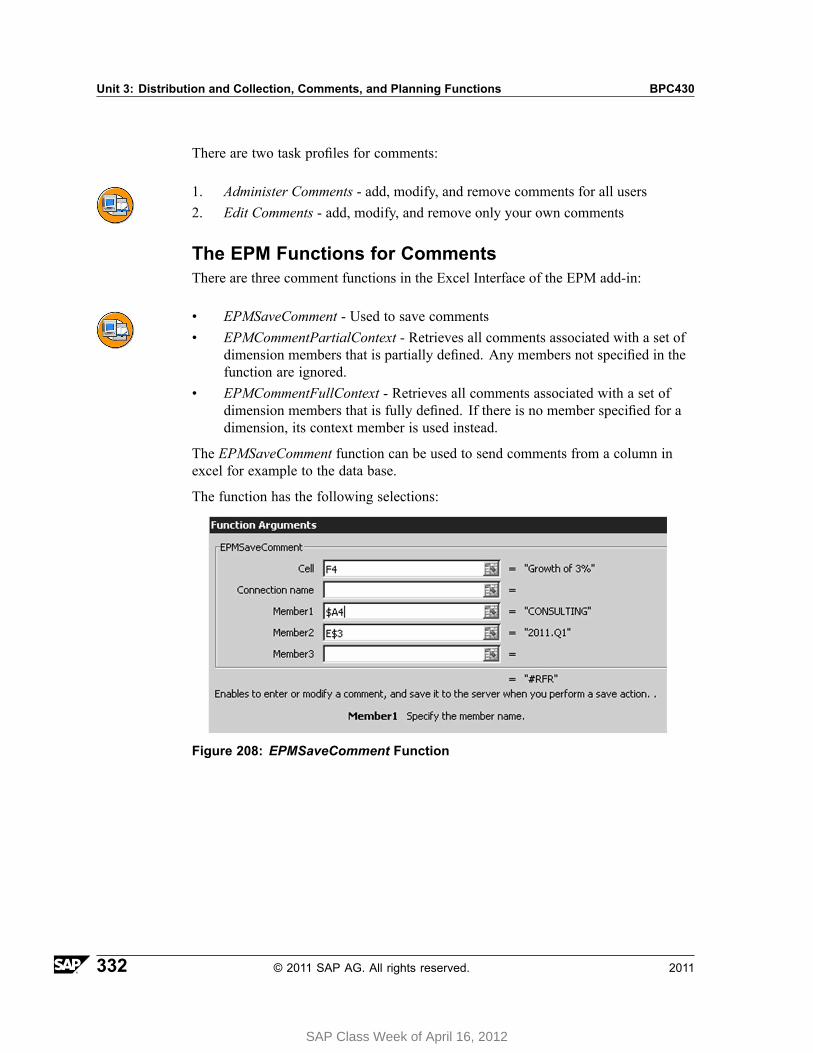
Unit 3: Distribution and Collection, Comments, and Planning Functions BPC430
There are two task profiles for comments:
1. Administer Comments - add, modify, and remove comments for all users2. Edit Comments - add, modify, and remove only your own comments
The EPM Functions for CommentsThere are three comment functions in the Excel Interface of the EPM add-in:
• EPMSaveComment - Used to save comments• EPMCommentPartialContext - Retrieves all comments associated with a set of
dimension members that is partially defined. Any members not specified in thefunction are ignored.
• EPMCommentFullContext - Retrieves all comments associated with a set ofdimension members that is fully defined. If there is no member specified for adimension, its context member is used instead.
The EPMSaveComment function can be used to send comments from a column inexcel for example to the data base.
The function has the following selections:
Figure 208: EPMSaveComment Function
332 © 2011 SAP AG. All rights reserved. 2011
SAP Class Week of April 16, 2012
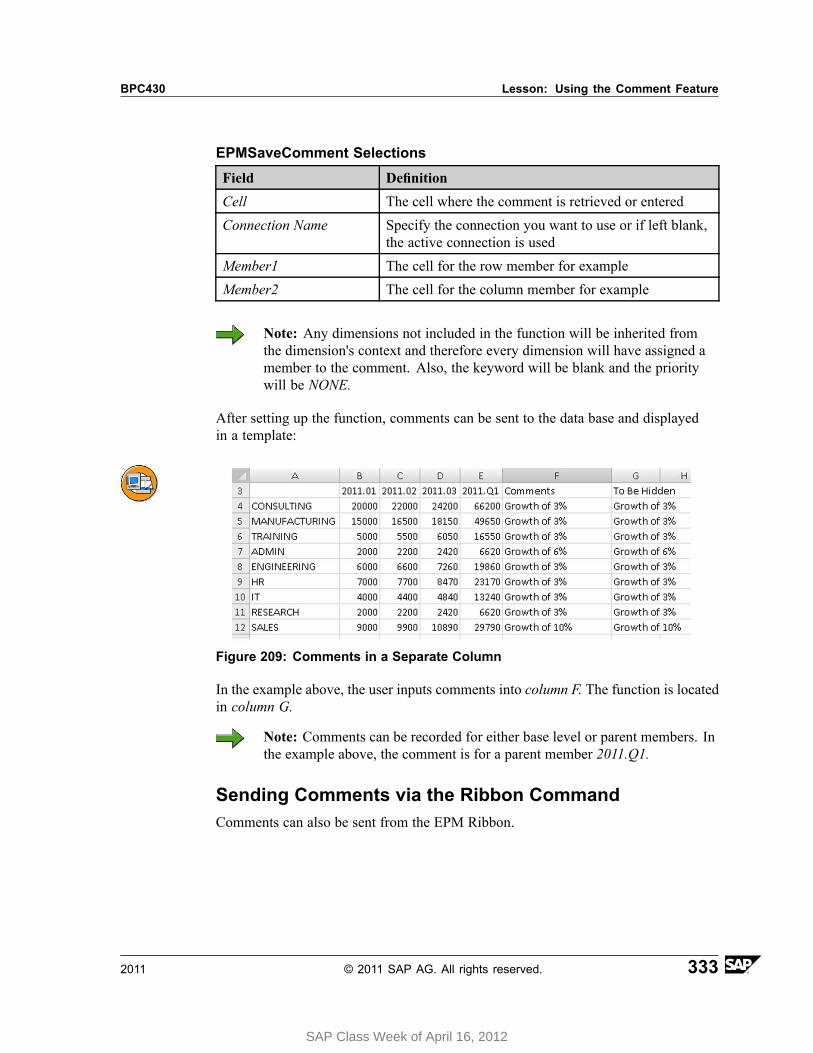
BPC430 Lesson: Using the Comment Feature
EPMSaveComment Selections
Field Definition
Cell The cell where the comment is retrieved or entered
Connection Name Specify the connection you want to use or if left blank,the active connection is used
Member1 The cell for the row member for example
Member2 The cell for the column member for example
Note: Any dimensions not included in the function will be inherited fromthe dimension's context and therefore every dimension will have assigned amember to the comment. Also, the keyword will be blank and the prioritywill be NONE.
After setting up the function, comments can be sent to the data base and displayedin a template:
Figure 209: Comments in a Separate Column
In the example above, the user inputs comments into column F. The function is locatedin column G.
Note: Comments can be recorded for either base level or parent members. Inthe example above, the comment is for a parent member 2011.Q1.
Sending Comments via the Ribbon CommandComments can also be sent from the EPM Ribbon.
2011 © 2011 SAP AG. All rights reserved. 333
SAP Class Week of April 16, 2012
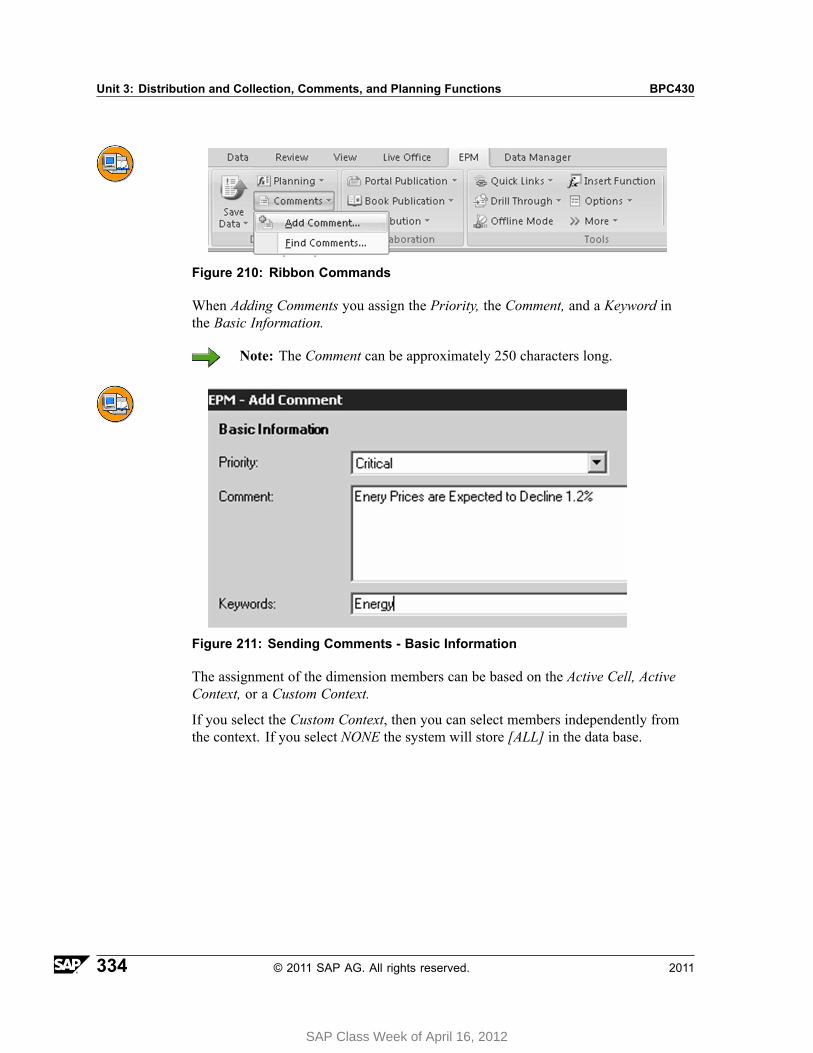
Unit 3: Distribution and Collection, Comments, and Planning Functions BPC430
Figure 210: Ribbon Commands
When Adding Comments you assign the Priority, the Comment, and a Keyword inthe Basic Information.
Note: The Comment can be approximately 250 characters long.
Figure 211: Sending Comments - Basic Information
The assignment of the dimension members can be based on the Active Cell, ActiveContext, or a Custom Context.
If you select the Custom Context, then you can select members independently fromthe context. If you select NONE the system will store [ALL] in the data base.
334 © 2011 SAP AG. All rights reserved. 2011
SAP Class Week of April 16, 2012
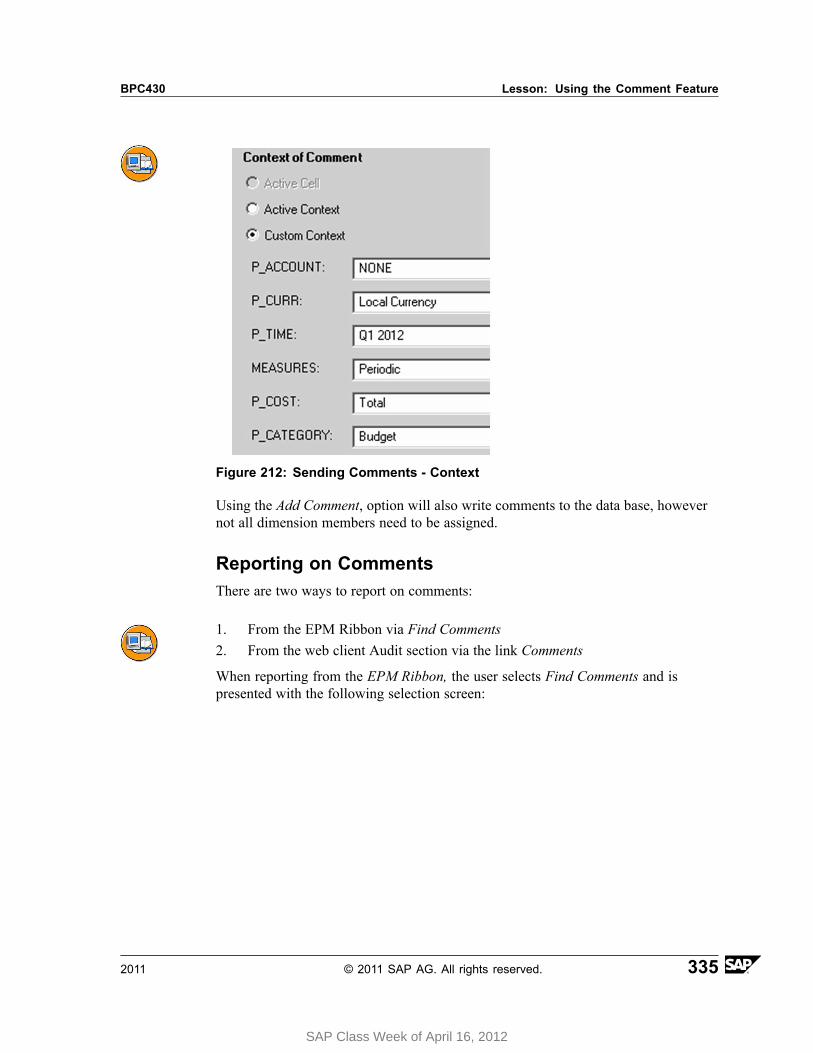
BPC430 Lesson: Using the Comment Feature
Figure 212: Sending Comments - Context
Using the Add Comment, option will also write comments to the data base, howevernot all dimension members need to be assigned.
Reporting on CommentsThere are two ways to report on comments:
1. From the EPM Ribbon via Find Comments2. From the web client Audit section via the link Comments
When reporting from the EPM Ribbon, the user selects Find Comments and ispresented with the following selection screen:
2011 © 2011 SAP AG. All rights reserved. 335
SAP Class Week of April 16, 2012
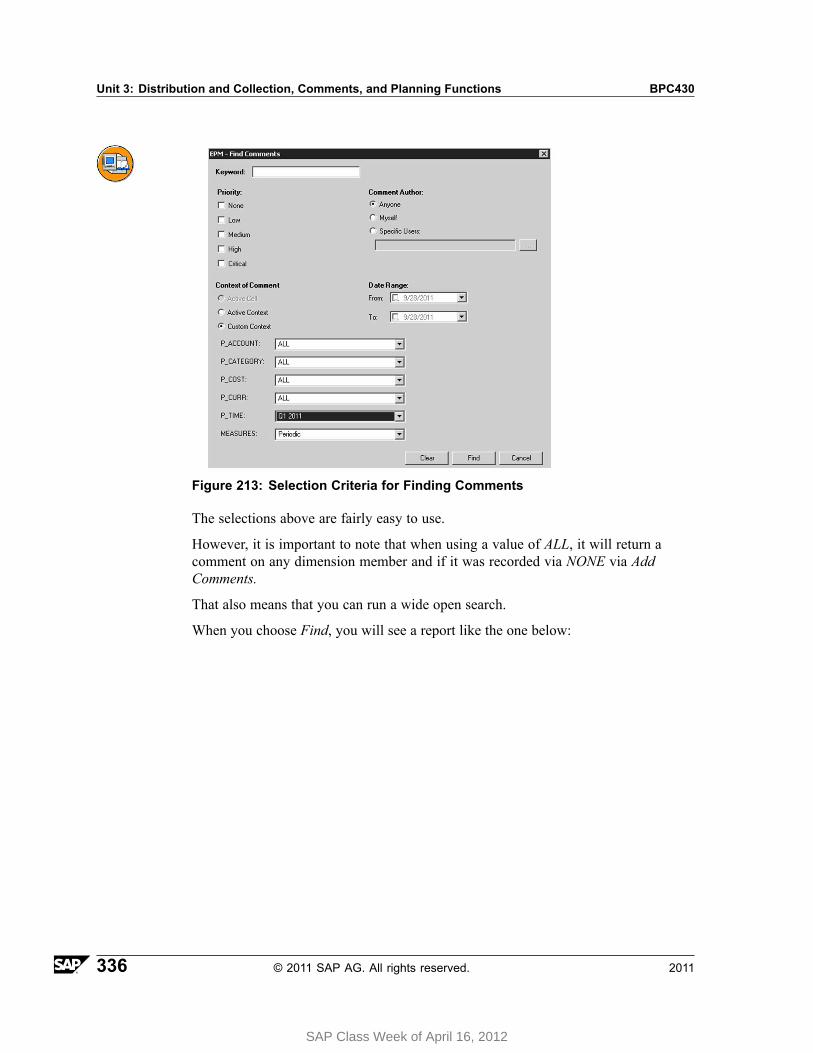
Unit 3: Distribution and Collection, Comments, and Planning Functions BPC430
Figure 213: Selection Criteria for Finding Comments
The selections above are fairly easy to use.
However, it is important to note that when using a value of ALL, it will return acomment on any dimension member and if it was recorded via NONE via AddComments.
That also means that you can run a wide open search.
When you choose Find, you will see a report like the one below:
336 © 2011 SAP AG. All rights reserved. 2011
SAP Class Week of April 16, 2012
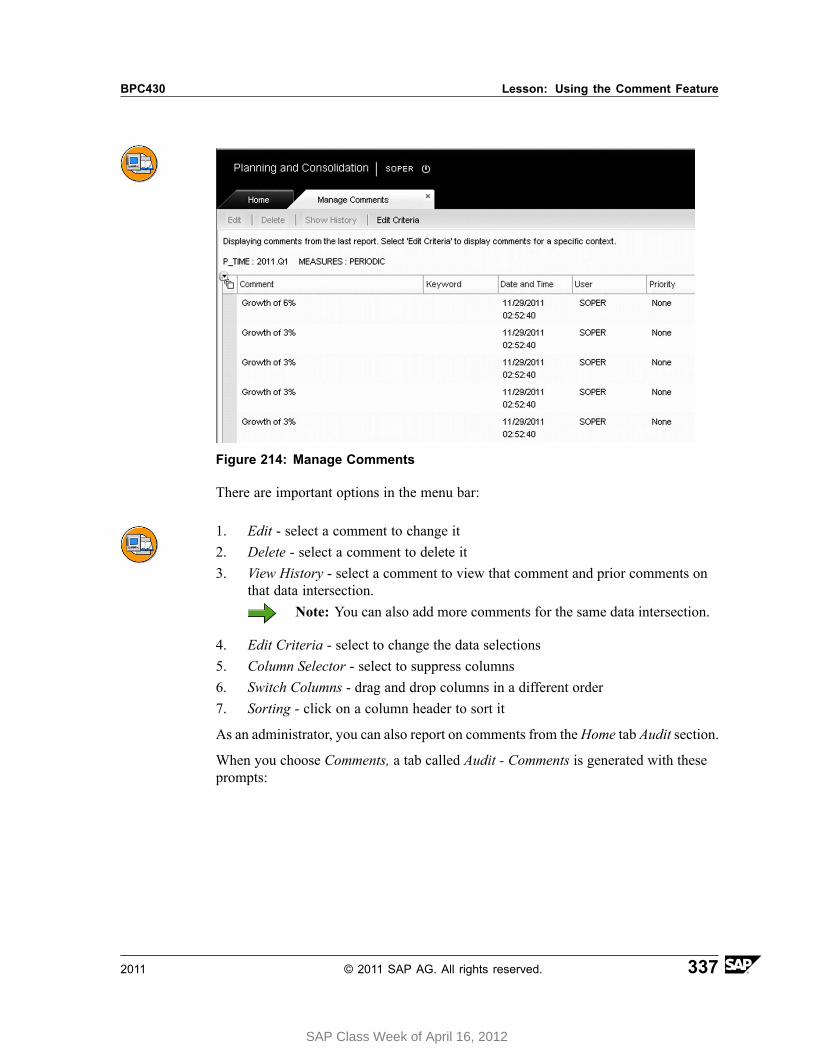
BPC430 Lesson: Using the Comment Feature
Figure 214: Manage Comments
There are important options in the menu bar:
1. Edit - select a comment to change it2. Delete - select a comment to delete it3. View History - select a comment to view that comment and prior comments on
that data intersection.Note: You can also add more comments for the same data intersection.
4. Edit Criteria - select to change the data selections5. Column Selector - select to suppress columns6. Switch Columns - drag and drop columns in a different order7. Sorting - click on a column header to sort it
As an administrator, you can also report on comments from theHome tab Audit section.
When you choose Comments, a tab called Audit - Comments is generated with theseprompts:
2011 © 2011 SAP AG. All rights reserved. 337
SAP Class Week of April 16, 2012
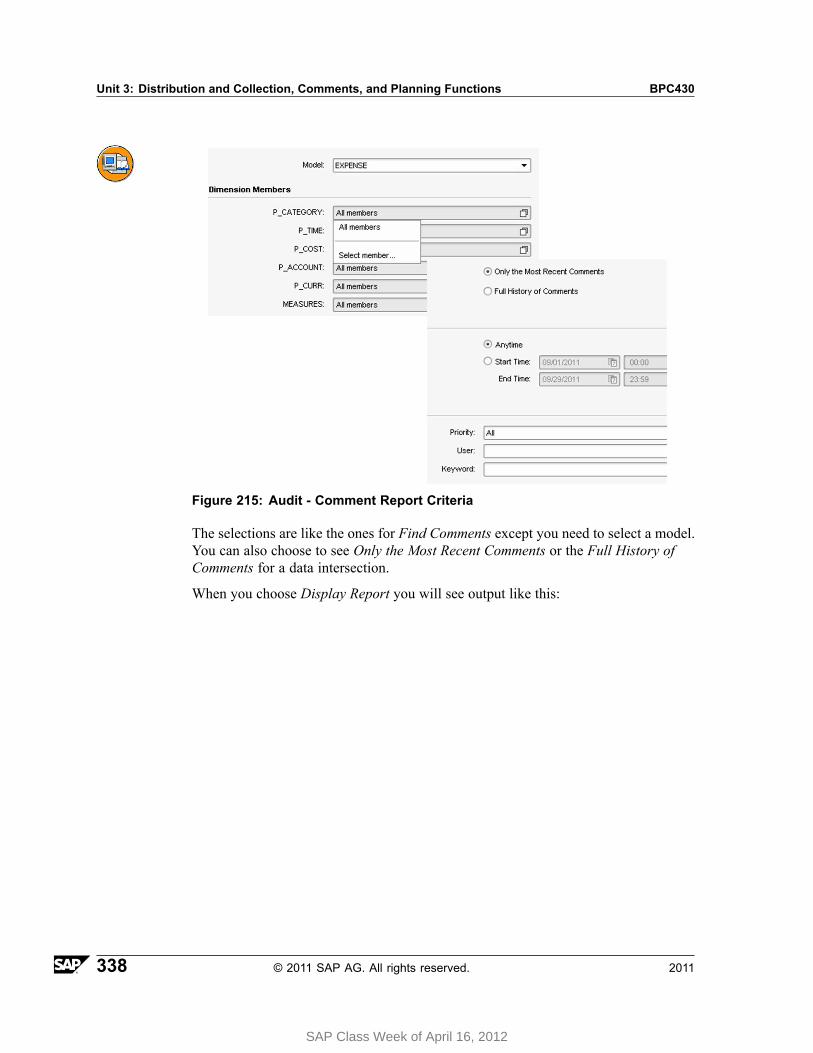
Unit 3: Distribution and Collection, Comments, and Planning Functions BPC430
Figure 215: Audit - Comment Report Criteria
The selections are like the ones for Find Comments except you need to select a model.You can also choose to see Only the Most Recent Comments or the Full History ofComments for a data intersection.
When you choose Display Report you will see output like this:
338 © 2011 SAP AG. All rights reserved. 2011
SAP Class Week of April 16, 2012
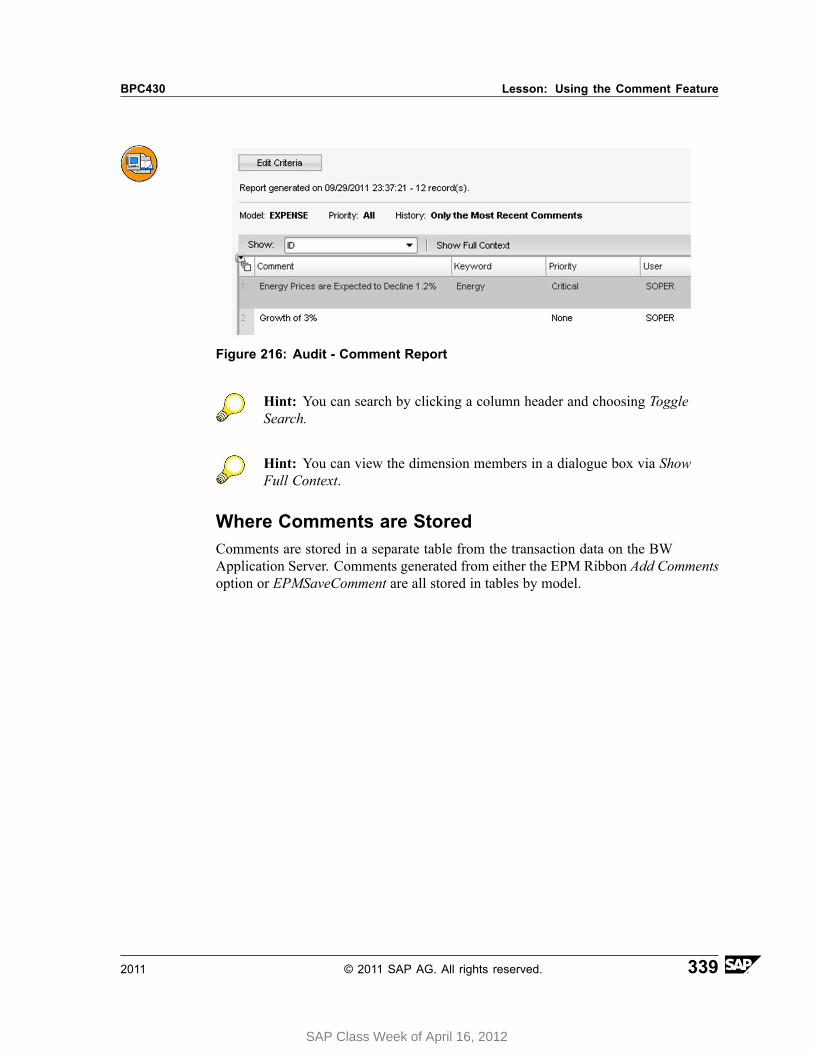
BPC430 Lesson: Using the Comment Feature
Figure 216: Audit - Comment Report
Hint: You can search by clicking a column header and choosing ToggleSearch.
Hint: You can view the dimension members in a dialogue box via ShowFull Context.
Where Comments are StoredComments are stored in a separate table from the transaction data on the BWApplication Server. Comments generated from either the EPM Ribbon Add Commentsoption or EPMSaveComment are all stored in tables by model.
2011 © 2011 SAP AG. All rights reserved. 339
SAP Class Week of April 16, 2012
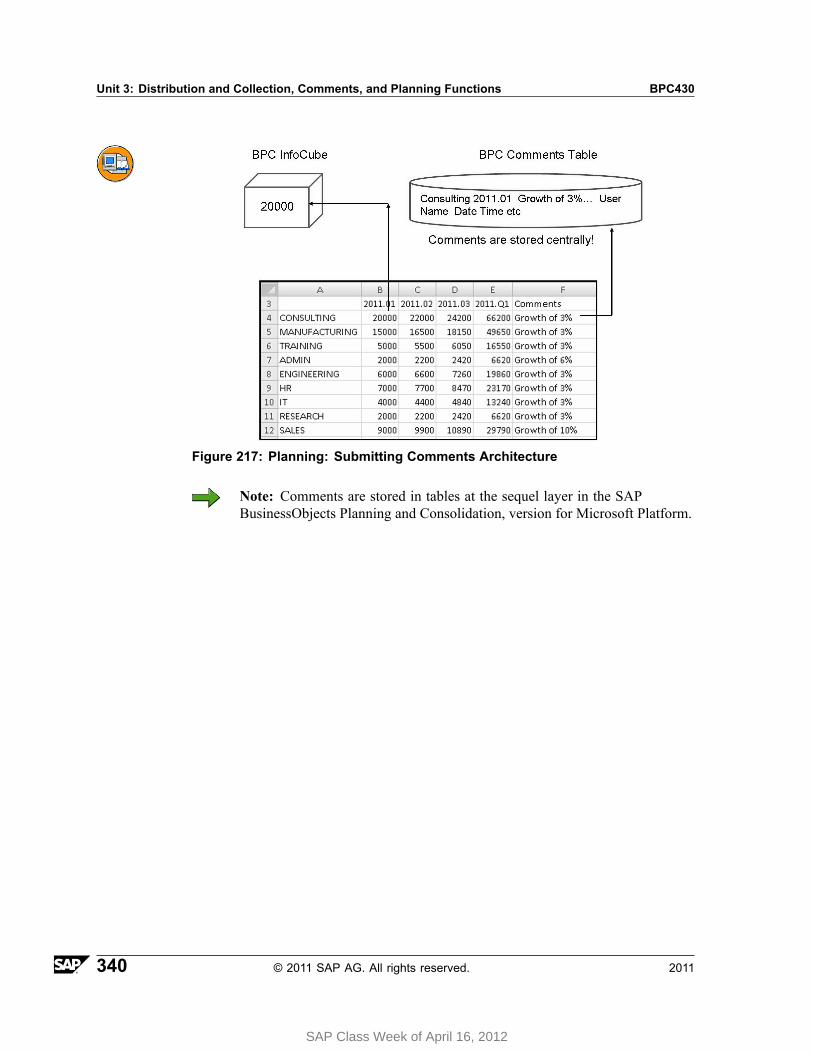
Unit 3: Distribution and Collection, Comments, and Planning Functions BPC430
Figure 217: Planning: Submitting Comments Architecture
Note: Comments are stored in tables at the sequel layer in the SAPBusinessObjects Planning and Consolidation, version for Microsoft Platform.
340 © 2011 SAP AG. All rights reserved. 2011
SAP Class Week of April 16, 2012
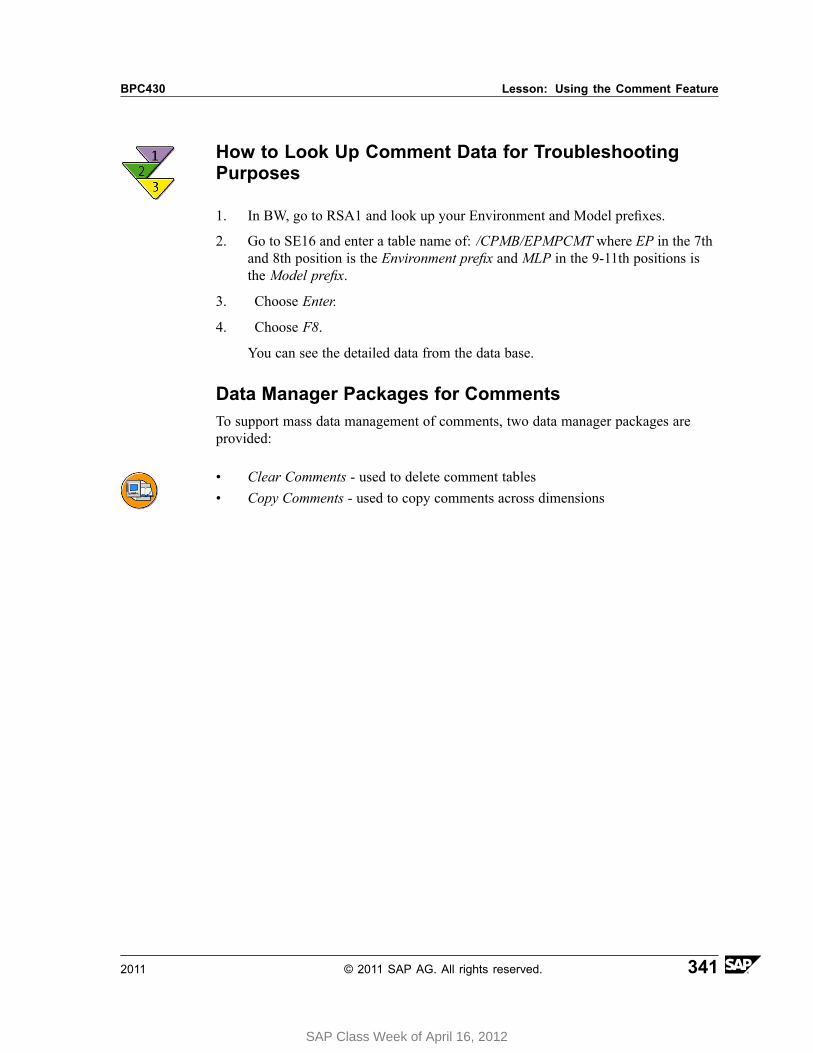
BPC430 Lesson: Using the Comment Feature
How to Look Up Comment Data for TroubleshootingPurposes
1. In BW, go to RSA1 and look up your Environment and Model prefixes.
2. Go to SE16 and enter a table name of: /CPMB/EPMPCMT where EP in the 7thand 8th position is the Environment prefix and MLP in the 9-11th positions isthe Model prefix.
3. Choose Enter.
4. Choose F8.
You can see the detailed data from the data base.
Data Manager Packages for CommentsTo support mass data management of comments, two data manager packages areprovided:
• Clear Comments - used to delete comment tables• Copy Comments - used to copy comments across dimensions
2011 © 2011 SAP AG. All rights reserved. 341
SAP Class Week of April 16, 2012

Unit 3: Distribution and Collection, Comments, and Planning Functions BPC430
342 © 2011 SAP AG. All rights reserved. 2011
SAP Class Week of April 16, 2012
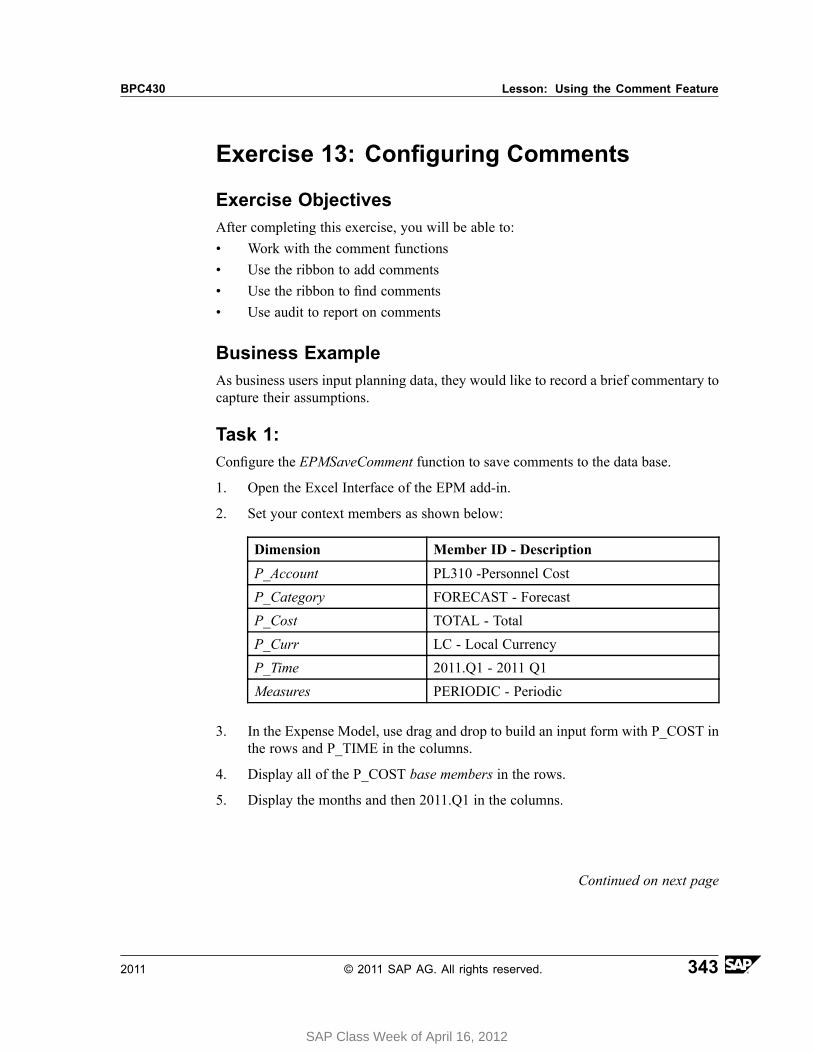
BPC430 Lesson: Using the Comment Feature
Exercise 13: Configuring Comments
Exercise ObjectivesAfter completing this exercise, you will be able to:• Work with the comment functions• Use the ribbon to add comments• Use the ribbon to find comments• Use audit to report on comments
Business ExampleAs business users input planning data, they would like to record a brief commentary tocapture their assumptions.
Task 1:Configure the EPMSaveComment function to save comments to the data base.
1. Open the Excel Interface of the EPM add-in.
2. Set your context members as shown below:
Dimension Member ID - Description
P_Account PL310 -Personnel Cost
P_Category FORECAST - Forecast
P_Cost TOTAL - Total
P_Curr LC - Local Currency
P_Time 2011.Q1 - 2011 Q1
Measures PERIODIC - Periodic
3. In the Expense Model, use drag and drop to build an input form with P_COST inthe rows and P_TIME in the columns.
4. Display all of the P_COST base members in the rows.
5. Display the months and then 2011.Q1 in the columns.
Continued on next page
2011 © 2011 SAP AG. All rights reserved. 343
SAP Class Week of April 16, 2012
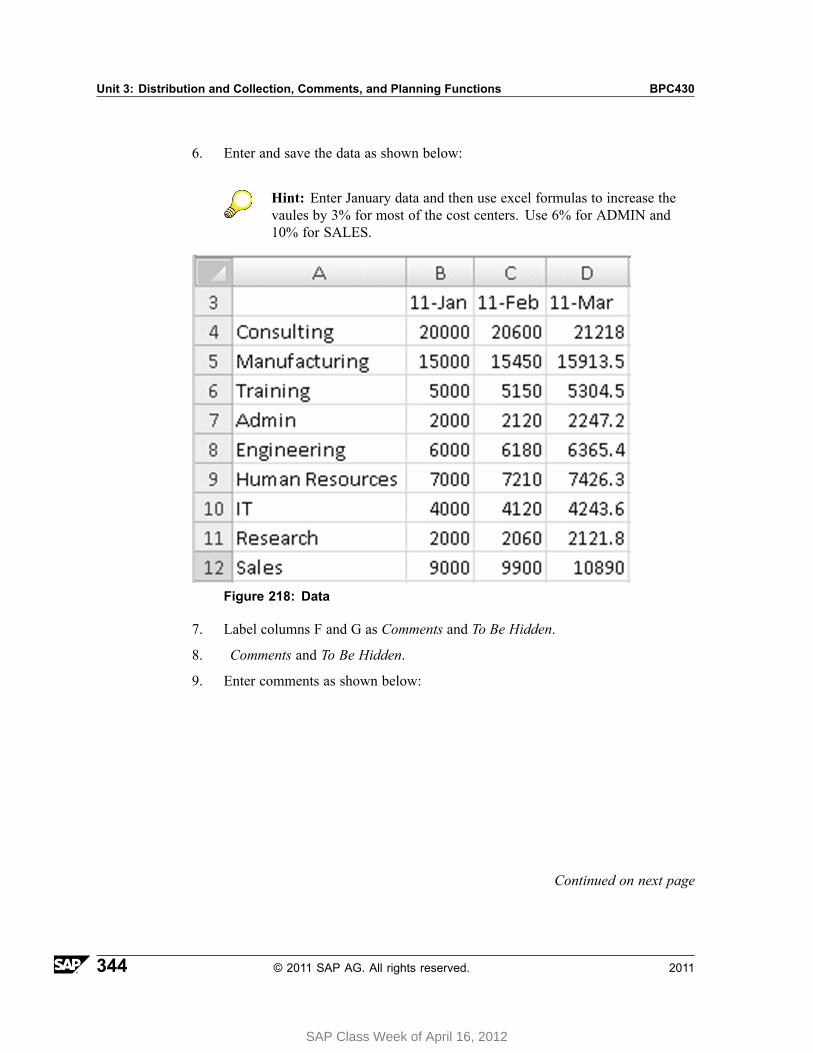
Unit 3: Distribution and Collection, Comments, and Planning Functions BPC430
6. Enter and save the data as shown below:
Hint: Enter January data and then use excel formulas to increase thevaules by 3% for most of the cost centers. Use 6% for ADMIN and10% for SALES.
Figure 218: Data
7. Label columns F and G as Comments and To Be Hidden.
8. Comments and To Be Hidden.
9. Enter comments as shown below:
Continued on next page
344 © 2011 SAP AG. All rights reserved. 2011
SAP Class Week of April 16, 2012

BPC430 Lesson: Using the Comment Feature
Figure 219: Comments
10. Save the template as GR## Column Comments.
11. Run the Find Comments from the Excel Interface of the EPM add-in.
Task 2: Adding Comments from the EPM Ribbon in theExcel Interface of the EPM add-inUse the EPM Ribbon to add comments and then run the comments report fromadministration.
1. Add a comment via the EPM ribbon Add Comment option as you see below:
Continued on next page
2011 © 2011 SAP AG. All rights reserved. 345
SAP Class Week of April 16, 2012
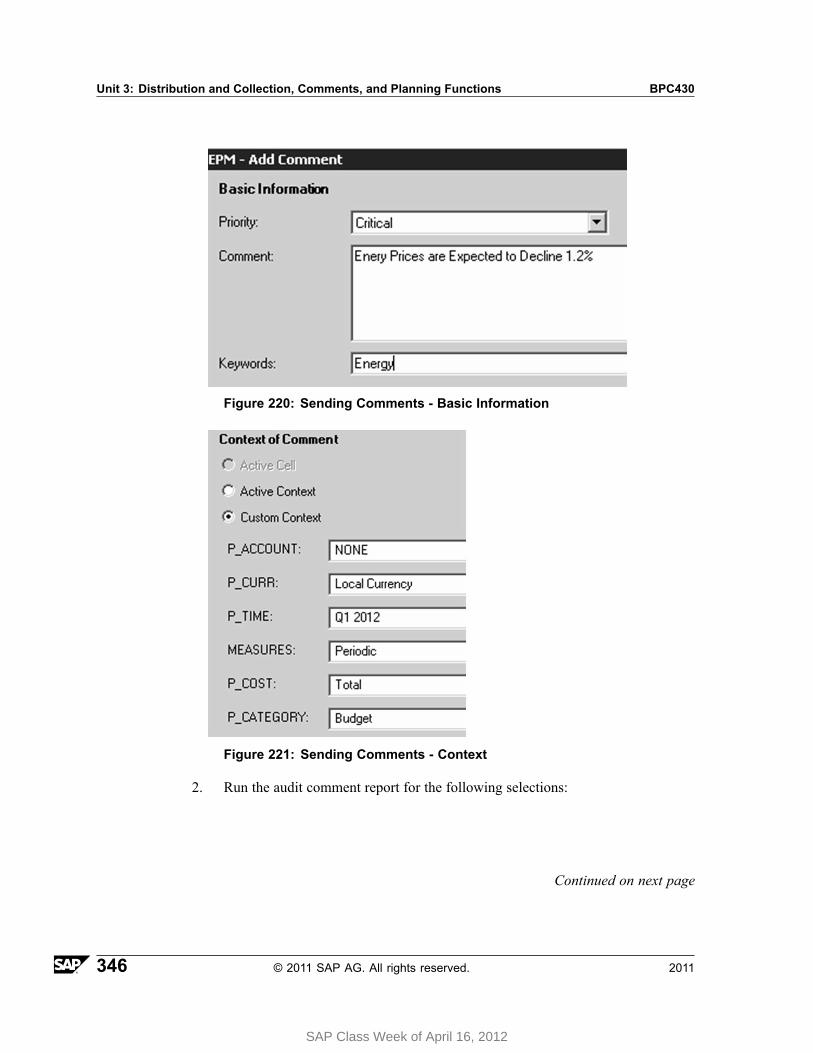
Unit 3: Distribution and Collection, Comments, and Planning Functions BPC430
Figure 220: Sending Comments - Basic Information
Figure 221: Sending Comments - Context
2. Run the audit comment report for the following selections:
Continued on next page
346 © 2011 SAP AG. All rights reserved. 2011
SAP Class Week of April 16, 2012
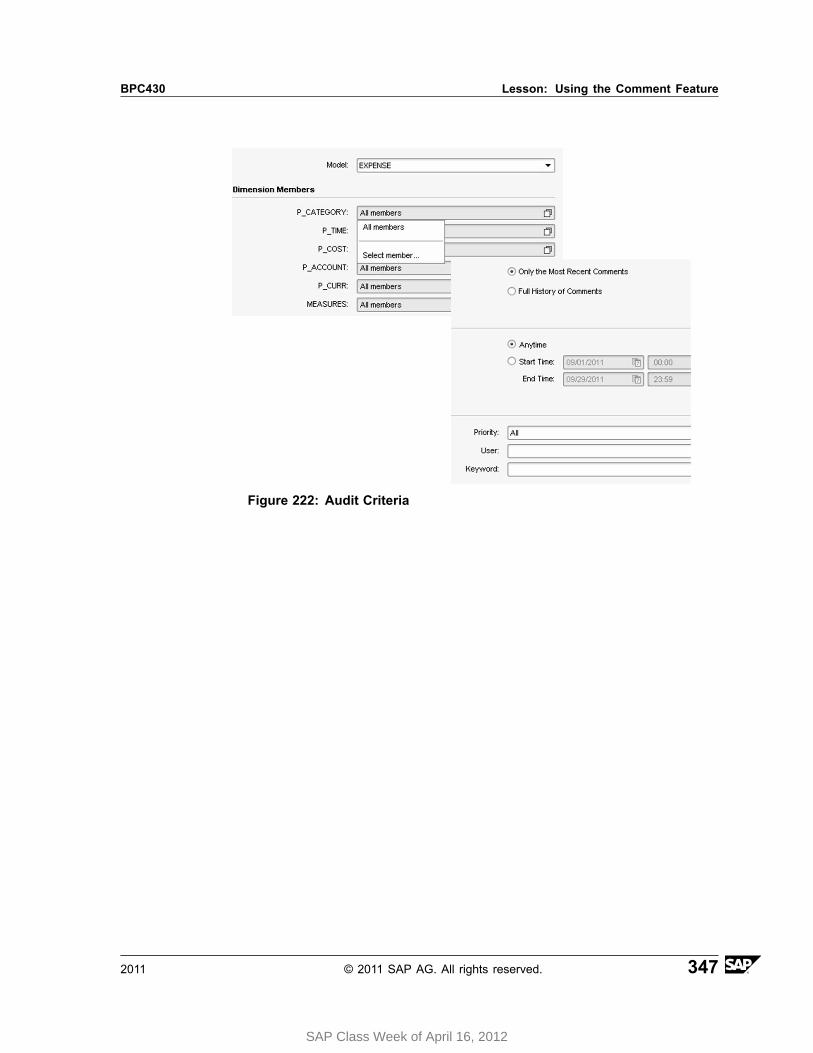
BPC430 Lesson: Using the Comment Feature
Figure 222: Audit Criteria
2011 © 2011 SAP AG. All rights reserved. 347
SAP Class Week of April 16, 2012
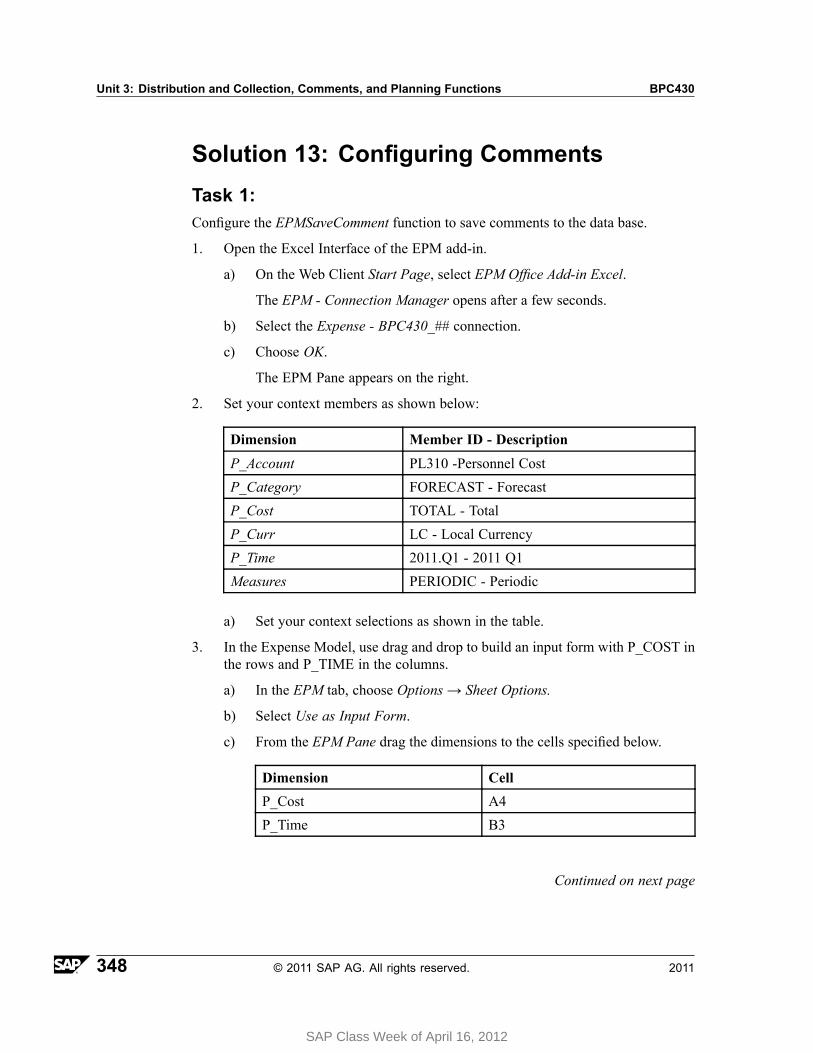
Unit 3: Distribution and Collection, Comments, and Planning Functions BPC430
Solution 13: Configuring CommentsTask 1:Configure the EPMSaveComment function to save comments to the data base.
1. Open the Excel Interface of the EPM add-in.
a) On the Web Client Start Page, select EPM Office Add-in Excel.
The EPM - Connection Manager opens after a few seconds.
b) Select the Expense - BPC430_## connection.
c) Choose OK.
The EPM Pane appears on the right.
2. Set your context members as shown below:
Dimension Member ID - Description
P_Account PL310 -Personnel Cost
P_Category FORECAST - Forecast
P_Cost TOTAL - Total
P_Curr LC - Local Currency
P_Time 2011.Q1 - 2011 Q1
Measures PERIODIC - Periodic
a) Set your context selections as shown in the table.
3. In the Expense Model, use drag and drop to build an input form with P_COST inthe rows and P_TIME in the columns.
a) In the EPM tab, choose Options → Sheet Options.
b) Select Use as Input Form.
c) From the EPM Pane drag the dimensions to the cells specified below.
Dimension Cell
P_Cost A4
P_Time B3
Continued on next page
348 © 2011 SAP AG. All rights reserved. 2011
SAP Class Week of April 16, 2012
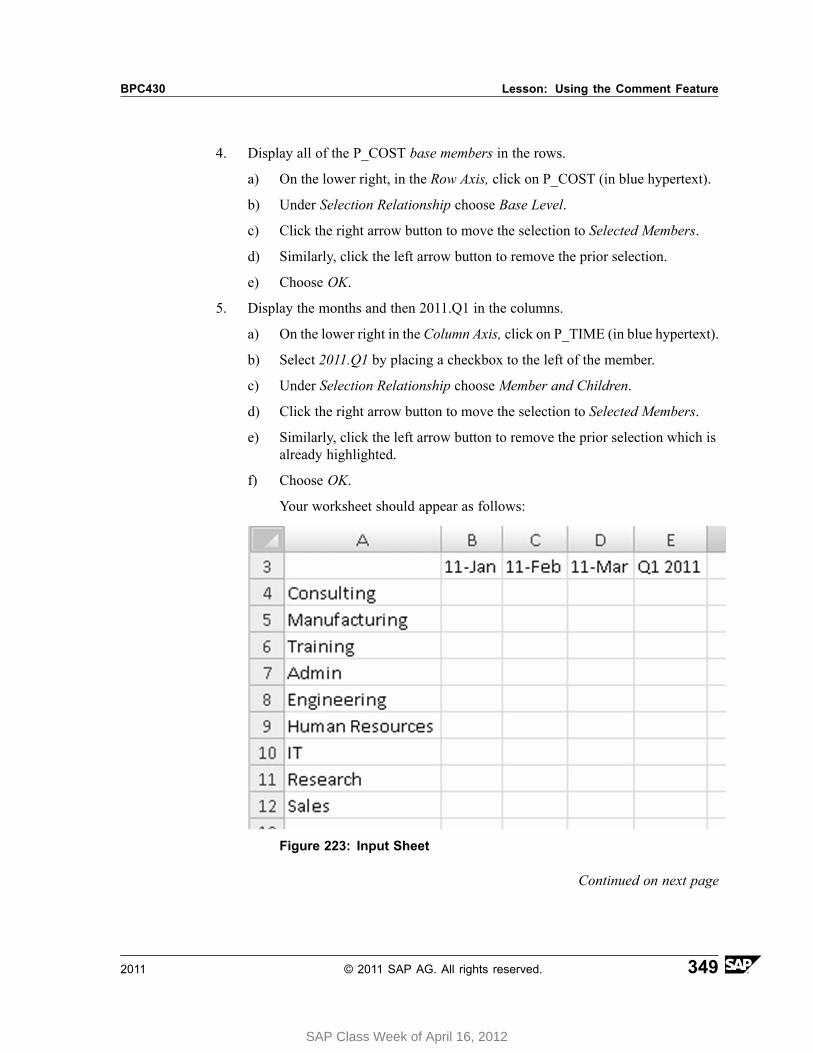
BPC430 Lesson: Using the Comment Feature
4. Display all of the P_COST base members in the rows.
a) On the lower right, in the Row Axis, click on P_COST (in blue hypertext).
b) Under Selection Relationship choose Base Level.
c) Click the right arrow button to move the selection to Selected Members.
d) Similarly, click the left arrow button to remove the prior selection.
e) Choose OK.
5. Display the months and then 2011.Q1 in the columns.
a) On the lower right in the Column Axis, click on P_TIME (in blue hypertext).
b) Select 2011.Q1 by placing a checkbox to the left of the member.
c) Under Selection Relationship choose Member and Children.
d) Click the right arrow button to move the selection to Selected Members.
e) Similarly, click the left arrow button to remove the prior selection which isalready highlighted.
f) Choose OK.
Your worksheet should appear as follows:
Figure 223: Input Sheet
Continued on next page
2011 © 2011 SAP AG. All rights reserved. 349
SAP Class Week of April 16, 2012
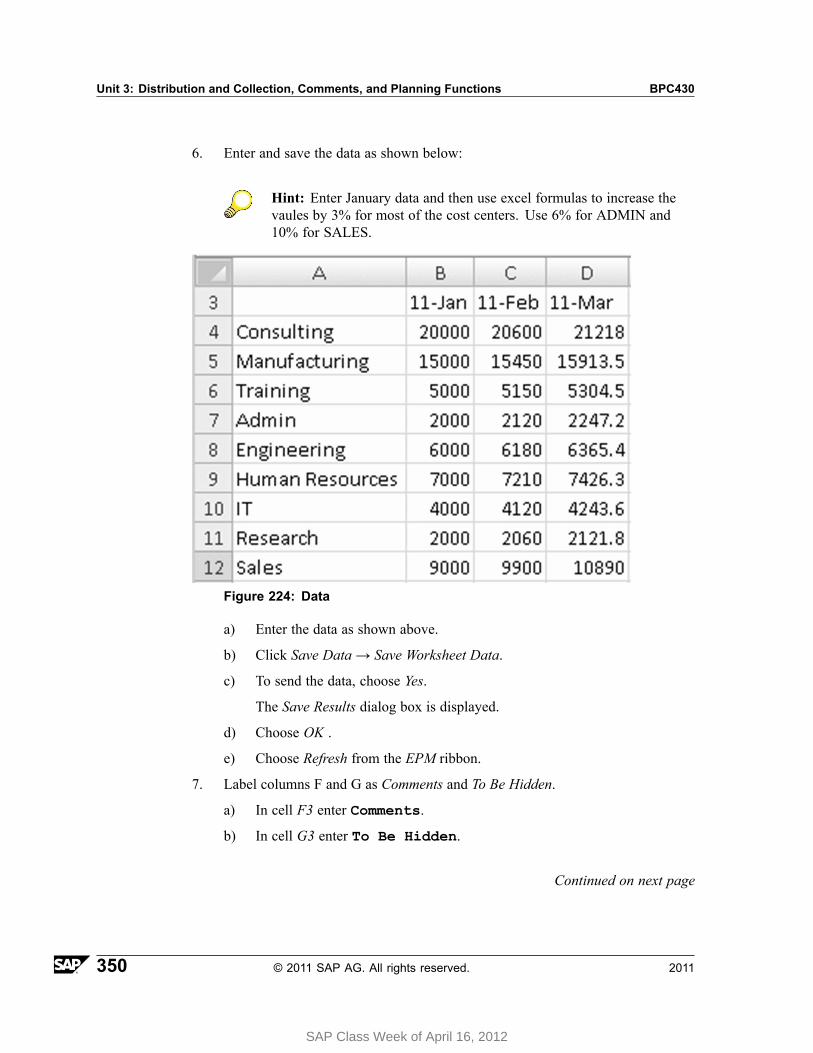
Unit 3: Distribution and Collection, Comments, and Planning Functions BPC430
6. Enter and save the data as shown below:
Hint: Enter January data and then use excel formulas to increase thevaules by 3% for most of the cost centers. Use 6% for ADMIN and10% for SALES.
Figure 224: Data
a) Enter the data as shown above.
b) Click Save Data → Save Worksheet Data.
c) To send the data, choose Yes.
The Save Results dialog box is displayed.
d) Choose OK .
e) Choose Refresh from the EPM ribbon.
7. Label columns F and G as Comments and To Be Hidden.
a) In cell F3 enter Comments.
b) In cell G3 enter To Be Hidden.
Continued on next page
350 © 2011 SAP AG. All rights reserved. 2011
SAP Class Week of April 16, 2012
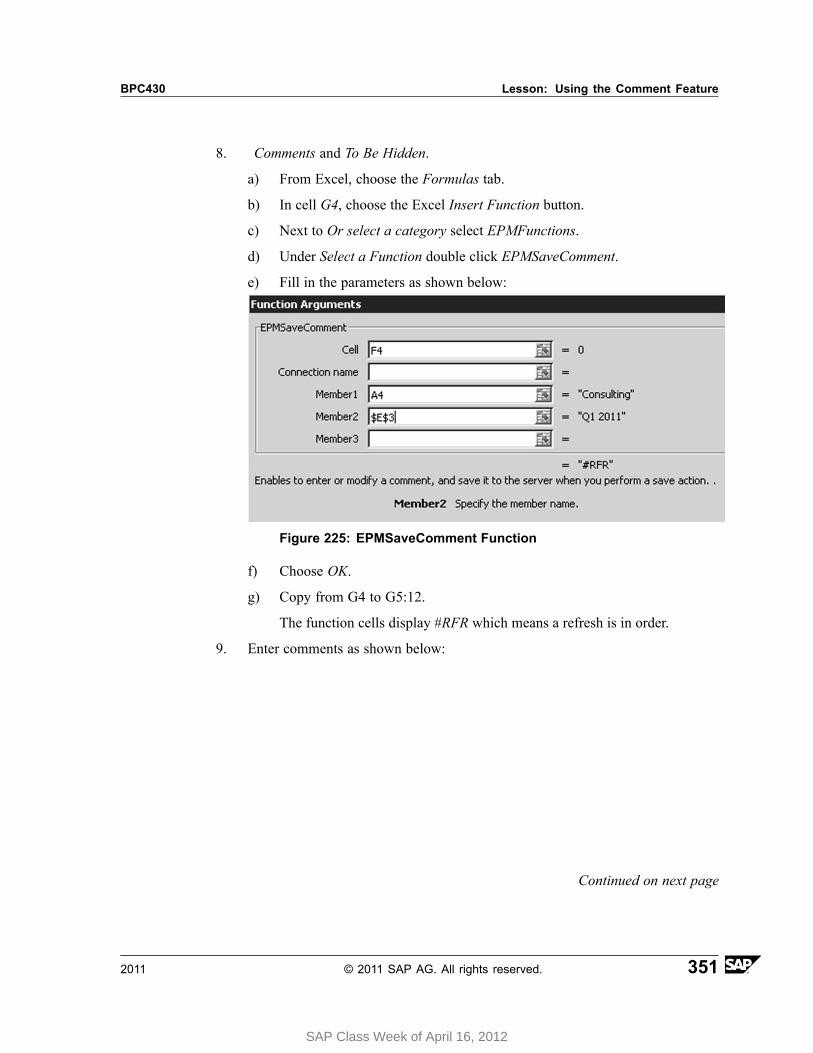
BPC430 Lesson: Using the Comment Feature
8. Comments and To Be Hidden.
a) From Excel, choose the Formulas tab.
b) In cell G4, choose the Excel Insert Function button.
c) Next to Or select a category select EPMFunctions.
d) Under Select a Function double click EPMSaveComment.
e) Fill in the parameters as shown below:
Figure 225: EPMSaveComment Function
f) Choose OK.
g) Copy from G4 to G5:12.
The function cells display #RFR which means a refresh is in order.
9. Enter comments as shown below:
Continued on next page
2011 © 2011 SAP AG. All rights reserved. 351
SAP Class Week of April 16, 2012
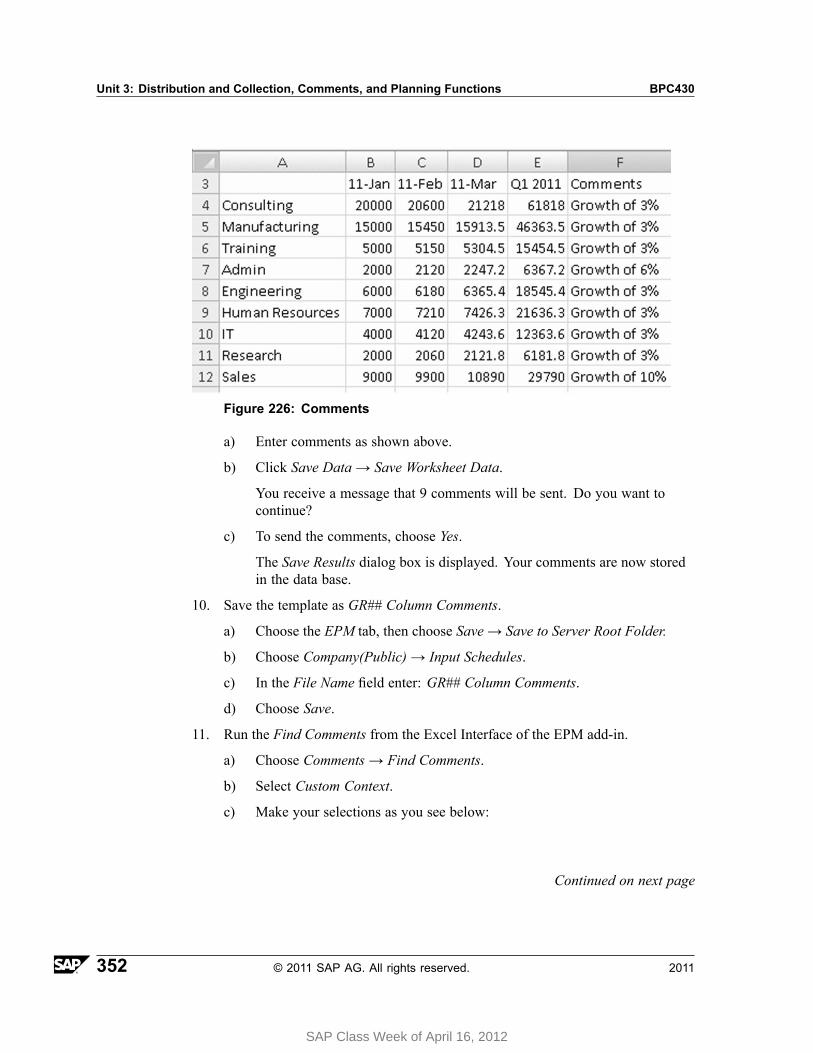
Unit 3: Distribution and Collection, Comments, and Planning Functions BPC430
Figure 226: Comments
a) Enter comments as shown above.
b) Click Save Data → Save Worksheet Data.
You receive a message that 9 comments will be sent. Do you want tocontinue?
c) To send the comments, choose Yes.
The Save Results dialog box is displayed. Your comments are now storedin the data base.
10. Save the template as GR## Column Comments.
a) Choose the EPM tab, then choose Save → Save to Server Root Folder.
b) Choose Company(Public) → Input Schedules.
c) In the File Name field enter: GR## Column Comments.
d) Choose Save.
11. Run the Find Comments from the Excel Interface of the EPM add-in.
a) Choose Comments → Find Comments.
b) Select Custom Context.
c) Make your selections as you see below:
Continued on next page
352 © 2011 SAP AG. All rights reserved. 2011
SAP Class Week of April 16, 2012
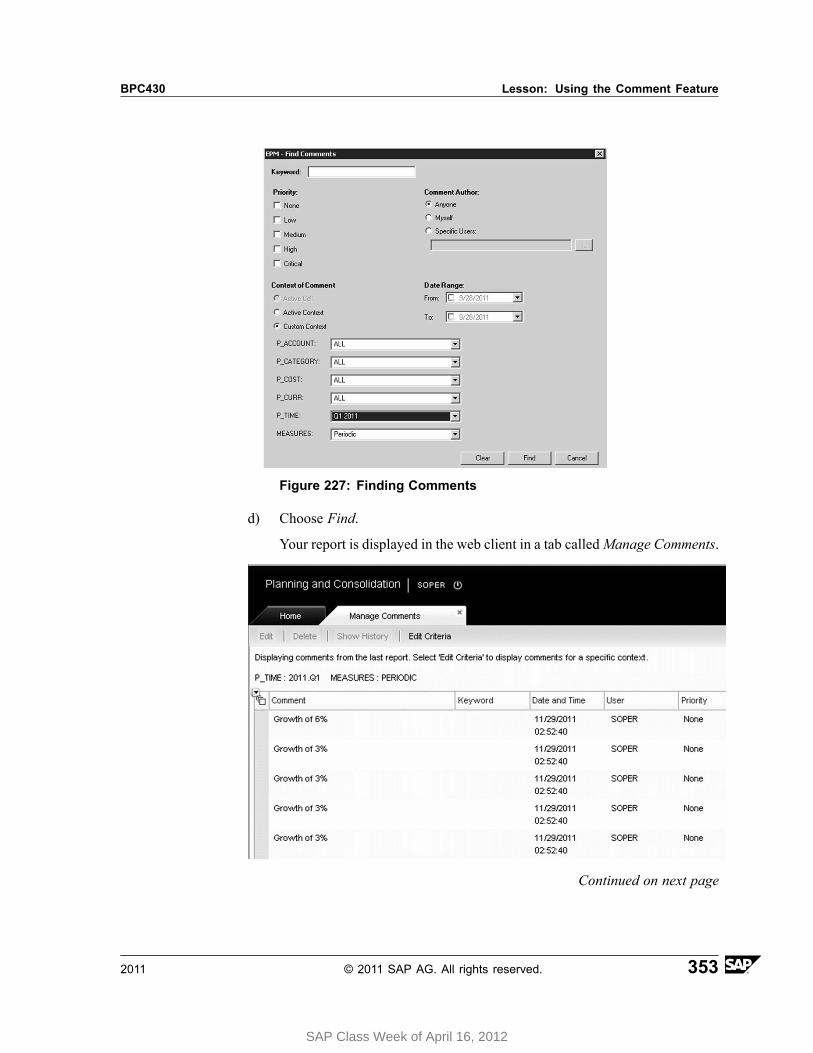
BPC430 Lesson: Using the Comment Feature
Figure 227: Finding Comments
d) Choose Find.
Your report is displayed in the web client in a tab calledManage Comments.
Continued on next page
2011 © 2011 SAP AG. All rights reserved. 353
SAP Class Week of April 16, 2012
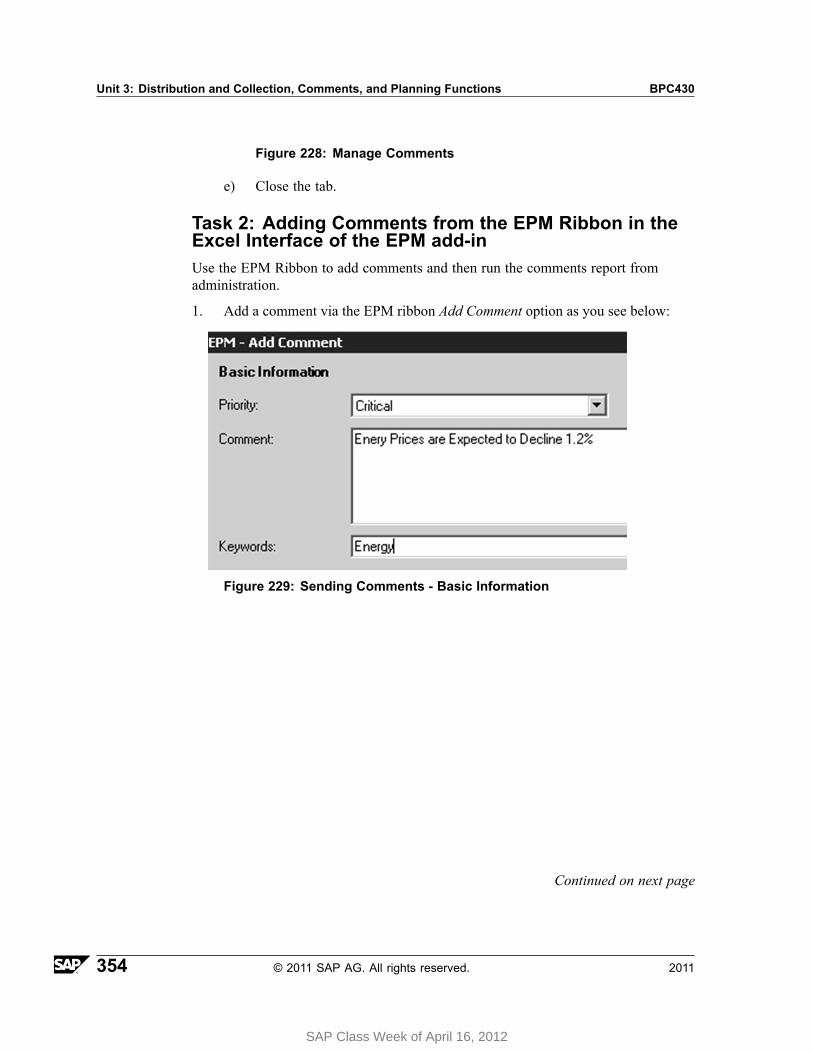
Unit 3: Distribution and Collection, Comments, and Planning Functions BPC430
Figure 228: Manage Comments
e) Close the tab.
Task 2: Adding Comments from the EPM Ribbon in theExcel Interface of the EPM add-inUse the EPM Ribbon to add comments and then run the comments report fromadministration.
1. Add a comment via the EPM ribbon Add Comment option as you see below:
Figure 229: Sending Comments - Basic Information
Continued on next page
354 © 2011 SAP AG. All rights reserved. 2011
SAP Class Week of April 16, 2012
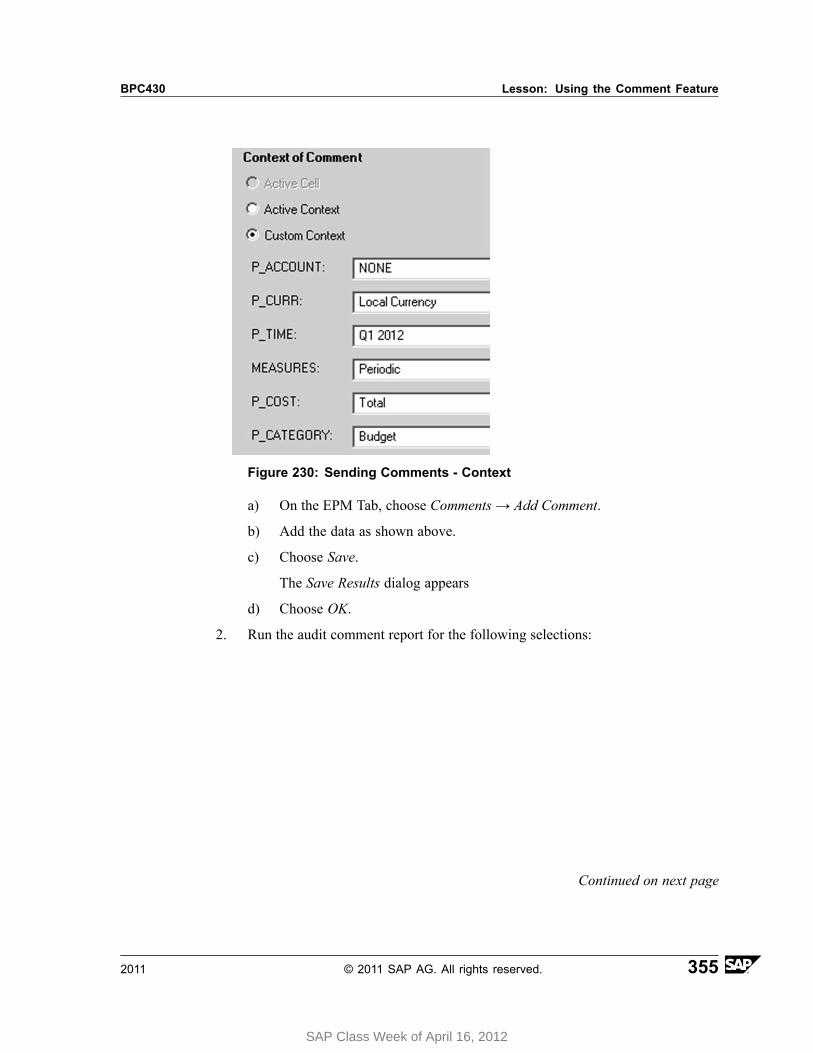
BPC430 Lesson: Using the Comment Feature
Figure 230: Sending Comments - Context
a) On the EPM Tab, choose Comments → Add Comment.
b) Add the data as shown above.
c) Choose Save.
The Save Results dialog appears
d) Choose OK.
2. Run the audit comment report for the following selections:
Continued on next page
2011 © 2011 SAP AG. All rights reserved. 355
SAP Class Week of April 16, 2012
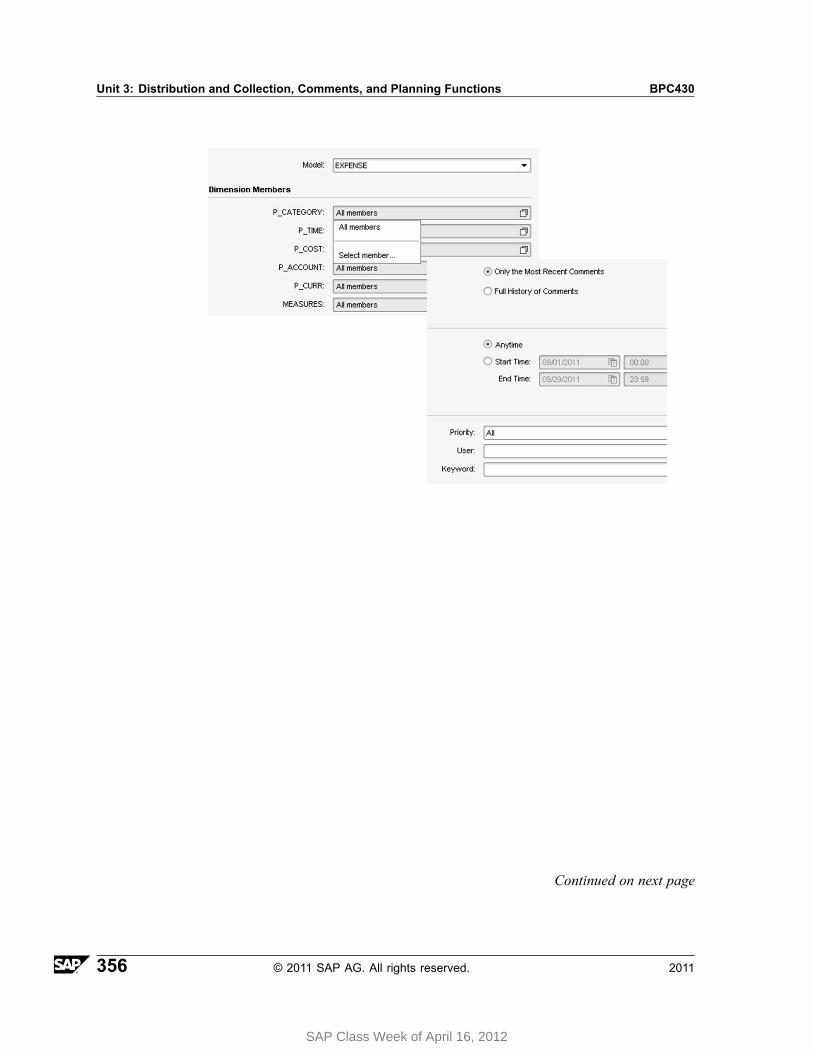
Unit 3: Distribution and Collection, Comments, and Planning Functions BPC430
Continued on next page
356 © 2011 SAP AG. All rights reserved. 2011
SAP Class Week of April 16, 2012
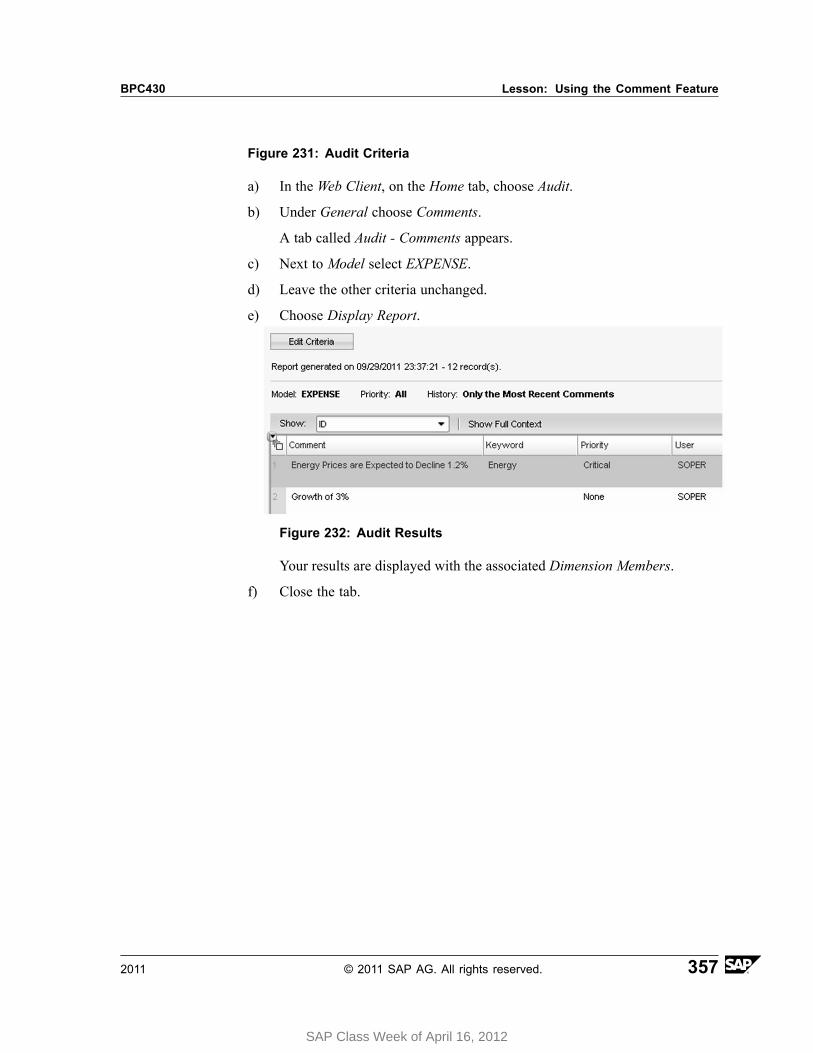
BPC430 Lesson: Using the Comment Feature
Figure 231: Audit Criteria
a) In the Web Client, on the Home tab, choose Audit.
b) Under General choose Comments.
A tab called Audit - Comments appears.
c) Next to Model select EXPENSE.
d) Leave the other criteria unchanged.
e) Choose Display Report.
Figure 232: Audit Results
Your results are displayed with the associated Dimension Members.
f) Close the tab.
2011 © 2011 SAP AG. All rights reserved. 357
SAP Class Week of April 16, 2012
Unit 3: Distribution and Collection, Comments, and Planning Functions BPC430
Lesson Summary
You should now be able to:• Describe the features of comments• Save comments with the EPMSaveComment function• Save comments with the ribbon command• Report on comments
358 © 2011 SAP AG. All rights reserved. 2011
SAP Class Week of April 16, 2012

BPC430 Lesson: Using the Spread, Trend, and Weight Manual Planning Functions
Lesson: Using the Spread, Trend, and Weight ManualPlanning Functions
Lesson OverviewIn this lesson, you will learn how to set up spread, trend, and weight.
Lesson ObjectivesAfter completing this lesson, you will be able to:
• Evaluate the features of spread, trend, and weight to see if they will meet someof your business requirements.
Business ExamplePlanners will occasionally have a need to easily manipulate their data in excel. Thespread, trend, and weight modeling options are built in functions in the EPM add-inthat you can use without any configuration or programming. They can be accessedfrom the EPM Ribbon under Planning.
SpreadThe spread feature enables you to take a value and allocate it among selecteddestination cells. The allocation can be equally or weighted by some range of values.For example, you can take the value 100 and spread it across a number of columnsthat represent each month of the year.
Spread
Field Purpose
Source Value Specifies the total to be spread
Destination Where the system writes the result of the spread
Weights Optional: A range containing weight values upon which tobase the spread
Spread Results Add to existing values or Overwrite existing values
2011 © 2011 SAP AG. All rights reserved. 359
SAP Class Week of April 16, 2012
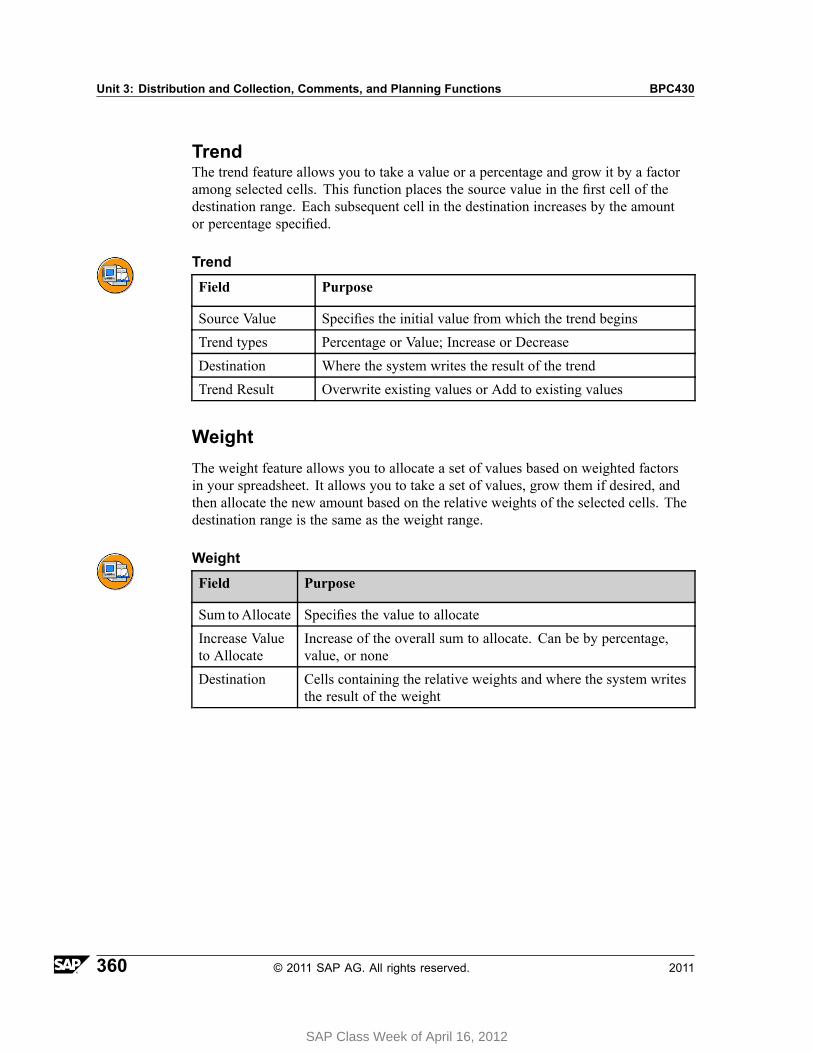
Unit 3: Distribution and Collection, Comments, and Planning Functions BPC430
TrendThe trend feature allows you to take a value or a percentage and grow it by a factoramong selected cells. This function places the source value in the first cell of thedestination range. Each subsequent cell in the destination increases by the amountor percentage specified.
Trend
Field Purpose
Source Value Specifies the initial value from which the trend begins
Trend types Percentage or Value; Increase or Decrease
Destination Where the system writes the result of the trend
Trend Result Overwrite existing values or Add to existing values
WeightThe weight feature allows you to allocate a set of values based on weighted factorsin your spreadsheet. It allows you to take a set of values, grow them if desired, andthen allocate the new amount based on the relative weights of the selected cells. Thedestination range is the same as the weight range.
Weight
Field Purpose
Sum toAllocate Specifies the value to allocate
Increase Valueto Allocate
Increase of the overall sum to allocate. Can be by percentage,value, or none
Destination Cells containing the relative weights and where the system writesthe result of the weight
360 © 2011 SAP AG. All rights reserved. 2011
SAP Class Week of April 16, 2012
BPC430 Lesson: Using the Spread, Trend, and Weight Manual Planning Functions
Exercise 14: Spread, Trend, And WeightExercise ObjectivesAfter completing this exercise, you will be able to:• Use the Spread Trend and Weight features to help you plan.
Business ExampleYou want to generate your planning data set using the spread, trend, and weightfeatures available in the EPM add-in.
Task 1:In this exercise, you will use the spread feature available for your input form withinthe EPM add-in.
1. Go to the Excel client for your Sales model in your BPC430_## environment.
Note: If you do not have a connection for the Sales model use theinstructions in Exercise #2 to create it.
2. Create a new blank workbook.
3. Set your EPM Context.
4. Create a report with the Product dimension in the Row Axis and Time in theColumn Axis. For the Product dimension, set the members to All Dog Products,member and children. For the Time dimension, set the member to 2012 Baselevel only.
5. Set your report to an input form.
6. Using a base value of 100 in January, use the spread feature to perform an equaldistribution of values into January, February, and March.
7. In this next scenario, we want to use the weights feature to do our spread.
For the product Ball with Cotton Ropes, spread 100 to January, February, andMarch, based on a 2, 3, 4 weighting factor.
Continued on next page
2011 © 2011 SAP AG. All rights reserved. 361
SAP Class Week of April 16, 2012
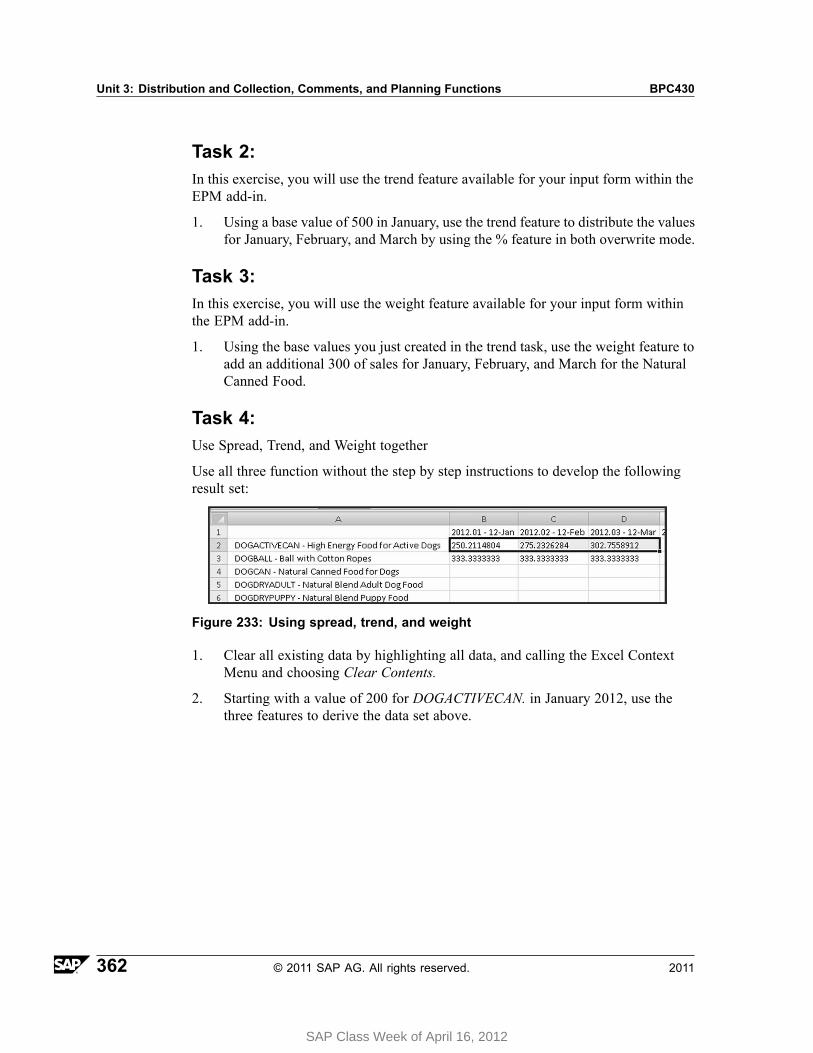
Unit 3: Distribution and Collection, Comments, and Planning Functions BPC430
Task 2:In this exercise, you will use the trend feature available for your input form within theEPM add-in.
1. Using a base value of 500 in January, use the trend feature to distribute the valuesfor January, February, and March by using the % feature in both overwrite mode.
Task 3:In this exercise, you will use the weight feature available for your input form withinthe EPM add-in.
1. Using the base values you just created in the trend task, use the weight feature toadd an additional 300 of sales for January, February, and March for the NaturalCanned Food.
Task 4:Use Spread, Trend, and Weight together
Use all three function without the step by step instructions to develop the followingresult set:
Figure 233: Using spread, trend, and weight
1. Clear all existing data by highlighting all data, and calling the Excel ContextMenu and choosing Clear Contents.
2. Starting with a value of 200 for DOGACTIVECAN. in January 2012, use thethree features to derive the data set above.
362 © 2011 SAP AG. All rights reserved. 2011
SAP Class Week of April 16, 2012

BPC430 Lesson: Using the Spread, Trend, and Weight Manual Planning Functions
Solution 14: Spread, Trend, And WeightTask 1:In this exercise, you will use the spread feature available for your input form withinthe EPM add-in.
1. Go to the Excel client for your Sales model in your BPC430_## environment.
Note: If you do not have a connection for the Sales model use theinstructions in Exercise #2 to create it.
a) From your web client's Start Page, choose EPM Office Add-in Excel.
Excel opens and the EPM - Connection Manager appears.
b) Choose the Sales - BPC430_## connection.
c) Click OK.
d) If you are prompted, log on again with your user ID and password asshown below:
User ID Password
BPC-## training
2. Create a new blank workbook.
a) Create a blank workbook by choosing the Office button and choose New.
b) Choose Create.
Continued on next page
2011 © 2011 SAP AG. All rights reserved. 363
SAP Class Week of April 16, 2012

Unit 3: Distribution and Collection, Comments, and Planning Functions BPC430
3. Set your EPM Context.
a) Set your EPM Context to the following:
Dimension Member ID - Description
CATEGORY FLASH - Current Flash
ENTITY STORE1 - Store1
PRODUCT DOG - All Dog Products
P_ACCT EXTSALES - External Sales
RPTCURRENCY LC - Local Currency
TIME 2012.TOTAL - 2012
MEASURES PERIODIC - Periodic
Note: You may have to scroll down to see all of your dimensions.
Continued on next page
364 © 2011 SAP AG. All rights reserved. 2011
SAP Class Week of April 16, 2012
BPC430 Lesson: Using the Spread, Trend, and Weight Manual Planning Functions
4. Create a report with the Product dimension in the Row Axis and Time in theColumn Axis. For the Product dimension, set the members to All Dog Products,member and children. For the Time dimension, set the member to 2012 Baselevel only.
a) From the EPM Ribbon, choose New Report.
The EPM - Report Editor window opens on the Layout tab by default.
b) Right-click the Product dimension and select Move to Row Axis.
c) Right-click Time dimension and select Move to Column Axis.
d) In the Column Axis, open the EPM - Member Selector by clicking on theTime dimension.
The EPM - Member Selector window opens.
e) Move the Selected Members Context 2012.TOTAL - 2012, withthe Relationship Member and Children to the left.
f) Choose 2012.TOTAL - 2012 by placing a checkbox to the left of themember. On the bottom left, set your Selection Relationship to BaseLevel. Move this selection to the right under Selected Members byusing the arrow.
g) Choose OK to close the EPM - Member Selector.
h) In the Row Axis, open the EPM - Member Selector by clicking on theProduct dimension.
The EPM - Member Selector window opens.
i) Set the Member Names to Display ID
j) Choose OK to close the EPM - Member Selector.
k) Choose OK to close the EPM - Report Editor.
The Report is executed.
5. Set your report to an input form.
a) From the EPM Ribbon, go to Options → Sheet Options.
The EPM - Sheet Options window opens.
b) On the General tab, under Data Input select the checkbox next to Useas Input Form.
c) Choose OK.
Continued on next page
2011 © 2011 SAP AG. All rights reserved. 365
SAP Class Week of April 16, 2012
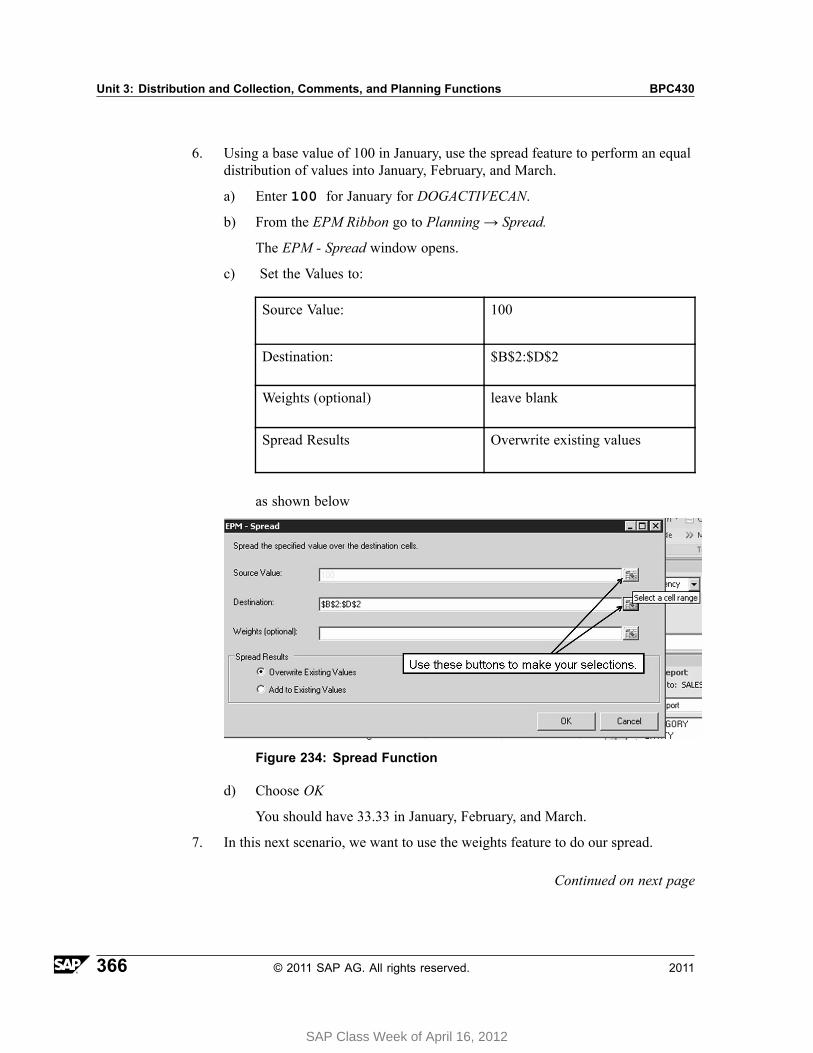
Unit 3: Distribution and Collection, Comments, and Planning Functions BPC430
6. Using a base value of 100 in January, use the spread feature to perform an equaldistribution of values into January, February, and March.
a) Enter 100 for January for DOGACTIVECAN.
b) From the EPM Ribbon go to Planning → Spread.
The EPM - Spread window opens.
c) Set the Values to:
Source Value: 100
Destination: $B$2:$D$2
Weights (optional) leave blank
Spread Results Overwrite existing values
as shown below
Figure 234: Spread Function
d) Choose OK
You should have 33.33 in January, February, and March.
7. In this next scenario, we want to use the weights feature to do our spread.
Continued on next page
366 © 2011 SAP AG. All rights reserved. 2011
SAP Class Week of April 16, 2012
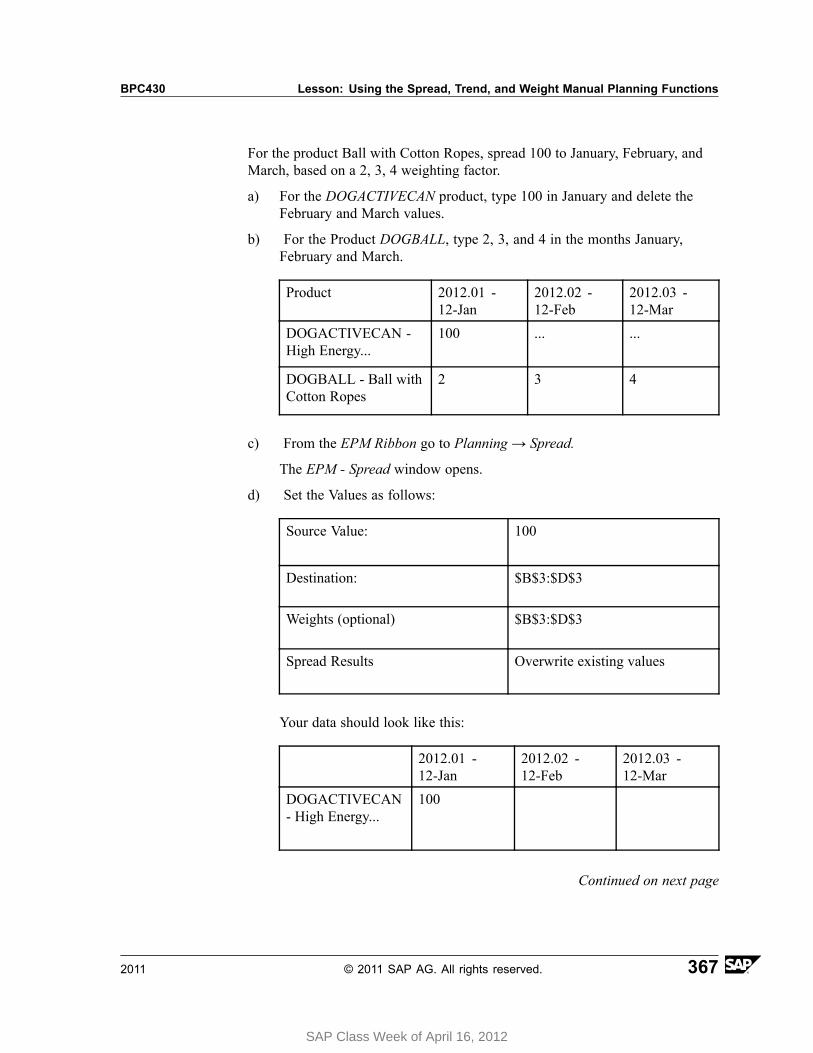
BPC430 Lesson: Using the Spread, Trend, and Weight Manual Planning Functions
For the product Ball with Cotton Ropes, spread 100 to January, February, andMarch, based on a 2, 3, 4 weighting factor.
a) For the DOGACTIVECAN product, type 100 in January and delete theFebruary and March values.
b) For the Product DOGBALL, type 2, 3, and 4 in the months January,February and March.
Product 2012.01 -12-Jan
2012.02 -12-Feb
2012.03 -12-Mar
DOGACTIVECAN -High Energy...
100 ... ...
DOGBALL - Ball withCotton Ropes
2 3 4
c) From the EPM Ribbon go to Planning → Spread.
The EPM - Spread window opens.
d) Set the Values as follows:
Source Value: 100
Destination: $B$3:$D$3
Weights (optional) $B$3:$D$3
Spread Results Overwrite existing values
Your data should look like this:
2012.01 -12-Jan
2012.02 -12-Feb
2012.03 -12-Mar
DOGACTIVECAN- High Energy...
100
Continued on next page
2011 © 2011 SAP AG. All rights reserved. 367
SAP Class Week of April 16, 2012
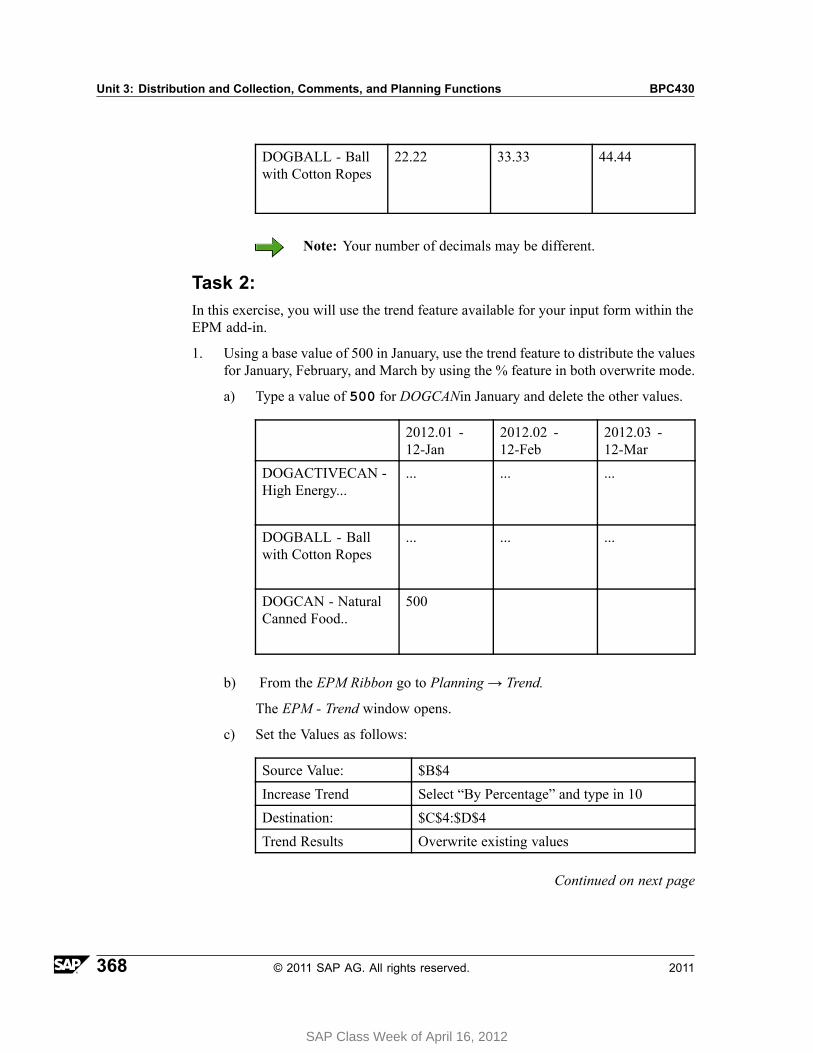
Unit 3: Distribution and Collection, Comments, and Planning Functions BPC430
DOGBALL - Ballwith Cotton Ropes
22.22 33.33 44.44
Note: Your number of decimals may be different.
Task 2:In this exercise, you will use the trend feature available for your input form within theEPM add-in.
1. Using a base value of 500 in January, use the trend feature to distribute the valuesfor January, February, and March by using the % feature in both overwrite mode.
a) Type a value of 500 for DOGCANin January and delete the other values.
2012.01 -12-Jan
2012.02 -12-Feb
2012.03 -12-Mar
DOGACTIVECAN -High Energy...
... ... ...
DOGBALL - Ballwith Cotton Ropes
... ... ...
DOGCAN - NaturalCanned Food..
500
b) From the EPM Ribbon go to Planning → Trend.
The EPM - Trend window opens.
c) Set the Values as follows:
Source Value: $B$4
Increase Trend Select “By Percentage” and type in 10
Destination: $C$4:$D$4
Trend Results Overwrite existing values
Continued on next page
368 © 2011 SAP AG. All rights reserved. 2011
SAP Class Week of April 16, 2012
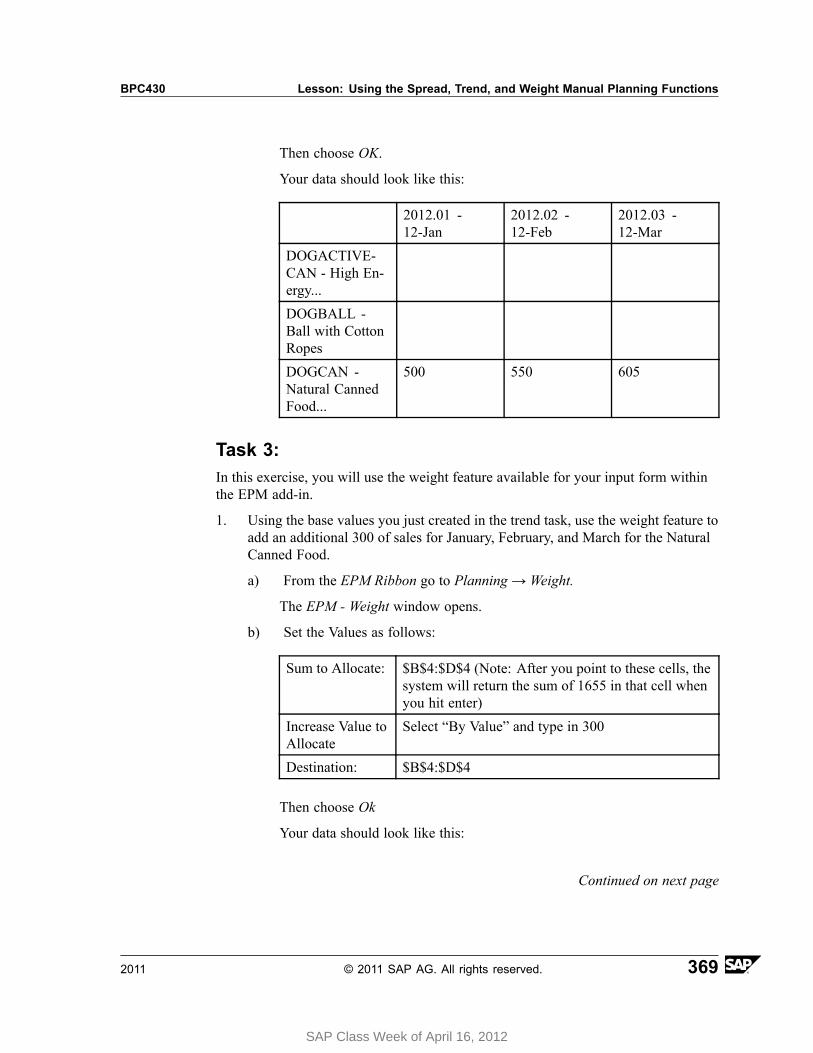
BPC430 Lesson: Using the Spread, Trend, and Weight Manual Planning Functions
Then choose OK.
Your data should look like this:
2012.01 -12-Jan
2012.02 -12-Feb
2012.03 -12-Mar
DOGACTIVE-CAN - High En-ergy...
DOGBALL -Ball with CottonRopes
DOGCAN -Natural CannedFood...
500 550 605
Task 3:In this exercise, you will use the weight feature available for your input form withinthe EPM add-in.
1. Using the base values you just created in the trend task, use the weight feature toadd an additional 300 of sales for January, February, and March for the NaturalCanned Food.
a) From the EPM Ribbon go to Planning → Weight.
The EPM - Weight window opens.
b) Set the Values as follows:
Sum to Allocate: $B$4:$D$4 (Note: After you point to these cells, thesystem will return the sum of 1655 in that cell whenyou hit enter)
Increase Value toAllocate
Select “By Value” and type in 300
Destination: $B$4:$D$4
Then choose Ok
Your data should look like this:
Continued on next page
2011 © 2011 SAP AG. All rights reserved. 369
SAP Class Week of April 16, 2012

Unit 3: Distribution and Collection, Comments, and Planning Functions BPC430
2012.01 -12-Jan
2012.02 -12-Feb
2012.03 -12-Mar
DOGACTIVE-CAN - High En-ergy...
DOGBALL - Ballwith Cotton Ropes
DOGCAN -Natural CannedFood...
590.63 649.69 714.66
Note: Your number of decimals may be different.
Task 4:Use Spread, Trend, and Weight together
Use all three function without the step by step instructions to develop the followingresult set:
Figure 235: Using spread, trend, and weight
1. Clear all existing data by highlighting all data, and calling the Excel ContextMenu and choosing Clear Contents.
a) Highlight all data. Right mouse click and choose Clear Data.
2. Starting with a value of 200 for DOGACTIVECAN. in January 2012, use thethree features to derive the data set above.
a) Use the Trend function for DOGACTIVECAN to increase sales by 10%.
b) Use the Spread function for DOGBALL to allocate 1000 in sales equally.
c) Use the Weight function to add an additional 100 in sales toDOGACTIVECAN.
370 © 2011 SAP AG. All rights reserved. 2011
SAP Class Week of April 16, 2012

BPC430 Lesson: Using the Spread, Trend, and Weight Manual Planning Functions
Lesson Summary
You should now be able to:• Evaluate the features of spread, trend, and weight to see if they will meet some
of your business requirements.
2011 © 2011 SAP AG. All rights reserved. 371
SAP Class Week of April 16, 2012
Unit Summary BPC430
Unit SummaryYou should now be able to:• Distribute static reports to file directories• Distribute static reports via e-mail• Collect off line data• Describe the features of comments• Save comments with the EPMSaveComment function• Save comments with the ribbon command• Report on comments• Evaluate the features of spread, trend, and weight to see if they will meet some
of your business requirements.
372 © 2011 SAP AG. All rights reserved. 2011
SAP Class Week of April 16, 2012

SAP Class Week of April 16, 2012

SAP Class Week of April 16, 2012

Unit Summary BPC430
373 © 2011 SAP AG. All rights reserved. 2011
SAP Class Week of April 16, 2012

Unit Summary BPC430
374 © 2011 SAP AG. All rights reserved. 2011
SAP Class Week of April 16, 2012
Unit 4Business Process Flows
Unit OverviewThis unit covers Business Process Flows.
Unit ObjectivesAfter completing this unit, you will be able to:
• Create a Business Process Flow• Run a Business Process Flow
Unit ContentsLesson: Creating Planning Business Process Flows ... . . . . . . . . . . . . . . . . . . . . . . .376
Procedure: Adding Hyperlinks ... . . . . . . . . . . . . . . . . . . . . . . . . . . . . . . . . . . . . . . . . . . . . .387Exercise 15: Create a Business Process Flow for Planning... . . . . . . . . . . .395
2011 © 2011 SAP AG. All rights reserved. 375
SAP Class Week of April 16, 2012

Unit 4: Business Process Flows BPC430
Lesson: Creating Planning Business Process Flows
Lesson OverviewIn this lesson, you will learn how to create a Business Process Flow.
Lesson ObjectivesAfter completing this lesson, you will be able to:
• Create a Business Process Flow• Run a Business Process Flow
Business ExampleYou are considering the use of a Business Process Flow on your project, so you needto know how to build and use it.
Key Features of Business Process FlowsTo decide whether to use a Business Process Flow, you need to know what the benefitsare as well as the cost to implement and maintain.
376 © 2011 SAP AG. All rights reserved. 2011
SAP Class Week of April 16, 2012

BPC430 Lesson: Creating Planning Business Process Flows
The Benefits and Costs of Business Process Flows are shown below:
• Benefits:
– Helps with coordination– Web based User Interface / Launchpad– Status and tracking– Guided navigation– E-mail notifications– Steps can be reopened– Steps can be reviewed by higher authorities– Built in Monitor– Delivered detailed reports– Work Status integration– Real time simulations in build mode– Users can save workspaces during execution
• Costs:
– Has to be designed and configured– Has to be maintained– Has to be supported by the help desk– Users cannot be forced to use the Business Process Flow user interface
2011 © 2011 SAP AG. All rights reserved. 377
SAP Class Week of April 16, 2012
Unit 4: Business Process Flows BPC430
Key Terms
• Process Template - A sequential grouping of activities to complete a process• Activities - The activities for which the logged-on user can perform• Activity Regions - The members that an activity is executed by• Process Instance - An iteration of a business process flow template that is in
active use• Process monitor - Users who can monitor the instances of a template• Performer - A User(s) or Team assigned to a Dimension. Performers can
complete or submit (for approval) activities for example.• Reviewer - A User(s) or Team assigned to a Dimension. Reviewers approve
or reject submitted activities.• Workspace - A tab in the Web Interface with links to activities• Hyperlink - A link in a workspace which defines the action that occurs when
chosen
Business Process Flow ActivitiesIn this section, you will learn how to use Activities.
From the Home tab, go to Activities. The upper area renders all processes that you areinvolved in. The lower area renders the activities for that process.
Note: By choosing an activity, you can use the Actions button to changethe status to complete for example.
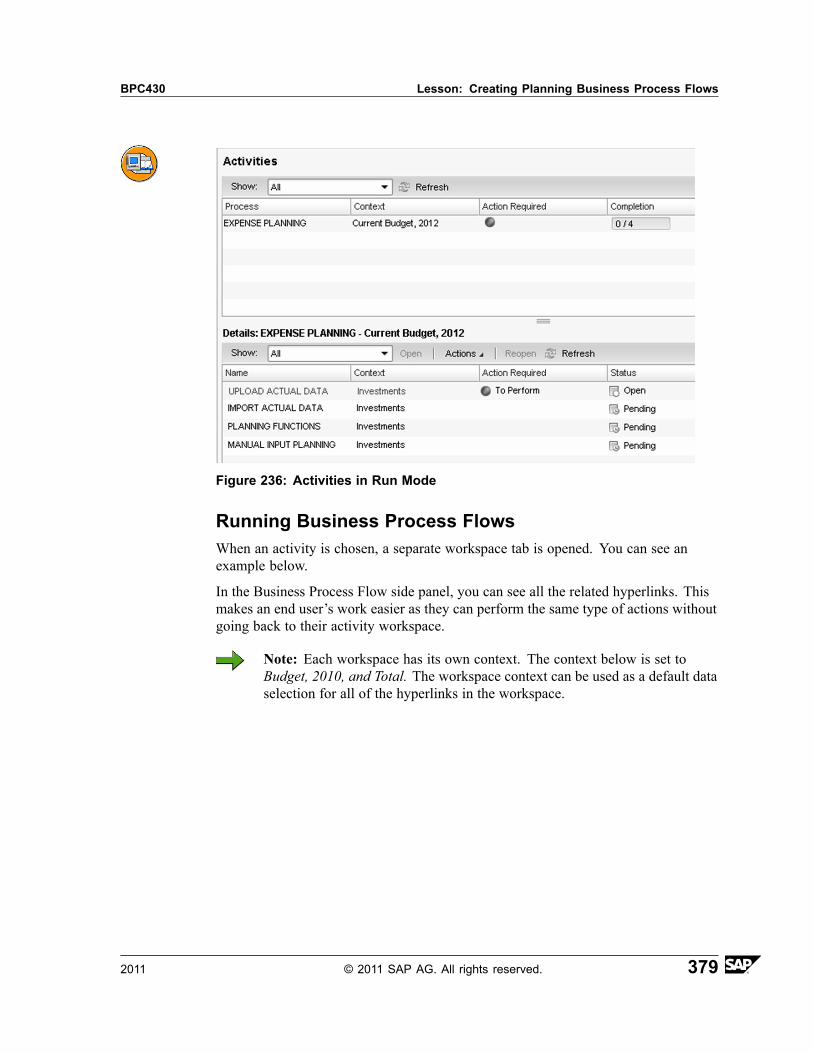
BPC430 Lesson: Creating Planning Business Process Flows
Figure 236: Activities in Run Mode
Running Business Process FlowsWhen an activity is chosen, a separate workspace tab is opened. You can see anexample below.
In the Business Process Flow side panel, you can see all the related hyperlinks. Thismakes an end user’s work easier as they can perform the same type of actions withoutgoing back to their activity workspace.
Note: Each workspace has its own context. The context below is set toBudget, 2010, and Total. The workspace context can be used as a default dataselection for all of the hyperlinks in the workspace.
2011 © 2011 SAP AG. All rights reserved. 379
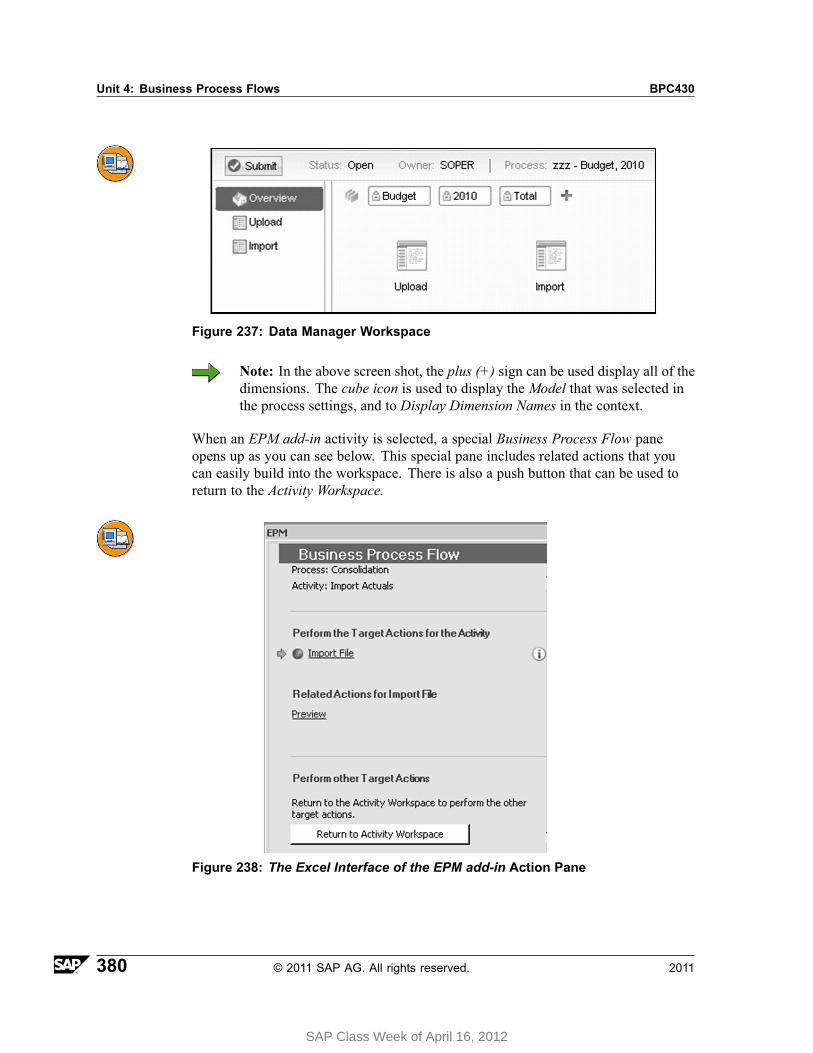
Unit 4: Business Process Flows BPC430
Figure 237: Data Manager Workspace
Note: In the above screen shot, the plus (+) sign can be used display all of thedimensions. The cube icon is used to display the Model that was selected inthe process settings, and to Display Dimension Names in the context.
When an EPM add-in activity is selected, a special Business Process Flow paneopens up as you can see below. This special pane includes related actions that youcan easily build into the workspace. There is also a push button that can be used toreturn to the Activity Workspace.
Figure 238: The Excel Interface of the EPM add-in Action Pane
380 © 2011 SAP AG. All rights reserved. 2011
SAP Class Week of April 16, 2012
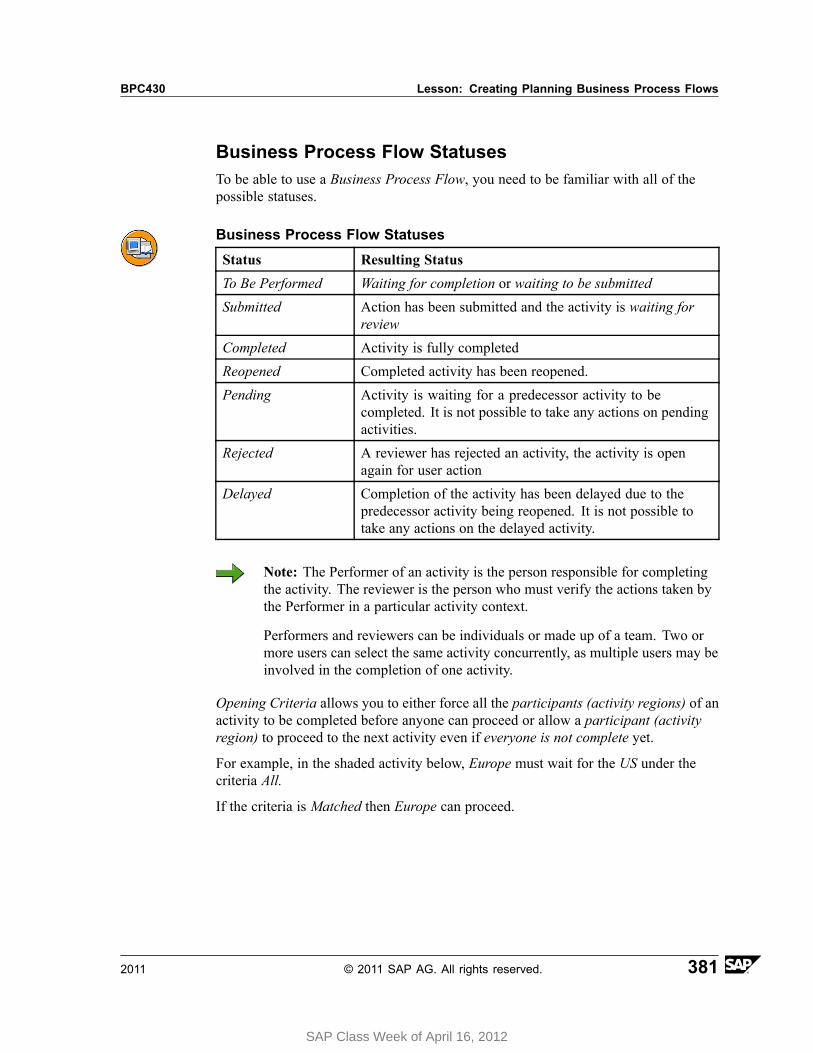
BPC430 Lesson: Creating Planning Business Process Flows
Business Process Flow StatusesTo be able to use a Business Process Flow, you need to be familiar with all of thepossible statuses.
Business Process Flow Statuses
Status Resulting Status
To Be Performed Waiting for completion or waiting to be submitted
Submitted Action has been submitted and the activity is waiting forreview
Completed Activity is fully completed
Reopened Completed activity has been reopened.
Pending Activity is waiting for a predecessor activity to becompleted. It is not possible to take any actions on pendingactivities.
Rejected A reviewer has rejected an activity, the activity is openagain for user action
Delayed Completion of the activity has been delayed due to thepredecessor activity being reopened. It is not possible totake any actions on the delayed activity.
Note: The Performer of an activity is the person responsible for completingthe activity. The reviewer is the person who must verify the actions taken bythe Performer in a particular activity context.
Performers and reviewers can be individuals or made up of a team. Two ormore users can select the same activity concurrently, as multiple users may beinvolved in the completion of one activity.
Opening Criteria allows you to either force all the participants (activity regions) of anactivity to be completed before anyone can proceed or allow a participant (activityregion) to proceed to the next activity even if everyone is not complete yet.
For example, in the shaded activity below, Europe must wait for the US under thecriteria All.
If the criteria is Matched then Europe can proceed.
2011 © 2011 SAP AG. All rights reserved. 381
SAP Class Week of April 16, 2012
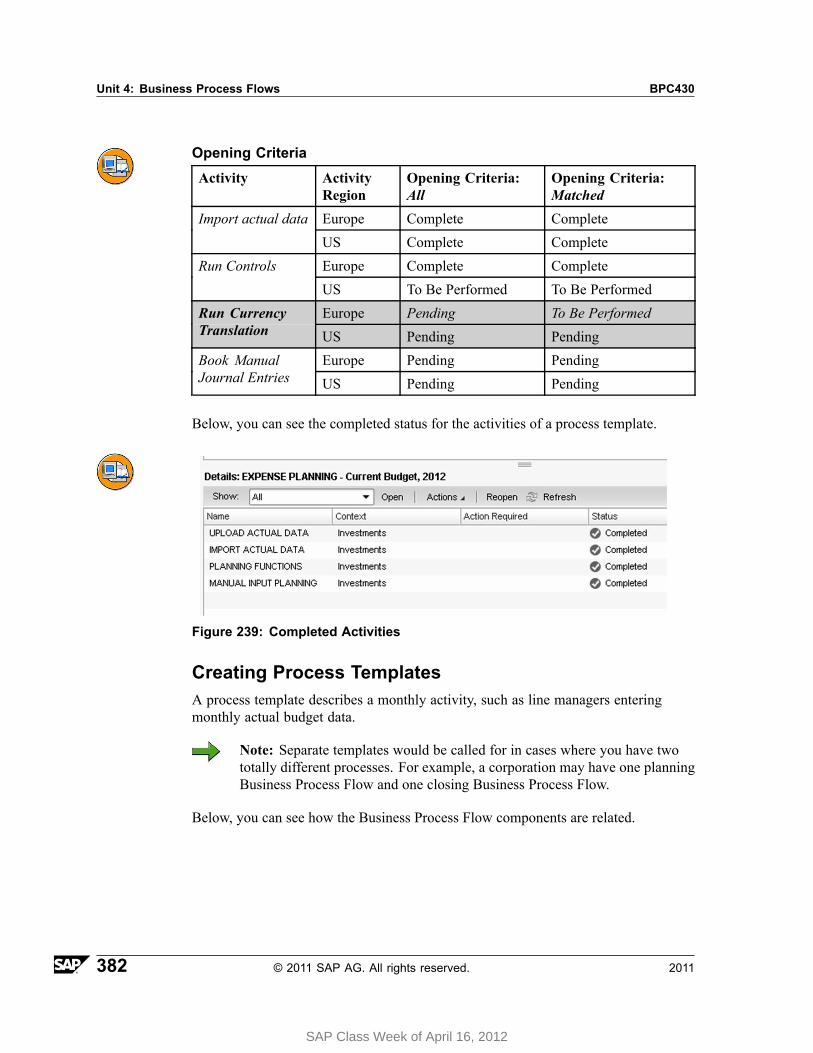
Unit 4: Business Process Flows BPC430
Opening Criteria
Activity ActivityRegion
Opening Criteria:All
Opening Criteria:Matched
Europe Complete CompleteImport actual data
US Complete Complete
Europe Complete CompleteRun Controls
US To Be Performed To Be Performed
Europe Pending To Be PerformedRun CurrencyTranslation US Pending Pending
Europe Pending PendingBook ManualJournal Entries US Pending Pending
Below, you can see the completed status for the activities of a process template.
Figure 239: Completed Activities
Creating Process TemplatesA process template describes a monthly activity, such as line managers enteringmonthly actual budget data.
Note: Separate templates would be called for in cases where you have twototally different processes. For example, a corporation may have one planningBusiness Process Flow and one closing Business Process Flow.
Below, you can see how the Business Process Flow components are related.
382 © 2011 SAP AG. All rights reserved. 2011
SAP Class Week of April 16, 2012
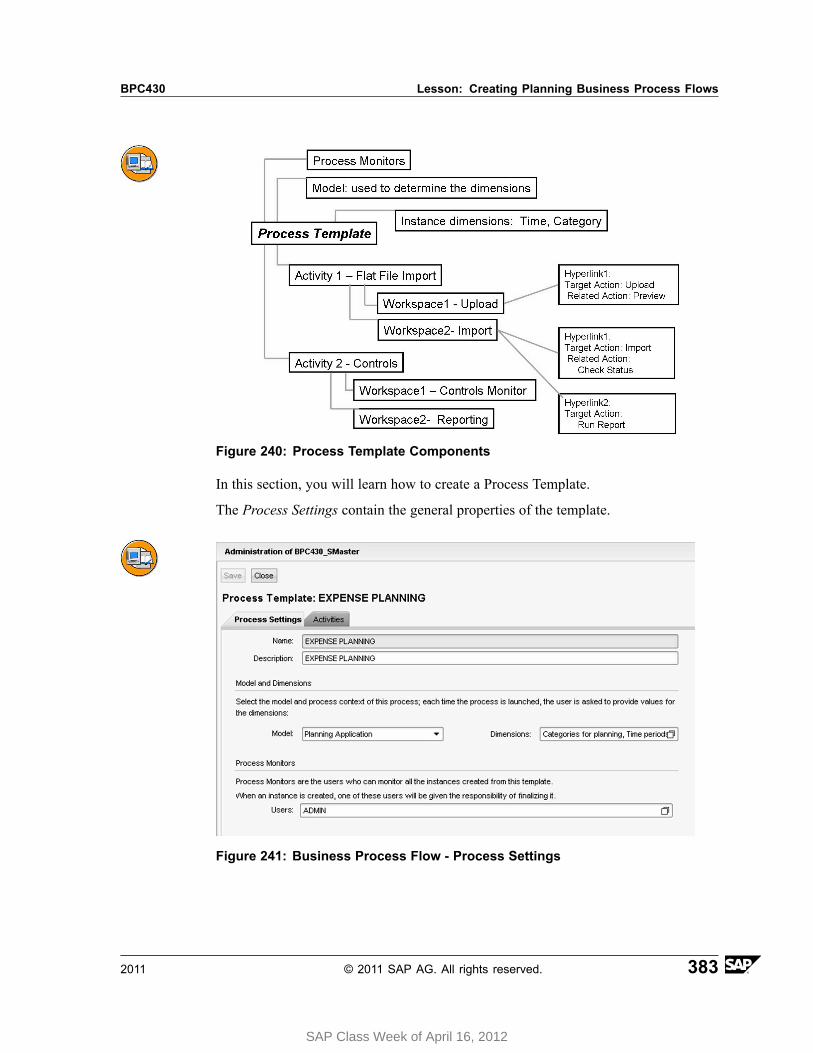
BPC430 Lesson: Creating Planning Business Process Flows
Figure 240: Process Template Components
In this section, you will learn how to create a Process Template.
The Process Settings contain the general properties of the template.
Figure 241: Business Process Flow - Process Settings
2011 © 2011 SAP AG. All rights reserved. 383
SAP Class Week of April 16, 2012
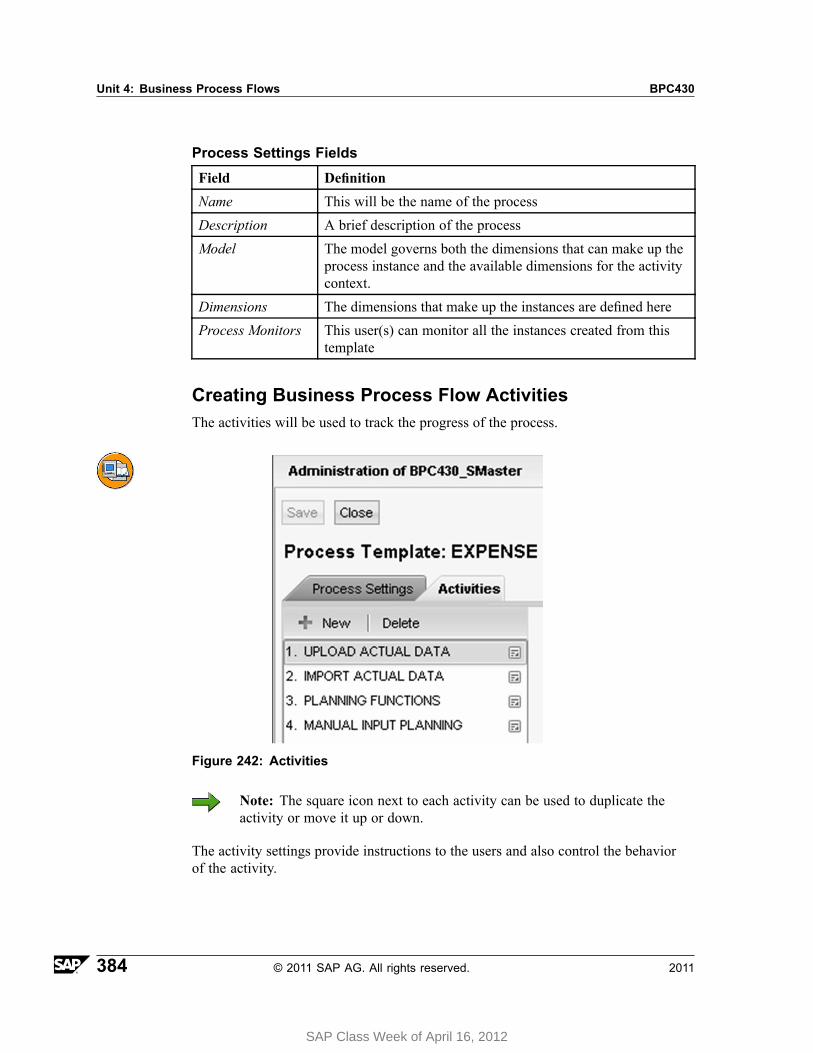
Unit 4: Business Process Flows BPC430
Process Settings Fields
Field Definition
Name This will be the name of the process
Description A brief description of the process
Model The model governs both the dimensions that can make up theprocess instance and the available dimensions for the activitycontext.
Dimensions The dimensions that make up the instances are defined here
Process Monitors This user(s) can monitor all the instances created from thistemplate
Creating Business Process Flow ActivitiesThe activities will be used to track the progress of the process.
Figure 242: Activities
Note: The square icon next to each activity can be used to duplicate theactivity or move it up or down.
The activity settings provide instructions to the users and also control the behaviorof the activity.
384 © 2011 SAP AG. All rights reserved. 2011
SAP Class Week of April 16, 2012
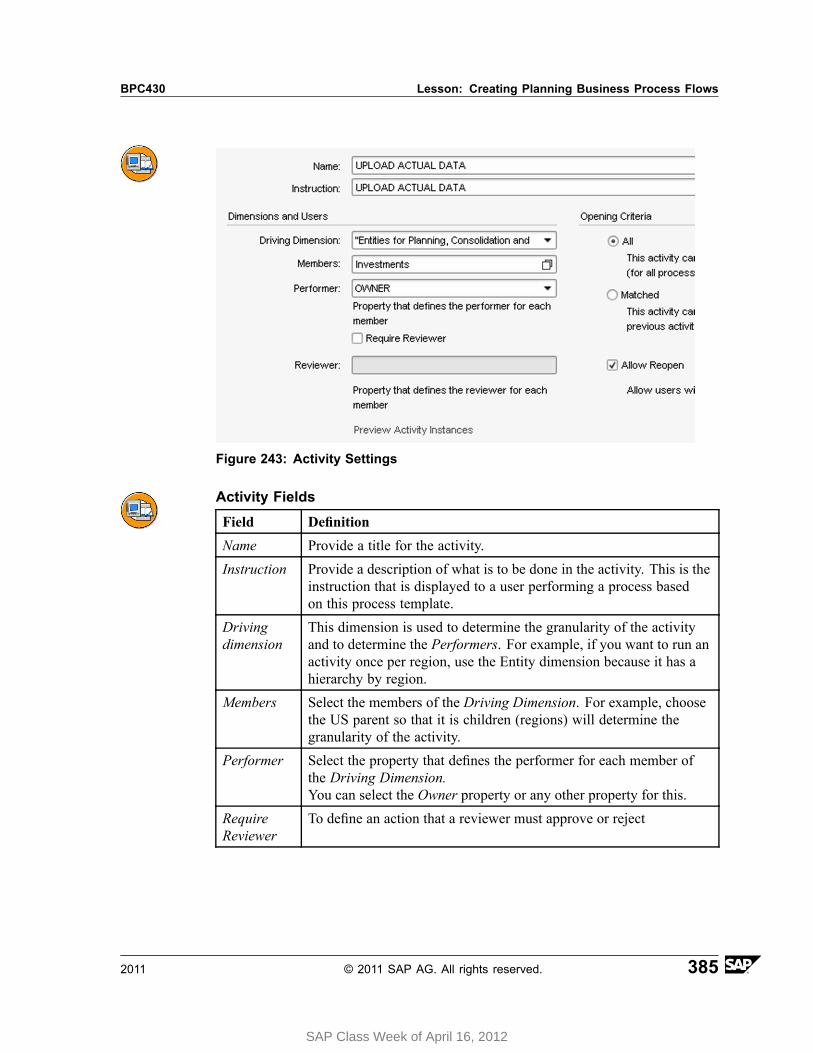
BPC430 Lesson: Creating Planning Business Process Flows
Figure 243: Activity Settings
Activity Fields
Field Definition
Name Provide a title for the activity.
Instruction Provide a description of what is to be done in the activity. This is theinstruction that is displayed to a user performing a process basedon this process template.
Drivingdimension
This dimension is used to determine the granularity of the activityand to determine the Performers. For example, if you want to run anactivity once per region, use the Entity dimension because it has ahierarchy by region.
Members Select the members of the Driving Dimension. For example, choosethe US parent so that it is children (regions) will determine thegranularity of the activity.
Performer Select the property that defines the performer for each member ofthe Driving Dimension.You can select the Owner property or any other property for this.
RequireReviewer
To define an action that a reviewer must approve or reject
2011 © 2011 SAP AG. All rights reserved. 385
SAP Class Week of April 16, 2012
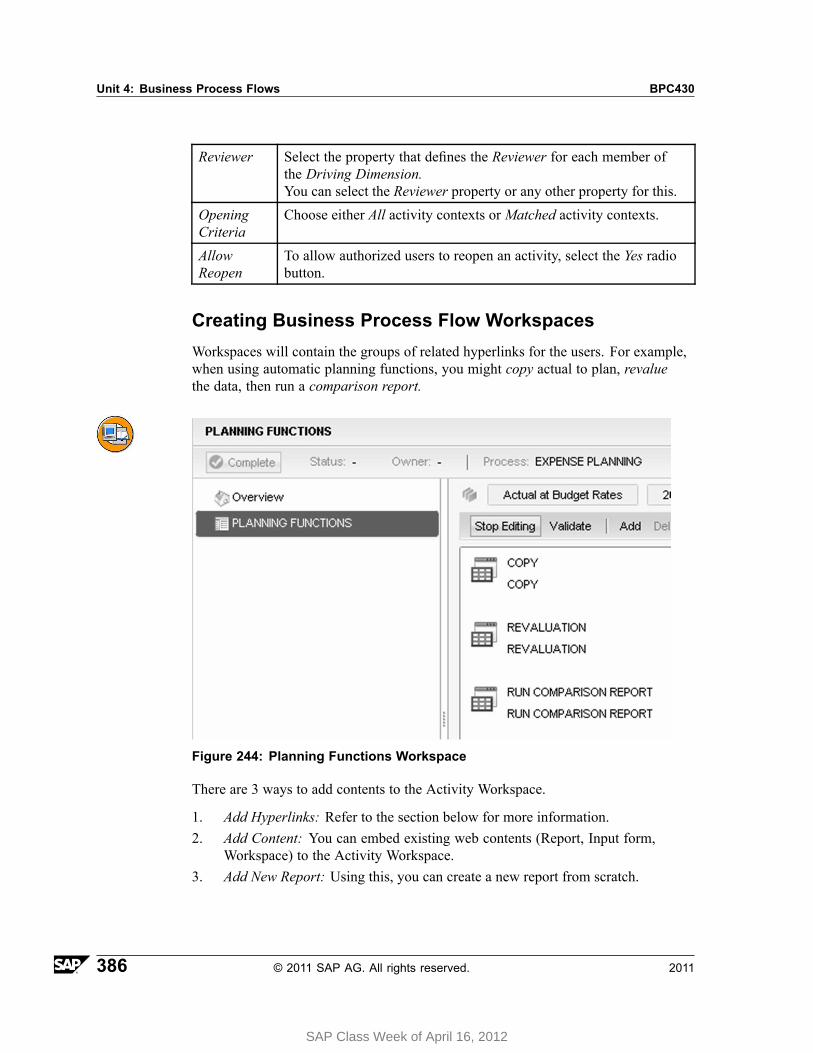
Unit 4: Business Process Flows BPC430
Reviewer Select the property that defines the Reviewer for each member ofthe Driving Dimension.You can select the Reviewer property or any other property for this.
OpeningCriteria
Choose either All activity contexts or Matched activity contexts.
AllowReopen
To allow authorized users to reopen an activity, select the Yes radiobutton.
Creating Business Process Flow WorkspacesWorkspaces will contain the groups of related hyperlinks for the users. For example,when using automatic planning functions, you might copy actual to plan, revaluethe data, then run a comparison report.
Figure 244: Planning Functions Workspace
There are 3 ways to add contents to the Activity Workspace.
1. Add Hyperlinks: Refer to the section below for more information.2. Add Content: You can embed existing web contents (Report, Input form,
Workspace) to the Activity Workspace.3. Add New Report: Using this, you can create a new report from scratch.
386 © 2011 SAP AG. All rights reserved. 2011
SAP Class Week of April 16, 2012

BPC430 Lesson: Creating Planning Business Process Flows
Adding Hyperlinks
1. Add new hyperlinks by clicking the Add Hyperlinks button.
A new hyperlinks view is added in the left side panel, and in the main canvas, anew Hyperlink is added.
2. Set the properties in the Edit Hyperlink pane on the right-hand side.
3. Click the Browse button to navigate to a desired report for example.
4. Click the Save button to save the hyperlink.
5. Save the Process Template.
Creating Business Process Flow HyperlinksHyperlinks contain the actions, Model, context, and related actions.
Figure 245: Upload File Hyperlink
Note: You can simulate hyperlinks at design-time. Click Stop Editing, thenthe name of hyperlink becomes available just like at run time.
2011 © 2011 SAP AG. All rights reserved. 387
SAP Class Week of April 16, 2012
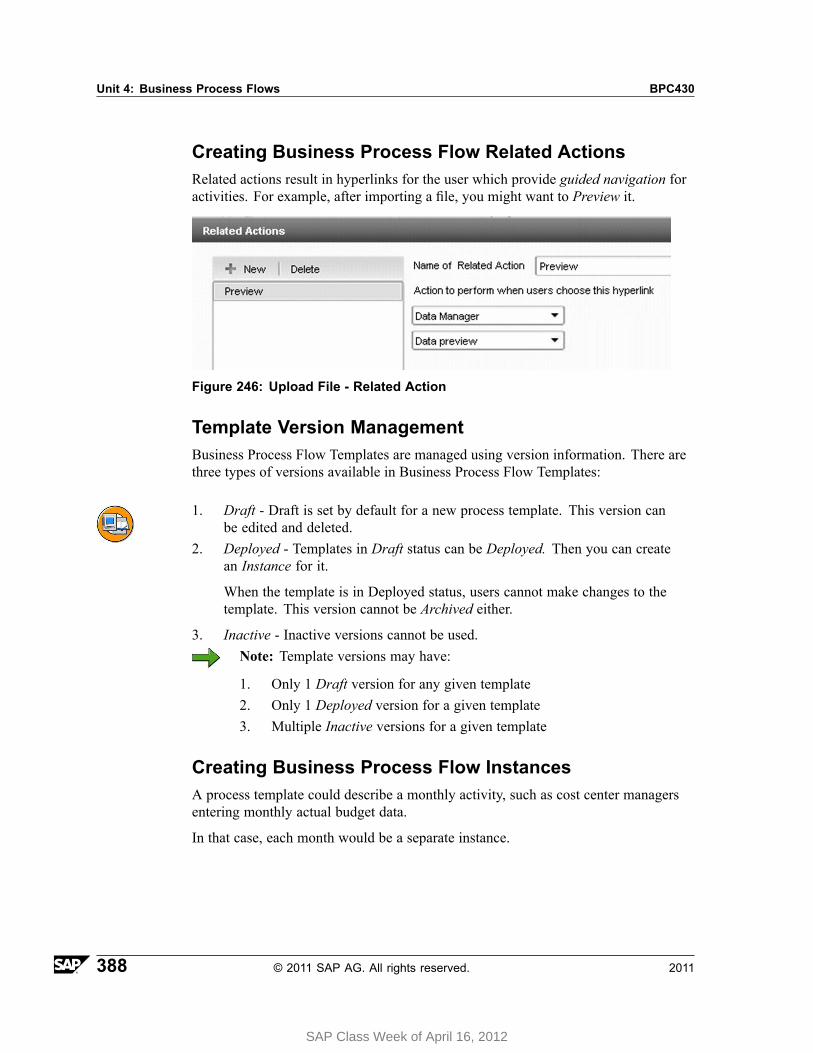
Unit 4: Business Process Flows BPC430
Creating Business Process Flow Related ActionsRelated actions result in hyperlinks for the user which provide guided navigation foractivities. For example, after importing a file, you might want to Preview it.
Figure 246: Upload File - Related Action
Template Version ManagementBusiness Process Flow Templates are managed using version information. There arethree types of versions available in Business Process Flow Templates:
1. Draft - Draft is set by default for a new process template. This version canbe edited and deleted.
2. Deployed - Templates in Draft status can be Deployed. Then you can createan Instance for it.
When the template is in Deployed status, users cannot make changes to thetemplate. This version cannot be Archived either.
3. Inactive - Inactive versions cannot be used.Note: Template versions may have:
1. Only 1 Draft version for any given template2. Only 1 Deployed version for a given template3. Multiple Inactive versions for a given template
Creating Business Process Flow InstancesA process template could describe a monthly activity, such as cost center managersentering monthly actual budget data.
In that case, each month would be a separate instance.
388 © 2011 SAP AG. All rights reserved. 2011
SAP Class Week of April 16, 2012
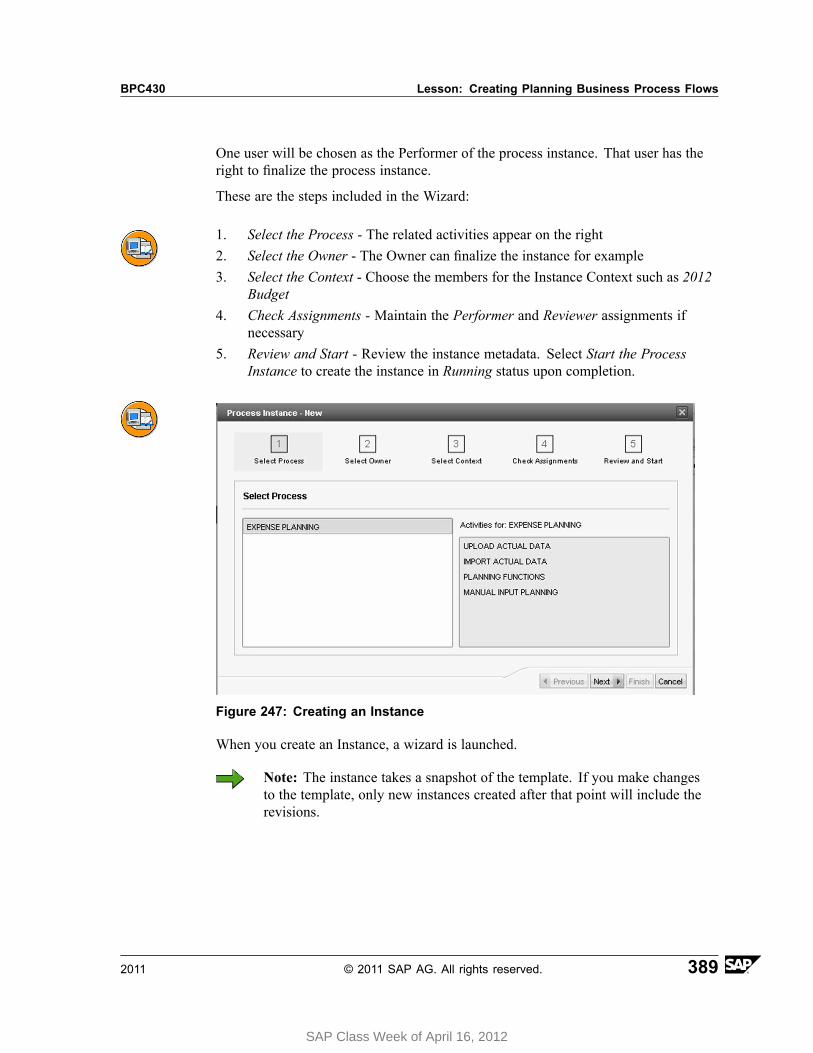
BPC430 Lesson: Creating Planning Business Process Flows
One user will be chosen as the Performer of the process instance. That user has theright to finalize the process instance.
These are the steps included in the Wizard:
1. Select the Process - The related activities appear on the right2. Select the Owner - The Owner can finalize the instance for example3. Select the Context - Choose the members for the Instance Context such as 2012
Budget4. Check Assignments - Maintain the Performer and Reviewer assignments if
necessary5. Review and Start - Review the instance metadata. Select Start the Process
Instance to create the instance in Running status upon completion.
Figure 247: Creating an Instance
When you create an Instance, a wizard is launched.
Note: The instance takes a snapshot of the template. If you make changesto the template, only new instances created after that point will include therevisions.
2011 © 2011 SAP AG. All rights reserved. 389
SAP Class Week of April 16, 2012

Unit 4: Business Process Flows BPC430
After an Instance is created, these are the activities that are available.
• Start - To start a process Instance• Suspend / resume - Suspended Instances are not available to users.• Change Assignment - Process Owner and Activity Owners can be changed by
selecting the Change Assignment option• Reset - To reset an instance back to the first activity• Archive - To archive finalized or inactive instances. An archived process does is
not available for users.• Finalize - You can finalize a process instance if you are the process instance
Owner
Note: Archived instances can be reported on if Audit of Business ProcessFlow Activity is turned on.
Audit reports are available in the Home tab under Audit. Run theAdministration Activity report.
E-mail NotificationProcess monitors receive an e-mail notification when a new process instance iscreated, suspended, resumed, reset, ready to be finalized and archived.
The owner of an activity receives an e-mail notification when the activity is open toperform, approved/rejected by reviewer, and reopened.
The responsible reviewer for an activity receives an e-mail notification when theactivity is ready for review.
Note: SAP BusinessObjects Planning and Consolidation Version for theNetWeaver Platform contains a number of e-mail templates by default.
These are S-type (system) templates, which cannot be modified. A copy ofeach system template can be created and customized according to the businessneeds. These are C-type (customized) templates.
The program used to generate e-mails is: UJB_MAINTAIN_EMAIL_TMPL.
The table where the templates are stored is: UJB_EMAIL10 - BPC: Business ProcessFlow Email Template Table.
New e-mail templates can be created via the SMARTFORM transaction code.
Below is an example of the information contained in an e-mail.
390 © 2011 SAP AG. All rights reserved. 2011
SAP Class Week of April 16, 2012
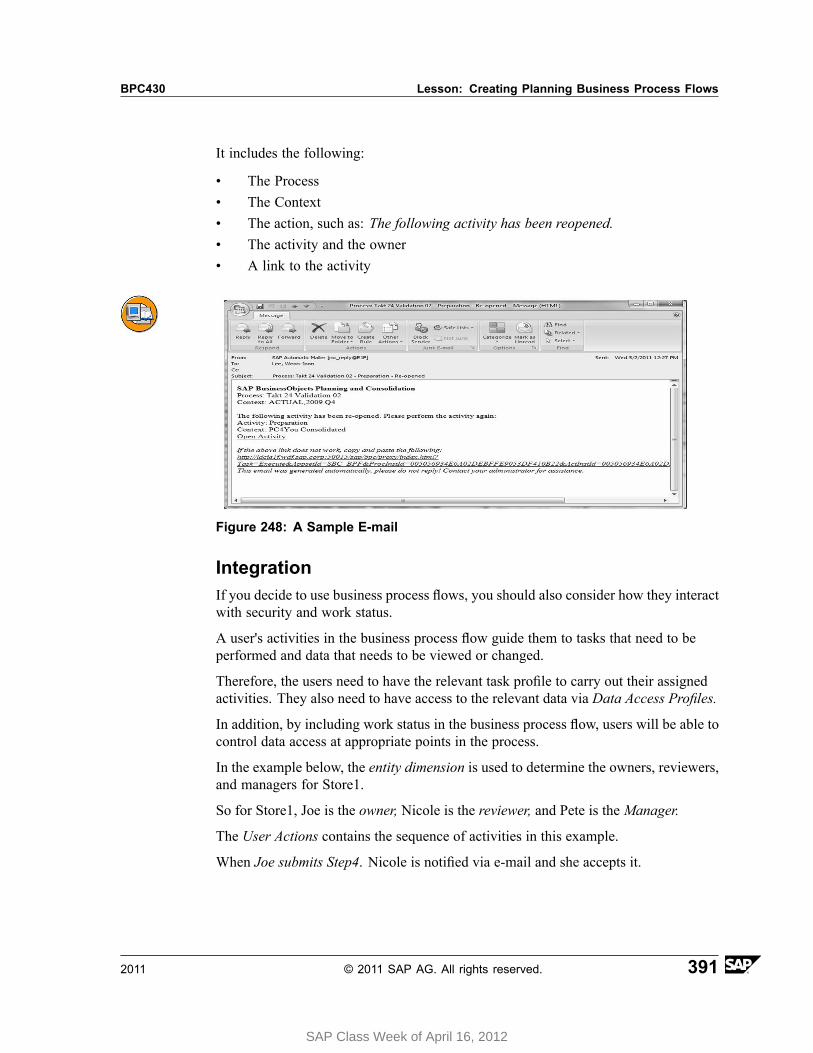
BPC430 Lesson: Creating Planning Business Process Flows
It includes the following:
• The Process• The Context• The action, such as: The following activity has been reopened.• The activity and the owner• A link to the activity
Figure 248: A Sample E-mail
IntegrationIf you decide to use business process flows, you should also consider how they interactwith security and work status.
A user's activities in the business process flow guide them to tasks that need to beperformed and data that needs to be viewed or changed.
Therefore, the users need to have the relevant task profile to carry out their assignedactivities. They also need to have access to the relevant data via Data Access Profiles.
In addition, by including work status in the business process flow, users will be able tocontrol data access at appropriate points in the process.
In the example below, the entity dimension is used to determine the owners, reviewers,and managers for Store1.
So for Store1, Joe is the owner, Nicole is the reviewer, and Pete is the Manager.
The User Actions contains the sequence of activities in this example.
When Joe submits Step4. Nicole is notified via e-mail and she accepts it.
2011 © 2011 SAP AG. All rights reserved. 391
SAP Class Week of April 16, 2012
Unit 4: Business Process Flows BPC430
Since Pete is the manager of Store1, he can set the work state to Reviewed and thenApproved.
If the work state is Reviewed for example, no one can run a data manager packagefor that data region, since it is Locked.
The work state options are defined as follows.
• All - All users are allowed to perform the activity• Locked - Users are Locked out of that activity• Owner - Only the Owner can perform the activity• Manager - Only the Manager can perform the activity
Status Controlled By determines who can change the work state. In the examplebelow, the Manager can advance the work state to Approved and back to Reviewed.
The Work status interfaces are the methods that users can save data or documents tothe data base. They are defined as follows:
• Data Manager - running data manager packages• Journals - posting journal entries• Manual - manually entering and saving data• Documents - posting document attachments• Comments - saving comments to the data base
Note: The diagram below is a conceptual illustration.
392 © 2011 SAP AG. All rights reserved. 2011
SAP Class Week of April 16, 2012
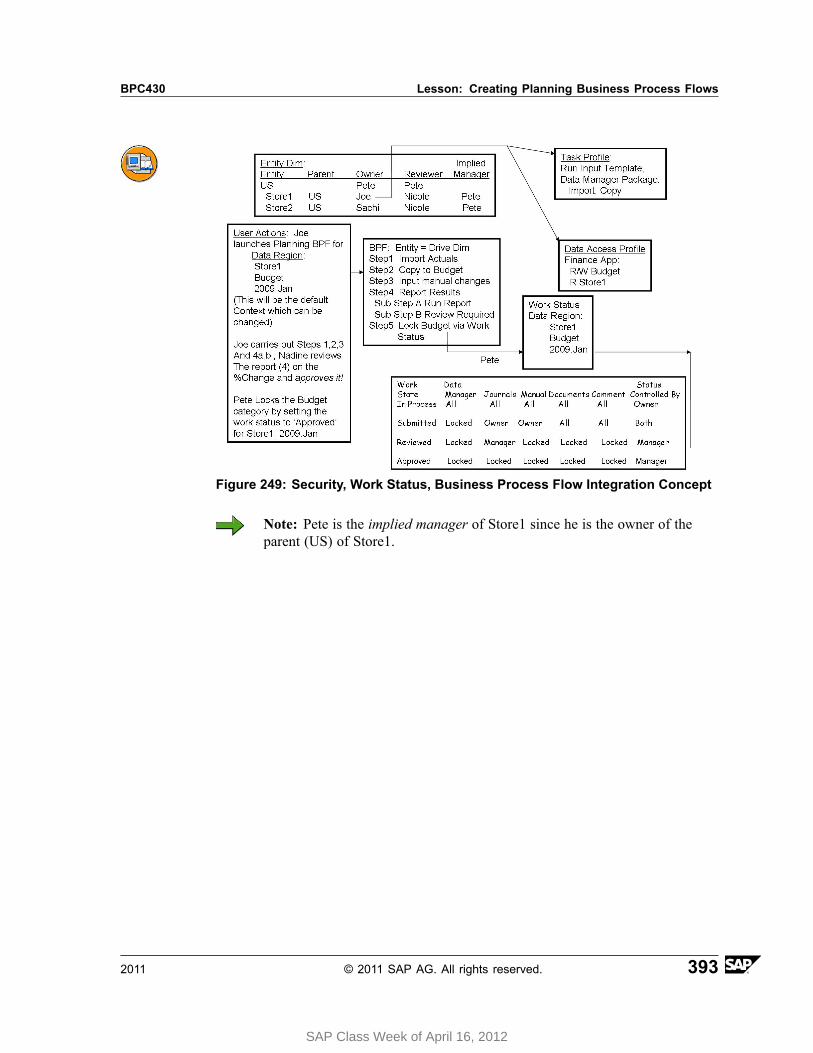
BPC430 Lesson: Creating Planning Business Process Flows
Figure 249: Security, Work Status, Business Process Flow Integration Concept
Note: Pete is the implied manager of Store1 since he is the owner of theparent (US) of Store1.
2011 © 2011 SAP AG. All rights reserved. 393
SAP Class Week of April 16, 2012

Unit 4: Business Process Flows BPC430
394 © 2011 SAP AG. All rights reserved. 2011
SAP Class Week of April 16, 2012

BPC430 Lesson: Creating Planning Business Process Flows
Exercise 15: Create a Business ProcessFlow for Planning
Exercise ObjectivesAfter completing this exercise, you will be able to:• Create and run a Business Process Flow - Process Template for Planning
Business ExampleYou need to create a Business Process Flow for your Planning Process.
Task 1:Create a Process Template.
1. Access Process Templates in Administration.
2. Create a new template with a Name and Description of Expense_Planning.Complete the Process Settings as you see below.
Hint: For the Users, choose the Role tab and select the ADMIN Teamand choose the Add pushbutton.
Continued on next page
2011 © 2011 SAP AG. All rights reserved. 395
SAP Class Week of April 16, 2012

Unit 4: Business Process Flows BPC430
Figure 250: Process Settings
3. Create the Import Actual Data Activity as you see below.
Figure 251: Import Actual Data Settings
Continued on next page
396 © 2011 SAP AG. All rights reserved. 2011
SAP Class Week of April 16, 2012
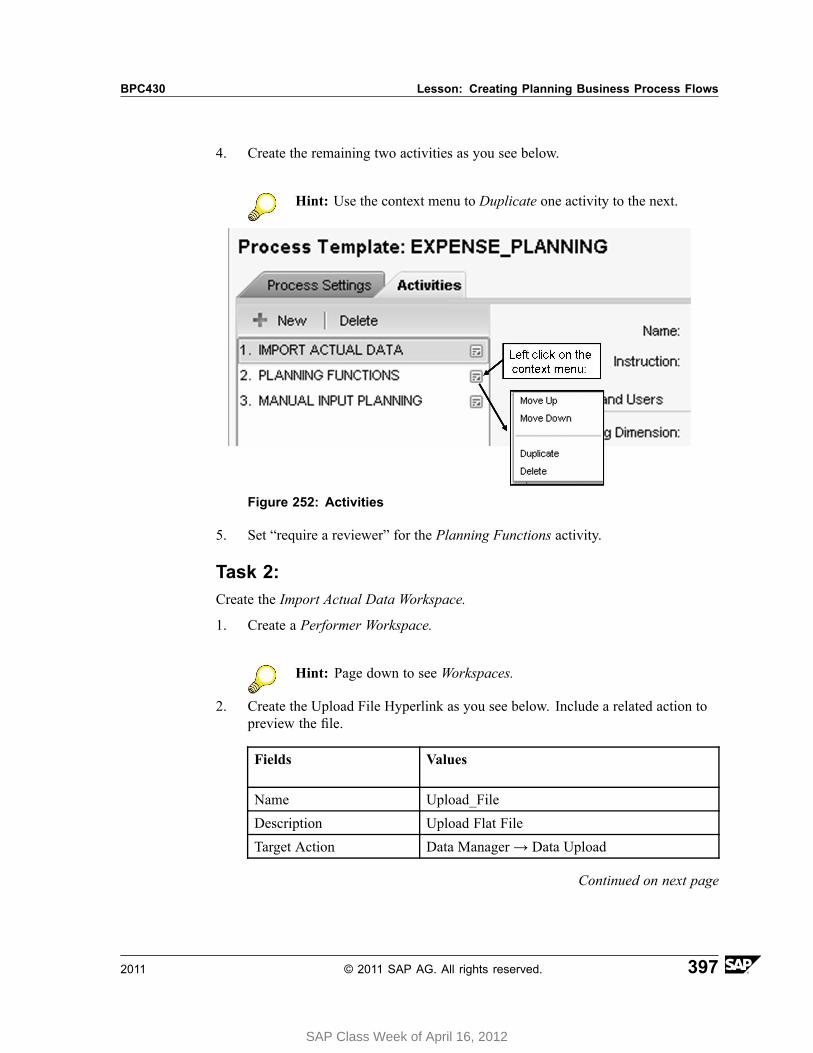
BPC430 Lesson: Creating Planning Business Process Flows
4. Create the remaining two activities as you see below.
Hint: Use the context menu to Duplicate one activity to the next.
Figure 252: Activities
5. Set “require a reviewer” for the Planning Functions activity.
Task 2:Create the Import Actual Data Workspace.
1. Create a Performer Workspace.
Hint: Page down to see Workspaces.
2. Create the Upload File Hyperlink as you see below. Include a related action topreview the file.
Fields Values
Name Upload_File
Description Upload Flat File
Target Action Data Manager→ Data Upload
Continued on next page
2011 © 2011 SAP AG. All rights reserved. 397
SAP Class Week of April 16, 2012
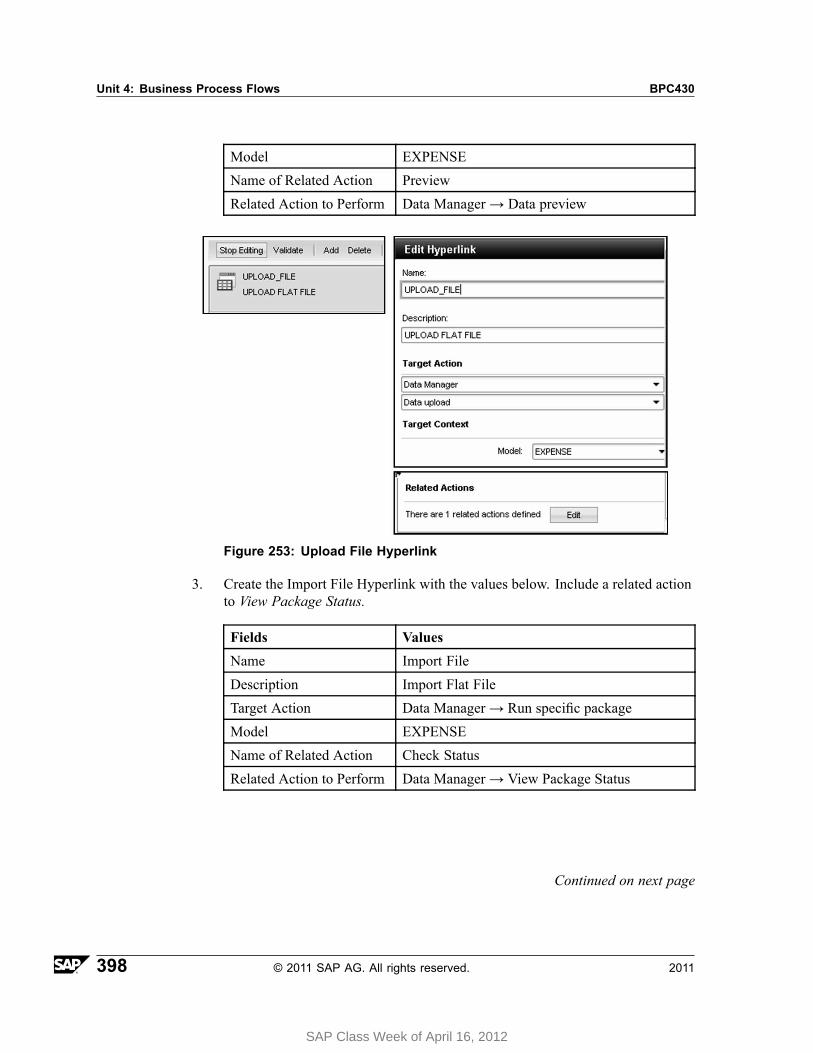
Unit 4: Business Process Flows BPC430
Model EXPENSE
Name of Related Action Preview
Related Action to Perform Data Manager→ Data preview
Figure 253: Upload File Hyperlink
3. Create the Import File Hyperlink with the values below. Include a related actionto View Package Status.
Fields Values
Name Import File
Description Import Flat File
Target Action Data Manager→ Run specific package
Model EXPENSE
Name of Related Action Check Status
Related Action to Perform Data Manager→ View Package Status
Continued on next page
398 © 2011 SAP AG. All rights reserved. 2011
SAP Class Week of April 16, 2012
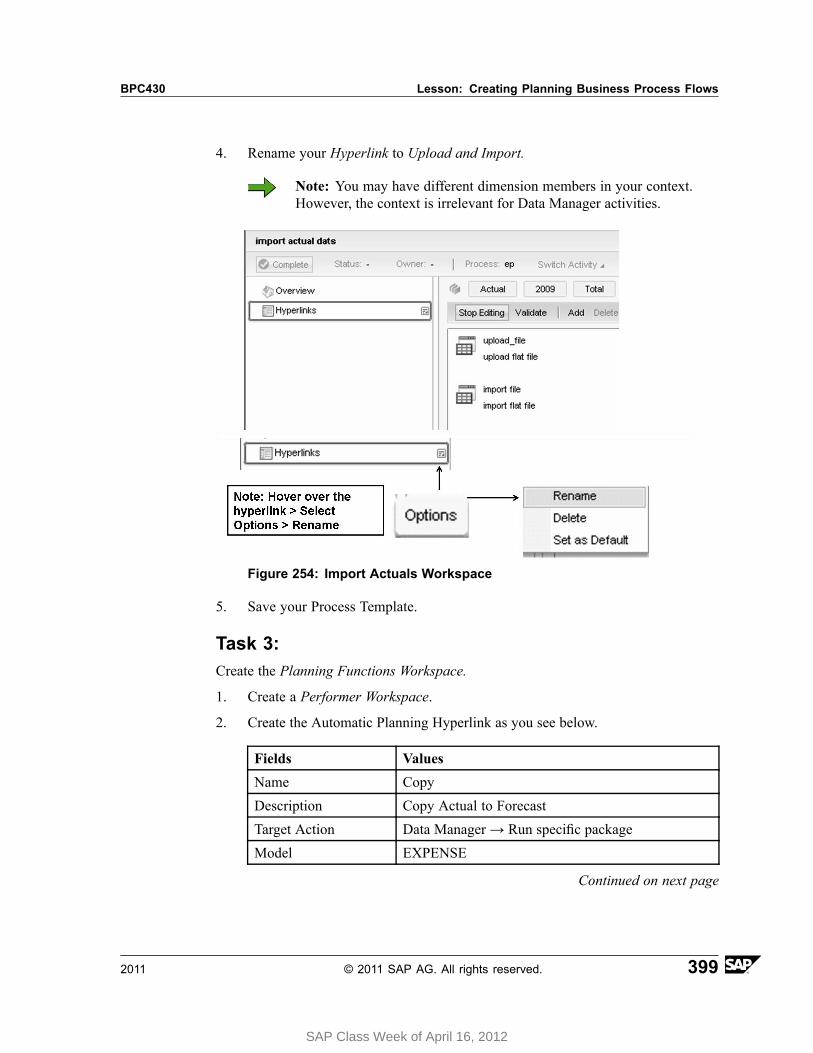
BPC430 Lesson: Creating Planning Business Process Flows
4. Rename your Hyperlink to Upload and Import.
Note: You may have different dimension members in your context.However, the context is irrelevant for Data Manager activities.
Figure 254: Import Actuals Workspace
5. Save your Process Template.
Task 3:Create the Planning Functions Workspace.
1. Create a Performer Workspace.
2. Create the Automatic Planning Hyperlink as you see below.
Fields Values
Name Copy
Description Copy Actual to Forecast
Target Action Data Manager→ Run specific package
Model EXPENSE
Continued on next page
2011 © 2011 SAP AG. All rights reserved. 399
SAP Class Week of April 16, 2012
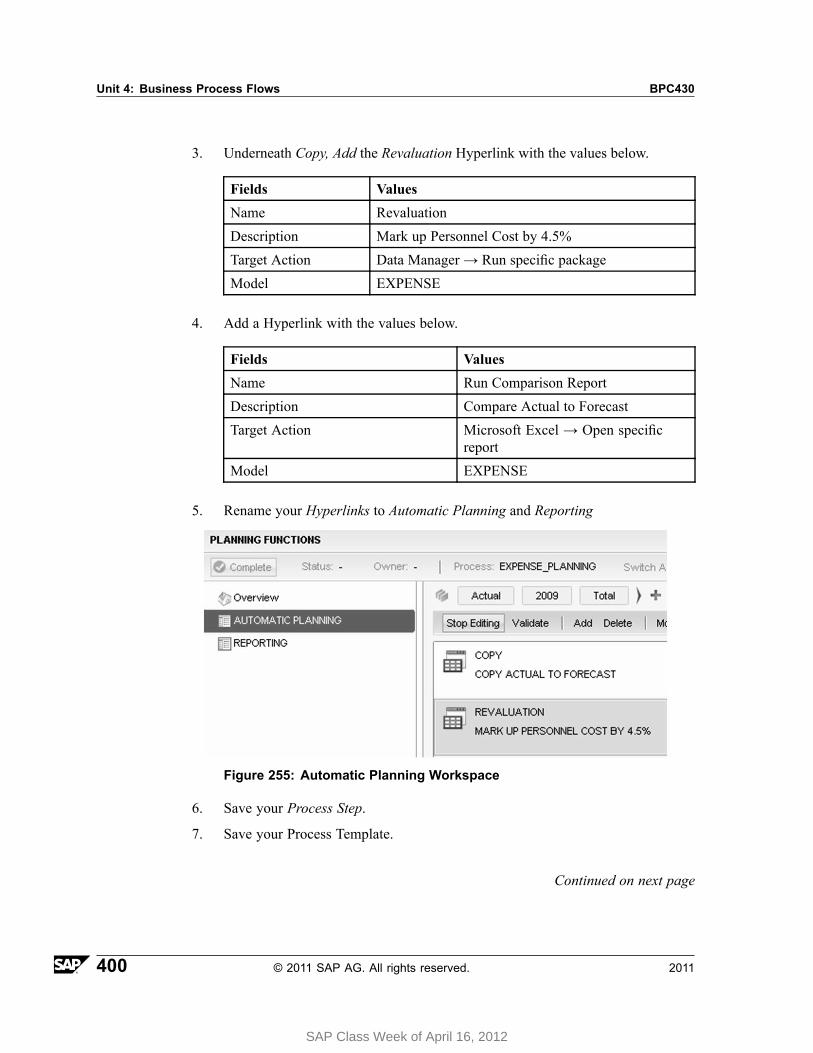
Unit 4: Business Process Flows BPC430
3. Underneath Copy, Add the Revaluation Hyperlink with the values below.
Fields Values
Name Revaluation
Description Mark up Personnel Cost by 4.5%
Target Action Data Manager→ Run specific package
Model EXPENSE
4. Add a Hyperlink with the values below.
Fields Values
Name Run Comparison Report
Description Compare Actual to Forecast
Target Action Microsoft Excel → Open specificreport
Model EXPENSE
5. Rename your Hyperlinks to Automatic Planning and Reporting
Figure 255: Automatic Planning Workspace
6. Save your Process Step.
7. Save your Process Template.
Continued on next page
400 © 2011 SAP AG. All rights reserved. 2011
SAP Class Week of April 16, 2012
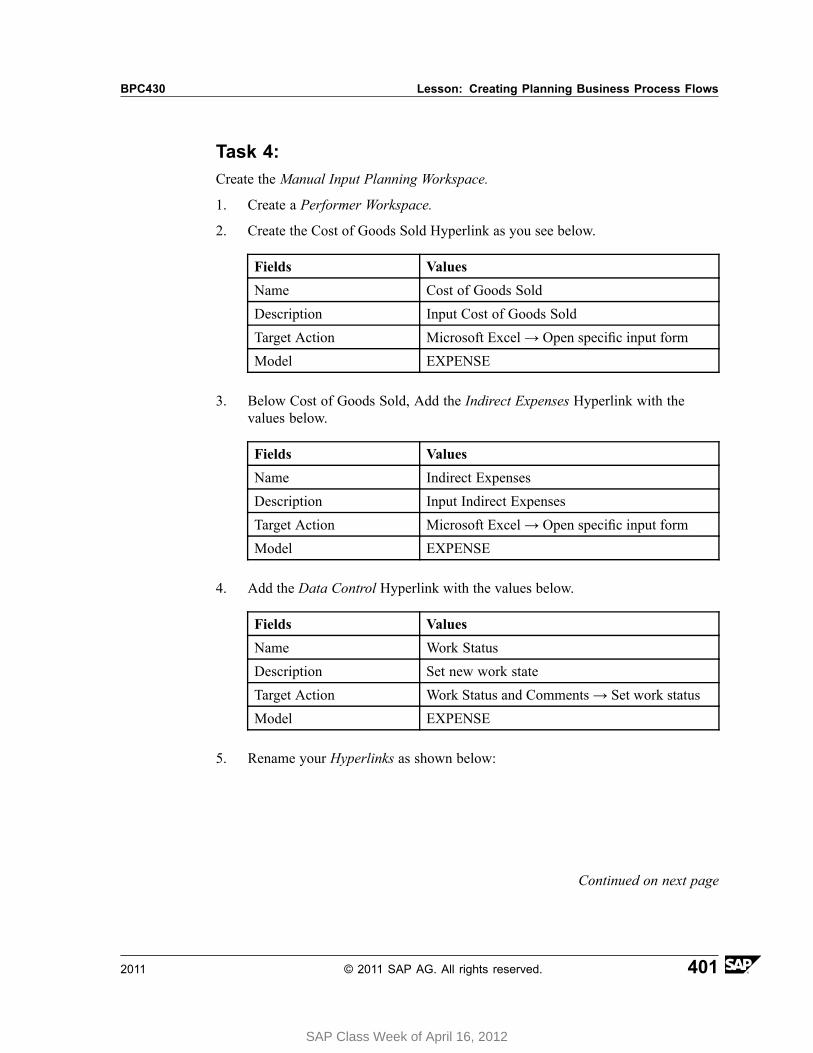
BPC430 Lesson: Creating Planning Business Process Flows
Task 4:Create the Manual Input Planning Workspace.
1. Create a Performer Workspace.
2. Create the Cost of Goods Sold Hyperlink as you see below.
Fields Values
Name Cost of Goods Sold
Description Input Cost of Goods Sold
Target Action Microsoft Excel→ Open specific input form
Model EXPENSE
3. Below Cost of Goods Sold, Add the Indirect Expenses Hyperlink with thevalues below.
Fields Values
Name Indirect Expenses
Description Input Indirect Expenses
Target Action Microsoft Excel→ Open specific input form
Model EXPENSE
4. Add the Data Control Hyperlink with the values below.
Fields Values
Name Work Status
Description Set new work state
Target Action Work Status and Comments→ Set work status
Model EXPENSE
5. Rename your Hyperlinks as shown below:
Continued on next page
2011 © 2011 SAP AG. All rights reserved. 401
SAP Class Week of April 16, 2012
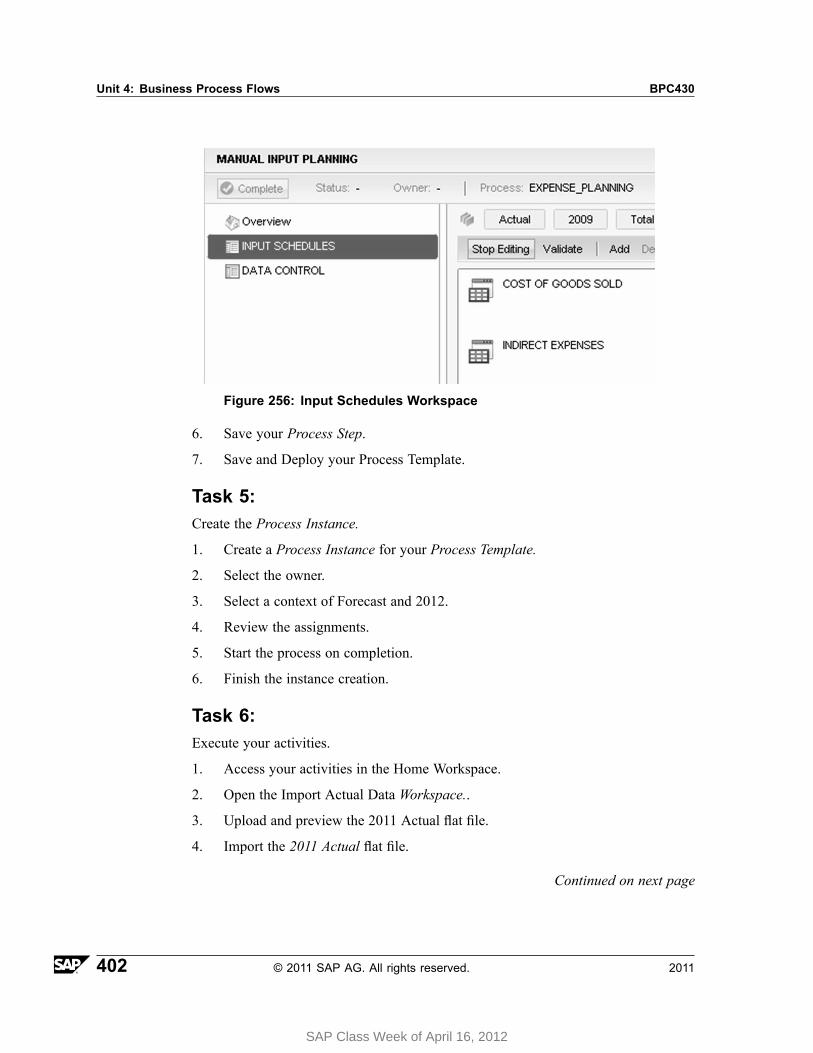
Unit 4: Business Process Flows BPC430
Figure 256: Input Schedules Workspace
6. Save your Process Step.
7. Save and Deploy your Process Template.
Task 5:Create the Process Instance.
1. Create a Process Instance for your Process Template.
2. Select the owner.
3. Select a context of Forecast and 2012.
4. Review the assignments.
5. Start the process on completion.
6. Finish the instance creation.
Task 6:Execute your activities.
1. Access your activities in the Home Workspace.
2. Open the Import Actual Data Workspace..
3. Upload and preview the 2011 Actual flat file.
4. Import the 2011 Actual flat file.
Continued on next page
402 © 2011 SAP AG. All rights reserved. 2011
SAP Class Week of April 16, 2012
BPC430 Lesson: Creating Planning Business Process Flows
5. Complete the Import Actual Data activity and return to your activities.
6. Complete Import Actual Data for Manufacturing.
7. Open Planning Functions and Copy Actual to Forecast.
8. Revalue the Forecast data
9. Compare actual to forecast data.
10. Submit and approve planning functions.
11. Perform manual input planning.
12. Approve the data.
13. Complete Manual Input Planning for Consulting.
14. Run the Process Monitor.
15. Archive the Instance.
2011 © 2011 SAP AG. All rights reserved. 403
SAP Class Week of April 16, 2012
Unit 4: Business Process Flows BPC430
Solution 15: Create a Business ProcessFlow for PlanningTask 1:Create a Process Template.
1. Access Process Templates in Administration.
a) In the Web Client goto the Home Tab → Start Page
b) Choose Planning and Consolidation Administration
c) Choose Business Process Flows → Process Templates
2. Create a new template with a Name and Description of Expense_Planning.Complete the Process Settings as you see below.
Hint: For the Users, choose the Role tab and select the ADMIN Teamand choose the Add pushbutton.
Continued on next page
404 © 2011 SAP AG. All rights reserved. 2011
SAP Class Week of April 16, 2012
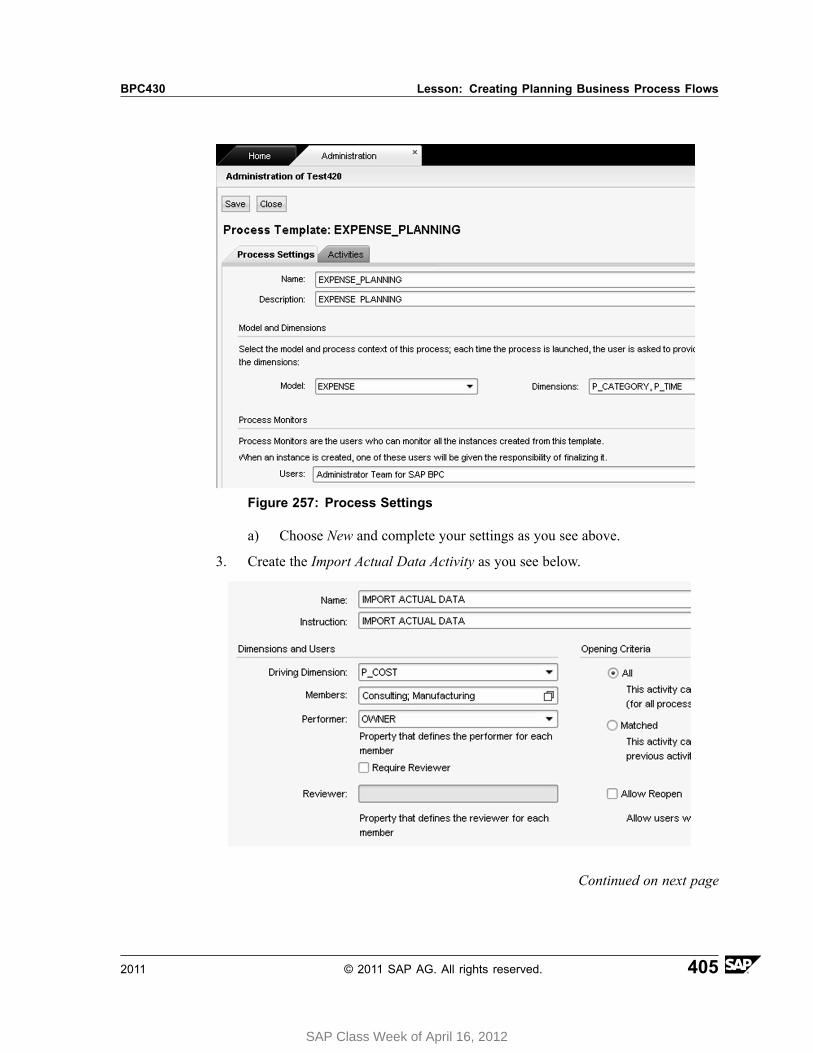
BPC430 Lesson: Creating Planning Business Process Flows
Figure 257: Process Settings
a) Choose New and complete your settings as you see above.
3. Create the Import Actual Data Activity as you see below.
Continued on next page
2011 © 2011 SAP AG. All rights reserved. 405
SAP Class Week of April 16, 2012
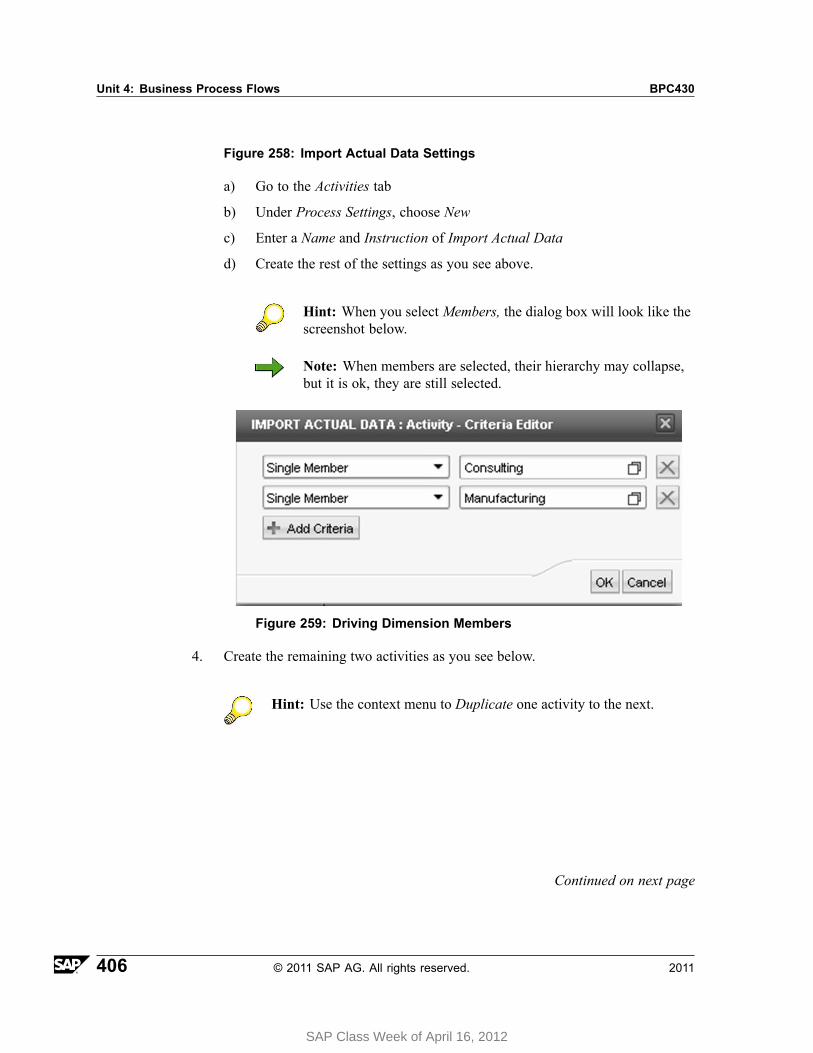
Unit 4: Business Process Flows BPC430
Figure 258: Import Actual Data Settings
a) Go to the Activities tab
b) Under Process Settings, choose New
c) Enter a Name and Instruction of Import Actual Data
d) Create the rest of the settings as you see above.
Hint: When you select Members, the dialog box will look like thescreenshot below.
Note: When members are selected, their hierarchy may collapse,but it is ok, they are still selected.
Figure 259: Driving Dimension Members
4. Create the remaining two activities as you see below.
Hint: Use the context menu to Duplicate one activity to the next.
Continued on next page
406 © 2011 SAP AG. All rights reserved. 2011
SAP Class Week of April 16, 2012
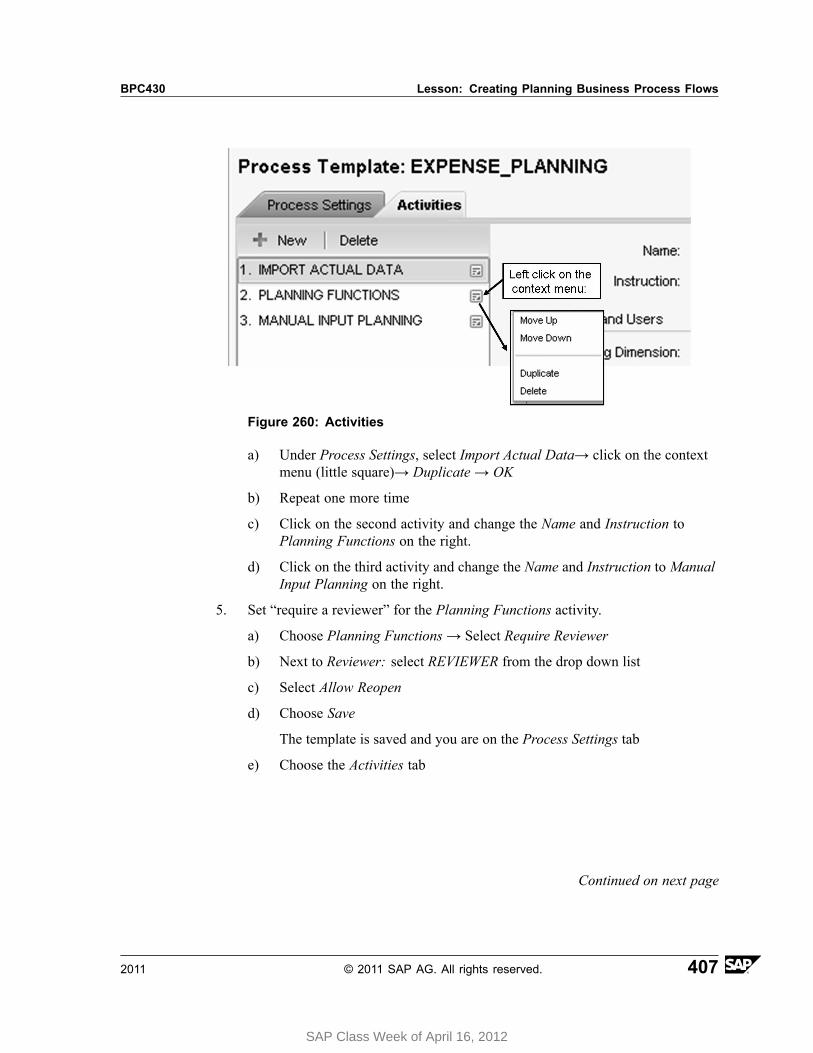
BPC430 Lesson: Creating Planning Business Process Flows
Figure 260: Activities
a) Under Process Settings, select Import Actual Data→ click on the contextmenu (little square)→ Duplicate → OK
b) Repeat one more time
c) Click on the second activity and change the Name and Instruction toPlanning Functions on the right.
d) Click on the third activity and change the Name and Instruction to ManualInput Planning on the right.
5. Set “require a reviewer” for the Planning Functions activity.
a) Choose Planning Functions → Select Require Reviewer
b) Next to Reviewer: select REVIEWER from the drop down list
c) Select Allow Reopen
d) Choose Save
The template is saved and you are on the Process Settings tab
e) Choose the Activities tab
Continued on next page
2011 © 2011 SAP AG. All rights reserved. 407
SAP Class Week of April 16, 2012
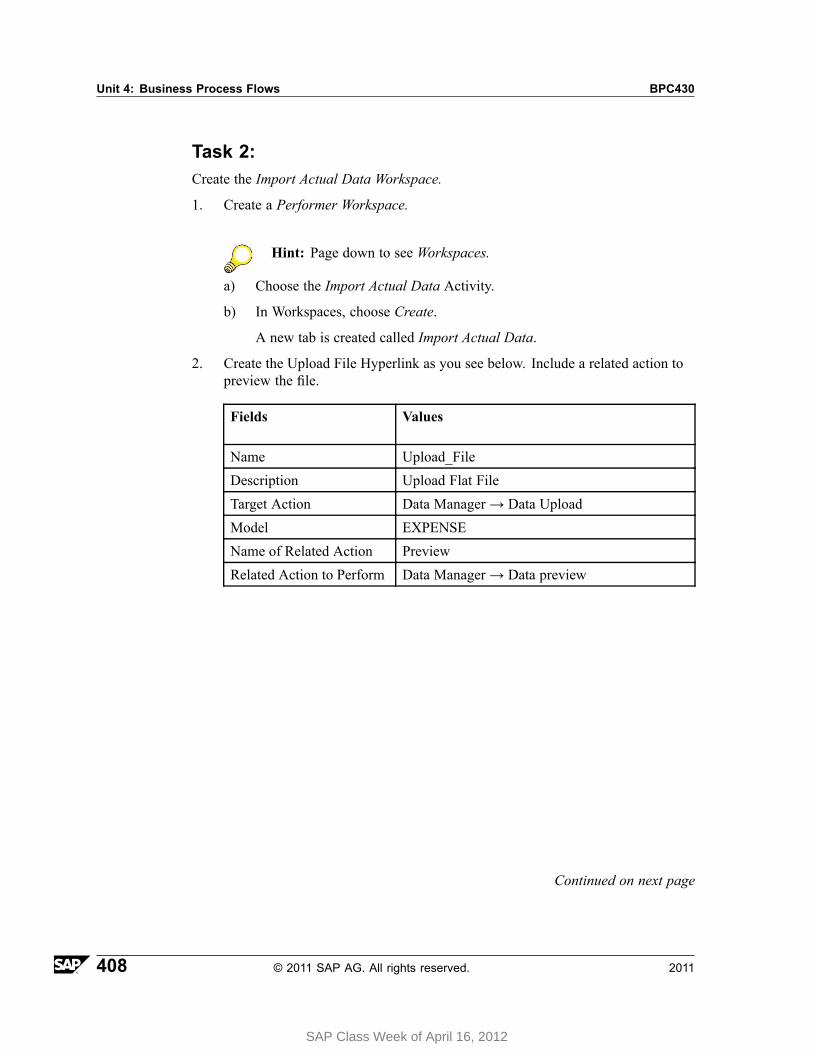
Unit 4: Business Process Flows BPC430
Task 2:Create the Import Actual Data Workspace.
1. Create a Performer Workspace.
Hint: Page down to see Workspaces.
a) Choose the Import Actual Data Activity.
b) In Workspaces, choose Create.
A new tab is created called Import Actual Data.
2. Create the Upload File Hyperlink as you see below. Include a related action topreview the file.
Fields Values
Name Upload_File
Description Upload Flat File
Target Action Data Manager→ Data Upload
Model EXPENSE
Name of Related Action Preview
Related Action to Perform Data Manager→ Data preview
Continued on next page
408 © 2011 SAP AG. All rights reserved. 2011
SAP Class Week of April 16, 2012
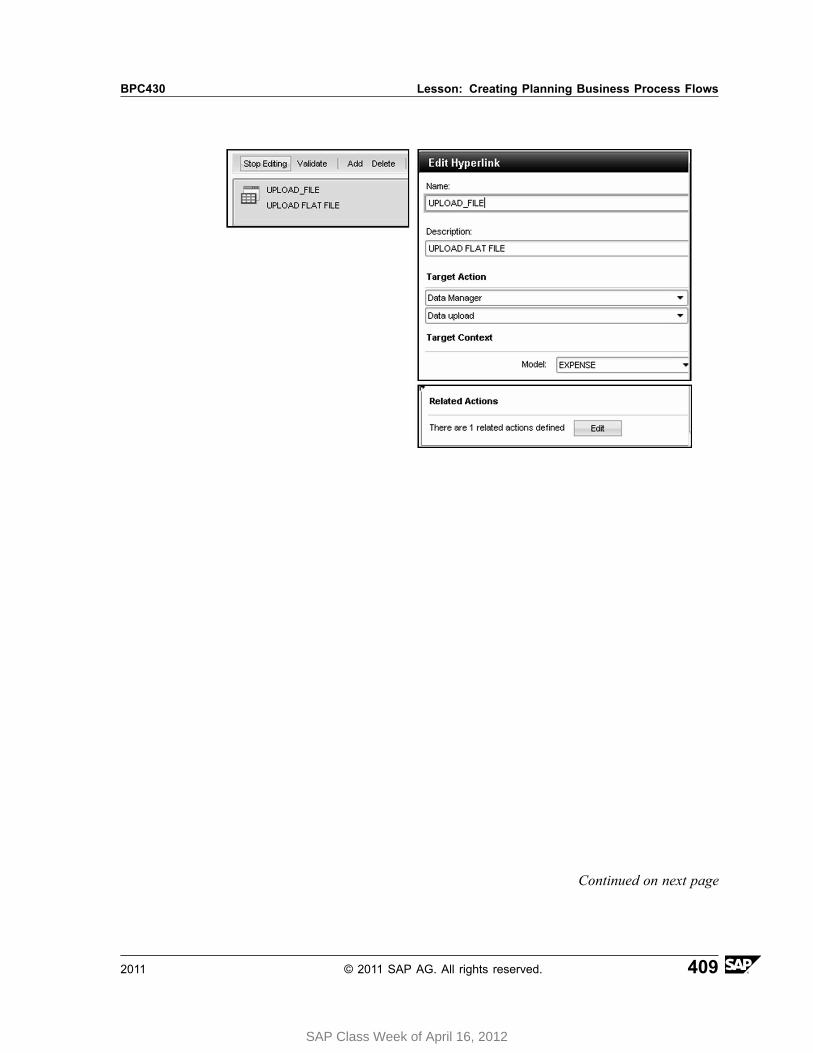
BPC430 Lesson: Creating Planning Business Process Flows
Continued on next page
2011 © 2011 SAP AG. All rights reserved. 409
SAP Class Week of April 16, 2012

Unit 4: Business Process Flows BPC430
Figure 261: Upload File Hyperlink
a) On the upper right, choose Add Hyperlinks
Edit Hyperlink appears on the right.
b) Enter a Name of Upload_File and Description of Upload Flat File.
c) Select a Target Action of Data Manager → Data upload.
d) Next to Model: select EXPENSE
e) Scroll down.
f) Under Related Actions, click Edit.
The Related Actions dialog appears.
g) Choose New
A Related Action is created.
h) Under New, select Related Action.
i) Next to Name of Related Action, enter Preview.
j) Under Action to perform when users choose this hyperlink, select DataManager.
k) Under Data Manager, select Data preview.
Figure 262: Upload File - Related Action
l) Choose OK.
3. Create the Import File Hyperlink with the values below. Include a related actionto View Package Status.
Continued on next page
410 © 2011 SAP AG. All rights reserved. 2011
SAP Class Week of April 16, 2012
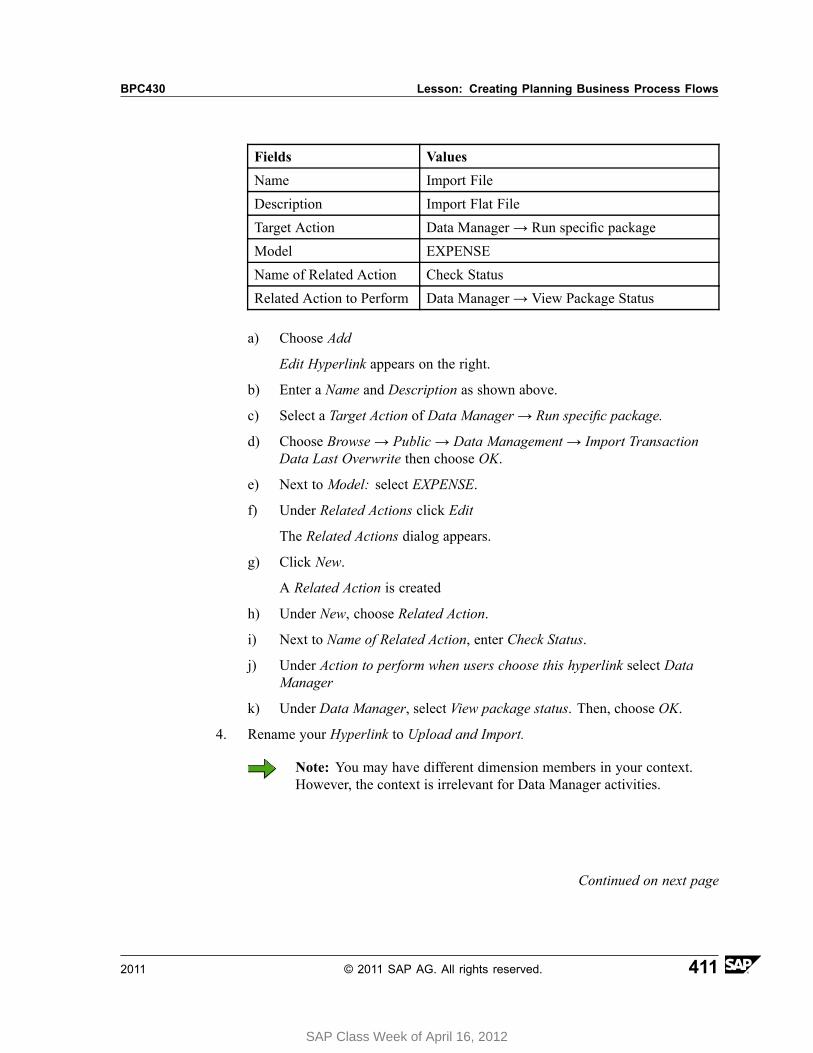
BPC430 Lesson: Creating Planning Business Process Flows
Fields Values
Name Import File
Description Import Flat File
Target Action Data Manager→ Run specific package
Model EXPENSE
Name of Related Action Check Status
Related Action to Perform Data Manager→ View Package Status
a) Choose Add
Edit Hyperlink appears on the right.
b) Enter a Name and Description as shown above.
c) Select a Target Action of Data Manager → Run specific package.
d) Choose Browse → Public → Data Management → Import TransactionData Last Overwrite then choose OK.
e) Next to Model: select EXPENSE.
f) Under Related Actions click Edit
The Related Actions dialog appears.
g) Click New.
A Related Action is created
h) Under New, choose Related Action.
i) Next to Name of Related Action, enter Check Status.
j) Under Action to perform when users choose this hyperlink select DataManager
k) Under Data Manager, select View package status. Then, choose OK.
4. Rename your Hyperlink to Upload and Import.
Note: You may have different dimension members in your context.However, the context is irrelevant for Data Manager activities.
Continued on next page
2011 © 2011 SAP AG. All rights reserved. 411
SAP Class Week of April 16, 2012

Unit 4: Business Process Flows BPC430
Figure 263: Import Actuals Workspace
a) Under Overview, hover over the Hyperlink.
The options box appears.
b) Click Options.
The context menu appears.
c) Choose Rename. Enter Upload and Import.
d) Choose Save.
e) In the message box, you will see Workspace has been saved.
f) Choose OK
g) Close the Import Actual Data tab.
5. Save your Process Template.
a) Choose Save. Go back to the Activities tab.
Continued on next page
412 © 2011 SAP AG. All rights reserved. 2011
SAP Class Week of April 16, 2012
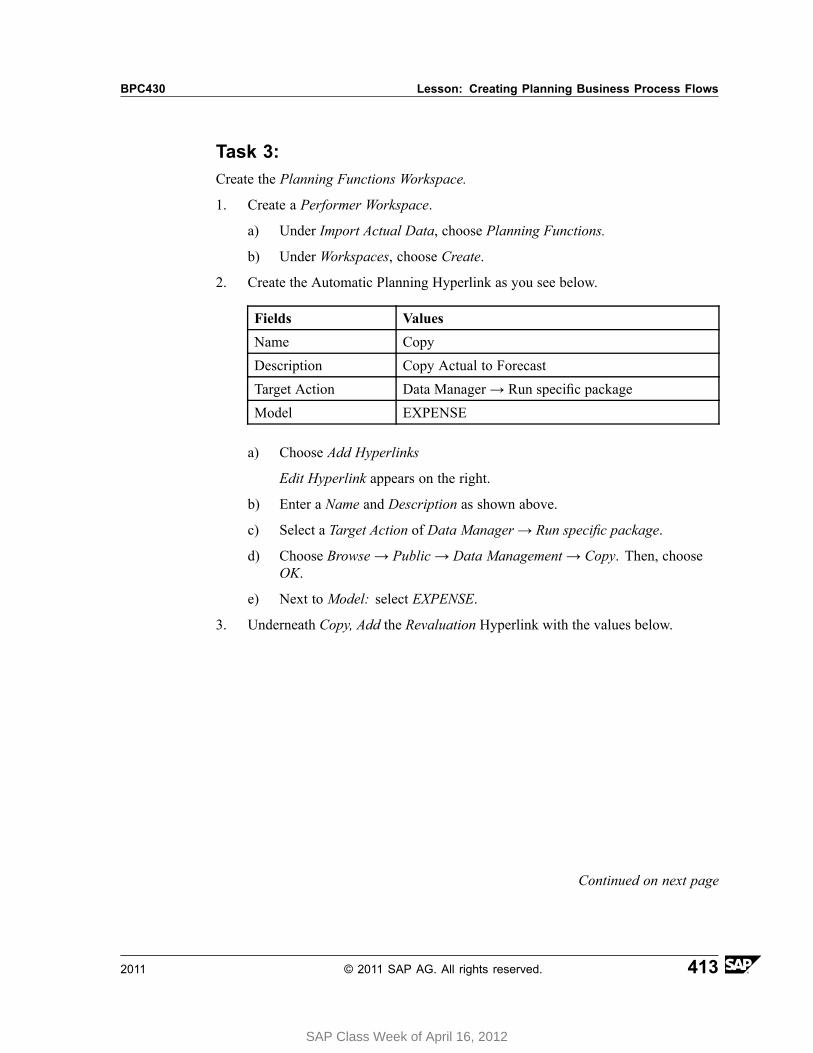
BPC430 Lesson: Creating Planning Business Process Flows
Task 3:Create the Planning Functions Workspace.
1. Create a Performer Workspace.
a) Under Import Actual Data, choose Planning Functions.
b) Under Workspaces, choose Create.
2. Create the Automatic Planning Hyperlink as you see below.
Fields Values
Name Copy
Description Copy Actual to Forecast
Target Action Data Manager→ Run specific package
Model EXPENSE
a) Choose Add Hyperlinks
Edit Hyperlink appears on the right.
b) Enter a Name and Description as shown above.
c) Select a Target Action of Data Manager → Run specific package.
d) Choose Browse → Public → Data Management → Copy. Then, chooseOK.
e) Next to Model: select EXPENSE.
3. Underneath Copy, Add the Revaluation Hyperlink with the values below.
Continued on next page
2011 © 2011 SAP AG. All rights reserved. 413
SAP Class Week of April 16, 2012
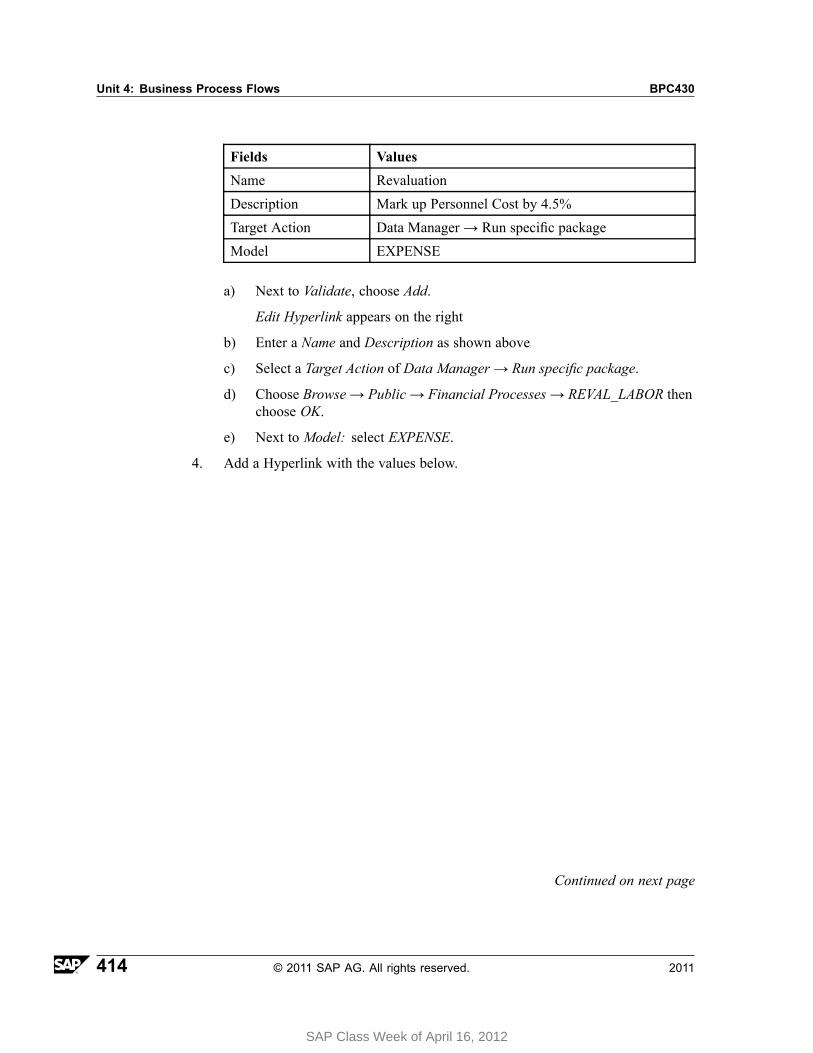
Unit 4: Business Process Flows BPC430
Fields Values
Name Revaluation
Description Mark up Personnel Cost by 4.5%
Target Action Data Manager→ Run specific package
Model EXPENSE
a) Next to Validate, choose Add.
Edit Hyperlink appears on the right
b) Enter a Name and Description as shown above
c) Select a Target Action of Data Manager → Run specific package.
d) Choose Browse → Public → Financial Processes → REVAL_LABOR thenchoose OK.
e) Next to Model: select EXPENSE.
4. Add a Hyperlink with the values below.
Continued on next page
414 © 2011 SAP AG. All rights reserved. 2011
SAP Class Week of April 16, 2012
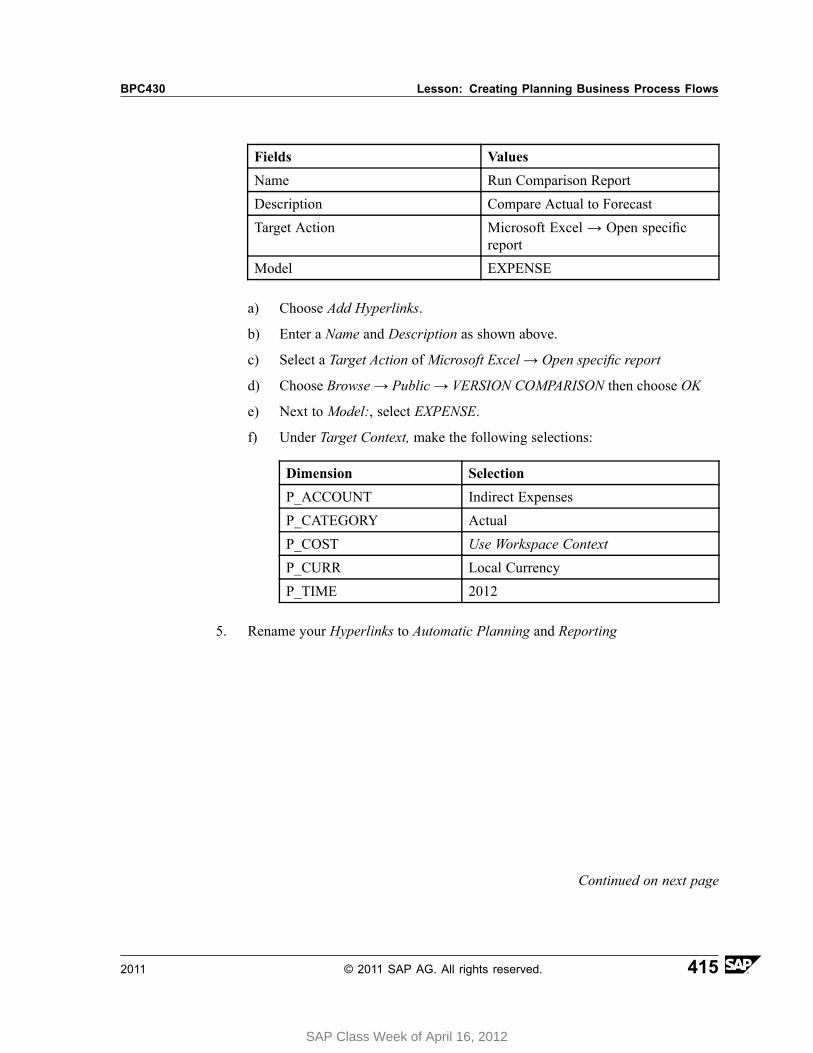
BPC430 Lesson: Creating Planning Business Process Flows
Fields Values
Name Run Comparison Report
Description Compare Actual to Forecast
Target Action Microsoft Excel → Open specificreport
Model EXPENSE
a) Choose Add Hyperlinks.
b) Enter a Name and Description as shown above.
c) Select a Target Action of Microsoft Excel → Open specific report
d) Choose Browse → Public → VERSION COMPARISON then choose OK
e) Next to Model:, select EXPENSE.
f) Under Target Context, make the following selections:
Dimension Selection
P_ACCOUNT Indirect Expenses
P_CATEGORY Actual
P_COST Use Workspace Context
P_CURR Local Currency
P_TIME 2012
5. Rename your Hyperlinks to Automatic Planning and Reporting
Continued on next page
2011 © 2011 SAP AG. All rights reserved. 415
SAP Class Week of April 16, 2012
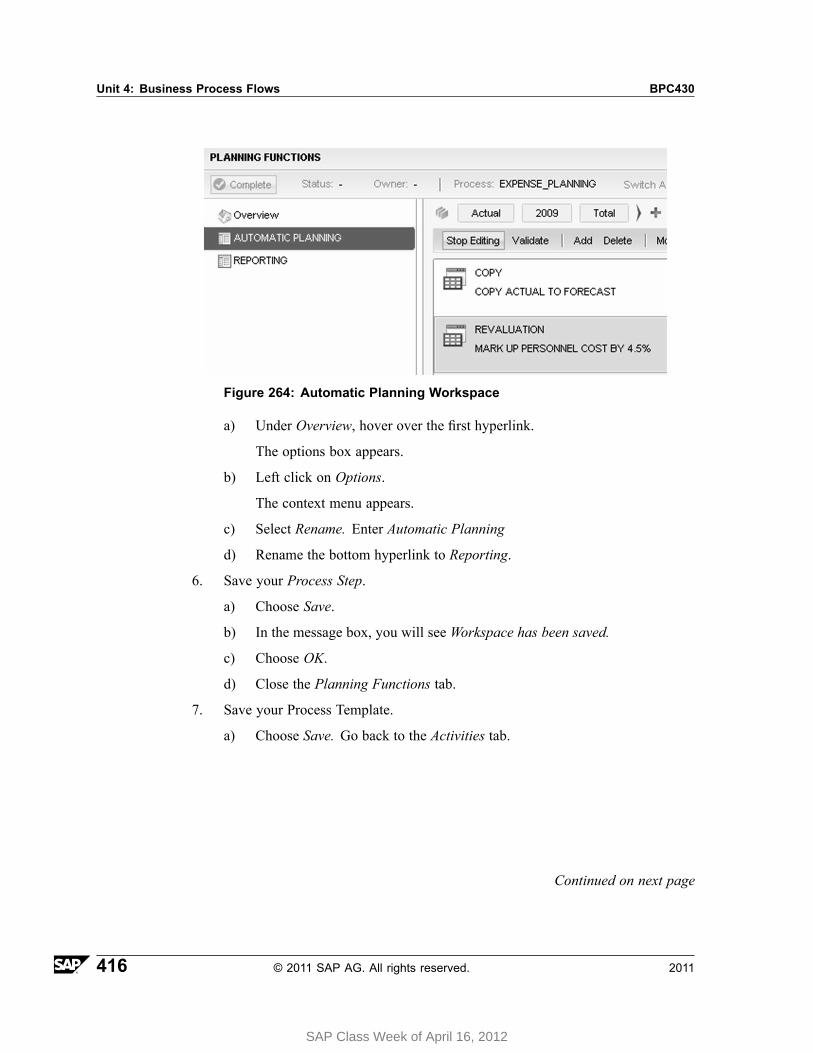
Unit 4: Business Process Flows BPC430
Figure 264: Automatic Planning Workspace
a) Under Overview, hover over the first hyperlink.
The options box appears.
b) Left click on Options.
The context menu appears.
c) Select Rename. Enter Automatic Planning
d) Rename the bottom hyperlink to Reporting.
6. Save your Process Step.
a) Choose Save.
b) In the message box, you will see Workspace has been saved.
c) Choose OK.
d) Close the Planning Functions tab.
7. Save your Process Template.
a) Choose Save. Go back to the Activities tab.
Continued on next page
416 © 2011 SAP AG. All rights reserved. 2011
SAP Class Week of April 16, 2012
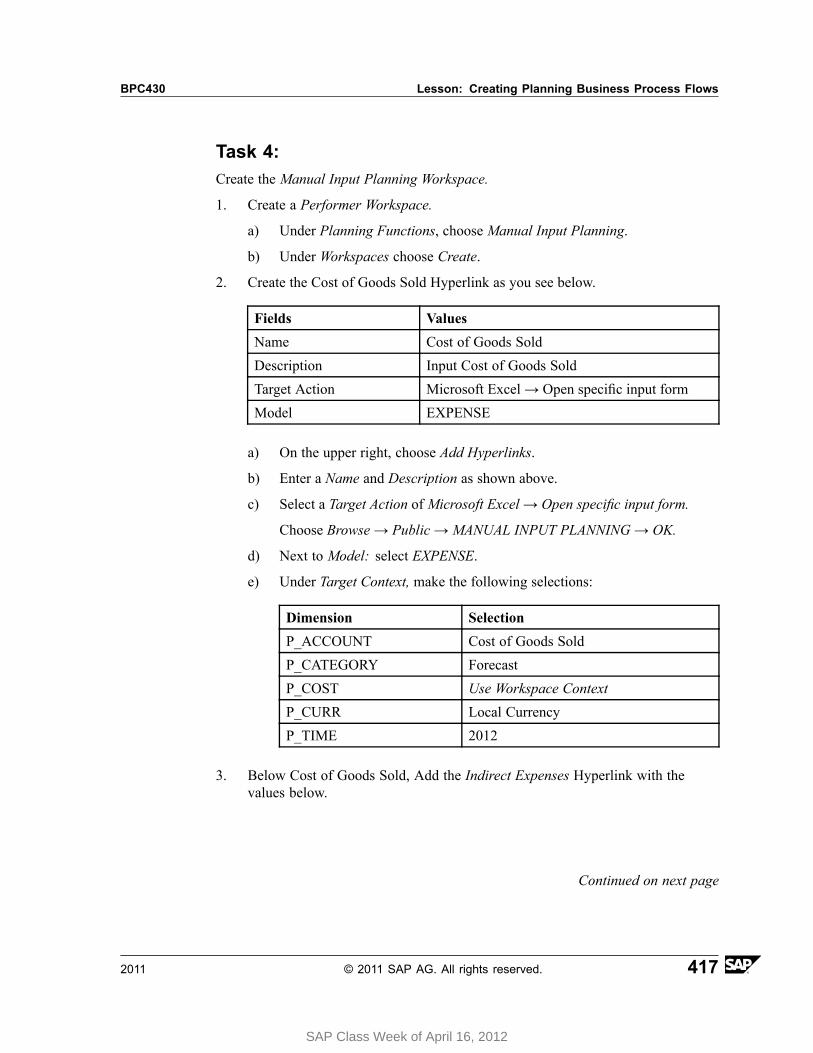
BPC430 Lesson: Creating Planning Business Process Flows
Task 4:Create the Manual Input Planning Workspace.
1. Create a Performer Workspace.
a) Under Planning Functions, choose Manual Input Planning.
b) Under Workspaces choose Create.
2. Create the Cost of Goods Sold Hyperlink as you see below.
Fields Values
Name Cost of Goods Sold
Description Input Cost of Goods Sold
Target Action Microsoft Excel→ Open specific input form
Model EXPENSE
a) On the upper right, choose Add Hyperlinks.
b) Enter a Name and Description as shown above.
c) Select a Target Action of Microsoft Excel → Open specific input form.
Choose Browse → Public → MANUAL INPUT PLANNING → OK.
d) Next to Model: select EXPENSE.
e) Under Target Context, make the following selections:
Dimension Selection
P_ACCOUNT Cost of Goods Sold
P_CATEGORY Forecast
P_COST Use Workspace Context
P_CURR Local Currency
P_TIME 2012
3. Below Cost of Goods Sold, Add the Indirect Expenses Hyperlink with thevalues below.
Continued on next page
2011 © 2011 SAP AG. All rights reserved. 417
SAP Class Week of April 16, 2012
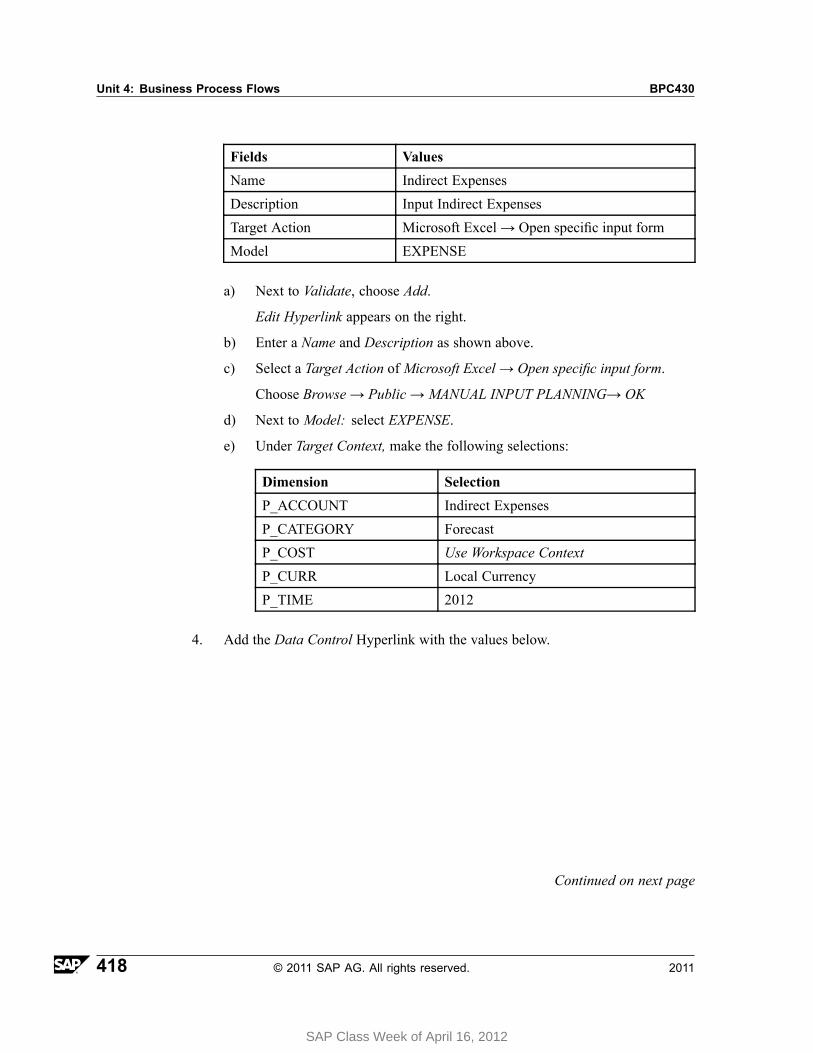
Unit 4: Business Process Flows BPC430
Fields Values
Name Indirect Expenses
Description Input Indirect Expenses
Target Action Microsoft Excel→ Open specific input form
Model EXPENSE
a) Next to Validate, choose Add.
Edit Hyperlink appears on the right.
b) Enter a Name and Description as shown above.
c) Select a Target Action of Microsoft Excel → Open specific input form.
Choose Browse → Public → MANUAL INPUT PLANNING→ OK
d) Next to Model: select EXPENSE.
e) Under Target Context, make the following selections:
Dimension Selection
P_ACCOUNT Indirect Expenses
P_CATEGORY Forecast
P_COST Use Workspace Context
P_CURR Local Currency
P_TIME 2012
4. Add the Data Control Hyperlink with the values below.
Continued on next page
418 © 2011 SAP AG. All rights reserved. 2011
SAP Class Week of April 16, 2012
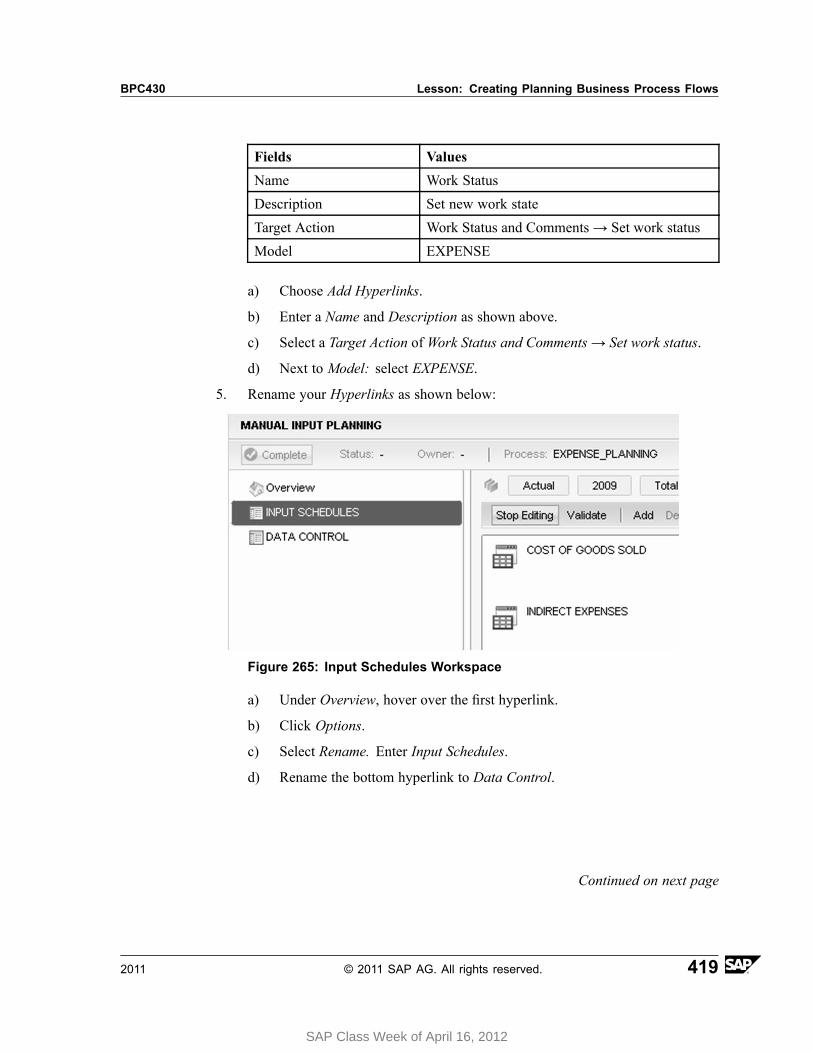
BPC430 Lesson: Creating Planning Business Process Flows
Fields Values
Name Work Status
Description Set new work state
Target Action Work Status and Comments→ Set work status
Model EXPENSE
a) Choose Add Hyperlinks.
b) Enter a Name and Description as shown above.
c) Select a Target Action of Work Status and Comments → Set work status.
d) Next to Model: select EXPENSE.
5. Rename your Hyperlinks as shown below:
Figure 265: Input Schedules Workspace
a) Under Overview, hover over the first hyperlink.
b) Click Options.
c) Select Rename. Enter Input Schedules.
d) Rename the bottom hyperlink to Data Control.
Continued on next page
2011 © 2011 SAP AG. All rights reserved. 419
SAP Class Week of April 16, 2012

Unit 4: Business Process Flows BPC430
6. Save your Process Step.
a) Choose Save.
b) In the message box, you will see Workspace has been saved.
c) Choose OK.
d) Close the Manual Input Planning tab.
7. Save and Deploy your Process Template.
a) Choose Save → Close.
Your template is complete.
b) Highlight your template
Hint: If you accidentally click the hyperlink, the template willopen. Just choose Close.
c) Choose Deploy.
The Current Version changes from Draft to Deployed.
Task 5:Create the Process Instance.
1. Create a Process Instance for your Process Template.
a) Choose Process Instances.
b) Click New.
c) Select your Process.
Your three activities appear.
2. Select the owner.
a) Choose Next.
b) Next to Name: select BPC-## from the drop down list.
3. Select a context of Forecast and 2012.
a) Choose Next.
b) Select Forecast and 2012 as the context.
Continued on next page
420 © 2011 SAP AG. All rights reserved. 2011
SAP Class Week of April 16, 2012
BPC430 Lesson: Creating Planning Business Process Flows
4. Review the assignments.
a) Choose Next.
The Check Assignments step is reached.
5. Start the process on completion.
a) Choose Next.
b) Select Start the process instance.
The instance will be in Running status on completion.
6. Finish the instance creation.
a) Choose Finish → Close
Caution: The instance creates a snapshot of the template. If youfind that you need to make changes to the template, you will needto Suspend it, Archive it, and then create a new instance.
Continued on next page
2011 © 2011 SAP AG. All rights reserved. 421
SAP Class Week of April 16, 2012

Unit 4: Business Process Flows BPC430
Task 6:Execute your activities.
1. Access your activities in the Home Workspace.
a) Go to the Home tab and choose Activities.
b) Under Process, choose the EXPENSE_PLANNING Process.
Figure 266: Activities in Run Mode
2. Open the Import Actual Data Workspace..
a) Click Import Actual Data for Consulting.
The Import Actual Data tab opens.
b) Choose Upload_File.
After a few seconds, the EPM add-In opens and the Data Manager -Upload dialog appears.
If not, check your status bar for Excel.
Continued on next page
422 © 2011 SAP AG. All rights reserved. 2011
SAP Class Week of April 16, 2012
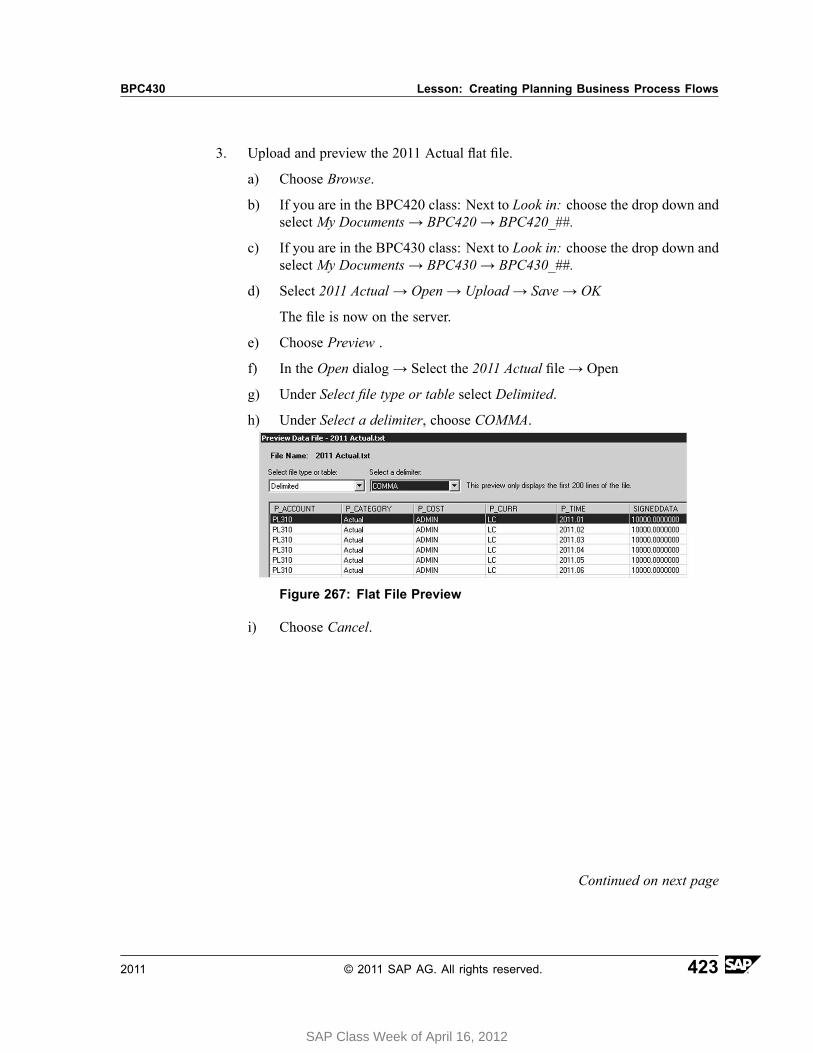
BPC430 Lesson: Creating Planning Business Process Flows
3. Upload and preview the 2011 Actual flat file.
a) Choose Browse.
b) If you are in the BPC420 class: Next to Look in: choose the drop down andselect My Documents → BPC420 → BPC420_##.
c) If you are in the BPC430 class: Next to Look in: choose the drop down andselect My Documents → BPC430 → BPC430_##.
d) Select 2011 Actual → Open → Upload → Save → OK
The file is now on the server.
e) Choose Preview .
f) In the Open dialog → Select the 2011 Actual file → Open
g) Under Select file type or table select Delimited.
h) Under Select a delimiter, choose COMMA.
Figure 267: Flat File Preview
i) Choose Cancel.
Continued on next page
2011 © 2011 SAP AG. All rights reserved. 423
SAP Class Week of April 16, 2012
Unit 4: Business Process Flows BPC430
4. Import the 2011 Actual flat file.
a) Choose Import_File.
b) Choose Browse → 2011 Actual → Open
c) Choose Next → Browse → EXP TRANS → Open
d) Choose Next.
Merge data values ... should be selected.
e) Choose Next and select No.
Default logic will not be run.
f) Choose Next and select No.
Work status will not be checked.
g) Choose Next then choose Finish.
The EPM - Data Manager window appears.
h) Choose OK, then choose the link for Check Status.
You should have a status of Succeed.
Note: If your log does not appear, go to the Data Manager taband view data.
i) Close the Package Status window by choosing Close.
j) Close Excel by choosing Office → Exit Excel.
k) Return to the Web Client.
5. Complete the Import Actual Data activity and return to your activities.
a) Under Import Actual Data - Consulting, select Complete.
b) Close the Import Actual Data tab.
c) Go to the Home tab and choose Activities.
6. Complete Import Actual Data for Manufacturing.
a) Highlight the row for Import Actual Data for Manufacturing.
b) Choose Actions and select Complete.
Planning Functions are now ready To Perform.
c) Close the Import Actual Data tab for Manufacturing.
Continued on next page
424 © 2011 SAP AG. All rights reserved. 2011
SAP Class Week of April 16, 2012
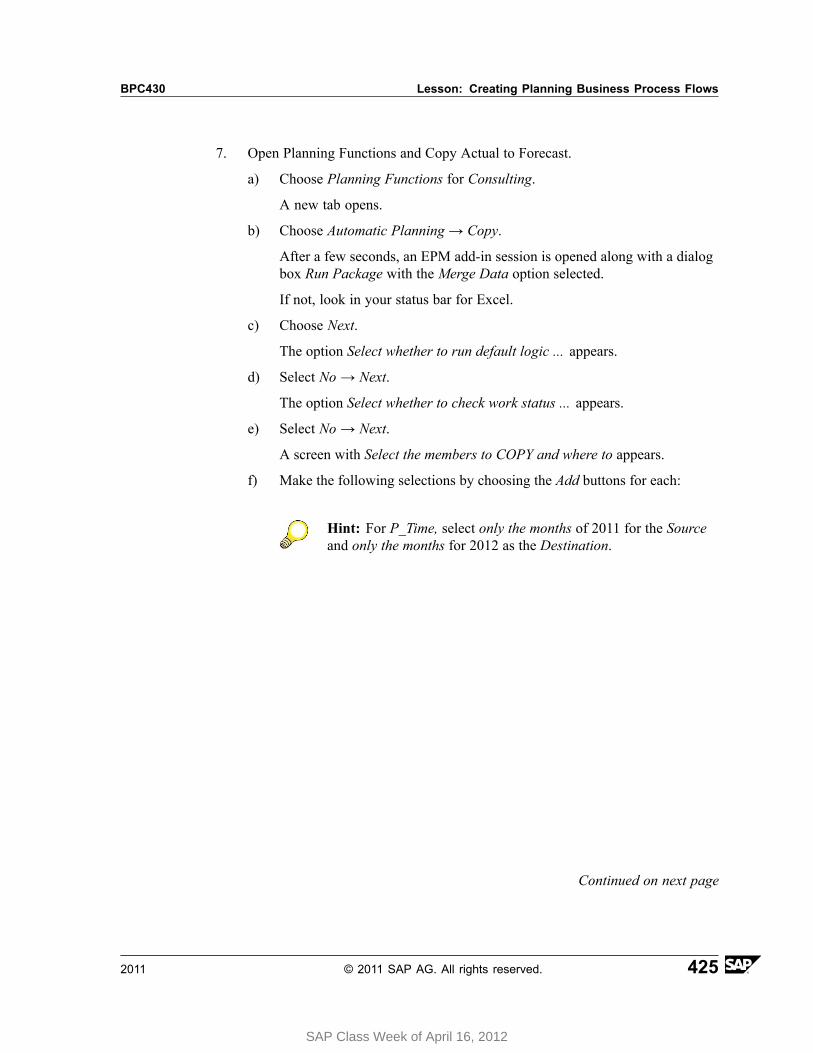
BPC430 Lesson: Creating Planning Business Process Flows
7. Open Planning Functions and Copy Actual to Forecast.
a) Choose Planning Functions for Consulting.
A new tab opens.
b) Choose Automatic Planning → Copy.
After a few seconds, an EPM add-in session is opened along with a dialogbox Run Package with the Merge Data option selected.
If not, look in your status bar for Excel.
c) Choose Next.
The option Select whether to run default logic ... appears.
d) Select No → Next.
The option Select whether to check work status ... appears.
e) Select No → Next.
A screen with Select the members to COPY and where to appears.
f) Make the following selections by choosing the Add buttons for each:
Hint: For P_Time, select only the months of 2011 for the Sourceand only the months for 2012 as the Destination.
Continued on next page
2011 © 2011 SAP AG. All rights reserved. 425
SAP Class Week of April 16, 2012
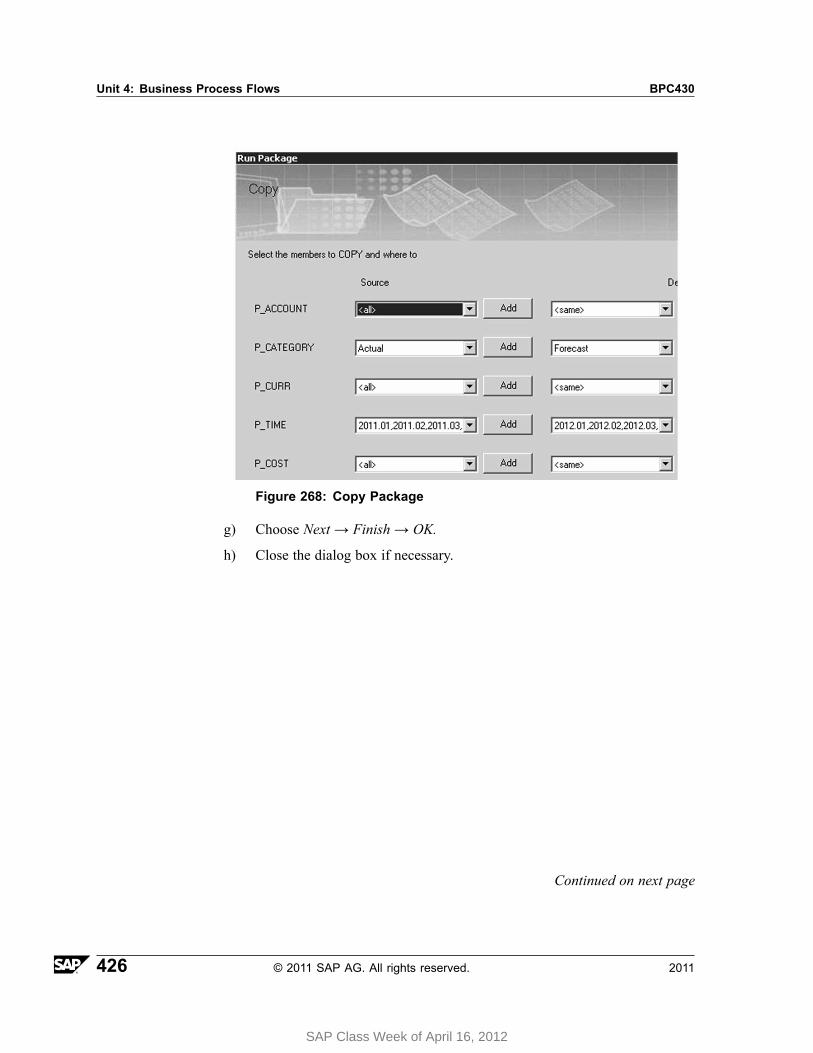
Unit 4: Business Process Flows BPC430
Figure 268: Copy Package
g) Choose Next → Finish → OK.
h) Close the dialog box if necessary.
Continued on next page
426 © 2011 SAP AG. All rights reserved. 2011
SAP Class Week of April 16, 2012

BPC430 Lesson: Creating Planning Business Process Flows
8. Revalue the Forecast data
a) Under Copy, choose Revaluation.
b) Select the following by choosing the Add buttons for each:
Dimension Value Selection Relationship
P_Category Forecast Member Only
P_Curr LC Member Only
P_Time 2012.01 to2012.12
Caution: When making selections, you may notice the systemgoes back to the Web Client. If so, look for Excel in your task bar.
c) Select Next → Finish → OK.
d) Choose the Data Manager tab and click View Status.
You should have a status of Succeed.
e) Close the dialog box.
f) Close Excel.
Continued on next page
2011 © 2011 SAP AG. All rights reserved. 427
SAP Class Week of April 16, 2012

Unit 4: Business Process Flows BPC430
9. Compare actual to forecast data.
a) In the Planning Functions tab, click Reporting → Run Comparison Report.
The report opens in the EPM add-in.
b) Choose the EPM tab, and click Refresh.
Figure 269: Version Comparison
Actual values have been copied to 2012 and Personnel Cost has beenmarked up by 4.5%.
c) Close Excel.
10. Submit and approve planning functions.
a) In the Planning Functions tab, choose Submit.
b) Close the Planning Functions tab.
c) On your Home tab, highlight Planning Functions for Consulting.
d) Choose Actions.
e) Select Approve.
f) Highlight Planning Functions for Manufacturing.
g) Choose Actions.
h) Select Submit.
The Action Required changes to To Review.
i) Choose Actions.
j) Select Approve.
Continued on next page
428 © 2011 SAP AG. All rights reserved. 2011
SAP Class Week of April 16, 2012
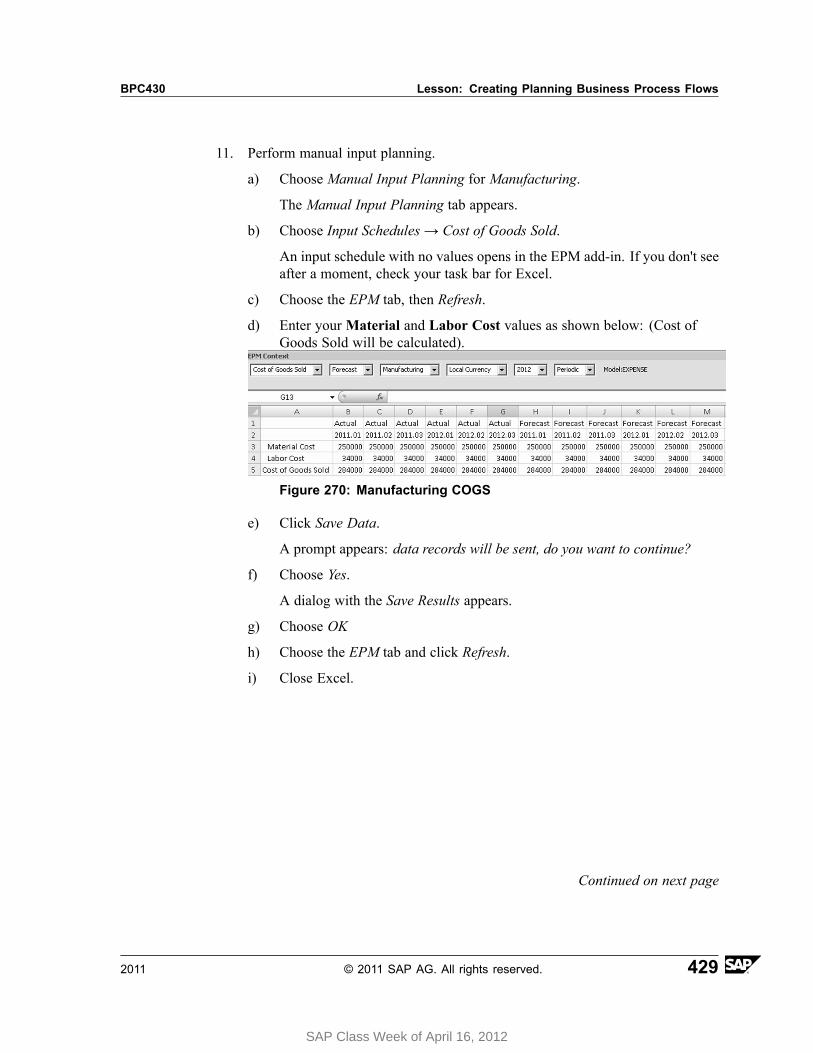
BPC430 Lesson: Creating Planning Business Process Flows
11. Perform manual input planning.
a) Choose Manual Input Planning for Manufacturing.
The Manual Input Planning tab appears.
b) Choose Input Schedules → Cost of Goods Sold.
An input schedule with no values opens in the EPM add-in. If you don't seeafter a moment, check your task bar for Excel.
c) Choose the EPM tab, then Refresh.
d) Enter yourMaterial and Labor Cost values as shown below: (Cost ofGoods Sold will be calculated).
Figure 270: Manufacturing COGS
e) Click Save Data.
A prompt appears: data records will be sent, do you want to continue?
f) Choose Yes.
A dialog with the Save Results appears.
g) Choose OK
h) Choose the EPM tab and click Refresh.
i) Close Excel.
Continued on next page
2011 © 2011 SAP AG. All rights reserved. 429
SAP Class Week of April 16, 2012
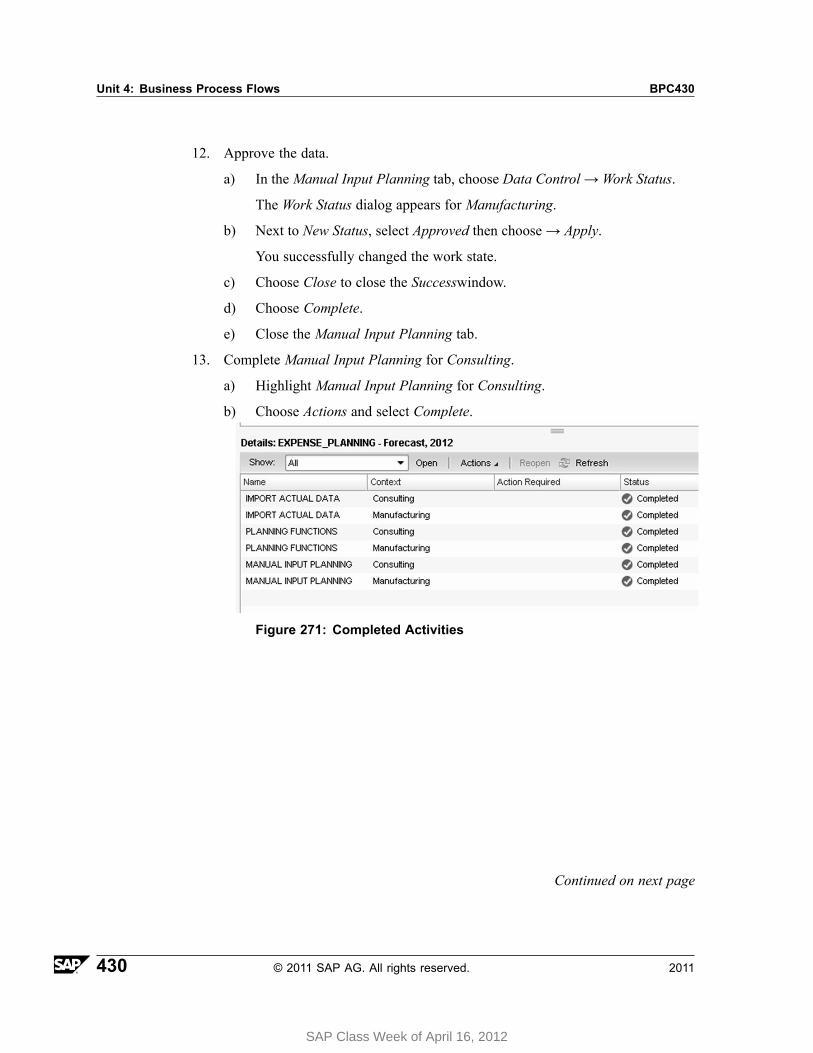
Unit 4: Business Process Flows BPC430
12. Approve the data.
a) In the Manual Input Planning tab, choose Data Control → Work Status.
The Work Status dialog appears for Manufacturing.
b) Next to New Status, select Approved then choose→ Apply.
You successfully changed the work state.
c) Choose Close to close the Successwindow.
d) Choose Complete.
e) Close the Manual Input Planning tab.
13. Complete Manual Input Planning for Consulting.
a) Highlight Manual Input Planning for Consulting.
b) Choose Actions and select Complete.
Figure 271: Completed Activities
Continued on next page
430 © 2011 SAP AG. All rights reserved. 2011
SAP Class Week of April 16, 2012

BPC430 Lesson: Creating Planning Business Process Flows
14. Run the Process Monitor.
a) On the Home tab, under Activities choose Process Monitor.
b) Click on Expense_Planning to view the results.
c) Close the EXPENSE_PLANNING tab after viewing.
d) In the Process Monitor highlight EXPENSE_PLANNING.
Figure 272: Process Monitor - Waiting Finalization
e) Choose Finalize.
15. Archive the Instance.
a) In Administration, under Business Process Flows → Process Instanceshighlight the instance EXPENSE_PLANNING - Forecast 2012 and chooseArchive.
Hint: If you do not have the Administration tab open, choose StartPage → Planning and Consolidation Administration.
The process instance will no longer appear in your Activities.
2011 © 2011 SAP AG. All rights reserved. 431
SAP Class Week of April 16, 2012
Unit 4: Business Process Flows BPC430
Lesson Summary
You should now be able to:• Create a Business Process Flow• Run a Business Process Flow
432 © 2011 SAP AG. All rights reserved. 2011
SAP Class Week of April 16, 2012

BPC430 Unit Summary
Unit SummaryYou should now be able to:• Create a Business Process Flow• Run a Business Process Flow
2011 © 2011 SAP AG. All rights reserved. 433
SAP Class Week of April 16, 2012

Unit Summary BPC430
434 © 2011 SAP AG. All rights reserved. 2011
SAP Class Week of April 16, 2012

SAP Class Week of April 16, 2012

SAP Class Week of April 16, 2012

Unit Summary BPC430
435 © 2011 SAP AG. All rights reserved. 2011
SAP Class Week of April 16, 2012

Unit Summary BPC430
436 © 2011 SAP AG. All rights reserved. 2011
SAP Class Week of April 16, 2012
Unit 5Web Integration
Unit OverviewThis unit includes the Web Interface, Web Reports, and Books
Unit ObjectivesAfter completing this unit, you will be able to:
• Describe the Home tab• Use the built-in screens• Use the Library and Workspaces to organize your reports• Explain functionality differences in the web and Excel clients• Set your context defaults• Create web reports• Create input forms• Create workspaces• Create Book Publication templates• Print workbooks• Publish to PDF
Unit ContentsLesson: Using The Web Client.. . . . . . . . . . . . . . . . . . . . . . . . . . . . . . . . . . . . . . . . . . . . . . . . . . .438Lesson: Using Web Reports, Input Forms, and Workspaces ... . . . . . . . . . . . . . .448
Exercise 16: Creating Web Reports, Web Input Forms, andWorkspaces ... . . . . . . . . . . . . . . . . . . . . . . . . . . . . . . . . . . . . . . . . . . . . . . . . . . . . . . . . . . . . . . . . . .455
Lesson: Publishing Books ... . . . . . . . . . . . . . . . . . . . . . . . . . . . . . . . . . . . . . . . . . . . . . . . . . . . . . .467Exercise 17: Using Books ... . . . . . . . . . . . . . . . . . . . . . . . . . . . . . . . . . . . . . . . . . . . . . . . . . .481
2011 © 2011 SAP AG. All rights reserved. 437
SAP Class Week of April 16, 2012

Unit 5: Web Integration BPC430
Lesson: Using The Web Client
Lesson OverviewIn this lesson, you will learn how to use the Web Client
Lesson ObjectivesAfter completing this lesson, you will be able to:
• Describe the Home tab• Use the built-in screens• Use the Library and Workspaces to organize your reports• Explain functionality differences in the web and Excel clients
Business ExampleYour users need an entry point for Planning and Consolidation to access theiractivities, documents, workspaces, and audit reports.
The Home TabThe web client is a good way for your users to access the web features as well as toconnect in the Excel Interface of the EPM add-in for example.
When you log in to the web client, you are taken to the Home tab and the Start Page.
The Header area of the Home Tab shows who is logged in, a button to log off, ahyperlink to customize a users’ preferences, and a hyperlink for Help.
The Home Tab can be broken into five main areas:
• Header area - Describes who is logged in, a link to change Preferences, and alink to Help
• Built-in screens - Activities, Process Monitor, Library, Documents, ConsolidationCentral, and Audit
• Create - Workspace, Report, and Input Forms• Launch area - To launch the EPM Add-in for Excel, EPM Add-in for Word,
EPM Add-in for PowerPoint, and Planning and Consolidation Administration• Footer - Shows the Environment you are currently in as well as links to view
your access rights, Download Center, and About (the product)
438 © 2011 SAP AG. All rights reserved. 2011
SAP Class Week of April 16, 2012

BPC430 Lesson: Using The Web Client
Figure 273: Home Tab - Start Page
Note: The Consolidation Central module in BusinessObjects Planning andConsolidation enables you to generate and manage consolidated data, givingyou an accurate view of the financial situation of your organization. WithinConsolidation Central, there are four sub steps: Consolidation Monitor,Controls Monitor, Journals, and Ownership Manager.
User PreferencesA user can customize the User Interface by adjusting the Text size (100, 150, or 200)percentage as well as the Theme. The default theme is Streamline, which is blackwith a white background.
The High Contrast Theme is solid black with white lettering and the Signature Themecontains a light blue background with black lettering.
Language, Time, Date and Number format can also be customized by the user.
2011 © 2011 SAP AG. All rights reserved. 439
SAP Class Week of April 16, 2012
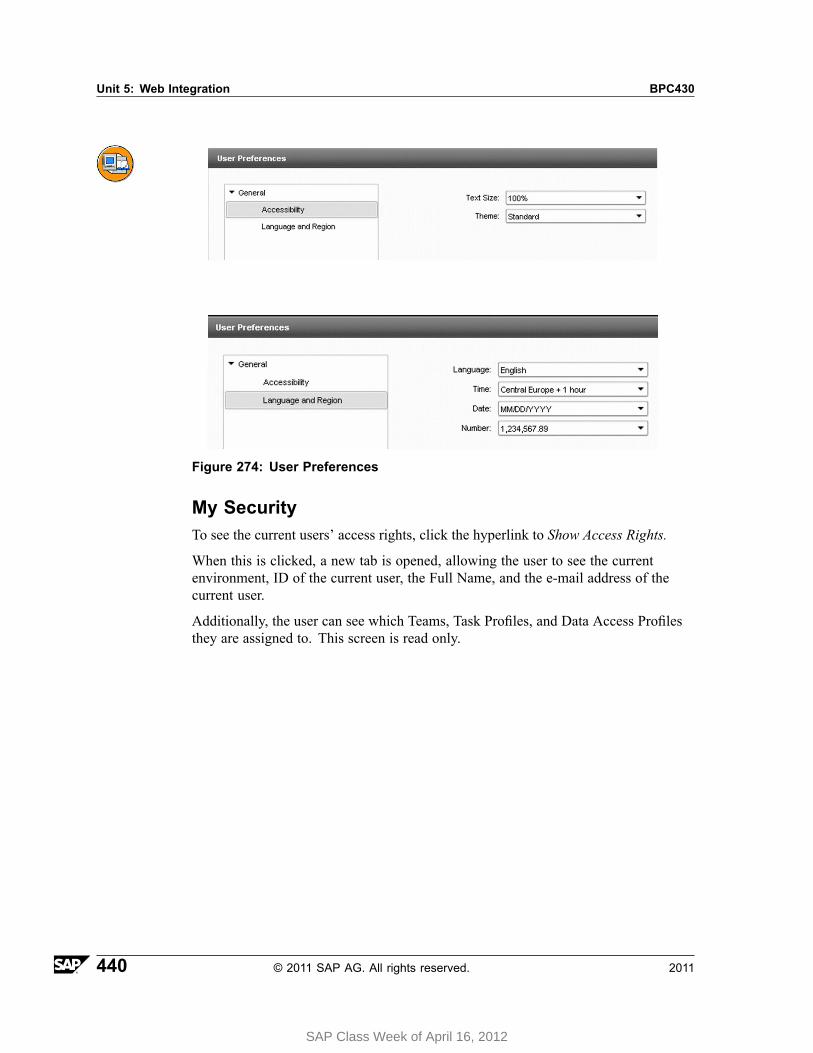
Unit 5: Web Integration BPC430
Figure 274: User Preferences
My SecurityTo see the current users’ access rights, click the hyperlink to Show Access Rights.
When this is clicked, a new tab is opened, allowing the user to see the currentenvironment, ID of the current user, the Full Name, and the e-mail address of thecurrent user.
Additionally, the user can see which Teams, Task Profiles, and Data Access Profilesthey are assigned to. This screen is read only.
440 © 2011 SAP AG. All rights reserved. 2011
SAP Class Week of April 16, 2012
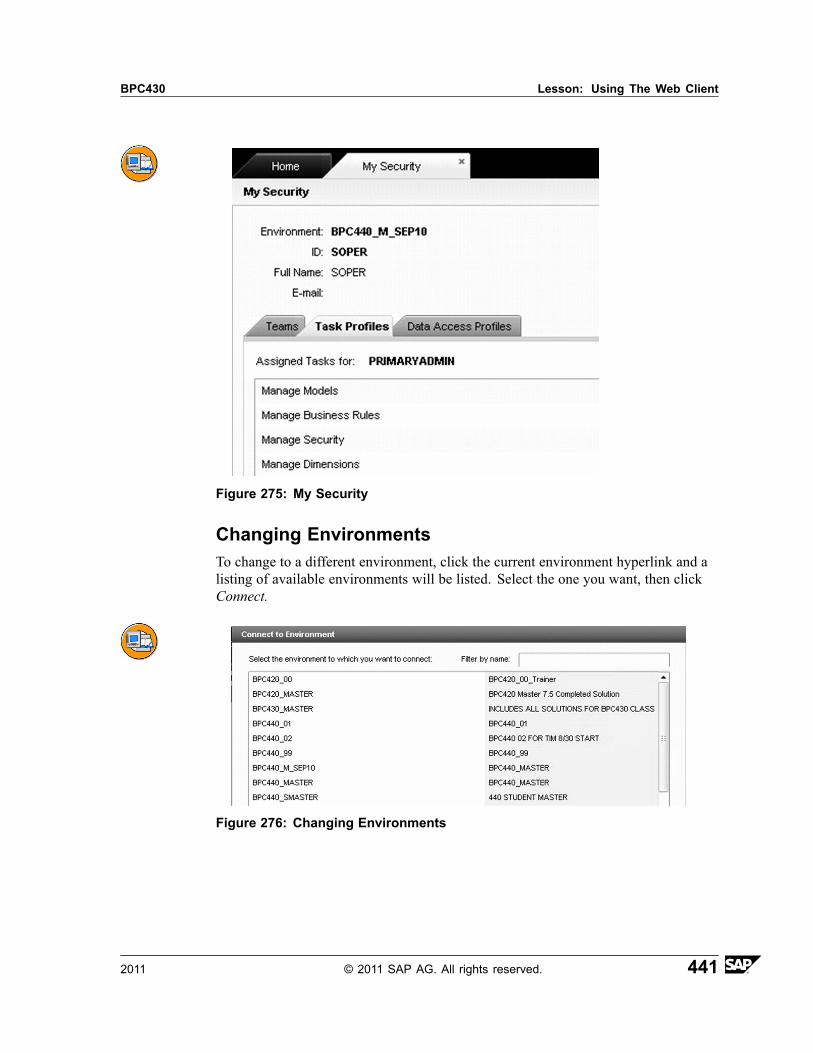
BPC430 Lesson: Using The Web Client
Figure 275: My Security
Changing EnvironmentsTo change to a different environment, click the current environment hyperlink and alisting of available environments will be listed. Select the one you want, then clickConnect.
Figure 276: Changing Environments
2011 © 2011 SAP AG. All rights reserved. 441
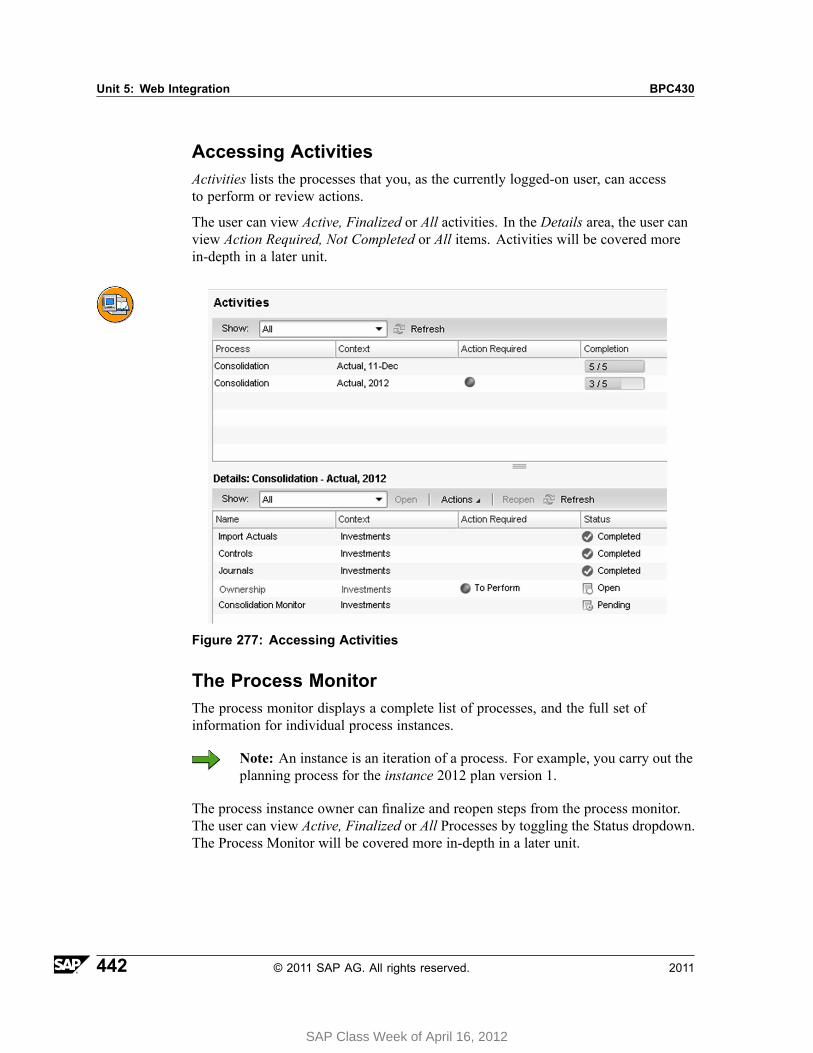
Unit 5: Web Integration BPC430
Accessing ActivitiesActivities lists the processes that you, as the currently logged-on user, can accessto perform or review actions.
The user can view Active, Finalized or All activities. In the Details area, the user canview Action Required, Not Completed or All items. Activities will be covered morein-depth in a later unit.
Figure 277: Accessing Activities
The Process MonitorThe process monitor displays a complete list of processes, and the full set ofinformation for individual process instances.
Note: An instance is an iteration of a process. For example, you carry out theplanning process for the instance 2012 plan version 1.
The process instance owner can finalize and reopen steps from the process monitor.The user can view Active, Finalized or All Processes by toggling the Status dropdown.The Process Monitor will be covered more in-depth in a later unit.
442 © 2011 SAP AG. All rights reserved. 2011
SAP Class Week of April 16, 2012
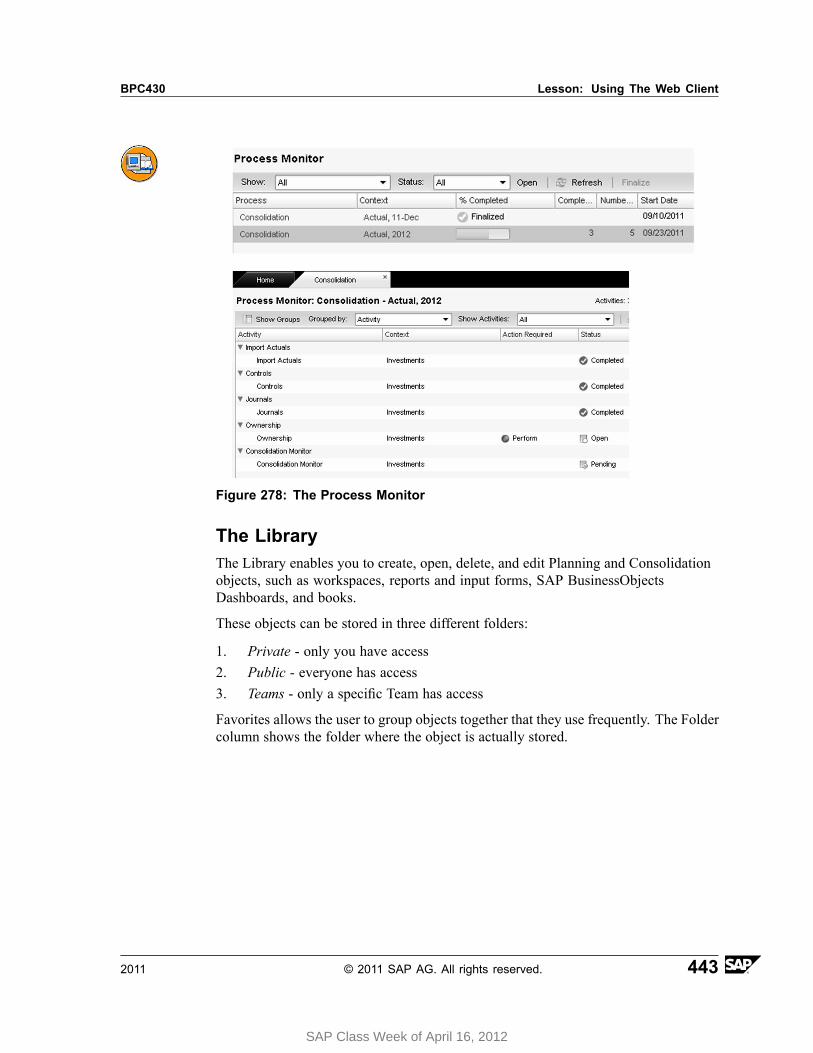
BPC430 Lesson: Using The Web Client
Figure 278: The Process Monitor
The LibraryThe Library enables you to create, open, delete, and edit Planning and Consolidationobjects, such as workspaces, reports and input forms, SAP BusinessObjectsDashboards, and books.
These objects can be stored in three different folders:
1. Private - only you have access2. Public - everyone has access3. Teams - only a specific Team has access
Favorites allows the user to group objects together that they use frequently. The Foldercolumn shows the folder where the object is actually stored.
2011 © 2011 SAP AG. All rights reserved. 443
SAP Class Week of April 16, 2012
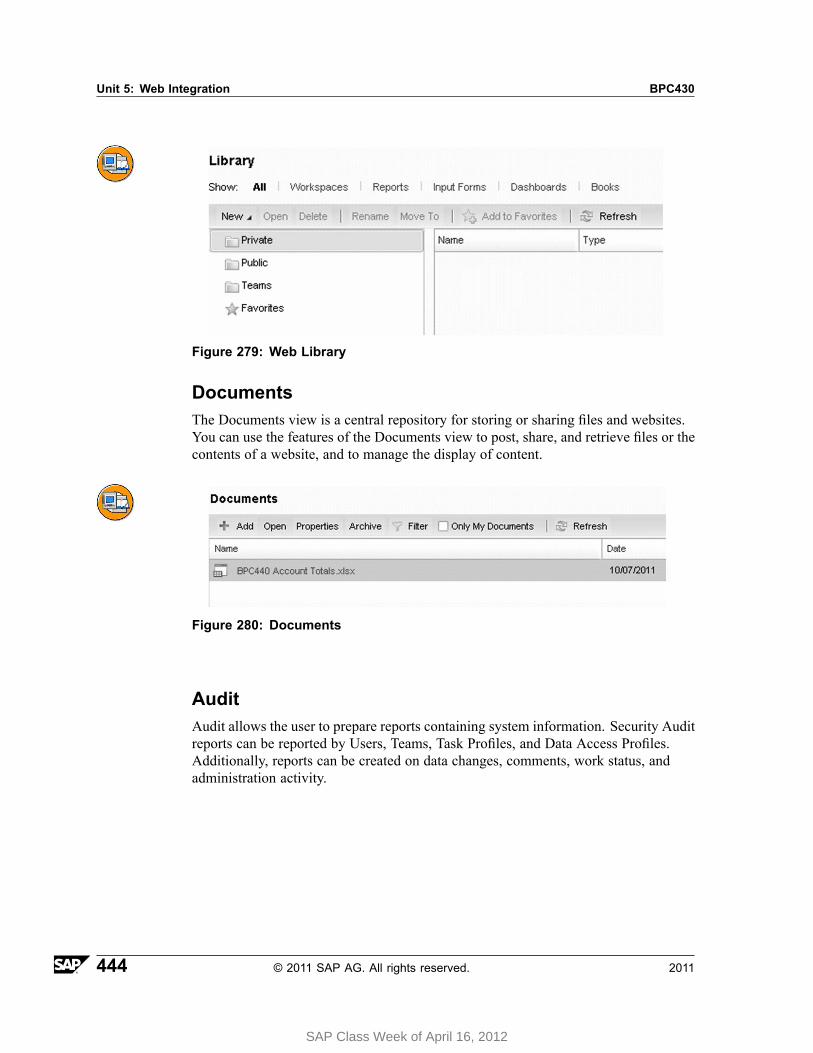
Unit 5: Web Integration BPC430
Figure 279: Web Library
DocumentsThe Documents view is a central repository for storing or sharing files and websites.You can use the features of the Documents view to post, share, and retrieve files or thecontents of a website, and to manage the display of content.
Figure 280: Documents
AuditAudit allows the user to prepare reports containing system information. Security Auditreports can be reported by Users, Teams, Task Profiles, and Data Access Profiles.Additionally, reports can be created on data changes, comments, work status, andadministration activity.
444 © 2011 SAP AG. All rights reserved. 2011
SAP Class Week of April 16, 2012
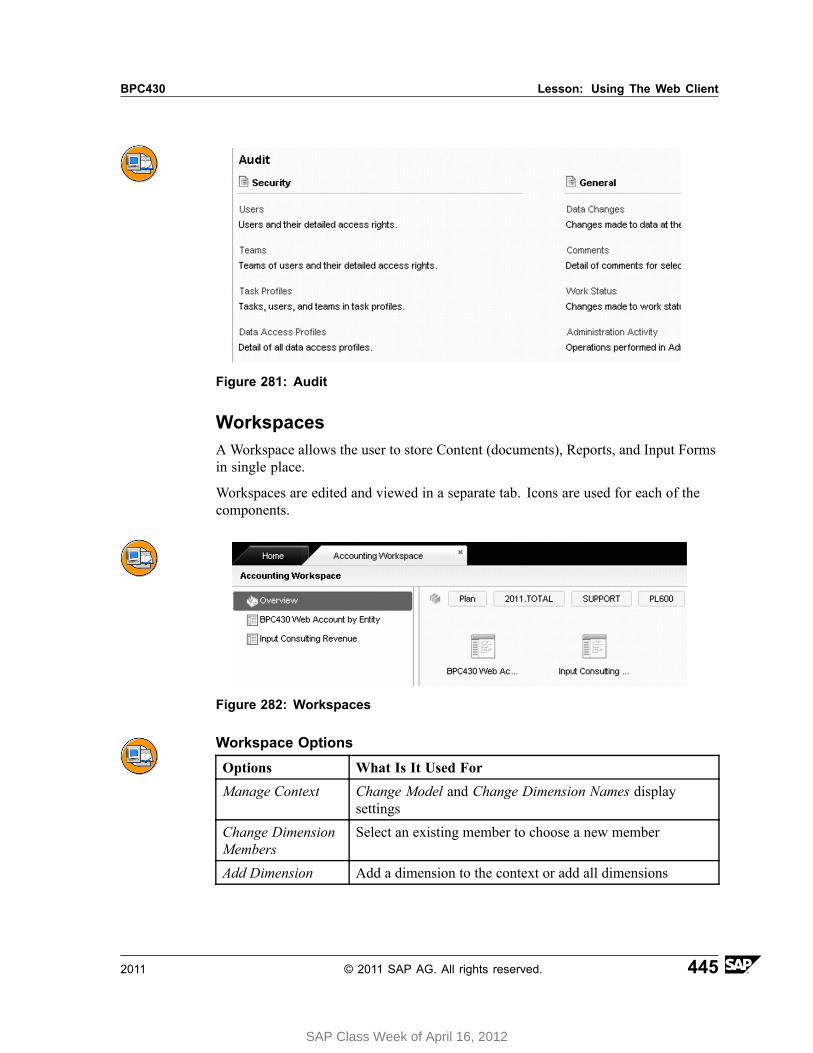
BPC430 Lesson: Using The Web Client
Figure 281: Audit
WorkspacesA Workspace allows the user to store Content (documents), Reports, and Input Formsin single place.
Workspaces are edited and viewed in a separate tab. Icons are used for each of thecomponents.
Figure 282: Workspaces
Workspace Options
Options What Is It Used For
Manage Context Change Model and Change Dimension Names displaysettings
Change DimensionMembers
Select an existing member to choose a new member
Add Dimension Add a dimension to the context or add all dimensions
2011 © 2011 SAP AG. All rights reserved. 445
SAP Class Week of April 16, 2012
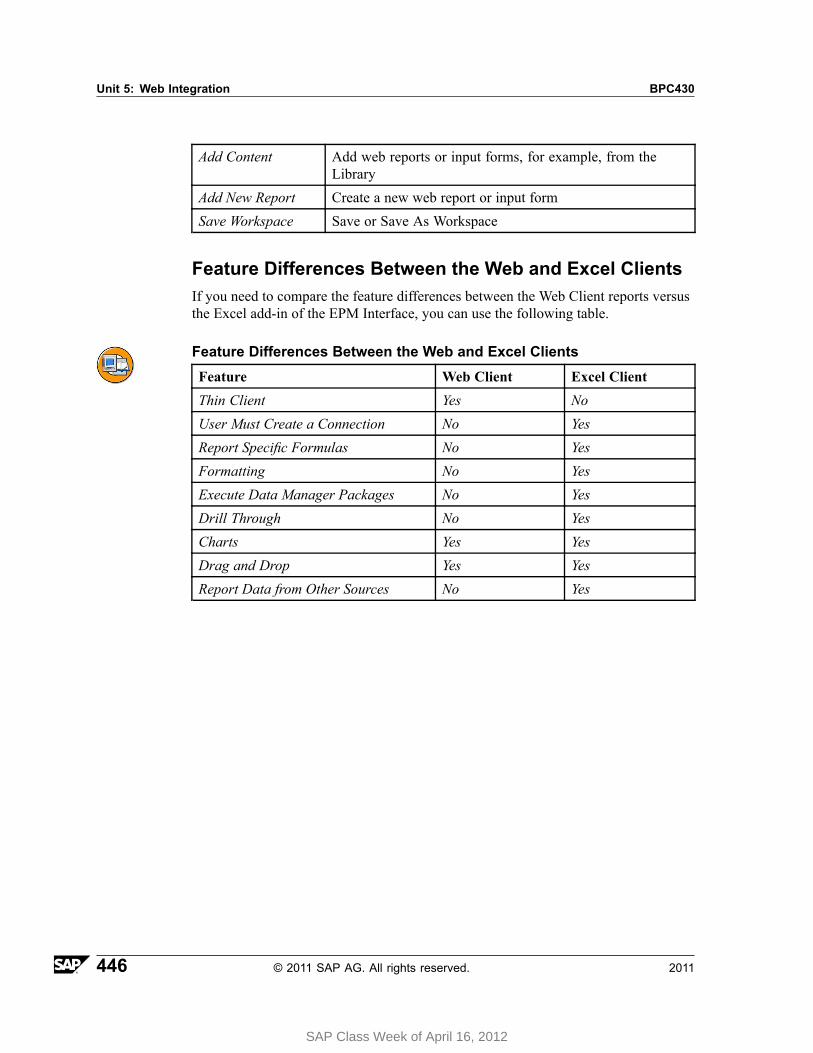
Unit 5: Web Integration BPC430
Add Content Add web reports or input forms, for example, from theLibrary
Add New Report Create a new web report or input form
Save Workspace Save or Save As Workspace
Feature Differences Between the Web and Excel ClientsIf you need to compare the feature differences between the Web Client reports versusthe Excel add-in of the EPM Interface, you can use the following table.
Feature Differences Between the Web and Excel Clients
Feature Web Client Excel Client
Thin Client Yes No
User Must Create a Connection No Yes
Report Specific Formulas No Yes
Formatting No Yes
Execute Data Manager Packages No Yes
Drill Through No Yes
Charts Yes Yes
Drag and Drop Yes Yes
Report Data from Other Sources No Yes
446 © 2011 SAP AG. All rights reserved. 2011
SAP Class Week of April 16, 2012
BPC430 Lesson: Using The Web Client
Lesson Summary
You should now be able to:• Describe the Home tab• Use the built-in screens• Use the Library and Workspaces to organize your reports• Explain functionality differences in the web and Excel clients
2011 © 2011 SAP AG. All rights reserved. 447
SAP Class Week of April 16, 2012
Unit 5: Web Integration BPC430
Lesson: UsingWeb Reports, Input Forms, andWorkspaces
Lesson OverviewIn this lesson you will learn how to work with web reports, input forms, andworkspaces.
Lesson ObjectivesAfter completing this lesson, you will be able to:
• Set your context defaults• Create web reports• Create input forms• Create workspaces
Business ExampleYou need a way to organize your reports and so you are interested in the Library andWorkspaces. Your users also need to do some reporting and light data input in a thinclient, the web reports and input forms can easily serve that purpose.
Context DefaultsContext Defaults control the initial settings when working in the web interface.
They are accessed from the Start Page → Planning and Consolidation Administration.
You can make the following settings for each dimension of a selected model:
• A default member for the scope context initialized for Reporting in web reports• A default member for the scope context initialized for Data Input in web input
forms• Whether the dimension is displayed or not in the scope context• Whether the name of the dimension is displayed in the scope context or not• Whether the name, ID, or both of the member is displayed
448 © 2011 SAP AG. All rights reserved. 2011
SAP Class Week of April 16, 2012
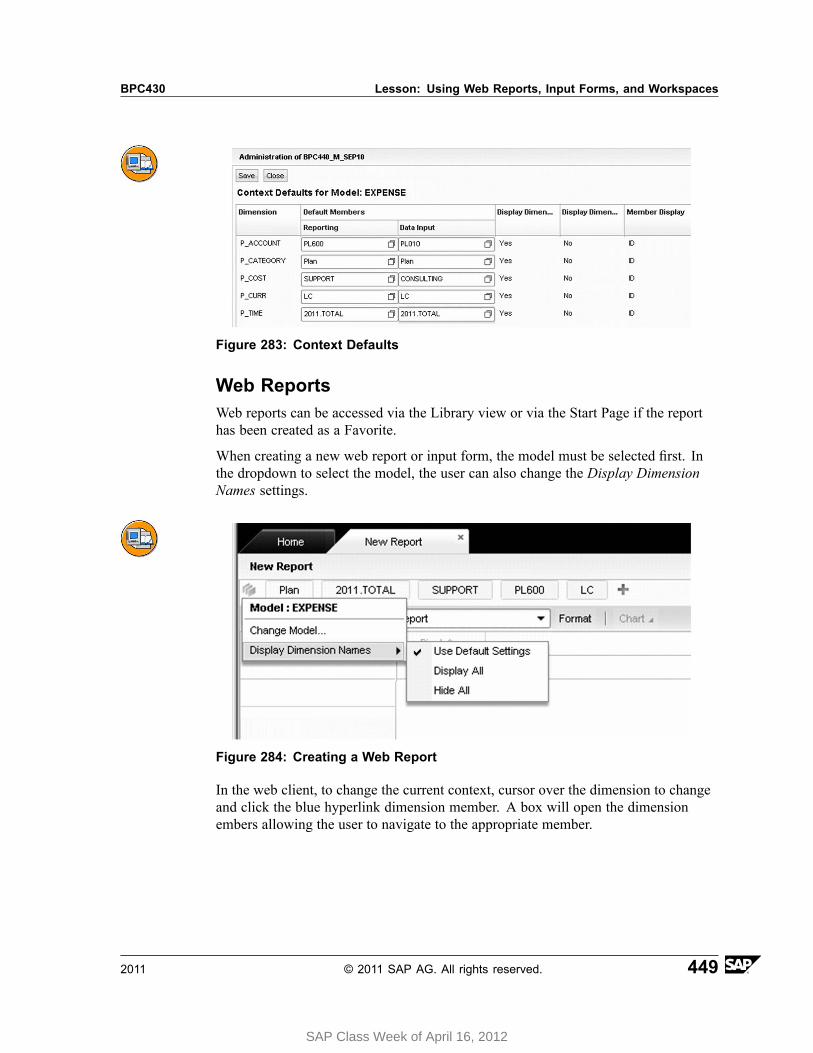
BPC430 Lesson: Using Web Reports, Input Forms, and Workspaces
Figure 283: Context Defaults
Web ReportsWeb reports can be accessed via the Library view or via the Start Page if the reporthas been created as a Favorite.
When creating a new web report or input form, the model must be selected first. Inthe dropdown to select the model, the user can also change the Display DimensionNames settings.
Figure 284: Creating a Web Report
In the web client, to change the current context, cursor over the dimension to changeand click the blue hyperlink dimension member. A box will open the dimensionembers allowing the user to navigate to the appropriate member.
2011 © 2011 SAP AG. All rights reserved. 449
SAP Class Week of April 16, 2012
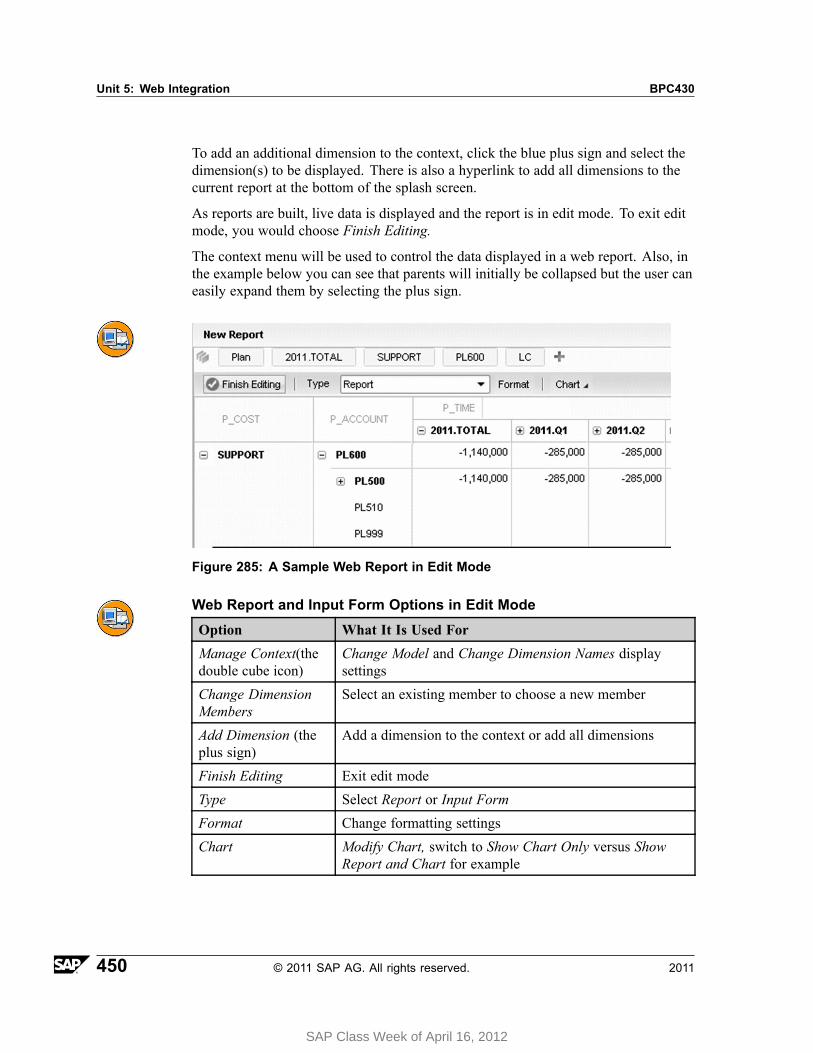
Unit 5: Web Integration BPC430
To add an additional dimension to the context, click the blue plus sign and select thedimension(s) to be displayed. There is also a hyperlink to add all dimensions to thecurrent report at the bottom of the splash screen.
As reports are built, live data is displayed and the report is in edit mode. To exit editmode, you would choose Finish Editing.
The context menu will be used to control the data displayed in a web report. Also, inthe example below you can see that parents will initially be collapsed but the user caneasily expand them by selecting the plus sign.
Figure 285: A Sample Web Report in Edit Mode
Web Report and Input Form Options in Edit Mode
Option What It Is Used For
Manage Context(thedouble cube icon)
Change Model and Change Dimension Names displaysettings
Change DimensionMembers
Select an existing member to choose a new member
Add Dimension (theplus sign)
Add a dimension to the context or add all dimensions
Finish Editing Exit edit mode
Type Select Report or Input Form
Format Change formatting settings
Chart Modify Chart, switch to Show Chart Only versus ShowReport and Chart for example
450 © 2011 SAP AG. All rights reserved. 2011
SAP Class Week of April 16, 2012
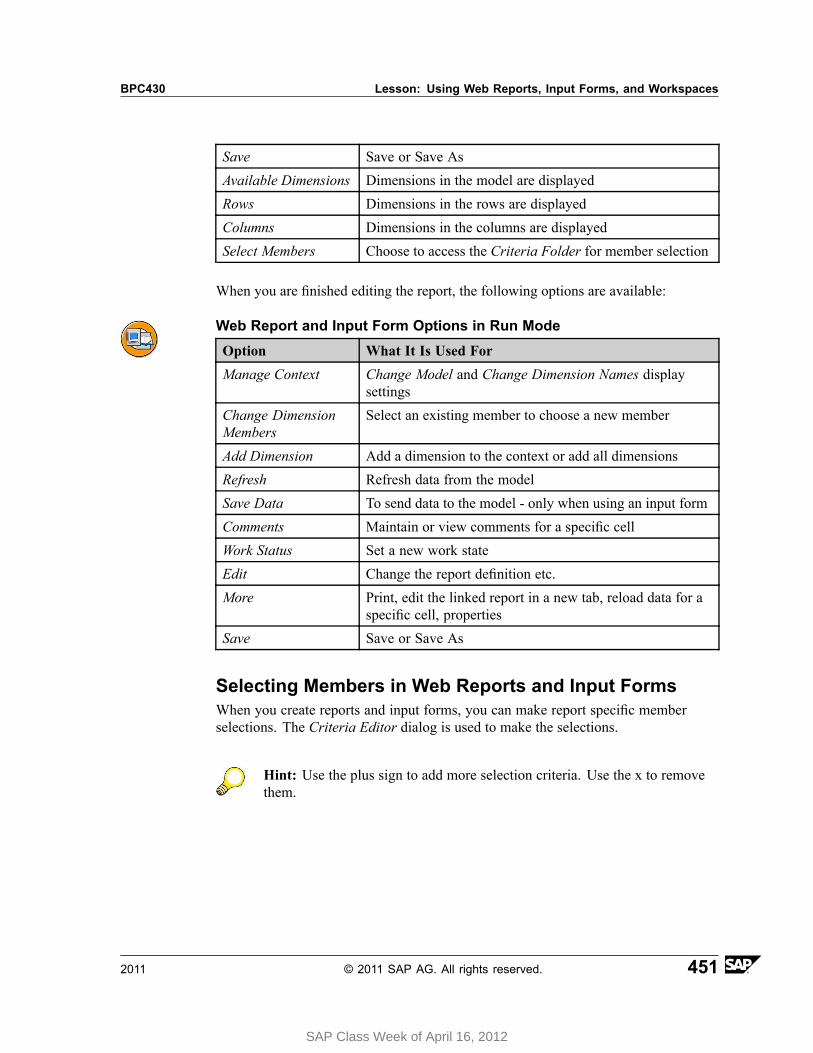
BPC430 Lesson: Using Web Reports, Input Forms, and Workspaces
Save Save or Save As
Available Dimensions Dimensions in the model are displayed
Rows Dimensions in the rows are displayed
Columns Dimensions in the columns are displayed
Select Members Choose to access the Criteria Folder for member selection
When you are finished editing the report, the following options are available:
Web Report and Input Form Options in Run Mode
Option What It Is Used For
Manage Context Change Model and Change Dimension Names displaysettings
Change DimensionMembers
Select an existing member to choose a new member
Add Dimension Add a dimension to the context or add all dimensions
Refresh Refresh data from the model
Save Data To send data to the model - only when using an input form
Comments Maintain or view comments for a specific cell
Work Status Set a new work state
Edit Change the report definition etc.
More Print, edit the linked report in a new tab, reload data for aspecific cell, properties
Save Save or Save As
Selecting Members in Web Reports and Input FormsWhen you create reports and input forms, you can make report specific memberselections. The Criteria Editor dialog is used to make the selections.
Hint: Use the plus sign to add more selection criteria. Use the x to removethem.
2011 © 2011 SAP AG. All rights reserved. 451
SAP Class Week of April 16, 2012
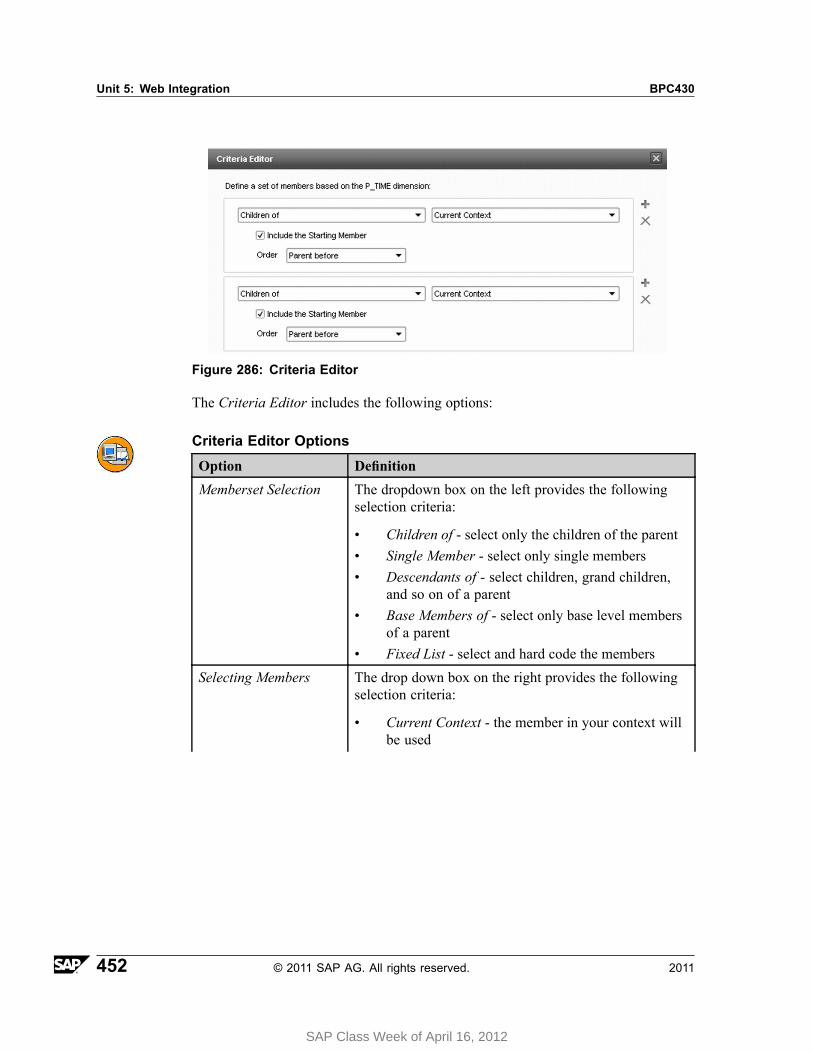
Unit 5: Web Integration BPC430
Figure 286: Criteria Editor
The Criteria Editor includes the following options:
Criteria Editor Options
Option Definition
Memberset Selection The dropdown box on the left provides the followingselection criteria:
• Children of - select only the children of the parent• Single Member - select only single members• Descendants of - select children, grand children,
and so on of a parent• Base Members of - select only base level members
of a parent• Fixed List - select and hard code the members
Selecting Members The drop down box on the right provides the followingselection criteria:
• Current Context - the member in your context willbe used
452 © 2011 SAP AG. All rights reserved. 2011
SAP Class Week of April 16, 2012
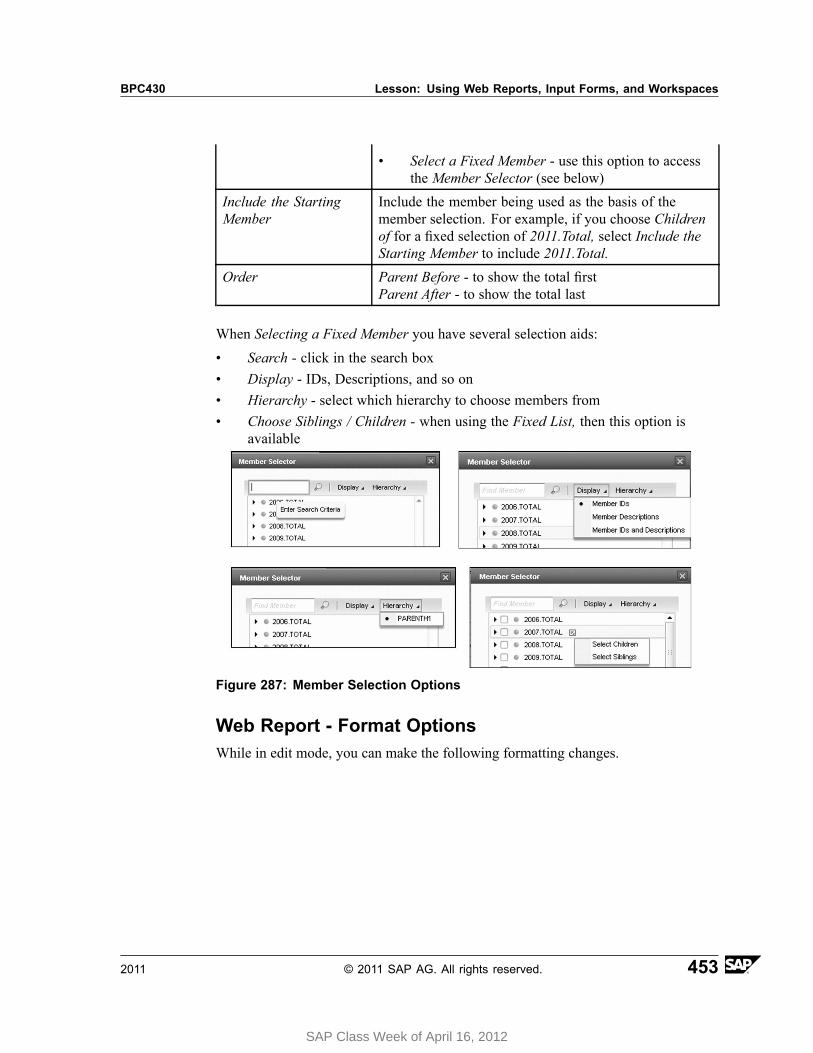
BPC430 Lesson: Using Web Reports, Input Forms, and Workspaces
• Select a Fixed Member - use this option to accessthe Member Selector (see below)
Include the StartingMember
Include the member being used as the basis of themember selection. For example, if you choose Childrenof for a fixed selection of 2011.Total, select Include theStarting Member to include 2011.Total.
Order Parent Before - to show the total firstParent After - to show the total last
When Selecting a Fixed Member you have several selection aids:
• Search - click in the search box• Display - IDs, Descriptions, and so on• Hierarchy - select which hierarchy to choose members from• Choose Siblings / Children - when using the Fixed List, then this option is
available
Figure 287: Member Selection Options
Web Report - Format OptionsWhile in edit mode, you can make the following formatting changes.
2011 © 2011 SAP AG. All rights reserved. 453
SAP Class Week of April 16, 2012
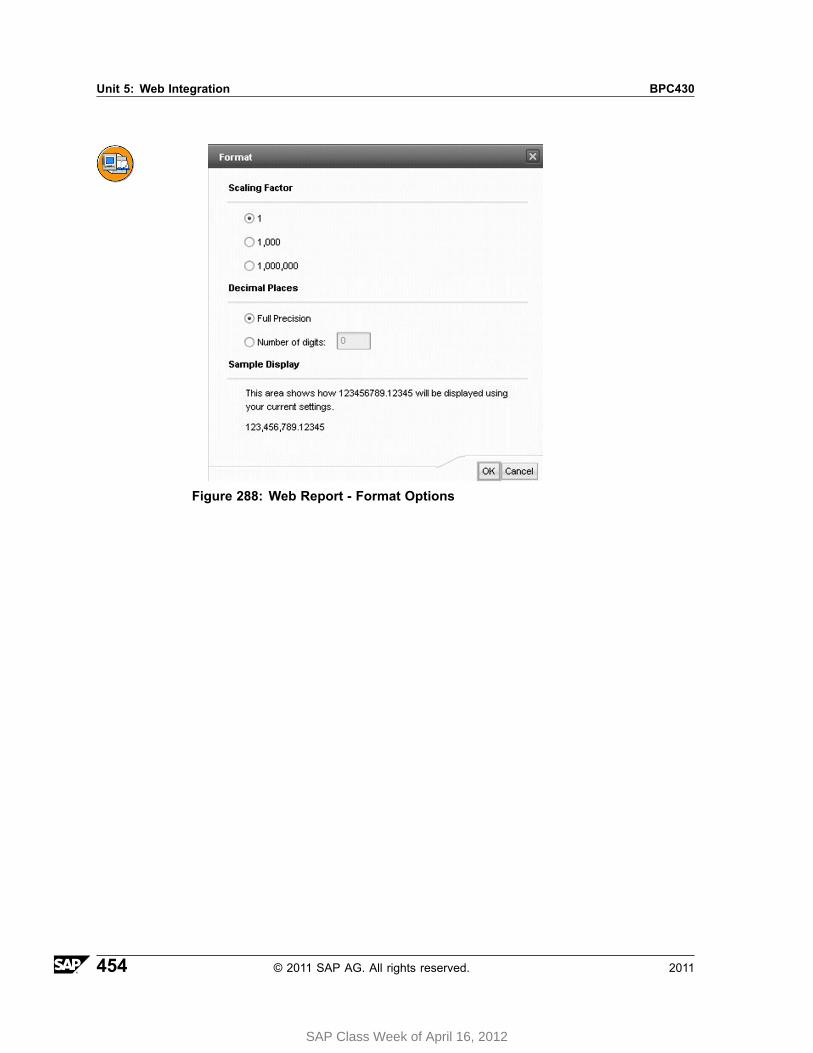
Unit 5: Web Integration BPC430
Figure 288: Web Report - Format Options
454 © 2011 SAP AG. All rights reserved. 2011
SAP Class Week of April 16, 2012
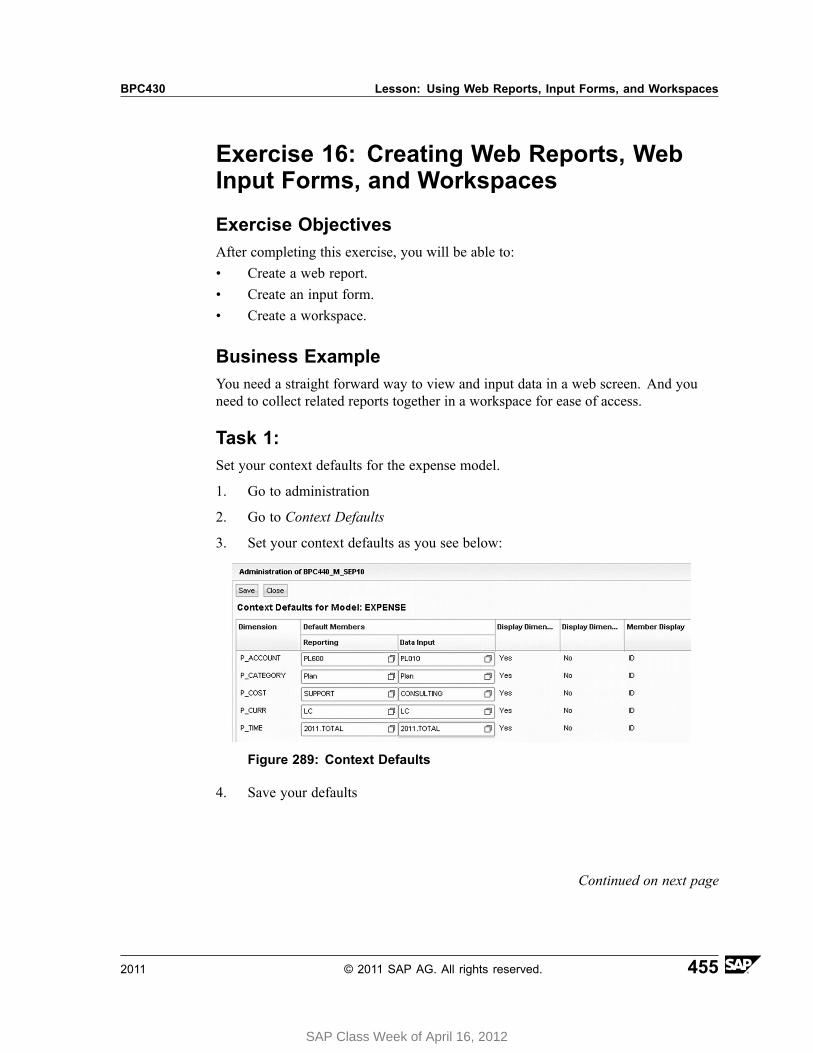
BPC430 Lesson: Using Web Reports, Input Forms, and Workspaces
Exercise 16: Creating Web Reports, WebInput Forms, and Workspaces
Exercise ObjectivesAfter completing this exercise, you will be able to:• Create a web report.• Create an input form.• Create a workspace.
Business ExampleYou need a straight forward way to view and input data in a web screen. And youneed to collect related reports together in a workspace for ease of access.
Task 1:Set your context defaults for the expense model.
1. Go to administration
2. Go to Context Defaults
3. Set your context defaults as you see below:
Figure 289: Context Defaults
4. Save your defaults
Continued on next page
2011 © 2011 SAP AG. All rights reserved. 455
SAP Class Week of April 16, 2012
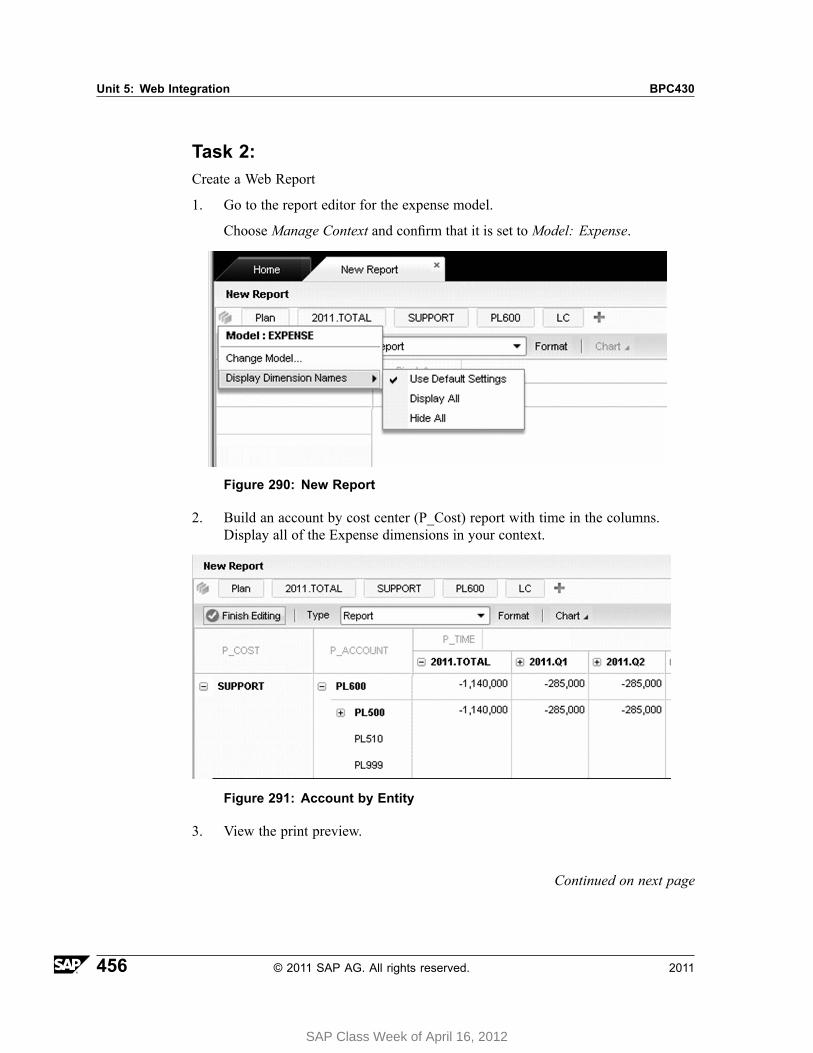
Unit 5: Web Integration BPC430
Task 2:Create a Web Report
1. Go to the report editor for the expense model.
Choose Manage Context and confirm that it is set to Model: Expense.
Figure 290: New Report
2. Build an account by cost center (P_Cost) report with time in the columns.Display all of the Expense dimensions in your context.
Figure 291: Account by Entity
3. View the print preview.
Continued on next page
456 © 2011 SAP AG. All rights reserved. 2011
SAP Class Week of April 16, 2012

BPC430 Lesson: Using Web Reports, Input Forms, and Workspaces
Figure 292: Print View
4. Save the report to the public folder as BPC430 Web Account by Entity.
Task 3:Create a Web Input Form.
1. Go to the input form editor for the expense model.
2. Build an input form with account in the rows and time in the columns
3. Display only months in the columns.
4. Display only base level accounts for in the rows.
5. Save the input form to the public folder as BPC430 Web Account Trend.
Task 4:Create a new workspace and add your web report and input form.
1. Create a new workspace.
2. Add your BPC430 Web Account by Entity.
3. Add your BPC430 Web Account Trend.
4. Save the workspace as Accounting Workspace.
2011 © 2011 SAP AG. All rights reserved. 457
SAP Class Week of April 16, 2012
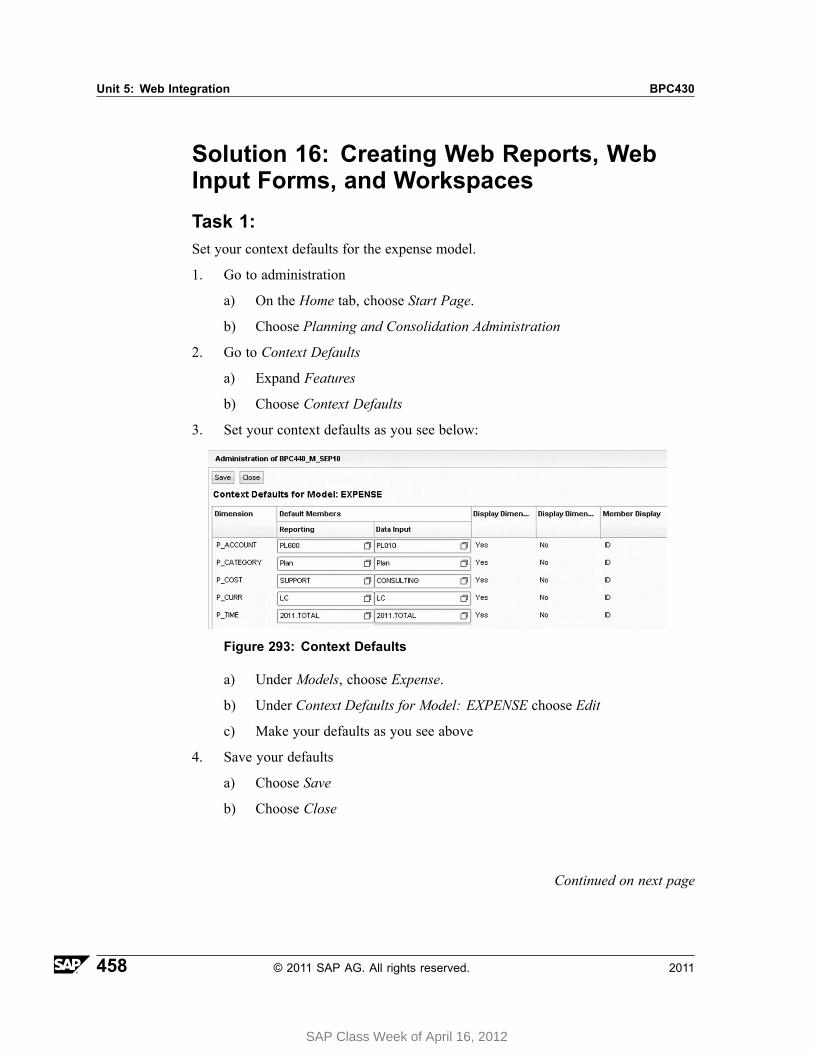
Unit 5: Web Integration BPC430
Solution 16: Creating Web Reports, WebInput Forms, and WorkspacesTask 1:Set your context defaults for the expense model.
1. Go to administration
a) On the Home tab, choose Start Page.
b) Choose Planning and Consolidation Administration
2. Go to Context Defaults
a) Expand Features
b) Choose Context Defaults
3. Set your context defaults as you see below:
Figure 293: Context Defaults
a) Under Models, choose Expense.
b) Under Context Defaults for Model: EXPENSE choose Edit
c) Make your defaults as you see above
4. Save your defaults
a) Choose Save
b) Choose Close
Continued on next page
458 © 2011 SAP AG. All rights reserved. 2011
SAP Class Week of April 16, 2012
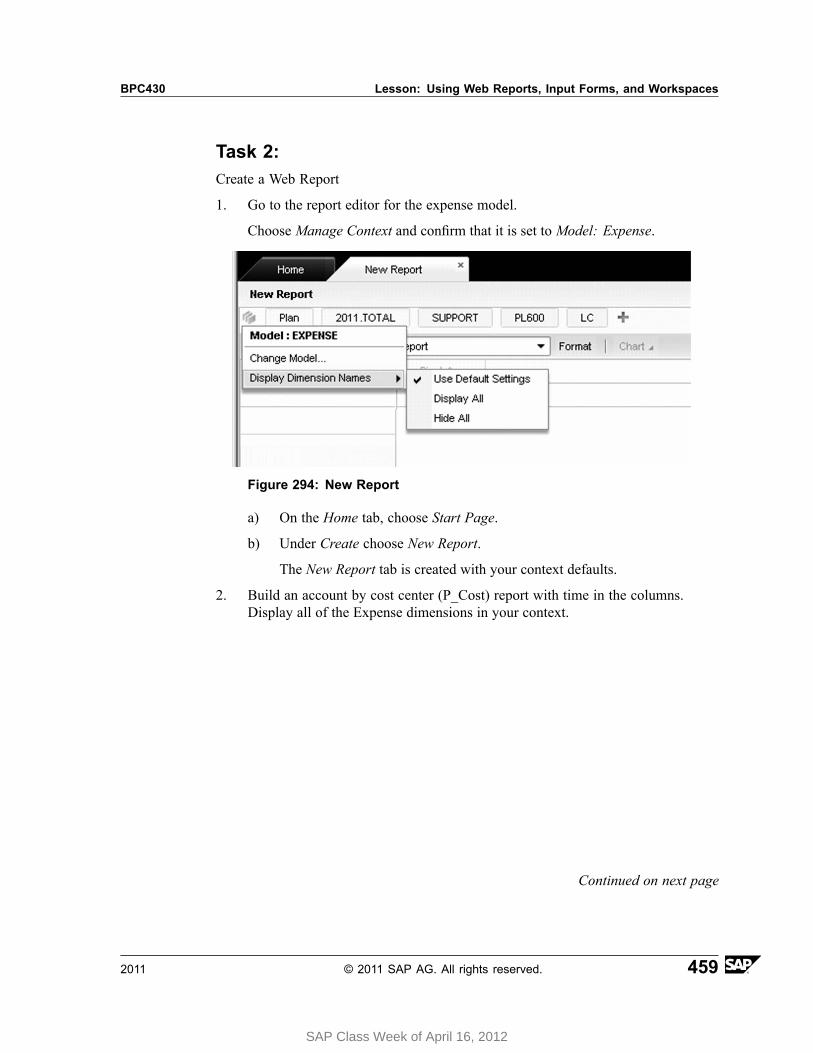
BPC430 Lesson: Using Web Reports, Input Forms, and Workspaces
Task 2:Create a Web Report
1. Go to the report editor for the expense model.
Choose Manage Context and confirm that it is set to Model: Expense.
Figure 294: New Report
a) On the Home tab, choose Start Page.
b) Under Create choose New Report.
The New Report tab is created with your context defaults.
2. Build an account by cost center (P_Cost) report with time in the columns.Display all of the Expense dimensions in your context.
Continued on next page
2011 © 2011 SAP AG. All rights reserved. 459
SAP Class Week of April 16, 2012
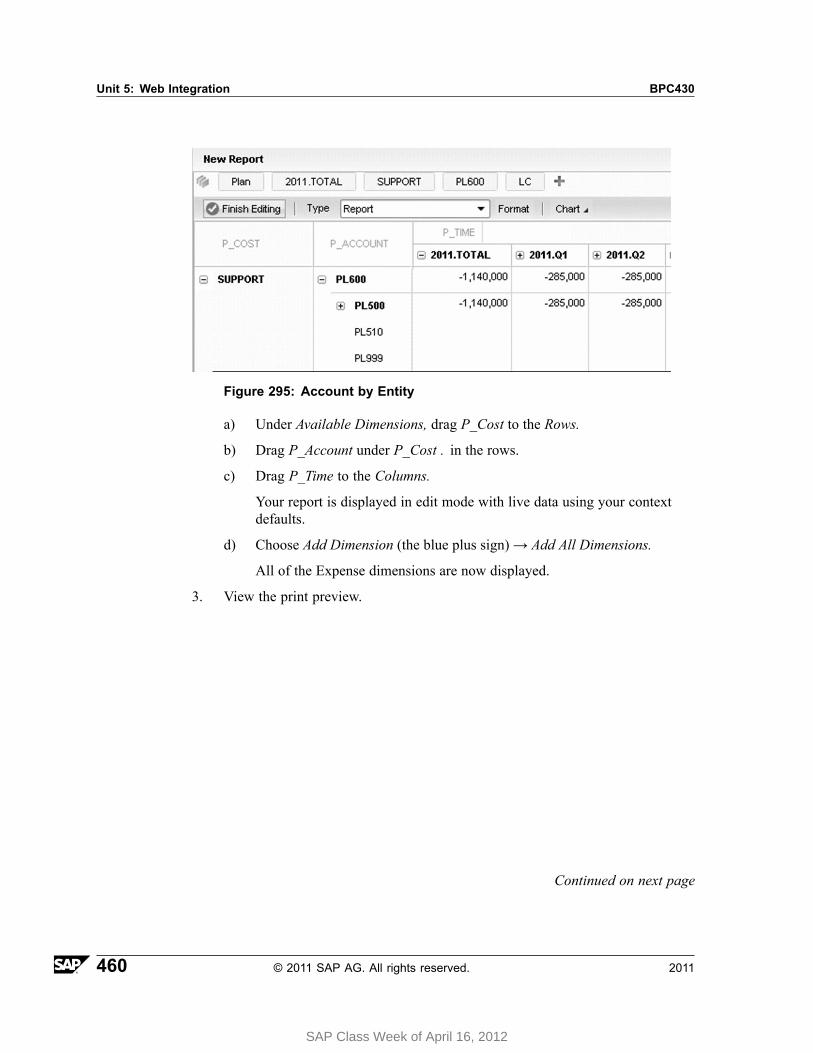
Unit 5: Web Integration BPC430
Figure 295: Account by Entity
a) Under Available Dimensions, drag P_Cost to the Rows.
b) Drag P_Account under P_Cost . in the rows.
c) Drag P_Time to the Columns.
Your report is displayed in edit mode with live data using your contextdefaults.
d) Choose Add Dimension (the blue plus sign)→ Add All Dimensions.
All of the Expense dimensions are now displayed.
3. View the print preview.
Continued on next page
460 © 2011 SAP AG. All rights reserved. 2011
SAP Class Week of April 16, 2012
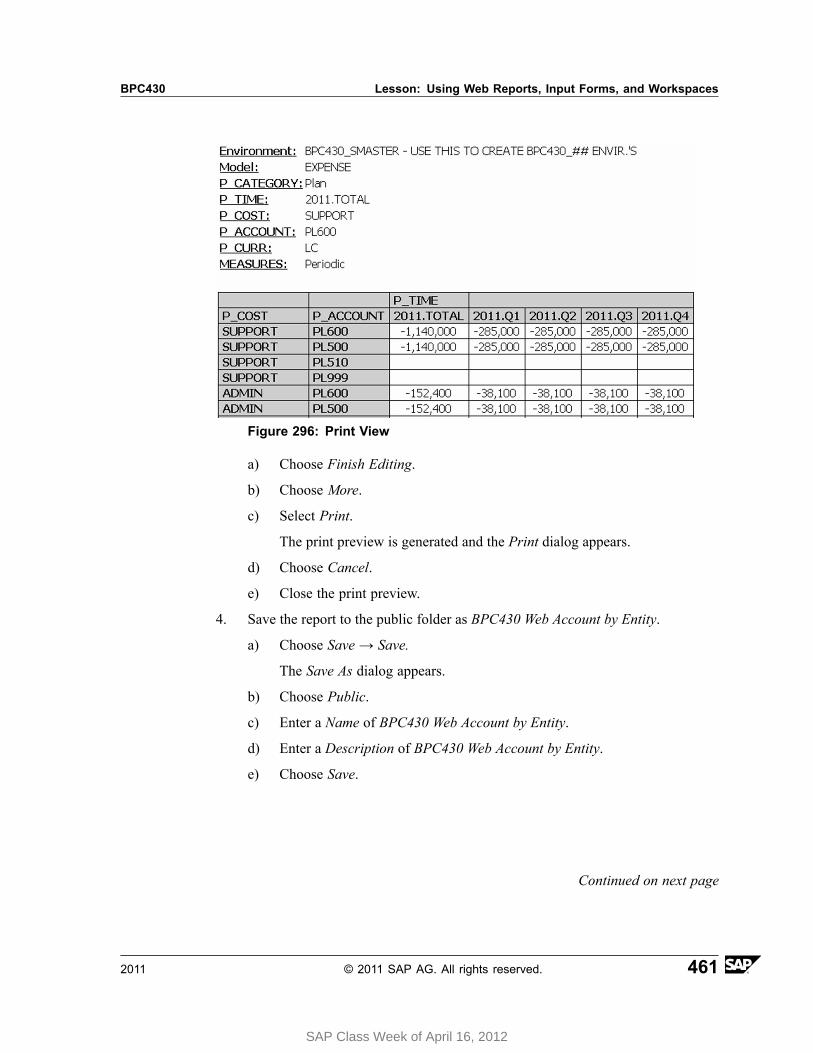
BPC430 Lesson: Using Web Reports, Input Forms, and Workspaces
Figure 296: Print View
a) Choose Finish Editing.
b) Choose More.
c) Select Print.
The print preview is generated and the Print dialog appears.
d) Choose Cancel.
e) Close the print preview.
4. Save the report to the public folder as BPC430 Web Account by Entity.
a) Choose Save → Save.
The Save As dialog appears.
b) Choose Public.
c) Enter a Name of BPC430 Web Account by Entity.
d) Enter a Description of BPC430 Web Account by Entity.
e) Choose Save.
Continued on next page
2011 © 2011 SAP AG. All rights reserved. 461
SAP Class Week of April 16, 2012
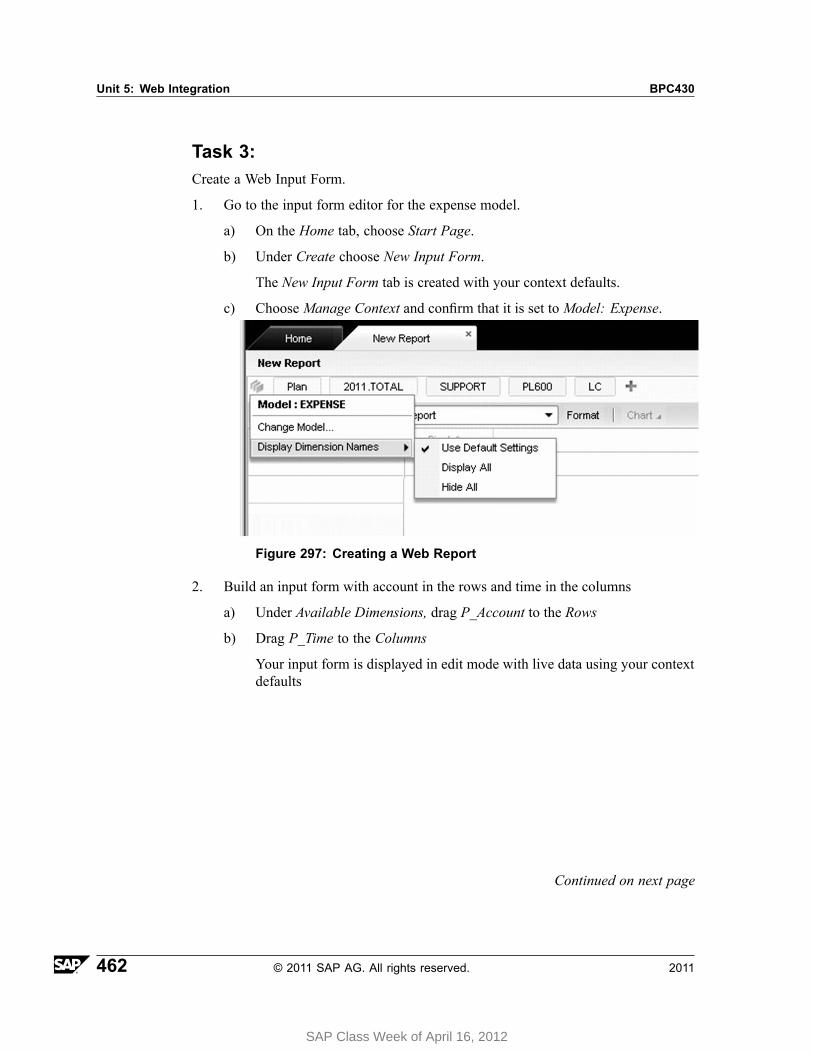
Unit 5: Web Integration BPC430
Task 3:Create a Web Input Form.
1. Go to the input form editor for the expense model.
a) On the Home tab, choose Start Page.
b) Under Create choose New Input Form.
The New Input Form tab is created with your context defaults.
c) Choose Manage Context and confirm that it is set to Model: Expense.
Figure 297: Creating a Web Report
2. Build an input form with account in the rows and time in the columns
a) Under Available Dimensions, drag P_Account to the Rows
b) Drag P_Time to the Columns
Your input form is displayed in edit mode with live data using your contextdefaults
Continued on next page
462 © 2011 SAP AG. All rights reserved. 2011
SAP Class Week of April 16, 2012

BPC430 Lesson: Using Web Reports, Input Forms, and Workspaces
3. Display only months in the columns.
a) Under Columns choose P_Time→ Select Members.
The Criteria Editor dialog appears.
b) Choose Children of and select→ Base Members of.
c) Deselect Include the Starting Member.
Figure 298: Criteria Editor
d) Choose OK.
The months for 2011 are displayed in the columns but not 2011.Total sinceyou did not include the Starting Member.
4. Display only base level accounts for in the rows.
a) Under Rows choose P_Account→ Select Members.
The Criteria Editor dialog appears.
b) Choose Children of and select→ Base Members of.
c) De-select Include the Starting Member.
d) In the right drop down box Select a Fixed Member.
The Member Selector opens.
e) Select PL600 (Net Income)
f) Choose OK twice.
The base level accounts of the PL600 (Net Income) parent are displayedin the rows.
Continued on next page
2011 © 2011 SAP AG. All rights reserved. 463
SAP Class Week of April 16, 2012

Unit 5: Web Integration BPC430
5. Save the input form to the public folder as BPC430 Web Account Trend.
a) Choose Save → Save
The Save As dialog appears.
b) Choose Public.
c) Enter a Name of BPC430 Web Account Trend.
d) Enter a Description of BPC430 Web Account Trend.
e) Choose Save.
Task 4:Create a new workspace and add your web report and input form.
1. Create a new workspace.
a) In the Home tab, choose Start Page.
b) Under Create choose New Workspace.
The Untitled Workspace tab is created with your context defaults.
2. Add your BPC430 Web Account by Entity.
a) Choose Add Content.
b) Select Public.
c) Select BPC430 Web Account by Entity.
d) Choose OK.
The result set is displayed in your workspace.
3. Add your BPC430 Web Account Trend.
a) Choose Add Content.
b) Select Public.
c) Select BPC430 Web Account Trend.
d) Choose OK.
The result set is displayed in your workspace.
Continued on next page
464 © 2011 SAP AG. All rights reserved. 2011
SAP Class Week of April 16, 2012

BPC430 Lesson: Using Web Reports, Input Forms, and Workspaces
4. Save the workspace as Accounting Workspace.
a) Choose Save Workspace → Save Workspace.
b) Select Private.
c) Next to Name enter Accounting Workspace.
d) Next to Description enter Accounting Workspace.
e) Choose Save.
f) Choose Overview
Figure 299: Accounting Workspace
The web report and input form are displayed as icons in the workspace.
2011 © 2011 SAP AG. All rights reserved. 465
SAP Class Week of April 16, 2012
Unit 5: Web Integration BPC430
Lesson Summary
You should now be able to:• Set your context defaults• Create web reports• Create input forms• Create workspaces
466 © 2011 SAP AG. All rights reserved. 2011
SAP Class Week of April 16, 2012
BPC430 Lesson: Publishing Books
Lesson: Publishing Books
Lesson OverviewIn this lesson, you will learn how to publish books.
Lesson ObjectivesAfter completing this lesson, you will be able to:
• Create Book Publication templates• Print workbooks• Publish to PDF
Business ExampleYou need a way to generate precalculated data in pdf format for flash reporting.
OverviewYou can use book publication to either print or generate pdfs in the Home tab in theLibrary section.
Below you can see the Book Publication options in the EPM Ribbon.
2011 © 2011 SAP AG. All rights reserved. 467
SAP Class Week of April 16, 2012
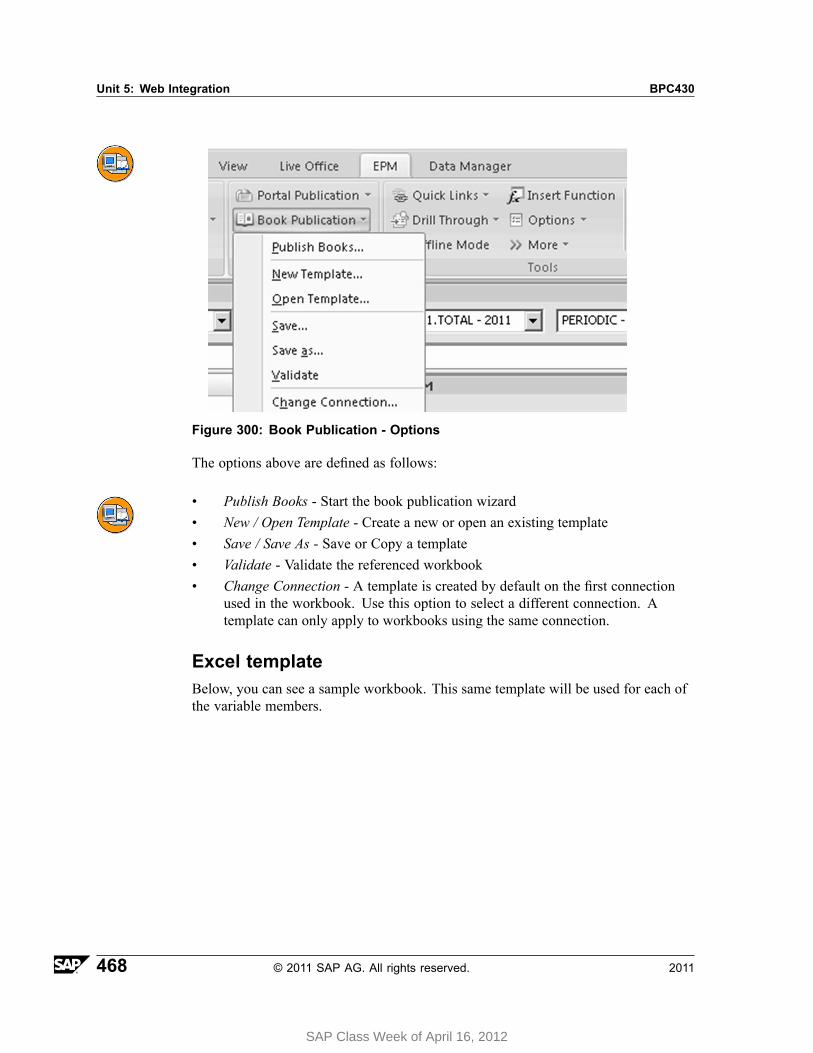
Unit 5: Web Integration BPC430
Figure 300: Book Publication - Options
The options above are defined as follows:
• Publish Books - Start the book publication wizard• New / Open Template - Create a new or open an existing template• Save / Save As - Save or Copy a template• Validate - Validate the referenced workbook• Change Connection - A template is created by default on the first connection
used in the workbook. Use this option to select a different connection. Atemplate can only apply to workbooks using the same connection.
Excel templateBelow, you can see a sample workbook. This same template will be used for each ofthe variable members.
468 © 2011 SAP AG. All rights reserved. 2011
SAP Class Week of April 16, 2012
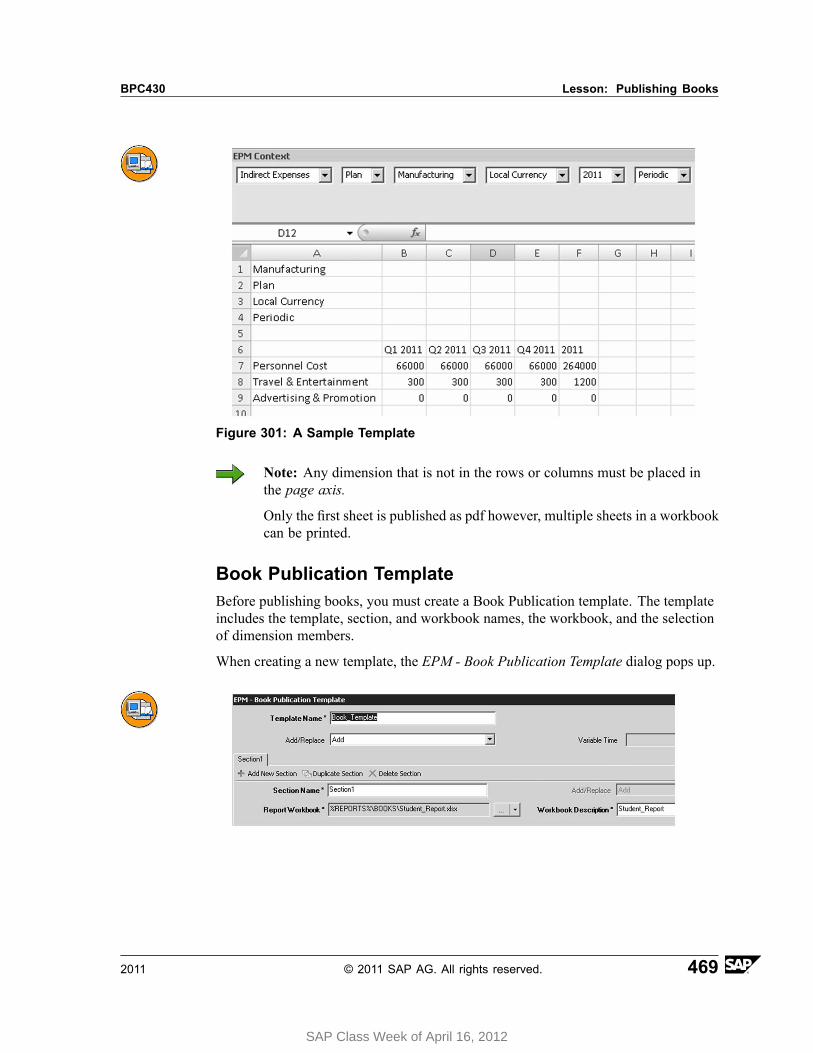
BPC430 Lesson: Publishing Books
Figure 301: A Sample Template
Note: Any dimension that is not in the rows or columns must be placed inthe page axis.
Only the first sheet is published as pdf however, multiple sheets in a workbookcan be printed.
Book Publication TemplateBefore publishing books, you must create a Book Publication template. The templateincludes the template, section, and workbook names, the workbook, and the selectionof dimension members.
When creating a new template, the EPM - Book Publication Template dialog pops up.
2011 © 2011 SAP AG. All rights reserved. 469
SAP Class Week of April 16, 2012
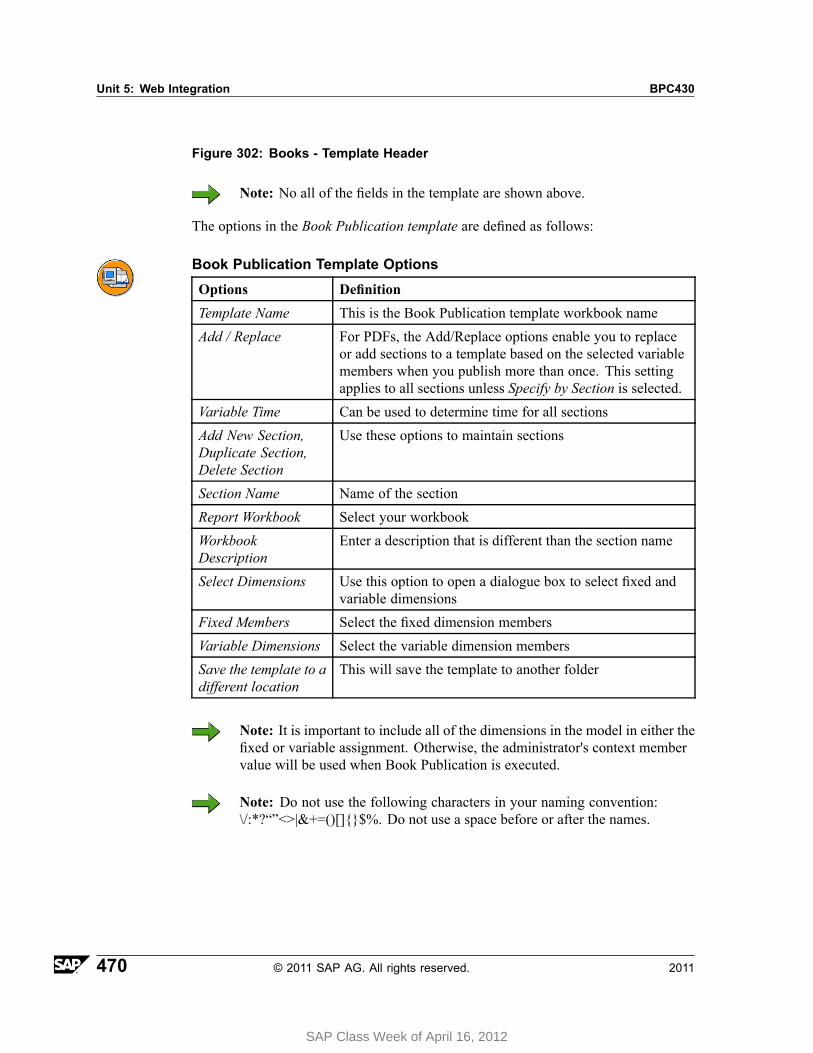
Unit 5: Web Integration BPC430
Figure 302: Books - Template Header
Note: No all of the fields in the template are shown above.
The options in the Book Publication template are defined as follows:
Book Publication Template Options
Options Definition
Template Name This is the Book Publication template workbook name
Add / Replace For PDFs, the Add/Replace options enable you to replaceor add sections to a template based on the selected variablemembers when you publish more than once. This settingapplies to all sections unless Specify by Section is selected.
Variable Time Can be used to determine time for all sections
Add New Section,Duplicate Section,Delete Section
Use these options to maintain sections
Section Name Name of the section
Report Workbook Select your workbook
WorkbookDescription
Enter a description that is different than the section name
Select Dimensions Use this option to open a dialogue box to select fixed andvariable dimensions
Fixed Members Select the fixed dimension members
Variable Dimensions Select the variable dimension members
Save the template to adifferent location
This will save the template to another folder
Note: It is important to include all of the dimensions in the model in either thefixed or variable assignment. Otherwise, the administrator's context membervalue will be used when Book Publication is executed.
Note: Do not use the following characters in your naming convention:\/:*?“”<>|&+=()[]{}$%. Do not use a space before or after the names.
470 © 2011 SAP AG. All rights reserved. 2011
SAP Class Week of April 16, 2012
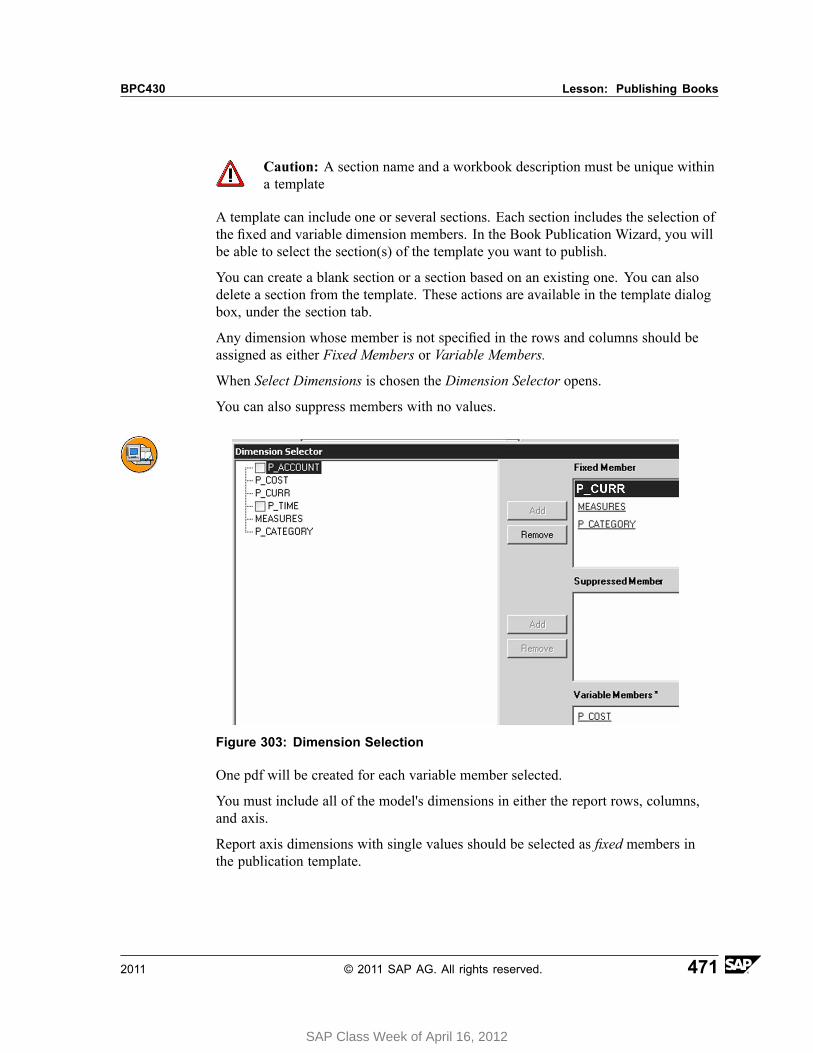
BPC430 Lesson: Publishing Books
Caution: A section name and a workbook description must be unique withina template
A template can include one or several sections. Each section includes the selection ofthe fixed and variable dimension members. In the Book Publication Wizard, you willbe able to select the section(s) of the template you want to publish.
You can create a blank section or a section based on an existing one. You can alsodelete a section from the template. These actions are available in the template dialogbox, under the section tab.
Any dimension whose member is not specified in the rows and columns should beassigned as either Fixed Members or Variable Members.
When Select Dimensions is chosen the Dimension Selector opens.
You can also suppress members with no values.
Figure 303: Dimension Selection
One pdf will be created for each variable member selected.
You must include all of the model's dimensions in either the report rows, columns,and axis.
Report axis dimensions with single values should be selected as fixed members inthe publication template.
2011 © 2011 SAP AG. All rights reserved. 471
SAP Class Week of April 16, 2012

Unit 5: Web Integration BPC430
Report axis dimensions with multiple values should be selected as variable membersin the publication template.
Below, you can see an example.
Figure 304: Fixed and Variable Selections
Note: A dimension can only be fixed or variable, not both.
In the result set, the members are displayed according to the followingprecedence:
1. Members selected in the row and column axis2. Members selected as fixed or variable3. Members in the page axis4. Members in the context
The Excel template below is generated when the Book Publication template is saved.
472 © 2011 SAP AG. All rights reserved. 2011
SAP Class Week of April 16, 2012
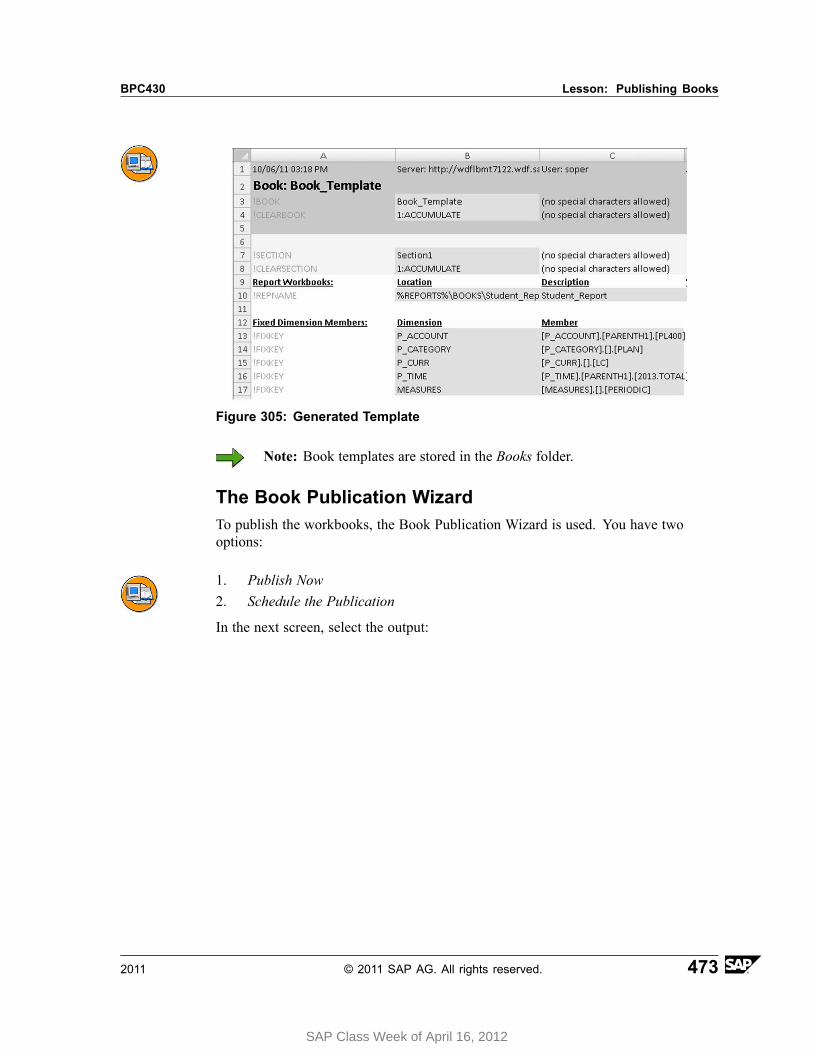
BPC430 Lesson: Publishing Books
Figure 305: Generated Template
Note: Book templates are stored in the Books folder.
The Book Publication WizardTo publish the workbooks, the Book Publication Wizard is used. You have twooptions:
1. Publish Now2. Schedule the Publication
In the next screen, select the output:
2011 © 2011 SAP AG. All rights reserved. 473
SAP Class Week of April 16, 2012

Unit 5: Web Integration BPC430
Figure 306: Publication Format
If you choose to print the books, you can use the following options:
1. Print one sheet for all dimensions member combinations.
• This option enables you to define the printing order• This option is not checked by default• For example, if a workbook contains two sheets and the variable members
that you have selected in the template are: Spain and Italy, the printingwill be performed in the following order: Sheet 1 - Spain, Sheet 1 - Italy,Sheet 2 - Spain, Sheet 2 - Italy.
• If you do not select the option, the printing will be performed in thefollowing order: Sheet 1 - Spain, Sheet 2 - Spain, Sheet 1 - Italy, Sheet2 - Italy.
2. Print sheets with no data
• This option enables you to specify that a sheet will be printed even if itdoes not contain any data
• This option is not checked by default
If the Single PDF option is selected, you can name the file and choose Local Folder orLibrary destinations: Public, Private, Teams
474 © 2011 SAP AG. All rights reserved. 2011
SAP Class Week of April 16, 2012
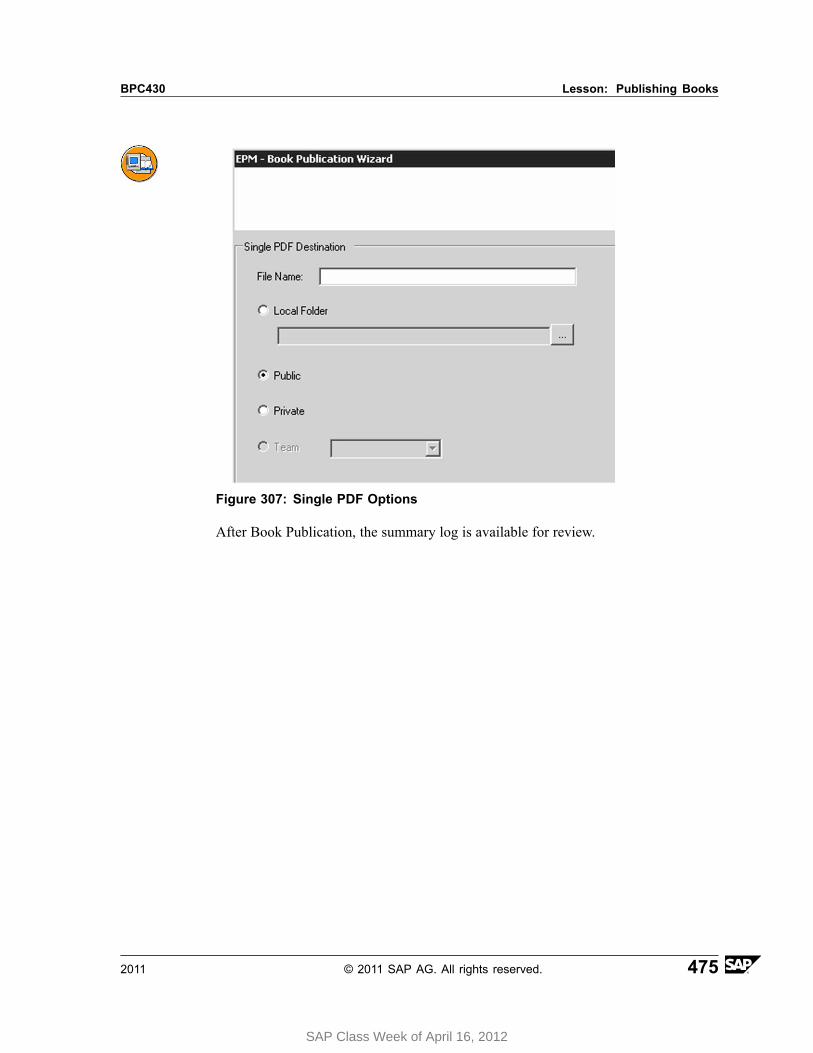
BPC430 Lesson: Publishing Books
Figure 307: Single PDF Options
After Book Publication, the summary log is available for review.
2011 © 2011 SAP AG. All rights reserved. 475
SAP Class Week of April 16, 2012
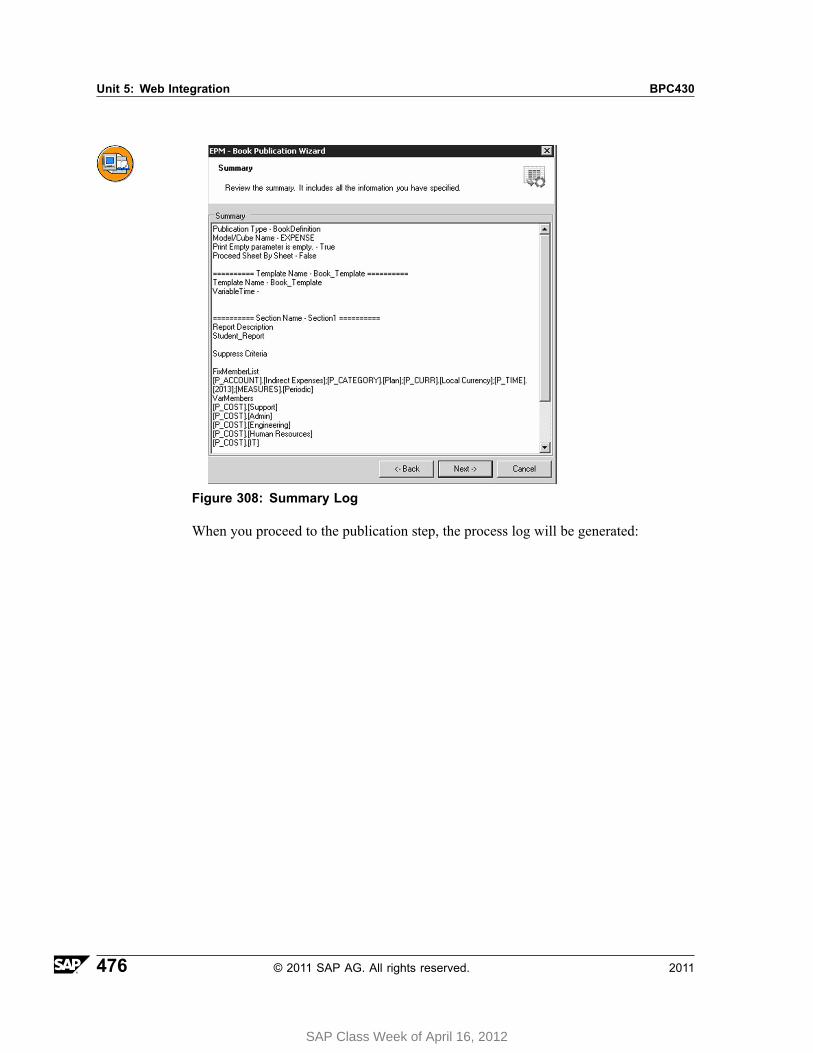
Unit 5: Web Integration BPC430
Figure 308: Summary Log
When you proceed to the publication step, the process log will be generated:
476 © 2011 SAP AG. All rights reserved. 2011
SAP Class Week of April 16, 2012
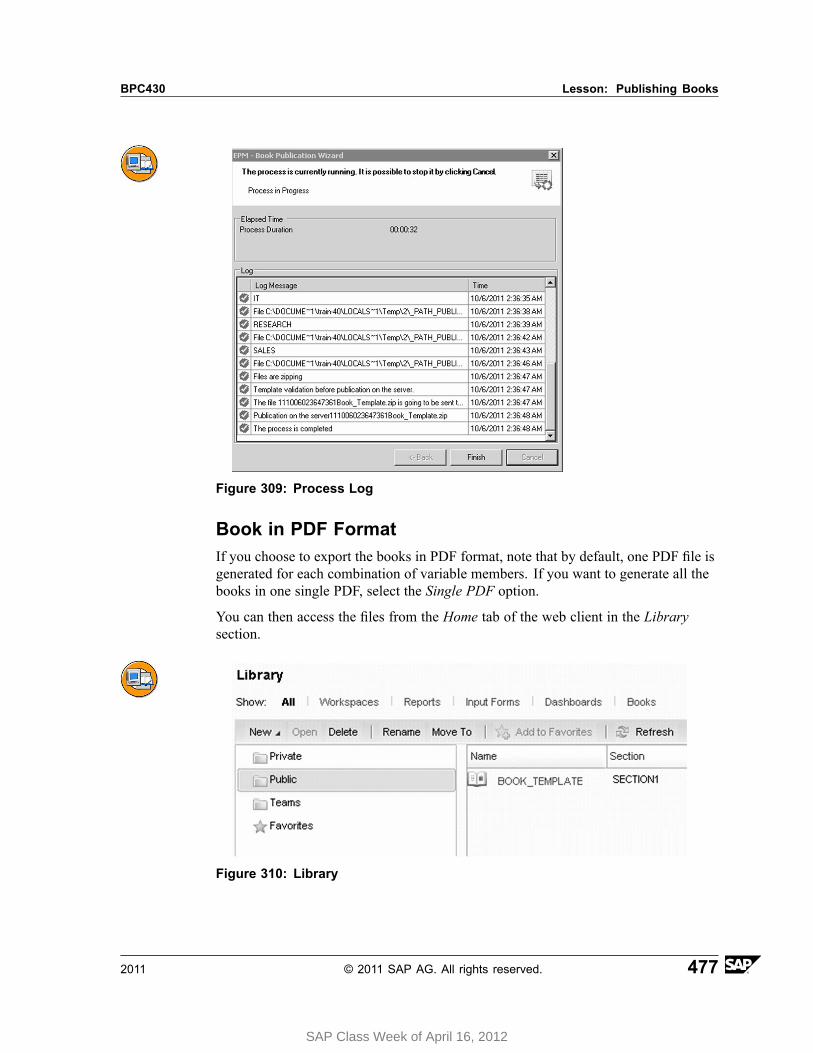
BPC430 Lesson: Publishing Books
Figure 309: Process Log
Book in PDF FormatIf you choose to export the books in PDF format, note that by default, one PDF file isgenerated for each combination of variable members. If you want to generate all thebooks in one single PDF, select the Single PDF option.
You can then access the files from the Home tab of the web client in the Librarysection.
Figure 310: Library
2011 © 2011 SAP AG. All rights reserved. 477
SAP Class Week of April 16, 2012
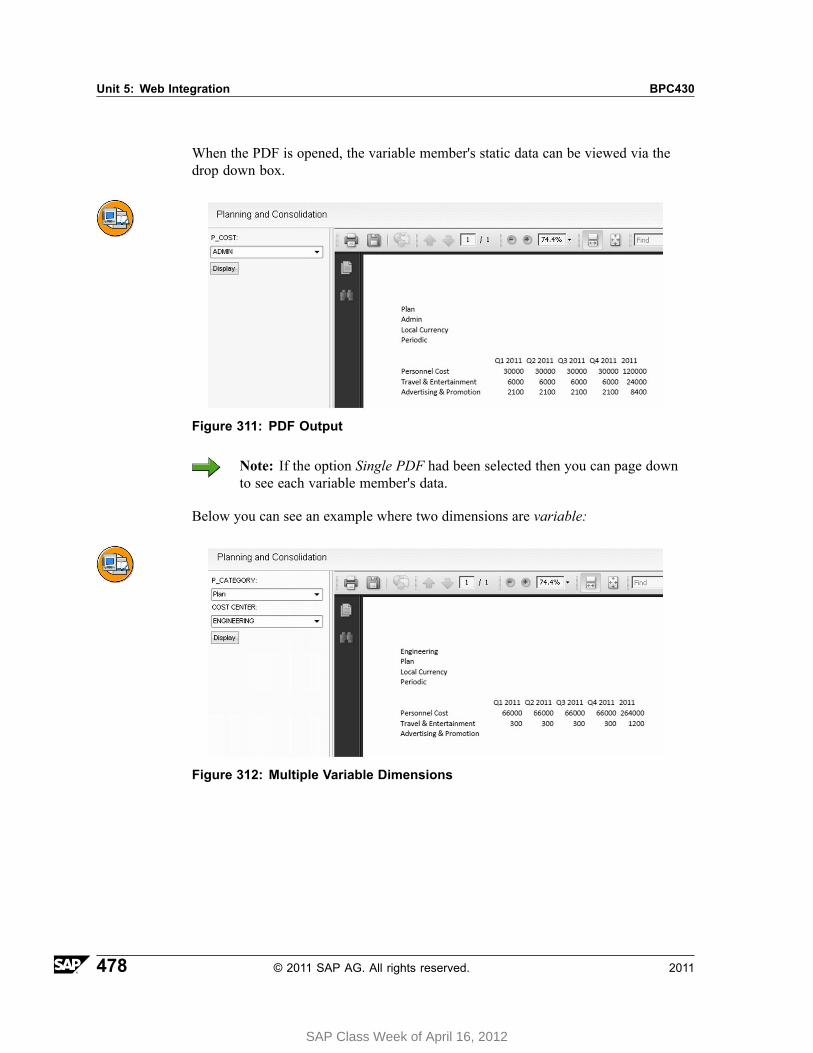
Unit 5: Web Integration BPC430
When the PDF is opened, the variable member's static data can be viewed via thedrop down box.
Figure 311: PDF Output
Note: If the option Single PDF had been selected then you can page downto see each variable member's data.
Below you can see an example where two dimensions are variable:
Figure 312: Multiple Variable Dimensions
478 © 2011 SAP AG. All rights reserved. 2011
SAP Class Week of April 16, 2012

BPC430 Lesson: Publishing Books
SecurityThere are two task profiles for this feature.
1. Edit Book and Distribution Templates - This permits a user to maintain thetemplates
2. Publish Books and Delete Published Books - This permits a user to maintainpublished books
2011 © 2011 SAP AG. All rights reserved. 479
SAP Class Week of April 16, 2012

Unit 5: Web Integration BPC430
480 © 2011 SAP AG. All rights reserved. 2011
SAP Class Week of April 16, 2012
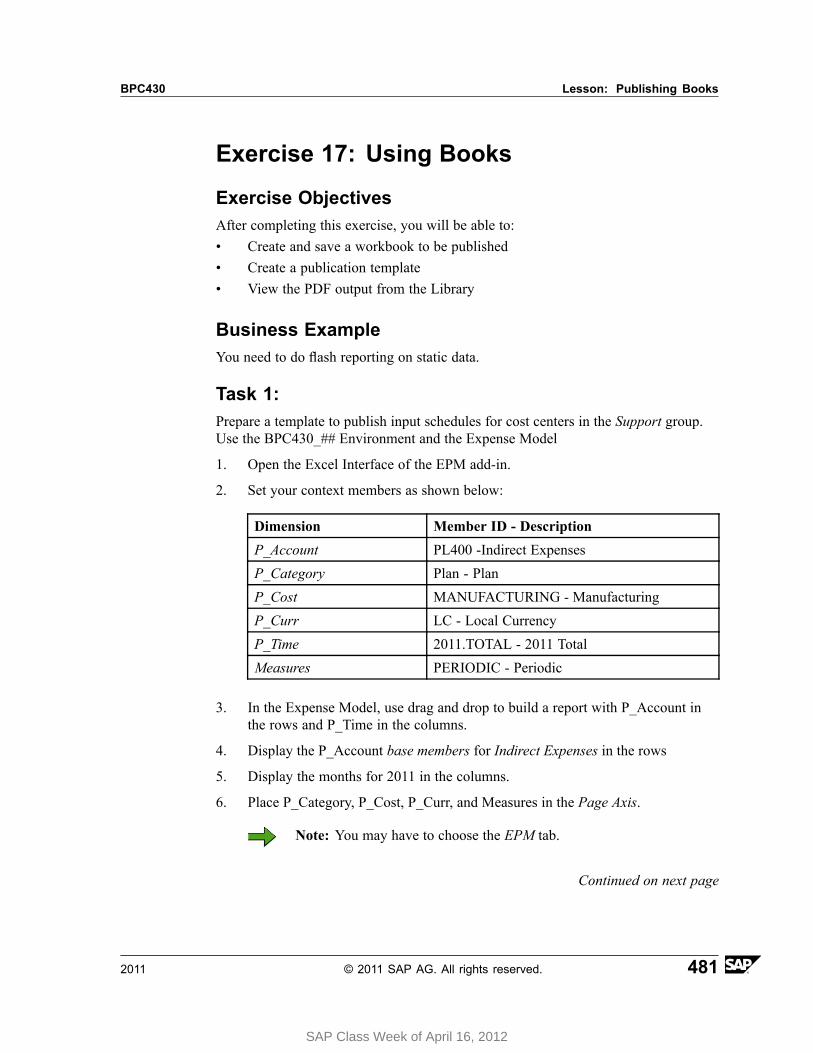
BPC430 Lesson: Publishing Books
Exercise 17: Using Books
Exercise ObjectivesAfter completing this exercise, you will be able to:• Create and save a workbook to be published• Create a publication template• View the PDF output from the Library
Business ExampleYou need to do flash reporting on static data.
Task 1:Prepare a template to publish input schedules for cost centers in the Support group.Use the BPC430_## Environment and the Expense Model
1. Open the Excel Interface of the EPM add-in.
2. Set your context members as shown below:
Dimension Member ID - Description
P_Account PL400 -Indirect Expenses
P_Category Plan - Plan
P_Cost MANUFACTURING - Manufacturing
P_Curr LC - Local Currency
P_Time 2011.TOTAL - 2011 Total
Measures PERIODIC - Periodic
3. In the Expense Model, use drag and drop to build a report with P_Account inthe rows and P_Time in the columns.
4. Display the P_Account base members for Indirect Expenses in the rows
5. Display the months for 2011 in the columns.
6. Place P_Category, P_Cost, P_Curr, and Measures in the Page Axis.
Note: You may have to choose the EPM tab.
Continued on next page
2011 © 2011 SAP AG. All rights reserved. 481
SAP Class Week of April 16, 2012

Unit 5: Web Integration BPC430
7. Save the template as Student_Report
Task 2:Create the publication template.
1. Create your publication settings as shown below:
Caution: If you do not have a blank workbook open, then create a newworkbook.
Figure 313: Books - Template Header
2. Select your dimensions as you see below
Figure 314: Dimension Selection
Continued on next page
482 © 2011 SAP AG. All rights reserved. 2011
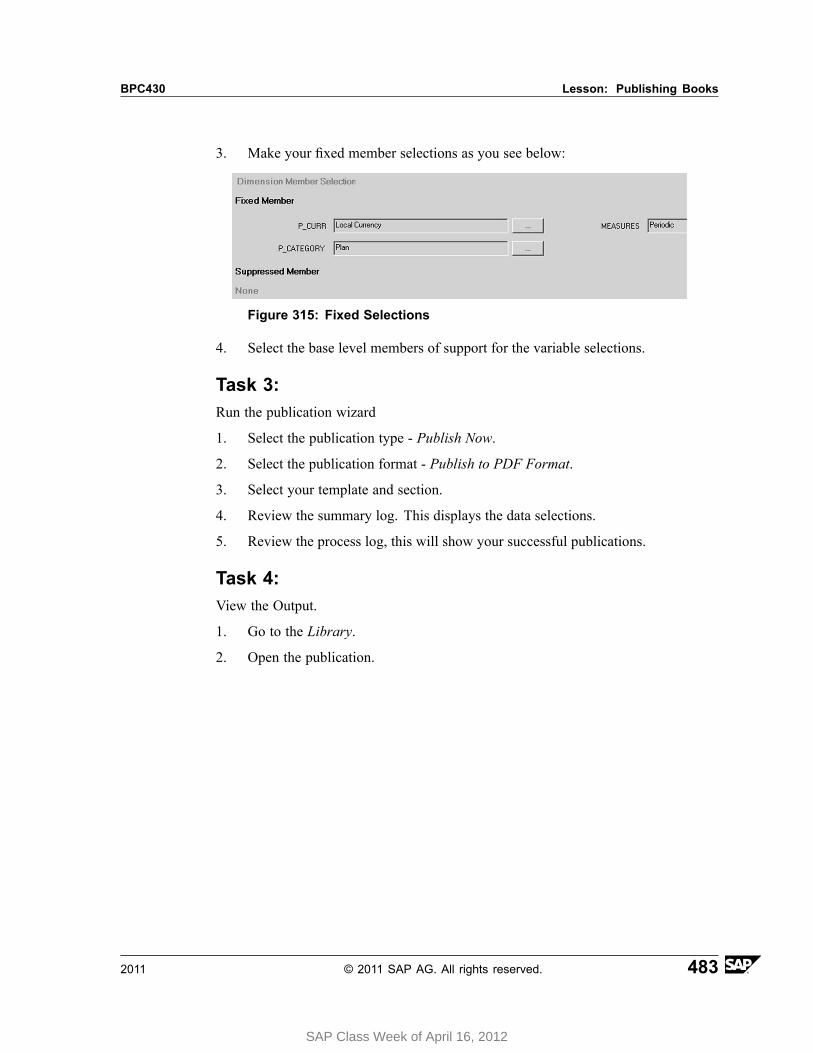
BPC430 Lesson: Publishing Books
3. Make your fixed member selections as you see below:
Figure 315: Fixed Selections
4. Select the base level members of support for the variable selections.
Task 3:Run the publication wizard
1. Select the publication type - Publish Now.
2. Select the publication format - Publish to PDF Format.
3. Select your template and section.
4. Review the summary log. This displays the data selections.
5. Review the process log, this will show your successful publications.
Task 4:View the Output.
1. Go to the Library.
2. Open the publication.
2011 © 2011 SAP AG. All rights reserved. 483
SAP Class Week of April 16, 2012
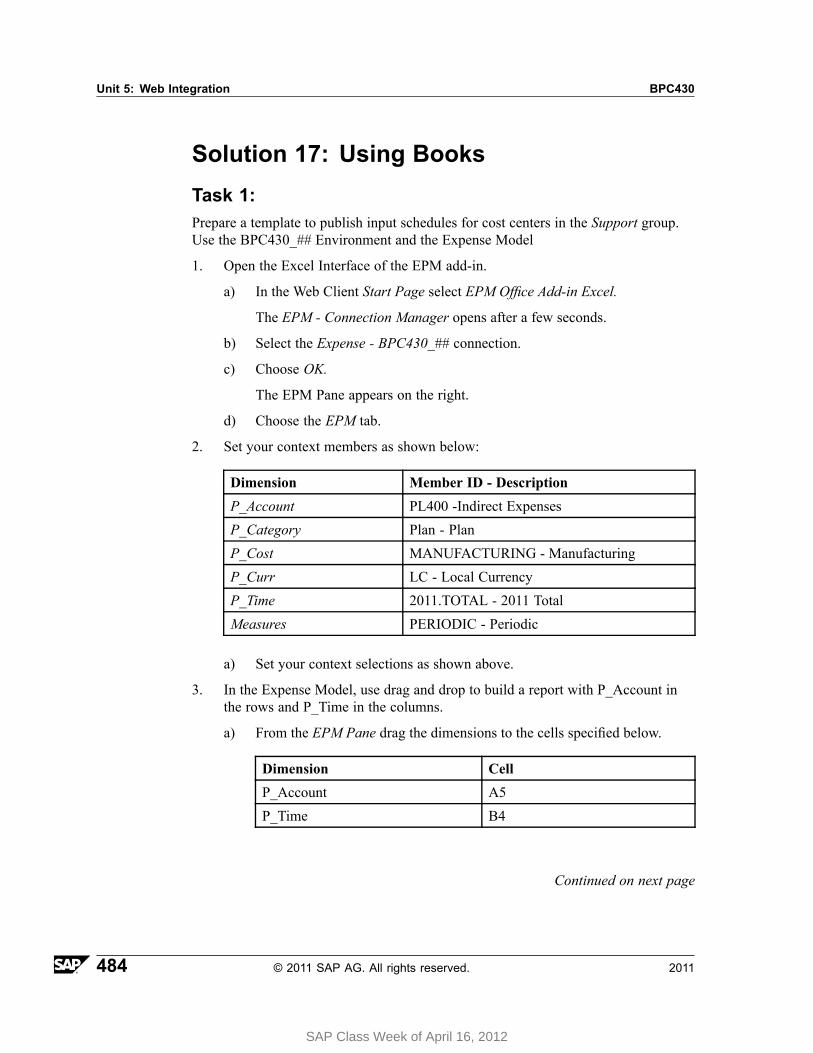
Unit 5: Web Integration BPC430
Solution 17: Using BooksTask 1:Prepare a template to publish input schedules for cost centers in the Support group.Use the BPC430_## Environment and the Expense Model
1. Open the Excel Interface of the EPM add-in.
a) In the Web Client Start Page select EPM Office Add-in Excel.
The EPM - Connection Manager opens after a few seconds.
b) Select the Expense - BPC430_## connection.
c) Choose OK.
The EPM Pane appears on the right.
d) Choose the EPM tab.
2. Set your context members as shown below:
Dimension Member ID - Description
P_Account PL400 -Indirect Expenses
P_Category Plan - Plan
P_Cost MANUFACTURING - Manufacturing
P_Curr LC - Local Currency
P_Time 2011.TOTAL - 2011 Total
Measures PERIODIC - Periodic
a) Set your context selections as shown above.
3. In the Expense Model, use drag and drop to build a report with P_Account inthe rows and P_Time in the columns.
a) From the EPM Pane drag the dimensions to the cells specified below.
Dimension Cell
P_Account A5
P_Time B4
Continued on next page
484 © 2011 SAP AG. All rights reserved. 2011
SAP Class Week of April 16, 2012

BPC430 Lesson: Publishing Books
4. Display the P_Account base members for Indirect Expenses in the rows
a) On the lower right, in the Row Axis, click on P_Account (in blue hypertext).
b) Select Indirect Expenses by placing a checkbox to the left of the member.
c) Under Selection Relationship choose Base Level.
d) Click the right arrow button to move the selection to Selected Members .
e) Similarly, click the left arrow button to remove the prior selection which isalready highlighted.
f) Set the display to Description.
g) Choose OK.
5. Display the months for 2011 in the columns.
a) On the lower right, in the Column Axis, click on P_Time (in blue hypertext)
b) Select 2011.TOTAL by selecting the checkbox to the left of the member.
c) Under Selection Relationship, choose Member and Children.
d) Click the right arrow button to move the selection to Selected Members.
e) Similarly, click the left arrow button to remove the prior selection which isalready highlighted.
f) Set the display to Description.
g) Choose OK.
Continued on next page
2011 © 2011 SAP AG. All rights reserved. 485
SAP Class Week of April 16, 2012
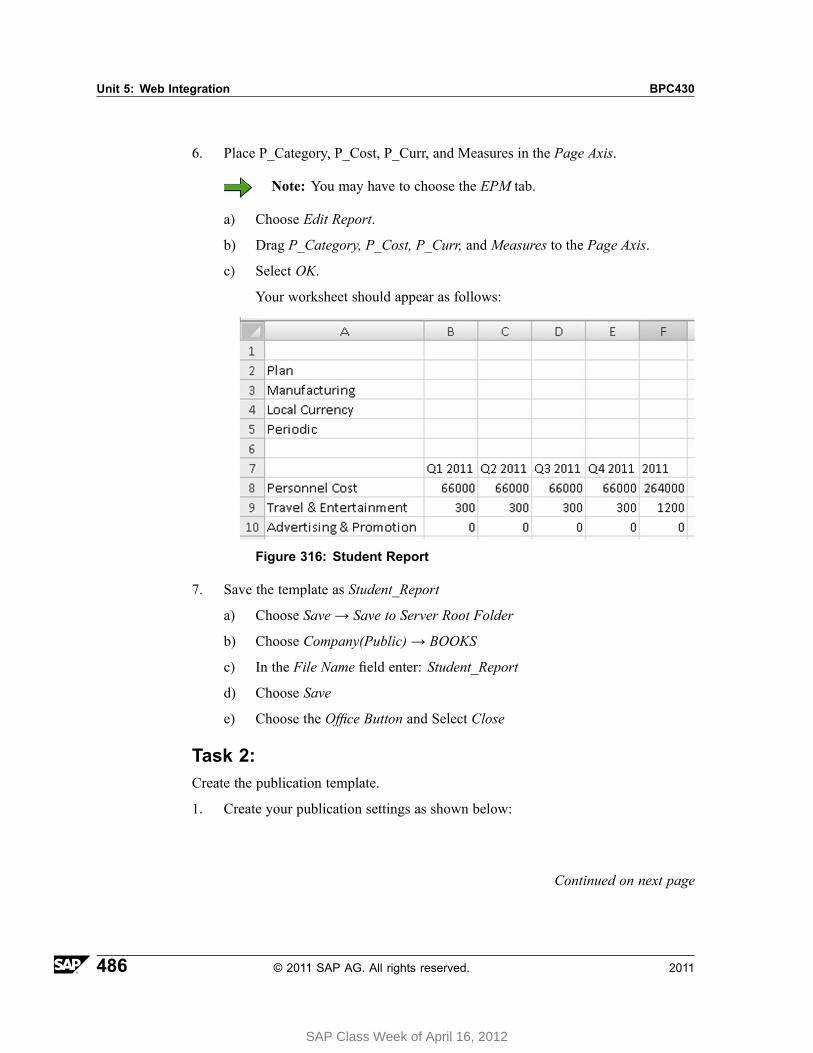
Unit 5: Web Integration BPC430
6. Place P_Category, P_Cost, P_Curr, and Measures in the Page Axis.
Note: You may have to choose the EPM tab.
a) Choose Edit Report.
b) Drag P_Category, P_Cost, P_Curr, and Measures to the Page Axis.
c) Select OK.
Your worksheet should appear as follows:
Figure 316: Student Report
7. Save the template as Student_Report
a) Choose Save → Save to Server Root Folder
b) Choose Company(Public) → BOOKS
c) In the File Name field enter: Student_Report
d) Choose Save
e) Choose the Office Button and Select Close
Task 2:Create the publication template.
1. Create your publication settings as shown below:
Continued on next page
486 © 2011 SAP AG. All rights reserved. 2011
SAP Class Week of April 16, 2012
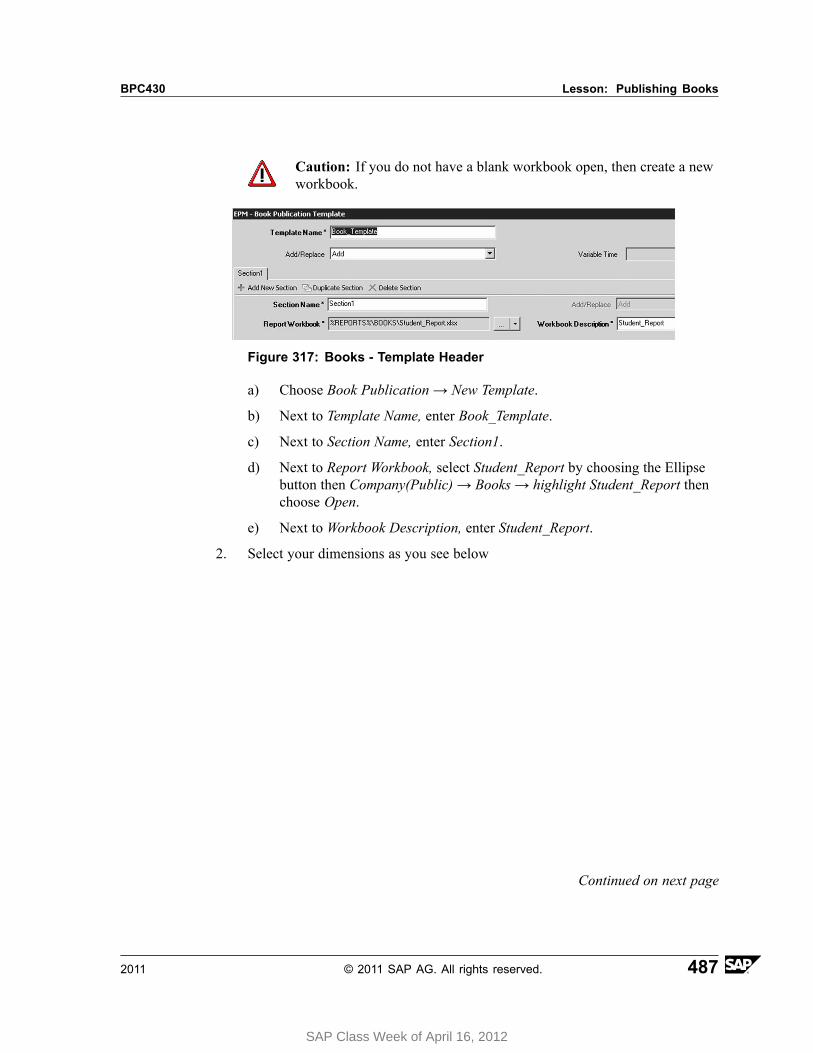
BPC430 Lesson: Publishing Books
Caution: If you do not have a blank workbook open, then create a newworkbook.
Figure 317: Books - Template Header
a) Choose Book Publication → New Template.
b) Next to Template Name, enter Book_Template.
c) Next to Section Name, enter Section1.
d) Next to Report Workbook, select Student_Report by choosing the Ellipsebutton then Company(Public) → Books → highlight Student_Report thenchoose Open.
e) Next to Workbook Description, enter Student_Report.
2. Select your dimensions as you see below
Continued on next page
2011 © 2011 SAP AG. All rights reserved. 487
SAP Class Week of April 16, 2012
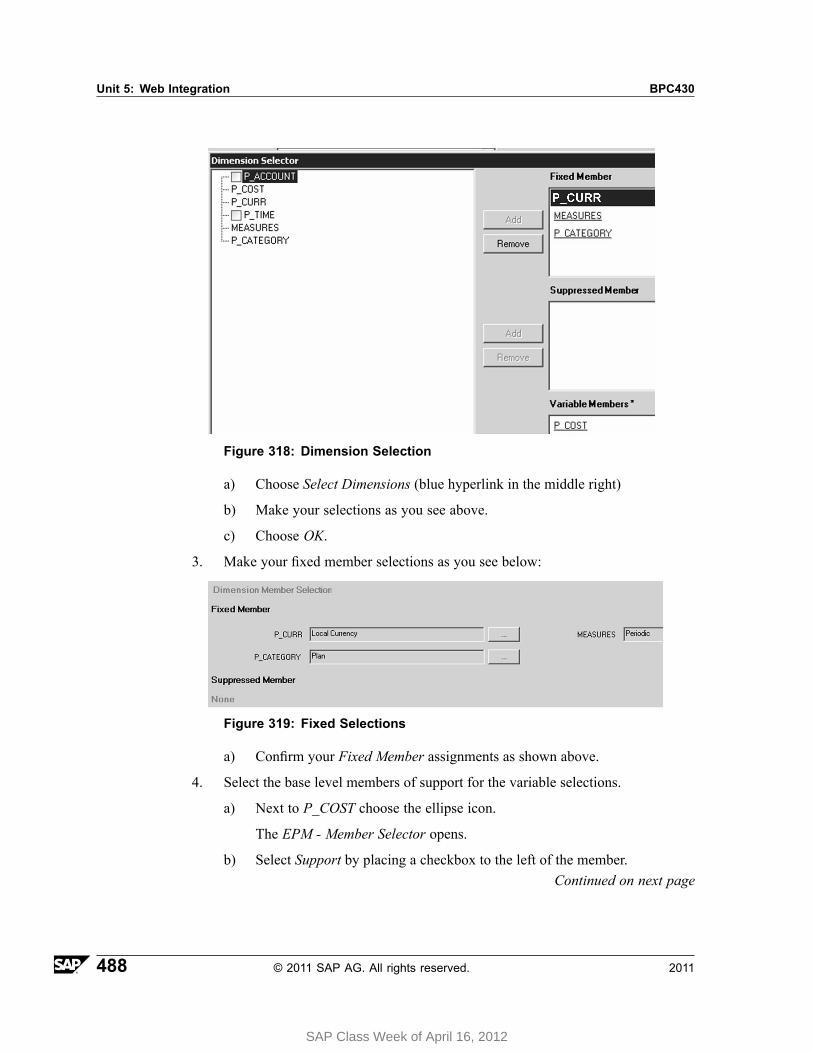
Unit 5: Web Integration BPC430
Figure 318: Dimension Selection
a) Choose Select Dimensions (blue hyperlink in the middle right)
b) Make your selections as you see above.
c) Choose OK.
3. Make your fixed member selections as you see below:
Figure 319: Fixed Selections
a) Confirm your Fixed Member assignments as shown above.
4. Select the base level members of support for the variable selections.
a) Next to P_COST choose the ellipse icon.
The EPM - Member Selector opens.
b) Select Support by placing a checkbox to the left of the member.Continued on next page
488 © 2011 SAP AG. All rights reserved. 2011
SAP Class Week of April 16, 2012

BPC430 Lesson: Publishing Books
c) Under Selection Relationship choose Base Level.
d) Click the right arrow button to move the selection to Selected Members.
e) Similarly, click the left arrow button to remove the prior selection which isalready highlighted.
f) Choose OK.
You may receive a message Some members have been modified so that thetemplate can be used, choose OK.
Hint: You may need to maximize your screen for the next step.
g) Choose Save.
The excel sheet is generated and a save dialogue box pops up.
h) Enter the File Name Book_Template.
i) Choose Save.
An error may occur. If so, choose OK. The workbook below will be savedand then close. Here is what you saved.
Figure 320: Generated Template
Continued on next page
2011 © 2011 SAP AG. All rights reserved. 489
SAP Class Week of April 16, 2012
Unit 5: Web Integration BPC430
Task 3:Run the publication wizard
1. Select the publication type - Publish Now.
a) Choose Book Publication → Publish Books.
b) Select Publish Now→ Next.
2. Select the publication format - Publish to PDF Format.
a) Select Publish to PDF Format.
b) Choose Next.
3. Select your template and section.
a) Select Book_Template.
Note: When Book_Template is selected, the system will validatethe template for a few seconds.
b) Select Section1.
Continued on next page
490 © 2011 SAP AG. All rights reserved. 2011
SAP Class Week of April 16, 2012
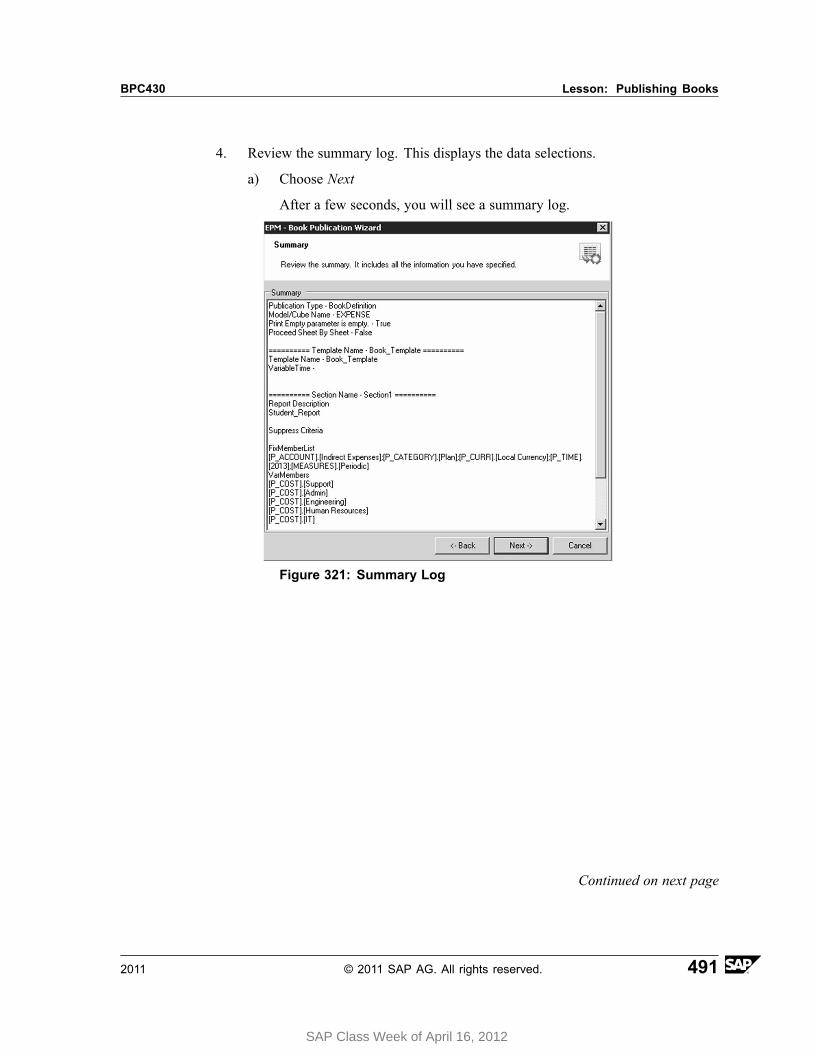
BPC430 Lesson: Publishing Books
4. Review the summary log. This displays the data selections.
a) Choose Next
After a few seconds, you will see a summary log.
Figure 321: Summary Log
Continued on next page
2011 © 2011 SAP AG. All rights reserved. 491
SAP Class Week of April 16, 2012
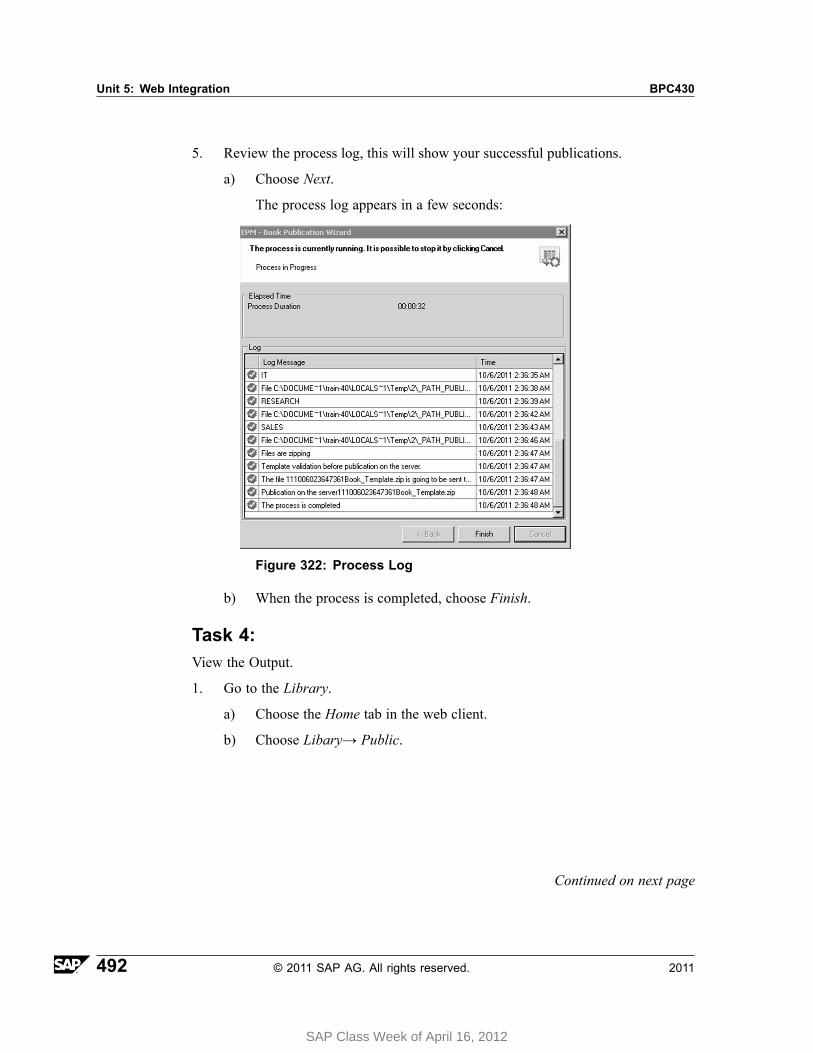
Unit 5: Web Integration BPC430
5. Review the process log, this will show your successful publications.
a) Choose Next.
The process log appears in a few seconds:
Figure 322: Process Log
b) When the process is completed, choose Finish.
Task 4:View the Output.
1. Go to the Library.
a) Choose the Home tab in the web client.
b) Choose Libary→ Public.
Continued on next page
492 © 2011 SAP AG. All rights reserved. 2011
SAP Class Week of April 16, 2012
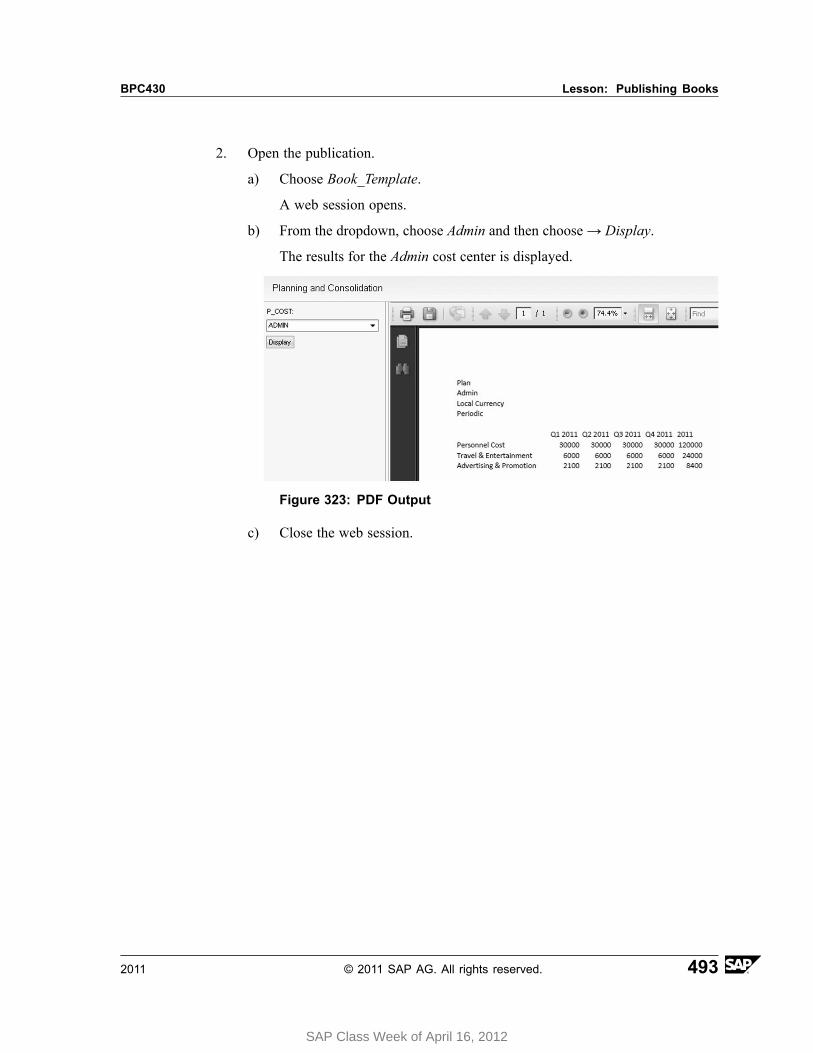
BPC430 Lesson: Publishing Books
2. Open the publication.
a) Choose Book_Template.
A web session opens.
b) From the dropdown, choose Admin and then choose→Display.
The results for the Admin cost center is displayed.
Figure 323: PDF Output
c) Close the web session.
2011 © 2011 SAP AG. All rights reserved. 493
SAP Class Week of April 16, 2012
Unit 5: Web Integration BPC430
Lesson Summary
You should now be able to:• Create Book Publication templates• Print workbooks• Publish to PDF
494 © 2011 SAP AG. All rights reserved. 2011
SAP Class Week of April 16, 2012

BPC430 Unit Summary
Unit SummaryYou should now be able to:• Describe the Home tab• Use the built-in screens• Use the Library and Workspaces to organize your reports• Explain functionality differences in the web and Excel clients• Set your context defaults• Create web reports• Create input forms• Create workspaces• Create Book Publication templates• Print workbooks• Publish to PDF
2011 © 2011 SAP AG. All rights reserved. 495
SAP Class Week of April 16, 2012

Unit Summary BPC430
496 © 2011 SAP AG. All rights reserved. 2011
SAP Class Week of April 16, 2012

SAP Class Week of April 16, 2012

SAP Class Week of April 16, 2012

Unit Summary BPC430
497 © 2011 SAP AG. All rights reserved. 2011
SAP Class Week of April 16, 2012

Unit Summary BPC430
498 © 2011 SAP AG. All rights reserved. 2011
SAP Class Week of April 16, 2012
Unit 6Drill Through
Unit OverviewThis Unit covers Drill Through
Unit ObjectivesAfter completing this unit, you will be able to:
• Configure drill through for a website• Configure drill through for a BW Query• Configure drill through for ECC
Unit ContentsLesson: Using Drill Through for BW, ECC, and Websites .. . . . . . . . . . . . . . . . . . .500
Procedure: How to Drill Through to ECC.... . . . . . . . . . . . . . . . . . . . . . . . . . . . . . . . .513Exercise 18: Configuring the URL Based Drill Through ... . . . . . . . . . . . . . . . .517
2011 © 2011 SAP AG. All rights reserved. 499
SAP Class Week of April 16, 2012
Unit 6: Drill Through BPC430
Lesson: Using Drill Through for BW, ECC, and Websites
Lesson OverviewIn this lesson, you will learn to configure and use drill through.
Lesson ObjectivesAfter completing this lesson, you will be able to:
• Configure drill through for a website• Configure drill through for a BW Query• Configure drill through for ECC
Business ExampleYour business users need to access related information in web sites, BW tables, andECC.
OverviewIn this section, you will learn about the business reasons to use drill through.
The drill-through feature enables you to view information on source data that makesup the content of a selected cell in a report in Microsoft Office Excel. Drill-throughdefinitions are set up in administration.
First of all, since there a lot of different words people use for this and related features,lets's start by discussing the difference between two of the most common phrases drilldown and drill through.
• Drill Down - performs an expansion of a parent member.
For example, you drill down from 2011.TOTAL to quarters in 2011.
• Drill Through - jumps the user to another system and performs a look up basedon which cell the user's cursor is in.
For example, you want to drill through and access the cost centers for thecompany that you are viewing.
500 © 2011 SAP AG. All rights reserved. 2011
SAP Class Week of April 16, 2012
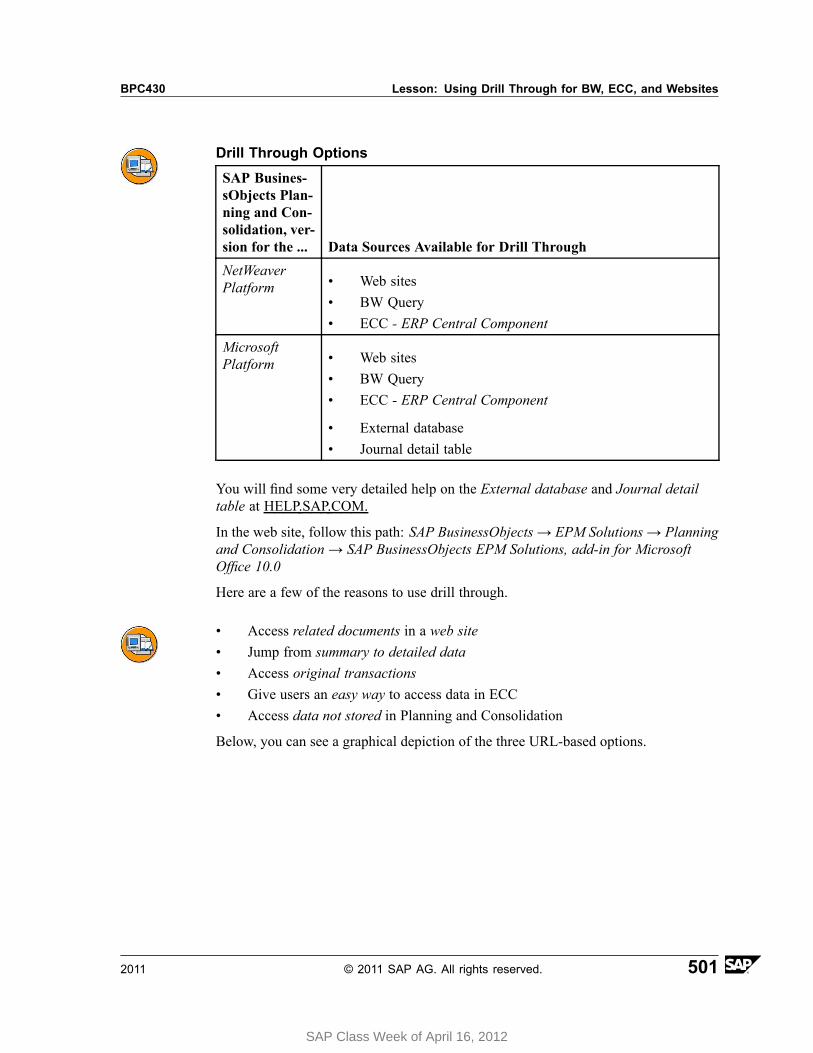
BPC430 Lesson: Using Drill Through for BW, ECC, and Websites
Drill Through Options
SAP Busines-sObjects Plan-ning and Con-solidation, ver-sion for the ... Data Sources Available for Drill Through
NetWeaverPlatform • Web sites
• BW Query• ECC - ERP Central Component
MicrosoftPlatform • Web sites
• BW Query• ECC - ERP Central Component
• External database• Journal detail table
You will find some very detailed help on the External database and Journal detailtable at HELP.SAP.COM.
In the web site, follow this path: SAP BusinessObjects → EPM Solutions → Planningand Consolidation → SAP BusinessObjects EPM Solutions, add-in for MicrosoftOffice 10.0
Here are a few of the reasons to use drill through.
• Access related documents in a web site• Jump from summary to detailed data• Access original transactions• Give users an easy way to access data in ECC• Access data not stored in Planning and Consolidation
Below, you can see a graphical depiction of the three URL-based options.
2011 © 2011 SAP AG. All rights reserved. 501
SAP Class Week of April 16, 2012

Unit 6: Drill Through BPC430
Figure 324: Drill through – URL-Based Options
Drill Through to a WebsetDrill throughs are created by model in administration.
After you set up at least one drill through for a model, it is available to users of reportsthat reference that model.
In administration, your will find the drill through configuration area in Features.
In the example below, there are three drill throughs set up.
Figure 325: Drill through – In Administration
502 © 2011 SAP AG. All rights reserved. 2011
SAP Class Week of April 16, 2012
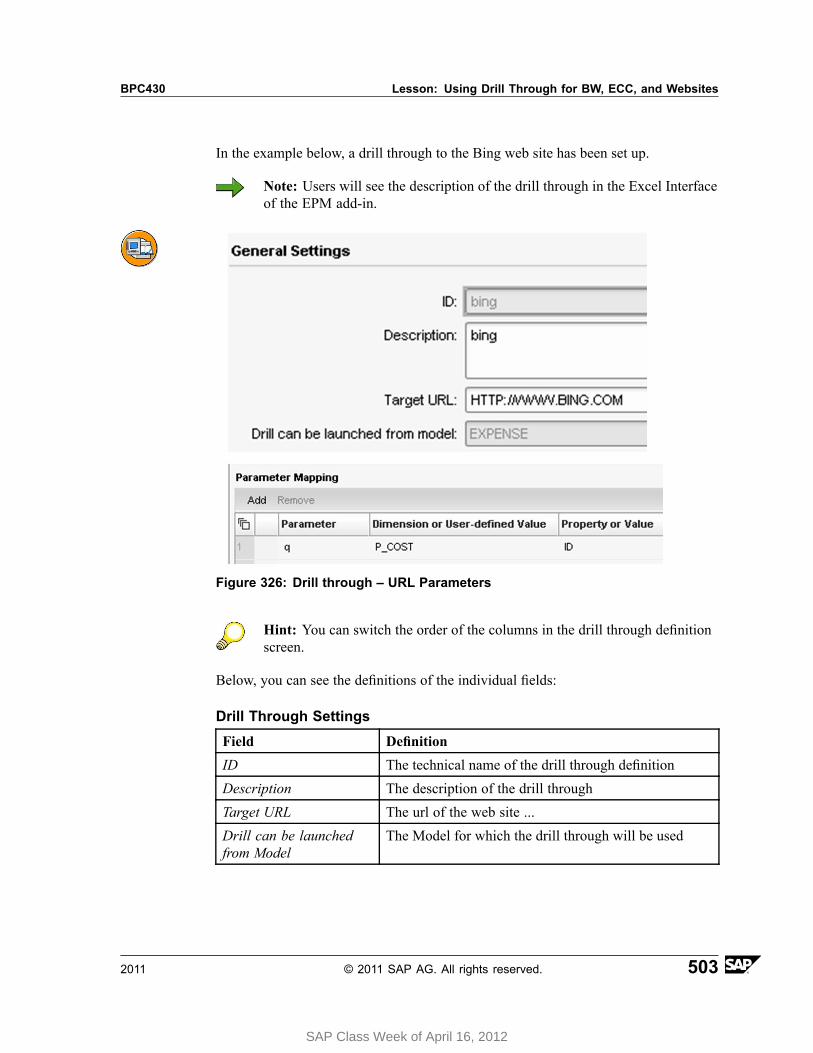
BPC430 Lesson: Using Drill Through for BW, ECC, and Websites
In the example below, a drill through to the Bing web site has been set up.
Note: Users will see the description of the drill through in the Excel Interfaceof the EPM add-in.
Figure 326: Drill through – URL Parameters
Hint: You can switch the order of the columns in the drill through definitionscreen.
Below, you can see the definitions of the individual fields:
Drill Through Settings
Field Definition
ID The technical name of the drill through definition
Description The description of the drill through
Target URL The url of the web site ...
Drill can be launchedfrom Model
The Model for which the drill through will be used
2011 © 2011 SAP AG. All rights reserved. 503
SAP Class Week of April 16, 2012
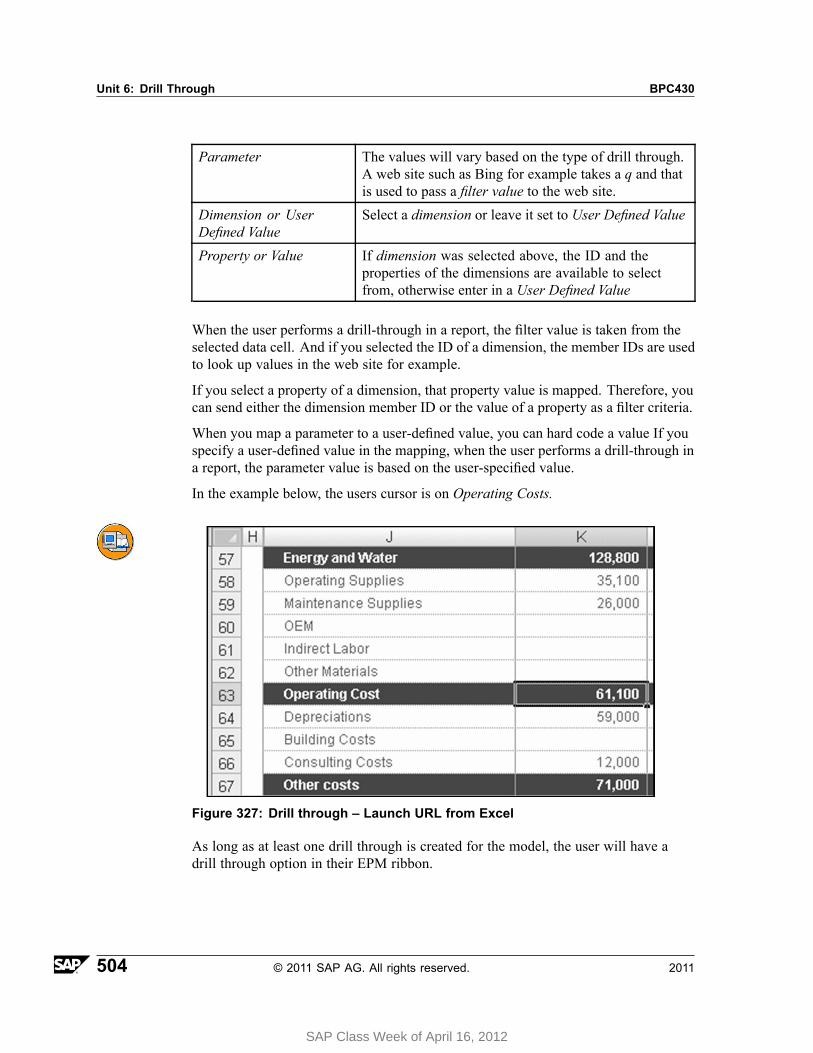
Unit 6: Drill Through BPC430
Parameter The values will vary based on the type of drill through.A web site such as Bing for example takes a q and thatis used to pass a filter value to the web site.
Dimension or UserDefined Value
Select a dimension or leave it set to User Defined Value
Property or Value If dimension was selected above, the ID and theproperties of the dimensions are available to selectfrom, otherwise enter in a User Defined Value
When the user performs a drill-through in a report, the filter value is taken from theselected data cell. And if you selected the ID of a dimension, the member IDs are usedto look up values in the web site for example.
If you select a property of a dimension, that property value is mapped. Therefore, youcan send either the dimension member ID or the value of a property as a filter criteria.
When you map a parameter to a user-defined value, you can hard code a value If youspecify a user-defined value in the mapping, when the user performs a drill-through ina report, the parameter value is based on the user-specified value.
In the example below, the users cursor is on Operating Costs.
Figure 327: Drill through – Launch URL from Excel
As long as at least one drill through is created for the model, the user will have adrill through option in their EPM ribbon.
504 © 2011 SAP AG. All rights reserved. 2011
SAP Class Week of April 16, 2012
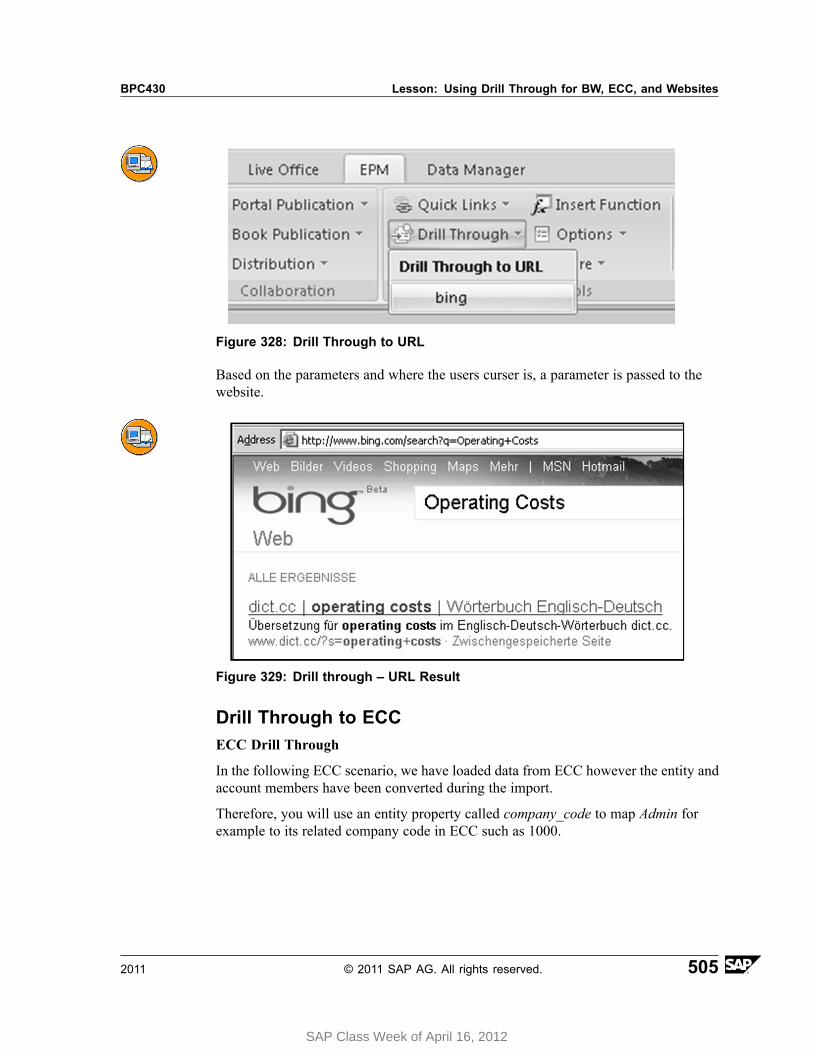
BPC430 Lesson: Using Drill Through for BW, ECC, and Websites
Figure 328: Drill Through to URL
Based on the parameters and where the users curser is, a parameter is passed to thewebsite.
Figure 329: Drill through – URL Result
Drill Through to ECCECC Drill Through
In the following ECC scenario, we have loaded data from ECC however the entity andaccount members have been converted during the import.
Therefore, you will use an entity property called company_code to map Admin forexample to its related company code in ECC such as 1000.
2011 © 2011 SAP AG. All rights reserved. 505
SAP Class Week of April 16, 2012
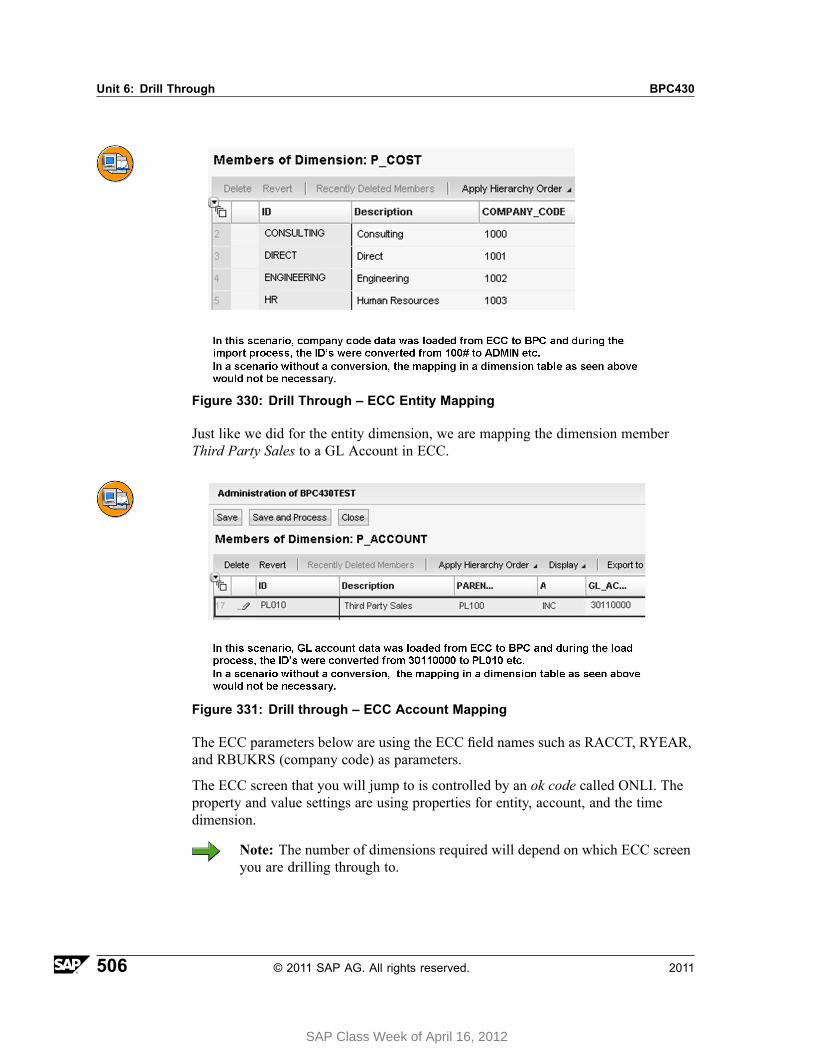
Unit 6: Drill Through BPC430
Figure 330: Drill Through – ECC Entity Mapping
Just like we did for the entity dimension, we are mapping the dimension memberThird Party Sales to a GL Account in ECC.
Figure 331: Drill through – ECC Account Mapping
The ECC parameters below are using the ECC field names such as RACCT, RYEAR,and RBUKRS (company code) as parameters.
The ECC screen that you will jump to is controlled by an ok code called ONLI. Theproperty and value settings are using properties for entity, account, and the timedimension.
Note: The number of dimensions required will depend on which ECC screenyou are drilling through to.
506 © 2011 SAP AG. All rights reserved. 2011
SAP Class Week of April 16, 2012
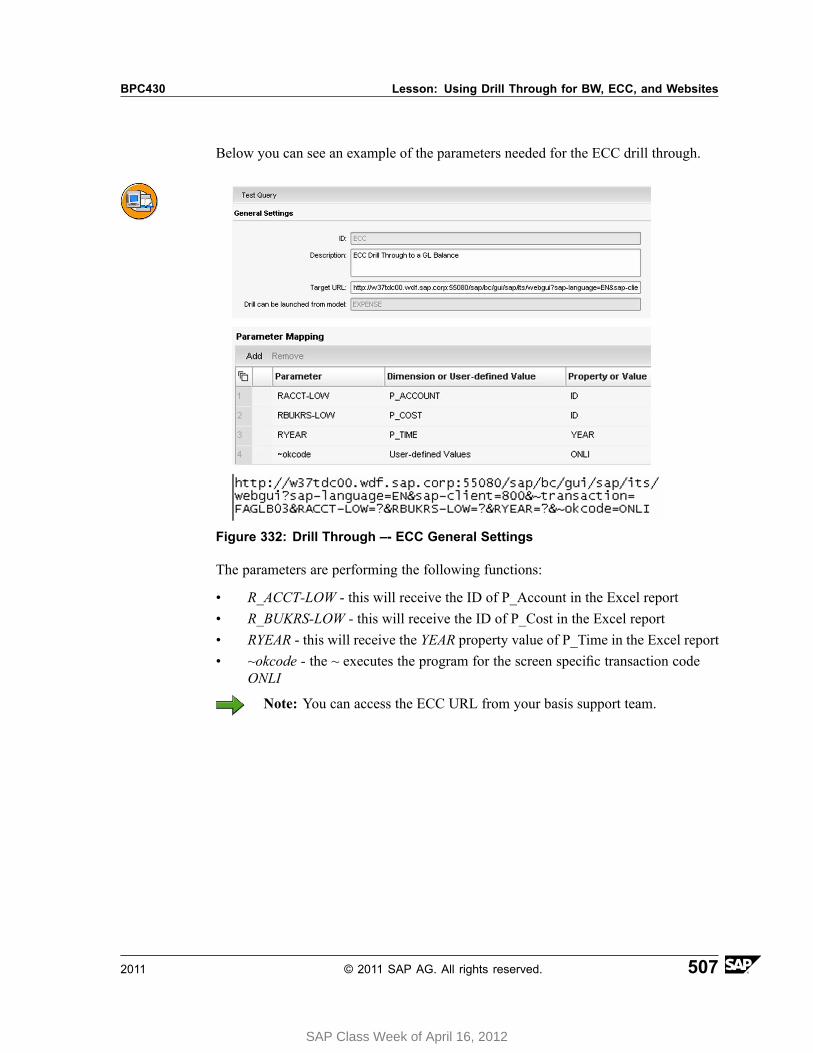
BPC430 Lesson: Using Drill Through for BW, ECC, and Websites
Below you can see an example of the parameters needed for the ECC drill through.
Figure 332: Drill Through –- ECC General Settings
The parameters are performing the following functions:
• R_ACCT-LOW - this will receive the ID of P_Account in the Excel report• R_BUKRS-LOW - this will receive the ID of P_Cost in the Excel report• RYEAR - this will receive the YEAR property value of P_Time in the Excel report• ~okcode - the ~ executes the program for the screen specific transaction code
ONLI
Note: You can access the ECC URL from your basis support team.
2011 © 2011 SAP AG. All rights reserved. 507
SAP Class Week of April 16, 2012
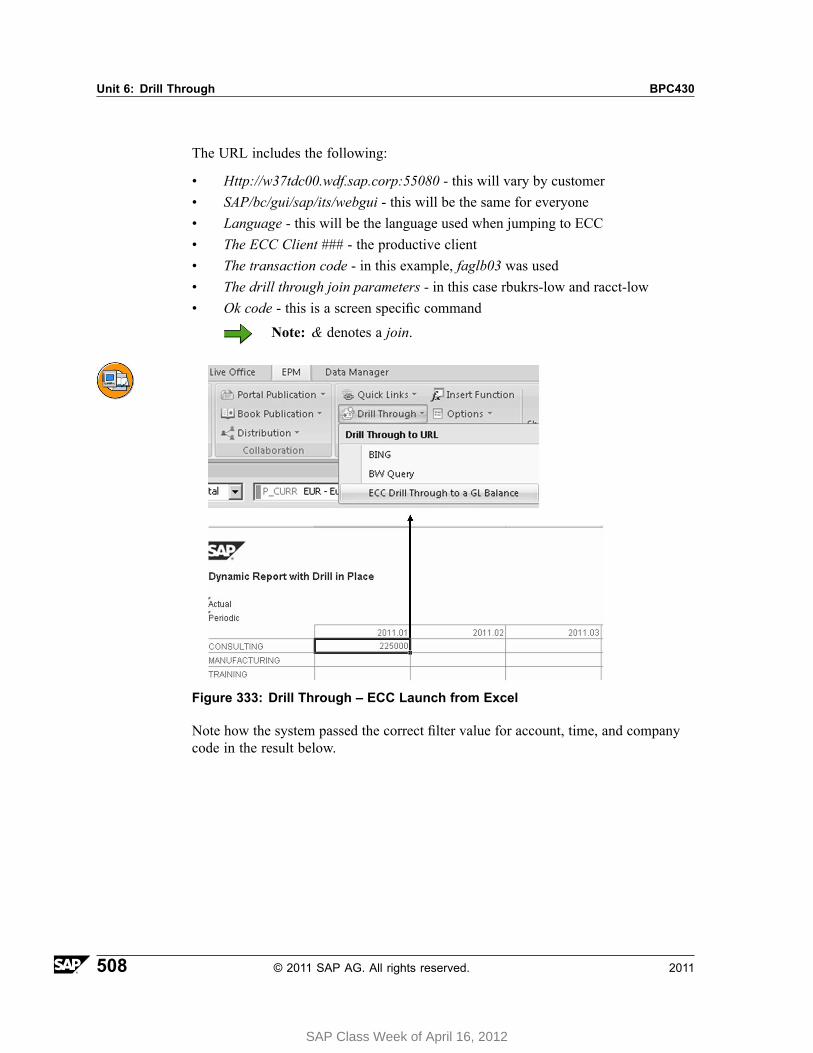
Unit 6: Drill Through BPC430
The URL includes the following:
• Http://w37tdc00.wdf.sap.corp:55080 - this will vary by customer• SAP/bc/gui/sap/its/webgui - this will be the same for everyone• Language - this will be the language used when jumping to ECC• The ECC Client ### - the productive client• The transaction code - in this example, faglb03 was used• The drill through join parameters - in this case rbukrs-low and racct-low• Ok code - this is a screen specific command
Note: & denotes a join.
Figure 333: Drill Through – ECC Launch from Excel
Note how the system passed the correct filter value for account, time, and companycode in the result below.
508 © 2011 SAP AG. All rights reserved. 2011
SAP Class Week of April 16, 2012
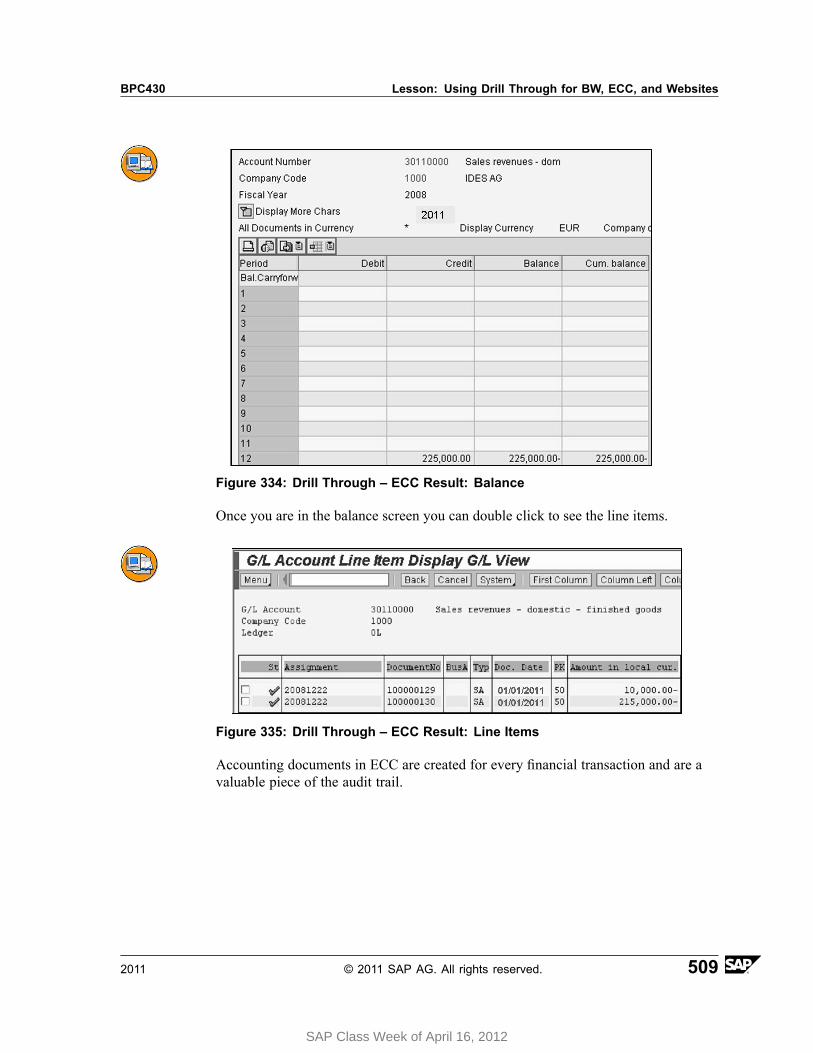
BPC430 Lesson: Using Drill Through for BW, ECC, and Websites
Figure 334: Drill Through – ECC Result: Balance
Once you are in the balance screen you can double click to see the line items.
Figure 335: Drill Through – ECC Result: Line Items
Accounting documents in ECC are created for every financial transaction and are avaluable piece of the audit trail.
2011 © 2011 SAP AG. All rights reserved. 509
SAP Class Week of April 16, 2012
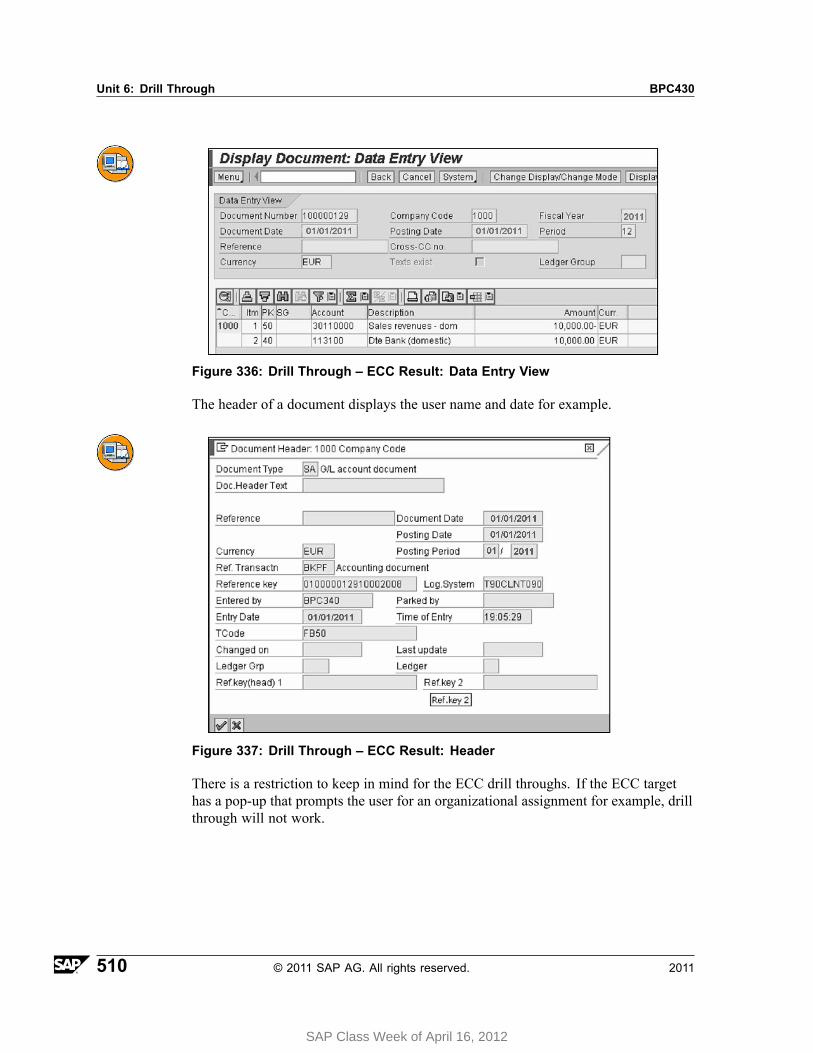
Unit 6: Drill Through BPC430
Figure 336: Drill Through – ECC Result: Data Entry View
The header of a document displays the user name and date for example.
Figure 337: Drill Through – ECC Result: Header
There is a restriction to keep in mind for the ECC drill throughs. If the ECC targethas a pop-up that prompts the user for an organizational assignment for example, drillthrough will not work.
510 © 2011 SAP AG. All rights reserved. 2011
SAP Class Week of April 16, 2012
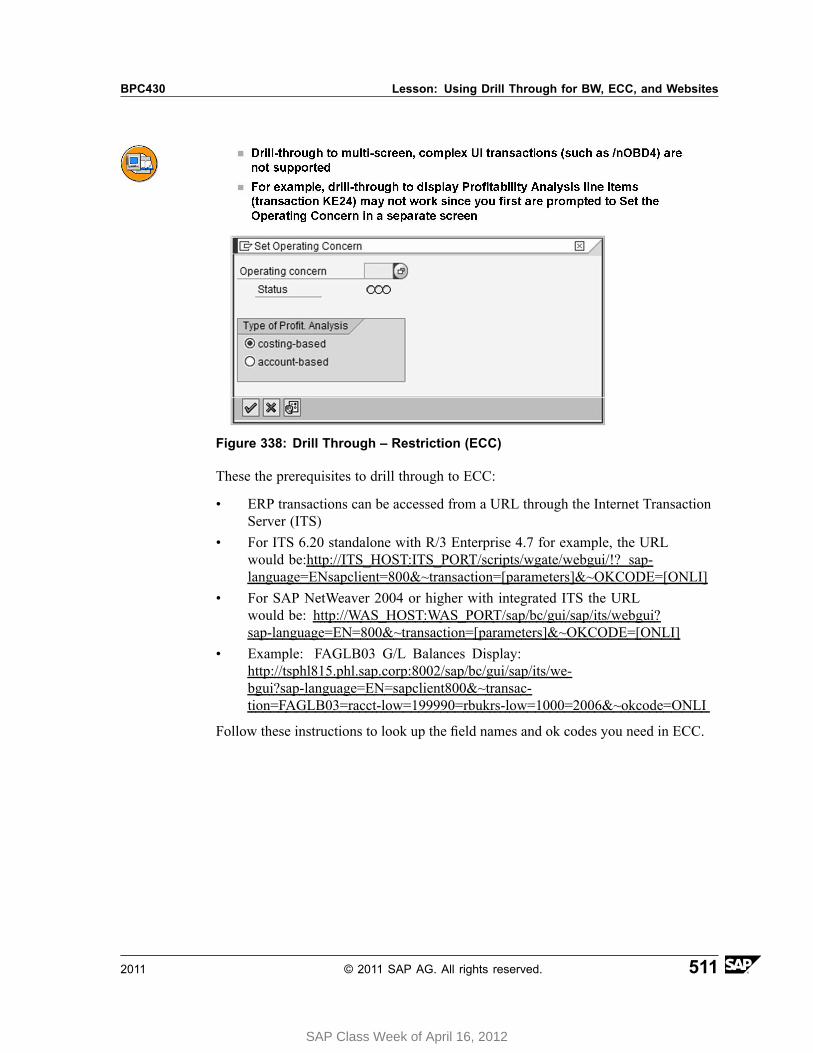
BPC430 Lesson: Using Drill Through for BW, ECC, and Websites
Figure 338: Drill Through – Restriction (ECC)
These the prerequisites to drill through to ECC:
• ERP transactions can be accessed from a URL through the Internet TransactionServer (ITS)
• For ITS 6.20 standalone with R/3 Enterprise 4.7 for example, the URLwould be:http://ITS_HOST:ITS_PORT/scripts/wgate/webgui/!? sap-language=ENsapclient=800&~transaction=[parameters]&~OKCODE=[ONLI]
• For SAP NetWeaver 2004 or higher with integrated ITS the URLwould be: http://WAS_HOST:WAS_PORT/sap/bc/gui/sap/its/webgui?sap-language=EN=800&~transaction=[parameters]&~OKCODE=[ONLI]
• Example: FAGLB03 G/L Balances Display:http://tsphl815.phl.sap.corp:8002/sap/bc/gui/sap/its/we-bgui?sap-language=EN=sapclient800&~transac-tion=FAGLB03=racct-low=199990=rbukrs-low=1000=2006&~okcode=ONLI
Follow these instructions to look up the field names and ok codes you need in ECC.
2011 © 2011 SAP AG. All rights reserved. 511
SAP Class Week of April 16, 2012
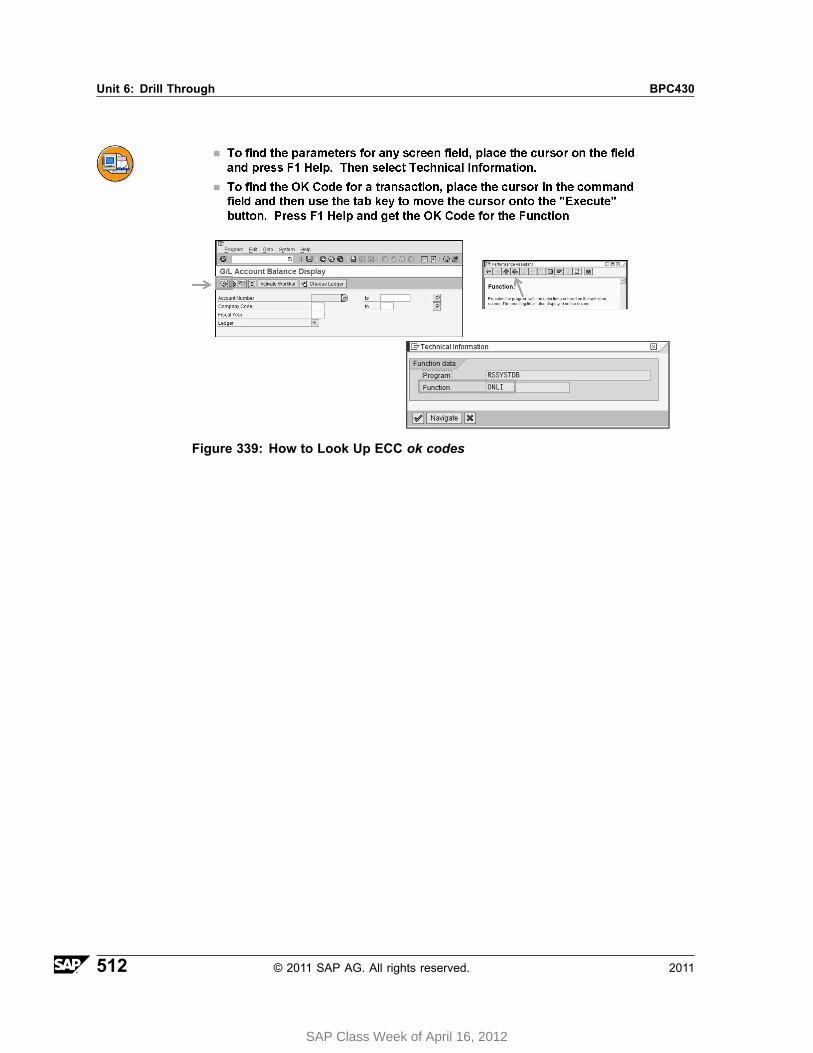
Unit 6: Drill Through BPC430
Figure 339: How to Look Up ECC ok codes
512 © 2011 SAP AG. All rights reserved. 2011
SAP Class Week of April 16, 2012
BPC430 Lesson: Using Drill Through for BW, ECC, and Websites
How to Drill Through to ECC
1. Look up the field names and okcode in ECC for the target transaction code.
In your target transaction code in ECC use the tab key to position your curseron the execute or enter icon.
Choose F1 → Technical Help and note the okcode.
Position your curser in the join fields→ choose F1→ Technical Help.
Note the field names.
Contact your basis administrator for ECC for the URL.
You now have the metadata to configure this in Planning and Consolidation
2. Create the drill through definition
In Administration go to Features → Drill Through.
Choose Add.
Enter the General Parameters including the ECC URL.
Under Parameter Mapping, choose Add.
Enter the parameters for your ECC drill down scenario.
Choose Test Query and enter in values for the fields you specified above.
Choose OK.
You should be prompted to log in to ECC and then you should be in thetransaction code you specified for the filter values you selected.
Drill Through to a BW QueryBW Drill Through
2011 © 2011 SAP AG. All rights reserved. 513
SAP Class Week of April 16, 2012
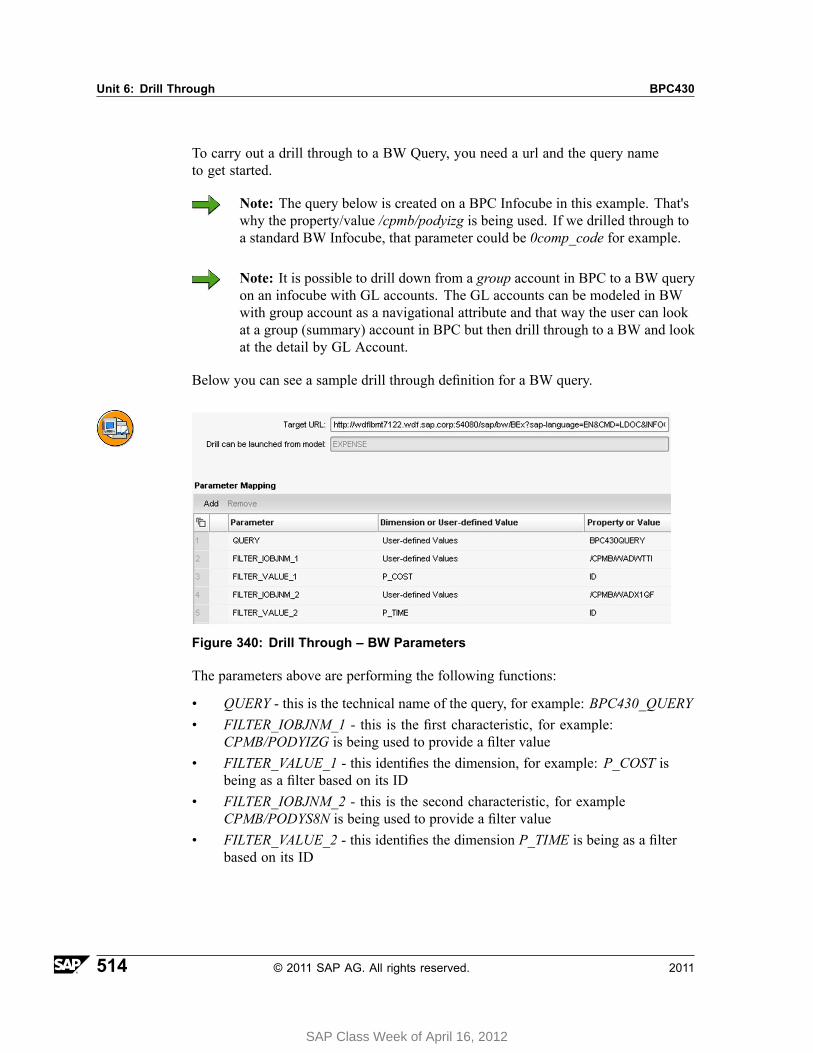
Unit 6: Drill Through BPC430
To carry out a drill through to a BW Query, you need a url and the query nameto get started.
Note: The query below is created on a BPC Infocube in this example. That'swhy the property/value /cpmb/podyizg is being used. If we drilled through toa standard BW Infocube, that parameter could be 0comp_code for example.
Note: It is possible to drill down from a group account in BPC to a BW queryon an infocube with GL accounts. The GL accounts can be modeled in BWwith group account as a navigational attribute and that way the user can lookat a group (summary) account in BPC but then drill through to a BW and lookat the detail by GL Account.
Below you can see a sample drill through definition for a BW query.
Figure 340: Drill Through – BW Parameters
The parameters above are performing the following functions:
• QUERY - this is the technical name of the query, for example: BPC430_QUERY• FILTER_IOBJNM_1 - this is the first characteristic, for example:
CPMB/PODYIZG is being used to provide a filter value• FILTER_VALUE_1 - this identifies the dimension, for example: P_COST is
being as a filter based on its ID• FILTER_IOBJNM_2 - this is the second characteristic, for example
CPMB/PODYS8N is being used to provide a filter value• FILTER_VALUE_2 - this identifies the dimension P_TIME is being as a filter
based on its ID
514 © 2011 SAP AG. All rights reserved. 2011
SAP Class Week of April 16, 2012
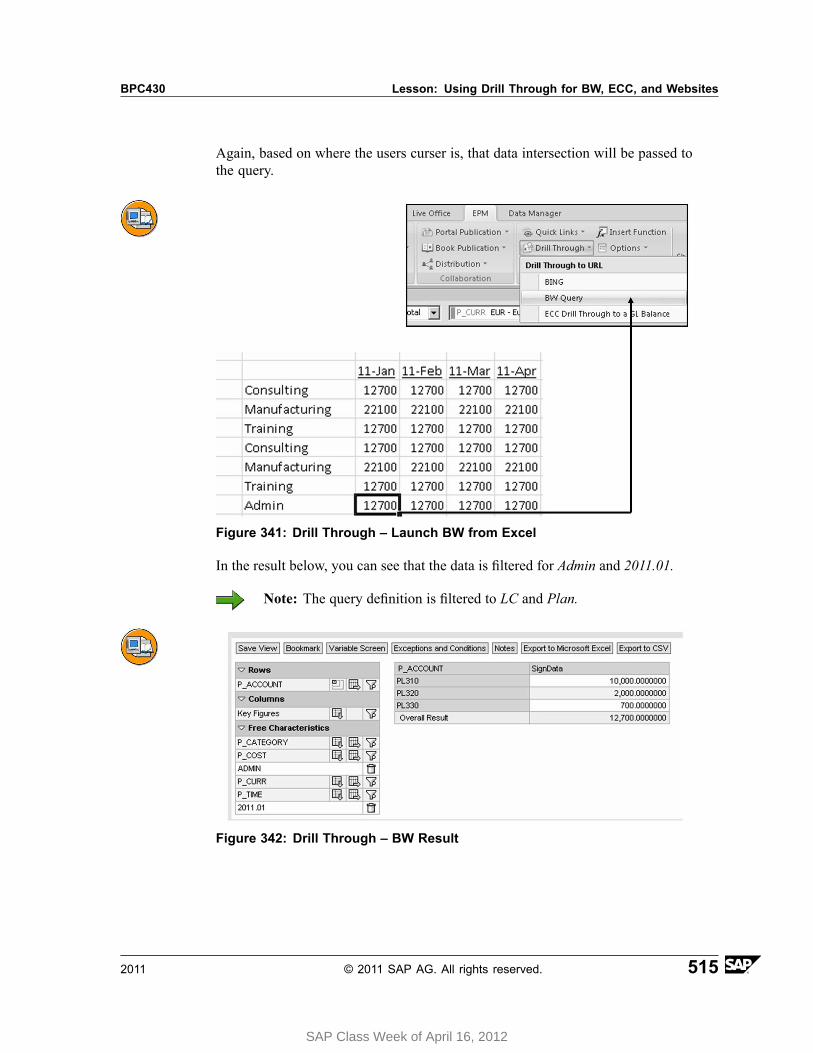
BPC430 Lesson: Using Drill Through for BW, ECC, and Websites
Again, based on where the users curser is, that data intersection will be passed tothe query.
Figure 341: Drill Through – Launch BW from Excel
In the result below, you can see that the data is filtered for Admin and 2011.01.
Note: The query definition is filtered to LC and Plan.
Figure 342: Drill Through – BW Result
2011 © 2011 SAP AG. All rights reserved. 515
SAP Class Week of April 16, 2012
Unit 6: Drill Through BPC430
SecurityThere are three drill through task profiles:
1. Manage Drill Throughs - this allows a user to maintain drill through parameters2. View Drill Throughs - this allows a user to view drill through parameters3. Run Drill Throughs - this allows a user to run a drill through
516 © 2011 SAP AG. All rights reserved. 2011
SAP Class Week of April 16, 2012
BPC430 Lesson: Using Drill Through for BW, ECC, and Websites
Exercise 18: Configuring the URL BasedDrill Through
Exercise ObjectivesAfter completing this exercise, you will be able to:• Create and test the web site drill through• Create and test the BW Query drill through
Business ExampleWhile working in the Excel interface, users typically need to access related data. So,they may need to perform a filtered jump to a website, related BW Query to look atgeneral ledger details for example that don't exist in SAP BusinessObjects Planningand Consolidation.
Task 1: Create a Web Site Drill ThroughConfigure the web site drill through to http:/www.BING.COM in administration anduse it in the Excel Interface of the EPM add-in.
1. Open Administration for your BPC430_## Environment.
2. Go to the Drill Through screen.
3. Configure the website drill through in Administration for your BPC430_##Environment and Expense Model as you see below:
Use a parameter value of q for the dimension P_Cost ID as the filter criteria.
Continued on next page
2011 © 2011 SAP AG. All rights reserved. 517
SAP Class Week of April 16, 2012

Unit 6: Drill Through BPC430
Figure 343: Drill through – URL Parameters
4. Test the drill through from Administration.
5. Open the Excel Interface of the EPM add-in.
6. Set your context members as shown below and open the Dynamic Report WithSubtotals - Accounts.
Dimension Member ID - Description
P_Account PL400 - Indirect Expenses
P_Category PLAN - Plan
P_Cost DIRECT - Direct
P_Curr LC - Local Currency
P_Time 2011.TOTAL - 2011 Total
Measures PERIODIC - Periodic
7. Test the web-based drill through in the Excel Interface of the EPM add-in.
Continued on next page
518 © 2011 SAP AG. All rights reserved. 2011
SAP Class Week of April 16, 2012
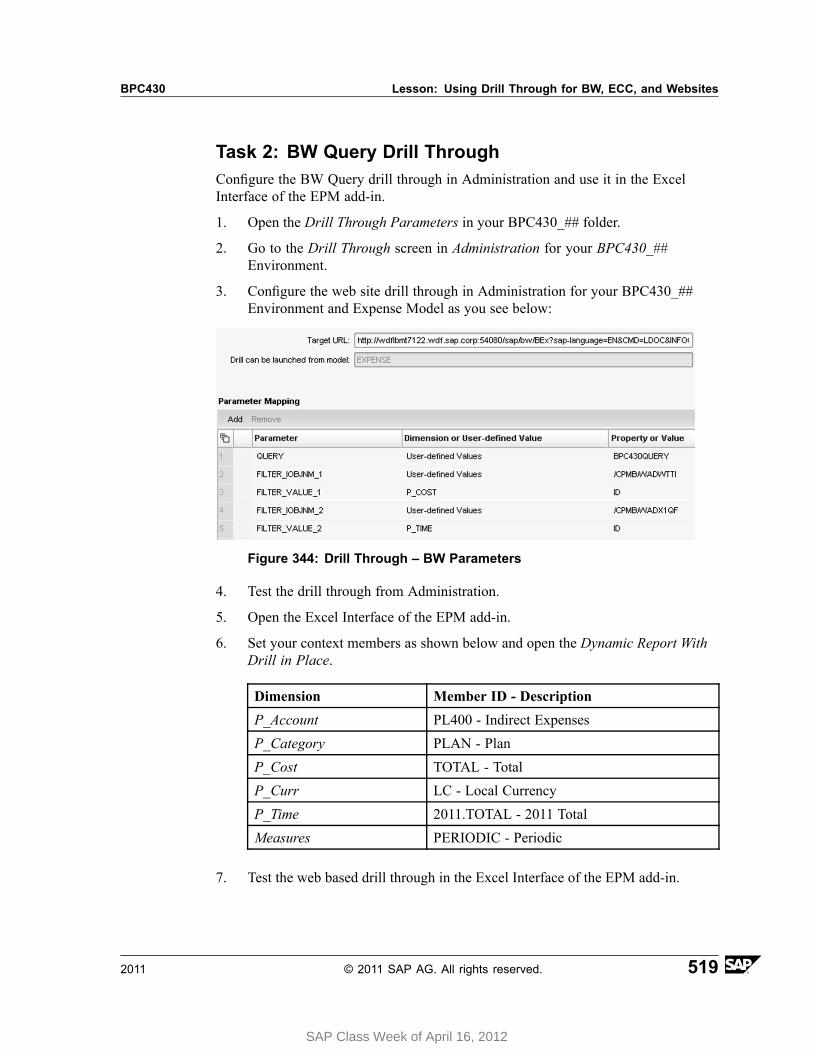
BPC430 Lesson: Using Drill Through for BW, ECC, and Websites
Task 2: BW Query Drill ThroughConfigure the BW Query drill through in Administration and use it in the ExcelInterface of the EPM add-in.
1. Open the Drill Through Parameters in your BPC430_## folder.
2. Go to the Drill Through screen in Administration for your BPC430_##Environment.
3. Configure the web site drill through in Administration for your BPC430_##Environment and Expense Model as you see below:
Figure 344: Drill Through – BW Parameters
4. Test the drill through from Administration.
5. Open the Excel Interface of the EPM add-in.
6. Set your context members as shown below and open the Dynamic Report WithDrill in Place.
Dimension Member ID - Description
P_Account PL400 - Indirect Expenses
P_Category PLAN - Plan
P_Cost TOTAL - Total
P_Curr LC - Local Currency
P_Time 2011.TOTAL - 2011 Total
Measures PERIODIC - Periodic
7. Test the web based drill through in the Excel Interface of the EPM add-in.
2011 © 2011 SAP AG. All rights reserved. 519
SAP Class Week of April 16, 2012
Unit 6: Drill Through BPC430
Solution 18: Configuring the URL BasedDrill ThroughTask 1: Create a Web Site Drill ThroughConfigure the web site drill through to http:/www.BING.COM in administration anduse it in the Excel Interface of the EPM add-in.
1. Open Administration for your BPC430_## Environment.
a) On the web client Home tab, choose the Start Page and click Planningand Consolidation Administration
The Administration tab is created.
2. Go to the Drill Through screen.
a) Choose Features → Drill Through.
An Empty Drill Through screen is displayed.
3. Configure the website drill through in Administration for your BPC430_##Environment and Expense Model as you see below:
Use a parameter value of q for the dimension P_Cost ID as the filter criteria.
Continued on next page
520 © 2011 SAP AG. All rights reserved. 2011
SAP Class Week of April 16, 2012
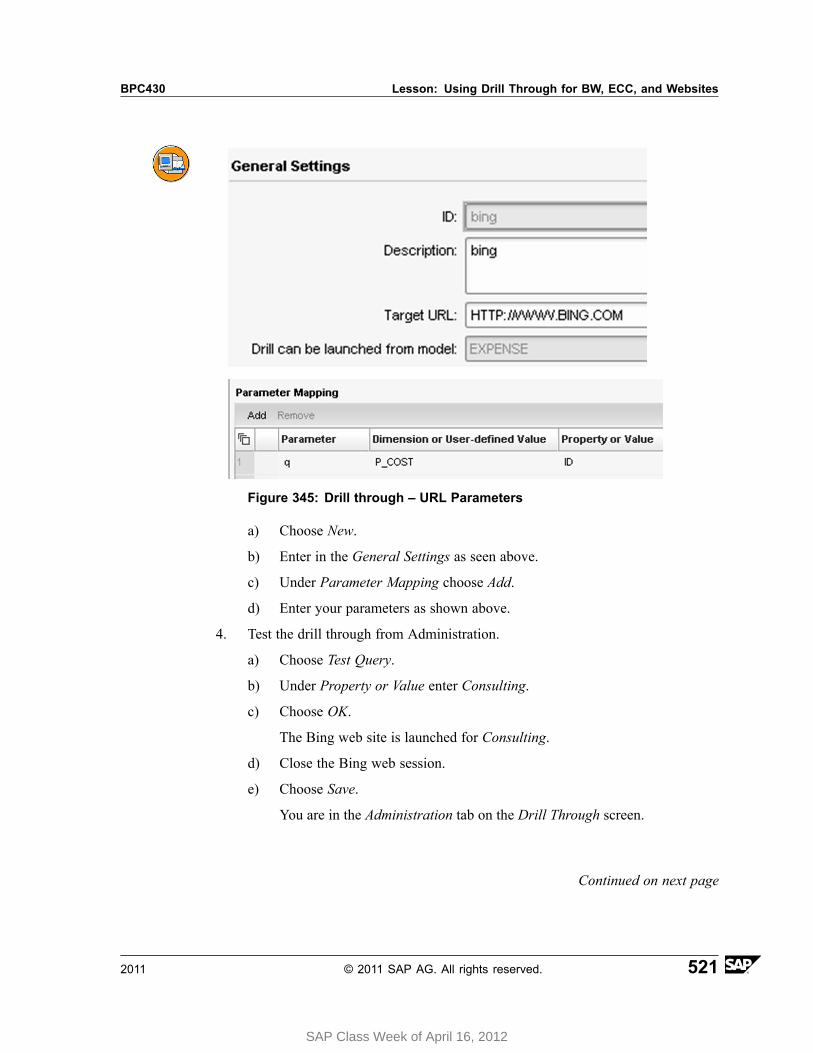
BPC430 Lesson: Using Drill Through for BW, ECC, and Websites
Figure 345: Drill through – URL Parameters
a) Choose New.
b) Enter in the General Settings as seen above.
c) Under Parameter Mapping choose Add.
d) Enter your parameters as shown above.
4. Test the drill through from Administration.
a) Choose Test Query.
b) Under Property or Value enter Consulting.
c) Choose OK.
The Bing web site is launched for Consulting.
d) Close the Bing web session.
e) Choose Save.
You are in the Administration tab on the Drill Through screen.
Continued on next page
2011 © 2011 SAP AG. All rights reserved. 521
SAP Class Week of April 16, 2012
Unit 6: Drill Through BPC430
5. Open the Excel Interface of the EPM add-in.
a) In the Web Client Start Page select EPM Office Add-in Excel.
Hint: If you are already connected to the Expense model in theExcel client, you should log off and log back on.
The EPM - Connection Manager opens after a few seconds.
b) Select the Expense - BPC430_## connection.
c) Choose OK.
The EPM Pane appears on the right.
6. Set your context members as shown below and open the Dynamic Report WithSubtotals - Accounts.
Dimension Member ID - Description
P_Account PL400 - Indirect Expenses
P_Category PLAN - Plan
P_Cost DIRECT - Direct
P_Curr LC - Local Currency
P_Time 2011.TOTAL - 2011 Total
Measures PERIODIC - Periodic
a) Set your context selections as shown above.
Hint: If you do not see the EPM Context create a blank workbook.
b) In the EPM ribbon, select Open → Open server root folder.
c) On the left side of the dialog box, choose Company(Public) Reports →Templates
d) Select the Dynamic Report With Hierarchy - Entities → Open
e) Choose Refresh
Continued on next page
522 © 2011 SAP AG. All rights reserved. 2011
SAP Class Week of April 16, 2012
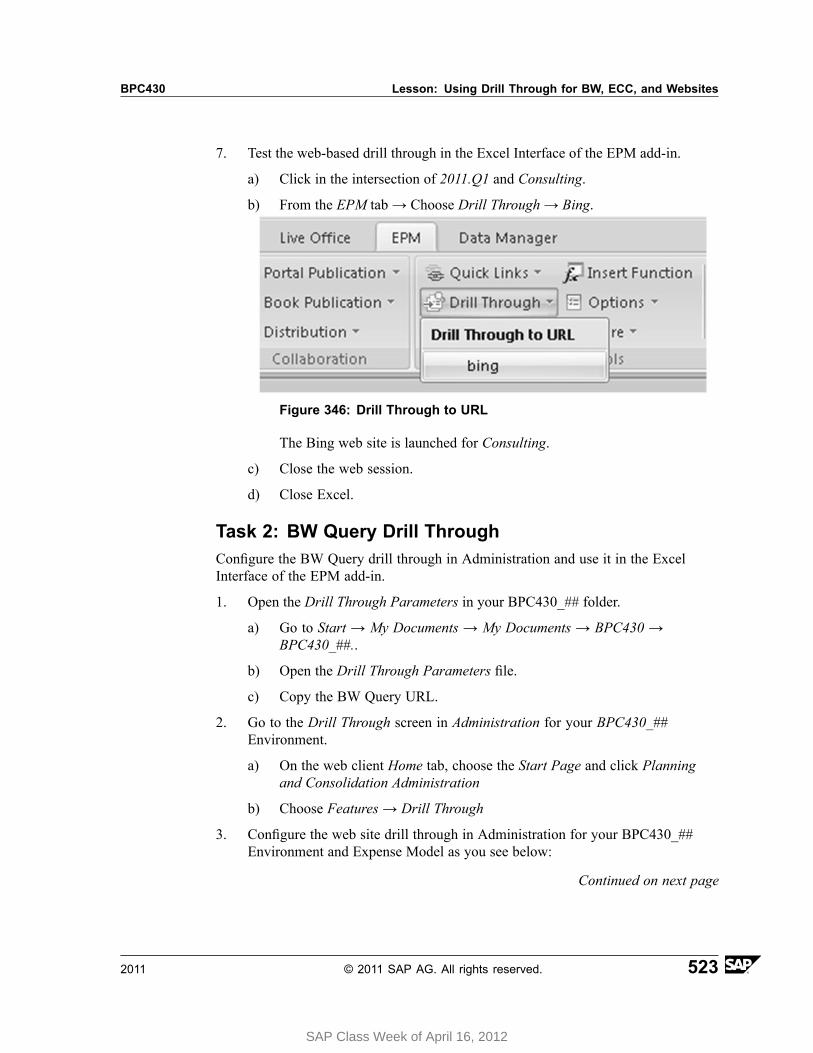
BPC430 Lesson: Using Drill Through for BW, ECC, and Websites
7. Test the web-based drill through in the Excel Interface of the EPM add-in.
a) Click in the intersection of 2011.Q1 and Consulting.
b) From the EPM tab → Choose Drill Through → Bing.
Figure 346: Drill Through to URL
The Bing web site is launched for Consulting.
c) Close the web session.
d) Close Excel.
Task 2: BW Query Drill ThroughConfigure the BW Query drill through in Administration and use it in the ExcelInterface of the EPM add-in.
1. Open the Drill Through Parameters in your BPC430_## folder.
a) Go to Start → My Documents → My Documents → BPC430 →BPC430_##..
b) Open the Drill Through Parameters file.
c) Copy the BW Query URL.
2. Go to the Drill Through screen in Administration for your BPC430_##Environment.
a) On the web client Home tab, choose the Start Page and click Planningand Consolidation Administration
b) Choose Features → Drill Through
3. Configure the web site drill through in Administration for your BPC430_##Environment and Expense Model as you see below:
Continued on next page
2011 © 2011 SAP AG. All rights reserved. 523
SAP Class Week of April 16, 2012
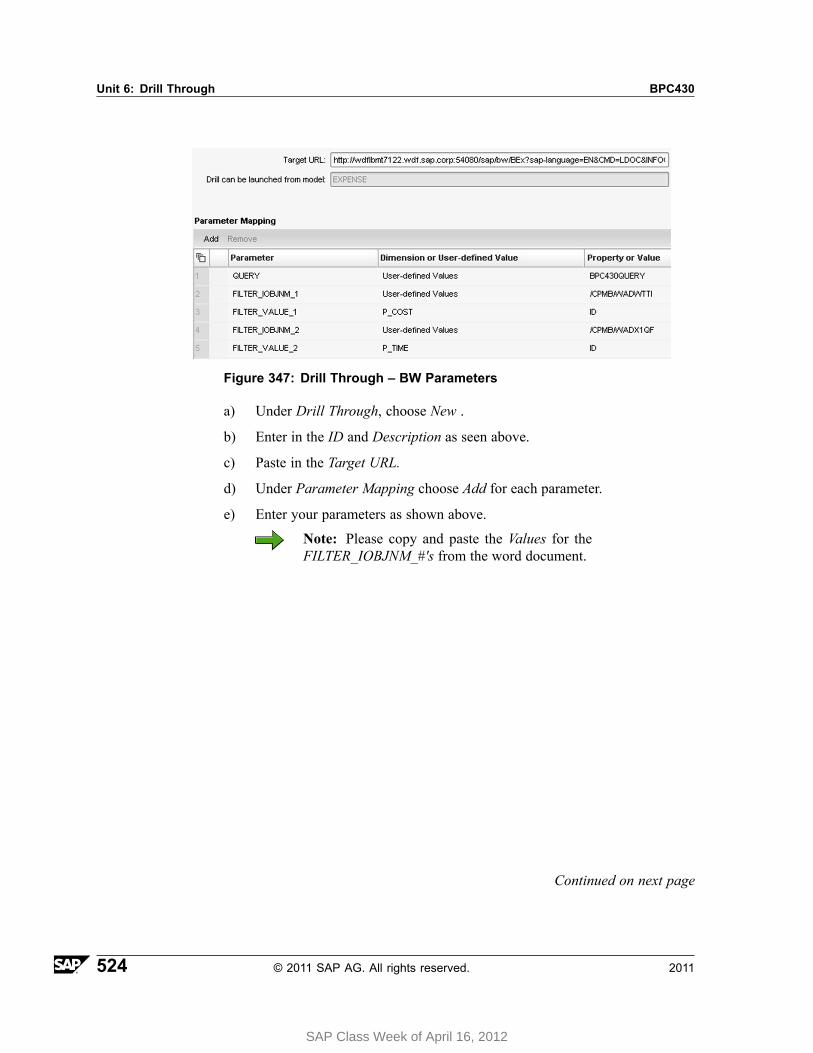
Unit 6: Drill Through BPC430
Figure 347: Drill Through – BW Parameters
a) Under Drill Through, choose New .
b) Enter in the ID and Description as seen above.
c) Paste in the Target URL.
d) Under Parameter Mapping choose Add for each parameter.
e) Enter your parameters as shown above.
Note: Please copy and paste the Values for theFILTER_IOBJNM_#'s from the word document.
Continued on next page
524 © 2011 SAP AG. All rights reserved. 2011
SAP Class Week of April 16, 2012
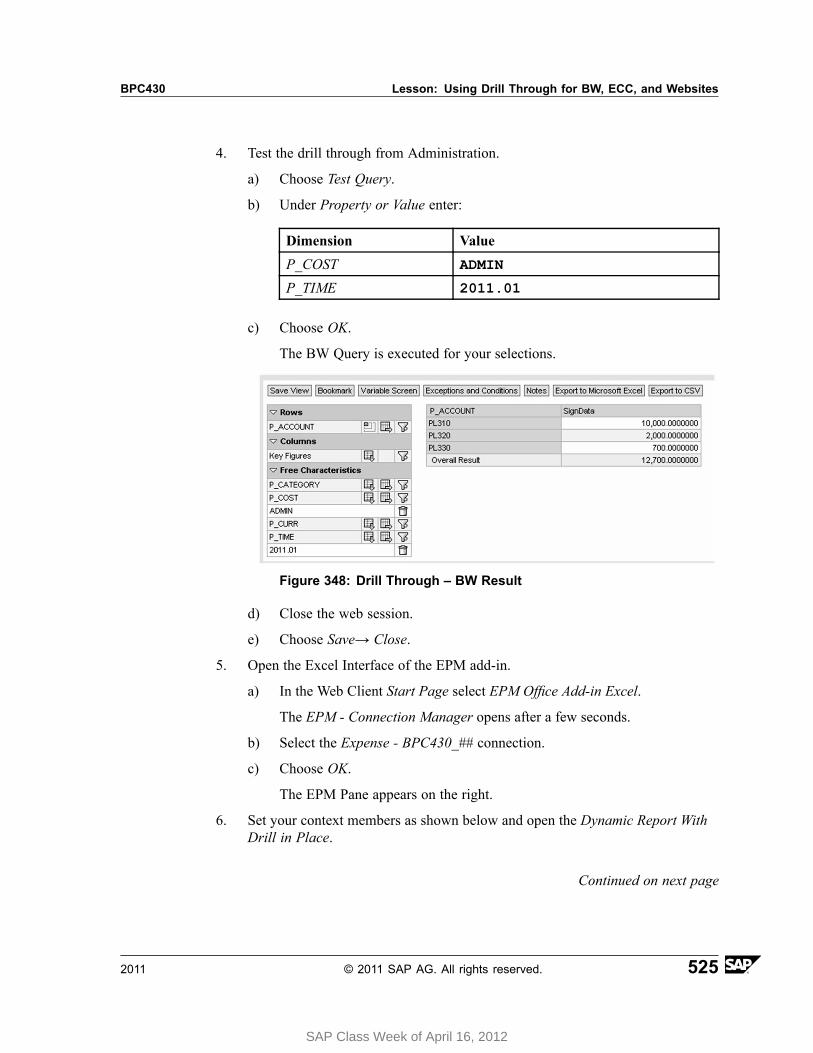
BPC430 Lesson: Using Drill Through for BW, ECC, and Websites
4. Test the drill through from Administration.
a) Choose Test Query.
b) Under Property or Value enter:
Dimension Value
P_COST ADMIN
P_TIME 2011.01
c) Choose OK.
The BW Query is executed for your selections.
Figure 348: Drill Through – BW Result
d) Close the web session.
e) Choose Save→ Close.
5. Open the Excel Interface of the EPM add-in.
a) In the Web Client Start Page select EPM Office Add-in Excel.
The EPM - Connection Manager opens after a few seconds.
b) Select the Expense - BPC430_## connection.
c) Choose OK.
The EPM Pane appears on the right.
6. Set your context members as shown below and open the Dynamic Report WithDrill in Place.
Continued on next page
2011 © 2011 SAP AG. All rights reserved. 525
SAP Class Week of April 16, 2012
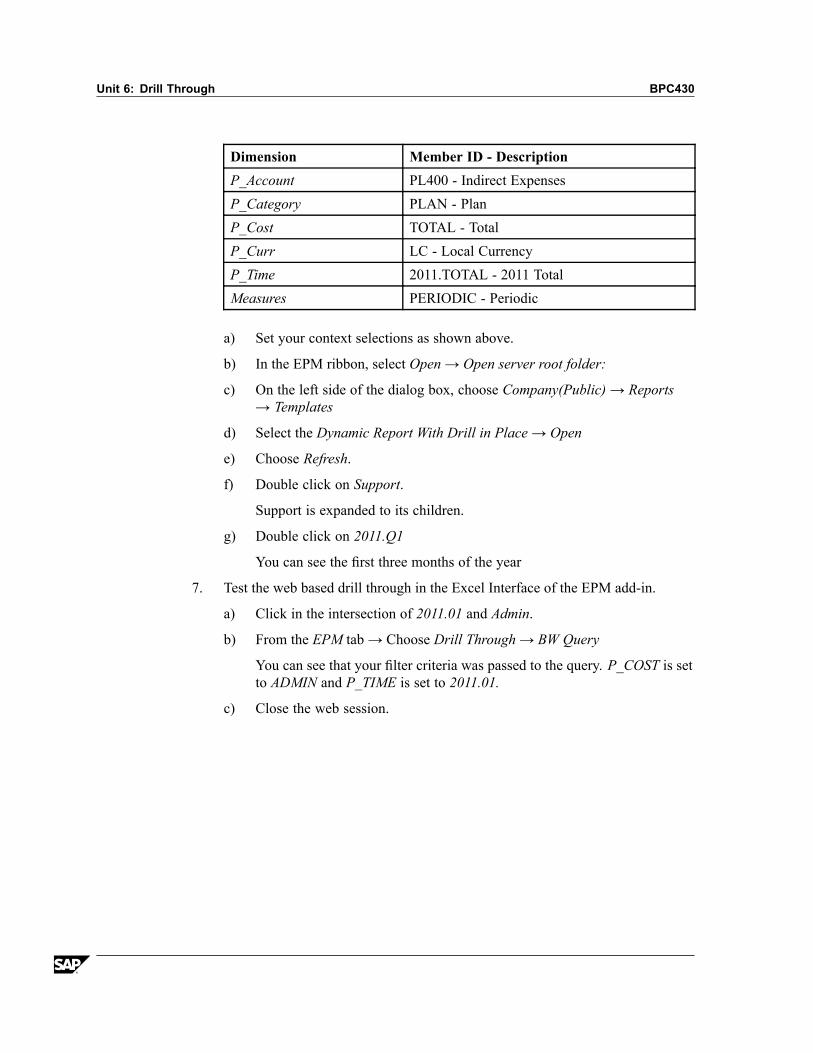
Unit 6: Drill Through BPC430
Dimension Member ID - Description
P_Account PL400 - Indirect Expenses
P_Category PLAN - Plan
P_Cost TOTAL - Total
P_Curr LC - Local Currency
P_Time 2011.TOTAL - 2011 Total
Measures PERIODIC - Periodic
a) Set your context selections as shown above.
b) In the EPM ribbon, select Open → Open server root folder:
c) On the left side of the dialog box, choose Company(Public) → Reports→ Templates
d) Select the Dynamic Report With Drill in Place → Open
e) Choose Refresh.
f) Double click on Support.
Support is expanded to its children.
g) Double click on 2011.Q1
You can see the first three months of the year
7. Test the web based drill through in the Excel Interface of the EPM add-in.
a) Click in the intersection of 2011.01 and Admin.
b) From the EPM tab → Choose Drill Through → BW Query
You can see that your filter criteria was passed to the query. P_COST is setto ADMIN and P_TIME is set to 2011.01.
c) Close the web session.

BPC430 Lesson: Using Drill Through for BW, ECC, and Websites
Lesson Summary
You should now be able to:• Configure drill through for a website• Configure drill through for a BW Query• Configure drill through for ECC
2011 © 2011 SAP AG. All rights reserved. 527
SAP Class Week of April 16, 2012

Unit Summary BPC430
Unit SummaryYou should now be able to:• Configure drill through for a website• Configure drill through for a BW Query• Configure drill through for ECC
528 © 2011 SAP AG. All rights reserved. 2011
SAP Class Week of April 16, 2012

SAP Class Week of April 16, 2012

SAP Class Week of April 16, 2012

Unit Summary BPC430
529 © 2011 SAP AG. All rights reserved. 2011
SAP Class Week of April 16, 2012

Unit Summary BPC430
530 © 2011 SAP AG. All rights reserved. 2011
SAP Class Week of April 16, 2012
Unit 7Word and Powerpoint
Unit OverviewThis unit covers the EPM add-in for Word and PowerPoint.
Unit ObjectivesAfter completing this unit, you will be able to:
• Describe the EPM add-in for Word and PowerPoint• Insert SAP Business Planning and Consolidation data into a Microsoft Word file• Insert SAP Business Planning and Consolidation data into a Microsoft
PowerPoint file.
Unit ContentsLesson: Using Word and PowerPoint . . . . . . . . . . . . . . . . . . . . . . . . . . . . . . . . . . . . . . . . . . . .532
Procedure: Copy an Excel Report into Word or PowerPoint . . . . . . . . . . . . .536Exercise 19: Creating reports with the EPM add-in for Word andPowerpoint. . . . . . . . . . . . . . . . . . . . . . . . . . . . . . . . . . . . . . . . . . . . . . . . . . . . . . . . . . . . . . . . . . . . . . .537
2011 © 2011 SAP AG. All rights reserved. 531
SAP Class Week of April 16, 2012
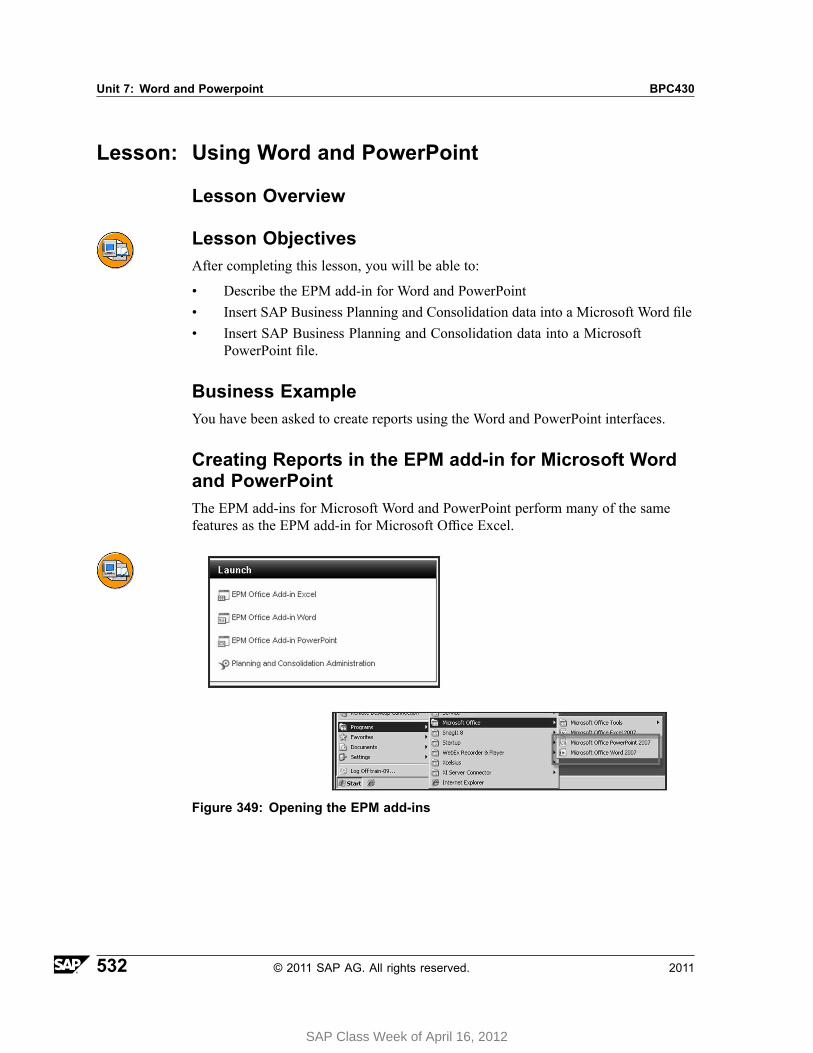
Unit 7: Word and Powerpoint BPC430
Lesson: Using Word and PowerPoint
Lesson Overview
Lesson ObjectivesAfter completing this lesson, you will be able to:
• Describe the EPM add-in for Word and PowerPoint• Insert SAP Business Planning and Consolidation data into a Microsoft Word file• Insert SAP Business Planning and Consolidation data into a Microsoft
PowerPoint file.
Business ExampleYou have been asked to create reports using the Word and PowerPoint interfaces.
Creating Reports in the EPM add-in for Microsoft Wordand PowerPointThe EPM add-ins for Microsoft Word and PowerPoint perform many of the samefeatures as the EPM add-in for Microsoft Office Excel.
Figure 349: Opening the EPM add-ins
532 © 2011 SAP AG. All rights reserved. 2011
SAP Class Week of April 16, 2012
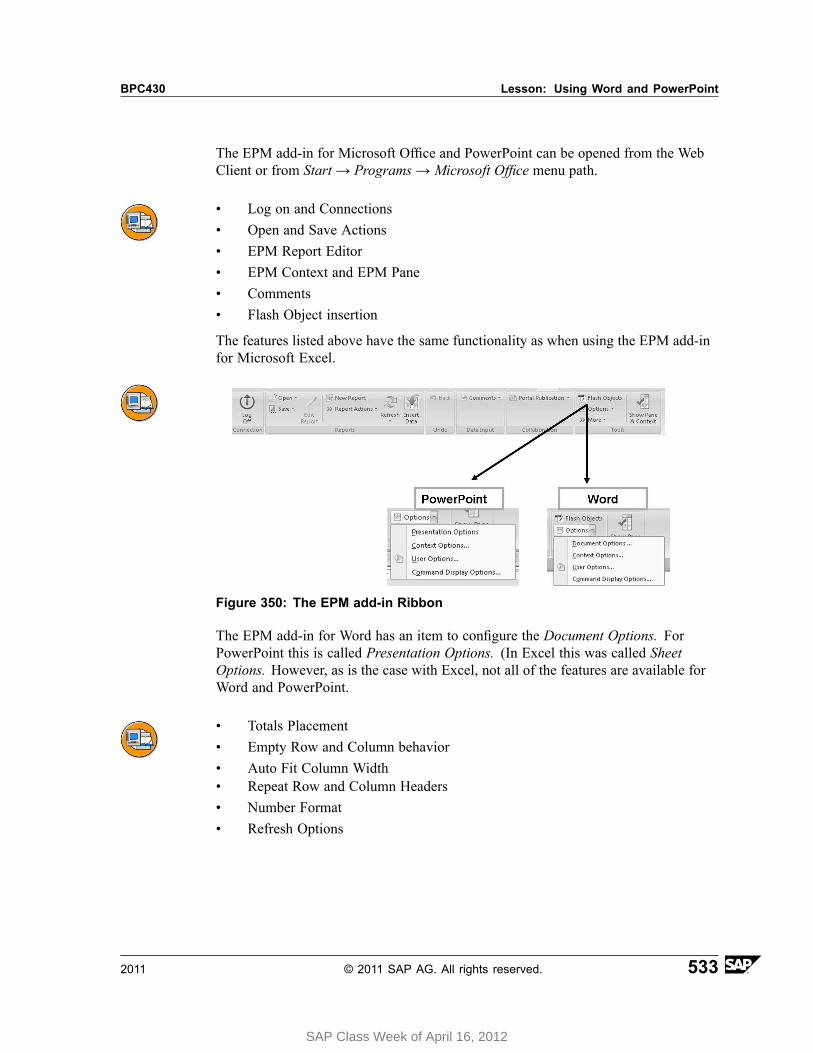
BPC430 Lesson: Using Word and PowerPoint
The EPM add-in for Microsoft Office and PowerPoint can be opened from the WebClient or from Start → Programs → Microsoft Office menu path.
• Log on and Connections• Open and Save Actions• EPM Report Editor• EPM Context and EPM Pane• Comments• Flash Object insertion
The features listed above have the same functionality as when using the EPM add-infor Microsoft Excel.
Figure 350: The EPM add-in Ribbon
The EPM add-in for Word has an item to configure the Document Options. ForPowerPoint this is called Presentation Options. (In Excel this was called SheetOptions. However, as is the case with Excel, not all of the features are available forWord and PowerPoint.
• Totals Placement• Empty Row and Column behavior• Auto Fit Column Width• Repeat Row and Column Headers• Number Format• Refresh Options
2011 © 2011 SAP AG. All rights reserved. 533
SAP Class Week of April 16, 2012

Unit 7: Word and Powerpoint BPC430
When you open the Options, the options noted above are available. Those that aregreyed out are not available for Word and PowerPoint. The Number Format optionenables you to enter how you want the data numbers to be displayed, including athousands separator and a decimal number. The default format is 0.## (No separatorand 2 decimal places.)
Figure 351: Insert Data Point
An additional feature for Word and PowerPoint is the option to insert a data point (onevalue.) This can be inserted for the context dimension members, for a specified setof dimension members, or combination of the two. If you do not specify a memberfor all the dimensions of the cube or model, the context members will be inheritedfrom the EPM Context.
534 © 2011 SAP AG. All rights reserved. 2011
SAP Class Week of April 16, 2012
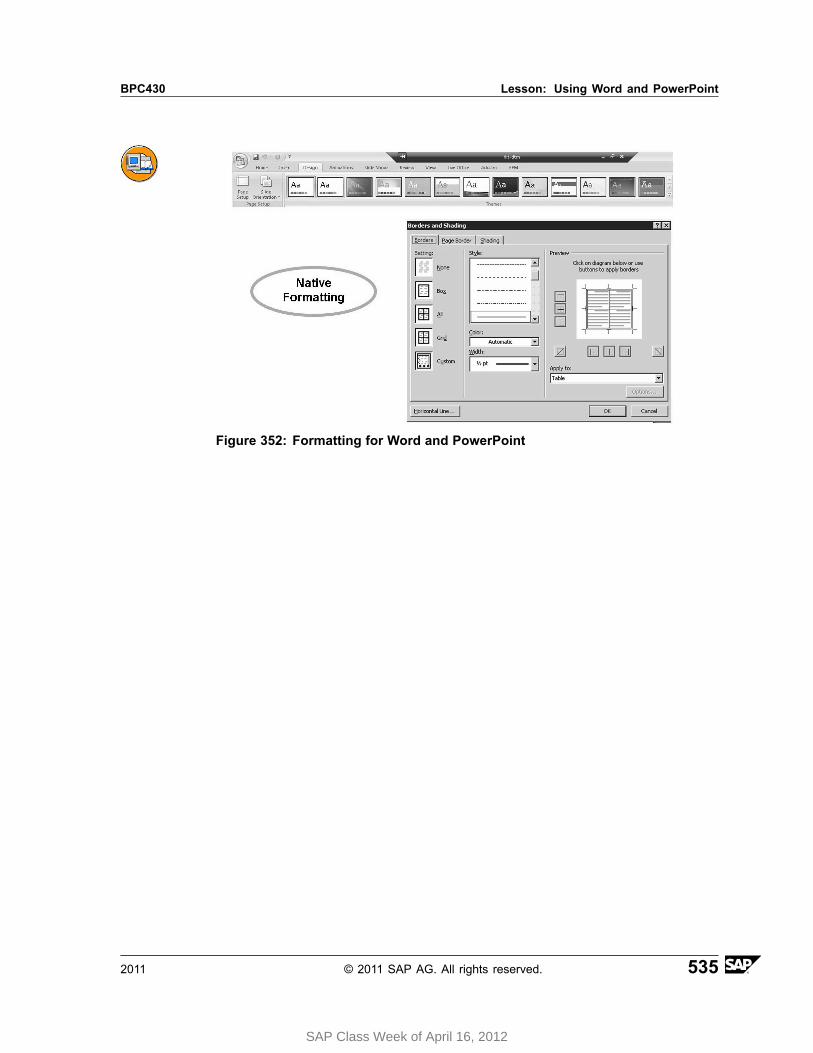
BPC430 Lesson: Using Word and PowerPoint
Figure 352: Formatting for Word and PowerPoint
2011 © 2011 SAP AG. All rights reserved. 535
SAP Class Week of April 16, 2012
Unit 7: Word and Powerpoint BPC430
Copy an Excel Report into Word or PowerPoint
1. Create a report in the EPM add-in for Excel
2. Open Word or PowerPoint.
3. In the EPM add-in Ribbon, choose Log On.
4. Choose the Ellipsis button, and select the Connection you were using in Excel.
5. Go back to Excel, and place your cursor anywhere within the report.
6. From the EPM ribbon, choose Report Actions → Copy report
7. Switch back to Word or PowerPoint and choose Report Actions → Paste Report
536 © 2011 SAP AG. All rights reserved. 2011
SAP Class Week of April 16, 2012
BPC430 Lesson: Using Word and PowerPoint
Exercise 19: Creating reports with the EPMadd-in for Word and Powerpoint
Exercise ObjectivesAfter completing this exercise, you will be able to:• Learn how to use the EPM add-in for Word and Powerpoint.
Business ExampleThere are business users who would like to see reports in Word and Powerpoint.
Task 1:Use Word to create a report.
1. Access the EPM add-in for Word.
2. Create a connection to the Sales Model for your assigned Environment andmake sure your EPM Context bar and EPM Pane are displayed. (Or if you haveconnected in previous exercises, choose the existing connection)
3. Ensure that your Active Connection is SALES - BPC430_##
4. Create a report with the Product and P_Acct dimension in the Row Axis andTime in the Column Axis.
5. Set your EPM Context.
6. Format the fill in the blanks with zeros and change for the numbers to includethousand separators.
7. Close the report without saving.
Task 2:Use PowerPoint to Insert some data points.
1. Open PowerPoint and Logon to the EPM add-in
2. Set your EPM Context.
3. In the PowerPoint Presentation, type The Dog Product Sales in 2009were
4. Insert a data point.
Continued on next page
2011 © 2011 SAP AG. All rights reserved. 537
SAP Class Week of April 16, 2012

Unit 7: Word and Powerpoint BPC430
5. Move your data point.
6. In the PowerPoint Presentation type The Cat Product Sales in 2009were
7. Insert another data point for all cat products.
8. Move your data point
9. Format the results according to your preference.
538 © 2011 SAP AG. All rights reserved. 2011
SAP Class Week of April 16, 2012

BPC430 Lesson: Using Word and PowerPoint
Solution 19: Creating reports with the EPMadd-in for Word and PowerpointTask 1:Use Word to create a report.
1. Access the EPM add-in for Word.
a) From the Remote Desktop: Start → Programs → Microsoft Office →Microsoft Office Word 2007.
Microsoft Word will open
2. Create a connection to the Sales Model for your assigned Environment andmake sure your EPM Context bar and EPM Pane are displayed. (Or if you haveconnected in previous exercises, choose the existing connection)
a) Choose the EPM tab → Log On.
The EPM - Logon window is displayed.
b) To the right of the Connection field, choose the Ellipses (...) button.
The EPM - Connection Manager window opens
c) If you have the SALES - BPC430_## connection, choose it and thenchoose OK. Move to Step 3.
If not, choose the Create button
The Create Connection window appears
d) In the Server URL field, type: http://wd-flbmt7122.wdf.sap.corp:54080/sap/bpc/ (no dashes) as shown below.
Continued on next page
2011 © 2011 SAP AG. All rights reserved. 539
SAP Class Week of April 16, 2012
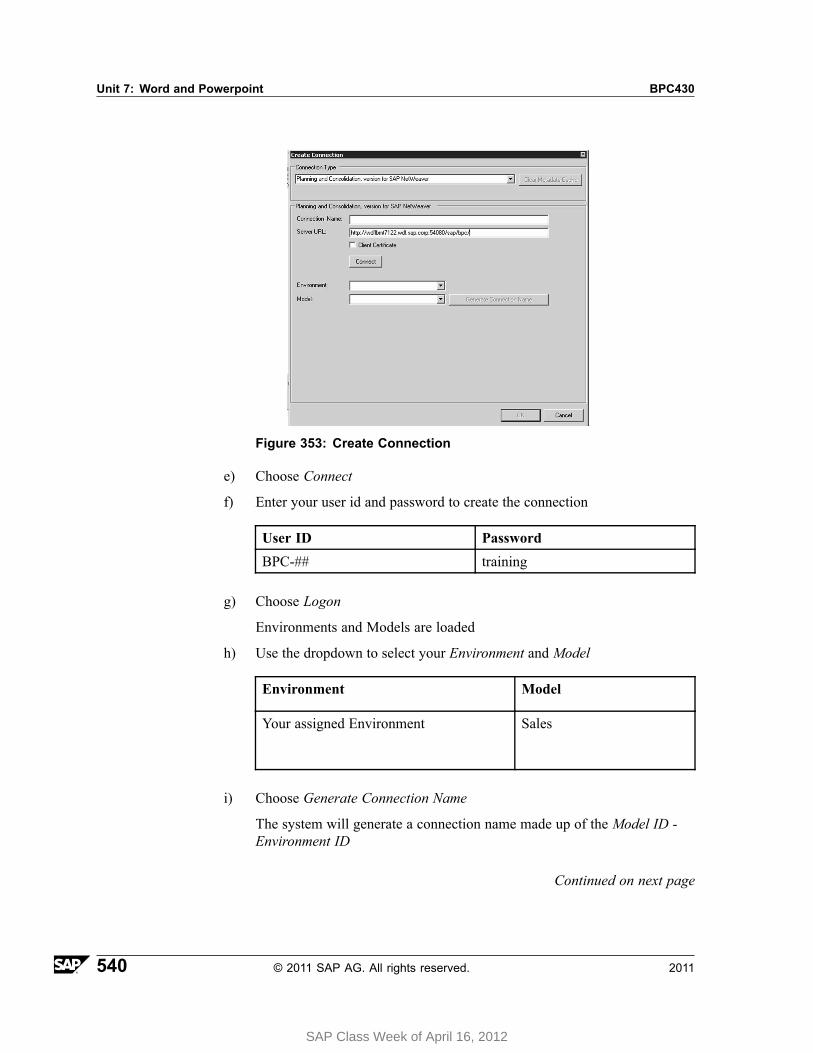
Unit 7: Word and Powerpoint BPC430
Figure 353: Create Connection
e) Choose Connect
f) Enter your user id and password to create the connection
User ID Password
BPC-## training
g) Choose Logon
Environments and Models are loaded
h) Use the dropdown to select your Environment and Model
Environment Model
Your assigned Environment Sales
i) Choose Generate Connection Name
The system will generate a connection name made up of the Model ID -Environment ID
Continued on next page
540 © 2011 SAP AG. All rights reserved. 2011
SAP Class Week of April 16, 2012
BPC430 Lesson: Using Word and PowerPoint
j) Click OK twice
k) If you are prompted, logon again with your user and password.
l) From the EPM Ribbon choose Options → User Options
The EPM - User Options window opens
m) Choose the Others tab. In the bottom right, make sure the checkboxesDisplay EPM Context Bar and Display EPM Pane are selected.
n) Choose OK
3. Ensure that your Active Connection is SALES - BPC430_##
a) In the EPM Pane make sure the Active Connection is set to SALES -BPC430_##. If not, choose it from the dropdown.
4. Create a report with the Product and P_Acct dimension in the Row Axis andTime in the Column Axis.
a) From the EPM Pane right mouse click on the PRODUCT dimension andchoose Move to Row Axis
b) Right mouse click on the P_ACCT dimension and choose Move to RowAxis.
c) Right mouse click on the TIME dimension and choose Move to ColumnAxis.
The Report is executed.
5. Set your EPM Context.
a) Set your EPM Context to the following:
Dimension Member ID - Description
CATEGORY Actual - Actual from GL
ENTITY STORE1 - Store1
PRODUCT DOGACTIVECAN - High Energy Food forActive Dogs
P_ACCT CE0004000 - Personal Costs
RPTCURRENCY LC - Local Currency
Continued on next page
2011 © 2011 SAP AG. All rights reserved. 541
SAP Class Week of April 16, 2012
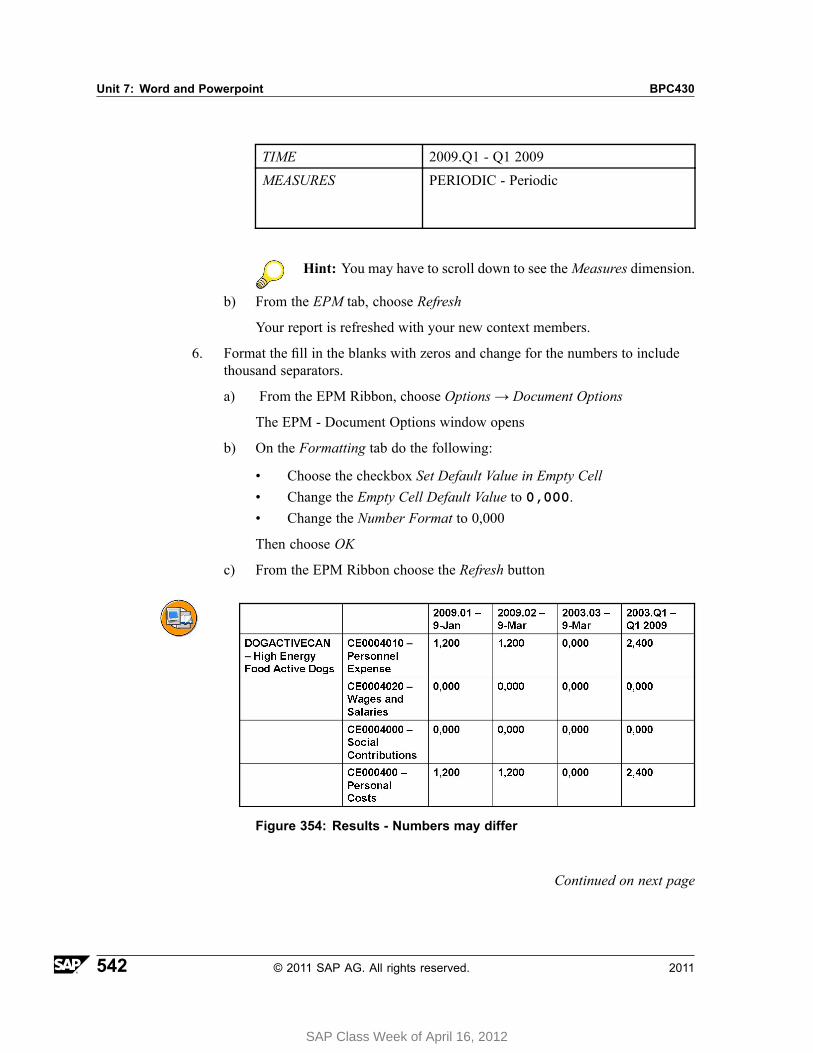
Unit 7: Word and Powerpoint BPC430
TIME 2009.Q1 - Q1 2009
MEASURES PERIODIC - Periodic
Hint: You may have to scroll down to see theMeasures dimension.
b) From the EPM tab, choose Refresh
Your report is refreshed with your new context members.
6. Format the fill in the blanks with zeros and change for the numbers to includethousand separators.
a) From the EPM Ribbon, choose Options → Document Options
The EPM - Document Options window opens
b) On the Formatting tab do the following:
• Choose the checkbox Set Default Value in Empty Cell• Change the Empty Cell Default Value to 0,000.• Change the Number Format to 0,000
Then choose OK
c) From the EPM Ribbon choose the Refresh button
Figure 354: Results - Numbers may differ
Continued on next page
542 © 2011 SAP AG. All rights reserved. 2011
SAP Class Week of April 16, 2012
BPC430 Lesson: Using Word and PowerPoint
7. Close the report without saving.
a) From the Office button, choose Close.
The Microsoft Office Word window appears.
b) When prompted with Do you want to save choose No.
Task 2:Use PowerPoint to Insert some data points.
1. Open PowerPoint and Logon to the EPM add-in
a) From the Remote Desktop Connection choose Start → Programs →Microsoft Office → Microsoft Office PowerPoint 2007.
b) Choose the EPM add-in ribbon and choose Log On.
The EPM - Logon window opens.
c) To the right of the Connection field, choose the Ellipses (...) button.
The EPM - Connection Manager window opens
d) Choose your Sales Connection from the Word task and choose OK
The EPM - Logon window opens
e) Enter your user id and password and choose Logon
2. Set your EPM Context.
a) Set your EPM Context to the following:
Dimension Member ID - Description
CATEGORY Actual - Actual from GL
ENTITY CONSTORE_TYPE
PRODUCT DOG - All Dog Products
P_ACCT EXTSALES - External Sales
RPTCURRENCY LC - Local Currency
TIME 2009.TOTAL - TOTAL - 2009
MEASURES PERIODIC - Periodic
Continued on next page
2011 © 2011 SAP AG. All rights reserved. 543
SAP Class Week of April 16, 2012
Unit 7: Word and Powerpoint BPC430
3. In the PowerPoint Presentation, type The Dog Product Sales in 2009were
a) Delete the title and subtitle text boxes in the presentation.
b) In Excel, choose the Insert tab, then insert a Text Box by choosing Text Boxand then drawing a text box in the PowerPoint.
c) In that text box, enter the text noted above.
4. Insert a data point.
a) Choose the EPM tab, then from the EPM Ribbon choose the Insert Databutton.
b) Since our EPM Context represents what we want, just choose OK.
A data point called #RFR is generated.
c) From the EPM Ribbon choose Refresh
5. Move your data point.
a) Click once on the data point, then drag and drop to the right of the textyou just typed.
6. In the PowerPoint Presentation type The Cat Product Sales in 2009were
a) In Excel, choose the Insert tab, then insert a Text Box by choosing Text Boxand then drawing a text box in the PowerPoint.
b) Enter the text noted above.
7. Insert another data point for all cat products.
a) Choose the EPM tab, and from the EPM Ribbon choose the Insert Databutton.
b) Under the Dimensions area choose the Product dimension and under theMembers area choose All Cat Products (You may have to open the PetType Consolidation hierarchy)
c) Choose OK.
d) From the EPM Ribbon choose Refresh.
8. Move your data point
a) Click once on the data point, then drag and drop to the right of the textyour just typed.
Continued on next page
544 © 2011 SAP AG. All rights reserved. 2011
SAP Class Week of April 16, 2012
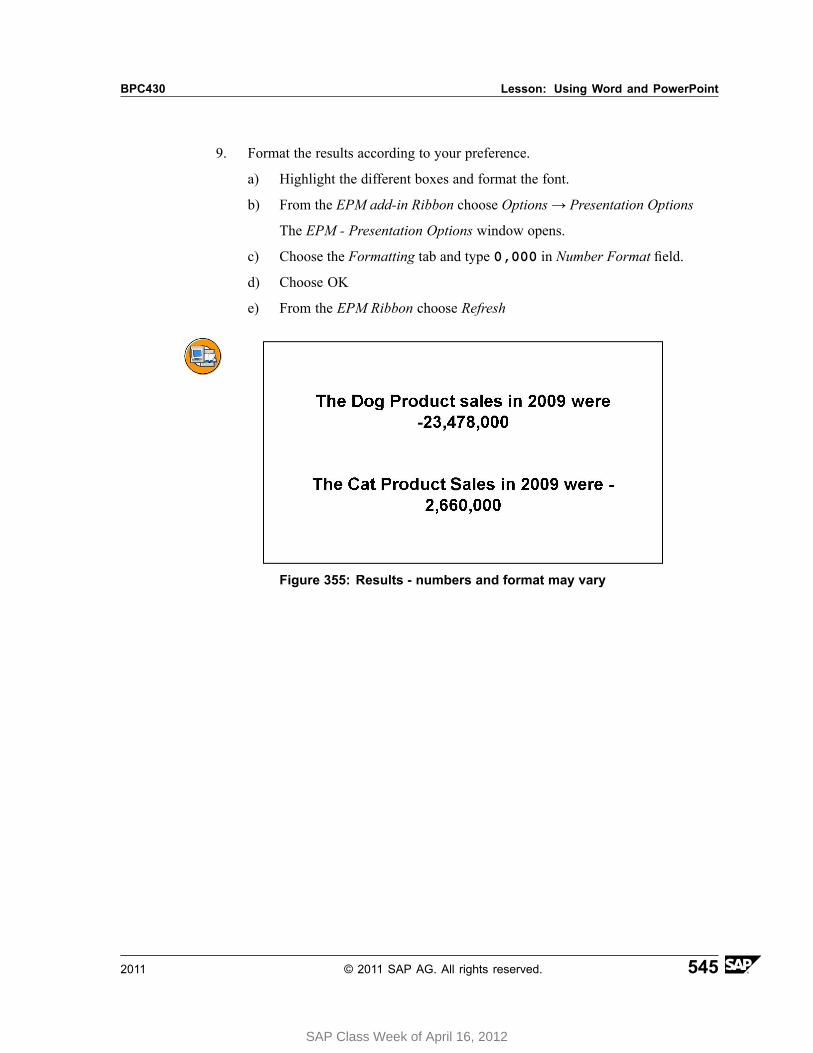
BPC430 Lesson: Using Word and PowerPoint
9. Format the results according to your preference.
a) Highlight the different boxes and format the font.
b) From the EPM add-in Ribbon choose Options → Presentation Options
The EPM - Presentation Options window opens.
c) Choose the Formatting tab and type 0,000 in Number Format field.
d) Choose OK
e) From the EPM Ribbon choose Refresh
Figure 355: Results - numbers and format may vary
2011 © 2011 SAP AG. All rights reserved. 545
SAP Class Week of April 16, 2012
Unit 7: Word and Powerpoint BPC430
Lesson Summary
You should now be able to:• Describe the EPM add-in for Word and PowerPoint• Insert SAP Business Planning and Consolidation data into a Microsoft Word file• Insert SAP Business Planning and Consolidation data into a Microsoft
PowerPoint file.
546 © 2011 SAP AG. All rights reserved. 2011
SAP Class Week of April 16, 2012

BPC430 Unit Summary
Unit SummaryYou should now be able to:• Describe the EPM add-in for Word and PowerPoint• Insert SAP Business Planning and Consolidation data into a Microsoft Word file• Insert SAP Business Planning and Consolidation data into a Microsoft
PowerPoint file.
2011 © 2011 SAP AG. All rights reserved. 547
SAP Class Week of April 16, 2012

Unit Summary BPC430
548 © 2011 SAP AG. All rights reserved. 2011
SAP Class Week of April 16, 2012

SAP Class Week of April 16, 2012

SAP Class Week of April 16, 2012

Unit Summary BPC430
549 © 2011 SAP AG. All rights reserved. 2011
SAP Class Week of April 16, 2012

Unit Summary BPC430
550 © 2011 SAP AG. All rights reserved. 2011
SAP Class Week of April 16, 2012
Unit 8Dashboards
Unit OverviewThis unit covers creating Dashboards.
Unit ObjectivesAfter completing this unit, you will be able to:
• Describe the key features of an SAP BusinessObjects Dashboard• Create a new dashboard• Use the EPM Connector
Unit ContentsLesson: SAP BusinessObjects Dashboard Integration ... . . . . . . . . . . . . . . . . . . . . .552
Procedure: How to Connect when using Planning and Consolidation,version for SAP Microsoft platform ... . . . . . . . . . . . . . . . . . . . . . . . . . . . . . . . . . . . . . . . .572Exercise 20: Create a Dashboard with Live Planning and ConsolidationData ... . . . . . . . . . . . . . . . . . . . . . . . . . . . . . . . . . . . . . . . . . . . . . . . . . . . . . . . . . . . . . . . . . . . . . . . . . . .573
2011 © 2011 SAP AG. All rights reserved. 551
SAP Class Week of April 16, 2012
Unit 8: Dashboards BPC430
Lesson: SAP BusinessObjects Dashboard Integration
Lesson OverviewThis lesson covers the key integration points of SAP BusinessObjects Planning andConsolidation as well as the key benefits of the integration.
Lesson ObjectivesAfter completing this lesson, you will be able to:
• Describe the key features of an SAP BusinessObjects Dashboard• Create a new dashboard• Use the EPM Connector
Business ExampleYou have business users who want to incorporate SAP BusinessObjects Planning andConsolidation data into their management dashboards.
SAP BusinessObjects DashboardsIn this section, you will learn how to leverage Dashboards to read and write SAPBusinessObjects Planning and Consolidation data.
SAP BusinessObjects Dashboards is data visualization software that enables users tocreate dynamic and interactive models that can be added to dashboards or exported fordelivery in a variety of formats such as PowerPoint, Flash, PDF, AIR, Outlook, andthe web (using HTML).
These models retain their full interactivity and require only Adobe Flash Player torun. The Dashboard Designer and Microsoft Excel are required only during thedesign Phase.
You can configure your model to work with live data updates from external sources,such as XML, Portals, Web Services, SAP BusinessObjects Enterprise (LiveOfficeand Query as a Web Service), and SAP Business Explorer Queries.
The software includes a fully-functioning Excel spreadsheet. Data and formulas canbe imported or entered directly into the embedded spreadsheet and then modified, asrequired, without re-importing the spreadsheet.
Here are some of the key features.
552 © 2011 SAP AG. All rights reserved. 2011
SAP Class Week of April 16, 2012
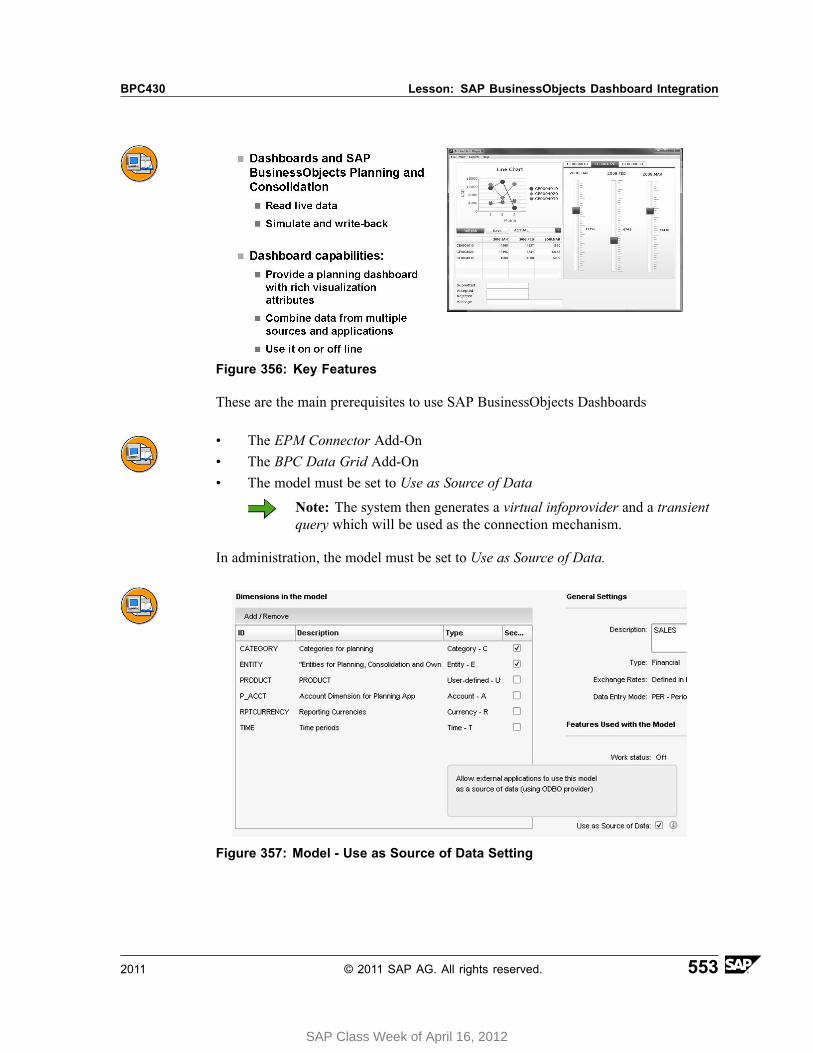
BPC430 Lesson: SAP BusinessObjects Dashboard Integration
Figure 356: Key Features
These are the main prerequisites to use SAP BusinessObjects Dashboards
• The EPM Connector Add-On• The BPC Data Grid Add-On• The model must be set to Use as Source of Data
Note: The system then generates a virtual infoprovider and a transientquery which will be used as the connection mechanism.
In administration, the model must be set to Use as Source of Data.
Figure 357: Model - Use as Source of Data Setting
2011 © 2011 SAP AG. All rights reserved. 553
SAP Class Week of April 16, 2012
Unit 8: Dashboards BPC430
Here are few of the other requirements for Planning and Consolidation, version forSAP NetWeaver platform.
• To run the dashboard based on flash files:
– Adobe Flash Player installed on client PCs• To build the dashboard:
– SAP BusinessObjects Dashboard Design– SAP EPM Add-In for Microsoft Excel– SAP BW OLE DB Provider
• To run the dashboard outside of BPC web client (standalone or in Excel)
– The Cross domain file must be created at http(s)://server:port/sap/cross-domain.xml
– Details can be found in the EPM Office Add-Ins Master Guide• XMLA service in ICF must be activated
– /sap/bw/xml/soap/xmla/ node can be activated via Transaction SICF– Details can be found in the SBOP PC 10.0 Installation Guide
554 © 2011 SAP AG. All rights reserved. 2011
SAP Class Week of April 16, 2012
BPC430 Lesson: SAP BusinessObjects Dashboard Integration
Here are the server configuration requirements for Planning and Consolidation,version for SAP Microsoft platform
• Configure XMLA Provider from the SBOP PC installed folder
– Choose Web XMLA→ WebSrvr– Choose Edit Datasource.xml– Check or modify the server name in the blow xml tag: DataSourceInfo -
Data Source=servername /DataSourceInfo– Restart the .Net Server
Note: The XMLA allows the end user to receive a .swf flashfile and to retrieve live data without the need for an SBOP PCinstallation.
• Configure the three Flash, crossdomain.xml files
– WebsrvrNote: Under Websrvr, the crossdomain.xml fileshould look like this: cross-domain-policy site-controlpermitted-cross-domain-policies=“all” / /cross-domain-polilcy
– Websrvr→ WebNote: Under Websrvr → Web and Web xmla, thecrossdomain.xml file should look like this: cross-domain-policyallow-http-request-headers-from domain=“*” headers=“*”secure=“false” / allow-access-from domain=“*” secure=“*” //cross-domain-polilcy
– Websrvr→ xmlaNote: To enable flash files to connect to SBOP PC XMLA provider,or SBOP PC web services, these three crossdomain.xml files areinstalled. You should never delete the crossdomain.xml files Youconfigure these files in the .net server in the installed folder.
Note: For more information on this server configuration, see theinstallation guide and/or master guide
In the Dashboard Designer, you can access the Add - On Manager via File → ManageAdd-Ons.
2011 © 2011 SAP AG. All rights reserved. 555
SAP Class Week of April 16, 2012
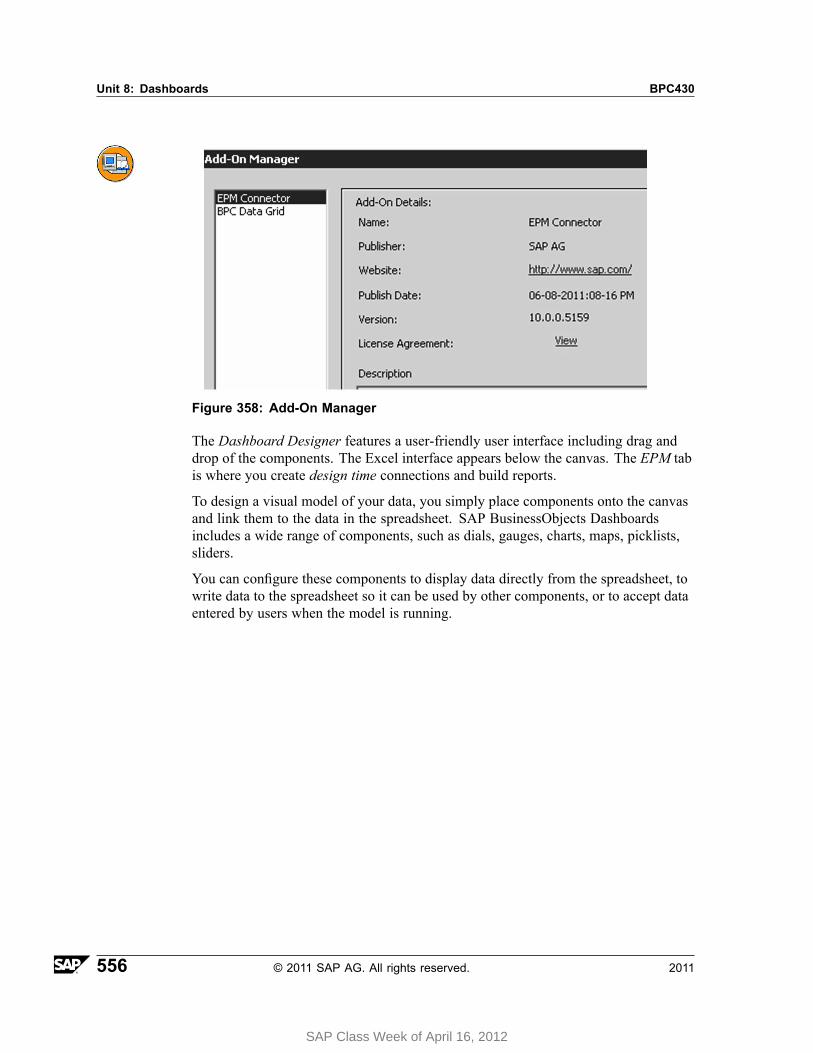
Unit 8: Dashboards BPC430
Figure 358: Add-On Manager
The Dashboard Designer features a user-friendly user interface including drag anddrop of the components. The Excel interface appears below the canvas. The EPM tabis where you create design time connections and build reports.
To design a visual model of your data, you simply place components onto the canvasand link them to the data in the spreadsheet. SAP BusinessObjects Dashboardsincludes a wide range of components, such as dials, gauges, charts, maps, picklists,sliders.
You can configure these components to display data directly from the spreadsheet, towrite data to the spreadsheet so it can be used by other components, or to accept dataentered by users when the model is running.
556 © 2011 SAP AG. All rights reserved. 2011
SAP Class Week of April 16, 2012
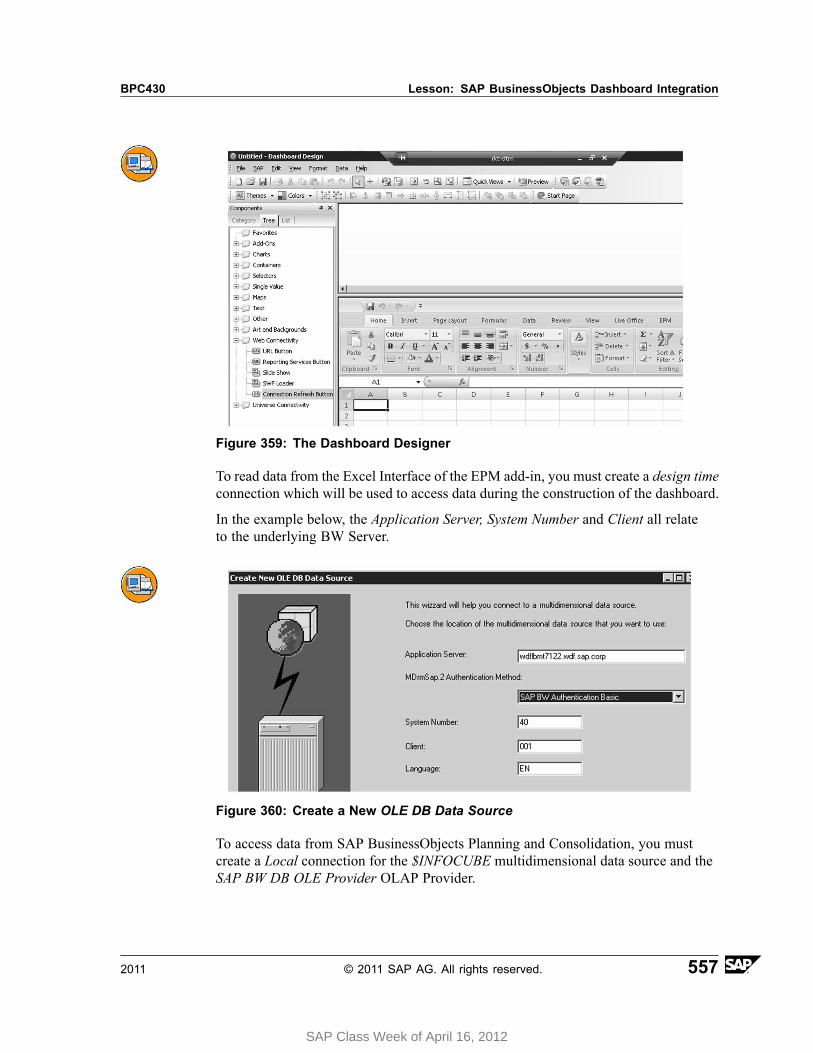
BPC430 Lesson: SAP BusinessObjects Dashboard Integration
Figure 359: The Dashboard Designer
To read data from the Excel Interface of the EPM add-in, you must create a design timeconnection which will be used to access data during the construction of the dashboard.
In the example below, the Application Server, System Number and Client all relateto the underlying BW Server.
Figure 360: Create a New OLE DB Data Source
To access data from SAP BusinessObjects Planning and Consolidation, you mustcreate a Local connection for the $INFOCUBE multidimensional data source and theSAP BW DB OLE Provider OLAP Provider.
2011 © 2011 SAP AG. All rights reserved. 557
SAP Class Week of April 16, 2012
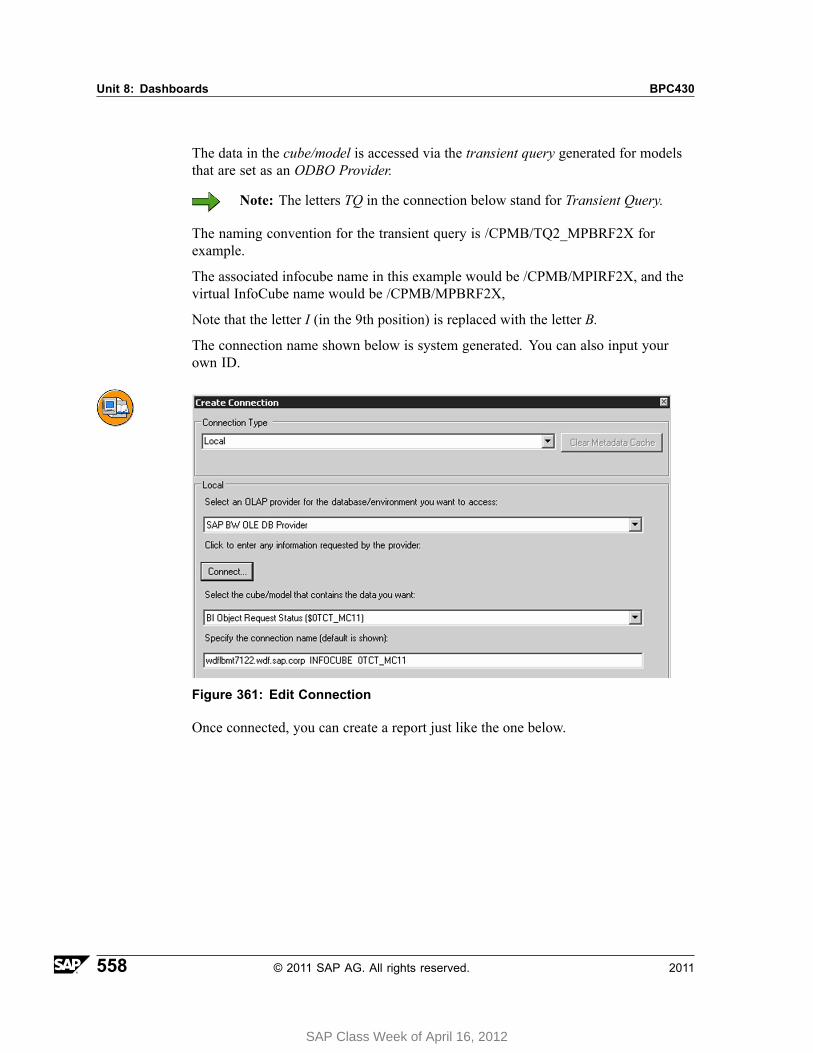
Unit 8: Dashboards BPC430
The data in the cube/model is accessed via the transient query generated for modelsthat are set as an ODBO Provider.
Note: The letters TQ in the connection below stand for Transient Query.
The naming convention for the transient query is /CPMB/TQ2_MPBRF2X forexample.
The associated infocube name in this example would be /CPMB/MPIRF2X, and thevirtual InfoCube name would be /CPMB/MPBRF2X,
Note that the letter I (in the 9th position) is replaced with the letter B.
The connection name shown below is system generated. You can also input yourown ID.
Figure 361: Edit Connection
Once connected, you can create a report just like the one below.
558 © 2011 SAP AG. All rights reserved. 2011
SAP Class Week of April 16, 2012
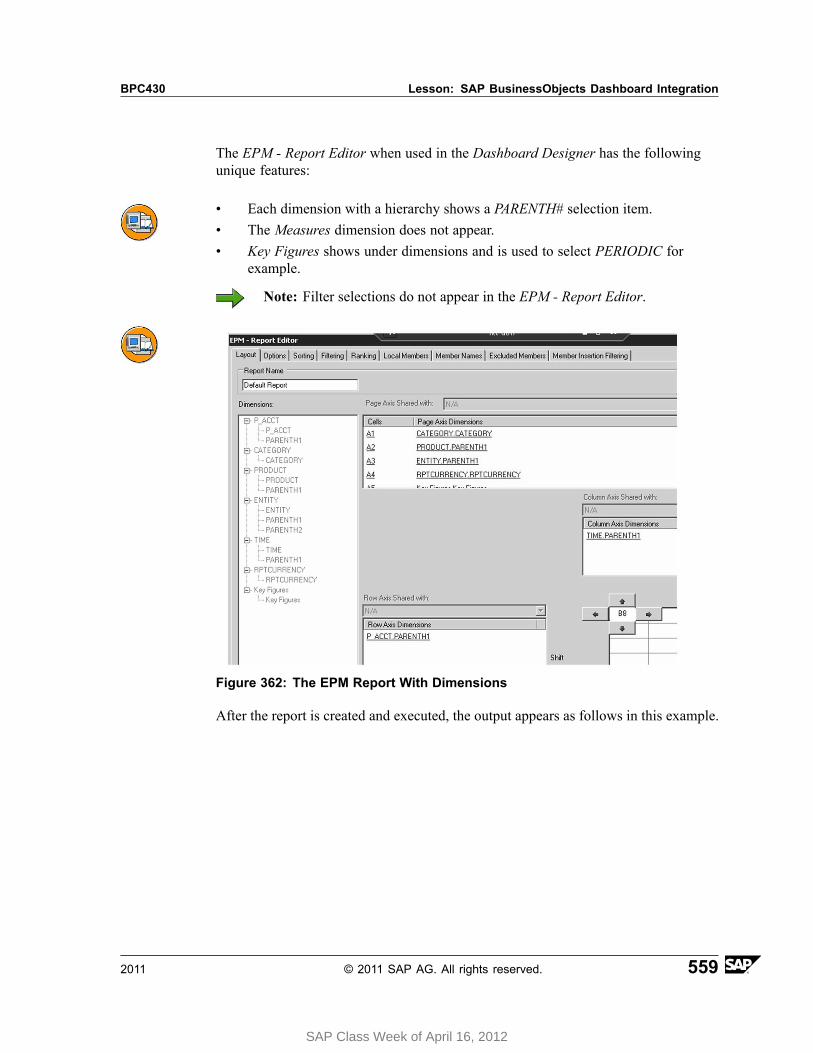
BPC430 Lesson: SAP BusinessObjects Dashboard Integration
The EPM - Report Editor when used in the Dashboard Designer has the followingunique features:
• Each dimension with a hierarchy shows a PARENTH# selection item.• The Measures dimension does not appear.• Key Figures shows under dimensions and is used to select PERIODIC for
example.
Note: Filter selections do not appear in the EPM - Report Editor.
Figure 362: The EPM Report With Dimensions
After the report is created and executed, the output appears as follows in this example.
2011 © 2011 SAP AG. All rights reserved. 559
SAP Class Week of April 16, 2012
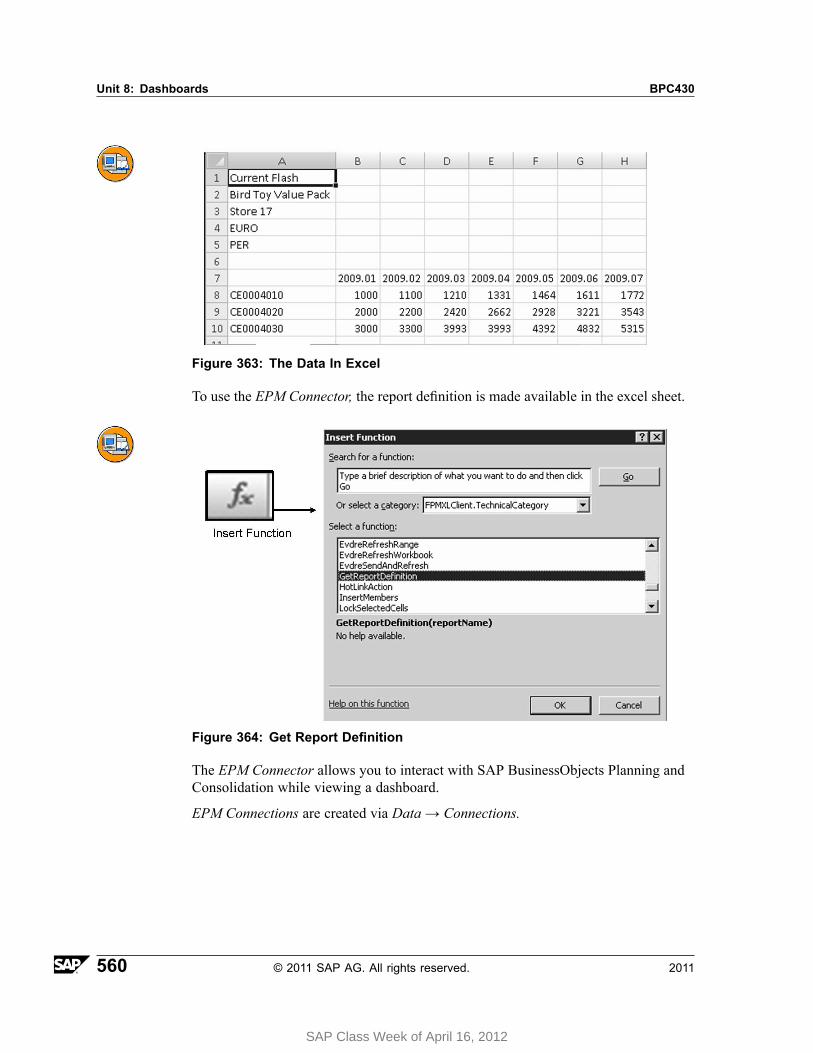
Unit 8: Dashboards BPC430
Figure 363: The Data In Excel
To use the EPM Connector, the report definition is made available in the excel sheet.
Figure 364: Get Report Definition
The EPM Connector allows you to interact with SAP BusinessObjects Planning andConsolidation while viewing a dashboard.
EPM Connections are created via Data → Connections.
560 © 2011 SAP AG. All rights reserved. 2011
SAP Class Week of April 16, 2012
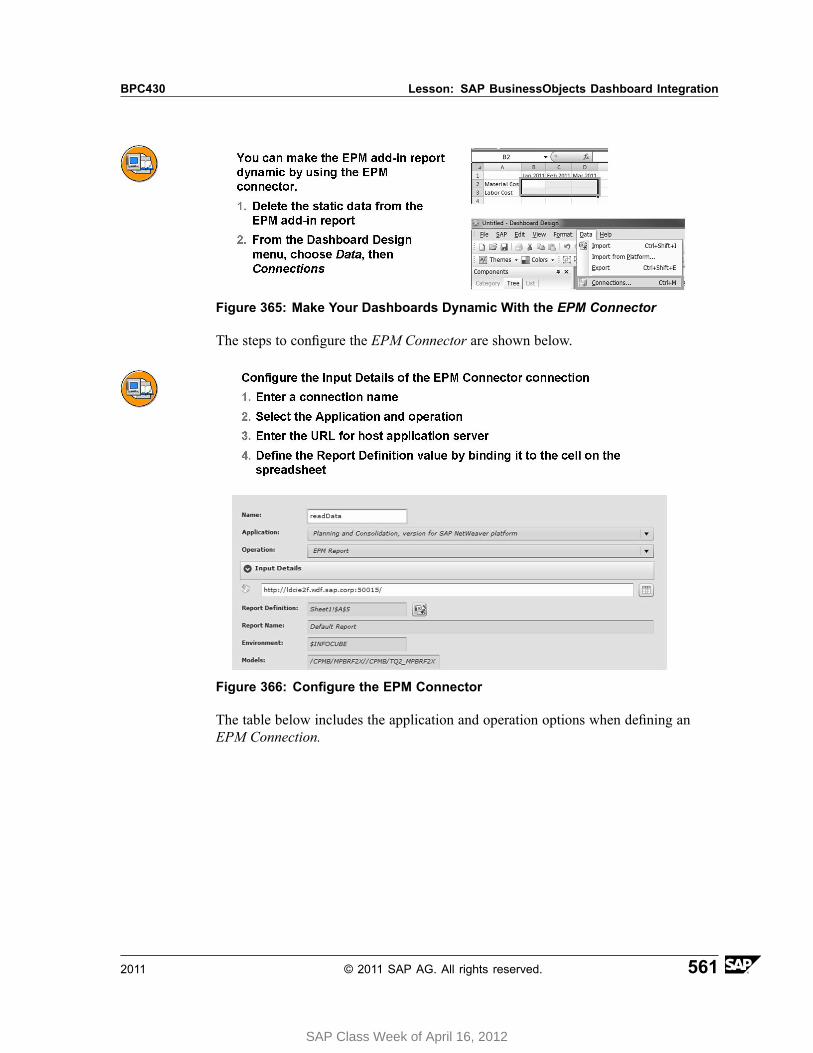
BPC430 Lesson: SAP BusinessObjects Dashboard Integration
Figure 365: Make Your Dashboards Dynamic With the EPM Connector
The steps to configure the EPM Connector are shown below.
Figure 366: Configure the EPM Connector
The table below includes the application and operation options when defining anEPM Connection.
2011 © 2011 SAP AG. All rights reserved. 561
SAP Class Week of April 16, 2012
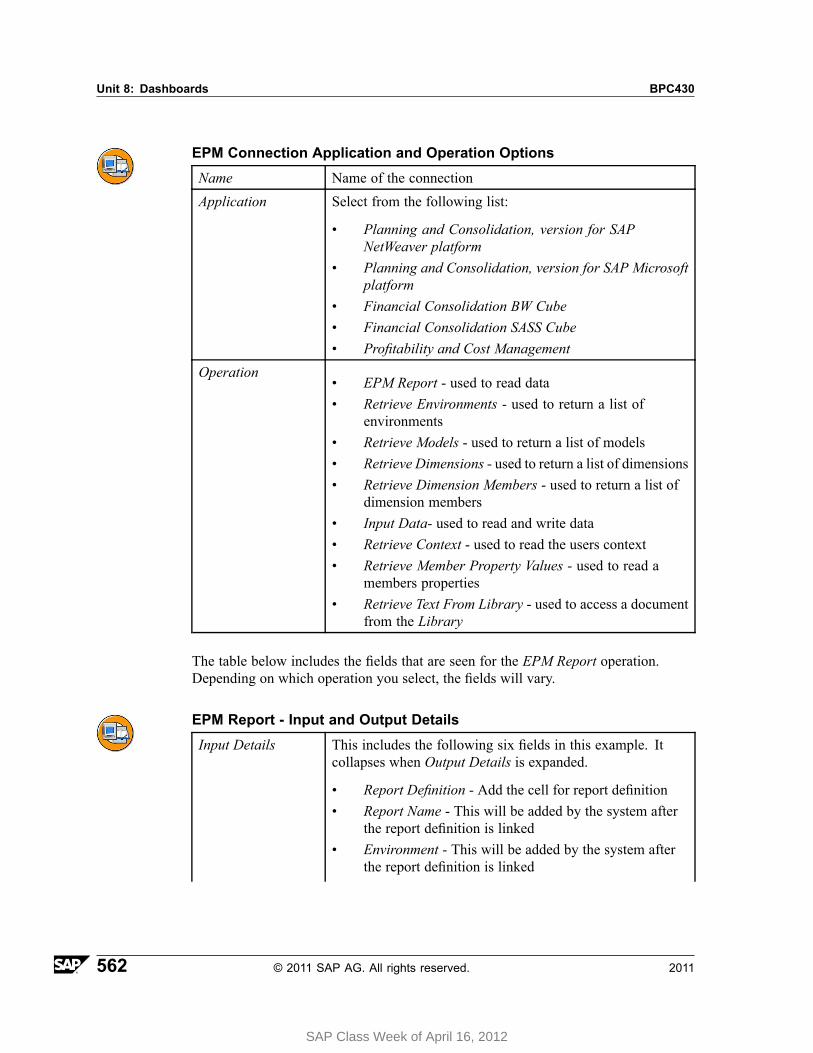
Unit 8: Dashboards BPC430
EPM Connection Application and Operation Options
Name Name of the connection
Application Select from the following list:
• Planning and Consolidation, version for SAPNetWeaver platform
• Planning and Consolidation, version for SAP Microsoftplatform
• Financial Consolidation BW Cube• Financial Consolidation SASS Cube• Profitability and Cost Management
Operation• EPM Report - used to read data• Retrieve Environments - used to return a list of
environments• Retrieve Models - used to return a list of models• Retrieve Dimensions - used to return a list of dimensions• Retrieve Dimension Members - used to return a list of
dimension members• Input Data- used to read and write data• Retrieve Context - used to read the users context• Retrieve Member Property Values - used to read a
members properties• Retrieve Text From Library - used to access a document
from the Library
The table below includes the fields that are seen for the EPM Report operation.Depending on which operation you select, the fields will vary.
EPM Report - Input and Output Details
Input Details This includes the following six fields in this example. Itcollapses when Output Details is expanded.
• Report Definition - Add the cell for report definition• Report Name - This will be added by the system after
the report definition is linked• Environment - This will be added by the system after
the report definition is linked
562 © 2011 SAP AG. All rights reserved. 2011
SAP Class Week of April 16, 2012
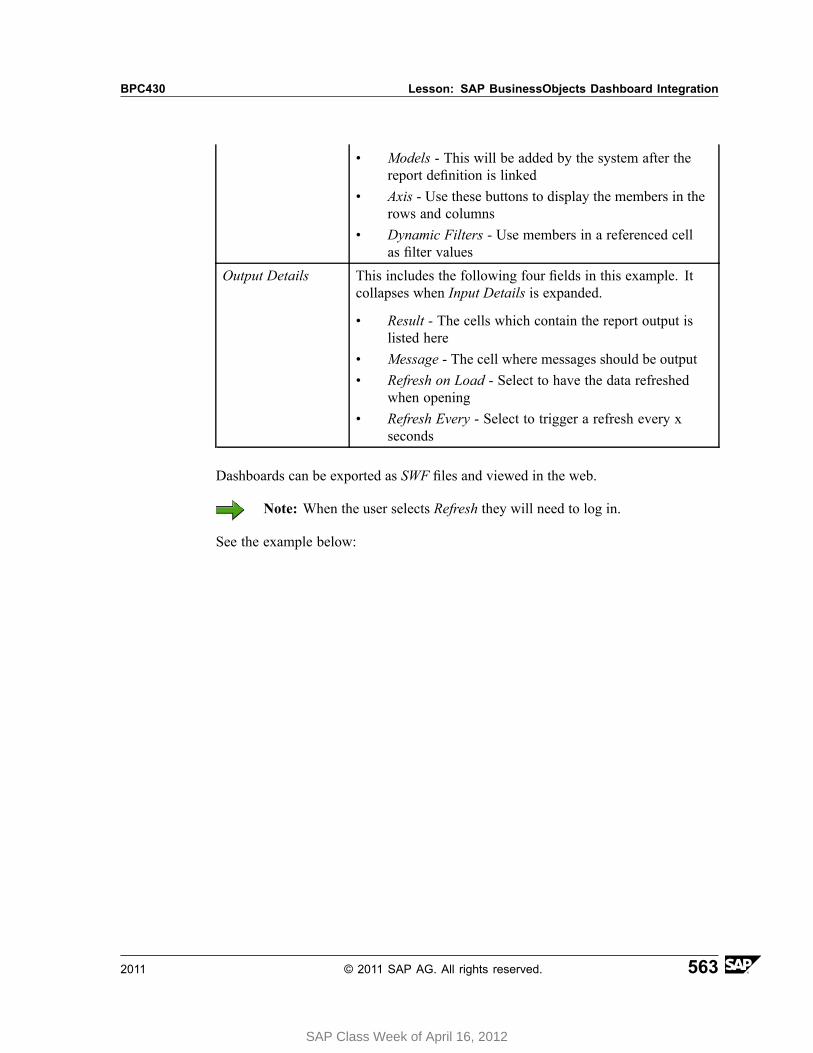
BPC430 Lesson: SAP BusinessObjects Dashboard Integration
• Models - This will be added by the system after thereport definition is linked
• Axis - Use these buttons to display the members in therows and columns
• Dynamic Filters - Use members in a referenced cellas filter values
Output Details This includes the following four fields in this example. Itcollapses when Input Details is expanded.
• Result - The cells which contain the report output islisted here
• Message - The cell where messages should be output• Refresh on Load - Select to have the data refreshed
when opening• Refresh Every - Select to trigger a refresh every x
seconds
Dashboards can be exported as SWF files and viewed in the web.
Note: When the user selects Refresh they will need to log in.
See the example below:
2011 © 2011 SAP AG. All rights reserved. 563
SAP Class Week of April 16, 2012
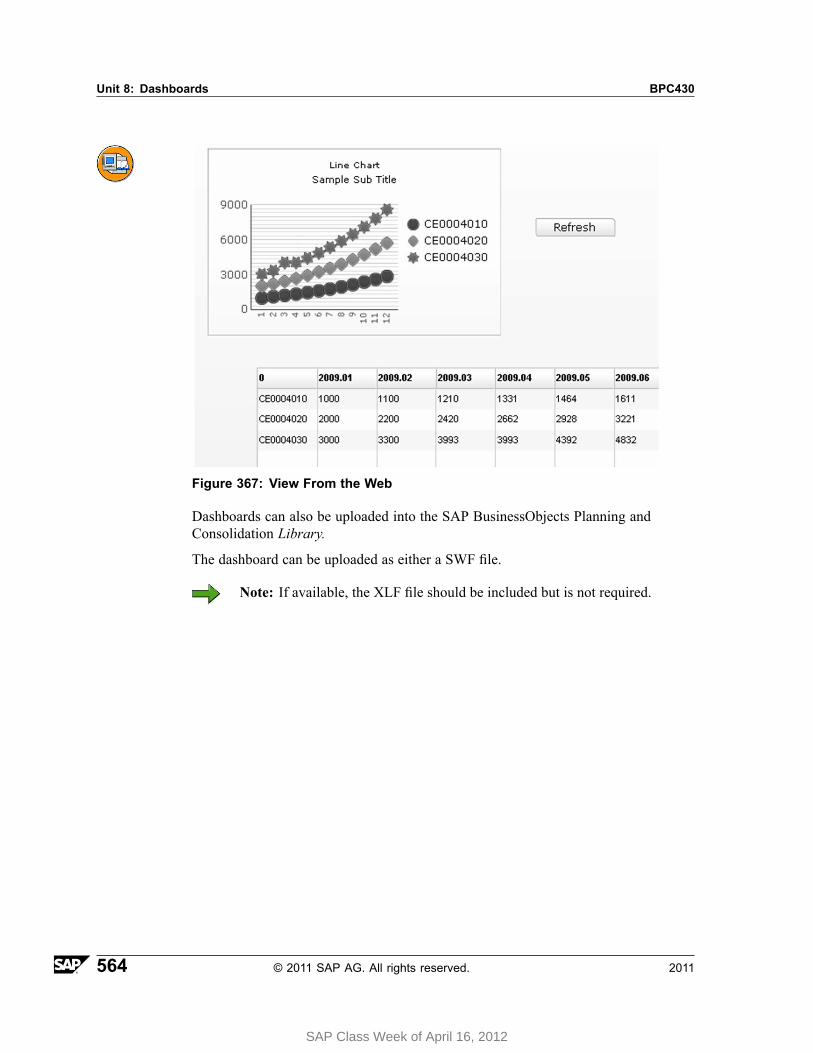
Unit 8: Dashboards BPC430
Figure 367: View From the Web
Dashboards can also be uploaded into the SAP BusinessObjects Planning andConsolidation Library.
The dashboard can be uploaded as either a SWF file.
Note: If available, the XLF file should be included but is not required.
564 © 2011 SAP AG. All rights reserved. 2011
SAP Class Week of April 16, 2012
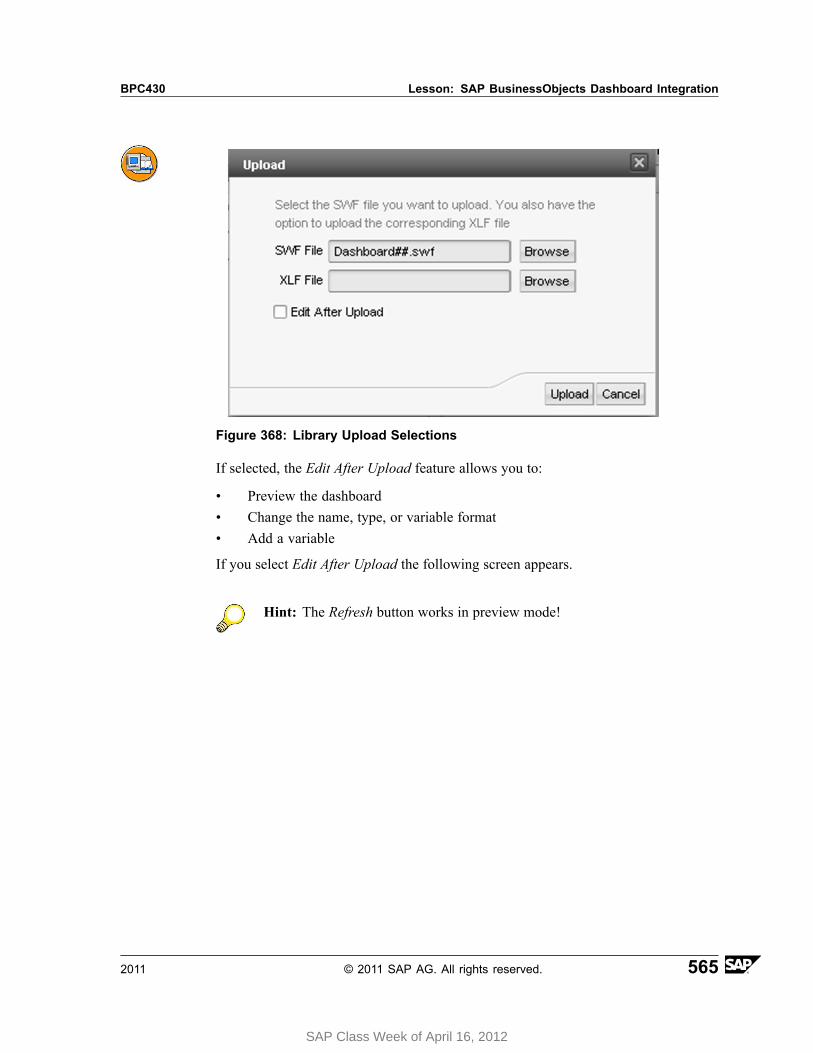
BPC430 Lesson: SAP BusinessObjects Dashboard Integration
Figure 368: Library Upload Selections
If selected, the Edit After Upload feature allows you to:
• Preview the dashboard• Change the name, type, or variable format• Add a variable
If you select Edit After Upload the following screen appears.
Hint: The Refresh button works in preview mode!
2011 © 2011 SAP AG. All rights reserved. 565
SAP Class Week of April 16, 2012
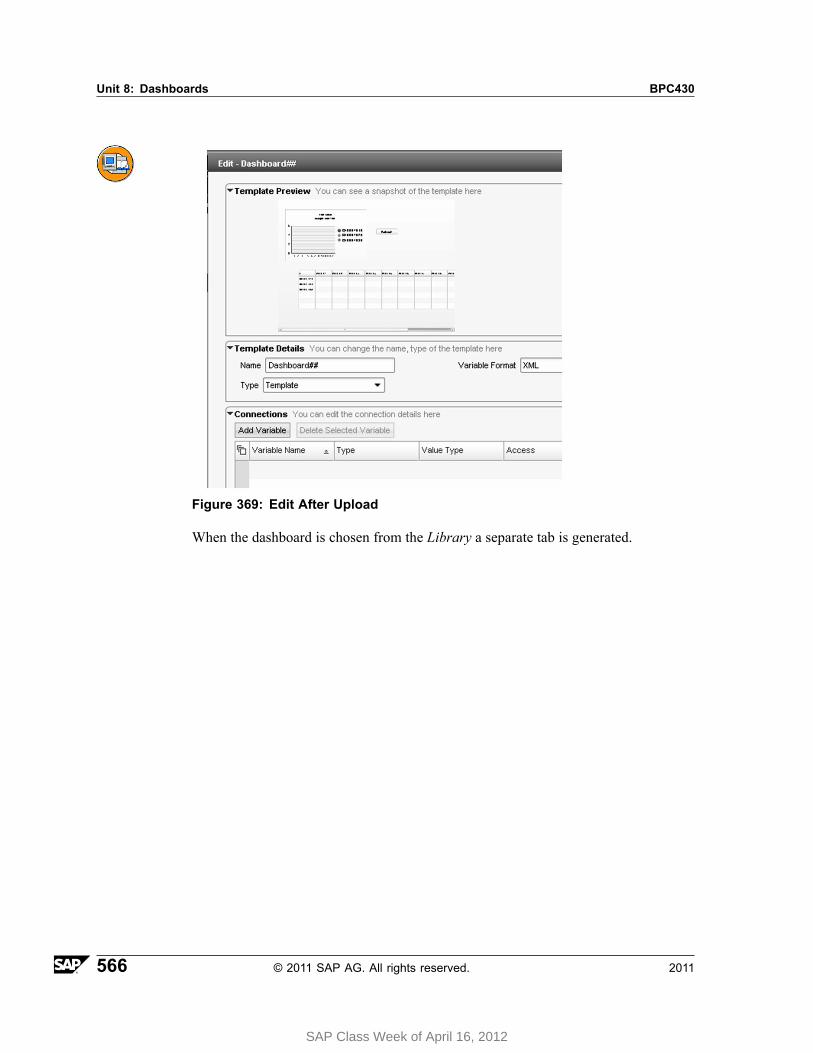
Unit 8: Dashboards BPC430
Figure 369: Edit After Upload
When the dashboard is chosen from the Library a separate tab is generated.
566 © 2011 SAP AG. All rights reserved. 2011
SAP Class Week of April 16, 2012
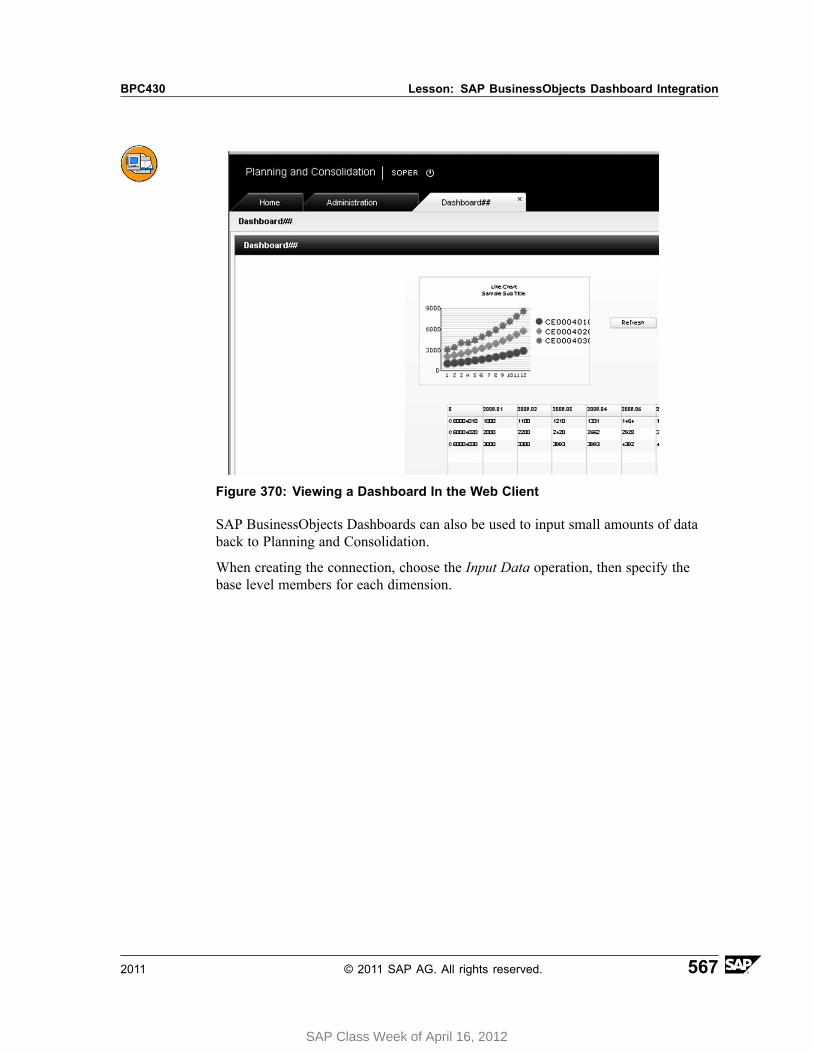
BPC430 Lesson: SAP BusinessObjects Dashboard Integration
Figure 370: Viewing a Dashboard In the Web Client
SAP BusinessObjects Dashboards can also be used to input small amounts of databack to Planning and Consolidation.
When creating the connection, choose the Input Data operation, then specify thebase level members for each dimension.
2011 © 2011 SAP AG. All rights reserved. 567
SAP Class Week of April 16, 2012
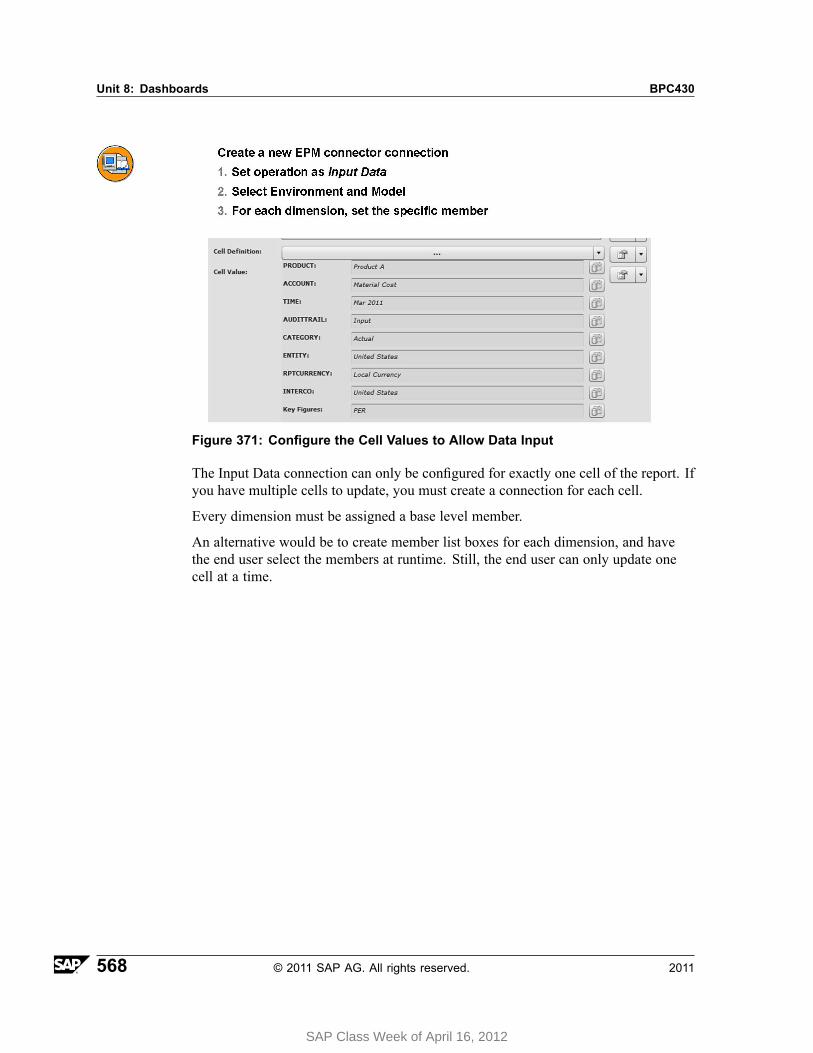
Unit 8: Dashboards BPC430
Figure 371: Configure the Cell Values to Allow Data Input
The Input Data connection can only be configured for exactly one cell of the report. Ifyou have multiple cells to update, you must create a connection for each cell.
Every dimension must be assigned a base level member.
An alternative would be to create member list boxes for each dimension, and havethe end user select the members at runtime. Still, the end user can only update onecell at a time.
568 © 2011 SAP AG. All rights reserved. 2011
SAP Class Week of April 16, 2012
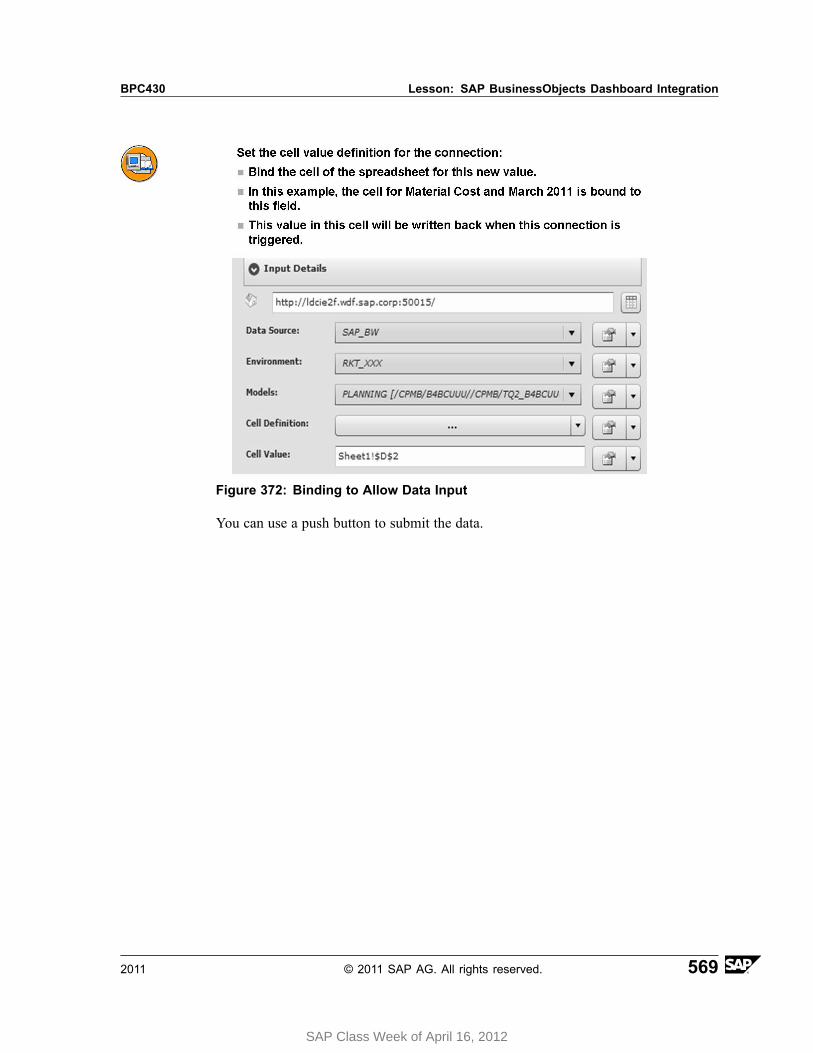
BPC430 Lesson: SAP BusinessObjects Dashboard Integration
Figure 372: Binding to Allow Data Input
You can use a push button to submit the data.
2011 © 2011 SAP AG. All rights reserved. 569
SAP Class Week of April 16, 2012
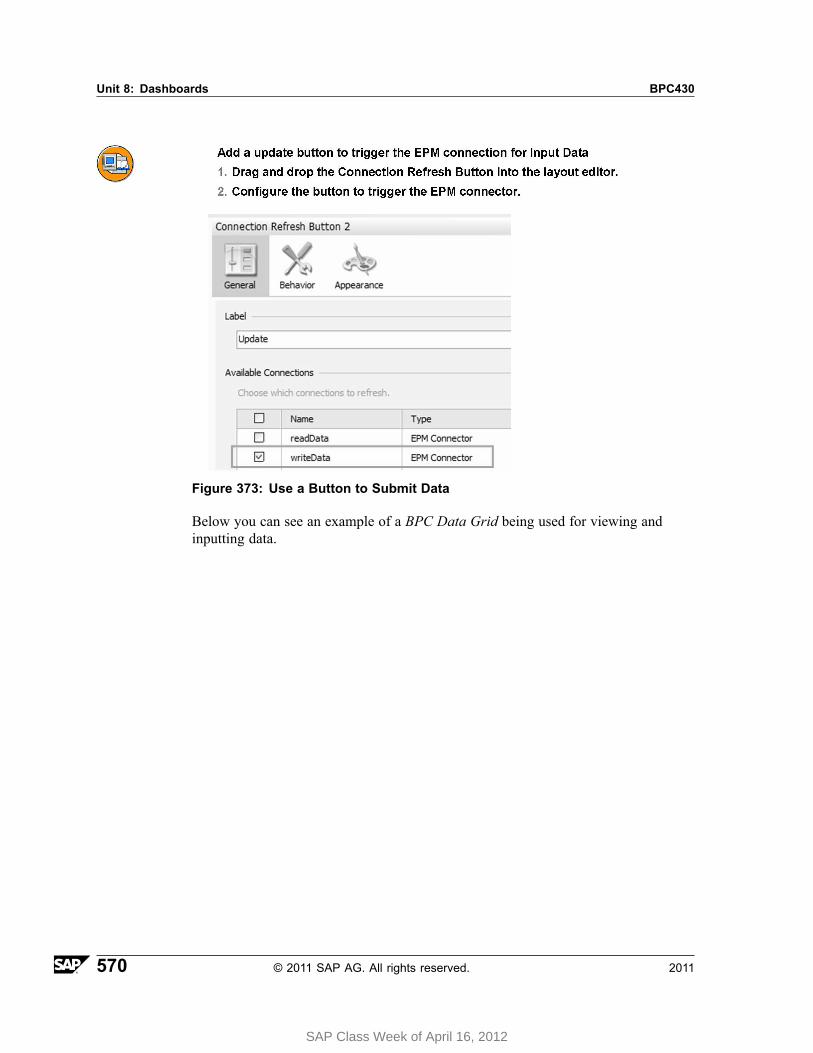
Unit 8: Dashboards BPC430
Figure 373: Use a Button to Submit Data
Below you can see an example of a BPC Data Grid being used for viewing andinputting data.
570 © 2011 SAP AG. All rights reserved. 2011
SAP Class Week of April 16, 2012
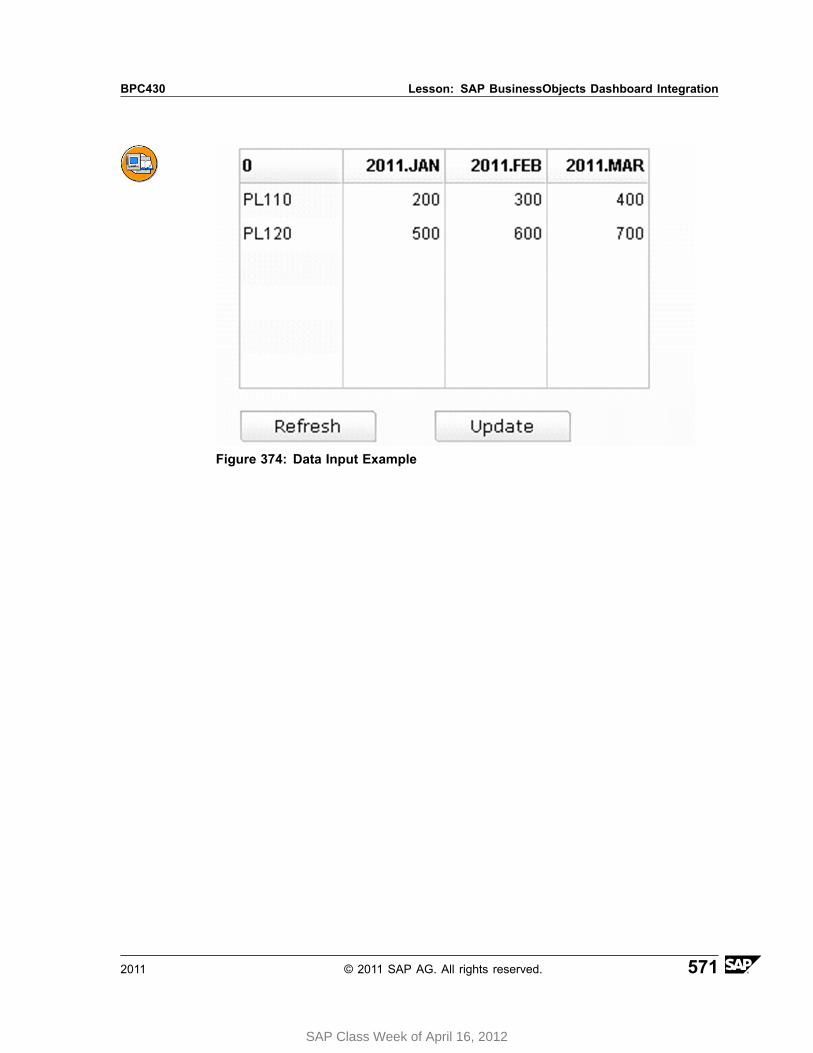
BPC430 Lesson: SAP BusinessObjects Dashboard Integration
Figure 374: Data Input Example
2011 © 2011 SAP AG. All rights reserved. 571
SAP Class Week of April 16, 2012
Unit 8: Dashboards BPC430
How to Connect when using Planning and Consolidation,version for SAP Microsoft platform
1. Open the Dashboard Designer and choose Blank Model.
2. In the EPM tab, choose Log On.
3. Next to the Connection field, choose the ellipse button.
4. In the EPM - Connection Manager choose Create.
5. Select Local.
6. Select SAP BusinessObjects Planning and Consolidation.
7. Enter the Application Server host name.
8. Select Enterprise BOE Authentication for PC MS.
9. Choose Next and log on.
10. Select your Environment and choose Finish.
11. Select the Model and choose OK.
You are back in the EPM - Connection Manager.
12. Choose OK.
You are back in the EPM tab.
13. Choose Create Report.
The EPM - Report Editor opens and you can now create the report.
572 © 2011 SAP AG. All rights reserved. 2011
SAP Class Week of April 16, 2012
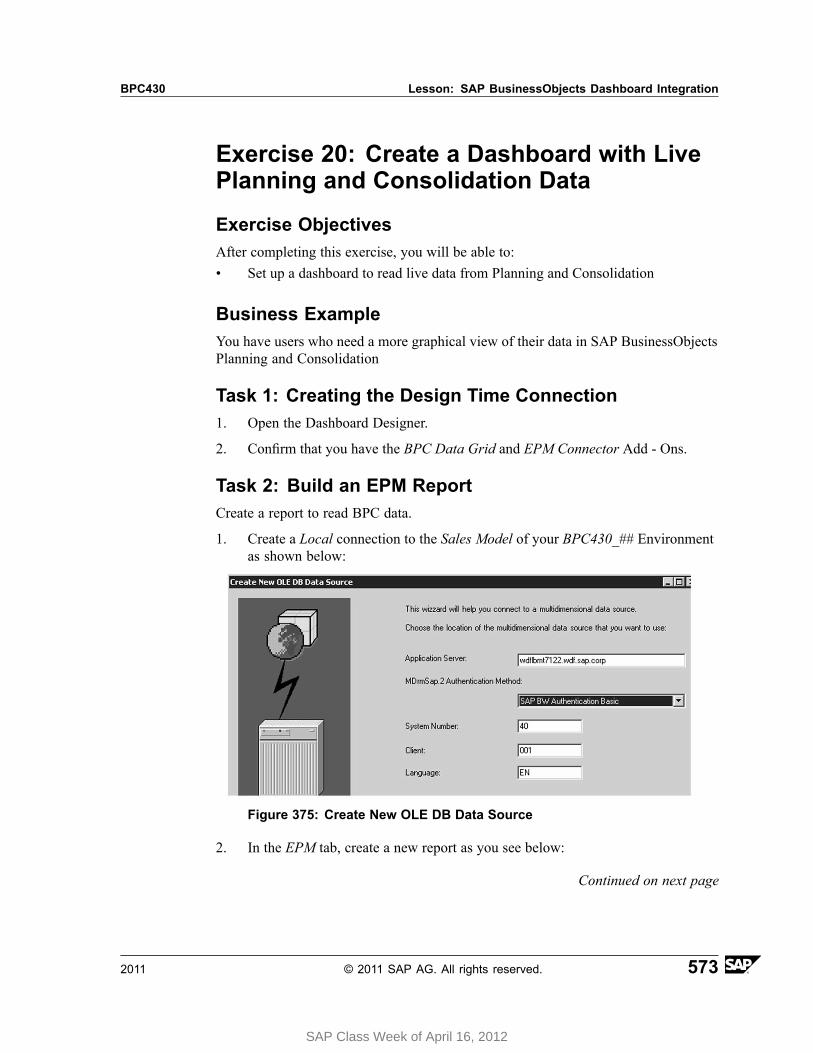
BPC430 Lesson: SAP BusinessObjects Dashboard Integration
Exercise 20: Create a Dashboard with LivePlanning and Consolidation Data
Exercise ObjectivesAfter completing this exercise, you will be able to:• Set up a dashboard to read live data from Planning and Consolidation
Business ExampleYou have users who need a more graphical view of their data in SAP BusinessObjectsPlanning and Consolidation
Task 1: Creating the Design Time Connection1. Open the Dashboard Designer.
2. Confirm that you have the BPC Data Grid and EPM Connector Add - Ons.
Task 2: Build an EPM ReportCreate a report to read BPC data.
1. Create a Local connection to the Sales Model of your BPC430_## Environmentas shown below:
Figure 375: Create New OLE DB Data Source
2. In the EPM tab, create a new report as you see below:
Continued on next page
2011 © 2011 SAP AG. All rights reserved. 573
SAP Class Week of April 16, 2012
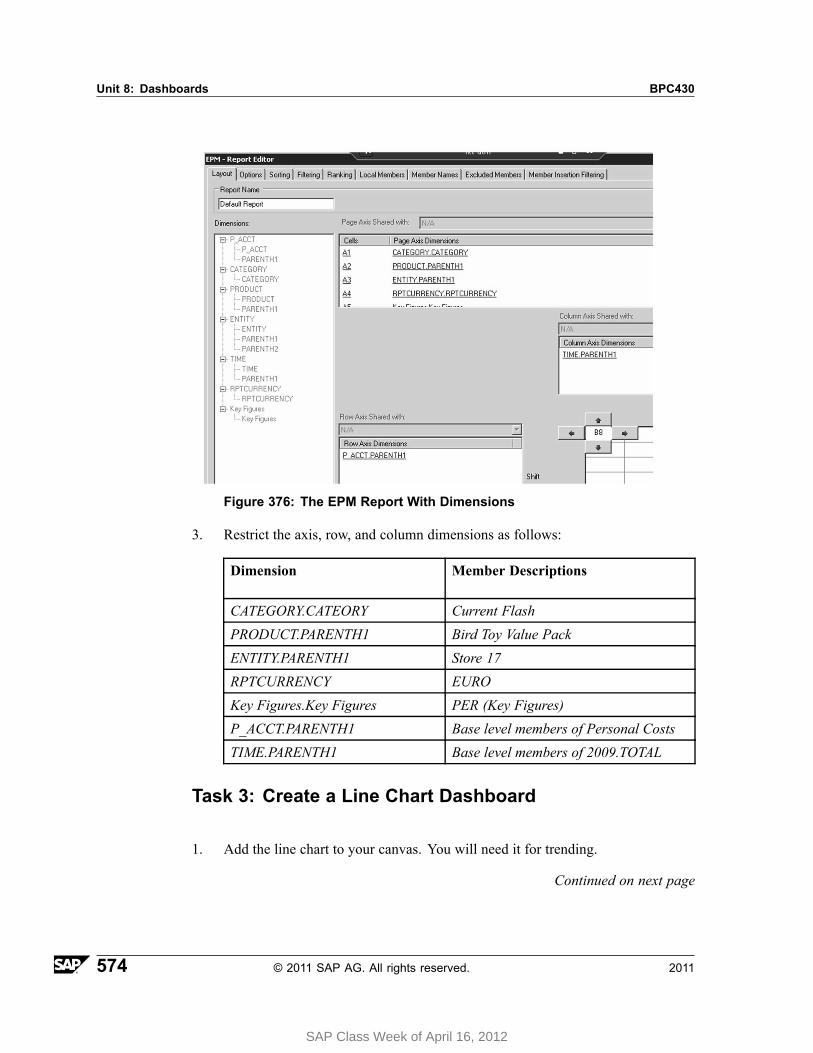
Unit 8: Dashboards BPC430
Figure 376: The EPM Report With Dimensions
3. Restrict the axis, row, and column dimensions as follows:
Dimension Member Descriptions
CATEGORY.CATEORY Current Flash
PRODUCT.PARENTH1 Bird Toy Value Pack
ENTITY.PARENTH1 Store 17
RPTCURRENCY EURO
Key Figures.Key Figures PER (Key Figures)
P_ACCT.PARENTH1 Base level members of Personal Costs
TIME.PARENTH1 Base level members of 2009.TOTAL
Task 3: Create a Line Chart Dashboard
1. Add the line chart to your canvas. You will need it for trending.
Continued on next page
574 © 2011 SAP AG. All rights reserved. 2011
SAP Class Week of April 16, 2012
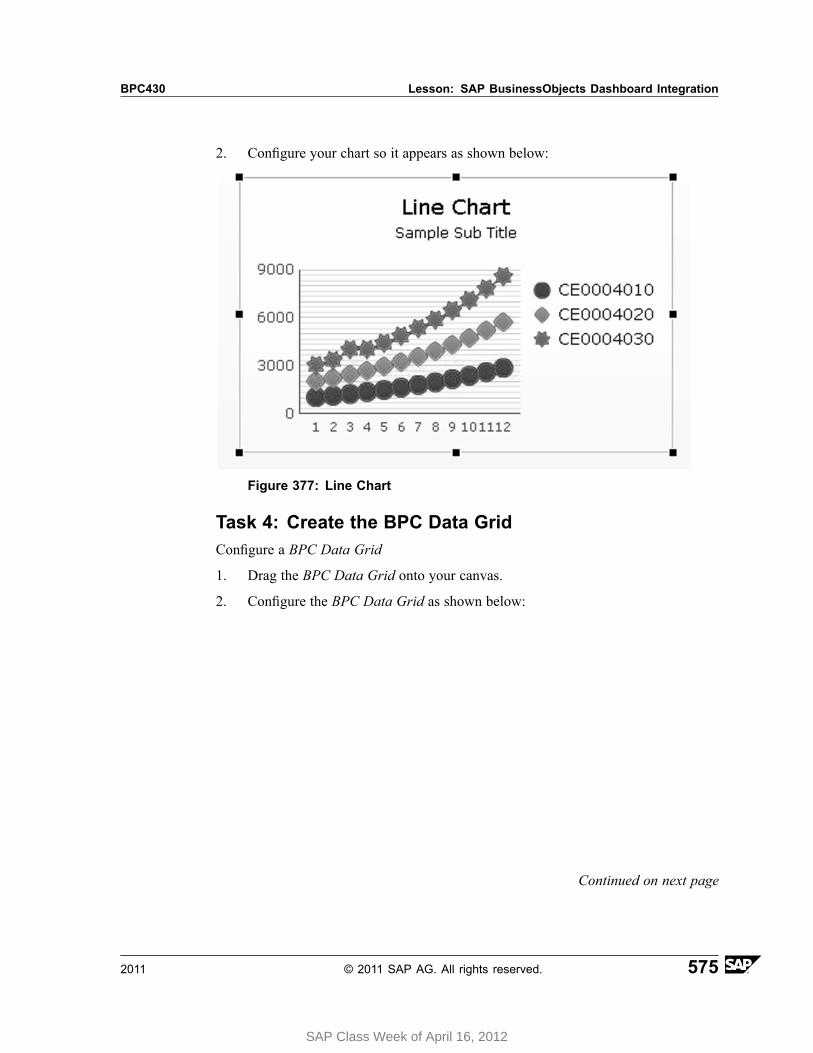
BPC430 Lesson: SAP BusinessObjects Dashboard Integration
2. Configure your chart so it appears as shown below:
Figure 377: Line Chart
Task 4: Create the BPC Data GridConfigure a BPC Data Grid
1. Drag the BPC Data Grid onto your canvas.
2. Configure the BPC Data Grid as shown below:
Continued on next page
2011 © 2011 SAP AG. All rights reserved. 575
SAP Class Week of April 16, 2012

Unit 8: Dashboards BPC430
Figure 378: Data Grid Properties
3. Save your dashboard
Task 5: Create the EPM Connection1. Insert the report definition in the Excel sheet and then configure the run time
connection.
2. Create the EPM Connection
3. Add a refresh button to access the latest data from BPC
Task 6: Create The Flash FileCreate a flash file and then launch it from Internet Explorer and test the refresh feature.
1. Delete the data in your EPM Report so that you can test the refresh button.Generate the flash file.
2. Launch your flash file in Internet Explorer.
3. Add the dashboard into your library.
576 © 2011 SAP AG. All rights reserved. 2011
SAP Class Week of April 16, 2012
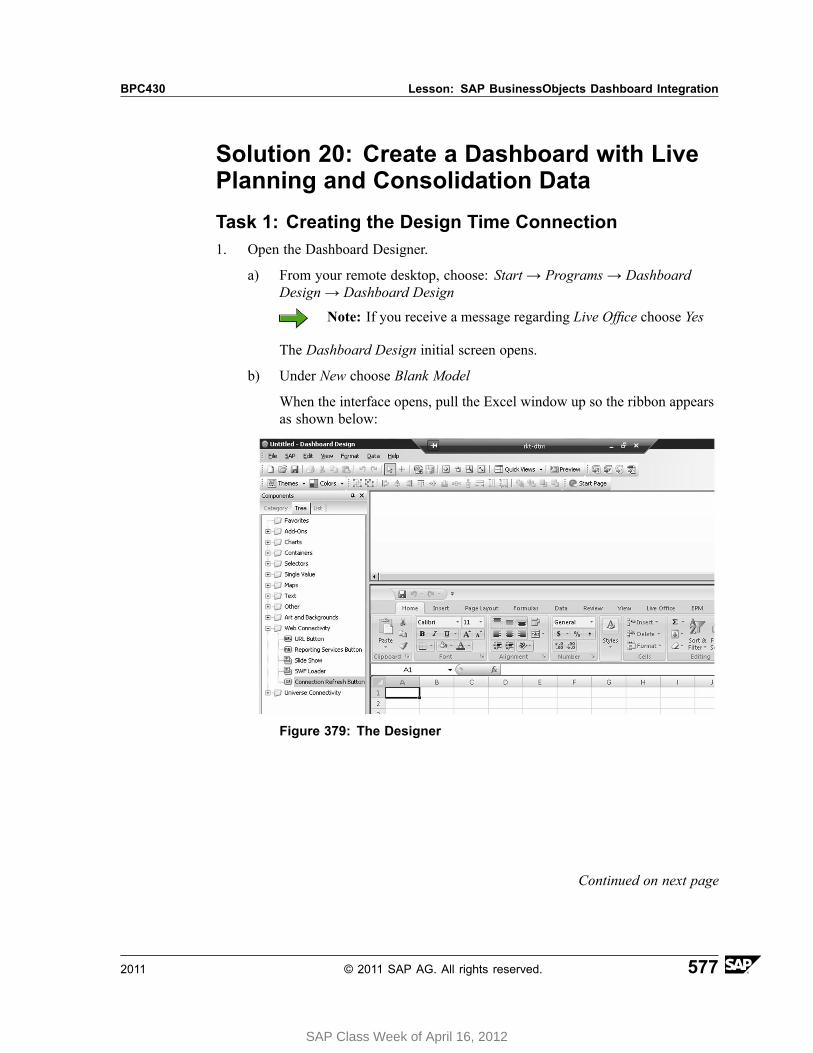
BPC430 Lesson: SAP BusinessObjects Dashboard Integration
Solution 20: Create a Dashboard with LivePlanning and Consolidation DataTask 1: Creating the Design Time Connection1. Open the Dashboard Designer.
a) From your remote desktop, choose: Start → Programs → DashboardDesign → Dashboard Design
Note: If you receive a message regarding Live Office choose Yes
The Dashboard Design initial screen opens.
b) Under New choose Blank Model
When the interface opens, pull the Excel window up so the ribbon appearsas shown below:
Figure 379: The Designer
Continued on next page
2011 © 2011 SAP AG. All rights reserved. 577
SAP Class Week of April 16, 2012
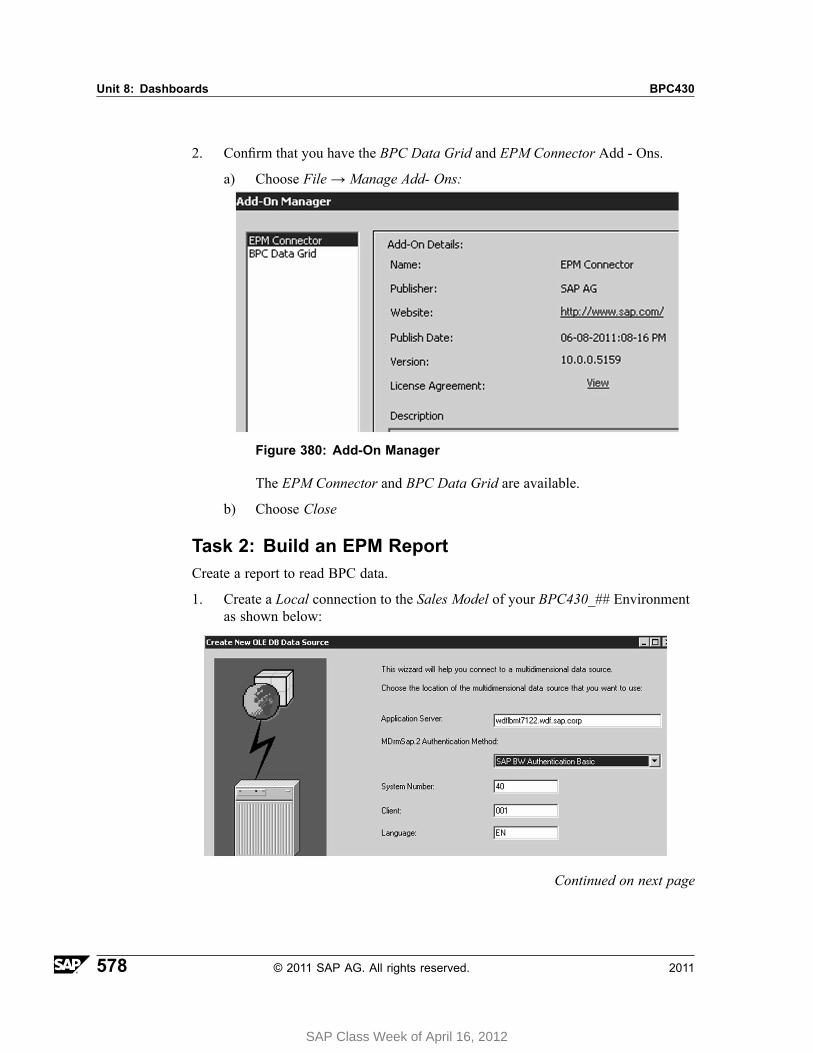
Unit 8: Dashboards BPC430
2. Confirm that you have the BPC Data Grid and EPM Connector Add - Ons.
a) Choose File → Manage Add- Ons:
Figure 380: Add-On Manager
The EPM Connector and BPC Data Grid are available.
b) Choose Close
Task 2: Build an EPM ReportCreate a report to read BPC data.
1. Create a Local connection to the Sales Model of your BPC430_## Environmentas shown below:
Continued on next page
578 © 2011 SAP AG. All rights reserved. 2011
SAP Class Week of April 16, 2012
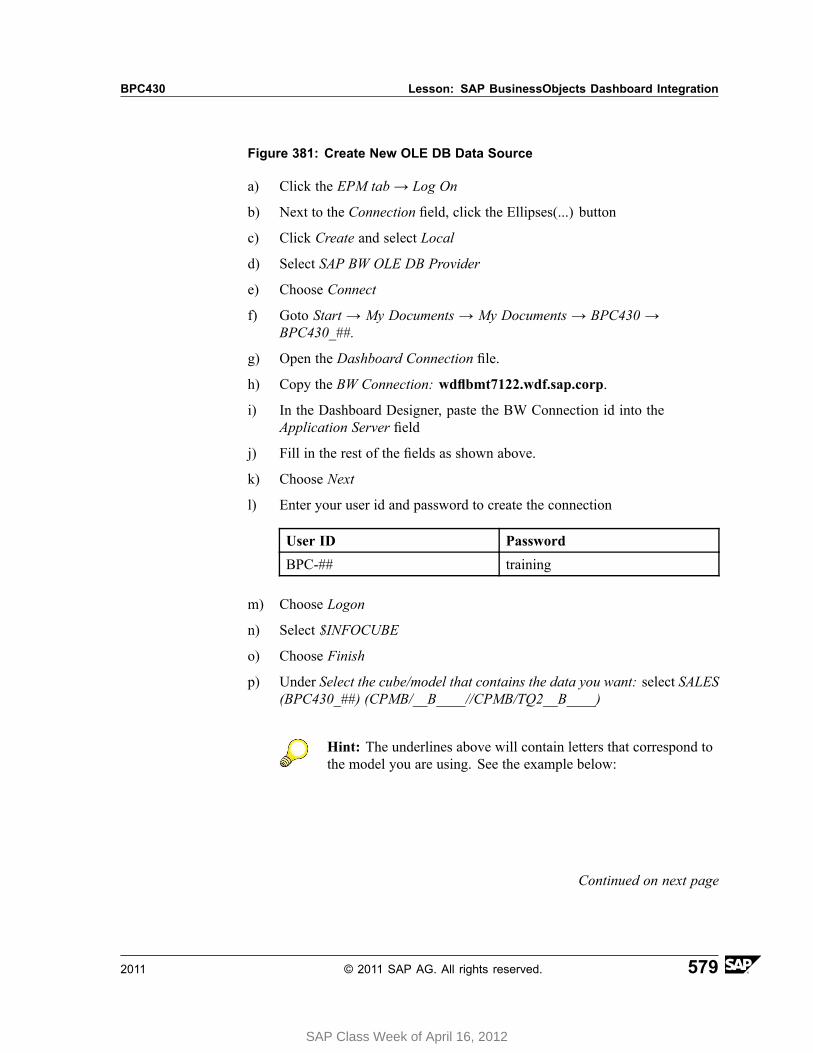
BPC430 Lesson: SAP BusinessObjects Dashboard Integration
Figure 381: Create New OLE DB Data Source
a) Click the EPM tab → Log On
b) Next to the Connection field, click the Ellipses(...) button
c) Click Create and select Local
d) Select SAP BW OLE DB Provider
e) Choose Connect
f) Goto Start → My Documents → My Documents → BPC430 →BPC430_##.
g) Open the Dashboard Connection file.
h) Copy the BW Connection: wdflbmt7122.wdf.sap.corp.
i) In the Dashboard Designer, paste the BW Connection id into theApplication Server field
j) Fill in the rest of the fields as shown above.
k) Choose Next
l) Enter your user id and password to create the connection
User ID Password
BPC-## training
m) Choose Logon
n) Select $INFOCUBE
o) Choose Finish
p) Under Select the cube/model that contains the data you want: select SALES(BPC430_##) (CPMB/__B____//CPMB/TQ2__B____)
Hint: The underlines above will contain letters that correspond tothe model you are using. See the example below:
Continued on next page
2011 © 2011 SAP AG. All rights reserved. 579
SAP Class Week of April 16, 2012

Unit 8: Dashboards BPC430
Figure 382: Edit Connection
q) Choose OK
You are back in the EPM - Connection Manager
r) Choose the connection just created.
s) Choose OK
t) Enter your user id and password to logon
User ID Password
BPC-## training
u) Click Logon
2. In the EPM tab, create a new report as you see below:
Continued on next page
580 © 2011 SAP AG. All rights reserved. 2011
SAP Class Week of April 16, 2012
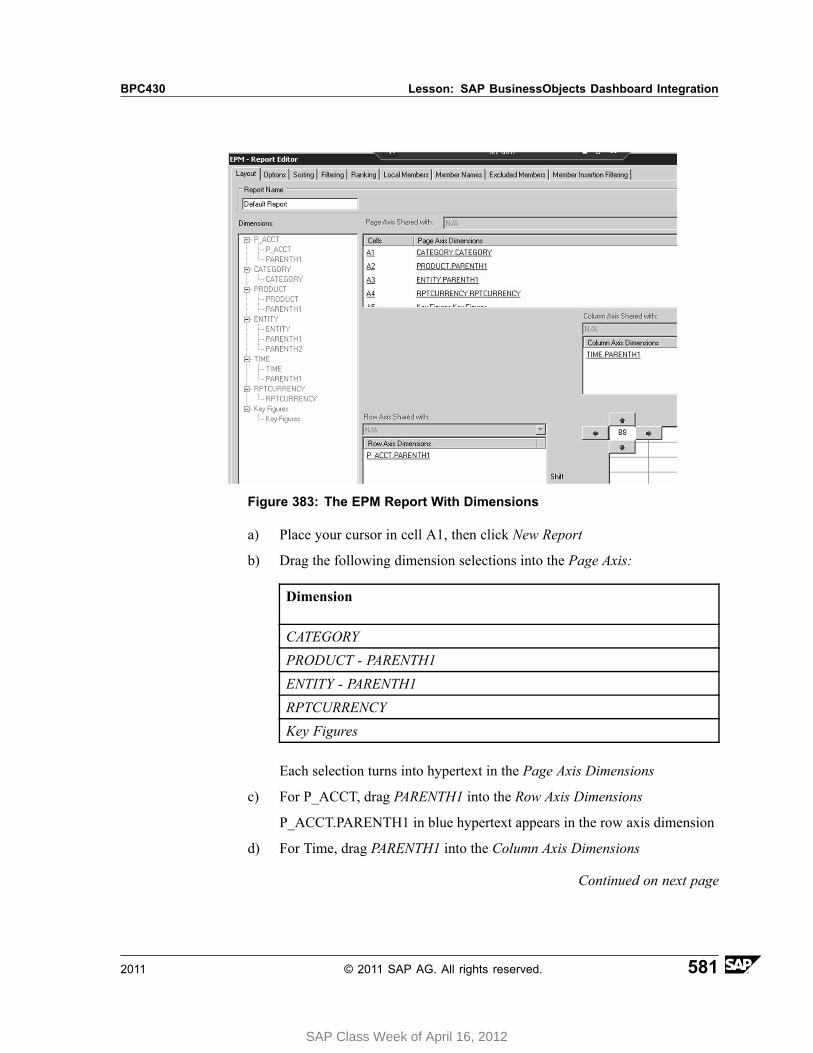
BPC430 Lesson: SAP BusinessObjects Dashboard Integration
Figure 383: The EPM Report With Dimensions
a) Place your cursor in cell A1, then click New Report
b) Drag the following dimension selections into the Page Axis:
Dimension
CATEGORY
PRODUCT - PARENTH1
ENTITY - PARENTH1
RPTCURRENCY
Key Figures
Each selection turns into hypertext in the Page Axis Dimensions
c) For P_ACCT, drag PARENTH1 into the Row Axis Dimensions
P_ACCT.PARENTH1 in blue hypertext appears in the row axis dimension
d) For Time, drag PARENTH1 into the Column Axis Dimensions
Continued on next page
2011 © 2011 SAP AG. All rights reserved. 581
SAP Class Week of April 16, 2012
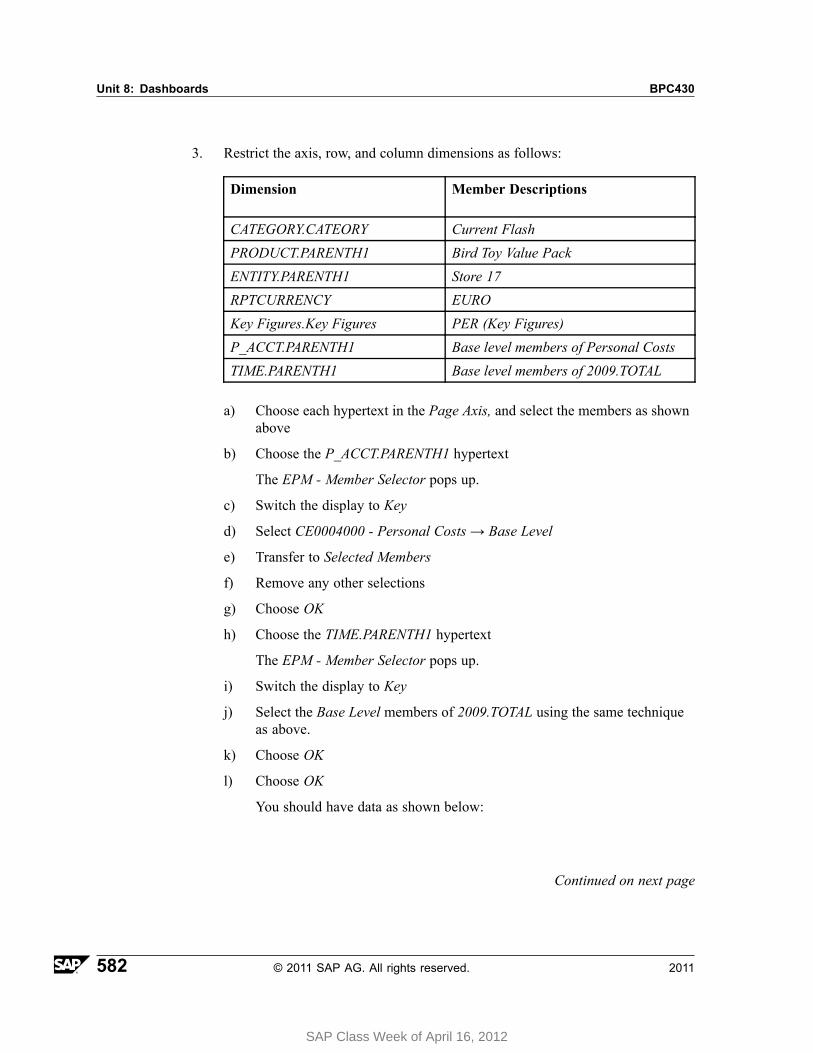
Unit 8: Dashboards BPC430
3. Restrict the axis, row, and column dimensions as follows:
Dimension Member Descriptions
CATEGORY.CATEORY Current Flash
PRODUCT.PARENTH1 Bird Toy Value Pack
ENTITY.PARENTH1 Store 17
RPTCURRENCY EURO
Key Figures.Key Figures PER (Key Figures)
P_ACCT.PARENTH1 Base level members of Personal Costs
TIME.PARENTH1 Base level members of 2009.TOTAL
a) Choose each hypertext in the Page Axis, and select the members as shownabove
b) Choose the P_ACCT.PARENTH1 hypertext
The EPM - Member Selector pops up.
c) Switch the display to Key
d) Select CE0004000 - Personal Costs → Base Level
e) Transfer to Selected Members
f) Remove any other selections
g) Choose OK
h) Choose the TIME.PARENTH1 hypertext
The EPM - Member Selector pops up.
i) Switch the display to Key
j) Select the Base Level members of 2009.TOTAL using the same techniqueas above.
k) Choose OK
l) Choose OK
You should have data as shown below:
Continued on next page
582 © 2011 SAP AG. All rights reserved. 2011
SAP Class Week of April 16, 2012
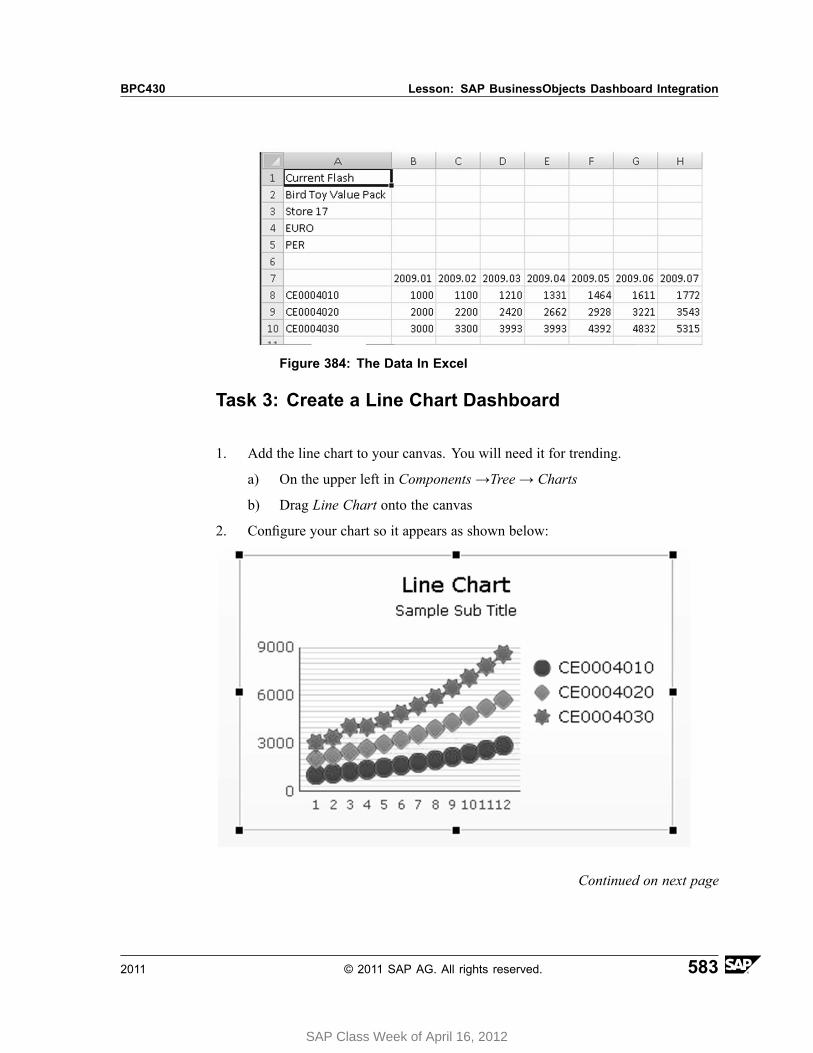
BPC430 Lesson: SAP BusinessObjects Dashboard Integration
Figure 384: The Data In Excel
Task 3: Create a Line Chart Dashboard
1. Add the line chart to your canvas. You will need it for trending.
a) On the upper left in Components →Tree → Charts
b) Drag Line Chart onto the canvas
2. Configure your chart so it appears as shown below:
Continued on next page
2011 © 2011 SAP AG. All rights reserved. 583
SAP Class Week of April 16, 2012
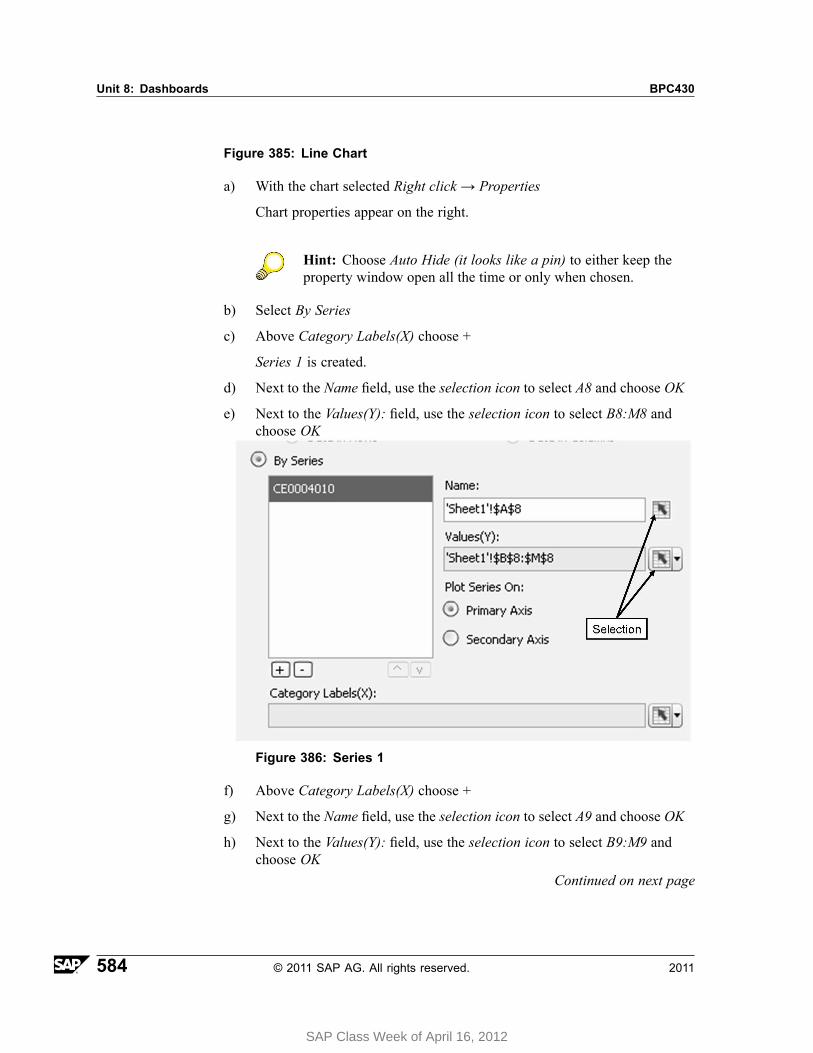
Unit 8: Dashboards BPC430
Figure 385: Line Chart
a) With the chart selected Right click → Properties
Chart properties appear on the right.
Hint: Choose Auto Hide (it looks like a pin) to either keep theproperty window open all the time or only when chosen.
b) Select By Series
c) Above Category Labels(X) choose +
Series 1 is created.
d) Next to the Name field, use the selection icon to select A8 and choose OK
e) Next to the Values(Y): field, use the selection icon to select B8:M8 andchoose OK
Figure 386: Series 1
f) Above Category Labels(X) choose +
g) Next to the Name field, use the selection icon to select A9 and choose OK
h) Next to the Values(Y): field, use the selection icon to select B9:M9 andchoose OK
Continued on next page
584 © 2011 SAP AG. All rights reserved. 2011
SAP Class Week of April 16, 2012
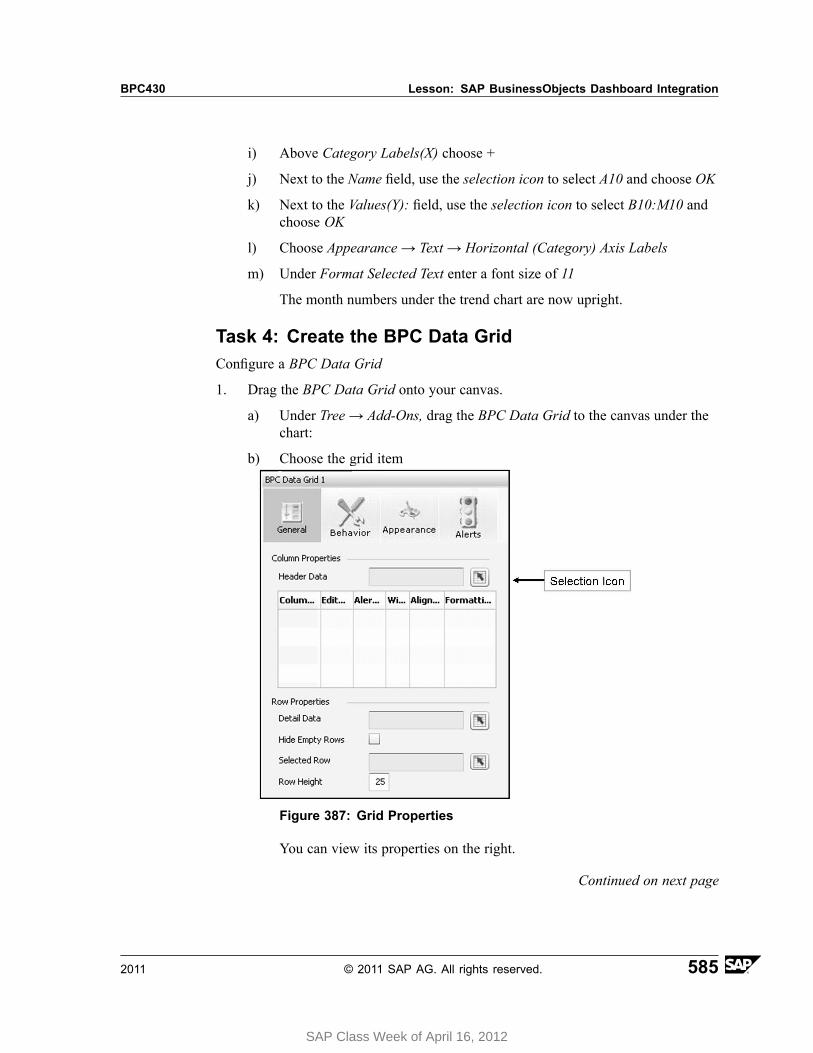
BPC430 Lesson: SAP BusinessObjects Dashboard Integration
i) Above Category Labels(X) choose +
j) Next to the Name field, use the selection icon to select A10 and choose OK
k) Next to the Values(Y): field, use the selection icon to select B10:M10 andchoose OK
l) Choose Appearance → Text → Horizontal (Category) Axis Labels
m) Under Format Selected Text enter a font size of 11
The month numbers under the trend chart are now upright.
Task 4: Create the BPC Data GridConfigure a BPC Data Grid
1. Drag the BPC Data Grid onto your canvas.
a) Under Tree→ Add-Ons, drag the BPC Data Grid to the canvas under thechart:
b) Choose the grid item
Figure 387: Grid Properties
You can view its properties on the right.
Continued on next page
2011 © 2011 SAP AG. All rights reserved. 585
SAP Class Week of April 16, 2012
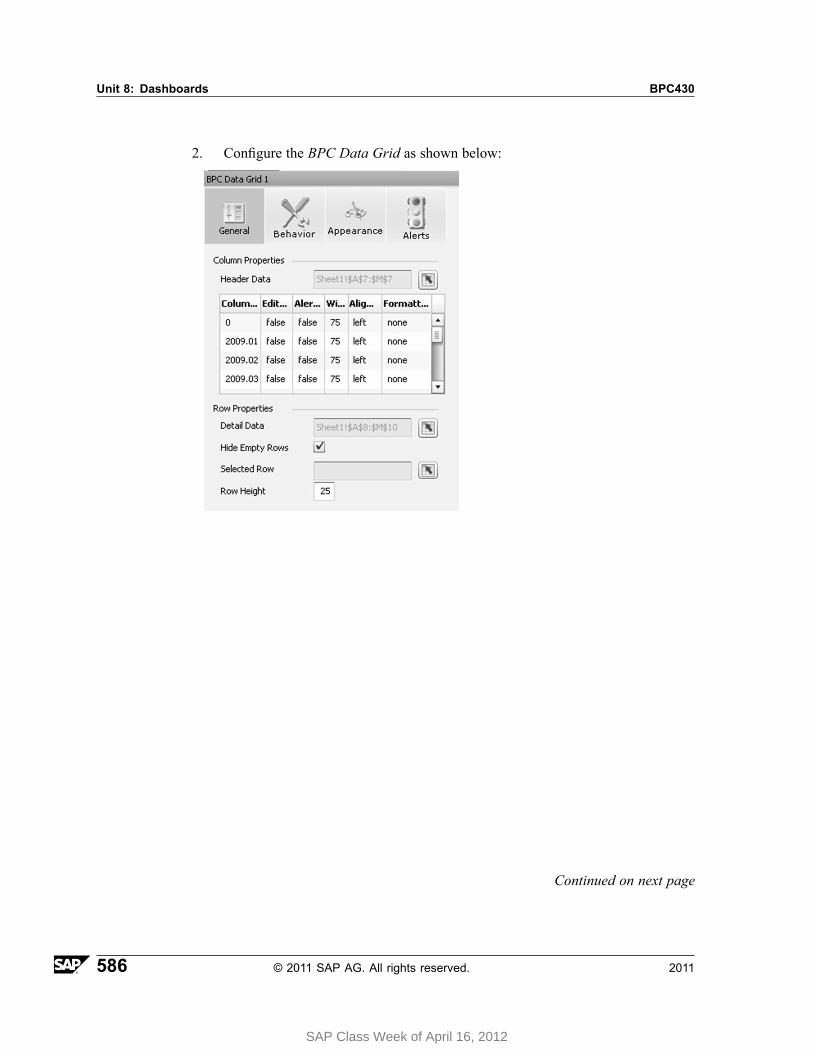
Unit 8: Dashboards BPC430
2. Configure the BPC Data Grid as shown below:
Continued on next page
586 © 2011 SAP AG. All rights reserved. 2011
SAP Class Week of April 16, 2012
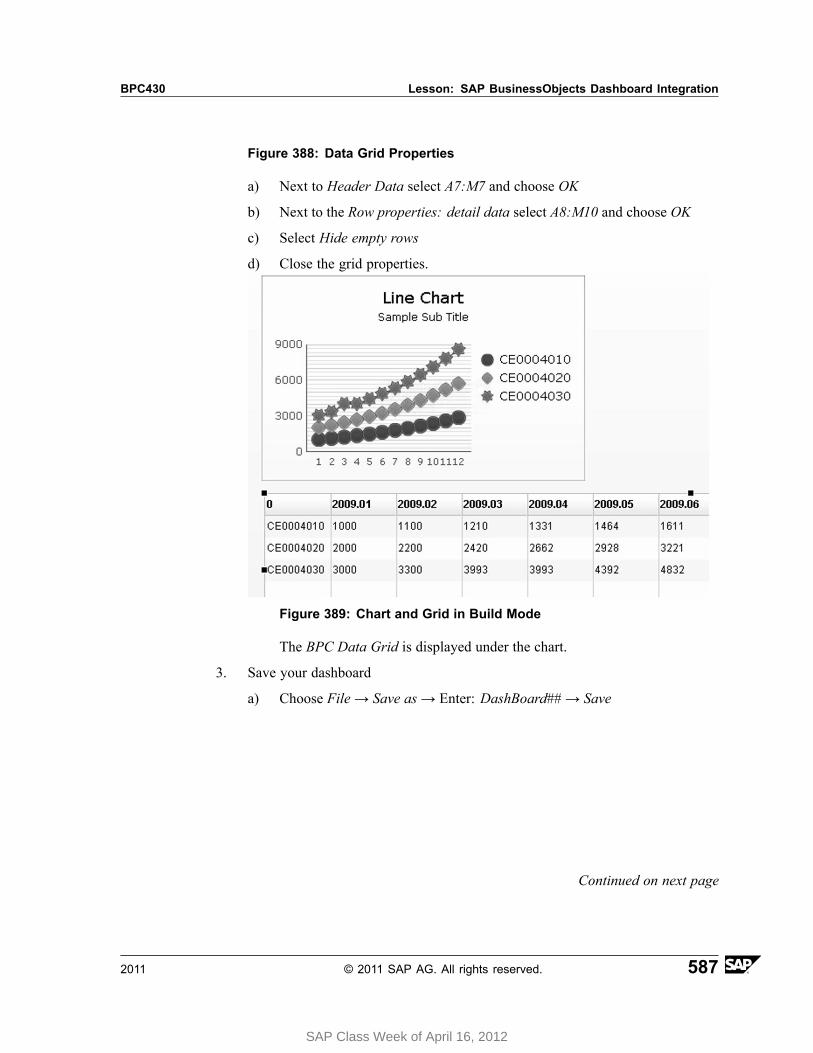
BPC430 Lesson: SAP BusinessObjects Dashboard Integration
Figure 388: Data Grid Properties
a) Next to Header Data select A7:M7 and choose OK
b) Next to the Row properties: detail data select A8:M10 and choose OK
c) Select Hide empty rows
d) Close the grid properties.
Figure 389: Chart and Grid in Build Mode
The BPC Data Grid is displayed under the chart.
3. Save your dashboard
a) Choose File → Save as→ Enter: DashBoard## → Save
Continued on next page
2011 © 2011 SAP AG. All rights reserved. 587
SAP Class Week of April 16, 2012
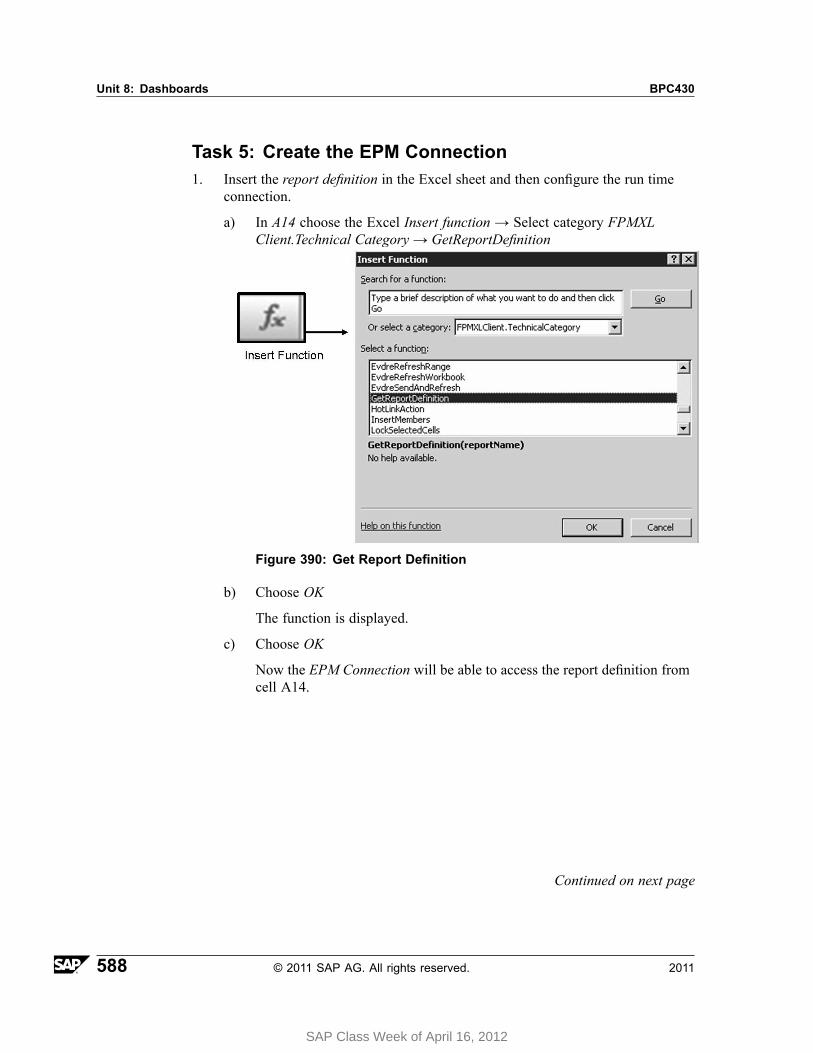
Unit 8: Dashboards BPC430
Task 5: Create the EPM Connection1. Insert the report definition in the Excel sheet and then configure the run time
connection.
a) In A14 choose the Excel Insert function→ Select category FPMXLClient.Technical Category → GetReportDefinition
Figure 390: Get Report Definition
b) Choose OK
The function is displayed.
c) Choose OK
Now the EPM Connection will be able to access the report definition fromcell A14.
Continued on next page
588 © 2011 SAP AG. All rights reserved. 2011
SAP Class Week of April 16, 2012

BPC430 Lesson: SAP BusinessObjects Dashboard Integration
2. Create the EPM Connection
a) Goto Data → Connections
The Data Manager opens
b) Choose Add → EPM Connector
Connection 1 is generated.
c) Select the Application: Planning and Consolidation, version for SAPNetWeaver platform
d) Select the Operation: EPM Report
e) In the web client, choose Documents → Connection Data → Open
f) Copy the Dashboard Connection: http://wd-flbmt7122.wdf.sap.corp:54080
g) Paste it into the open field below Input Details
h) Next to Report Definition choose Retrieve from one Excel Cell and selectA14 → OK
Figure 391: Run Time Connection
The report meta data is fed into the screen as shown above.
Continued on next page
2011 © 2011 SAP AG. All rights reserved. 589
SAP Class Week of April 16, 2012
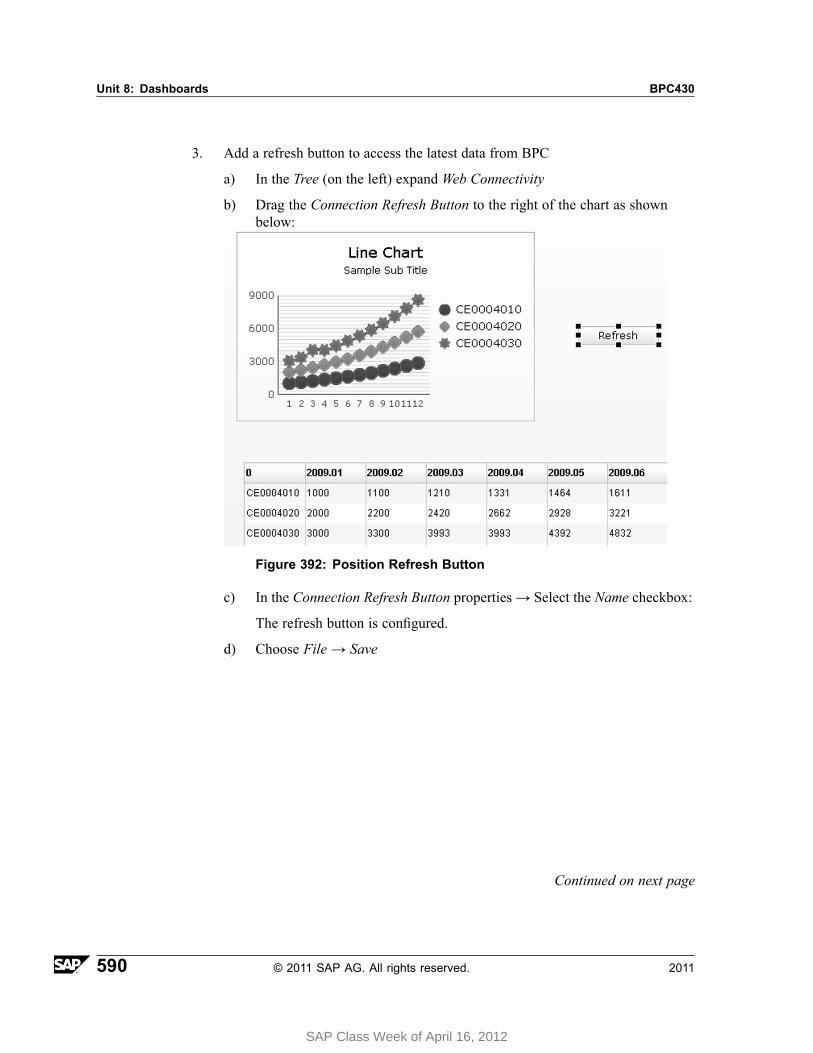
Unit 8: Dashboards BPC430
3. Add a refresh button to access the latest data from BPC
a) In the Tree (on the left) expand Web Connectivity
b) Drag the Connection Refresh Button to the right of the chart as shownbelow:
Figure 392: Position Refresh Button
c) In the Connection Refresh Button properties → Select the Name checkbox:
The refresh button is configured.
d) Choose File → Save
Continued on next page
590 © 2011 SAP AG. All rights reserved. 2011
SAP Class Week of April 16, 2012
BPC430 Lesson: SAP BusinessObjects Dashboard Integration
Task 6: Create The Flash FileCreate a flash file and then launch it from Internet Explorer and test the refresh feature.
1. Delete the data in your EPM Report so that you can test the refresh button.Generate the flash file.
a) Delete the transaction data in B8:M10
b) Choose File → Export → Flash(SWF) → My Documents → BPC430 →BPC430_## → DashBoard## → Save
Note: If you receive an error message regarding UnsupportedExcel Functions choose OK
c) Do not close your Dashboard Designer. (you may need to make a changelater)
Continued on next page
2011 © 2011 SAP AG. All rights reserved. 591
SAP Class Week of April 16, 2012
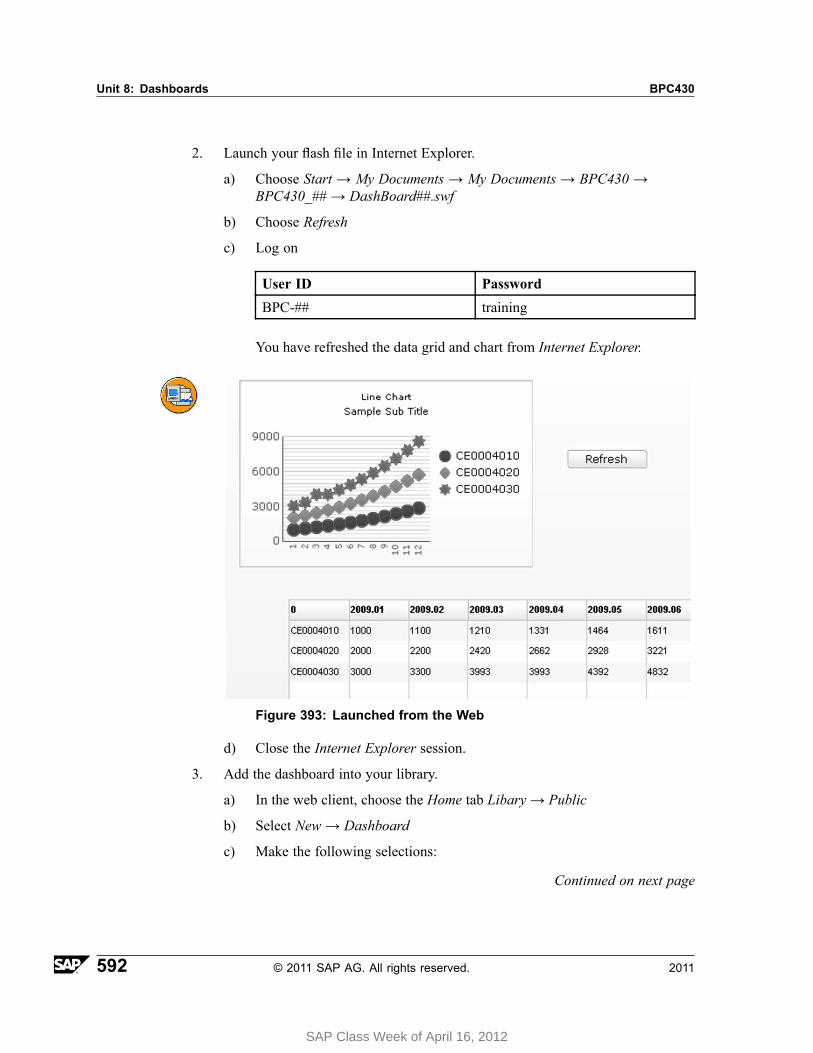
Unit 8: Dashboards BPC430
2. Launch your flash file in Internet Explorer.
a) Choose Start → My Documents → My Documents → BPC430 →BPC430_## → DashBoard##.swf
b) Choose Refresh
c) Log on
User ID Password
BPC-## training
You have refreshed the data grid and chart from Internet Explorer.
Figure 393: Launched from the Web
d) Close the Internet Explorer session.
3. Add the dashboard into your library.
a) In the web client, choose the Home tab Libary → Public
b) Select New → Dashboard
c) Make the following selections:
Continued on next page
592 © 2011 SAP AG. All rights reserved. 2011
SAP Class Week of April 16, 2012

BPC430 Lesson: SAP BusinessObjects Dashboard Integration
Figure 394: Library Upload Selections
d) Choose Upload
e) Select Refresh
f) Under Name choose Dashboard##
After a few seconds, an additional tab is created Dashboard##
g) Next to the chart, choose Refresh
Your data should appear using your current log in.
Continued on next page
2011 © 2011 SAP AG. All rights reserved. 593
SAP Class Week of April 16, 2012
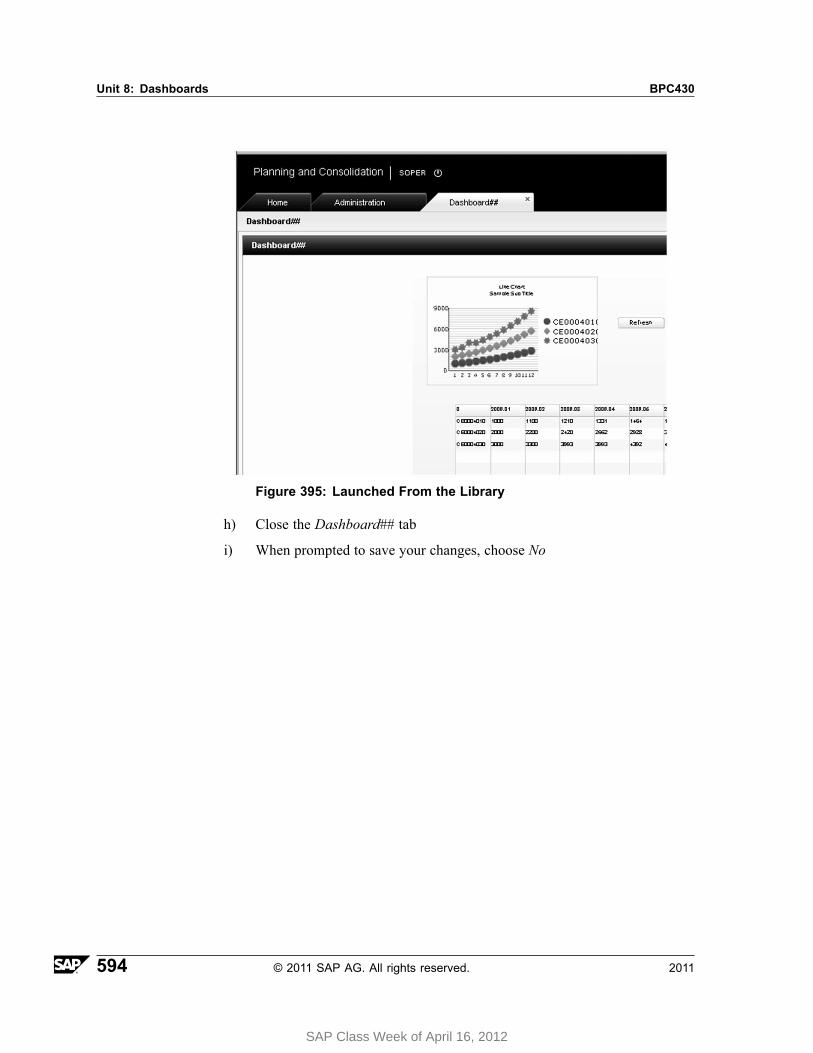
Unit 8: Dashboards BPC430
Figure 395: Launched From the Library
h) Close the Dashboard## tab
i) When prompted to save your changes, choose No
594 © 2011 SAP AG. All rights reserved. 2011
SAP Class Week of April 16, 2012
BPC430 Lesson: SAP BusinessObjects Dashboard Integration
Lesson Summary
You should now be able to:• Describe the key features of an SAP BusinessObjects Dashboard• Create a new dashboard• Use the EPM Connector
Related InformationYou will find some very detailed help documentation at HELP.SAP.COM.
Follow this path: SAP BusinessObjects → EPM Solutions → Planning andConsolidation → SAP BusinessObjects EPM Solutions, add-in for Microsoft Offcie10.0
2011 © 2011 SAP AG. All rights reserved. 595
SAP Class Week of April 16, 2012

Unit Summary BPC430
Unit SummaryYou should now be able to:• Describe the key features of an SAP BusinessObjects Dashboard• Create a new dashboard• Use the EPM Connector
596 © 2011 SAP AG. All rights reserved. 2011
SAP Class Week of April 16, 2012

SAP Class Week of April 16, 2012

SAP Class Week of April 16, 2012

Test Your Knowledge BPC430
597 © 2011 SAP AG. All rights reserved. 2011
SAP Class Week of April 16, 2012
Course Summary BPC430
Course SummaryYou should now be able to:
• Describe the SAP BusinessObjects Planning and Consolidation concepts andcomponents.
• Work with the delivered templates.• Use the Excel Interface of the EPM add-in• Set up and run the distribution and collection wizard.• Set up and run drill throughs.• Use Books to distribute precalculated static reports• Work with the Word, and PowerPoint Interfaces of the EPM add-in.• Build and use Dashboards for the purpose of integrating with SAP
BusinessObjects Planning and Consolidation.• Configure the comments feature.• Work with the EPM Functions.
598 © 2011 SAP AG. All rights reserved. 2011
SAP Class Week of April 16, 2012

FeedbackSAP AG has made every effort in the preparation of this course to ensure the accuracyand completeness of the materials. If you have any corrections or suggestions forimprovement, please record them in the appropriate place in the course evaluation.
2011 © 2011 SAP AG. All rights reserved. 599
SAP Class Week of April 16, 2012