rwe power international - rae.gr · rwe power international to conduct a ‘clean coal technologies...
TRANSCRIPT

TECH/JJB/657/06 December 2006 Issue: Final Error! Reference source not found.
1
Engineering Report
Clean Coal Technologies Overview
Reference Number: TECH/JJB/657/06
Date: December 2006
Issue: Final
RWE Power International

Copyright © December 2006 RWE Npower plc All pre-existing rights reserved. This document is supplied on and subject to the terms and conditions of the Contractual Agreement relating to this work, under which this document has been supplied, in particular: Confidentiality This document is confidential. Liability In preparation of this document RWE Npower plc has made reasonable efforts to ensure that the content is accurate, up to date and complete for the purpose for which it was contracted. RWE Npower plc makes no warranty as to the accuracy or completeness of material supplied by the client or their agent. Other than any liability on RWE Npower plc detailed in the contracts between the parties for this work RWE Npower plc shall have no liability for any loss, damage, injury, claim, expense, cost or other consequence arising as a result of use or reliance upon any information contained in or omitted from this document. Any persons intending to use this document should satisfy themselves as to its applicability for their intended purpose. The user of this document has the obligation to employ safe working practices for any activities referred to and to adopt specific practices appropriate to local conditions.
RWE Power International RWE Npower plc Windmill Hill Business Park Whitehill Way, Swindon Wiltshire, England, SN5 6PB
Telephone : 44 (0)1793 877777 Fax : 44 (0)1793 892525 Web site :http://www.rwepi.com
Registered Office: RWE Npower plc Windmill Hill Business Park Whitehill Way Swindon SN5 6PB
Registered in England & Wales: No. 3892782

TECH/JJB/657/06 December 2006 Issue Final
1
RWE Power International
Clean Coal Technologies Overview
Prepared for:
Client Contact :
Contract No. :
Prepared by: Iftikhar Khan, Boilers and Combustion Team
Reviewed by: Authorised by:
Phil Cahill,
Boilers and Combustion Team Dorian Matts, Manager,
Boilers and Combustion Team
Executive Summary Supercritical pf power plant is the technology of choice in the USA, Europe and Japan for new coal plants. Emission levels for current state-of-the-art supercritical plants using well-proven emission control technologies are below the emission constraints applicable in the EU’s Large Combustion Plant Directive (LCPD) which comes into force in 2008. Tried and tested supercritical plants range from 375 – 1000MWe, operate with steam conditions of 246-250bar/538/538-566oC and cycle efficiency of 42-45%. Availability is comparable to sub-critical units at 80 - 89%.
Parameter Unit Cost Capital Cost
SupercriticalUltra-supercritical
€/kWe 650 - 840800 - 920
Fixed O&M Cost Supercritical
Ultra-supercritical
€/kWe year 20 – 26 24 - 28
Variable O&M Cost €c/kWh 0.2 – 0.4
Fluidised Bed Combustion (FBC) is considered a mature technology and can make a contribution in the short to medium term. If Integrated Gasification Combined Cycle (IGCC) and advanced/ultra-supercritical fossil fuel technologies reach their potential, then fluidised bed technologies are likely to be superseded by 2020. The absence of current private sector interest in producing and promoting Pressurised Fluidised Bed Combustion (PFBC) technology could foreclose this as a technology option. PFBC is currently without a champion in the utility sector.

TECH/JJB/657/06 December 2006 Issue Final
2
RWE Power International
Parameter Unit Cost Capital Cost
PFBCCFBC
€/kWe 800 - 1040 680 - 880
Fixed O&M Cost PFBCCFBC
€/kWe-year 32 - 56 24 – 30
Variable O&M CostPFBCCFBC
€c/kWhe 0.16 – 0.32 0.16 – 0.4
Typical IGCC costs are approximated at €1370/kWe compared with €1020/kWe for supercritical coal fired power plants and €580/kWe for gas fired CCGT.
Parameter Unit Cost Capital Cost €/kWe 960 - 1370 Fixed O&M Cost €/kWe-year 24 - 36 Variable O&M Cost €c/kWhe 0.4 – 0.6
Operations and maintenance costs for IGCC plants are comparable with the O&M costs of supercritical pf coal plant and CCGT plants combined. These costs can only be justified in cases where environmental, fuel cost or grant/subsidy initiatives outweigh capital and O&M cost penalties. 50% efficiency is expected to be achievable by 2020. Although the fuel flexibility of IGCC plant makes this technology very attractive, the benefits do not presently outweigh the cost of capital and operational reliability. The capturing of CO2 from coal fired power plants requires significant energy and results in higher fuel consumption, reducing the overall plant efficiency. The specific investment cost €/kWe is increased. The proposed concepts require considerable R&D effort. New advanced supercritical plants can be designed and constructed to be capture ready by 2015. The retrofitting of carbon abatement technology to an existing coal-fired power plant minimises capital expenditure.
Case Investment Cost(€/kWe)
Cost of electricity(€c/kWh)
New build supercritical coal capture ready*
1239 4.0 – 4.5
New build supercritical with CO2 capture* 1568 5.0 – 5.5 Retrofit to supercritical steam conditions (without CO2 Capture)**
517 – 796 2.3 – 3.6
Retrofit to supercritical steam conditions (with CO2 Capture)**
868 – 1146 5.5 – 6.1
* €/kWe not allowing for energy use in the capture process feeding through to a higher specific capital cost ** Numbers very sensitive to condition of plant and what can be reused
TECH/JJB/657/06 December 2006 Issue Final
3
RWE Power International
Table of Contents
Introduction 1
1. Conventional Supercritical PF Combustion 1 1.1. Introduction 1
1.1.1. Description of Supercritical Steam Cycle 1 1.1.2. Environmental Performance 1 1.1.3. Demonstrated Commercial Performance 1 1.1.4. Efficiency 1 1.1.5. Boiler Option 1 1.1.6. Tried and Test Supercritical Plant 1 1.1.7. State-of-the-Art Current Plant 1 1.1.8. Future Development 1 1.1.9. Economic Facts 1
2. Fluidised Bed Combustion 1 2.1. Introduction 1
2.1.1. Atmospheric Circulating Fluidised Bed Combustion (CFBC) 1 2.1.2. Atmospheric Bubbling Fluidised Bed Combustion (BFBC) 1 2.1.3. Pressurised Fluidised Bed Combustion (PFBC) 1 2.1.4. Environmental Performance 1 2.1.5. Demonstrated Commercial Performance 1 2.1.6. Efficiency 1 2.1.7. Technology Status 1 2.1.8. Current Plant 1 2.1.9. State-of-the Art Fluidised Bed Supercritical Steam Cycle Developments 1 2.1.10. Future Development 1 2.1.11. Economic Facts 1
3. Integrated Gasification Combined Cycle (IGCC) 1 3.1. Introduction 1
3.1.1. Description of Process 1 3.1.2. Current Commercial Gasifier Development 1 3.1.3. Environmental Performance 1 3.1.4. Efficiency 1 3.1.5. Current Plant 1 3.1.6. Demonstrated Commercial Performance of Puertollano IGCC 1 3.1.7. State-of-the-Art 1 3.1.8. Potential for Future Deployment 1 3.1.9. Economic Facts 1
4. Power Plants with CO2 Carbon Capture 1 4.1. Introduction 1
4.1.1. Capture Technology 1 4.1.2. Efficiency 1 4.1.3. Technology Status 1 4.1.4. Supercritical PF Plant with Post-Combustion CO2 Capture 1
Appendix A. Fuel Analysis 1
Appendix B. Effect of Cooling Water on Cycle Efficiency 1
Appendix C. Power Plant Database 1
5. References: 1

TECH/JJB/657/06 December 2006 Issue Final
4
RWE Power International
List of Figures and Tables
Figure 1: H&M Balance for Supercritical pf Plant 1
Table 1. Definition of Sub-critical and Supercritical 1
Table 2. General Emission Levels for Supercritical Boilers 1
Table 3. Thermodynamic Data for Esbjergvaerket Unit 3 1
Table 4. Operating Data for Esbjergvaerket Unit 3 1
Table 5. Imported Bituminous Coal Specifications 1
Table 6. State-of-the Art Supercritical Plant 1
Figure 2: H&M Balance for sub-critical CFBC Systems 1
Figure 3: H&M Balance for ABB Carbon P800 PFBC with Supercritical Steam Conditions 1
Figure 4: H&M Balance for Supercritical IGCC Plant 1
Figure 5: Puertollano IGCC Arrangement 1
Table 7. Puertollano Power Plant Main Fuel Data 1
Table 8. Puertollano Power Output and Emissions 1
Figure 6: Emission Operational Data for Natural Gas 1
Figure 7: Emission Operational Data for Coal-Gas 1
Figure 8: Electricity Generation During 1998 - 2003 1
Table 9. Elcogas Availability Statistics 2003 – 2005 1
Table 10. Elcogas Unavailability during 2005 1
Table 11. Comparison of IGCC and Pre-Combustion Capture 1
Table 12. Oxyfuel Combustion Comparative Costs for Hard Coal 1
Table 13. Oxyfuel Combustion Comparative Costs for Lignite Coal 1
Table 14. Comparison of Post-Combustion CO2 Capture Technology 1
Table 15. Examples of Reported Efficiencies and Costs for Power Plants with CO2 Capture 1
Table 16. Cost of CO2 Retrofit Plant 1
Table 17. Merits of Carbon Capture Technology 1

TECH/JJB/657/06 December 2006 Issue Final
5
RWE Power International
Introduction The Regulatory Authority for Energy (RAE) of the Hellenic Republic has requested RWE Power International to conduct a ‘Clean Coal Technologies Overview’. This report is submitted in fulfilment of the requirements of Task 1, and comprises the assembly and evaluation of information that will assist RAE in the development of a strategy for coal fired power generation in Greece. The majority of worldwide coal fired power stations currently operating are based on a conventional single reheat, sub-critical thermodynamic cycle with main steam pressures ranging 160 – 180 bar, and 535 – 565oC superheat and reheat steam temperatures. Modern well designed sub-critical plants are achieving efficiencies of 36-38%. This report summarises the cleaner coal technologies available worldwide and, in particular focuses on the advantages and disadvantages of supercritical pf combustion, fluidised bed combustion (atmospheric and pressurised) and Integrated Gasification Combined Cycle combustion (IGCC). Developments in, and proposals for coal fired power plants incorporating carbon dioxide separation are also evaluated. The leading techniques discussed are pre-combustion capture of CO2, oxy-fuel combustion and post-combustion CO2 capture. In preparing this report RWE Power International has relied on its extensive experience and knowledge of power generation technology. Power plant owners, operating in commercially competitive markets do not release useful information on the reliability of their power plants or on their maintenance requirements. In this report RWE Power International presents an objective assessment of the current status of technology, its advantages or otherwise, and the role of this technology over the next decade, limited economic facts are also discussed. This report consists of four chapters. In each chapter a brief description of the technology, its environmental performance, demonstrated commercial performance, efficiency, technology status and its future potential, and economic assessments are presented. Chapter 1 covers conventional sub-critical and supercritical pf combustion. In Chapter 2 fluidised bed combustion is discussed, IGCC in Chapter 3 and Chapter 4 provides a discussion on power plants with CO2 carbon capture. Numbers quoted for the technology capital cost, fixed and variable O&M costs vary depending upon the selected source of information. Each technology supplier will present their technology in an attractive manner. To provide an objective assessment of the technology costs in the ‘Economic Facts’ section of chapter 1 - 3, reliance is placed on an independent study published in 2005 for the US EPA in which supercritical, fluidised bed and IGCC technology were evaluated. This therefore allows the costs of technology to be compared alongside each other for the same geographical region. The costs illustrated in Chapter 4 are extracted from European sources and are based on cost data published during the period 2004 – 2006. The ‘Capital cost’ figures provided are for gross output. Fixed O&M costs typically constitute: plant life usage/degradation and labour. Variable O&M costs typically include: fuel, feed chemicals and fuel consumed to bring unit to synchronisation. Each utility will have site and unit specific fixed and variable O&M costs, these specific costs cannot be determined. For each technology discussed in this report, a process diagram is presented along

TECH/JJB/657/06 December 2006 Issue Final
6
RWE Power International
with heat and mass balance figures. The basis assumptions for the H&M balances are: cycle operating at maximum rated power, located at sea level on a standard day with barometric pressure of 1013mbar, 15oC ambient temperature and 70% relative humidity. 90% sulphur capture efficiency is assumed. The fuel analysis for the reference fuel used in the H&M balance is provided in Appendix A.

TECH/JJB/657/06 December 2006 Issue Final
7
RWE Power International
1. Conventional Supercritical PF Combustion 1.1. Introduction
The majority of worldwide coal fired power stations currently operating are based on a conventional single reheat sub-critical thermodynamic cycle with main steam pressures ranging 160 – 180 bar and 535 – 565oC superheat and reheat steam temperatures. Modern well designed sub-critical plants are achieving efficiencies of 36-38%. The thermodynamic cycle efficiency can be improved by increasing the operating steam pressure and temperatures, which has led to the development of the supercritical steam cycle. This is now the leading clean coal technology. Existing sub-critical plants can be modified to operate at advanced supercritical steam conditions by replacing existing boilers and steam turbines with supercritical designs. Supercritical steam-cycle technology has been applied for several decades throughout the developed world and is now being applied to the developing world. It is the technology of choice in the USA, Europe and Japan for new coal plants. China has ordered >60GW of supercritical units in the past 3 years, and Japan has five ultra-supercritical plants in operation with steam temperatures of 593oC. Figure 1 (Maude 1993) illustrates the H&M balance for a 300MWe gross, supercritical pf plant with steam conditions of 240bar/565/565oC in a single reheat cycle comprising a once-through Benson type boiler with forced circulation and no steam drum.
Figure 1: H&M Balance for Supercritical pf Plant
1.1.1. Description of Supercritical Steam Cycle In a sub –critical plant the steam pressure is <221 bar, and the boiler is of a drum boiler design where steam and water is separated. A supercritical boiler has steam pressures >221 bar, with no distinct water/steam phase above the critical pressure of 221 bar. This eliminates the requirements of a drum and are therefore of once-through design with either forced or natural circulation. Table 1 lists the defining conditions for sub-critical and supercritical conditions. Whilst the differentiating conditions for sub-critical and supercritical conditions are clear, no clear universal definition exists on how advanced and ultra-supercritical technology is defined in terms of steam cycle operating temperatures. In Table 1 the technology
Boiler
Steam Cycle
Fuel
Air
Condenser
Steam Turbine
ESP FGD System
Reheater
Stack
Limestone 0.9t/hr
Gypsum1.7t/hr
Coal = 100.8 t/hr 698.0 MWt hhv
Gross = 300 MWe Auxiliary power = 26.6 MWe Net output = 273.4 MWe
Carbon = 231 g/kWhr CO2 = 847 kg/MWhr
240bar/565/565oC
Cycle η (%) = 39.2 HHV 41.1 LHV
Furnace Bottom Ash + Fly Ash 7.1t/hr

TECH/JJB/657/06 December 2006 Issue Final
8
RWE Power International
defining conditions are steam temperatures driven by material selection.
Table 1. Definition of Sub-critical and Supercritical Technology Pressure
(bar) Temperature
(superheat/reheat) oC Material
Sub-critical <221 <565/565 Low alloy austenitic steels
Supercritical >221 >540/540 Low alloy austenitic steels
Advanced Supercritical
>221 - 290 560/580 Martensitic steels
Ultra Supercritical >300 620-650/620 Nickel based alloys
With advanced supercritical cycles, reheat temperatures are increasingly exceeding superheat temperatures. The steam pressure in the reheat circuit is approximately 25% of the steam pressure in the superheater. This reduces the stresses in the reheat circuit materials and permits higher steam temperatures to be achieved before the design limits of the reheater material (steel) is reached. In principle, it is possible to increase the temperature of the main steam circuit to match the reheat temperatures by increasing the superheater tube pipe thickness. However, the cost penalty and thermal fatigue concerns have led to the present situation.
1.1.2. Environmental Performance General emission levels for current state-of-the art supercritical plants using well-proven emission control technologies are listed in Table 2 (DTI 2006). Emissions can be controlled to levels below the emission constraints applicable in the EU’s Large Combustion Plant Directive (LCPD), which comes into force in 2008. Actual emission levels are dependent on fuel composition.
Table 2. General Emission Levels for Supercritical Boilers
Emission Mg/Nm3
EU LCPD Limit For existing plant
(from 2008)
EU LCPD Limit For new plant
(from 2008)
Supercritical Emission Levels
NOx 500 200 38 SO2 400 200 100
Particulates 50 30 20 PM10 - 20
Mercury - 4.5x10⁻⁶ kg/MWh VOC - 38 CO - 11
H2SO4 - 3.75
1.1.3. Demonstrated Commercial Performance Danish power companies Elsam and Elkraft operate 6 supercritical and 2 ultra-supercritical units respectively, ranging from 250-400MWe. Elsam’s first supercritical units commenced operation in 1984 at the Studstrup power station. Table 3 (NP 1993, Kjaer) illustrates the thermodynamic data for Esbjergvaerket unit 3 (VKE3) – the newest coal-fired supercritical plant in Denmark and Table 4 (World Energy Council) illustrates Esbjergvaerket unit 3 performance data for the period 1995 – 1997. Danish power plants are fuelled by globally sourced imported bituminous coals. Blending of

TECH/JJB/657/06 December 2006 Issue Final
9
RWE Power International
coals is required only in extreme cases to overcome operational problems. Under normal operating circumstances the wide range of imported coals can be combusted without severe problems. Table 5 (World Energy Council) lists the range and main characteristics of these imported coals.
Table 3. Thermodynamic Data for Esbjergvaerket Unit 3
Parameter Units ValueYear of Commissioning yr 1992 Gross Output MW 415 Net Efficiency (LHV) % 45.5 Boiler Efficiency (LHV) % 95 Auxiliary Power % 7 Main Steam Temperature oC 560 Main Steam Pressure bar 250 Reheat Pressure bar 57 Reheat Temperature oC 560 Feed-water Temperature oC 275 Condenser Pressure mbar 23 Stack Temperature oC 105 Main Steam Flow kg/s 300
Table 4. Operating Data for Esbjergvaerket Unit 3
Parameter Units Value 1995 1996 1997
Electric Power to Grid GWh 2410 2647 2616 Equivalent Full Load Hours hr 6838 7572 7411 Operation Hours hr 7923 7595 8612 Planned Overhaul hr 708 708 0 Forced Outage Rate % 1.5 5.5 1.7 Cycle Efficiency (LHV) Net % 45.5 45 44.7
Table 5. Imported Bituminous Coal Specifications
Coal Characteristic Units Range LHV MJ/kg 23.0 – 27.0 Water % 6 – 14 Ash % 8 – 17 Volatiles % 20 – 40 Sulphur % 0.3 – 2.5 Hardgrove Index - 40 – 95 Ash Softening Temperature oC 1100 - 1400
1.1.4. Efficiency The power plant efficiency is the product of the boiler and turbine efficiency, this product being reduced because of ancillary power requirements. Boiler efficiencies are almost independent of steam conditions. Most modern coal boilers are more than 90% efficient. The emphasis for efficiency improvement has moved to the steam cycle which for thermodynamic reasons is generally in the range of 45 to 55% efficient. This

TECH/JJB/657/06 December 2006 Issue Final
10
RWE Power International
efficiency is sensitive to steam temperatures (superheat and reheat) and pressures and there is greater potential for increasing steam cycle efficiency than boiler efficiency. The efficiency of modern supercritical boilers firing high quality hard coals are typically 94-95% (LHV basis) with exceptional cases as high as 96%. Lignite fired boilers have lower efficiencies compared to hard coal boilers due to the higher moisture and ash in the fuel. A modern German lignite boiler exhibits 90-91% boiler efficiency. Lignite coal covers a wide range of composition with moisture varying from 20 – 60% and ash 4 – 50%. Lignite boiler efficiency will vary by several % points depending upon the actual composition of the fuel which is determined by the region supplying the fuel.
1.1.5. Boiler Option Tower and Two-pass boilers designs are suitable for advanced supercritical conditions and are available in the Benson or Sulzer design. Both designs are very similar with spiral-wound furnace tubing. Siemens AG of Germany owns the Benson design and ABB of Switzerland the Sulzer design. The Benson design is the market leader. The Two-pass design is dominant in the UK, its advantages are:
- reduced visual impact due to compact boiler height - economical due to reduced superstructure height, particularly for boilers
>400MWe Recent lignite coal units utilise the once-through Tower design and are particularly prevalent in Denmark and Germany. Principle advantages include:
- well suited design for inclusion of Selective Catalytic Reduction (SCR) for NOx reduction
- Simplified boiler support steelwork - Minimal temperature differentials throughout all parts of the boiler - Simpler boiler structure and concentration of support elements at the ground
level which allows quality welded elements and faster construction times - ~10% reduction in boiler construction material requirements - simpler construction of, and arrangement of boiler pressure parts which
permit ease of maintenance
1.1.6. Tried and Test Supercritical Plant Tried and tested supercritical plants have been constructed since the early 1970s. These range from 375 – 1000MWe, operate with steam conditions of 246-250bar/538/538-566oC and cycle efficiency of 42-45%. Availability is comparable to sub-critical units at 80 - 89%.
1.1.7. State-of-the-Art Current Plant State-of-the-art is determined by the combination of boiler, turbine and auxiliary balance-of-plant items that combine to deliver maximum cycle efficiency, plant performance and plant availability for the selected fuel. On a case-by-case basis, the plant location, climatic conditions, cooling water availability and temperatures (direct or indirect cooling) and fuel quality influence the actual efficiency of a plant. Table 6 (DTI 2006) provides a summary of the state-of-the-art supercritical technology sited in Europe, Japan and more recently China.
Table 6. State-of-the Art Supercritical Plant

TECH/JJB/657/06 December 2006 Issue Final
11
RWE Power International
Country Power Plant Unit
Rating MWe (net)
Steam Pressure
(bar)
Main Steam Temp (oC)
Reheat RH1
Steam Temp (oC)
Reheat RH2
Steam Temp (oC)
Efficiency (% net LHV)
Denmark Nordjylland 3 411 285 580 580 580 47 Holland Hemweg 8630 630 260 540 568 - 42 Finland Meri Pori 550 244 540 560 - 45
Germany Staudinger 509 262 545 562 - 43 Germany Niederaussem
K 965 275 580 600 - 45.2
Japan Tachibanawan 1050 250 600 610 - 43.5 Japan Isogo 600 266 600 610 - - China Changshu 600 259 569 569 - 42 China Wangqu 600 247 571 569 - 43 USA Tanners
Creek 580 241 538 552 566 39.8
1.1.8. Future Development
European supercritical boiler manufacturers in association with power generators launched the AD700 programme with the aim of achieving 50 - 55% net cycle efficiency. This requires a step-change in steam conditions to 350-375 bar steam pressure and approximately 700/720oC steam temperatures. This performance level can only be achieved through the use of nickel alloys in the highest temperature regions of the superheater, reheater, turbine and pipework. This programme is supported by the European Commission and is being executed in 6 phases, with the aim of having a full scale demonstration plant operational in 2014 (DTI 2006). Such plants are initially unlikely to be economically competitive with less efficient lower temperature (<620oC) steam cycle plants.
1.1.9. Economic Facts Numbers quoted for the technology capital cost, fixed and variable O&M costs vary depending upon the selected source of information. Supercritical boiler and turbine manufacturers will present their technology in an attractive manner. To present an objective and independent assessment, the capital, fixed and variable O&M costs for supercritical and ultra-supercritical pf combustion plant are based on a 2005 study prepared for the US EPA (EPA 2005).
Parameter Unit Cost Capital Cost
SupercriticalUltra-supercritical
€/kWe 650 - 840800 - 920
Fixed O&M Cost Supercritical
Ultra-supercritical
€/kWe-year 20 – 26 24 - 28
Variable O&M Cost €c/kWhe 0.2 – 0.4
2. Fluidised Bed Combustion

TECH/JJB/657/06 December 2006 Issue Final
12
RWE Power International
2.1. Introduction Fluidised bed combustion is considered mature technology and can make a contribution in the short to medium term. If IGCC and advanced/ultra-supercritical fossil fuel technologies reach their potential then fluidised bed technologies are likely to be superseded by 2020. Electricity generation using fluidised bed combustion accounts for a small fraction of total electricity generation from coal. Fluidised bed combustion market penetration has been increasing for many years. The major market for circulating fluidised bed technology is Eastern Europe and Asia. Steam conditions are comparable with sub-critical pf plant. Major suppliers of fluidised bed boilers are Lurgi, Alstom Power and Foster Wheeler. Fluidised bed combustion has a number of advantages. It is able to utilise high ash material such as oil shale, which in a normal pf boiler would lead to high maintenance costs and potentially unstable combustion. Fluidised beds are able to burn a wide range of low-grade fuels and high-sulphur, high-ash coals, petroleum coke, wood waste, peat and lignite coals. Waste recovery applications favour the use of relatively small units constructed in close proximity of the fuel source. Combustion temperature is typically 800 – 900oC which is below the temperature at which the ash becomes sticky. This lower temperature results in the formation of considerable less NOx compared to pf combustion and does not necessitate the requirements for de-NOx technology. 90 – 95% SO2 reduction can be achieved without FGD, mainly through the addition of lime or dolomite to the bed. No additional SO2 control measures are needed, but the disposal of solid residue warrants careful consideration. Fluidised bed boilers are not inherently more efficient than pulverised coal boilers. In fact their efficiency is usually less than pulverised boilers because the greater fan power outweighs the savings in coal mill power. They are effectively a change in combustion conditions to allow gas cleaning during the combustion process. The overall power plant efficiency is dominated by the steam cycle. The steam parameter can be similar for pulverised coal and fluidised beds but to date only one supercritical fluidised bed power plant is under construction. This is in Poland.
2.1.1. Atmospheric Circulating Fluidised Bed Combustion (CFBC) Circulating fluidised bed combustors is considered as a fully proven commercial option competing with sub-critical pf + FGD + De-NOx plants for sizes up to 200-460MWe. CFBC plants require higher thermal efficiencies in order to compete with high temperature supercritical pf plants. Capital cost quotes can vary significantly due to the differing design emphasis for fuel flexibility or stringent emission control. Figure 2 (Maude 1993) illustrates the H&M balance for a 300MWe gross CFBC plant designed to generate steam at standard sub-critical conditions of 125bar/538/538°C in a single reheat stage steam cycle. Operating efficiencies are 0.3 percentage points higher compared with equivalent pf boilers with similar steam conditions. A higher, 2:1, calcium to sulphur ratio is required for CFBC compared to 1:1 for pf FGD systems to obtain 90% sulphur capture levels. No saleable gypsum is produced with the CFBC system and the level of residue generated is slightly greater (~10%) than pf combustion. This is less than the extra amount of limestone added to the CFBC

TECH/JJB/657/06 December 2006 Issue Final
13
RWE Power International
process (due to the limestone products of CFBC consisting of lighter weight compounds) compared to pf combustion. The ‘waste steams’ of pf combustion consist of 3 separate and saleable products; furnace bottom ash, fly ash and gypsum. The furnace bottom ash is from the boiler and the fly ash from the ESP process. Both comprise a mixture of the ash in the coal and unburnt carbon. The ‘waste stream’ of CFBC is a single product comprising a mixture of ash, unburnt carbon and limestone products which is difficult to dispose of as a saleable product. Products of pf combustion:
Ash + unburnt carbon: 1) furnace bottom ash 2) fly ash
Limestone + SOx: 3) Gypsum (CaSO4.7H2O) Products of CFBC: Ash + unburnt carbon + limestone products (CaO, CaCO3, CaSO4, CaSO4.1/2H2O) as a mixture in a single product. Each of the limestone products have molecular weights less than gypsum which is produced from the pf combustion process.
Figure 2: H&M Balance for sub-critical CFBC Systems
It is not necessary to remove moisture from lignites coals for use in a CFB, though manufacturers are considering the economic case for doing so in order to improve boiler efficiency. Coal preparation is an important factor in CFBC performance and is specified by the manufacturer. Limestone size is particularly critical for bed control. Boiler efficiencies quoted for lignite coal is 89-92% with moisture ranging form 35-45%. A key factor in achieving design performance is adherence to the limestone and fuel quality specification, which is critical for the temperature distribution and heat transfer performance of the combustor. Manufacturers are currently driving to reduce capital costs in response to a highly competitive market. Costs are minimised by offering off-the-shelf designs. The market for BFBC and CFBC fluidised bed combustors for brown coal is dominated by three licence holders; Alhstrom Pyropower, Lurgi Lentjes Babcock (LLB) and GEC Alsthom-EVT Energi (EVT). Other BFBC/CFBC suppliers include Foster Wheeler (purchasers of
Fluidised Bed Combustor
125bar/538/538oC ESP
Coal
Limestone
AirDry Residue
9.7t/hr
Flue Gas
Ash
Stack
Steam Turbine
Emission Control Coal = 108.9 t/hr
753.9 MWt hhv
1.8 t/hr
Gross = 300 MWe Auxiliary power = 19.2 MWe Net output = 280.8 MWe
Carbon = 242 g/kWhr CO2 = 887.3 kg/MWhr
Cycle η (%) = 37.3 HHV 39.0 LHV

TECH/JJB/657/06 December 2006 Issue Final
14
RWE Power International
Ahlstrom), Tampella and Studsvik. CFBC in the mid 1980s demonstrated a poor availability record which has been largely resolved. Circulating fluidised bed combustors can accommodate fast load changes after reaching operating temperature but, are less tolerant of rapid temperature changes from cold.
2.1.2. Atmospheric Bubbling Fluidised Bed Combustion (BFBC) The BFBC is the basic fluidised bed combustor and is proven technology for lignite coals. BFBC has the advantage of being able to be retrofitted to conventional pf boilers and has been demonstrated by Tampella Power. Five Babcock’s (now LLB) Circofluid units utilising lignite coal are in operation in Germany. BFBC is best suited to small units firing low grade fuels. In comparison to CFBC, BFBC’s have reduced capital cost, lower efficiency, lower fuel flexibility, poorer heat transfer characteristics and lower sulphur removal capacity.
2.1.3. Pressurised Fluidised Bed Combustion (PFBC) In a pressurised fluidised bed combustor (includes both pressurised bubbling and circulating fluidised beds) combustion takes place within a large pressure vessel at 10 – 15 bar pressure. Some of the energy in the hot, high pressure gas leaving the combustor is utilised directly in a gas turbine at moderate combustion temperatures of ~850oC. As PBFBC (pressurised bubbling fluidised bed combustors) operate under pressure, they can be physically smaller than BFBCs and efficiency is not limited by the steam cycle. Commercially available PFBC systems are based on ABB-Carbon pressurised fluidised bed technology. In comparison with pf combustion and atmospheric fluidised bed, advantages of PFBC include:
• The PFBC is essentially part of a combined cycle system • PFBC system with sub-critical steam cycle gives efficiency similar to basic
supercritical pf plant (~42% Net LHV). A PFBC with supercritical steam cycle should approach 44% Net efficiency
• PFBC units are more compact than comparable rated atmospheric fluidised bed combustors or pf boilers
• PFBC have greater sulphur capture efficiency at lower Ca/S ratios The low NOx and integrated desulphurisation benefits of fluidised bed technology restrict the entry temperatures at the gas turbine to ~900oC. This restricts the exploitation of advances achieved in gas turbine technology. In combined cycle power applications, approximately 80% of the electricity is generated in a conventional steam turbine-generator unit. After cleaning of the gases in high efficiency cyclones, the cleaned gases are expanded through a gas turbine, which generates the balance of 20% electricity. Compared with BFBC, PBFBCs achieve considerably higher combustion and sulphur retention efficiencies. The first installations are now fully operational, mothballed or dismantled. PFBC technology is suitable for plants rated up to 200MWe. Higher efficiencies can only be achieved by increased steam pressures in the water-steam circuit which creates unfavourable operating conditions for the steam turbine which necessitate very small turbine blades, this lead to higher steam turbine associated leakage losses. Operating experience with PBFBC is limited and specialised. The Tidd unit was constructed as a technology demonstrator, and in accordance to the original plan

TECH/JJB/657/06 December 2006 Issue Final
15
RWE Power International
was shut down at the end of the demonstration programme. Experience at EscatrÓn illustrates the difficulty in applying this technology to coals with high-ash and high-sulphur contents especially those which present sintering problems in their ashes. With the exception of the Vartan plant in Stockholm, the operational PFBCs are all demonstration plants and have experienced a considerable number of difficulties with resultant low availabilities. The Vartan plant has shown good availability due to being available for extended maintenance during the summer months. The major concern with PFBC is probably the lack of clear commitment by a major manufacturer. Figure 3 (Maude 1993) illustrates the H&M balance for a single large ABB Carbon PFBC module designated P800 and incorporating a single GT-140P gas turbine.
Figure 3: H&M Balance for ABB Carbon P800 PFBC with Supercritical Steam Conditions
2.1.4. Environmental Performance The inherent design features of CFBC boilers means that compliance with moderate emission limits of SOx, NOx, and particulates are easily attainable. A comparable conventional pf combustion boiler would require expensive additional processes such as Flue Gas Desulphurisation – FGD, Selective Catalytic Reduction – SCR, and/or low NOx pf burners, and high efficiency Electrostatic Precipitators – ESP. SOx emissions are controlled in-situ by the addition of limestone. The low temperatures of fluidised bed combustion (850 – 900oC) limit the formation of NOx. CFBC power plants are capable of complying with moderate emission limits of NOx without flue gas treatment, but emission standards are generally becoming more stringent. Selective Non-Catalytic Reduction (SNCR), and/or Selective Catalytic Reduction (SCR) have to been implemented for locations where NOx limits are stringent, and the primary
Air Compressor Gas
Turbine
Pressurised Combustor
240bar/540/565 oC
Gas Clean-up
Coal
Economiser
Water
Steam Steam Turbine
Stack Coal = 123.8 t/hr 856.8 MWt hhv
71.3MWe
Limestone 1.8t/hr
Solid 11.2t/hr
Cycle η (%) = 42.2 HHV 44.2 LHV
Carbon = 209 g/kWhr CO2 = 766.3 kg/MWhr
Gross for cycle = 379.7 MWe Gross steam turbine = 308.4 MWe Auxiliary power = 18.3 MWe Net output = 361.4 MWe

TECH/JJB/657/06 December 2006 Issue Final
16
RWE Power International
control measures are inadequate to comply with particularly stringent NOx emission limits. A potential weakness of CFBC is the relatively high levels of N2O emissions. Though there are no general standards for N2O, there is a concern that N2O is a potent greenhouse gas. N2O from fluidised bed boilers can be in the order of 50-200 ppmv, the number being very sensitive to coal properties. CO and unburnt hydrocarbon emissions are low due to good solid/gas mixing and long residence times in the bed. The most common particulate control mitigating measures for FBC boilers is fabric filtration. By using a properly designed fabric filter system, emission regulations can be maintained with low to moderate pressure drops in addition to ensuring good bag life. Fluidised bed combustion generates considerable quantity of solid by-products, whose chemical and physical properties are different from the solid by-products of pf combustion. Containing spent sorbent material, CFBC residue is rendered unsuitable for the main pf combustion by-product market. CFBC residue typically can contain 7-74% unreacted CaO and CaSO4. The high pH of these residues can complicate ash disposal which is usually disposed of in landfills. A lack of familiarity with FBC residues may lead some licensing authorities to adopt a conservative attitude and insist on stringent associated regulatory precautions to be implemented before disposal to landfill, in particular requirements for additional precautions to prevent lechate from entering the ground water table.
2.1.5. Demonstrated Commercial Performance Detailed objective commercial and operational performance data for fluidised bed combustion is not readily available. This is especially true for markets where this technology has largely been superseded by advances in supercritical pf combustion. Fluidised bed combustion serve a niche market for inexpensive and easily procured problem fuels. Vartan is a CHP plant providing district heating to the Stockholm area in Sweden. The PFBCs are required to operate at base load from October to May, although there are frequent cycling operations. The units are available for maintenance during the summer months. In the period to May 1996, unit P4 which was commissioned early 1990 had accumulated 14,500 hours; most of this operation was during the district heating season represented a capacity factor of ~50%. The Tidd PFBC was constructed as a demonstration plant and after the planned 4 years of operation was decommissioned in March 1995 having accumulated over 10,000 hours of coal-fired operation, the longest continuous run was 1079 hours in 1994. Availability in 1994 was 55% with many problems being encountered during the first years of operation resulting in very poor availability and requiring major changes to the configuration of the hear transfer surfaces.
2.1.6. Efficiency Fluidised bed combustion is a mature technology for the combustion of difficult fuels and can make a contribution in the short to medium term. If IGCC and advanced/ultra - supercritical fossil fuel technologies reach their potential then fluidised bed technologies are likely to be superseded after 2020.

TECH/JJB/657/06 December 2006 Issue Final
17
RWE Power International
Fluidised bed combustion in use today is particularly suited to burning low-grade coal e.g. lignite of variable ash and water content. Fluidised bed combustion at elevated pressure (PFBC) typically 12 bar can result in efficiencies of 44%.
2.1.7. Technology Status Circulating fluidised bed combustion is a mature technology with several hundred units of <100MWe operational worldwide. However large sub and supercritical PC boilers which benefit from economies of scale are still the most competitive coal fired boilers for utilities. Fluidised bed combustion is a mature technology and can make a contribution in the short to medium term. Newer forms of fossil fuel technologies such as ultra supercritical PC combustion and IGCC will supersede PFBC.
2.1.8. Current Plant All CFBC units in operation worldwide with the exception of Lagisza (Poland) are sub-critical. The Gardanne CFB plant in France rated at 250MWe (gross), 237MWe (net) is a sub-critical single reheat, natural recirculation drum boiler with steam conditions of 169 bar, 567/565oC. Designed for a net efficiency of ~37.5% It burns a local high-sulphur (3.7%) sub-bituminous coal containing 28-32% ash. SO2 emissions are guaranteed at <400mg/m3 which equates to 97% desulphurisation efficiency. First synchronisation occurred on 29th October 1995 with full load achieved 13th November 1995. The plant has been in commercial operation since April 1996. The station is quoted to operate as a semi-base loading plant with up to 70 stops/starts per annum; equivalent to ~3300 equivalent full power hours per year. In Korea two 200MWe CFBC units were commissioned in 1998 and 1999 to consume locally available high-ash anthracite coals (Ash 40-45%, Sulphur 0.6-1.5%). Three 233MWe units have been constructed in Poland to burn locally mined lignite - TurÓw brown coal.
2.1.9. State-of-the Art Fluidised Bed Supercritical Steam Cycle Developments
Poludniowy Koncern Energetyczny SA (PKE) – Poland has contracted Foster Wheeler Energia to engineer and build the world’s largest and first supercritical CFB unit; a 460MWe supercritical unit, sited at Lagisza in southern Poland. Net efficiency is quoted as ~43%. The boiler is a low mass flux Benson vertical once-through supercritical boiler developed by Siemens and licensed to Foster Wheeler. Using locally produced bituminous coal with the additional capability to burn coal slurry from nearby mines, the unit can be considered to be a retrofit to replace existing older units on the site. The new unit will be constructed adjacent to the old boilers and will utilise many of the existing plant infrastructure including coal handling and water treatment. The fuel specification is illustrated below.
Parameter Unit Bituminous Coal Coal Slurry LHV MJ/kg 18 - 23 7 – 17 Moisture % 6 – 23 27 – 45 Ash % 10 – 25 28 – 65 Sulphur % 0.6 – 1.4 0.6 – 1.6 Chlorine % <0.4 <0.4

TECH/JJB/657/06 December 2006 Issue Final
18
RWE Power International
Valued at €150 million, mechanical erection of the new plant was scheduled for completion in February 2006, and commercial operation for the end of September 2006. It is unclear whether this unit will be commissioned on time, and will require several years of operational experience of this new state-of-the art plant to permit an objective assessment of its success. Alstom Power is engaged in the conceptual development of a 600MWe supercritical circulating fluidised bed boiler and power plant, with supercritical steam parameters and once-through boiler technology. Scale-up methodologies based on the operational experience of existing CFBs are applied to this new design. It could not be ascertained if a customer has been selected to host a technology demonstration plant.
2.1.10. Future Development Remaining problems with CFBC are related to capital cost and efficiency of current units. If CFBC is to compete in major utility markets, then a reduction in capital cost and improvement in efficiency need to be achieved. CFBC units have been promoted on a premise of being broadly equivalent in cost and performance with small sub-critical pf units fitted with FGD and SCR and have the advantage of being able to utilise low rank/low grade coal. With increasing unit size, economies of scale tend to cancel CFBC’s initial cost advantage. Multiple units of CFBC are required to compete with an average single-sized pf unit installation. For units >250MWe, the efficiencies of modern supercritical pf combustion and IGCC exceed the performance of PFBC. PFBC future looks uncompetitive with ABB selling its interest in power generation including the Finspong research and development facility to Alstom, which does not consider PFBC technology as one of their future core products. Opportunities will continue to arise for small CFBC units to take advantage of competitively priced low-grade fuels. Further development is required for CFBC technology to compete in the utility coal technology sector currently dominated by sub and supercritical pf plant. Larger CFBC units have been competitive to-date as a result of attracting subsidies for replacing old heavy polluting units and the low-cost (sometimes subsidised) local fuel supplies. Alstom’s acquisition of ABB’s interest in CFBC and PFBC has reduced the drive for fluidised bed technology in Western Europe. After their initial investment in Emile Huchet and Gardanne, EDF believe they have sufficient coal-fired capacity for the foreseeable future and do not envisage funding a new large CFBC unit. Foster Wheeler appear to have also reduced their emphasis on their CFBC, however, the Foster Wheeler/Siemens concept for a supercritical ‘compact’ CFBC appears to offer a route to units that would have the fuel flexibility of CFB’s combined with supercritical pf plant efficiency. PFBC approach has been applied as demonstrators in a few locations. However conventional PFBC is currently without a champion in the utility sector. 2nd Generation PFBC cycles are hybrid systems incorporating higher temperature turbines with supplementary firing of coal-derived gas after the combustor and are under development in Japan. These systems combine features of both PFBC and IGCC but have yet to reach demonstration scale. CFBC still have outstanding problems related to capital cost and efficiency for utility scale units. To compete in major utility markets require reductions in capital costs

TECH/JJB/657/06 December 2006 Issue Final
19
RWE Power International
and improvements in thermal efficiency. Reliability will be an important feature of demonstration programmes to show that the plant availability is not compromised by the increased sophistication needed to deliver improved efficiency. The absence of current private sector interest in producing and promoting PFBC technology could foreclose this as a technology option.
2.1.11. Economic Facts Numbers quoted for the technology capital cost, fixed and variable O&M costs vary depending upon the selected source of information. To present an objective and independent assessment, the capital, fixed and variable O&M costs for fluidised bed combustion plant are based on a 2005 study prepared for the US EPA (EPA 2005).
Parameter Unit Cost Capital Cost
PFBCCFBC
€/kWe 800 - 1040 680 - 880
Fixed O&M Cost PFBCCFBC
€/kWe-year 32 - 56 24 – 30
Variable O&M CostPFBCCFBC
€c/kWhe 0.16 – 0.32 0.16 – 0.4
3. Integrated Gasification Combined Cycle (IGCC) 3.1. Introduction
Integrated Gasification Combined Cycle – IGCC systems are among the cleanest clean-coal electricity generation technologies. They have the added advantage of accepting a diverse fuel diet comprising coal, petroleum coke, residue oil, biomass and municipal solid waste. Benefits of IGCC include
1. gas cleaning before combustion permits the use of high efficiency combined cycle power plants
2. good environmental performance 3. potential for carbon capture before combustion
3.1.1. Description of Process
In an IGCC process, heating in a sub-stoichiometric oxygen atmosphere gasifies the fuel. The gas is then fed to a gas turbine and the exhaust heat is used to raise steam for powering a steam turbine. Due to the high volatile contents matter, lignite coal if dry, is easier to gasify compared to bituminous coals, though gases produced from lignite coals are lower in calorific value. Figure 4 (Maude 1993) illustrates the H&M balance for an IGCC with supercritical steam conditions of 240bar/565/565oC utilising an oxygen blown, wet feed entrained flow gasifier and cold gas cleaning.
Figure 4: H&M Balance for Supercritical IGCC Plant

TECH/JJB/657/06 December 2006 Issue Final
20
RWE Power International
3.1.2. Current Commercial Gasifier Development
Gasifiers are pressure vessels and cannot be fabricated on-site. Large gasifiers require complicated logistical arrangements for transportation and fabrication. Gasifiers are of three types: 4.1.2.1 Fixed Bed gasifiers (known as moving bed in the USA) consist of beds of fuel through which air or oxygen for gasification is blown. Fixed beds have limitations on the properties and the size range of the fuel, sometimes requiring some fine coal to be briquetted to avoid gas channelling. Lurgi is considered the technology market leader for large fixed bed gasifier technology. Their BGL gasifier – oxygen blown version exhibits a high ratio of chemical energy to sensible heat in the product gas and is particularly applicable for power plants applications. A very important factor in any economic evaluation of BGL gasifiers is the quantity of limestone introduced as a fluxing agent, with a possibility that the quantity required may exceed the levels for flue gas desulphurisation using conventional post-combustion flue gas cleaning in a FGD unit. 4.1.2.2 Fluidised Bed gasifiers use coal ground to a few millimetres diameter and are best suited for low-ash brown coals. The development of large fluidised bed gasifiers was led by Uhde. 4.1.2.3 Entrained gasifiers use pulverised coal blown into the gasifier vessel in a manner similar to pf power stations. Achieving low nitrogen concentrations is important and is achieved by using oxygen or highly enriched air as the oxidising agent. This technology was developed in parallel for coal, petroleum coke and oil feedstocks. Texaco, Shell (GE has purchased Texaco technology), Dow (now Conoco Phillips) and Krupp Koppers are the leading technology developers. Entrained gasifiers are the most popular choice for IGCC plants due to their ability to handle a wide range of solid and liquid fuels. Oxygen needed for gasification can be separated from air (which consists of 80% nitrogen, 20% oxygen). This requires expensive air separation units and additional energy requirements. Oxygen plant capital and operating costs are sensitive to plant
Compressor Gas
Turbine
Combustor
ASU
Gasifier 240 bar/540/540 oC
Oxy
gen
Air
Air
Coal
Gas Cleaning
Raw Gas
Syn-Gas
Steam Turbine
Steam
HRSG Stack
Steam
Coal = 136.3 t/hr 943.1 MWt hhv
212.5 MWe
Gross = 442.7 MWe Auxiliary power = 62.0 MWe Net output = 380.7 MWe
Cycle η (%) = 40.4 HHV 42.3 LHV
Carbon = 222 g/kWhr CO2 = 814 kg/MWhr
Limestone 4.1 t/hr
solid 12.4 t/hr
Sulphur 0.3t/hr
230.2 MWe

TECH/JJB/657/06 December 2006 Issue Final
21
RWE Power International
size. Recent large gasification projects have preferred oxygen-blown gasifiers to air-blown gasifiers.
3.1.3. Environmental Performance In the IGCC process coal is gasified to produce a syngas. Sulphur dioxide, mercury and particulate matter is removed from the syngas prior to combustion in the gas turbine. The removal of sulphur in its elemental form from the syngas using standard refinery technologies is more efficient than back-end flue gas FGD techniques. Further development of gas turbine combustion systems specifically for IGCC applications will result in NOx emissions reaching levels comparable with modern high efficient CCGT plants. IGCC plant specified with an additional water-gas shift reaction can capture CO2 from the syngas prior to combustion in the gas turbine.
3.1.4. Efficiency The energy losses during the gasification process are balanced by the high efficiency combined cycle unit. This results in an overall conversion efficiency of approximately 80% and is therefore comparable to advanced supercritical pf plant. First generation IGCC plants achieved 40-45% cycle efficiencies. With steady increases in CCGT technology, there is potential for IGCC to achieve 50% cycle efficiencies.
3.1.5. Current Plant Elcogas sited in Puertollano – Spain is a 318MWe IGCC and is among the most efficient IGCC plant currently operating, in spite of the low-grade fuel diet and high ambient temperatures. With a net power output of ~280MWe, the cycle gross efficiency is 47% (LHV) (Net ~ 42.2%). This high efficiency has been achieved at high capital cost and the plant is particularly challenging to operate at high load factors or with fast start-ups. It utilises a Krupp Koppers dry-feed gasifier, a high degree of process integration for efficiency and a modern high efficiency Siemens V94.3 gas turbine. All of the air for the oxygen Air Separation Unit – ASU is extracted from the gas turbine compressor. The fuel is a mixture of 70:30 low-ash high-sulphur petroleum coke (5.4% sulphur, 0.3% ash) and local high-ash low sulphur bituminous coal (~47% ash, 0.7% sulphur). The fuel is ground and fed to the gasifier with limestone as flux. The Elcogas plant consists of three main units; the power island, gasification island and oxygen production (Mills 2006). The high level of plant integration and optimisation comprises:
• All air required for the ASU – Air Separation Unit is extracted from the gas turbine compressor
• Waste nitrogen produced in the ASU is mixed with the syngas prior to feeding to the gas turbine in order to decrease NOx formation and increase output
• The high temperature air (400oC) extracted from the gas turbine compressor is used to heat the waste nitrogen and to prepare the water injected into the clean gas saturator
• There is complete integration between the combined cycle water/steam systems and the gasification island. The water used to feed the gasification steam generator comes from the combined cycle. Excess steam produced in the gasification island is sent to the combined cycle, is reheated in the HRSG and expanded in the steam turbine after the internal steam consumption has been met.

TECH/JJB/657/06 December 2006 Issue Final
22
RWE Power International
With civil work commencing in October 1993, the associated CCGT unit was first synchronised to the grid in August 1996 using natural gas. Coal was first introduced to the gasifier in December 1997 and the first syngas delivery to the gas turbine was on 20th March 1998. Figure 5 (Mills 2006) provides an illustration of the arrangement for Elcogas Puertollano IGCC.
Figure 5: Puertollano IGCC Arrangement
3.1.6. Demonstrated Commercial Performance of Puertollano IGCC The commercial performance and operational data for Puertollano IGCC has been extracted from public domain information (Peńa 2004), and is therefore limited in its extent. Table 7 illustrates the fuel composition, Table 8 power output and emissions. Figures 6 and 7 illustrate the emissions performance for Puertollano in 2003 and Figure 8 illustrates electricity generation data for 1998 – 2003. Due to the high integrated nature of the Elcogas plant, start-up is comparatively slow like the Buggenum plant. Start-up on natural gas to establish combined cycle operation takes two hours. The ASU is then started which takes between six hours and three days, depending on its temperature to achieve normal operation. The gasifier takes four hours to come on-line; the minimum start-up time is therefore 12 hours but could be longer (Mills 2006). Although this high integration enables high efficiency operation, the operational performance of the plant is compromised as illustrated in Table 9 and Table 10 (Mills 2006). During 2000 and 2001 the plant availability was ~60%, which is considerably below the availability levels required for commercial plant. By late 2004, the IGCC unit was operating at 93%, the gasifier as 82% including start-ups.
ASU
Nitrogen
Oxygen
Coal Coke
Coal Dust
Gasifier
Slag
Gas Cleaning
Stri
pper
Syn-gas
Que
nch
gas
Oxygen Air
Sour gas
Sulphur recovery (Claus)
Sulphur
Sulphur removal
Gas conditioning
Rec
ycle
gas
Claus gas
Air
nitrogen
Compressed air combustor
GT
HRSG
Clean gas ST

TECH/JJB/657/06 December 2006 Issue Final
23
RWE Power International
Table 7. Puertollano Power Plant Main Fuel Data
Fuel Parameter(%wt)
Coal Petroleum Coke
Moisture 11.8 7.0 Ash 41.10 0.26 Carbon 36.27 82.21 Hydrogen 2.48 3.11 Nitrogen 0.81 1.90 Oxygen 6.62 0.02 Sulphur 0.93 5.50 LHV (MJ/kg) 13.10 31.99
Table 8. Puertollano Power Output and Emissions
Parameter Units Value Gross Output MWe 317.7
Gas Turbine MWe 182.3 Steam Turbine MWe 135.4
Net Output MWe 282.7 Gross Efficiency % (LHV) 47.12 Net Efficiency % (LHV) 42.2
Figure 6: Emission Operational Data for Natural Gas
Figure 7: Emission Operational Data for Coal-Gas
Natural gas (mg/Nm3 at 6% O2, dry)
29.2
4.2
291.7246.1
0.18.7
0
50
100
150
200
250
300
SO2 NOx Particles
EU Directive 88/609/EECELCOGAS Permit limitsELCOGAS 2003 average

TECH/JJB/657/06 December 2006 Issue Final
24
RWE Power International
Figure 8: Electricity Generation During 1998 - 2003
Table 9. Elcogas Availability Statistics 2003 – 2005
IGCC Gasifier Power Block ASU Time (%) 2003 2005 2003 2005 2003 2005 2003 2005 Availability 65.8 50.8 69.2 78.7 90.7 80.3 79.7 94.1 Planned outages 9.6 5.1 8.1 5.6 3.3 6.0 4.8 3.9 Unplanned outages 24.6 44.1 15.2 15.7 4.1 13.8 3.3 2.0
Table 10. Elcogas Unavailability during 2005
IGCC, NGCC & TOTAL YEARLY PRODUCTION
335
911
1.3911.595
1.371
2.146
744
836
622
321
343
180
9
301
0
500
1.000
1.500
2.000
2.500
1998 1999 2000 2001 2002 2003 2004 aim
YEAR
GW
h
NGCC GWh
IGCC GWh
major overhaul
752
1,171
1,533
1,712
1,938
1,672
2,326

TECH/JJB/657/06 December 2006 Issue Final
25
RWE Power International
Section Cause Contribution (%) Overall (%)Coal milling and mixing plant 1.8 Sulphur recovery and tail gas recycle 7.7 Dry de-dusting and fly ash systems 2.9 Quench gas recirculation 1.8 Water-steam system and boilers 36.8 Wet gas treatment 3.0 Slags 15.9 Start-up burner and flame monitors 10.1
Gasifier
Coal dust conveying and feeding 10.0
42.7
Gas turbine 66.5 Water-steam cycle 24.0 Combined
cycle Gas saturator 9.5 24.6
Pure nitrogen production 13.4 Oxygen production 15.9 ASU Waste nitrogen production 70.7
6.3
Electrical systems 71.0 Auxiliary systems 8.0 BOP Distributed control system 21.0
26.4
The fuel mixing and grinding plant have presented a number of difficulties relating to clogging of the mills, mixing conveyors and lack of hardware quality. The pressure control and fluidised stability systems of the pulverised fuel feed system performance has been improved by implementing design changes and preventative maintenance procedures. Gasifier related problems have included:
• Water leakage of membrane tubes due to flow blockages or local erosion • Changes made to the distributors to overcome design deficiencies • Incidence of gas leakage caused by erosion in pipes. Overcome by utilisation of
improved materials and the implementation of measures to avoid ‘cold ends’ and downtime corrosion
3.1.7. State-of-the-Art General Electric (GE) acquisition of Texaco gasification technology in 2004 has made GE the first equipment manufacturer with the ability to supply both of the key components of an IGCC plant; the gasification and power generation technology. GE has formed an alliance with Bechtel to deliver “reference 630MW IGCC” plants. This reference plant is designed to gasify 5000 t/day US bituminous coal and utilises two GE 7FB gas turbines to generate 630MWe net power output, and 38.5 – 40% net cycle efficiency. This setup is designed to achieve an optimum economic arrangement i.e. capital cost and not maximum cycle efficiency. The Cold Water slurry feed system and raw gas coolers are optimised for cost and reliability and not efficiency. Estimated NOx is 15ppmv (corrected to 15% O2); 5ppmv can be achieved with the additional installation of an SCR unit. No demonstration project has been announced, and it will be several years following the commissioning of the first demonstration unit before an objective assessment of its performance can be made.
3.1.8. Potential for Future Deployment The capital cost of IGCC plants are approximately 20% higher than conventional pf supercritical plant. Current IGCC demonstration plants have efficiencies of 45%.

TECH/JJB/657/06 December 2006 Issue Final
26
RWE Power International
50% efficiency is expected to be achievable by 2020 and may be exceeded post 2020. The second generation of IGCC plants may have electricity generating costs comparable to supercritical pf plant.
The high capital cost and a number of technical issues are limiting the extensive adoption of IGCC plants. These require substantial R&D efforts. Although the fuel flexibility of IGCC plant makes this technology very attractive, the benefits do not presently outweigh cost of capital and operational reliability.
Research is needed to resolve a range of technical issues related to gasifier size and maintenance requirements, heat transfer, hot gas clean-up, gas composition and combustion, waste-water treatment and especially the degree of process integration. Further technological progress is required in the suitability and integration of the gas turbine unit and advances in oxygen generation processes.
IGCC will not be widely introduced until demonstration projects provide sufficient evidence of high plant utilisation and availability, with capital and O&M costs comparable to supercritical steam cycles.
Two major gas turbine manufacturers; General Electric in partnership with Bechtel and Siemens in partnership with German gasifier developers are preparing reference plant designs which should yield higher efficiencies compared to existing IGCC plants and are aimed at reducing costs to levels comparable to supercritical pf plant.
For the successful adoption of second generation IGCC plants and to compete with supercritical pf plant will require capital costs of <€1200/kWe, and net efficiency exceeding 48%. IGCC will benefit from advances in gas turbine technology and should approximate 50% IGCC cycle efficiency by 2020.
3.1.9. Economic Facts Coal fired IGCC plants are expensive. Typical IGCC costs are approximated at €1370/kWe compared with €1020/kWe for supercritical coal fired power plants and €580/kWe for gas fired CCGT. IGCC dominates in scenarios where security of electricity supply, ability to use local low-grade fuels in combination with stringent environmental constraints and long-term financial structure with reliable return on capital dominate. The inherent high moisture and low heat content of Greek lignite coals require the gasifier fuel feed to be dry and, may necessitate the requirements for lignite pre-drying. The syngas produced by the gasification of coals is highly corrosive at high temperature and can lead to metallic component life concerns. Low sulphur and low chlorine coals are therefore favoured to minimise corrosion. Operations and maintenance costs for IGCC plants are comparable with the O&M costs of supercritical pulverised coal plant and CCGT plant combined. These operations, maintenance and capital costs can only be justified in cases where environmental, fuel cost or grant/subsidy initiatives outweigh the other cost penalty.
Parameter Unit Cost Capital Cost €/kWe 960 - 1370 Fixed O&M Cost €/kWe-year 24 - 36 Variable O&M Cost €c/kWhe 0.04 – 0.16
TECH/JJB/657/06 December 2006 Issue Final
27
RWE Power International
4. Power Plants with CO2 Carbon Capture 4.1. Introduction
The carbon capture and sequestration process consists of three separate processes; the separation and capture of CO2 from power plants, CO2 transportation to the final destination and CO2 storage. Transportation is reasonably well established, whilst capture and storage requires demonstration. CO2 capture is the most expensive and least established technology. All aspects including transportation may be difficult to permit.
4.1.1. Capture Technology There are currently 3 main technology options for the capture of CO2 from power plants:
• Pre-combustion capture • Oxy-fuel combustion • Post-combustion capture
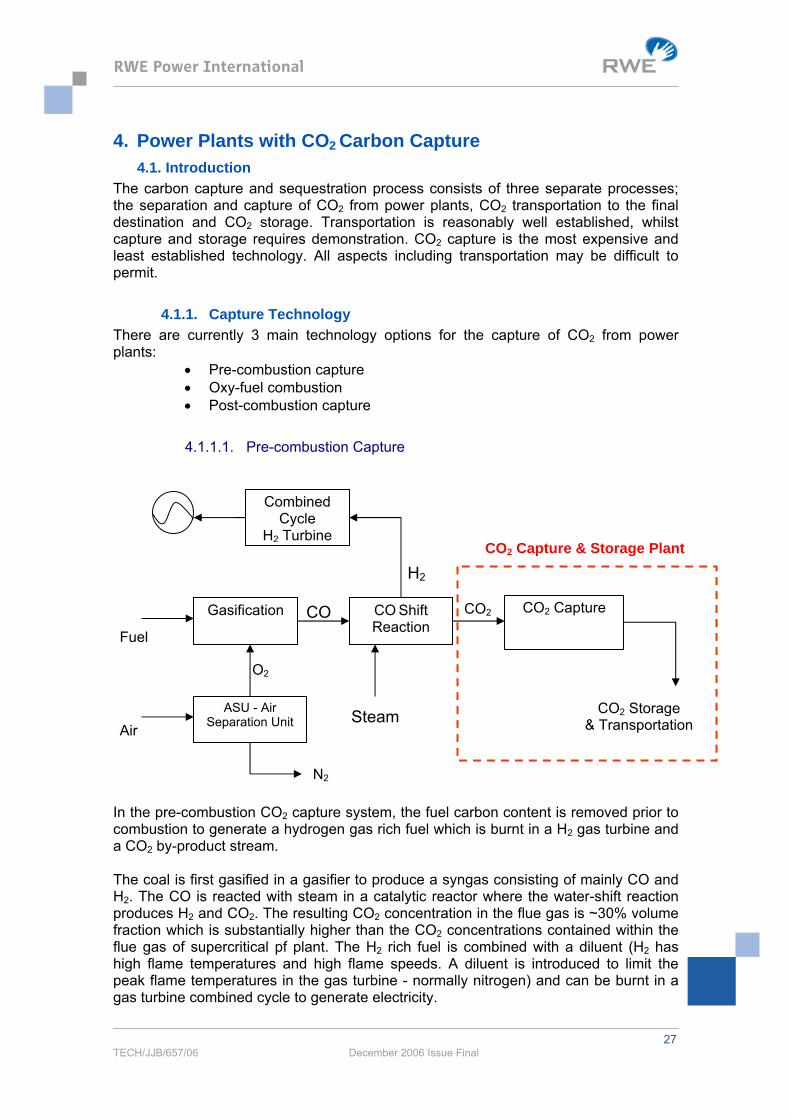
4.1.1.1. Pre-combustion Capture
In the pre-combustion CO2 capture system, the fuel carbon content is removed prior to combustion to generate a hydrogen gas rich fuel which is burnt in a H2 gas turbine and a CO2 by-product stream. The coal is first gasified in a gasifier to produce a syngas consisting of mainly CO and H2. The CO is reacted with steam in a catalytic reactor where the water-shift reaction produces H2 and CO2. The resulting CO2 concentration in the flue gas is ~30% volume fraction which is substantially higher than the CO2 concentrations contained within the flue gas of supercritical pf plant. The H2 rich fuel is combined with a diluent (H2 has high flame temperatures and high flame speeds. A diluent is introduced to limit the peak flame temperatures in the gas turbine - normally nitrogen) and can be burnt in a gas turbine combined cycle to generate electricity.
ASU - Air Separation Unit
Gasification
O2
Air
N2
Fuel
CO Shift Reaction
CO2 Capture CO2
CO2 Storage & Transportation
CO2 Capture & Storage Plant
Combined Cycle
H2 Turbine
CO
Steam
H2

TECH/JJB/657/06 December 2006 Issue Final
28
RWE Power International
The individual components of the pre-combustion capture concept have been successfully used in the process industry for many years, however their successful integration in the electricity generation industry needs to be demonstrated if this technology can be applied to power stations with acceptable reliability, availability and economical profiling. Table 11 (VGB 2004) illustrates data for an IGCC plant with CO2 capture based on gas turbine technology available in 2003.
Table 11. Comparison of IGCC and Pre-Combustion Capture
Parameter Units IGCC Base Case
IGCC with CO2
Capture Plant Rating MWe 776 676 Net Efficiency LHV (%) 43 34 CO2 Emissions Kg/MWh el 763 142 Captured CO2 Kg/MWh el - 809 Avoided CO2 Kg/MWh el - 621 Investment €/kWe 1370 1860 O&M Costs €/kWe 12 16
Current IGCC concepts are optimised to achieve optimised electricity generation efficiency and will therefore have to be modified for syngas applications with CO2 capture; this requires a different gasification train. The technology is well established but commercial competitiveness, reliability and flexibility to deliver the requirements of a base load power plant will need to be demonstrated.
4.1.1.2. Oxy-fuel Combustion
Nitrogen is removed from the air using an air separation unit. The coal is combusted in an atmosphere of high oxygen concentration and recycled CO2 rich flue gas (to control combustion temperature). The flue gas consists mainly of CO2 and water vapour which can be condensed to give a highly concentrated CO2 stream (90-95%) for subsequent transport and storage.
ASU - Air Separation Unit
Boiler
O2
Air
N2
Fuel
Flue Gas Treatment
Particulates
SOx
CO2 Condenser & Compressor
CO2
CO2 Transportation & Storage
CO2 Capture & Storage Plant
Steam Turbine

TECH/JJB/657/06 December 2006 Issue Final
29
RWE Power International
The cost data illustrated in Table 12 (Allam et al.) is based on a new build 740MWe
(gross) Advanced Supercritical pf coal fired power plant with steam conditions comprising 290bar/600/620oC and fitted with SCR and FGD. Table 13 (VGB 2004) further illustrates the efficiency penalty of oxy-fuel CO2 capture technology and the associated costs estimates for Lippendorf supercritical lignite power station with FGD and SCR fitted if it is fitted with oxy-fuel combustion.
Table 12. Oxyfuel Combustion Comparative Costs for Hard Coal
Parameter Units Supercritical non-oxyfuel
Oxy-fuel Combustion With CO2 Capture
Fuel Input kg/s 59.19 58.09 Fuel Heating Value (LHV) MJ/kg 25.86 25.86 O2 Input t/day - 10,373 Gross Electrical Output MWe 740 737
ASU Power MWe - 87 CO2 compression
and purification MWe - 65
Auxiliary power MWe 63 53 Net Electrical Output MWe 677 532 Gross Efficiency % (LHV) 48.3 49.06 Net Efficiency % (LHV) 44.2 35.4 Loss Due to CO2 Capture % Points - 8.8 CO2 Captured kg/MWh - 831 CO2 Emissions t/h 489 45 Investment Cost €/kWe
(gross)
1153 1409
Table 13. Oxyfuel Combustion Comparative Costs for Lignite Coal
Parameter Units Lignite non-
oxyfuel
Oxyfuel Lignite with
CO2 Capture Plant Rating MWe 865 681 Net Efficiency LHV (%) 43 34 CO2 Emissions Kg/MWh el 858 6 Captured CO2 Kg/MWh el - 1085 Avoided CO2 Kg/MWh el - 852 Investment €/kWe 1270 1790 O&M Costs Fixed % of investment
Variable
%/yr
€/MWth fuel
2.3 1.6
2.3 1.6
4.1.1.3. Post-Combustion Capture

TECH/JJB/657/06 December 2006 Issue Final
30
RWE Power International
In post-combustion capture, the CO2 is extracted from the power station flue gas using commercially available CO2 separation technologies. Typically capturing CO2 from the flue gas using absorption in an aqueous amine solution, the CO2 is stripped from the amine solution and dried, compressed, purified and transported to the storage site. A substantial amount of heat is required in an amine system to regenerate the solvent. Solvent regeneration temperature is typically 120oC. The recovery of CO2 from the rich amine stream is very energy intensive and therefore requires substantial quantities of low pressure stream extracted from the power plant steam turbine cycle in addition to the high power usage for compressing large volumes of flue gas to overcome absorber pressure losses. This results in significant reductions in the electricity available for export. Flue gas SO2 levels must be restricted to 10ppmv which requires the provision of high efficiency FGD technology, and NOX must similarly be restricted to 20ppmv via the use of SCR technology. Table 14 (VGB 2004) illustrates the efficiency, investment and cost data for a supercritical plant fired with hard coal as the base case and the resulting efficiencies when the same plant is fitted with post-combustion CO2 amine absorption technology. The cost of CO2 transport and storage are not included in the analysis. Supercritical pf coal plant is commercially well established for power production, efficiencies and cost data correspond to state-of-the-art in year 2000.
Table 14. Comparison of Post-Combustion CO2 Capture Technology
Parameter Units Pf Base Case
PF with CO2 Capture
Plant Rating MWe 500 362 Net Efficiency LHV (%) 46 33 CO2 Emissions Kg/MWh el 722 148 Captured CO2 Kg/MWh el - 850 Avoided CO2 Kg/MWh el - 574 Investment €/kWe 1020 1855 O&M Costs €/kWe 7 13
4.1.2. Efficiency The capturing of CO2 from coal fired power plants requires energy which inevitably results in higher fuel consumption, and by association, impacts upon and reduces the
Boiler
Steam Turbine
Flue Gas Treatment
CO2 Capture & Separation
SOx, NOx, ParticulatesCO2 Storage & Transportation
CO2
Flue Gas
Post-Combustion CO2 Capture Plant
Air
PF Fuel

TECH/JJB/657/06 December 2006 Issue Final
31
RWE Power International
overall plant efficiency. In combination with the requirements of additional plant items, the specific investment cost €/kWe is increased. Overall the cost of generating electricity is also increased. CO2 capture cost is also dependent upon the fuel cost. A cheaper fuel gives a lower capture cost. Table 15 (VGB 2004, IEAGHG 2005) illustrates examples of efficiency impact and investment costs for carbon capture technology. Power plants with CO2 capture technologies and the optimisation of power plant concepts with/without CO2 capture are continuously being developed. Supercritical pf and IGCC technology development and improvements are leading to higher electric efficiencies and reduced specific investment costs. For future plants, CO2 capture efficiency and cost penalties will be lower.

TECH/JJB/65706 July 2006 Issue: Final Final Error! Reference source not found.
32
RWE Power International
Table 15. Examples of Reported Efficiencies and Costs for Power Plants with CO2 Capture
Capture Technology
Fuel Power Plant Type
Reference Plant Size (MWe)
Electrical Efficiency
Net (%)
Electricity Cost (€/kWh)
(Specific Investment €/kWe)
CO2 Avoidance
Cost (€/tCO2)
Original With CO2 Capture
Original With CO2 Capture
Original With CO2 Capture
IGCC F-class technology
IEAGHG 2000 408 382 46 38 4.8 (1470)
6.9 (2200)
37
IGCC F-class technology
IEAGHG 2003 776 676 43 34 4.8 (1370)
6.3 (1860)
24
Pre-combustion capture (Physical absorption)
Coal
IGCC H –class technology (available 2020)
IEAGHG 2003 879 776 49 43 4.0 (1130)
4.5 (1250)
9
Oxyfuel Combustion Coal
Supercritical PF IEAGHG 2005
865 697 43 34 4.1 (1261)
6.1 (1952)
31
Post-combustion capture (Amine scrubbing)
Coal Supercritical PF IEAGHG 2000 500 362 46 33 3.7 (1020)
6.4 (1860)
47

TECH/JJB/657/06 July 2006 Issue: Final Error! Reference source not found.
33
RWE Power International
4.1.3. Technology Status For post-combustion capture systems, an amine or ammonia scrubbing process are the only technology that appears to be available approaching the scale required for CO2 capture from power plants. Process modifications must be achieved to overcome particular problems associated to the low concentration of chemical species present in the flue gas from coal fired power plants. Though published information highlight the feasibility of amine scrubbing, most of the suggested modifications have yet to be demonstrated at large commercial scale. As yet there is no large scale commercially operating power plant with post-combustion carbon dioxide technology. In total, numerous concepts for CO2 capture from electricity generating power plants have been proposed. These concepts are in various stages of development and are associated with a range of time frames for possible commercial application in power plants. These concepts do require considerable research and development effort prior to commercialisation. Pre-combustion, oxy-fuel and post-combustion CO2 capture processes should become commercially available during the middle of next decade. Carbon capture ready supercritical pf plants can be constructed by 2015 without the associated post-combustion CO2 capture process which may be retrofitted at a latter stage. Other proposed methods for the capture of CO2 from power plants include Ammonia Scrubbing, Cryogenic Frosting, and P-and-T Swing Adsorption. The merits of these proposed techniques are discussed in Table 17 (O’Nions 2006).
4.1.4. Supercritical PF Plant with Post-Combustion CO2 Capture New advanced supercritical plants can be designed to be CO2 capture ready, and should the requirement become necessary can be retrofitted with a CO2 capture plant. The retrofitting of carbon abatement technology to an existing coal-fired power plant minimises capital expenditure. The integration of existing site infrastructure (grid, water abstraction, fuel infrastructure – delivery, handling and storage), reduces permitting requirements compared with a new-build Greenfield site, the utilization of site-personnel permits quicker commissioning and also enable costs to be reduced. Table 16 (DTI 2006) illustrates indicative costs for new build and retrofit CO2 capture plant. These costs are based on European estimates and differ from the US EPA costs.
Table 16. Cost of CO2 Retrofit Plant
Case Investment Cost(€/kWe)
Cost of electricity(€c/kWh)
New build supercritical coal capture ready*
1239 4.0 – 4.5
New build supercritical with CO2 capture* 1568 5.0 – 5.5 Retrofit to supercritical steam conditions (without CO2 Capture)**
517 – 796 2.3 – 3.6
Retrofit to supercritical steam conditions (with CO2 Capture)**
868 – 1146 5.5 – 6.1
* €/kWe not allowing for energy use in the capture process feeding through to a higher specific capital cost ** Numbers very sensitive to condition of plant and what can be reused

TECH/JJB/657/06 December 2006 Issue: Final Error! Reference source not found.
34
RWE Power International
Table 17. Merits of Carbon Capture Technology
IP steamrequired
Reagentmake up
Sensitivity toSOx and NOx
CO2compression
Air sepunit
Rejectheat
Refrig-eration
Industrially proven in food industry with many of thecapture issues already known about
Requires 10 fold scale-up for USC needs andscaling may introduce new issues
The extent to which IP steam requirementmay change as amine development continues
Major studies for USC plant using amine underwayProject 407 should highlight implementation issues
High stream requirement for regenerationMEA regeneration = 825Btu/lb CO2
The effect of contaminants such as Hg and ashand the corrosion issues of amines/K2CO3
Amine reagent development improving CO2 regenerated at low pressure How to achieve the low SOx inlet concentrationand the economics surrounding this
High quality CO2 product High MEA reagent cost and low CO2 loadingon MEA molecule
Rate of reagent make up and cost of theadvanced amines
Requires low SOx entry levels before scrubberThermal integration of power plant and CO2
capture plant
Effect of oxygen unknown
Ammonia is a low cost material and has a high CO2
loadingEarly stage of developmentNot tested on an industrial scale
Suitability of process operation at anythingbeyond small scale CO2 capture
Low steam requirement for regenerationAmmonia reagent regenration = 262Btu/lb CO2
Slow reaction rate between CO2 and reagentmay result in a slightly larger plant
The effect of contaminants such as Hg and ash
Decreased CO2 compression power requirementdue to possible regeneration at higher pressure
CO2 stripping occurs at a low temperaturerequiring some refrigeration plant
Effectiveness of SOx capture using ammoniaprimarily designed for CO2 capture conditions
Possibility to combine CO2, SOx and NOx capture SOx will also react with reagent if notremoved beforehand Rate of reagent make up
High quality CO2 product
Easier to extract CO2 from the flue gas as the maincomponents are CO2 and H20
Requires air separation plant before boiler,meaning CO2 capture cannot be bypassed for ASU maintenance
Being able to achieve low values of air ingress
Potentially lower costIncreases risk for both boiler and CO2 capture technology
PF coal combustion in a CO2 rich atmosphere and issues this may introduce
No reagents required Lower CO2 product quality due to air ingress Effect of higher SOx concentration in boiler and its relation to corrosion
COMAH issues regarding Oxygen storage Is the CO2 product quality of importance?Additional treatment for NOx and SOx
Cryogenic separation plants used industrially forair separation and petrochemical industries(ethylene plants for hydrocarbon separation)
Likely to have high equipment capital cost dueto heat exchanger and refrigeration cycle complexity
Effect of scale up from industrial applications to boiler CO2 capture
No chemical reagents required Very low temperatures may require exoticmaterials in some sections
Best method of powering compressor to drive refrigerant (IP Steam, Gas turbine, electricity)
Significant amounts of SOx removed during the processSurface fouling could lower CO2% reductionefficiiency
Can flue gas be cooled to say 40C by river water/air before using refrigerant power?
Solid or liquid phase CO2 requires low compressionpower to reach 100+ bar
Thermal integration with boiler
Small study for 400MW boiler already done by ALSTOMECS (Environmental Control Systems) Overall effect of contaninants and fouling
Solid phase adsorption of CO2 onto zeolites or activecarbon
Not currently suitable for atmospheric boilers,but IGCC would be more appropriate.
Longevity of solid structure with adsorption andregeneration cycling
Potentially economic method of CO2 sequestration inthe right circumstances
Capture efficiency and capital cost
Concerns over H2S
?
CommonalitiesCarbon CaptureTechnology Advantages Disadvantages Uncertainties
?
?P and T swingadsorption
?
?
Aminescrubbing
AmmoniaScrubbing
Oxyfuel
CryogenicFrosting
Gasification + pre-combustion
captureAdditional plant relatively simple IGCC disadvantages Need to balance IGCC efficiency against simplicity
and reliability

TECH/JJB/657/06 December 2006 Issue: Final Final Error! Reference source not found.
35
RWE Power International
Appendix A. Fuel Analysis
Analysis Units ValueProximate analysis
daf coal wt% ar 77.3 ash wt% ar 6.7
moisture wt% ar 16.0 Ultimate analysis
Carbon wt% daf 76.2 Hydrogen wt% daf 5.3
Oxygen wt% daf 12.9 nitrogen wt% daf 1.5 sulphur wt% daf 4.1
HHv MJ/kg (daf) 32.2
Appendix B. Effect of Cooling Water on Cycle Efficiency Design cooling water temperature has a strong influence on the cycle efficiency; it determines the achievable vacuum at the turbine outlet and so strongly affects the degree of expansion and final volumetric flow of the steam. For example, changing the design condenser pressure from 0.005 MPa to 0.003 MPa will result in a 1 percentage point increase in efficiency for a pf combustion plant. For an approach temperature in the condenser of 12oC, a change in condenser pressure from 0.005 MPa to 0.003 MPa corresponds to a change in cooling water inlet temperature from 21oC – 12oC. The primer determinant of achievable condenser pressure is site location. The size of the last stage LP stage is strongly affected by exhaust pressure, the choice of cooling water design temperature can have major implications for the cost of the LP turbine. A trade-off therefore exists between capital cost and achievable efficiency (Henderson 2004).
Appendix C. Power Plant Database All power plant owners operating in competitive de-regulated markets consider the operational data for their power plants to be highly confidential. If this information is revealed to competitors it may lead to changes in the relative positions of competing companies in terms of quantity of generation or position in a "standby queue" (order of merit in traditional single generation company markets). The information in the database is generally based on gross performance. Regions covered include Australia, Europe, USA, Japan and Korea for plants commissioned post 1996. It should be noted that for all entries, reliance is placed on public domain publications and databases. These databases in themselves rely on the goodwill of power plant owners and operators to provide accurate and up-to-date technical information. Due to lack of information available, site specific efficiency, fixed and variable O&M costs, overhaul frequency and EFOR performance cannot be ascertained. Units that comprise a power plant site will have unit specific performance and operational numbers which may be aggregated to a single site value, calculated using unspecified definitions or kept completely confidential.

TECH/JJB/657/06 December 2006 Issue: Final Final Error! Reference source not found.
36
RWE Power International
Each organisation will have a separate definition for EFOR (Enforced Outage Rate, %). No attempt has been made to clarify this definition in the database entries since this information and definition is not being made available in the databases used to compile this report.

TECH/JJB/657/06 December 2006 Issue: Final Final Error! Reference source not found.
37
RWE Power International
5. References: Maude, C., ‘Advanced Power Generation – A Comparative Study of Design Options for Coal’, IEA Coal Research Report, Report No. IEACR/55. London, March 1993 EPA., ‘Multipollutant Emission Control Technology Options for Coal-fired Power Plants’, United States Environmental Protection Agency – EPA, Report: EPA-600/R-05/034, March 2005. DTI 2006., ‘Advanced Power Plant Using High Efficiency Boiler/Turbine’, Dti Best Practice Brochure, Carbon Abatement Technologies Programme, Report BPB010, January 2006.
National Power – NP., ‘Consultancy Service on Modern Steam Power Plant Sub-critical or Supercritical’, Ref 639, Final Report – no: Notat EP93/453b May 1993. Kjaer, S., ‘Advanced Super Critical Power Plant; Experience of Elsamprojekt’, Elsam Engineering A/S. World Energy Council., ‘Development of Ultra-supercritical PF Power Plants in Denmark’, NOER, Marius and KJÆR, Sven Vestkraft Power Company and ELSAMPROJEKT Denmark. Mills, Stephen J., ‘Coal Gasification and IGCC in Europe,’ IEA Clean Coal Centre report, Report No. CCC/113, June 2006. Peńa, Francis García., ‘ELCOGAS IGCC Plant: clean coal technology. Experience and Future’, IGCC Planel – ASME Conference - Vienna, 14th June 2004. Allam, R.J., Panesar, R.S., White, V., and Dillon, D., ‘Optimising the Design of an Oxyfuel-Fired Supercritical PF Boiler’. Paper prepared by Air Products PLC and Mitsui-Babcock Energy Ltd. VGB., ‘CO2 Capture and Storage. A VGB Report on the State of the Art’, Published by VGB PowerTech e.V., Essen, August 2004. IEAGHG 2005., ‘Oxy Combustion Processes for CO2 Capture from Power Plant’, IEA Greenhouse Gas R&D Programme, Report number 2005/9, July 2005. MitsuiBabcock., ‘Coal-fired Advanced Supercritical Boiler Turbine Retrofit with CO2 Capture’, GHGT-8, 8th International Conference on Greenhouse Gas Control Technologies, Trondheim – Norway 19-22nd June 2006. O’Nions. P., ‘Summary of Carbon Capture Technologies’, presentation, Alstom June 2006. Henderson, C., ‘Understanding Coal-fired Power Plant Cycles’, IEA Clean Coal Centre report, Report No. CCC/91, October 2004.