russian economic report no. 26 zeljko bogetic lead economist and coordinator for economic policy for...
Post on 22-Dec-2015
214 views
TRANSCRIPT

Russian Economic Report No. 26
Zeljko BogeticLead Economist and Coordinator for Economic Policy for Russia, The World Bank
Sergei UlatovResident macroeconomist, Moscow office
September 15, 2011
Moscow
Growing Risks

OUTLINE
I. Growing risks to global outlook
II. Recent economic developments and policies
II. Russia’s outlook for 2011-2012

I. GLOBAL TRENDSGrowing risks to global growth and commodity
prices:
• Dramatic mark-down of U.S. sovereign debt ratings
• Lower-than-expected growth in the U.S. and EU in the first half of 2011
• Global market turbulence
• Renewed uncertainties about the European debt crisis
• Preliminary, downward revisions to the global outlook
• High-income countries’ growth to slow to 1.6 percent in 2011 from 2.7
percent in 2010
• Slowing of growth in low- and middle-income countries is less
pronounced: to 6 percent in 2011 from more than 7 percent in 2010
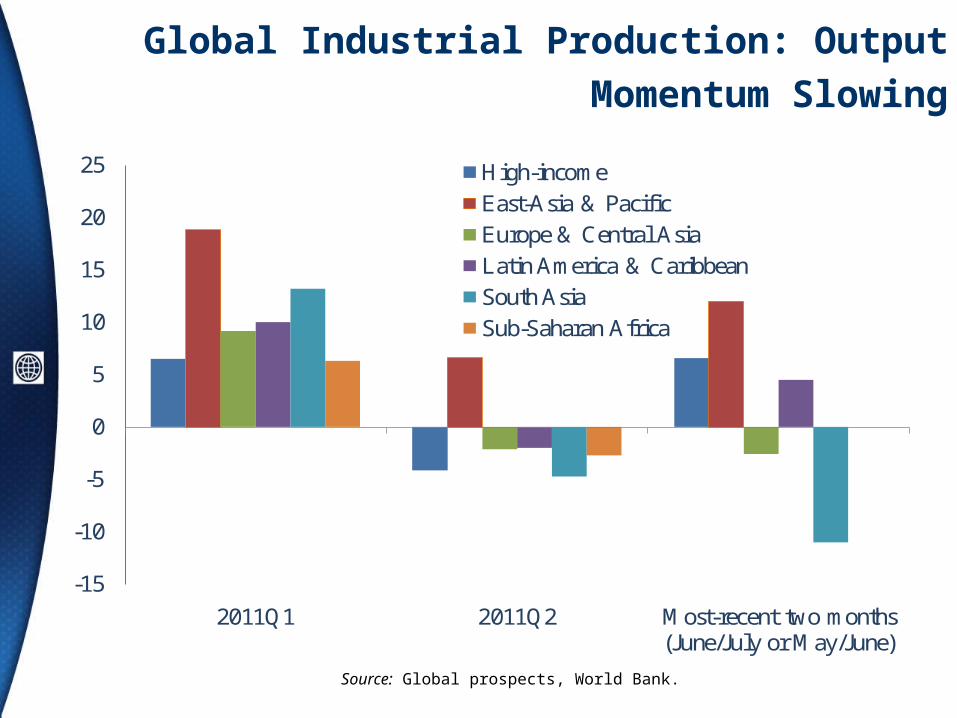
Global Industrial Production: Output Momentum
Slowing
Source: Global prospects, World Bank.
-15
-10
-5
0
5
10
15
20
25
2011Q1 2011Q2 Most-recent two months (June/July or May/June)
High-income
East-Asia & Pacific
Europe & Central Asia
Latin America & Caribbean
South Asia
Sub-Saharan Africa

Capital flows to developing countries-reflecting rising risks and uncertainty
Source: Global prospects, World Bank.
0
10
20
30
40
50
60
70
80
90
100
Jan-09 May-09 Sep-09 Jan-10 May-10 Sep-10 Jan-11 May-11
BondEquityBanktotal

Continuing debt crisis in the Eurozone and rising global uncertainty
Source: Bloomberg.
Selected Credit Default Swap Spreadsfive-year sovereign credit default swaps, basis points

RUSSIA’S RECENT ECONOMIC DEVELOPMENTS AND MACRO POLICIES IN 2011
• Economic growth slowed in the second quarter of 2011 as the inventory restocking cycle waned
• Balance of payments – deteriorating because of capital outflows
• External debt - improving access to longer-term financing
• Labor markets –– improving unemployment, rigid poverty
• Monetary policy–– slowing money growth and inflation
• Fiscal policy––postponing adjustment

Lower than expected but broad based growth in the first half of 2011: growth in domestic demand has not been as strong
as anticipated
Source: World Bank staff calculations based on Rosstat data.
GDP growth by main sectors (value added): 2007–2011
2007 2008 2009 2010 Q1-2011 Q2-2011
GDP growth 8.5 5.2 −7.8 4.0 4.1 3.4
Tradable sector 3.6 −0.2 −8.0 6.3 8.3 4.7
Agriculture, forestry 1.3 6.4 1.3 −10.7 1.1 0.5
Extraction industries −2.2 1.0 0.5 4.7 2.4 2.2
Manufacturing 7.5 −2.1 −14.9 12.3 12.9 6.9
Nontradable sector 12.4 9.2 −7.2 2.9 2.4 2.4
Electricity, gas, and water production and distribution −3.4 0.7 −5.0 5.5 -0.3 2.0
Construction 13.0 11.1 −14.6 -0.7 0.8 0.1
Wholesale and retail trade 11.7 9.9 −6.2 5.0 1.3 2.3
Transport and communication 4.8 5.2 −8.5 7.7 5.1 3.7
Financial services 29.1 13.5 2.2 −2.4 2.0 2.5

Balance of payments - overall position deteriorated in H1 2011 because of large net capital outflows
Source: CBR. a Preliminary estimates.
2007 2008 2009 2010a H1 2010 H1 2011a
Current account balance 77.0 103.7 48.6 71.1 52.1 57.6
Trade balance 130.9 155.4 111.6 151.4 86.1 101.7
Capital and financial account
84.8 −131.3 −43.5 −26.4 −3.1 −28.7
Errors and omissions −12.9 −11.3 −1.7 −8.0 −6.3 −6.0
Change in reserves (+ = increase)
148.9 −38.9 3.4 36.8 42.7 23.0
Memo: average oil price (Brent, US$/barrel)
72.5 96.9 61.5 79.5 77.3 111.0
US$ billions

Net capital outflows remained large in H1 2011 (albeit slowing in Q2) despite high oil prices and continued
moderate growth
Source: CBR, Global prospects.
2006 2007 2008 2009 2010 H1 2010 H1 2011 Q1 2001
Total net capital inflows to the private sector
41.4 81.7 −133.9 −56.9 −35.3 −11.5 −31.2 −21.3
Net capital inflows to the banking sector
27.5 45.8 −56.9 −31.4 15.9 7.6 −11.9 −7.7
Net capital inflows to the nonbanking sector
13.9 35.9 −77 −25.4 −51.2 −19.2 −19.3 −13.7

The labor market outcomes: gradually improving during the first half of 2011; Unemployment in July 6.5%
Sources: Rosstat; World Bank staff estimates.

And vacancies have been growing steadily since December 2010, especially in manufacturing and
finance

Yet many Russia’s regions are experiencing very high unemployment rates with attendant social risks

Percentage increase in unemployment in Q1 2011 from a year ago—the lighter the color the lower the
unemployment

Real wages and pensions increased slightly, along with the rise in productivity
*6 months for public administration wages.Source: Rosstat, WB staff calculations.
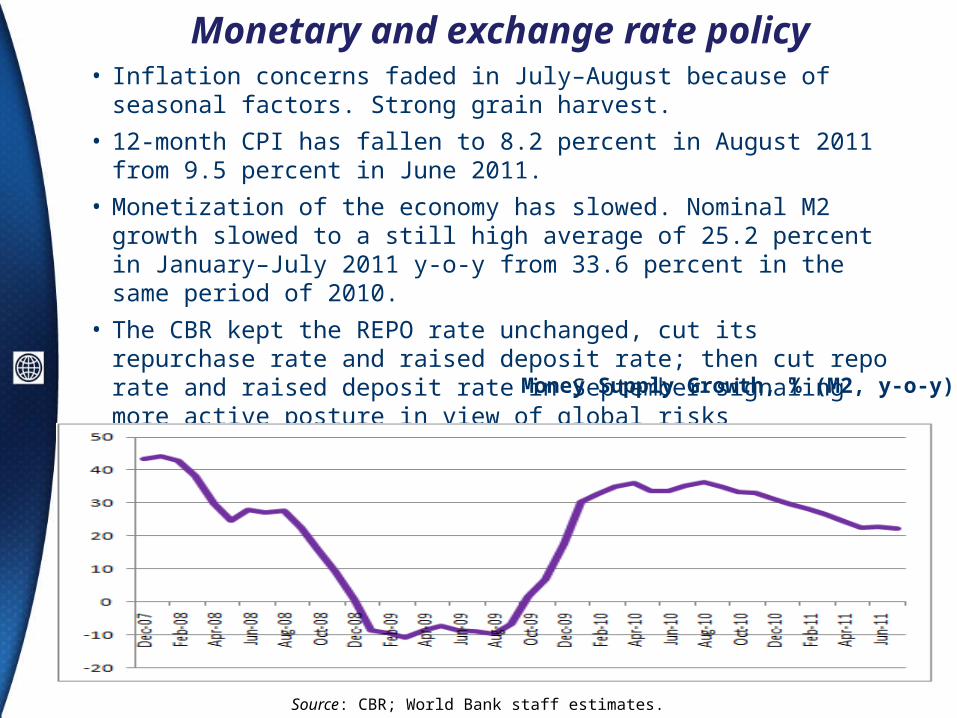
Monetary and exchange rate policy
Source: CBR; World Bank staff estimates.
Money Supply Growth, % (M2, y-o-y)
• Inflation concerns faded in July–August because of seasonal factors. Strong grain harvest.
• 12-month CPI has fallen to 8.2 percent in August 2011 from 9.5 percent in June 2011.
• Monetization of the economy has slowed. Nominal M2 growth slowed to a still high average of 25.2 percent in January–July 2011 y-o-y from 33.6 percent in the same period of 2010.
• The CBR kept the REPO rate unchanged, cut its repurchase rate and raised deposit rate; then cut repo rate and raised deposit rate in September signaling more active posture in view of global risks

With continued decline in lending rates, robust credit recovery continues, but the share of total credits to the private sector in GDP remains low
Sources: CBR; World Bank staff estimates.

2011 Federal budget)
2011 amendment
Change
Revenues 17.6 19.3 1.7
Oil revenues 8.1 9.8 1.7
Non-oil revenues 9.5 9.5 0.0
Expenditures21.2 20.7 −0.5
Deficit 3.6 1.3 −2.3
Non-oil deficit 11.7 11.1 −0.6
Amendment to 2011 Federal Budget % of GDP

Notwithstanding the short-term federal budget surplus and the low public debt, the new budget plan for 2012–
14 raises concerns about the long-term fiscal sustainability of Russia’s public finances
2012 2013 2014
Consolidated budget 1/Revenues 37.1 36.6 36.1
Expenditures 39.1 38.4 37.0
Surplus/Deficit –1.9 –1.8 –0.9Federal budget 2/
Revenues 20.1 19.6 19.5
Expenditures 21.6 21.2 20.2
Surplus/Deficit –1.5 –1.6 –0.7
Surplus/Non-oil deficit –11.0 –10.3 –9.2
Source: Ministry of Finance, Economic Expert Group. 1/ Estimates of the World Bank staff based on published budget parameters.2/ Ministry of Finance preliminary budget parameters published on September 12, 2011.

II. Global Outlook, 2011-2012 real GDP growth, %
Source: World Bank Staff Estimates; preliminary.
2009 2010 2011(projected)
2012(projected)
World −2.2 3.8 2.8 3.2
High-income countries −3.4 2.7 1.6 2.2
Developing countries 1.9 7.4 6.0 6.0
Russian Federation −7.8 4.0 4.0 3.8

The oil price outlook has been revised downward
World Bank oil price forecast. Average crude (Brent, Dubai and WTI), simple average, $/bbl
2008 2009 2010 2011 2012 201325
50
75
100
125
97.0
61.8
79.0
103.0
94.7 92.5
Source: World Bank staff.

Outlook for Russia: 2010 - 2012
Source: Russian Economic Report, The World Bank.
2011 2012
GDP growth (%) 4.0 3.8
Consolidated government balance (%) -0.2 -1.6
Current account (US$ billions) 67.0 21.0
Percentage of GDP 3.8 1.1
Capital account (US$ billions) -30.0 -6.0
Percentage of GDP -1.7 -0.3
Oil price assumption (US$ per barrel) 103.0 94.7
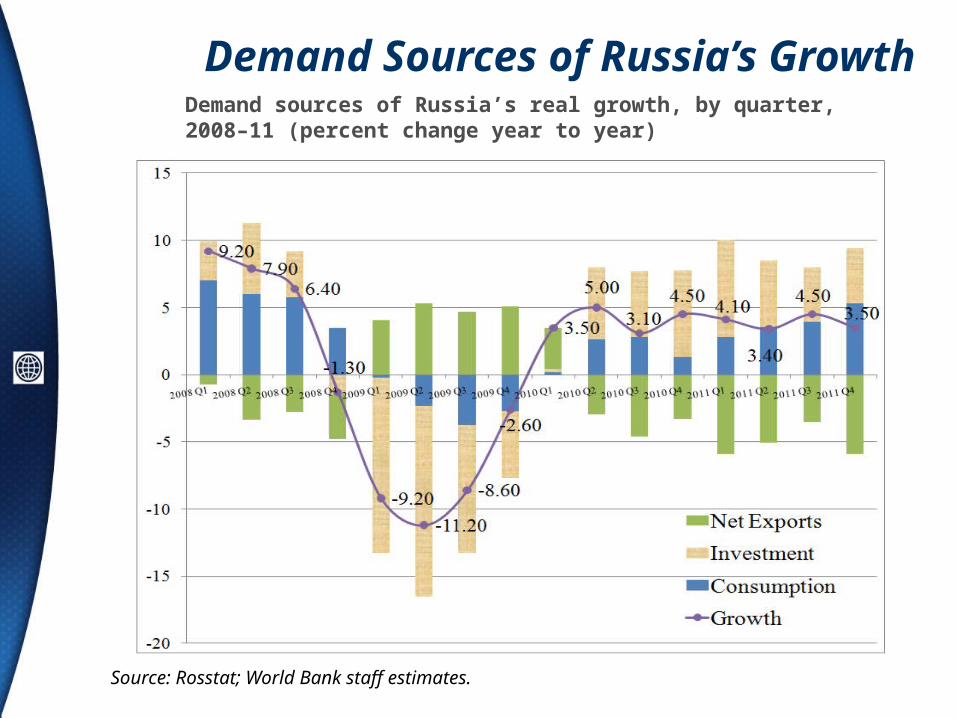
Demand Sources of Russia’s GrowthDemand sources of Russia’s real growth, by quarter, 2008–11 (percent change year to year)
Source: Rosstat; World Bank staff estimates.
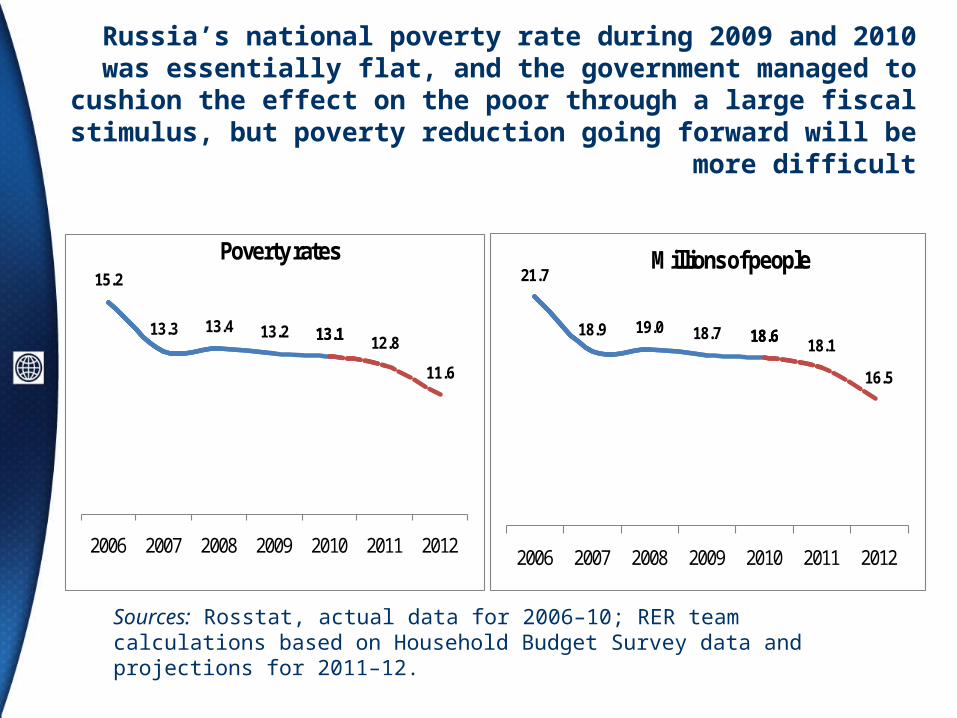
Russia’s national poverty rate during 2009 and 2010 was essentially flat, and the government managed to cushion the effect on the poor
through a large fiscal stimulus, but poverty reduction going forward will be more difficult
Sources: Rosstat, actual data for 2006–10; RER team calculations based on Household Budget Survey data and projections for 2011–12.
15.2
13.3 13.4 13.2 13.113.1 12.8
11.6
2006 2007 2008 2009 2010 2011 2012
Poverty rates21.7
18.9 19.0 18.7 18.618.6 18.1
16.5
2006 2007 2008 2009 2010 2011 2012
Millions of people

Thinking About the Unthinkable: How Bad Can it Get in Russia?
TWO RISK SCENARIOS
“moderate shock” scenario: global growth outlook gradually deteriorates, but remains positive, reflected in lower oil price outlook to an average of US$80 (a drop of about US$15 compared with the baseline outlook).
“severe shock” scenario: global outlook is severely affected by the recession in one of the major economic blocks, resulting in a sharp contraction in global demand and demand for oil. Under these conditions, oil demand would fall sharply and prices could again average $60 in 2012 (as in 2009).
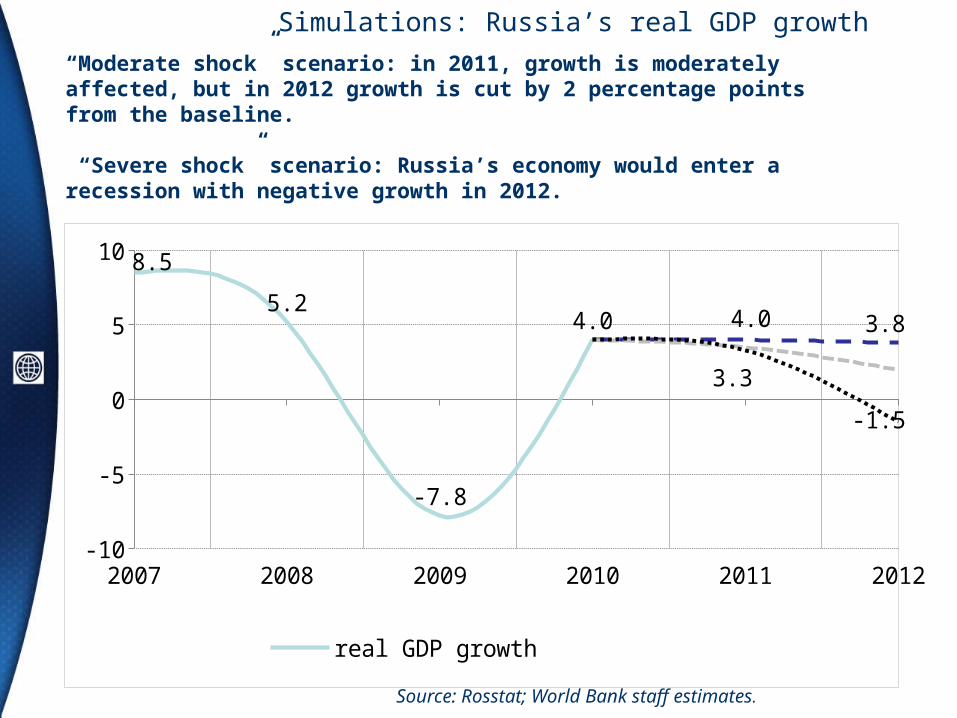
“Moderate shock” scenario: in 2011, growth is moderately affected, but in 2012 growth is cut by 2 percentage points from the baseline.
“Severe shock” scenario: Russia’s economy would enter a recession with negative growth in 2012.
2007 2008 2009 2010 2011 2012-10
-8-6-4-202468
10 8.5
5.2
-7.8
4.0 4.0 3.8
3.3
-1.5
real GDP growth scenario 1 (base case)scenario 2 (moderate shock) scenario 3 (severe shock)
Source: Rosstat; World Bank staff estimates.
Simulations: Russia’s real GDP growth

Simulations: Unemployment
2007 2008 2009 2010 2011 20125
6
7
8
9
6.1 6.3
8.4
7.5
6.66.3
7.0
7.5
unemployment rate scenario 1 (base case)scenario 2 (moderate shock) scenario 3 (severe shock)
Source: Rosstat; World Bank staff estimates
“Moderate shock” scenario: unemployment would trend back to 7 percent in 2012.
“Severe shock” scenario: unemployment is rising almost 1.5 percentage points higher than in the baseline outlook in 2012.

Simulations: Consolidated Budget Balance
2007 2008 2009 2010 2011 2012-7
-5
-3
-1
1
3
5
7 6.04.9
-6.3
-1.6-0.2
-3.5
-1.4
-5.3
cons budget balance scenario 1 (base case)scenario 2 (moderate shock) scenario 3 (severe shock)
Source: Rosstat; World Bank staff estimates
“Moderate shock scenario”: in 2012, without corrective adjustment, fiscal balance deteriorates sharply to 3.1 percent of GDP. This would likely result in the use of remaining balances in the Reserve Fund and recourse to domestic financing.
“Severe shock” scenario: without countervailing fiscal measures, fiscal balance would turn into a deficit of about 5.3 percent of GDP. This would require a combination of fiscal measures, including financing.

Simulations: Consumption
2007 2008 2009 2010 2011 2012-5-3-113579
111315 14.2
10.4
-4.8
2.95385672779529
5.5 5.3
2.95385672779529 4.6
0.3
real consumption growth scenario 1 (base case)scenario 2 (moderate shock) scenario 3 (severe shock)
Source: Rosstat; World Bank staff estimates
The pattern of real consumption in Russia is expected to remain resilient to negative shocks with consumption growth remaining higher than GDP growth in 2011–12.

In sum: Russia’s outlook
• Global growth is now projected to slow in the face of significant market turbulence, slowdown in the United States and European Union, and associated uncertainties.
• With heightened risks to global growth and lower commodity prices, we now expect Russia’s real GDP to grow 4 percent in 2011 (down from 4.4 percent expected in June) due to the lower Q2 outcome and the impact on domestic demand of the external conditions.
• The balance of payments position is expected to deteriorate toward end-2011, while capital flows are likely to remain volatile, reflecting increased global uncertainties.
• Unemployment is expected to remain under 7 percent but as the activity returns to pre-crisis level, further reduction in unemployment and poverty will be slow.
• Given the current trends and policies, we expect inflationary pressures to diminish somewhat faster than we projected before.
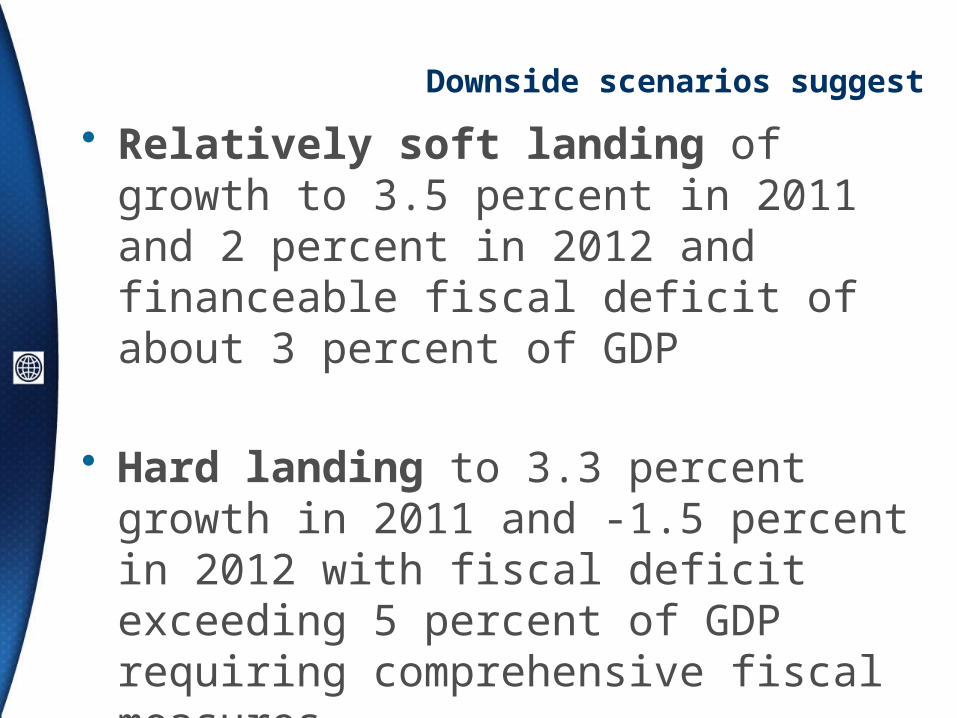
Downside scenarios suggest
• Relatively soft landing of growth to 3.5 percent in 2011 and 2 percent in 2012 and financeable fiscal deficit of about 3 percent of GDP
• Hard landing to 3.3 percent growth in 2011 and -1.5 percent in 2012 with fiscal deficit exceeding 5 percent of GDP requiring comprehensive fiscal measures
