rlm global fertilizer santa maria - santa barbara countycesantabarbara.ucanr.edu/files/75468.pdf ·...
TRANSCRIPT

The Global Fertilizer Situation:The Global Fertilizer Situation:What Is Going On?
Nitrate & Nutrient InterconnectionsSanta Maria, CA
Robert MikkelsenInternational Plant Nutrition Institute
Merced, CA

Feeling squeezed?

Why has fertilizer price increased?y as e t e p ce c eased
• fertilizer is a world market commodity … subject tofertilizer is a world market commodity … subject to supply and demand
• Price increases are a result of:Price increases are a result of:
–Global demand is increasing
–High energy and raw materials costs–High energy and raw materials costs
–Higher transportation costsW k USD–Weak USD
–Strong commodity prices
–Export tariffs on fertilizer in some countries


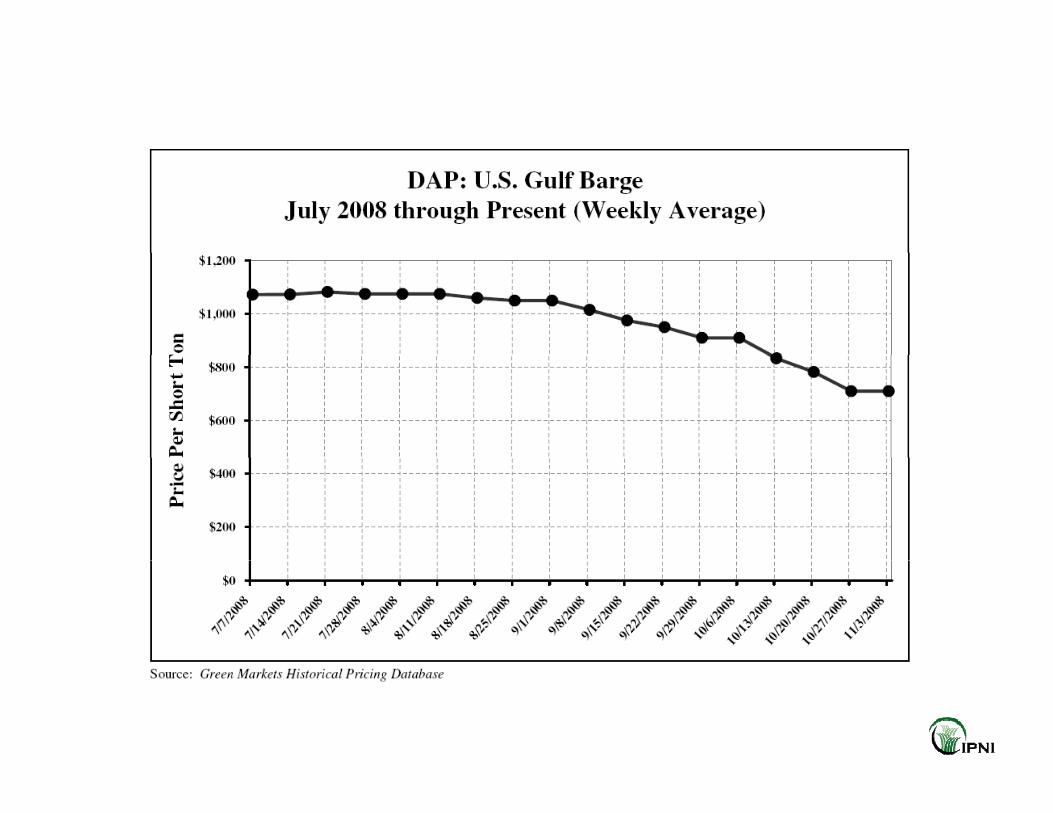
FOB World fertilizer prices, monthly averages J 2000 O t b 2008January, 2000 – October, 20081,200
800
1,000
n
600
SD p
er to
n
200
400U
0Jan 00 Jan 01 Jan 02 Jan 03 Jan 04 Jan 05 Jan 06 Jan 07 Oct 08
Urea, Middle East DAP, US Gulf MOP, Vancouver
Source: Pike & Fischer ‘s Green Markets

Index of fertilizer prices paid by U.S. farmers, J 1995 J 2008January 1995 – June 2008
400
375
350
32500
275
250
325
300
992
= 10 From January 2000 – June 2008
Increased 268%
225
200175
150
1990
/1
y
75
150
125
100
1995
1996
1998
1997
2006
1999
2000
2003
2002
2001
2005
2008
2007
2004
July
July
July
July
July
July
July
July
July
Jul y
July
July
July
Source: NASS
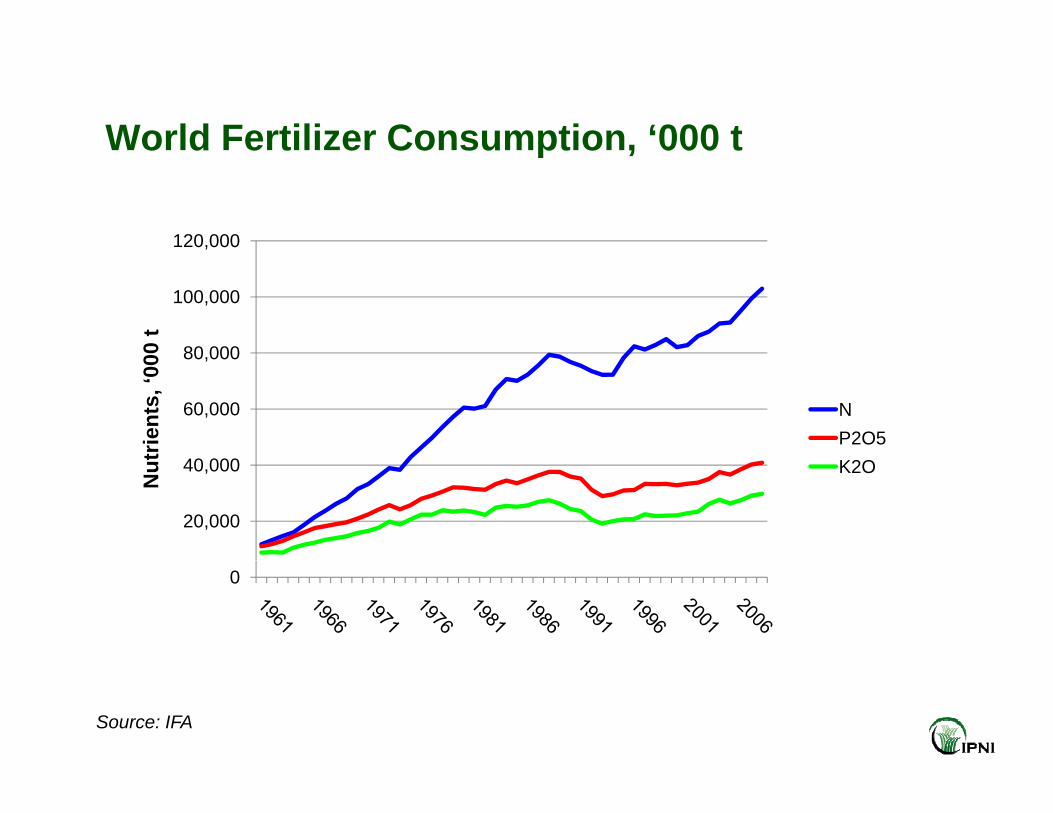
World Fertilizer Consumption, ‘000 to d e t e Co su pt o , 000 t
120,000
80 000
100,000
00 t
0 000
60,000
80,000
trie
nts,
‘00
NP2O5
20,000
40,000
Nut K2O
0
Source: IFA

Global Fertilizer Consumption Forecastst 2012/13 (Mt t i t )to 2012/13 (Mt nutrients)
OO OO llNN PP22OO55 KK22OO TotalTotal
Ave. 2005/06 to 2007/08 (e)
95.5 38.6 27.6 162.12007/08 (e)
2012/13 (f) 115.6 45.7 33.0 194.3
A A l +3 2% +2 8% +3 0% +3 1%Ave. Annual Change
+3.2% +2.8% +3.0% +3.1%
Source: P. Heffer, 2008. Medium-Term Outlook for World Agriculture and Fertilizer Demand 2007/08 – 20012/13. IFA Annual Conference, Vienna, Austria

F dFood,Feed,FibFiber…


Biofuels: Continued expected growth … i i d d f d thincreasing demand for corn and other crops
35,000Ethanol 6,000
Biodiesel
20,000
25,000
30,000
n ga
llons
Ethanol
India
EU
China 3,000
4,000
5,000
gal
lons
Biodiesel
Indonesia
EU
5,000
10,000
15,000
Mill
ion China
Canada
Brazil
USA 1,000
2,000
3,000
Mill
ion Brazil
Argentina
USA
02007 2009 2011 2013 2015 2017
02007 2009 2011 2013 2015 2017
Source: FAPRI 2008

Ethanol is here to stay


World demand for foodWorld demand for food
6
8
10Population, billionsPopulation, billions
0 30
0.40
0.50
0.60Arable land per capita, haArable land per capita, ha
0
2
4
6
0.00
0.10
0.20
0.30
Source: FAO Source: FAO1950 1960 1970 1980 1990 2000 2010 2020 2030 2040 2050
0.001961 1966 1971 1976 1981 1986 1991 1996 2001
““ f d d ti h t i 50% b 2013•• “…“…food production has to increase 50% by 2013 and double in 30 years…”
–– (Source: Global Challenges for Humanity 2008 State of the Future(Source: Global Challenges for Humanity 2008 State of the Future–– (Source: Global Challenges for Humanity, 2008 State of the Future, (Source: Global Challenges for Humanity, 2008 State of the Future, Millennium Project)Millennium Project)

Diets are changing … more protein.ets a e c a g g o e p ote
80
90 Meat consumption, kg/capita/yr
50
60
70
80
10
20
30
40
0
10
1995 1997 1999 2001 2003
Developed World Developing World
• Requires more feed grains to produce protein
p p g
Source: FAO
– 7 kg/kg beef, 4 kg/kg pork, and 2 kg/kg poultry


World wheat plus coarse grains ending stocks 1978 2008
40
stocks, 1978-2008
253035
mption
152025
consum
Lowest 2 yrs on
1998‐2008y = ‐1.80x + 3621
r² = 0.93510
% of y
record
0
1975 1980 1985 1990 1995 2000 2005 2010
( / )Year (2008 =2008/09)USDA-FAS, 5/2008

Low crop yields in the developing world(A 2005 2007)(Ave. 2005 – 2007)
10,000
7,000
8,000
9,000
a
5,000
6,000
,
yiel
d, K
g/h
USAChina
2,000
3,000
4,000
Cro
p y India
Brazil
0
1,000
2,000
Ri C S bRice Corn Soybean
Source: FAO

Global Nutrient DemandGlobal Nutrient Demand

Agricultural Commodity Prices(I d J 1995 100)
300
(Index: January 1995 = 100)
300
250
150
200
100
50
0
1995 1997 1999 2001 2003 2005 20071996 1998 2000 2002 2004 2006 2008
Cotton Palm Oil Sugar Wheat Maize Rice SoybeanSource: IFA


Why has fertilizer price increased?y as e t e p ce c eased
• fertilizer is a world market commodity … subject tofertilizer is a world market commodity … subject to supply and demand
• Price increases are a result of:Price increases are a result of:
–Global demand is increasing
–High energy and raw materials costs–High energy and raw materials costs
–Higher transportation costsW k USD–Weak USD
–Strong commodity prices
–Export tariffs on fertilizer in some countries

Cumulative U.S. ammonia plant closures i ith i i t l iincrease with increasing natural gas prices
30 9
257
8 Naturats
1985-1997 Ave. Price of Natural
15
20
4
5
6
al gas pricr of p
lant Gas $1.90 MMBtu
10
2
3
4
ce, $/MMN
umbe
0
5
0
1
MB
tu
1998 1999 2000 2001 2002 2003 2004 2005
Source: TFI
1998 1999 2000 2001 2002 2003 2004 2005

U.S. Ammonia Production and Net Nit I tNitrogen Imports
16
50
55
12
14
40
45
50
sN
et
8
10
25
30
35
ion
shor
t ton
t imports, %
o
4
6
15
20Mill
of total
0
2
0
5
10
1991/92 1993/94 1995/96 1997/98 1999/00 2001/02 2005/062003/041991/92 1993/94 1995/96 1997/98 1999/00 2001/02 2005/062003/04
Net imports (Imports – Exports)Ammonia Production Net imports as share of total
Source: TFI and U.S. Department of Commerce

Shipping and distribution costs increaseShipping and distribution costs increase
Baltic Ocean Freight Rate IndexJ 2008 J 2003
Change in Freight Rates
Index Jan. 2008 vs. Jan. 2003
Vessel Jan 08 vs Jan 03Capesize 453%Panamex 359%
Source: Overseas Marine Service, PotashCorp, TFI

Shipping and distribution costs increaseShipping and distribution costs increase
Rail Rates: Anhydrous Ammonia Tariff Rates - BNSF
40
45
25
30
35
40
mm
onia
15
10
20
25
$/to
n of
am
0
5
10
Jan 05 May 06 Mar 07 Nov 07 Jan 08
Source: Overseas Marine Service, PotashCorp, TFI
Jan 05 May 06 Mar 07 Nov 07 Jan 08
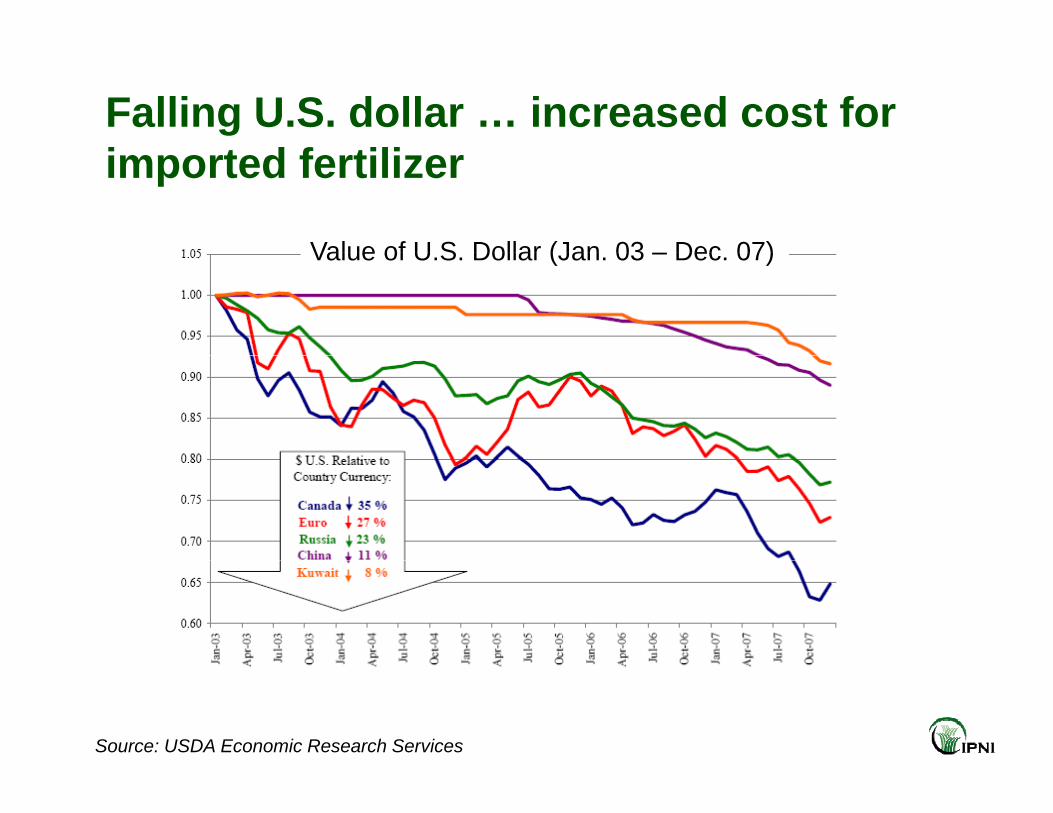
Falling U.S. dollar … increased cost for i t d f tiliimported fertilizer
Value of U S Dollar (Jan 03 – Dec 07)Value of U.S. Dollar (Jan. 03 – Dec. 07)
Source: USDA Economic Research Services
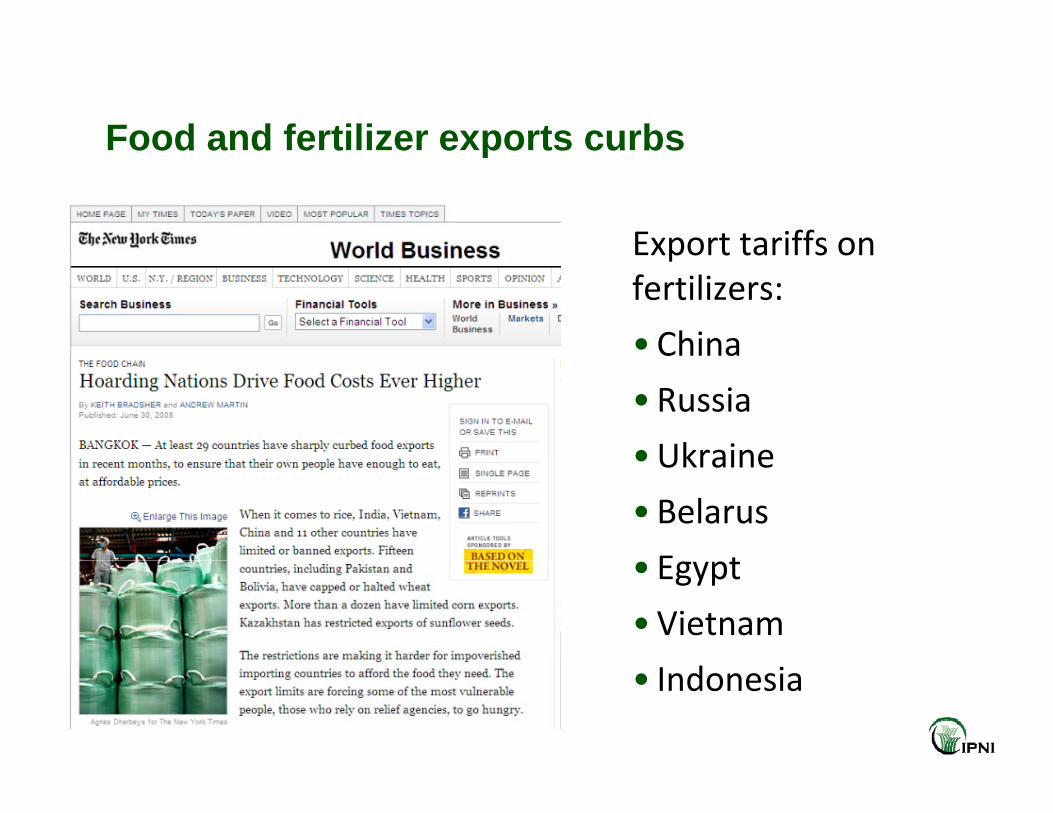
Food and fertilizer exports curbsood a d e t e e po ts cu bs
Export tariffs onExport tariffs on fertilizers:
• ChinaChina
• Russia
•Ukraine•Ukraine
• Belarus
E t• Egypt
• Vietnam
• Indonesia

What are the global consequences of higher What are the global consequences of higher g q gg q gfertilizer prices?fertilizer prices?

Global Consequences: Greater awareness of the role of fertilizer inof the role of fertilizer in producing food

Global Consequences: Reduction in fertilizer use …
• Shift in crops … more psoybeans
• Less P and K use … more imbalanced nutrient use
• Lower yields and less production …food prices and grain stocks
?• Better environment?

Global Consequences: Increased investment b th i d t i d ti itby the industry in production capacity
120,000
100,000
World Fertilizer Production, ‘000 t
60,000
80,000
N
40,000
P2O5K2O
0
20,000
0
Source: IFA


Global Consequence: Supply will catch up to ydemand in next 5 years
Source: M. Prud’homme. 2008. Global Fertilizers and Raw Materials Supply and Supply/Demand Balances 2008-2012, IFA Annual Conference, Vienna, Austria

ECONOMICECONOMIC
Global Frameworkfor Fertilizer BMPs
Profitability
Net profitReturn on investment
QualityResource use Energy Profitability
SourceRate
Adoption
Soil productivity
efficiencies:
WaterNutrient
Labor
gy
ProductivityCropping SystemSustainability
TimePlace Yield
stabilityYield
Water
Environment
Farm income
Working conditions
Nutrient balanceNutrient loss
Soil erosion
SOCIALSOCIALECOLOGICALECOLOGICAL
Water & air qualityBiodiversityEcosystem services
SOCIALSOCIALECOLOGICALECOLOGICAL
Source: IPNI

Productivity
• Yield – per unit area, per unit of time
• Efficiency of all resources involved in production
•Quantity and Quality

Profitability
•Difference between value and cost of production
•Net profit per unit area per unit of timep p p

Cropping System SustainabilityC opp g Syste Susta ab ty
• Influence of time on resources involved
•Use of non‐renewable resources
• “Outputs do not decrease when inputs are not increased” (Monteith, 1990)
Rothamsted Research, 2006

Environmental Healtho e ta ea t
• Biophysical– Material losses to water and air
– N, P, nitrate, ammonia, nitrous oxide
• Social– Demand for labor
– Working conditions

Re-emphasize the Scientific Principlesfor Fertilizer Management: o e t e a age e t
BMPs and improving nutrient use efficiency

Scientific Principles for Fertilizer BMPs –SSource
• Ensure a balanced supply of essential nutrients.Ensure a balanced supply of essential nutrients.
• Supply plant‐available forms.
• Suit soil physical and chemical properties• Suit soil physical and chemical properties.
• Recognize:synergisms among nutrient elements and sources;– synergisms among nutrient elements and sources;
– blend compatibility;
– associated nutritive or non‐nutritive elementsassociated nutritive or non‐nutritive elements.

Scientific Principles for Fertilizer BMPs –R tRate
•Assess:Assess:– Soil nutrient supply;
– All available nutrient sources;;
– Plant demand.
• Predict fertilizer use efficiency.y

Scientific Principles for Fertilizer BMPs –Ti iTiming
•Match timing of crop uptake.Match timing of crop uptake.
• Assess dynamics of soil nutrient supply.
• Recognize timing of weather factors influencing• Recognize timing of weather factors influencing nutrient loss.
• Evaluate logistics of field operations• Evaluate logistics of field operations.
Scientific Principles for Fertilizer BMPs –Pl tPlacement
• Recognize root‐soil dynamics.Recognize root soil dynamics.
•Manage spatial variability.
• Avoid detrimental effects on plant roots leaves and•Avoid detrimental effects on plant roots, leaves and seedlings.
• Limit potential off‐field transport of nutrients• Limit potential off‐field transport of nutrients.


ECONOMICECONOMIC
Global Framework For FertilizerBMPs
Net profit
Resource use Energy Ad ti
Return on investmentQuality
ProfitabilityResource use Energyefficiencies: Labor
NutrientWater
Adoption
Soil productivity
Profitability
RateRate
Yield stability
Nutrient
YieldProductivity
Cropping SystemSustainability
SourceSource
TimeTimePlacePlace
Farm incomeWorking conditions
balance
Nutrient loss
Soil erosionBiophysical & Social
Environment
SOCIALSOCIAL
Water & air quality
ECOLOGICALECOLOGICAL
Biodiversity
Ecosystem services
SOCIALSOCIALECOLOGICALECOLOGICAL

Thank YouThank You
www.ipni.net


Scientific Principles for Fertilizer Managementg
• Right Product
• Right Rate
• Right Timeg
• Right Place


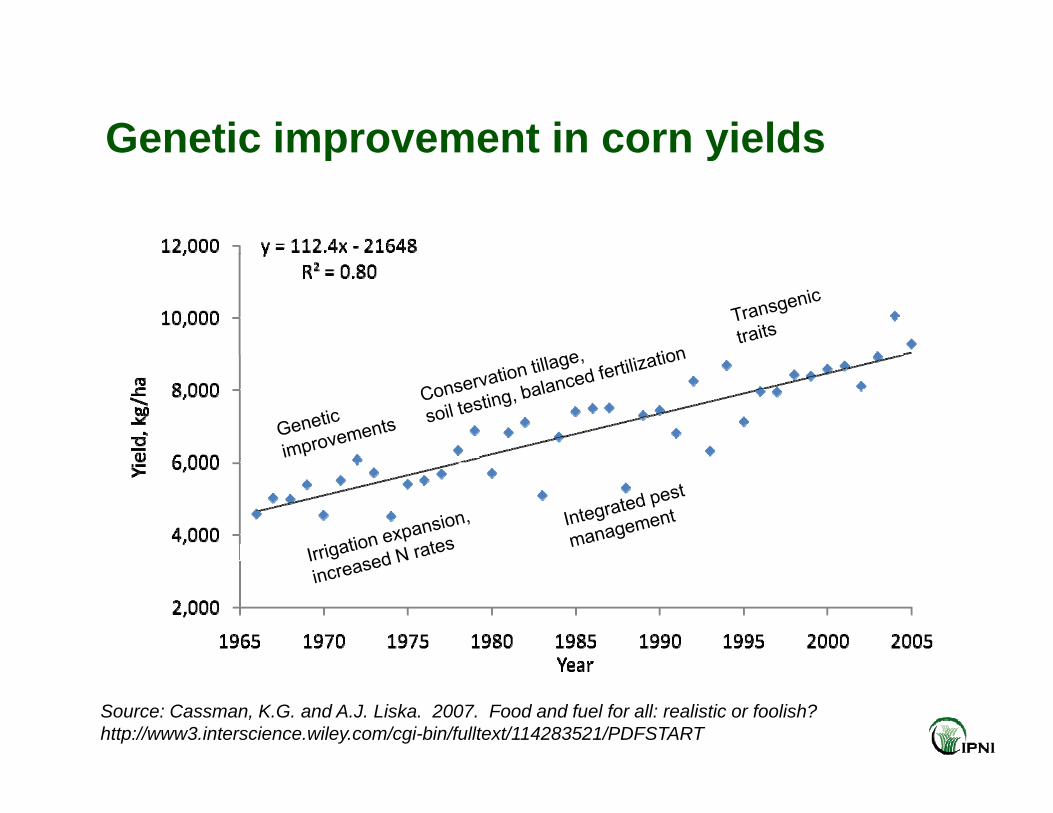
Genetic improvement in corn yieldsGenetic improvement in corn yields
Source: Cassman, K.G. and A.J. Liska. 2007. Food and fuel for all: realistic or foolish? http://www3.interscience.wiley.com/cgi-bin/fulltext/114283521/PDFSTART
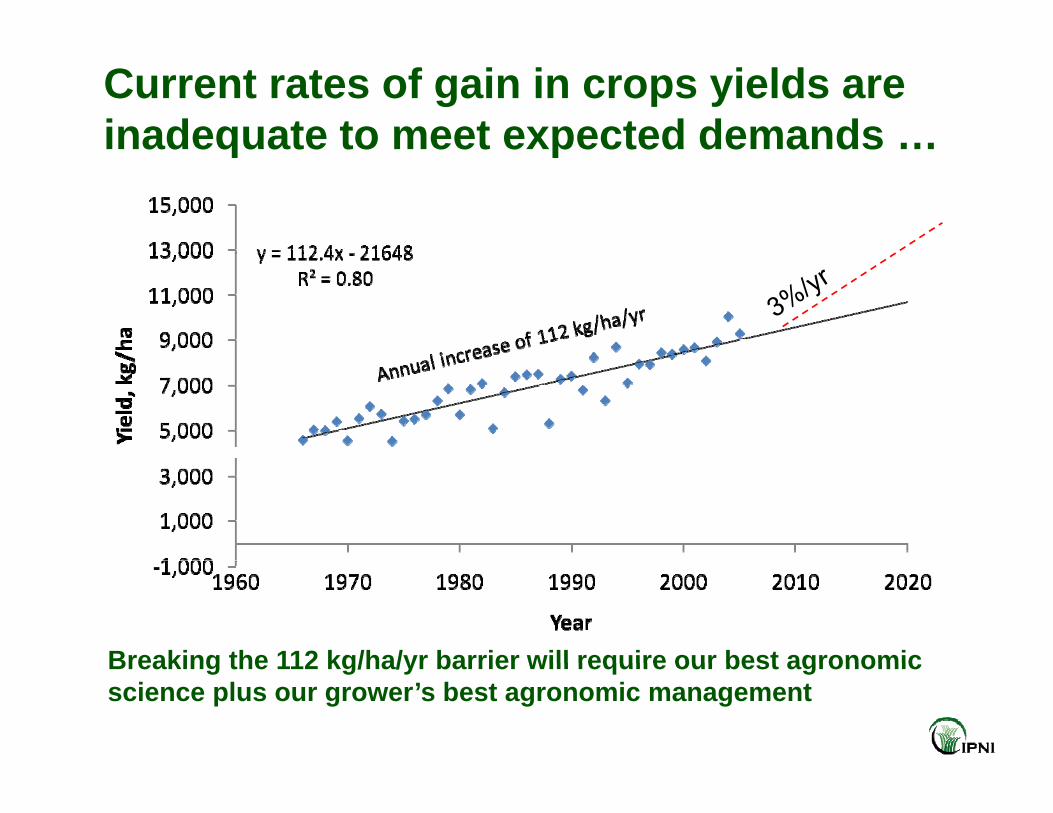
Current rates of gain in crops yields are inadequate to meet expected demands …q p
Breaking the 112 kg/ha/yr barrier will require our best agronomicBreaking the 112 kg/ha/yr barrier will require our best agronomic science plus our grower’s best agronomic management
