fertilizer statistics overview nigeria -...
TRANSCRIPT

Fertilizer Statistics Overview
NIGERIA2013 - 2016
2017 Edition

1. Production
2. Imports
3. Exports
4. Origins and destinations
5. Agric. and non Agric. use
6. Consumption (app)
7. NPK analysis
8. Summary
9. About us
An overview of fertilizer statistics in Nigeria from 2013 –2016.
More emphasis is given to the year 2016 and each analysis is based on the products with higher quantities.
Official trade data obtained from the Nigeria Customs Service(NCS) validated by Fertilizer Technical Working Group – Nigeria (FTWG-NGA)
2016 data validated from the 14 – 15th June, 2016.
Outline Background information

Fertilizer production
Comments:
• Notore Chemical Industries PLC and Indorama Group are the only primary producers of Urea inNigeria, both located at Onne, River state.
• Indorama opened its production plant in June 2016 which reflects on the 2016 production figures.
• There are other several companies blending different kinds of NPK’s (e.g. Golden Fertilizers, TAKAgro, Springfield Agro Ltd, etc.)
Source: FTWG-NGA
HS Code Product 2013 2014 2015 2016
3102100000 Urea 235,000 170,000 281,750 695,000
3103100000 SSP 15,000 491 611 -
Total (MT) 250,000 170,491 282,361 695,000

Fertilizer imports
Comments:
• NPK was the most imported fertilizer in Nigeria, accounted for 64% of fertilizer imports.
• Fertilizer imports for 2016(593,994MT) was a 42.11% increase from 2015 (417,976MT).
Source: FTWG-NGA
Other fertilizers includes products like; SSP, SoA, etc
NPK64%
NP compounds19%
Ammonium sulphate
5%
Other phosphate fertilizers
4%
Urea4%
Others fertilizers4%
TOP 5 IMPORTED FERTILIZERS 2016
-
100,000
200,000
300,000
400,000
500,000
600,000
700,000
NPK NPcompounds
Ammoniumsulphate
Otherphosphatefertilizers
Urea Othersfertilizers
MT
TOP FERTILIZER IMPORTS PER YEAR
2013 2014 2015 2016
HS Code Fertilizer Name 2013 2014 2015 2016
3105200000 NPK 294,980 344,879 165,684 380,455
3105510000 NP compounds 87,988 68,535 47,986 115,845
3102210000 Ammonium sulphate 12,301 2,321 10,483 27,450
3103900000 Other phosphate fertilizers 6 - 50,596 22,452
3102100000 Urea 598,616 291,966 120,346 21,013
Others fertilizers 20,068 34,517 22,881 26,779
Total fertilizer for agric (MT) 1,013,959 742,216 417,976 593,994

Fertilizer monthly imports
Comments:
• In 2016, fertilizer imports was at its peak in July recording imports of 122, 020MT (21% of 2016 imports).
• The first quarter recorded the least import.
• In 2016, most fertilizers imported into Nigeria reached the port in the third quarter.
Source: FTWG-NGA
Source: FAO/GIEWS
SEASON CROPS Jan Feb Mar Apr May Jun Jul Aug Sep Oct Nov Dec
Cassava (South)
Fertilizer peak demand
Maize (North main*)
Fertilizer peak demand
Maize (South main*)
Fertilizer peak demand
Millet
Fertilizer peak demand
Sorghum
Fertilizer peak demand
Rice
Fertilizer peak demand
Yams
Peak demand
Cassava, Maize, Millet, Sorghum, Rice, Yams
Fertilizer peak demand
Key: fertilizer peak demand Sowing growing harvesting
Major Season
(Long Rains)
Minor Season
(Short Rains)
-
200,000
400,000
600,000
800,000
1,000,000
1,200,000
Jan Feb Mar Apr May Jun Jul Aug Sep Oct Nov Dec
MT
NIGERIA FERTILIZER MONTHLY CUMULATIVE IMPORTS (2013-2016)
2013
2014
2015
2016
Quarter 2013 2014 2015 2016
Q1 147,791 153,485 62,761 27,966
Q2 391,619 333,775 115,692 215,756
Q3 391,264 113,195 146,067 205,087
Q4 83,285 141,761 93,457 145,185
Total 1,013,959 742,216 417,976 593,994

Fertilizer exports
Comments:
• Urea exports for 2016 (329,630MT) saw an increase of299.84% compared to 2015(82,440MT).
• The huge increase in 2016 exports was due to the 146%increase in urea production.
• The reduction in 2014 was due to gas pipeline problemswhich affected both production and exports in thatyear.
Source: FTWG-NGA
-
50,000
100,000
150,000
200,000
250,000
300,000
350,000
Urea
FERTILIZER EXPORTS PER YEAR
2013 2014 2015 2016
MT
HS Code Fertilizer Name 2013 2014 2015 2016
3102100000 Urea 50,000 38,000 82,440 329,630

Fertilizer origins and destinations 2016
Source: FTWG-NGA
Countries of Origin Morocco Russia Estonia Belgium UAE Egypt Ukraine Others
NPK 67% 17% 9% 0% 7% 0% 0% 1%
NP compounds 97% - - - - - - 3%
Ammonium sulphate - - - 100% - - - -
Urea - - - 2% - - 64% 35%
Other fertilizers 11% 45% - 0% - 35% 0% 8%
Mo
rocc
o,
37
1,2
36
Ru
ssia
, 8
6,6
98
Esto
nia
, 3
3,0
00
Bel
giu
m,
27
,97
8
Un
ited
Ara
b E
mir
ates
, 2
6,2
50
Egyp
t, 1
7,9
37
Ukr
ain
e,
13
,45
4
Ch
ina,
7,3
40
-
50,000
100,000
150,000
200,000
250,000
300,000
350,000
400,000
MT
COUNTRIES OF ORIGIN (IMPORTS)
Bra
zil,
17
2,4
90
Uru
guay
, 7
7,1
40
Un
ited
Sta
tes,
31
,58
0
Sou
th A
fric
a, 3
0,0
20
Arg
enti
na,
18
,40
0
-
20,000
40,000
60,000
80,000
100,000
120,000
140,000
160,000
180,000
200,000
MT
2016 UREA DESTINATIONS (EXPORTS)
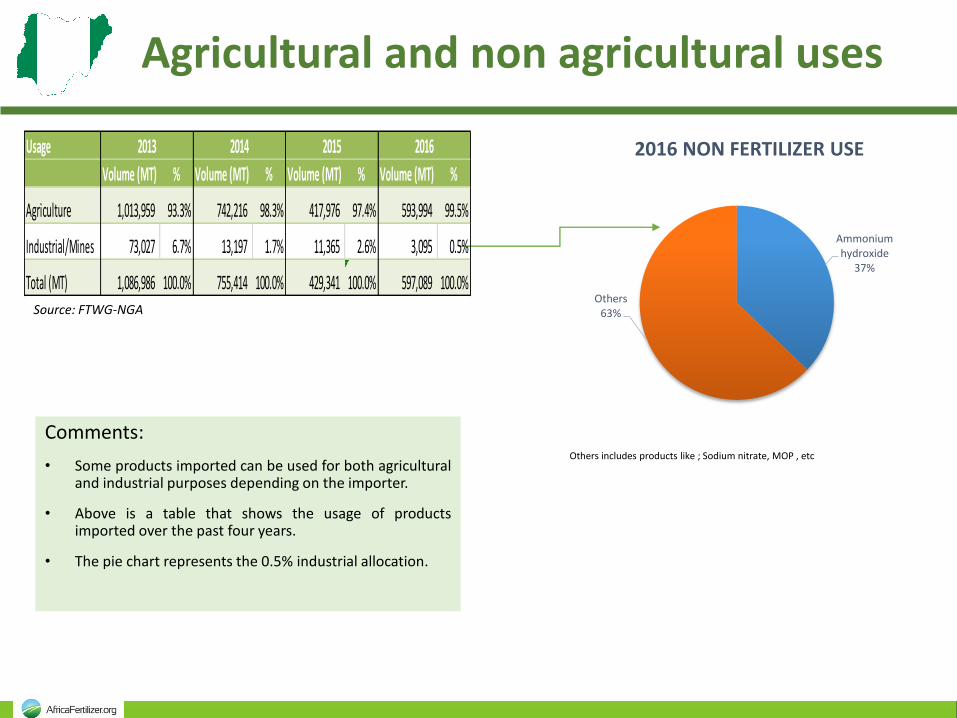
Agricultural and non agricultural uses
Comments:
• Some products imported can be used for both agriculturaland industrial purposes depending on the importer.
• Above is a table that shows the usage of productsimported over the past four years.
• The pie chart represents the 0.5% industrial allocation.
Source: FTWG-NGA
Others includes products like ; Sodium nitrate, MOP , etc
Ammonium hydroxide
37%
Others63%
2016 NON FERTILIZER USEUsage
Volume (MT) % Volume (MT) % Volume (MT) % Volume (MT) %
Agriculture 1,013,959 93.3% 742,216 98.3% 417,976 97.4% 593,994 99.5%
Industrial/Mines 73,027 6.7% 13,197 1.7% 11,365 2.6% 3,095 0.5%
Total (MT) 1,086,986 100.0% 755,414 100.0% 429,341 100.0% 597,089 100.0%
20162013 2014 2015

Fertilizer apparent consumption
Comments:
• Urea and NPK’s are the most consumed fertilizer inNigeria (Accounting for 80% of Nigeria’s fertilizerconsumption in 2016).
• There was a huge increase in total production aswell as imports which lead to an increase inapparent consumption in 2016.
• In 2016 total apparent consumption of fertilizers innutrients were 404.2 with 264.6 N, 98.3 P2O5 and 59.3K2O.
Source: FTWG-NGA
NB: Apparent consumption = Production + Imports – Exports –non fertilizer use
Nutrient aggregates was derived using AFO conversion methodology
HS Code Fertilizer Name 2013 2014 2015 2016
3102100000 Urea 765,731 423,966 319,656 386,383
3105200000 NPK 270,919 344,879 165,684 380,455
3105510000 NP compounds 87,988 68,535 47,986 115,845
3102210000 Ammonium sulphate 12,301 2,321 10,483 27,450
3103900000 Other phosphate fertilizers 6 - 50,596 22,452
Other Fertilizers 77,014 34,517 23,492 26,779
Total (MT) 1,213,959 874,216 617,897 959,364
Urea40%
NPK40%
NP compounds12%
Ammonium sulphate3%
Other phosphate fertilizers2%
Other Fertilizers3%
2016 APPARENT CONSUMPTION
-
100,000
200,000
300,000
400,000
500,000
600,000
700,000
800,000
900,000
Urea NPK NPcompounds
Ammoniumsulphate
Otherphosphatefertilizers
OtherFertilizers
MT
TOP FERTILIZER APPARENT CONSUMPTION PER YEAR
2013 2014 2015 2016

NPK analysis
Comments:
• Some NPK formulations in Nigeria include; NPK15-15-15 used on maize, cotton, sugar cane andginger; NPK 20-10-10 used on yam, millet,sorghum and beans; NPK 27-13-13 used onmaize, rice and sorghum, etc.
• NPK (Unknown Grade) refers to NPK fertilizers whose grades are not known.
Source: FTWG-NGA
HS Code Fertilizer Name 2012 2013 2014 2015
3105200000 Total NPK 230,446 294,980 344,879 165,684
3105510000/3105590000Total NP 0 87,988 68,535 47,986
3105700000 Total NK -
3105600000 Total PK - 3,015 485 -
3105900000 NPK (Unknown Grade) 50,043 44
Total (MT) 280,489 385,983 413,898 213,714
Total NPK78%
Total NP22%
NPK (Unknown Grade)0%
2016 NPK FERTILIZERS
-
50,000
100,000
150,000
200,000
250,000
300,000
350,000
400,000
450,000
2012 2013 2014 2015
NPK FERTILIZER IMPORTS PER YEAR
Total NPK Total NP Total NK Total PK NPK (Unknown Grade)

Summary of 2016 fertilizer statistics for Nigeria
HS Code Product Name Production
Total
Import Export
Domestic
Availability
Non Ferilizer
Use
Agricultural
Imports
Apparent
Consumption2510100000 Phosphate rock 1,521 1,521 727 794 794
2814100000 Anhydrous ammonia 54 54 54 - -
2814200000 Ammonium hydroxide 1,147 1,147 1,147 - -
3101000000 Organic fertilizer 176 176 176 176
3102100000 Urea 695,000 21,013 329,630 386,383 21,013 386,383
3102210000 Ammonium sulphate 27,679 27,679 229 27,450 27,450
3102500000 Sodium nitrate 68 68 68 - -
3102900000 Other N 100 100 100 100
3103100000 SSP 16,599 16,599 16,599 16,599
3103900000 Other P 22,452 22,452 22,452 22,452
3104200000 MOP 4,165 4,165 482 3,683 3,683
3104900000 Other K 499 499 371 128 128
3105200000 NPK 380,455 380,455 380,455 380,455
3105300000 DAP 5,250 5,250 5,250 5,250
3105400000 MAP 49 49 49 49
3105510000 NP compounds 115,645 115,645 115,645 115,645
3105590000 Other NP 200 200 200 200
3105600000 PK compounds 17 17 17 - -
Grand Total MT 695,000 597,089 329,630 962,459 3,095 593,994 959,364

Participants of 2017 FTWG
Name Institution Position Email
Samuel Ali FEPSAN Advocacy Officer [email protected]
Surendra Kumar Srivastava Indorama National Logistics head [email protected]
Mohammed Murtala Notore Regional Commercial Manager [email protected]
Olorunmola Dare Rapheal CountrySTAT CountrySTAT Leader [email protected]
Adamu Sale FMARD / FISS Deputy Director [email protected];
Felix Nwoche IFDC JFMA [email protected]

About Us
Links
Africafertilizer.org
USAID WAFP
AfricaFertilizer.org
USAID West Africa Fertilizer Program
@AfricFertilizer
@USAIDWAFP
CountrySTAT Nigeria
Report of Joint Nigeria, Ghana & Sierra Leone FTWG Validation workshop 2017
About AFO
AfricaFertilizer.org is a global initiativefacilitating the exchange of informationon soil fertility, fertilizers, and goodagricultural practices in Africa.
About USAID WAFP
The West Africa Fertilizer Program is afive-year USAID-funded project thatseeks sustainably improved agriculturalproductivity through increasedregional availability and use of qualityand appropriate fertilizer in WestAfrica.