risk management in iron ore markets - the ice · risk management in iron ore markets 8th december...
TRANSCRIPT

RISK MANAGEMENT IN IRON ORE MARKETS
www.theice.com
8th December 2009

2
Safe Harbour Statement
Forward-Looking Statements
This presentation may contain “forward-looking statements” made pursuant to the safe harbor
provisions of the Private Securities Litigation Reform Act of 1995. Statements regarding our
business that are not historical facts are forward-looking statements that involve risks,
uncertainties and assumptions that are difficult to predict. These statements are not guarantees
of future performance and actual outcomes and results may differ materially from what is
expressed or implied in any forward-looking statement. For a discussion of certain risks and
uncertainties that could cause actual results to differ from those contained in the forward-looking
statements see our filings with the Securities and Exchange Commission (the "SEC"), including,
but not limited to, the "Risk Factors" in our Annual Report on Form 10-K for the year ended
December 31, 2008, as filed with the SEC on February 11, 2009. SEC filings are also available in
the Investors & Media section of our website. All forward-looking statements in this presentation
are based on information known to us on the date hereof, and we undertake no obligation to
publicly update any forward-looking statements.
LEGAL DISCLAIMER

WELCOME: TODAY’S EVENT
Mike DavisDirector of Market Development ICE Futures Europe
• Introduction• Our first event of its kind in Iron Ore; event rationale, globalscope
• Content-driven and interactive, ICE and industry presentations• Driven by desire to inform, entertain, educate• Networking opportunity, lunch & ICE party this evening• Programme summary and structure, Q & A• Housekeeping: Exits, phones, feedback forms, reporting policy• Next up
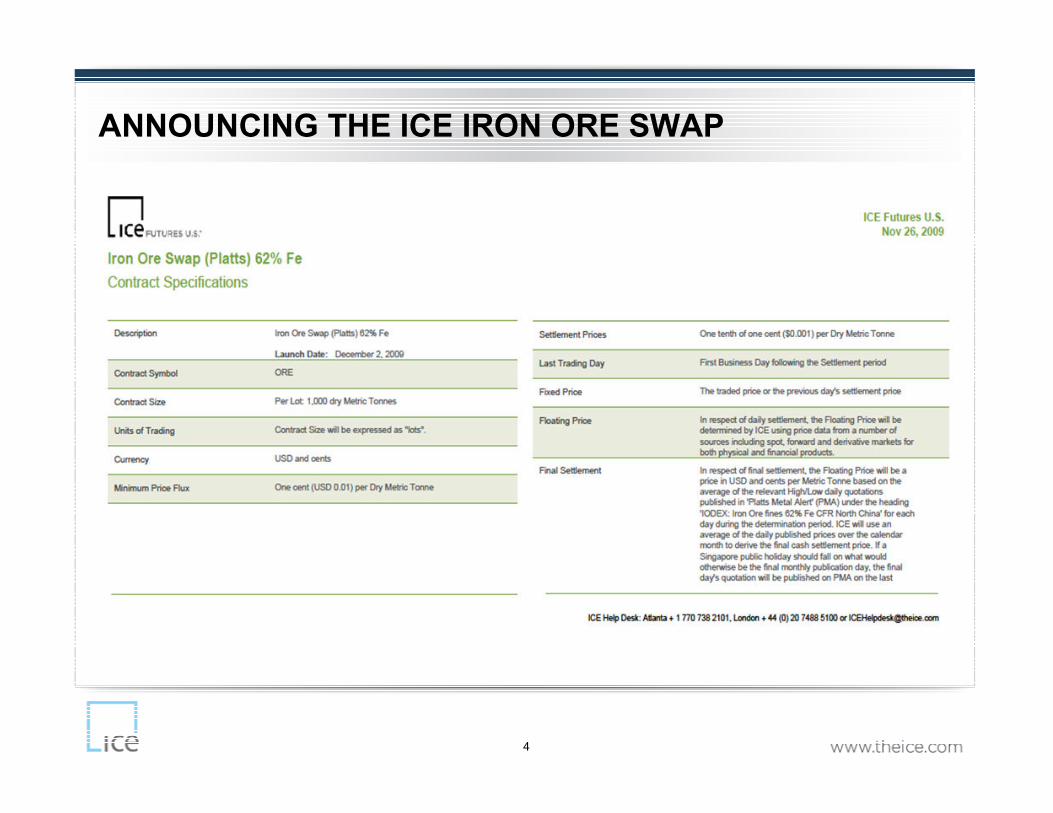
ANNOUNCING THE ICE IRON ORE SWAP
4

5
ICE OVERVIEW: DIVERSE MARKETS, PRODUCTS AND TECHNOLOGY
ICE Regulated Futures Exchanges ICE OTC ICE Data & Services
Europe
Energy
Brent Crude
WTI Crude
Sour Crude
Gas Oil/Heating oil
Natural gas
Electricity
Coal
Emissions
OTC Iron Ore
OTC Energy
Oil and refined products
Physical/Financial gas
Physical/Financial power
Natural gas liquids
U.S. & Canada
Agricultural
Cocoa
Coffee
Cotton
Sugar
Orange Juice
Barley
Canola Oil
Financial
FX
US Dollar Index
Russell Equity Indexes
Market Data
Real-time prices/screens
Indices and end of day reports
Tick-data, time and sales
Market price validations
Services
ICE eConfirm
Coffee & cocoa grading facilities
OTC Credit – Creditex
CDS – indexes, single names, structured products
ICE Clear U.S., ICE Clear Canada ICE Clear Europe
Integrated Markets, Clearing and Technology
ICE Trust – CDS Clearing

6
ICE FUTURES & OTC GROWTH:ENERGY & CREDIT MARKETS
ENERGY
CUSTOMERS
ENERGY
PRODUCTS
• Electronic Markets
• Over 800 products listed for natural gas, power and refined oil products
• Approximately 280 cleared products
• Commercial energy companies 53%
• Banks/Financial institution 21%
• Liquidity providers (prop/algo/funds) 26%
ANNUAL FUTURES & OTC CONTRACT VOLUME - TOTAL(000s)
142
268
372
484
369
0
100
200
300
400
500
600
2005 2006 2007 2008 9-mos 2009
$0
$50
$100
$150
$200
$250
$300
2006 2007 2008
Natural Gas Power Oil & Other
$150
$212
$285
$222
OTC Energy Revenues(millions)
9-mos 2009

www.theice.com
BENCHMARKS AND PRICING:
ONE VISION FOR IRON ORE8th December 2009
Mike Davis, Director Market Development, ICE Futures Europe

8
• Introduction: Contexts around discussion, ICE role
• Where do ‘marker’ prices or ‘benchmarks’ come from?
• What function do they serve?
• Some comparisons in marker price structures
• Benchmark fundamentals: How judge their effectiveness?
• Derivatives and Underlying reference pricing
• Liquidity, correlation, hedging and investment
• The status quo, trends and pricing evolution
• Marker price candidates
• Market driven new benchmarks in Iron Ore & Steel
WELCOME:TODAY’S PRESENTATION

9
• The ‘benchmark’ and index marker prices or benchmarks
• Exchange role
• Spot price volatility, benchmark & index divergences
• Spot and forward curve price transparency, trends & linkages
• Local and global impacts
• Term structure and intermonth spreads
• Comment and debate around alternatives
INTRODUCTION: CONTEXTS AROUND BENCHMARK DISCUSSION
Platts’ 62% Iron Ore CFR N.China:Longest-running and first daily 62% Iron Ore price quotation

10
• Benchmarks provide a standard industry reference point which is fair, market related, transparent and understood by all participants
• Benchmarks facilitate business by providing a focal point for differential pricing of related commodities
• Benchmarks enable :
Hedging
(offsetting a price exposure with an equal and opposite exposure)
Price transparency
(discovery/dissemination of prices in real-time)
BENCHMARKS: DEFINITION TO RECOGNISE THEM BYWHAT ARE THEY, WHAT FUNCTION DO THEY SERVE?

11
BENCHMARKS AND RELATIONAL PRICING:A CRUDE OIL EXAMPLE
• Market develops around a single physical grade
• Other grades trade as a diff to the main contract
• Benchmark sets the underlying market price
• Differentials are agreed due to quality, location, availability
• Liquidity & transparency of core benchmark means pricing discussion can move to differentials
• Risk management tools develop around the benchmark
• Used for hedging and risk mgmt volume and transparency grows
• Benchmark is a pool of core liquidity for trading of a wide range of physical grades
• Conditions: benchmark must be liquid, transparent, fair, represent the true value of the commodity methodology clearly understood
A - Forcados (Dated
Brent plus $2.65)
B - Dated/ Forcados
diff. $2.65
C - Dated Brent $48.54
A B
C

12
BENCHMARK PRICING: WHY THEY MATTERBENCHMARK BEHAVIOURS & CORRELATIONS
Price relationships
Iron ore has a close price relationship with:• Steel• Energy, Coal especially• Freight• Emissions
Growth of benchmark credibility pools liquidity, enables cross-market margin capture and hedging.
As a host to 2 key commodity benchmarks logic of ICE clearing Iron Ore is clear.
Source: Platts

13
• Oil and Steel comparisons - not single commodities
• Benchmarking a pricing solution to lack of homogeneity
• 550 crude oil grades - how many can be benchmarks?
• Largest grades?– No
• Begs question - Why Brent and WTI price more than 60 mil b/day of 85 mil b/day – what is special about these two grades?
WHAT MAKES A PRICE BENCHMARK?

14
Some Criteria for (Global) benchmarks:
• (Globally) representative grade with substantial production/consumption volume
• Reflective of underlying global Iron Ore & Steel economics
• Diversified production and consuming bases - existence of intermediaries
• Market liquidity and price transparency – early stages in Iron ore
• Relative stability to other less economically or more economically-valuable crudes
• Openly and actively traded by a critical mass of varied parties, free of logistical bottlenecks
• Wide acceptance by the industry as representative
• Benchmarks become embedded via long-term contract pricing, financial instrument innovation, related pricing
• Standardised Terms and Conditions
• Fungible or Interchangeable with equivalent grades, relational pricing
• Adherence to international/standardised norms of trading
• Confidence in contract stability, execution and risk transfer, hybrid to indexed
SO WHAT MAKES AN EFFECTIVE BENCHMARK?

BENCHMARKS:ENABLING MARGIN TRADING: IRON / STEEL SPREAD
15
More directly in related metals markets, relational pricing on a differential basis can exist between Iron Ore and Steel
16
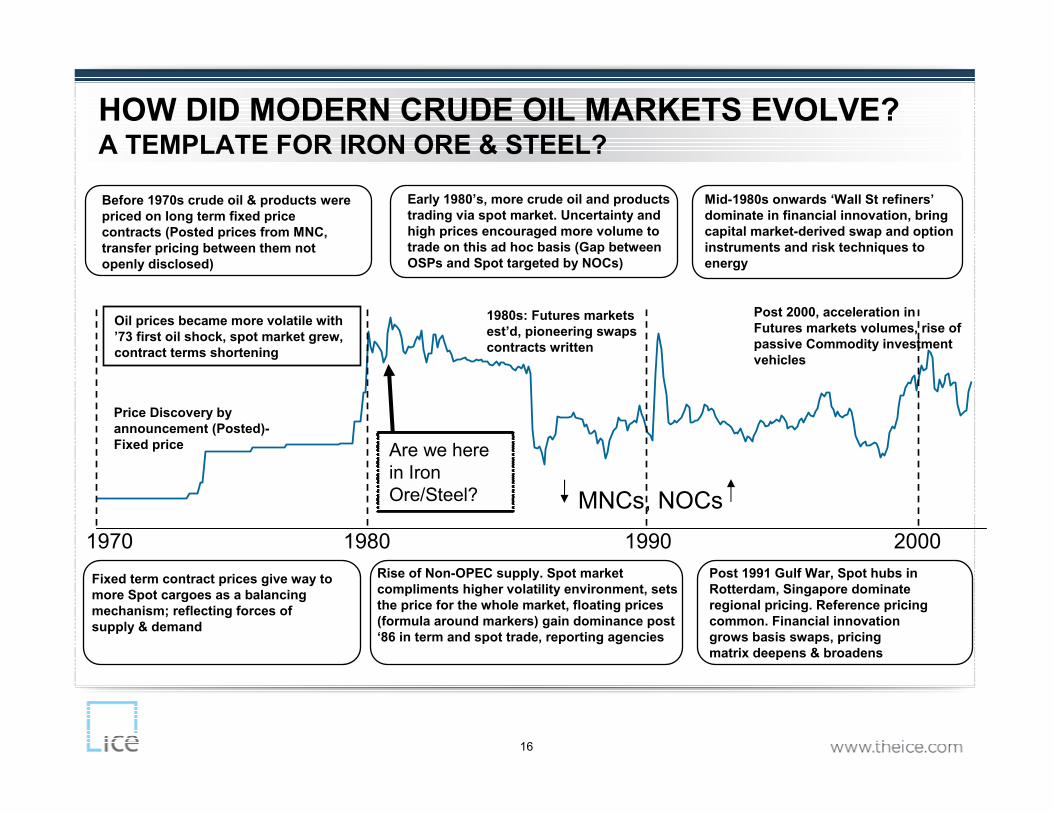
HOW DID MODERN CRUDE OIL MARKETS EVOLVE?A TEMPLATE FOR IRON ORE & STEEL?
Early 1980’s, more crude oil and products
trading via spot market. Uncertainty and
high prices encouraged more volume to
trade on this ad hoc basis (Gap between
OSPs and Spot targeted by NOCs)
Before 1970s crude oil & products were
priced on long term fixed price
contracts (Posted prices from MNC,
transfer pricing between them not
openly disclosed)
Fixed term contract prices give way to
more Spot cargoes as a balancing
mechanism; reflecting forces of
supply & demand
Rise of Non-OPEC supply. Spot market
compliments higher volatility environment, sets
the price for the whole market, floating prices
(formula around markers) gain dominance post
‘86 in term and spot trade, reporting agencies
Post 1991 Gulf War, Spot hubs in
Rotterdam, Singapore dominate
regional pricing. Reference pricing
common. Financial innovation
grows basis swaps, pricing
matrix deepens & broadens
1970 1980 1990 2000
Oil prices became more volatile with
’73 first oil shock, spot market grew,
contract terms shortening
Price Discovery by
announcement (Posted)-
Fixed price
1980s: Futures markets
est’d, pioneering swaps
contracts written
Mid-1980s onwards ‘Wall St refiners’
dominate in financial innovation, bring
capital market-derived swap and option
instruments and risk techniques to
energy
Post 2000, acceleration in
Futures markets volumes, rise of
passive Commodity investment
vehicles
MNCs, NOCs
Are we here in Iron Ore/Steel?

17
HOW DO THEY COME ABOUT? HOW DID WE GET HERE?
How to create a benchmark - not easy to design from scratch -Market finds its own solutions.
Then tends to find contractual accommodations if/when necessary, rather than move to a new benchmark
• A benchmark is a price used as a “proxy value” by market participants – 550 crudes, priced by three main ones - see price ranges, hundreds of ore grades – a handful will be key
• Markets typically use their most liquid commodities as benchmarks for less liquid ones.
• Liquidity is a function of number of trades and number of players, both in original spot markets, and for forward markets
• Liquidity attracts liquidity - momentum is key to benchmark growth
• Good benchmarks are created where the relationship between commodity X & Y is stable and predictable.
�The reliability of those relationships extend the core benchmark’s reach

18
HOW DO THEY COME ABOUT? HOW DID WE GET HERE?
Central elements of a benchmark’s success: continuing Industry engagement:
• Meets key liquidity criteria
• What are the key trade flows? Where does production and consumption take place? Are they still relevant to a global iron ore benchmark – 62% versus 63.5%
• Price discovery mechanisms – are they sufficient, do we know what we’re trading and what drives its price? What are the key pricing points?
• Why is liquidity coalescing around 62% Ore to China?
Futures - OTC nexus
• Benchmark evolution has varied in different regions - Asia, Europe and US
• Futures may take on part of benchmark role in very developed markets
• Futures underpin many other instruments – EFP, EFS, Futures based ‘Lookalike’calendar swaps

19
HOW DOES A BENCHMARK BEHAVE: PRICE MECHANISM
Benchmark behaviours:• Benchmarks should react to changes in market fundamentals of supply and demand, or price signals will be anomalous
• Price level signals trigger exploration, production and investment decisions, storage, transportation, consumption and reserve depletion/accretion levels. FC effects multiply the effect.
• Sustained manifestation of price instability or non-alignment can have a very serious effect on arbitrage economics, cracks, hedging, reference pricing, transfer prices, or taxation
Efficient functioning of a Benchmark price mechanism via the signals it gives matter because:• Relative price movements and levels put oil on the water or in pipe, flowing to the US from multiple International destinations in North America, Europe, the MidEast and Africa
• Relative prices decide which refined products are worth processing (from which crudes), which are worth selling or storing, and decide whether long-term investments in refining, pipelines or fields go ahead
• A high level of liquidity in the benchmark product, especially at times of market stress, ensures efficiency in the price mechanism – there is no liquidity ‘strike’ when the chips are down

20
HOW DOES THE MARKET USE THEM; WHY DO THEY MATTER?
• Their power comes from how much their price is leveraged for other prices, be that
for other physical grades or derivatives
• Benchmarks are visible and identifiable because they are traded or quoted openly,
and generally on an outright or ‘flat’ price basis
• They represent the core price of crude oil regionally or globally
• They possess the deepest liquidity pools, most advanced forward maturities in
tenors, and geographical dispersion of usage in pricing terms away from their core
benchmark location
• Tradable crude quality basis, geographical basis, and product ‘cracks’ can then be
‘sliced and diced’ by tenor and towards less-liquid differentials
• Transparency and price discovery
• Increasing role of futures in benchmark price discovery as spot volumes generally
decline worldwide, index providers monitoring futures or swap-related differentials

21
WHY USE A BENCHMARK?
Quick Answer – Easier to go with the flow…?
• Consumers - want price transparency
• There are tangible benefits for them
• Margins are protected via spread relationships (Most trading)
• Facilitate price risk management
What a benchmark won't do:
• NOT attempt to capture the price of every grade/size of a commodity, but then it doesn’t have to, just anchor the wider relational community
• NOT oblige producers to supply only one grade of a commodity – Acceptance of this benchmark as a standardised representative of the generic commodity plus or minus key index differentials is the critical condition
• NOT attempt to capture the price of that commodity in every location –locational basis differential instruments or EFPs can achieve that
• NOT remove the need to establish bilateral business relationships – OTC market can supplement a futures-related or spot flat-price benchmark

22
• Since inception in late 70’s Forward markets in oil have contributed to physical spot
trade in outright price discovery, as production trends have evolved and spot liquidity varied.
• Operational and logistical bar to forward markets is less onerous
• Forwards/futures in most developed commodity markets have near 24/7 trading, liquidity means often far more responsive in price discovery than less frequently traded spot underlyings
• Forwards/futures markets forward tenors discount the likely duration of fundamental trends and changes beyond the short-term reach of near-term spot markets 4/6 weeks out
• Spot assessments have used forwards/futures +/- diffs or seen the creation of synthetic futures-like instruments to enable assessments via Partials:
• E.g. Oil: Futures +/- EFP = Forward +/- Diff (CFD) = Spot Outright Products: Futures +/- EFP Diff = Spot Outright
• Innovation in bolting on additional grades to maintain pool of spot cargoes
FORWARD MARKET TRANSPARENCY, PRICE DISCOVERY

WHERE ARE IRON ORE MARKETS NOW AND WHERE ARE THEY
HEADING?
• Some comparisons in benchmark structures
• What a benchmark is, ICE approach compared to some others
• Where Iron Ore markets are heading in pricing terms…
• What kinds of choices might there be – have some Steel futures which have been successful, but many exchanges & products
• Is Asia now friendlier to futures- growth in some markets (China) although breadth of acceptance still low
23

FUTURE INDEX AND BENCHMARK SCENARIOS: SPREADS AND THE OIL EXAMPLE
• Hints that Iron ore looks similar in structure to the evolving Oil markets of the late 1970’s/early 1980’s
• The iron/steel spread is similar in concept to oil ‘crack spreads’ - both represent a pricing and processing differential between basic/raw and finished products
• Many integrated producers are more concerned with processing margin than flat price inputs in themselves
• Those circumstances chime with oil pricing and markets
• Traders favour quality, processing and timing spreads
• Volatility & direction considered more predictable than outright prices
24

IRON ORE AND BENCHMARKS
• If Iron Ore follows a similar path to other commodity (and energy) markets, the 62% Fe grade may become an important benchmark for relational pricing of other Iron Ore grades or even of finished products that relate to it.
• If that is the case, 58% and 65% Ore may trade at negative and positive differential respectively to 62%, and steel may trade as a positive differential to it in time.
– 62% Core benchmark
– 58%: 62% minus a differential e.g. -$2/dmt
– 65%: 62% plus a differential e.g. +$2/dmt
– Lump: 62% plus a differential e.g. +$1/dmt
– Steel: 62% plus a differential e.g. +$X/dmt (Red Hot spread)
25

26
BENCHMARK TRANSPARENCY ENABLES RISK MANAGEMENT
Benefits of Risk Management: Summary (More after the break)The value of forward prices and financial contracts:
• The development of Risk Management systems and processes enable identification, measurement and adjustment of risk and forward price exposure in particular according to an entity’s chosen and agreed degree of risk appetite
• Transparency in forward pricing and achievable investment returns, improves predictability of long term access to capital
• Can adjust the relative impact of price volatility
• Enables more predictable planning and budgetary control
• Protects margins, smoothes revenue and cost flows
• Locks in future cash flow, reduces need for capital reserves against shocks
• Can reduce the cost of capital via improved credit rating
• The ability to manage short-term price fluctuations can make long-term contracts more stable
• Risk management can become value added and management control tool vs. cost centre

RISK MANAGEMENT AND MARKET DEVELOPMENT
• This is the core of the ICE issue – can frame in terms of a number of questions to potential market participants
• All about the predictability of costs and revenue, about replacing forecasts with achievable forward prices, measuring risk, increasing forward price transparency and predictability, measuring and controlling risk, capital efficiency
• Key is linking physical price commitments/scheduling to financial constraints and opportunities
27

IRON ORE FINANCIAL MARKET POTENTIAL
28
Credit Suisse