risk assessment of a new high-speed railway
TRANSCRIPT
IMA Journal of Mathematics Applied in Business & Industry (1993/4) 5, 211-225
Risk assessment of a new high-speed railway
C. L. LEIGHTON
Network Technical Centre, Union Railways Limited, Wellesley Grove,Croydon CR9 1DY
C. R. DENNIS
W. S. Atkins Consultants Limited, Woodcote Grove, Ashley Road, Epsom,
Surrey KTI8 5BW
A quantitative risk assessment has been carried out for the conceptual stage of theproposed Channel Tunnel Rail Link (CTRL). The assessment is one of the first fora railway system. It includes an integrated computer model. The whole risk modelfor the CTRL from base event data, through fault and event trees, to individual,collective, and societal risks is processed using Lotus 1-2-3 spreadsheets. Variationsto the design and operational assumptions and to the input data can be introducedinto the model, and the effect on risk calculated rapidly. This versatility is particularlyuseful because of the early stage of the project. It can be used to assist designers inconsideration of possible design changes.
1. Introduction
Planning and outline design are underway for the Channel Tunnel Rail Link (CTRL).It will be a new 108 km high-speed railway between the Channel Tunnel and London.It is scheduled to open early in the next century. The Parliamentary Bill seeking thepowers to build the new line is expected to be introduced to Parliament in late 1994.The railway will complete the high-speed international passenger network betweenLondon and Paris, and London and Brussels. New-build domestic trains will alsouse the new railway, providing much improved commuter services between Londonand North Kent. The railway will be capable of carrying freight, such as that whichwill use the Channel Tunnel.
In support of the Bill, an outline Railway Safety Case (ORSC) has been prepared.It includes consideration of the project's safety management systems, the engineeringdesign standards to be used, and a quantified risk assessment (QRA).
During the last few years, the railway industry has begun to use QRA as a toolto guide decision making in safety investment. British Rail (BR) has made particularuse of QRA in determining whether individual safety investments are reasonablypracticable. The approach taken for the QRA for the CTRL builds on this body ofexperience within BR.
2. The railway
The CTRL will be a twin-track railway linking the terminus at St Pancras toEurotunnel's Channel Tunnel railway at Cheriton near Folkestone. There will be
211iT) Oxford University Press 1994
at Penn State University (Paterno L
ib) on May 12, 2016
http://imam
an.oxfordjournals.org/D
ownloaded from

2 1 2 C. L. LEIGHTON AND C.R. DENNIS
several junctions on the railway (e.g. to allow some international trains to run fromthe CTRL onto existing lines to access Waterloo International Station). Most of therailway will be in the open, but about a quarter will be in tunnels. The longest tunnelwill be on the approach to St Pancras. It will be about 14 km long, built in twohalves with an open box at Stratford in East London. Here, the tunnel arrangementwill be two single-track bores. A second similar but shorter tunnel will take therailway beneath the Thames. There will be several tunnels in Kent, the longest ofwhich will be a single twin-track tunnel of about 3 km under the North Downs. TheCTRL will have no level crossings, and all road crossings will be by bridges.
Trains running on the CTRL will be electrically powered using a 25 kV ACoverhead line. The international passenger trains will run typically at speeds of225 km/h, whereas the existing UK network is currently restricted to at most200 km/h. The passenger trains on the CTRL will have doors remotely controlledby the driver, there is not intended to be any of the older-style slam-door stock,currently used on the BR network. Drivers of trains on the existing UK network areadvised of whether it is safe to proceed by line-side signals. The CTRL will use atrain-borne signalling system: line-side radio beacons will transmit informationdigitally to equipment on each train.
The peak traffic daily will be up to 14 trains per hour in each direction. Anyon-track maintenance required will normally be scheduled at night, with one trackbeing closed to traffic, and any traffic run alternately up and down on the track thatremains open.
3. The QRA
There are two main objectives of the QRA:
• to produce estimates of the risk to passengers, staff, and members of the publicfrom the operation of the proposed CTRL, to give confidence that the railwaycould be operated safely
• to enable modifications to the design and operating concept of the railway to beassessed, to determine whether the levels of risk estimated for the CTRL are as lowas reasonably practicable (ALARP).
3.1 Safety criteria
In addition to complying with all mandatory safety requirements, the safety criteriaproposed for the new railway are
• to reduce risks to as low as reasonably practicable• to reduce risk to below designed safety values, where reasonably practicable.
The judgement of what is reasonably practicable is largely based on a quantifiedapproach. The potential benefit of a possible safety provision is estimated in termsof net present value, and similarly the cost of making the safety provision. If the costis not grossly disproportionate to the benefits, then the provision should be made.
The designed safety values are set well within the ALARP region (Ref. 1). Values
at Penn State University (Paterno L
ib) on May 12, 2016
http://imam
an.oxfordjournals.org/D
ownloaded from

RISK ASSESSMENT OF A NEW HIGH-SPEED RAILWAY 213
TABLE 1
Designed safety value Designed safety valuefor individual risk Number of for societal risk
Category (risk per year) deaths (risk per year)
Passengers 10 5 ^ 1 0 10"2
Staff 10"4 SstOO 10"3
are specified for individual risk to passengers, and to railway staff, and for societalrisk, i.e. the frequency of accidents entailing many deaths. The designed safety valuescurrently being prepared for the CTRL are shown in Table 1. The particularadvantage of setting designed safety values is realized in preparing equipmentreliability specifications for a base design.
In judging what is reasonably practicable, and in making comparisons withdesigned safety values for risk, it is necessary to estimate how likely and how severecould be the potential accidents on the railway. These estimates are the subject ofthe next sections of this paper.
3.2 Identification of potential hazards and fault sequences
The operation of a railway such as the CTRL involves a large number of train,passenger, and staff movements within the system, and there is always the potentialfor hazardous situations to arise, which could lead to casualties, wherever suchmovements exist. Therefore, before attempting to quantify the risk to passengers,staff, and members of the public from the CTRL, it has been necessary to identifythe potential hazards that could arise during the operation and maintenance of therailway. To gain as much benefit as possible from the wealth of experience that existson the operation and maintenance of railway systems when assessing the potentialhazards that could occur on the railway, it was decided that hazard and operability(HAZOP) studies would be used as the main hazard identification process.
HAZOP studies were originally developed in the late 1960s for use in the UKchemical industry and have only recently been considered for use in the railwayindustry. A HAZOP study is a structured meeting of a team of representatives fromthe various operational, engineering, and emergency-response disciplines who havedetailed knowledge of the system being studied. A HAZOP study is run by a chairmanwho is well versed in the HAZOP study technique and uses a series of predeterminedguide words and key words to prompt discussion within the team to identify all thepotential hazards relating to the system being studied, their causes and consequences,and (where appropriate) the safeguards to be provided to protect against or mitigatethe hazards. The keys to the success of a HAZOP study are the use of a searchingand structured procedure and the commitment of a balanced multidisciplinary team.
The CTRL HAZOP studies were particularly focused on
• the key differences between the CTRL and the British Rail system (most notablythe higher train speeds to be employed)
• infrequent events with potentially high consequences which do not feature inhistorical data.
at Penn State University (Paterno L
ib) on May 12, 2016
http://imam
an.oxfordjournals.org/D
ownloaded from

2 1 4 C. L. LEIGHTON AND C.R. DENNIS
A level 1 HAZOP study approach was selected as being consistent with the existinglevel of design, with the potential for more detailed (level 2) HAZOP studies to beundertaken in the later stages of the design of the CTRL.
3.3 Classification of hazards
To quantify the risk to passengers, staff, and members of the public, it has beennecessary to classify the hazards identified in the HAZOP study meetings intoparticular hazard categories to form a 'fault schedule'. The CTRL fault schedule,which will become a 'living document' to be revised and updated throughout the lifeof the CTRL project, provides a comprehensive listing of all the hazards, their causes,the factors which could affect the consequences resulting from each hazard, and thesafeguards intended to be provided to prevent the hazard occurring or to mitigatethe consequences should the hazard occur. In order to provide additional confidencein the completeness of the fault schedule, the development of the fault schedule alsoincluded a detailed review of the records of accidents that have occurred on the BRsystem over the last ten years.
For the purposes of the QRA, the most effective way of classifying the hazardsin the fault schedule was seen to be the use of the same classification of trainaccidents, movement accidents, and non-movement accidents as used by HM RailwayInspectorate, which is as follows:
• train accidents: accidents to trains and rolling stock• movement accidents: accidents to people caused by the movement of railway
vehicles but excluding those involved in train accidents• non-movement accidents: accidents to people on railway premises but not
connected with the movement of railway vehicles.
From a review of these accident types, it was concluded that movement andnon-movement accidents tend to be relatively frequent events which generally onlylead to single casualties. There is a large database of such incidents on BR. However,while train accidents can be relatively frequent events with low consequences, thereis also the potential for infrequent events with high consequences, such as a highspeed collision, for which there is, thankfully, little recorded experience. The ORSCcontains an assessment of the risk from each hazard identified on the fault schedule.
3.4 Quantification of risk from movement and non-movement accidents
The risk from movement and non-movement accidents has been quantified byreviewing the data on these types of accidents that have occurred on BR, andnormalizing them to take into account the characteristics of the CTRL, i.e. we askthe question 'If the infrastructure and operations of the whole BR system were exactlythe same as that proposed for the CTRL, how would the number of fatalities andmajor injuries differ from that recorded on BR?' Having established the number offatalities and major injuries that would be applicable to the CTRL case, thepopulation of BR passengers and staff who are exposed to each type of accident have
at Penn State University (Paterno L
ib) on May 12, 2016
http://imam
an.oxfordjournals.org/D
ownloaded from

RISK ASSESSMENT OF A NEW HIGH-SPEED RAILWAY 215
been assessed to give the estimated levels of risk that could be expected frommovement and non-movement accidents on the CTRL.
3.5 Quantification of risk from train accidents
As there is little recorded experience of particularly the infrequent high-consequencetrain accidents, it has been necessary to calculate the risk from train accidents usingstandard risk-assessment techniques, as follows:
• fault-tree analysis to assess the frequency of the potentially hazardous eventsthat could occur on the CTRL
• event-tree analysis to assess the possible outcomes (fault sequences) that couldresult from each hazardous event
• collection and compilation of data for use in the fault trees and event trees• assessment of the consequences, in terms of the deaths and major injuries, which
could result from each fault sequence.
As the frequency and consequences of train accidents can vary quite considerably atdifferent locations along the proposed CTRL, for the purposes of the QRA, the CTRLhas been divided up into a number of'representative sections' such as open trackat grade level, open track on embankment, single-track tunnel, twin-track tunnel,and stations, where the frequency and/or consequences of train accidents could besignificantly different. This process has resulted in the quantification of the risk from36 different types of train accident (hazardous events) involving collisions, derail-ments, and fires at different locations on the CTRL. The overall risk associatedwith the CTRL has then been estimated by summing the risk from each individualhazardous event.
3.5.1 Fault-tree analysis. The frequency of each hazardous event has been assessedusing fault-tree analysis. Fault-tree analysis is a technique which can be used torepresent the individual failures or combinations of failures which can produce anundesirable end or 'top event', e.g. a derailment. Logical operations known as gatesare used to work systematically back from the top event to the originating failures.The most commonly used gates in fault-tree analysis are AND and OR gates. AnAND gate is used when a combination of input failures must occur for the top eventto occur, and an OR gate is used when any input failure will cause the topevent to occur. By assigning probabilities or frequencies to each input event and,where necessary, using the mathematical rules of Boolean algebra, the frequencies/probabilities can be combined together at each gate to give the top event probabilityor frequency as required.
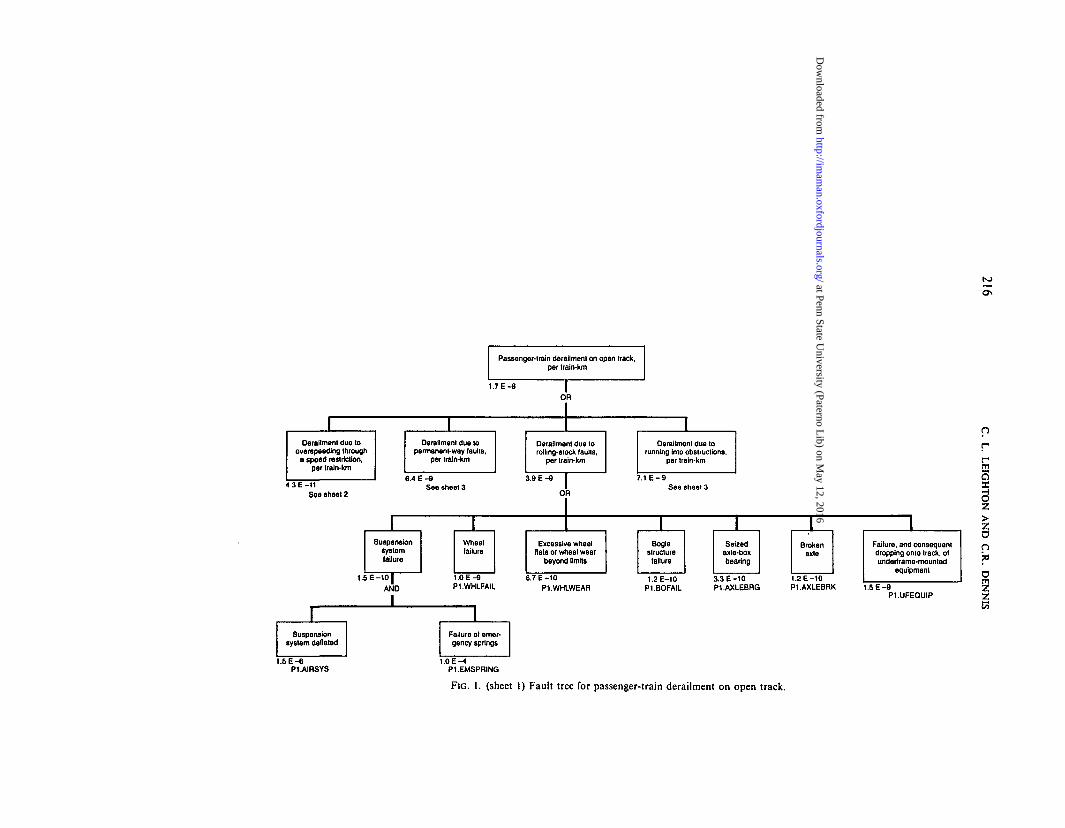
The fault trees have been developed to a level which is consistent with the currentstage of design, and to which the frequencies or probabilities of failure for individualevents are supportable by existing data. The analysis is therefore a high-level fault-treeanalysis and does not include a detailed analysis of systems such as the signalling ortrain-braking systems. An example of the fault-tree analysis relating to passenger-train derailment on open track is presented in Fig. 1.
at Penn State University (Paterno L
ib) on May 12, 2016
http://imam
an.oxfordjournals.org/D
ownloaded from
Passenger-train derallmeni on open track,per train-km
1.7 E - 8
0
IDerailment due to
overspeeding througha speed restriction,
per train-km
1Derailment due to
permanent-way faults,per traln-km
R
Derailment due torolling-stock faults,
per Irain-km
BiF-O 3 4F-9
" E - 1 1 See sheet 3See sheet 2 0
1Suspension
systemfailure
1.5E-10I
|
Wheellailure
O E - 9
A N D P1.WHLFA
II I
Suspensionsystem donated
1.5 E - 6P1.AIRSYS
1
Excessive wheelflats or wheel wear
beyond limits
3.7 E-10
IL P1.WHLWEAR
Failure of emer-gency springs
1.0 E -4P1.EMSPRING
1Derailment due to
running into obstructions,per Irain-km
M E-9See sheet 3
IBogle
structurefailure
1.2E-10
ISeized
axle-boxbearing
3.3 E-10
IBroken
axle
1.2 E-10
1Failure, and consequentdropping onto track, ofunderframe-mounted
equipment
P1.BOFAIL P1.AXLEBRG P1.AXLEBRK 1 .5E-9P1.UFEQUIP
pp
m
aHTO
N
>Z
D C
.R. D
ENN
IS
FIG. 1. (sheet 1) Fault tree for passenger-train derailment on open track.
at Penn State University (Paterno L
ib) on May 12, 2016
http://imam
an.oxfordjournals.org/D
ownloaded from

To sheet 1Derailment due lo overspeedmg
through a speed restriction,per traln-km
4.3E-11
AND
Number ol speed restrictionsper km ol open track
3.8 E - 2P1/OT.RES
Train overspeeds througha speed restriction, due
to equipment faults
1 16-6 T
Probability of overspeed beingsignificant enough tocause a derailment
P1/OTDER
Braking system fallsto reduce train speed.given that the driver
or ATP applies brakes
Speed restriction notIdentified to the ATP
via track data(incorrect track data)
t.oE-eP1.BRKFAIL
1.0E-7TKDATA
Independent failuresleading to train
overspeed and non-tnpping of ATP
1.2 E - 8 |AND
Condition of driverresulting In Incorrecttram-data input andfailure to observe a
speed restriction
P1.0RV-COMM
Failure ol Iralnbome equip-ment resulting commonly in
wrong-side error In train-speedor larget-speed Indication lo
driver and to ATP circuits
1.0 E - 6ATP-COMM
Train driven at greaterspeed than permitted
ATP fails to limitspeed
1.1 E-4rWrong-side error in
speed IndicationDnver fails to observe
speed restriction
1.0E-5
No ATP responselo overspeed
ATP-IND DRV-RES1.0E-4 I
OR
ATP/brake systeminterface vent valve
tails to open
1.2 E-SATP-VENT
Incorrect train dataInput to ATP
ATP fails lo limit speed,due to equipment laulls
1 0 E - 4PI ATP-DATA
FIG. 1. (sheet 2) Fault tree for passenger-train derailment on open track.
at Penn State University (Paterno L
ib) on May 12, 2016
http://imam
an.oxfordjournals.org/D
ownloaded from

To sheel 1Derailment due to permanent-way faults,
per train-km
6.4 E -9OR
OO
1 1 1Defective switch or
crossing
L I E - 9P1/OT.TKSWITCH
Spread gauge
1.1 E-10P1/OT.TKGQE
Derailment causedby a broken rail
B.7E-10P1/OT.TKBRKRL
I I ITrack buckled
9.4 E-10OT.TKBKE
Formation failure
1.2 E-9P1/OT.TKFORM
Track twist
3.3 E -10P1/OT.TKTWIST
Miscellaneous trackfaults
2.0 E -9P1/OT.TKMISC
Vehicles fallingfrom roadoverbridge
1.1 E-10OT.BHGVEH
Objects fromoverbridges
35E-10I
OR
Derailment due torunning into obstructions,
per train-km
7.1 E -0.9
Objects placed online by vandals
2.5 E -9OT.VANDALS
Animals on the line
2.0 E-11OT.ANIMALS
Tree blownonto line
Compacted snow
OT.TREES1.8E-10
OT.SNOW
Vehicles throughboundary fence
1.2E-9OT.FENVEH
Landslips Miscellaneousobstructions
1.5 E - 9OT.SUPS
1.4 E -9OT.MISC.
Road overbridgestructural lailure
1.8E-11OT.BRGSTRU
Items dislodged fromroad overbridge dueto a traffic accident
2.3 E-10OT.BRGRTA
FIG. 1. (sheet 3) Fault tree for passenger-train derailment on open track.
prr-ESO
lpjoam
Z
at Penn State University (Paterno L
ib) on May 12, 2016
http://imam
an.oxfordjournals.org/D
ownloaded from

RISK ASSESSMENT OF A NEW HIGH-SPEED RAILWAY 219
3.5.2 Event trees. Once a train accident such as a derailment has occurred, then—depending on the circumstances of the event—there are a number of possibleoutcomes having significantly different levels of severity. To quantify the frequenciesfor these different possible outcomes (fault sequences), use has been made of eventtrees.
An event tree takes the form of a diagrammatic representation of the events whichcould occur following an initiating event. It is defined as a tree because therepresentation expands out like the branches of a tree as an increasing number ofphysical effects, component or system failures, or operational errors are considered.Once the event tree is fully expanded, probabilities can be assigned to each branchof the tree and combined with the frequency of the initiating event (calculated fromthe fault-tree analysis described above) to give frequency for each fault sequence. Anexample of the event-tree analysis relating to passenger-train derailment on opentrack is presented in Fig. 2.
3.5.3 Fault frequency quantification. In general, quantified risk assessments carriedout for industries such as nuclear power or oil and gas suffer from the lack of actualfailure-rate data associated with the equipment being analysed, and therefore tendto be based largely on generic failure rate data. In the railway industry, however, acomprehensive record of train accidents and system failures and, in most cases,their associated causes has been kept on a computer database for the last ten yearsof BR operations. Therefore, wherever possible, the frequencies and probabilitieswhich form the input into the fault trees and event trees have been derived from BRhistorical data.
It has been recognized, however, that characteristics of the CTRL infrastructure,operations, and rolling stock will be quite different to the situation that exists on theBR network to which the historical data relate. Examples of these differences are
• the average train speed will be significantly higher on the CTRL than on BR• the level of testing, inspection and maintenance of the track and its associated
components will be higher on the CTRL than on BR• all equipment will be specified to conform to modem standards• the rolling stock will be designed to conform to the fire standards for rolling stock
which will travel underground.
Thus, historical data, when applied to the CTRL, have been normalized to takeaccount of the distinct characteristics of the CTRL when compared to BR. Wherehistorical data are not available, use has been made of generic component failure-ratedatabases and individual human-factor assessments using the human-error assessmentand reduction technique (HEART). To improve the level of confidence in the results,sensitivity analyses have been carried out on any key assumptions which have beenmade in normalizing or adapting the data to the CTRL situation.
3.5.4 Assessment of consequences. After the fault sequences from each hazardousevent were identified, the consequences were assessed in terms of passenger and staffcasualties (deaths plus major injuries) that could arise from each sequence. From areview of the limited historical data available on the consequences of train accidents,
at Penn State University (Paterno L
ib) on May 12, 2016
http://imam
an.oxfordjournals.org/D
ownloaded from

Initiating event:passenger-train
derailmentper Irain-km
Does the trainremain withinits envelope
Y/N
Direction ofderailmenttowards thecess or line?
C/L
Is there asecondary
collision with astructure?
N/Y
Is the nexttrain on
the adjacenttrack pass, or(reight? P/F
Is therea secondary
collision with apassenger train?
N/Y
Is therea secondary
collision with afreight train?
N/Y
Faultsequencenumber
Faultsequencefrequency
toO
Y 0.83
1.7E-8 2.1P-1
N 0.17
C 0.5
2.1 P-2
L 0.5
N 0.05
2.1P-3
Y 0.95
P 0.88
2.1 P-4
F 0.12
N 0.61
2.1P-5
Y 0.39
N 0.60
2.1 P-6
1
2
3
4
5
1.4E-8
7.4E-11
1.4E-9
7.9E-10
5.1E-10
C. L
.L
EIG
F
3
I A
ND
C.R
.D
EN
N
m
Y 0.40
1.0E-10
7.0E-11
FIG. 2. Event tree for passenger-train derailment on open track.
at Penn State University (Paterno L
ib) on May 12, 2016
http://imam
an.oxfordjournals.org/D
ownloaded from

RISK ASSESSMENT OF A NEW HIGH-SPEED RAILWAY 221
it has been concluded that, for any given train loading, the number of casualtiesassociated with each fault sequence can be estimated confidently within a rangehaving the upper and lower bounds separated by a factor of ten, e.g. 1 to 10,5 to 50, 10 to 100 etc. For the purposes of the QRA, a number of casualties havebeen assigned to each fault sequence where, to avoid the use of the pessimisticupper-bound estimates for all fault sequences, the assigned value represents theapproximate midpoint value of a range with endpoints related by a factor of ten, e.g.an assigned value of 5 would represent the approximate midpoint of the range 1 to10. The use of the approximate midpoint of the range implies that the upper-boundestimate of consequences would be a factor of 2 higher than the assigned value, andthe lower-bound estimate would be a factor of 5 lower than the assigned value.The assigned values based on the approximate midpoint estimates can thereforebe considered to represent prudently pessimistic estimates of the consequences foreach fault sequence, since an average value based on the geometric midpointsof the ten-to-one range would be a factor of 1.5 lower than the approximate midpointvalues.
The assessment of the range of consequences applicable to each fault sequence inthe event trees has been made using judgement, taking into account:
• historical data on train accidents• the characteristics of the CTRL• train speed (taking into account that the amount of energy to be absorbed in
bringing the train to a halt varies with the square of the train speed)• incident location• the conditions for evacuation etc. which are relevant to the fault sequence• the differences between two similar fault sequences, e.g. a passenger-train
derailment, on open track at high speed, that does not involve a secondary collisionwith an adjacent structure or another train could result in 10 to 100 casualties(assigned value 50), whereas a corresponding incident that also involves a secondarycollision with an adjacent structure could result in further damage to the train in thelocation of the impact, leading to the possibility of between 5 and 50 additionalcasualties (midrange value 25), giving an overall assigned value of 75 casualties
• other conditions which may be relevant to the fault sequence.
The consequence bands have been assigned to each fault sequence on the assumptionthat the trains are fully loaded (approximately 800 passengers per train). In practice,however, the trains will not always be fully loaded, and—if no allowance for trainloading were made—the results of the analysis would be unduly pessimistic. Thenumber of casualties for each fault sequence have therefore been modified to takeaccount of the average train loading. The consequences in terms of the numbers ofstaff casualties have been individually assessed for each fault sequence considered inthe assessment based on historical data and judgement assuming a fixed number ofstaff on each type of train.
When the number of casualties applicable to each consequence band is deter-mined, an estimate is made of how the total number of casualties would be dividedbetween deaths and major injuries for each fault sequence. A review of historicaltrain accidents, combined with judgement, has been used to derive the proportion
at Penn State University (Paterno L
ib) on May 12, 2016
http://imam
an.oxfordjournals.org/D
ownloaded from
2 2 2 C. L. LEIGHTON AND C.R. DENNIS
of casualties that would be deaths and major injuries for each type of accident,such as
• in collisions between trains, 0.3 deaths to 0.7 major injuries• on derailments, 0.1 deaths to 0.9 major injuries• in fires where people are directly exposed to the fire, 0.5 deaths to 0.5 major injuries• in fires where people are only exposed to smoke, 0.3 deaths to 0.7 major injuries.
Once the frequencies and consequences for each fault sequence have been estimated,the risk from each fault sequence is calculated and then summed to give the overallrisk for each hazardous event. The levels of risk in terms of the individual riskand societal risk are then calculated for comparison with the designed safety valuesfor risk.
3.6 Computerization of the model
The overall analysis of the CTRL for the mixed-traffic case (passenger and freighttrains using the CTRL) consists of the quantification of 36 individual types ofhazardous event involving in excess of 30 fault trees and 100 event trees which breakdown into over 3000 individual fault sequences. In addition, the output from eachevent tree requires a significant amount of processing to prepare the results in termsof the measures of risk to be used for comparison with the designed safety values.The risk-quantification process is clearly too large for manual calculation of theresults to be considered, and therefore it was decided that significant advantagescould be obtained from the use of an integrated computer-based model for fault treesand event trees, which would quantify the overall results of the analysis.
While there are commercially available fault-tree, event-tree, and combinedfault-tree-event-tree packages currently available on the market, none of theminclude the results-processing capability required to produce a fully integrated modelappropriate to the project. However, as the fault trees are of a sufficiently high levelnot to involve the need for complex minimal-cutset analysis, it was decided that thedata storage, the fault-tree and event-tree graphics and quantification, and the resultsprocessing could be achieved using the PC-based spreadsheet package Lotus 1-2-3Version 3 to produce a fully integrated model.
The Lotus 1-2-3 package is a three-dimensional spreadsheet package allowing upto 250 individual two-dimensional spreadsheets (sheets) to be created with each file.The fault-tree, event-tree, and results processing for each hazardous event have beenproduced on a separate spreadsheet which is linked to the main project data file(contained in a separate spreadsheet file) for the data input. The results from eachmodel are then linked to an overall results file for the quantification of overall risk.The spreadsheet models are constructed in a way that allows the modelling of differenttrain distributions and passenger loadings over a day in terms of the peak, off-peak,and night service.
In this way we have produced, for the first time, a fully integrated risk model ofa railway system which enables the basic input data to be processed into the formof risk estimates and the results presented in terms of the predetermined measures
at Penn State University (Paterno L
ib) on May 12, 2016
http://imam
an.oxfordjournals.org/D
ownloaded from

RISK ASSESSMENT OF A NEW HIGH-SPEED RAILWAY 223
of risk for direct comparison with the safety criteria. By using this fully integratedPC based spreadsheet risk model we can
• estimate the risk to passengers and staff in terms of individual risk to the mostexposed groups
• estimate the frequency and consequences for each key fault sequence to be usedfor societal risk calculations
• carry out sensitivity analyses relating to the changes in the overall risk estimateswhich will result from changes to input data and assumptions
• establish the failure rates or failure probabilities required for particular com-ponents, subsystems, or systems to be quoted in the CTRL equipment-specificationdocuments
• assess the impact of some equipment not being available• assess the potential benefits of proposed system modifications in the ALARP
assessment which will follow the QRA.
4. Uses of the QRA
4.1 Identification of reasonably practicable safety enhancements
The concept for the CTRL has many design and operational safety improvementswhen compared to the existing rail network. In addition to those mentioned inSection 2, these include: modern crash-resistant and fire-resistant rolling stock;severe limits on the transport of hazardous goods; high-quality permanent way; noworking on a line while it remains open to traffic; and a high standard of fencingto discourage trespassers, animals, and vandalism. However, it would be technicallypossible to provide yet further safety measures. A key use of the QRA is to guidethe designers on which measures are appropriate, and which are not. The approachtaken, as described in Section 3.1, involves comparing the benefit of the measurewith its cost in terms of net present value, and considering whether there is a grossdisproportion.
One example of such an assessment related to the question of whether theproposed 3 km tunnel under the North Downs in Kent should be built as a singletwin-track tunnel or as two single-track tunnels. The main safety benefits of thesingle-track configuration would be in the event of a serious derailment. In thetwin-track configuration, there would be a chance of a train travelling on the othertrack running into the derailed train and making the accident worse. There wouldalso be some safety benefit in two single-track tunnels if it were ever necessary todeal with a serious train fire in which the train was forced to stop in the tunnel.These safety benefits need to be weighed against the fact that the ground con-ditions at the North Downs strongly favour the twin-track configuration. Alsothe twin-track configuration would have safety benefits in some types of accident,mainly due to the better access which a larger tunnel affords. Using the QRA, itwas estimated that, if the tunnel were built as a single-track configuration purelyon safety grounds, it would be placing a value in excess of £40 million on eachpotential death avoided. This valuation was felt to be grossly disproportionate tothe safety benefit.
at Penn State University (Paterno L
ib) on May 12, 2016
http://imam
an.oxfordjournals.org/D
ownloaded from
2 2 4 C. L. LEIGHTON AND C.R. DENNIS
The assessment indicated that a twin-track configuration would be appropriate inthis case. However, it also showed that a relatively inexpensive system of derailmentcontainment might be worthwhile, if it could be devised. Accordingly, work has beenput in hand to investigate the feasibility of a low concrete barrier between the twotracks. It would contain the wheel flanges of a derailed bogie, preventing potentiallydangerous lateral movement.
4.2 Ease of identification of key safety issues
The integrated computerized QRA model can be used to estimate the effects of designor operational perturbations rapidly. This facilitates sensitivity analyses, which canbe used easily to identify which modelling assumptions and data dominate the risks.This information allows
• consideration of possible safety enhancements to be directed towards measuresthat have the greatest potential to reduce risks
• specification of minimum acceptable safety performances to support design stan-dards (e.g. for earthworks stability) and procurement (e.g. in signalling systems, toprevent wrong-side failure—i.e. failure critical to safety) and in the future safetytesting and commissioning.
• highlighting of key safety parameters (e.g. train speed) to guide designers andbusiness planners in their development of the project
• targeting of future safety assessment work on the key areas (e.g. data forderailment frequency).
5. Conclusions
The Channel Tunnel Rail Link can be built to deliver high standards of safety inoperation by carefully targeting expenditure on safety measures and thus avoidingincurring excessive additional costs. The QRA for the CTRL Outline Safety Casehas demonstrated the following.
(a) The HAZOP study methodology can be successfully applied to a railwaysystem.
(b) The production of a 'fault schedule' can form the basis of a 'living document'which can be revised and updated throughout the life of the project to providea comprehensive up-to-date list of the hazards present on the railway, their causes,and the safeguards in place, or to be provided, to prevent or mitigate against thehazards.
(c) A fully integrated PC spreadsheet risk model can be produced to quantify therisk from train accidents on the CTRL to
• enable the sensitivity of the results to changes in input data to be quantified easily• establish the rates or probabilities of failure required for particular components,
subsystems, or systems to be quoted in the CTRL equipment specification documents.
at Penn State University (Paterno L
ib) on May 12, 2016
http://imam
an.oxfordjournals.org/D
ownloaded from

RISK ASSESSMENT OF A NEW HIGH-SPEED RAILWAY 225
• enable modifications to the design of the railway to be assessed to determinewhether the levels of risk estimated for the CTRL are ALARP.
REFERENCES
1. HEALTH & SAFETY EXECUTIVE, 1993. The tolerability of risk from nuclear power stations.HMSO, London.
at Penn State University (Paterno L
ib) on May 12, 2016
http://imam
an.oxfordjournals.org/D
ownloaded from