interaction railway bridges speed lines
TRANSCRIPT

i
v
r(x)
Train–Track–Bridge Interaction for non‐ballasted Railway Bridges
on High‐Speed Lines
THERESE ARVIDSSON ANDREAS ANDERSSON
TRITA‐BKN, Report 165 ISSN 1103‐4289 ISRN KTH/BKN/R‐‐165‐‐SE
Structural Engineering and Bridges, 2017 Civil and Architectural Engineering
KTH, SE‐100 44 Stockholm www.byv.kth.se


Train–Track–Bridge Interaction for non-ballasted Railway Bridges
on High-Speed Lines
THERESE ARVIDSSON ANDREAS ANDERSSON
Report Stockholm, Sweden 2017

TRITA-BKN. Report 165, 2017 ISSN 1103-4289 ISRN KTH/BKN/R--165--SE
KTH School of ABE SE-100 44 Stockholm
SWEDEN
Royal Institute of Technology (KTH) Department of Civil and Architectural Engineering Division of Structural Engineering and Bridges

i
Abstract
This report contains a comprehensive parametric study on the coupled dynamic train–track–bridge interaction (TTBI) system for non-ballasted railway bridges. The existing design limits in Eurocode EN 1990 A2 regarding vertical deck acceleration and vertical deck displacement is compared with the wheel–rail forces and car body acceleration from simulations.
The simulations are based on a 2D TTBI model with linear Hertzian contact that allows for loss of contact. The model has been verified against both other numerical simulations as well as experiments, all with good agreement. The parametric study consists of a large number of theoretical bridges, all optimized to reach the limit of either vertical deck acceleration or vertical deck displacement. The study comprises both single- and double track bridges.
The track irregularities are found to be of paramount importance. Two different levels are therefore studied; “higher track quality” corresponding to a well-maintained track for high-speed railways and “lower track quality” corresponding to the Alert Limit in EN 13848-5. The final conclusions are based on the “lower track quality” in order not to underestimate the risk of running safety and passenger comfort. Simulations with the bridge excluded show that the additional contribution from the bridge is low, especially for the lower track quality.
The existing limit for vertical deck acceleration is set to 5 m/s2 in EN 1990 A2 and is based on a very simple assumption of the gravity acceleration reduced by a factor 2. The results in this report show that this likely is a too conservative measure of the running safety. Based on the wheel–rail forces from the simulations, the resulting wheel unloading factor and duration of contact loss does not reach critical values before the deck acceleration is beyond 30 m/s2.
In EN 1990 A2, a vertical car body acceleration of 1 m/s2 is stipulated as “very good level of comfort” and is indirectly limited by the vertical deck displacement. Good agreement is generally found in the simulations between deck displacement and expected car body acceleration. In the simulations, the limit for car body acceleration is always exceeded before the running safety is compromised.
Keywords: non-ballasted railway bridges, slab track, deck acceleration, train–bridge interaction, wheel–rail force, running safety, passenger comfort, car body acceleration.

iii
Sammanfattning
I denna rapport redovisas omfattande parameteranalyser avseende dynamisk samverkan av det kopplade systemet fordon–spår–bro för järnvägsbroar med ballastfria spår. Nuvarande krav i Eurokod EN 1990 A2 avseende vertikal broacceleration och vertikal nedböjning jämförs med simuleringar av kontaktkraft mellan hjul–räl och acceleration i vagnskorgen.
Simuleringarna baseras på en 2D modell med linjär Hertz-kontakt som medger kontaktsläpp. Modellen har verifierats mot både andra simuleringar och experiment, samtliga med god överenstämmelse. Parameteranalysen omfattar ett stort antal teoretiska broar, samtliga optimerade att uppnå kraven på antingen vertikal acceleration eller nedböjning av bron. Studien omfattar både enkelspårs- och dubbel-spårsbroar.
Valet av rälsojämnheter visas ha avgörande betydelse för resultaten. Därför studeras två olika nivåer, “hög spårkvalitet” motsvarande ett väl underhållet spår för höghastighetsbanor samt “låg spårkvalitet” motsvarande Alert Limit i EN 13848-5. Slutsatserna baseras på resultat med ”låg spårkvalitet” för att inte underskatta risk avseende trafiksäkerhet eller fordonskomfort. Simuleringar där bron exkluderas från analysen visar att bron har liten inverkan på resultaten, särskilt för fallet med låg spårkvalitet.
Nuvarande krav på vertikal acceleration av bron är 5 m/s2 enligt EN 1990 A2, baserat på ett förenklat antagande av tyngdaccelerationen reducerat med en faktor 2. Resultaten i denna rapport visar att detta troligtvis är ett alltför konservativt mått på trafiksäkerhet. Hjul–rälkrafter från simuleringarna visar att resulterande hjul-avlastning och varaktighet av kontaktsläpp inte når kritiska värden innan broaccelerationen är över 30 m/s2.
I EN 1990 A2 benämns en vertikal vagnskorgacceleration på 1 m/s2 som ”hög komfort-nivå”, vilket indirekt kontrolleras genom att begränsa brons vertikala nedböjning. Simuleringarna visar generellt god överenstämmelse mellan bronedböjning och förväntad vagnskorgsacceleration. I simuleringarna överskrids värdet för komfort alltid innan risk för trafiksäkerhet föreligger.
Nyckelord: ballastfria järnvägsbroar, ballastfria spår, acceleration i brodäcket, tåg–bro–interaction, hjul–rälkrafter, risk för urspårning, passagerarkomfort, fordonsacceleration.


v
Preface
The research presented in this report has been funded by the Swedish Transport Administration via the research project TRV 2016/56769, “Brodynamik på höghastighetsbanor–gränsvärden för säkerhet och komfort”.
The project consists of theoretical simulations of the dynamic response of non-ballasted railway bridges from passing high-speed trains. The limits for vertical deck acceleration and vertical deck displacement according to Eurocode EN 1990 are compared with running safety indices from the wheel–rail contact forces and the riding comfort of the vehicle, obtained from simulations.
Stockholm, October 2017
Therese Arvidsson & Andreas Andersson

vii
Contents
Abstract i
Sammanfattning iii
Preface v
1 Introduction 1
Background . . . . . . . . . . . . . . . . . . . . . . . 1 1.1
Aim and scope . . . . . . . . . . . . . . . . . . . . . . 2 1.2
Limitations . . . . . . . . . . . . . . . . . . . . . . . 2 1.3
Outline of the report . . . . . . . . . . . . . . . . . . . . 3 1.4
2 Train–Track–Bridge Interaction 5
Train model . . . . . . . . . . . . . . . . . . . . . . . 5 2.1
Track model . . . . . . . . . . . . . . . . . . . . . . . 7 2.2
Track profile quality . . . . . . . . . . . . . . . . . . . . 9 2.3
Wheel–rail contact model . . . . . . . . . . . . . . . . . . 13 2.4
Coupled equations of motion . . . . . . . . . . . . . . . . . 15 2.5
Running safety measures . . . . . . . . . . . . . . . . . . 15 2.6
Passenger comfort indices . . . . . . . . . . . . . . . . . . 18 2.7
Theoretical validations . . . . . . . . . . . . . . . . . . . 19 2.8
2.8.1 Transition zones . . . . . . . . . . . . . . . . . . . 19
2.8.2 Validation of linearized Hertz contact model . . . . . . . . 20
2.8.3 Validation against 2D model results . . . . . . . . . . . 23
Experimental validations . . . . . . . . . . . . . . . . . . 25 2.9
2.9.1 Measured wheel–rail forces . . . . . . . . . . . . . . . 25
2.9.2 Measured bridge deck acceleration . . . . . . . . . . . . 25

viii
3 Parametric study 29
Input parameters . . . . . . . . . . . . . . . . . . . . . 29 3.1
3.1.1 Bridges . . . . . . . . . . . . . . . . . . . . . . 29
3.1.2 Trains . . . . . . . . . . . . . . . . . . . . . . 32
3.1.3 Track and track profile . . . . . . . . . . . . . . . . 33
3.1.4 Analysis procedure . . . . . . . . . . . . . . . . . . 36
Results . . . . . . . . . . . . . . . . . . . . . . . . . 37 3.2
3.2.1 Double-track bridges . . . . . . . . . . . . . . . . . 39
3.2.2 Single-track bridges . . . . . . . . . . . . . . . . . 42
3.2.3 Single-track bridges with reduced cross-sections . . . . . . . 42
3.2.4 Correlation between vehicle and bridge response . . . . . . 44
3.2.5 Running safety indices for further reduced cross-sections . . . 45
3.2.6 Rail pad stiffness . . . . . . . . . . . . . . . . . . 47
4 Conclusions 49
General remarks . . . . . . . . . . . . . . . . . . . . . . 49 4.1
Deck acceleration vs. wheel–rail force. . . . . . . . . . . . . . 50 4.2
Deck displacement vs. riding comfort . . . . . . . . . . . . . . 51 4.3
Further research . . . . . . . . . . . . . . . . . . . . . 51 4.4
Acknowledgments . . . . . . . . . . . . . . . . . . . . . 52 4.5
Bibliography 53
A Double-track bridges 57
A.1 Input parameters . . . . . . . . . . . . . . . . . . . . . 57
A.2 Lower track quality . . . . . . . . . . . . . . . . . . . . 59
A.3 Higher track quality . . . . . . . . . . . . . . . . . . . . 77
A.4 Rail pad stiffness . . . . . . . . . . . . . . . . . . . . . 92
B Single-track bridges 93
B.1 Input parameters . . . . . . . . . . . . . . . . . . . . . 93
B.2 Lower track quality . . . . . . . . . . . . . . . . . . . . 96
B.3 Higher track quality . . . . . . . . . . . . . . . . . . . 114
C Single-track bridges with reduced cross-section 129
C.1 Input parameters . . . . . . . . . . . . . . . . . . . . 129
C.2 Lower track quality . . . . . . . . . . . . . . . . . . . 132
C.3 Higher track quality . . . . . . . . . . . . . . . . . . . 150

1.1. BACKGROUND
1
1 Introduction
Background 1.1
The design of railway bridges for high-speed lines includes, apart from the static design, also a set of dynamic design limits. Following Eurocode EN 1990 (CEN, 2005), the most important design criterions are related to the vertical deck acceleration and the vertical deck displacement, both during train passages. A theoretical study by Andersson and Svedholm (2016) only concerning the dynamic design showed that the bridge deck acceleration is typically decisive for bridge spans up to 30 m, while the deflection limit is decisive for longer spans.
The background to the bridge deck acceleration criteria is the fact that high accelerations have been shown to lead to ballast destabilisation. This leads to rapid deterioration of track quality and stability. Increased maintenance is needed to reduce the risk for derailment. Shake table tests undertaken in connection to the work of the ERRI committee D214 (ERRI, 1999a) showed that ballast loses its interlock at accelerations exceeding 0.7 g. A safety factor of 2 leads to the stipulated acceleration limit of 3.5 m/s2 for ballasted bridges (CEN, 2005). Shortly after the opening of the Paris to Lyon high-speed line, ballast instability problems were observed on some of the short span bridges. The subsequent investigations showed that the train speed and axle distance induced resonance loading with bridge deck accelerations of 0.7–0.8 g. Shake table tests confirmed the results, although further research is still needed on the dynamic behaviour of ballast and particularly which frequency range that is of interest for ballast destabilisation. According to EN 1990, 0–30 Hz (or the three lowest natural frequencies of the bridge) should be considered.
For non-ballasted bridges (bridges with slab track) the limit is instead 5 m/s2 (0.5 g). This limit is related to the assumed loss of contact between the wheel and the rail at the gravitational acceleration 1 g, again with a safety factor of 2 (Zacher and Baeßler, 2002). However, the motive behind this limit seems as a rather crude simplification with little physical background. There is no obvious relation between the wheel–rail contact and the bridge deck acceleration; the wheel being separated from the bridge deck by means of the rail, fastenings and the track slab. The risk for derailment due to loss of wheel–rail contact at bridge deck accelerations above 5 m/s2 has not been shown with simulations or observed in measurements. Interestingly, there is no corresponding Eurocode limit of the dynamic wheel unloading for trains running on track
Chapter

CHAPTER 1. INTRODUCTION
2
embankments, except for what is implicitly given by the maintenance limits for track irregularities. In the European design codes related to vehicle engineering, the wheel unloading is used only in connection to quasi static wheel–rail forces and in evaluating the risk for overturning due to wind loading. Thus, there is an inconsistency between the design codes for the two fields.
The generally accepted method of evaluating passenger comfort is based on measurements on car body acceleration over a certain track length. Human sensitivity weighting filters are applied to the root-mean-square of the car body acceleration. Bridges could pose a risk for elevated car body acceleration as the train traverses the vibrating deck. EN 1991-2 (CEN, 2010a) allows for an indirect verification of the passenger comfort, based on limits for the bridge deck deflection given in EN 1990. These limits are intended to ensure a very good comfort with maximum car body acceleration of 1 m/s2. It is of interest to study the car body acceleration in simulations where the bridge deck deflection limit is met. Interestingly, there are significant differences between the Eurocode limits and the serviceability limits in the Japanese design codes (RTRI, 2007).
Aim and scope 1.2
The aim of this work is to study the relation between the vertical bridge response (deck acceleration and displacement) and the vertical vehicle response (wheel–rail force and car body acceleration). Specifically, the aim is to evaluate whether the EN 1990 bridge deck acceleration limit (5 m/s2) is a relevant and necessary measure of the running safety of trains at non-ballasted bridges. At the same time, the passenger comfort is assessed in relation to the limit on maximum car body acceleration (1 m/s2) and the serviceability bridge deflection limit. Even more analyses would be needed to say something definitive concerning the deflection limit. In the scope of the study, bridges with spans 10–80 m are investigated in a parametric study.
Limitations 1.3
The train–track–bridge interaction is modelled in 2D, which allows us to analyse thousands of train passages at a relatively low computational time. As a consequence of the 2D model, the lateral dynamics are neglected. However, the aim is to study the vertical bridge deck acceleration and deflection limits. The 2D analysis is motivated by the assumption that the vertical bridge vibration will primarily affect the vertical wheel–rail forces.
The parametric study is limited to single span simply supported bridges and continuous bridges in two and three spans. The supports are assumed fixed. The cross-sectional properties are based on the optimised cross-sections for concrete slab bridges, steel–concrete composite bridges and concrete beam bridges presented in Svedholm and Andersson (2016). These have not been checked for static loading. The purpose is primarily to obtain cross-sections at the design limit for dynamic loading with reasonably realistic cross-sections. The bridges are assumed to carry one or two tracks. Sequences of simply supported spans are not treated as they are not usually built in
1.4. OUTLINE OF THE REPORT
3
Sweden. The track profile quality has been chosen based on the recommendations in EN 13848-5 (CEN, 2015), EN 13848-6 (CEN, 2014) and TDOK 2013:0347 (Trafikverket, 2015). Track irregularity profiles are obtained from random samples of theoretical Power Spectral Density (PSD) functions. The track stiffness follows recommendations in design standards and relevant literature (Trafikverket, 2016; UIC, 2008b; DB, 2002). The train model is based on the EN 1991-2 HSLM-A load model, however the mechanical properties of the carriages is not given in the Eurocode and has therefore been assumed. The car body acceleration from the rigid multi-body vehicle model serves as a rough measure of the passenger comfort with no consideration of the flexibility of the car body or the dynamic properties of the passenger seats.
In relation to the level of bridge deck acceleration discussed in this report, no consideration has been taken to what the acceleration would infer for auxiliary installations on the bridges such as drainage pipes and traction line towers. The Eurocode limits for bridge rotations at support are not considered in this report. Svedholm and Andersson (2016) showed that limits for rotations are often exceeded before the Eurocode deflection limit. However, the limits for rotations are presumably based on ballasted bridges. It is deemed unsafe to use these for bridges with non-ballasted tracks, as it probably depends on the design of the track at the bridge end.
Outline of the report 1.4
In Chapter 2, the coupled 2D train–track–bridge model is described, as a further development from the model by Cantero et al. (2016). The properties of the track and the use of rail irregularities are presented. The criterion for running safety and passenger comfort is described. Furthermore, the model is validated against both other simulation models and experimental data with good agreement.
Chapter 3 presents the main results from an extensive parametric study. The bridge properties are taken from Svedholm & Andersson (2016), consisting of a large set of theoretical cross-sections that all reach the dynamic design limits in EN 1990. Other parameters that are studied in Chapter 3 are the track irregularity and rail pad stiffness, the influence with/without bridge, double track / single track bridges and bridges with further reduced cross-sections.
Conclusions are made in Chapter 4, regarding the deck acceleration vs. wheel–rail forces and the deck displacement vs. the passenger comfort. Further research is proposed.
Additional results from the parametric study is found in Appendix A (double–track bridges), Appendix B (single–track bridges) and Appendix C (single–track bridges with reduced cross-section).


2.1. TRAIN MODEL
5
2 Train–Track–Bridge Interaction
The theoretical model (Figure 2.1) is a 2D coupled train–track–bridge finite element (FE) model based on the framework developed by Cantero et al. (2016). The model includes the vehicle, the track and the bridge subsystems. The bridge is modelled as a finite element 2D Euler–Bernoulli beam in one simply supported span or several continuous spans. The model has been updated to include a linearized Hertzian spring contact that allows for loss of contact.
Figure 2.1: 2D train–track–bridge coupled model.
Train model 2.1
The train carriage is represented by a 10 degree of freedom (DOF) rigid multi-body system including the car body (2 DOF), bogies (4 DOF) and wheels (4 DOF). The primary and secondary suspension systems are represented by springs and dashpots in parallel. For conventional bogie (non-articulated) trains the interaction between adjacent carriages is neglected. For articulated trains, where adjacent carriages share a Jacobs’s bogie, a stiff vertical coupling between adjacent car bodies is considered; see Figure 2.2. The geometrical and mechanical input properties depend on the particular vehicle to be modelled. However, selecting these properties is not a trivial issue since the masses of the vehicle components and the suspension properties are not generally available other than to the rolling stock manufacturers.
vCar bodySec. susp.
BogiePrim. susp.
WheelRail, Irreg.
Rail padTrack slab
Substructure
r(x)
Chapter

CHAPTER 2. TRAIN–TRACK–BRIDGE INTERACTION
6
Figure 2.2: Articulated train model.
In this study, a vehicle model representing the Eurocode HSLM trains is established. The 10 HSLM trains are defined in EN 1991-2 (CEN, 2010a) with axle loads 17–21 ton/axle and total length of 370–400 m. The wheelbase within the bogie is 2.0–3.5 m and the bogie distance is 18–27 m.
The Eurocodes provide no information on vehicle mechanical properties. The data presented in Table 2.1 is based on articulated train properties found in the literature, which have been adjusted to fit the HSLM load model. A wheel mass of 2000 kg is chosen as a realistic upper limit value as high unsprung mass increases the wheel–rail forces. The car body mass for each of the HSLM A1–A10 trains is adjusted to give the corresponding axle load.
The car body and bogie inertia are derived from the simple formula for the inertia of a rigid rectangle and give pitch frequencies close to 1 Hz for the car body and 7–8 Hz for the bogie. The primary and secondary suspension stiffness is adjusted to give realistic bogie- and car body bounce frequencies, 5 Hz and 0.7 Hz, respectively. The primary and secondary damping ratio is assumed at 20 % and 15 %, respectively. The suspension properties are assumed the same for the leading and trailing (non-articulated) carriages, as well as for the side cars and the central articulated carriages. The assumed HSLM vehicle properties are similar to the TGV model presented in (Kouroussis et al., 2014).
Table 2.1: Assumed HSLM vehicle properties with symbols according to Figure 2.2. Values are presented here for train number A1 and A10; the properties for the remaining trains lie in between these values.
Car type Central Side Leading/trailing
HSLM train A1 A10 A1 A10 A1 A10
mc (kg) 27160 35310 40740 52970 54320 70630
Ic (106 kgm2) 0.91 2.49 1.02 3.06 1.33 1.72
mb (kg) 3500 3500 3500 3500 3500 3500
Ib (kgm2) 1240 1240 1240 1240 2700 2700
mw (kg) 2000 2000 2000 2000 2000 2000
kp (MN/m) 1.4 1.3 1.4 1.3 1.4 1.3
cp (kNs/m) 20 19 20 19 20 19
ks (MN/m) 0.64 0.88 0.64 0.88 0.64 0.88
cs (kNs/m) 39 53 39 53 39 53
1 leading carriage
ks, cs
kcc>>ks
1 side carriageN central carriages
kp, cpmw
mc, Ic
mb, Ib
kc

2.2. TRACK MODEL
7
Track model 2.2
In the non-ballasted track system, the axle loads on the rail is distributed to the concrete slab by means of rail fastenings. The concrete slab is about 30 cm thick and is in turn supported by a layer of compacted engineering material or a cement stabilised layer. The track stiffness (commonly expressed as the stiffness experienced by each rail) is mainly governed by the rail fastenings and to some degree also by the substructure. Adequate track stiffness is important for the riding and track stability and to limit the forces on the vehicle and track components (UIC, 2008a). Given the vertical wheel load Q and the vertical rail displacement zrail, the track stiffness for one rail is defined by Equation (2.1), see also Figure 2.3.
Ktrack = Q/zrail (2.1)
Figure 2.3: 2D track model under a wheel load Q with resulting rail deflection zrail.
A commonly suggested value for the rail displacement under a 20-tonne axle load is 1–2 mm (UIC, 2008a), resulting in a recommended slab track stiffness of 50–100 MN/m. A slab track stiffness of 64 ± 5 MN/m is recommended by Deutsche Bahn (DB, 2002). The Swedish standards instead recommend a track stiffness in the higher end of the interval: 90–110 MN/m (Trafikverket, 2016).
The track stiffness is always higher than the support point stiffness under each rail fastening as the deformation of the track distribute the load to several support points. The support point stiffness is the combined stiffness of the track components and the subgrade. In the slab track, the rail fastenings must provide the elasticity that the ballasted bed gives in a ballasted track. This normally results in a rather soft pad with a standard stiffness of 22.5 MN/m (DB, 2002; UIC 2008b).
Figure 2.4 shows the track stiffness and rail displacement as a function of subgrade bed modulus for two different values of pad stiffness. As seen, there is a threshold subgrade bed modulus at about 50 MN/m3 above which increasing subgrade stiffness has small effect on the total track stiffness. Above the threshold, the track stiffness is mainly governed by the pad stiffness.
Er, Ar, Ir, r
krp, crp
kss, css
Es, As, Is, s
Q s
zrail
tslab

CHAPTER 2. TRAIN–TRACK–BRIDGE INTERACTION
8
Figure 2.4: Track stiffness and rail deflection as a function of substructure bed modulus.
In some non-ballasted track systems, prefabricated sleepers are integrated in the slab by in-situ infill concrete (e.g. Rheda, Züblin). Altogether prefabricated track slabs are also used (e.g. Bögl, ÖBB-PORR, Japanese Shinkansen tracks, CRTS China Railway Track System). The slab is generally separated from the supporting structure (cement stabilised layer, bridge or tunnel) by means of a bituminous mortar a couple of centimetres thick. Even if it has some degree of elasticity, the main purpose of the mortar is to make replacement possible. For sections where sound or vibration insulation is needed, a rubber mat or elastic bearings can separate the track from the surroundings. The slab has the advantage that it requires less maintenance compared to a ballasted track to achieve the high track quality required for a high-speed railway line. The main disadvantage is the higher cost for construction.
The track structure is modelled as a combination of beams and spring–dashpots with properties according to Table 2.2. The UIC60 rails are modelled as either Euler–Bernoulli or Timoshenko beams connected to the track slab at each fastening location by a spring and dashpot in parallel. The commonly recommended fastening stiffness 22.5 MN/m per rail pad (DB, 2002; UIC 2008b) is adopted, with a 10 % damping ratio. The effect of an increase in pad stiffness is studied in Section 3.2.2. The slab is modelled as a Euler–Bernoulli beam supported by a continuous spring bed representing the substructure (on embankment) or mortar layer (on bridge).
The bed modulus given in Table 2.2 is multiplied with the slab width, bs, (3.2 m at embankment and 2.4 m at bridge) to obtain the 2D spring stiffness per meter track. The resulting track stiffness is shown in Figure 2.4. A joint is typically introduced to the track slab at the track–bridge transition. Therefore, the track slab is modelled as discontinuous over the bridge supports. No special consideration has been taken to model the transition zone between embankment and bridge. The example in Section 2.8.1 shows that an abrupt change in substructure stiffness introduces relatively small variation in the wheel–rail force as compared to the effect of the irregular track profile.

2.3. TRACK PROFILE QUALITY
9
Table 2.2: Slab track model properties for the full track (two rails) with symbols according to Figure 2.3.
Rail Slab Pads and elastic layer Er 210 GPa Es 34 GPa krp 22.5x2 MN/m Ar 15.38·10-3 m2 As 0.96 m2 crp 5.47 x2 kNs/m Ir 61.1·10-6 m4 Is 7.2·10-3 m4 s 0.6 m ρr 7850 kg/m3 ρs 2400 kg/m3 Kbed 100 MN/m3 bs 3.2 m / 2.4 m ts 0.3 m
Track profile quality 2.3
Track irregularities in the wavelength range around 0.5–150 m and longer are deviations from the ideal track geometry generated from, for example, settlements, the sleeper spacing and irregular track stiffness. EN 13848-5 (CEN, 2015) defines wavelength ranges D1 (3–25 m), D2 (25–70 m) and D3 (70–150 m), where the lower range is more relevant for running safety (wheel–rail forces) and the upper range is more relevant for passenger comfort (CEN, 2015; Cantero et al., 2016).
As the unsprung axle masses traverse the irregular profile, variations in the wheel–rail forces arise, providing an additional excitation of the train–track–bridge system. This increase in load can lead to higher bridge response. For the vehicle, the running safety and passenger comfort is affected. The short wavelengths influence the wheel–rail forces but are effectively filtered out by means of the suspension system, while the longer wavelengths can excite the car body modes of vibration (Cantero et al., 2016).
As an example, the vertical car body frequency (0.5–1 Hz) lies within the range of the frequencies induced by the 70–150 m wavelengths in the speed range 100–400 km/h (0.2–1.6 Hz). EN 13848-5 stipulates limit values for the maximum deviation for gauge, twist, alignment and for the vertical direction. Zero to peak limits from EN 13848-5 and TDOK 2013:0347 (Trafikverket, 2015) are given in Table 2.3.

CHAPTER 2. TRAIN–TRACK–BRIDGE INTERACTION
10
Table 2.3: EN 13848-5 and TDOK 2013:0347 zero to peak values (mm) for the vertical track irregularities. The limits are given for the highest available speed category.
EN 13848-5 (300–360 km/h) D1 (3–25 m) D2 (25–70 m) D3 (70–150 m) Alert limit (AL) 6–8 8–10 – Intervention limit (IL) 7–10 8–12 – Immediate action limit (IAL) 14 16 – TDOK 2013:0347 (200–250 km/h) D1 (1–25 m) D2 (25–70 m) D3 (70–150 m) NYTT 2 7 10 NYJUST 2 7 10 PLAN 4 10 14 UH1 6 14 20 UH2 8 20 28 KRIT 16 28 36
EN 13848-6 (CEN, 2014) presents a cumulative frequency distribution of the standard deviation, σ, of track irregularities in the European network. Track quality class A–E are defined for speed range 0–300 km/h. In Figure 2.5 the track quality classes are extrapolated to include speeds up to 400 km/h. Track quality D (90th percentile) or better is recommended as alert limit for standard deviation.
Figure 2.5: EN 13848-6 track quality classes for vertical standard deviation.
Random track irregularities are often idealised as stationary random processes, described by power spectral density (PSD) functions. Examples are given in Figure 2.6. The German PSD, S m2/(rad/m) is given by:
2p c
2 2 2 2r c
( )( )( )
AS
(2.2)

2.3. TRACK PROFILE QUALITY
11
Figure 2.6: Theoretical irregularity PSD functions: German, σ3–25 = 1.0 mm, (Berawi, 2013) and Chinese non-ballasted tracks, σ3–25 = 0.3 mm, (Zhai et al., 2015).
for wavelengths Ω rad/m, Ωr = 0.0206 rad/m, Ωc = 0.8246 rad/m and track quality factor Ap rad·m (Claus and Schiehlen, 1998). Ap can be adjusted to scale the profile to the desired track quality. Spatial samples are extracted from the PSD functions by means of the inverse Fourier transform with random phases assigned to each harmonic component.
Theoretical PSD functions have the shortcoming that they cannot reproduce the isolated defects that are present in the real track profiles and therefore tend to produce profiles with less variation in maximum deviations as compared to measured profiles. This is illustrated in Figure 2.7, where the variation in running standard deviation for a measured and a theoretical profile is given. Thus, there is a compromise between a matching standard deviation and matching zero to peak values.
Figure 2.7: Comparison between measured track irregularities from a Swedish railway section and a scaled sample obtained from the German PSD.
10-2 10-1 100
Spatial frequency (1/m)
10-8
10-6
10-4
10-2
German low disturbanceChina ballastless track

CHAPTER 2. TRAIN–TRACK–BRIDGE INTERACTION
12
Figure 2.8 shows a sample with Ap = 4.032 rad·m according to the German “low disturbance” level as given in Berawi (2013). The generated profile has standard deviation σ3–25 = 1.0 mm in D1, at the upper limit of EN 13848-6 class D for speeds > 300 km/h. As can be seen, the zero to peak values are just below the EN 13848-5 Alert Limit for D1–D3.
Figure 2.8: German PSD track profile sample with σ3–25 = 1.0 mm in D1 (3–25 m), zero to peak values are just below the EN 13848-5 Alert Limit for D1–D2.
0 50 100 150 200 250 300 350 400Distance (m)
-10
0
10
z ri (
mm
)
D1: 3-25 m
AL lower bound
0 50 100 150 200 250 300 350 400Distance (m)
-10
0
10
z ri (
mm
)
D2: 25-70 m
AL lower bound
0 50 100 150 200 250 300 350 400Distance (m)
-10
0
10
z ri (
mm
)
D3: 70-150 m
0 50 100 150 200 250 300 350 400Distance (m)
-20
0
20
z ri (
mm
)
1-150 m, including D1-D3

2.4. WHEEL–RAIL CONTACT MODEL
13
Wheel–rail contact model 2.4
The contact between the wheel and the rail is realised through a linearized Hertz contact spring. The non-linear Hertz contact can be described by the force–deformation relation (Dinh et al., 2009):
3 12 4
C H H w r2
2, where
3(1 - )
EF C R RC
(2.3)
where Rw is the radius of the wheel and Rr the radius of the rail, both with elastic modulus E and Poisson ratio ν. For small deformations, δ, the normal wheel–rail force can be linearly represented by a stiffness coefficient (Dinh et al., 2009):
2/3
1 1C 3 4
C C w r2
3 2
2 3 1
dF Ek F R R
d
(2.4)
The Hertz contact relations are plotted in Figure 2.9. When the wheel loses contact with the rail, the force is set to zero. Thus, we have the relation:
C w r w w r w
w r w
, 0
0, 0
k u u r u u rF
u u r
(2.5)
where F is the wheel–rail force depending on the compression in the contact spring from the deflection of the wheel, uw, the deflection of the rail in contact, ur, and the track irregularity rw. The relative wheel–rail deflection (uw–ur–rw) is plotted against duration of contact loss in Figure 2.10 for the HSLM-A1 train on samples from the German PSD. Time histories are given for a very low-quality profile including a comparison between the presented Hertz contact model and a Hertzian spring contact model that does not allow for loss of contact. Some differences in the wheel–rail force is seen at 400 km/h where significant contact losses occur. The two models give similar results at 300 km/h where only small contact losses occur.
Figure 2.9: Hertz contact force–deflection relation, where the tangent to the curve is the contact stiffness. A linear approximation is shown at the preload 100 kN.

CHAPTER 2. TRAIN–TRACK–BRIDGE INTERACTION
14
Figure 2.10: Relative wheel–rail displacement: HSLM A1 (20th carriage, 1st wheel) at 20 m single span slab bridge for speeds 100–400 km/h, where the duration of contact loss generally increases with speed. Examples of time histories are given for the German high disturbance profile. Results from a Hertz contact model that does not allow for loss of contact are included for comparison.
4.5 5 5.5 6Time (s)
-100
0
100
200
400 km/h, high disturbance (unfiltered)
4.5 5 5.5 6Time (s)
-100
0
100
200
400 km/h, high disturbance (filtered at 20 Hz)
4.5 5 5.5 6Time (s)
-100
0
100
200
300 km/h, high disturbance (unfiltered)
4.5 5 5.5 6Time (s)
-100
0
100
200
300 km/h, high disturbance (filtered at 20 Hz)
Hertzian spring, no loss of contactHertzian spring, loss of contact
0.001 0.01 0.015 0.025Duration of contact loss (s)
0.001
0.01
0.1
1
10
100Wheel-rail displacement during contact loss
German high disturbance3-25
= 1.65 mm
German low disturbance3-25
= 1.0 mm

2.5. COUPLED EQUATIONS OF MOTION
15
Coupled equations of motion 2.5
The coupled equations of motion of the train–track–bridge model can be expressed in terms of block matrices adopting the sub-indices V, T and B to indicate vehicle, track and bridge subsystems respectively:
B
T
V
B
T
V
BTB
BTTVT
TVV
B
T
V
BTB
BTT
V
B
T
V
B
T
V
F
F
F
X
X
X
KK
KKK
KK
X
X
X
CC
CC
C
X
X
X
M
M
M
,
,,
,
,
,
0
0
0
0
00
00
00
00
(2.6)
The coupling of the subsystems is expressed with off-diagonal terms in Equation (2.6). The coupling terms between the track and bridge remain constant, since there is no change in their configuration during one simulation. On the other hand, the coupling terms from the linearized Hertzian contact between the vehicle and the track depend on the vehicle’s position. These terms are time-dependent as they include the shape function of the beam element at the point of contact and thus need to be recalculated for every time step in the Newmark solution.
Moreover, in each time step the contact stiffness needs to be updated according to Equation (2.5). The contact stiffness is initially based on the contact condition from the previous time step (contact or loss of contact). Iterations are performed within each time step to update the contact. For small time steps, the solution with and without iterations converge.
The external force vector F includes the contributions due to the gravity and the excitation due the track irregularities. For further modelling details the reader is referred to Cantero et al. (2016).
Running safety measures 2.6
There are several possible reasons for derailment; among them can be mentioned rail breakage, geometrical imperfections in wheels or turnouts and obstacles on the track. Other reasons are related to the horizontal and vertical forces between the rail and the wheels of the running vehicle; lateral track shifting, flange climbing, vehicle over-turning, and rail rollover. The wheel–rail force consists of (1) the static part, (2) the quasi-static part (additional forces developed when the vehicle passes a curved track section with constant speed and cant), and (3) the dynamic part.
This work deals mainly on the variation in the dynamic force from the bridge characteristics, e.g. resonance and the passing from embankment to bridge and also from the track structure, e.g. sleeper passing frequency or variations in track stiffness and track irregularities.
Lateral forces, e.g. centrifugal forces on curved bridges, wind- or earthquake loading are neglected. Thus, the running safety is evaluated only on basis of the 2D vertical motion of the coupled train–track–bridge system.

CHAPTER 2. TRAIN–TRACK–BRIDGE INTERACTION
16
Loss of contact may occur for high dynamic wheel loads, which under certain conditions can lead to derailment. A commonly used measure for the risk of derailment is the flange climbing criterion based on both vertical and lateral forces. Flange climbing is possible due to the frictional lifting force acting on a flange that is rolling against the rail at an angle. Flange climbing occurs if the vertical force is not large enough to prevent the wheel from climbing onto the top of the railhead. The risk for flange climbing is highest at the presence of large lateral forces and can thus be assessed by the quotient of the lateral, Y, to the vertical, Q, wheel–rail force. Nadal’s equation gives a limit for the Y/Q ratio for contact angle β and friction coefficient μ:
tan( )
1 tan( )
Y
Q
(2.7)
The limit for the Y/Q ratio is set to 0.8 in EN 14363 (CEN, 2016) for signals low-pass filtered at 20 Hz and with a sliding mean with 2.0 m window length. The filtering and sliding mean of the signal is in line with field tests and simulations that show that derailment from flange climbing only occurs when the limit has been exceeded for a certain distance or time duration (Iwnicki, 2006; Ishida and Matsuo, 1999; Montenegro, 2015). The relative wheel–rail displacement needs to overcome the flange height, typically 30 mm, in order for the wheel to derail. Thus, derailment does not occur instantly. The Japanese National Railways (JNR) suggests that the Y/Q ratio can exceed the safety limit for time periods shorter than 50 ms (Matsudaira, 1963; Iwnicki, 2006).
Ishida and Matsuo (1999) suggest that the Shinkansen high speed train is safe from derailment as long as the Y/Q ratio limit is not exceeded for more than 15 ms. Using a model of the flange–rail contact they showed that the wheel rise is below 1 mm for critical Y/Q ratio below 15 ms duration. Montenegro (2015) concludes that Ishida and Matsuo’s proposed time duration limit of 15 ms is overly conservative as the relative displacements between the wheel and the rail is small compared to the amount needed for the wheel to climb the flange and derail.
Since the present study adopts at a 2D model, the risk for derailment will be assessed based on the wheel unloading ratio:
0 min,dyn
0 0
Q QQ
Q Q
(2.8)
where Q0 is the static vertical wheel load and Qmin,dyn is the minimum dynamic vertical wheel load. Loss of contact occurs at ∆Q/Q0 = 1. Given a certain duration of contact loss and the presence of a lateral force, the contact loss could pose a risk for derailment.
In the Chinese design code for railway bridges on high-speed lines, Chinese National Railway Administration (2014), the running safety is based on both the derailment coefficient derailment coefficient Y/P ≤ 0.8 and the unloading factor ΔQ/Q0 ≤ 0.6.

2.6. RUNNING SAFETY MEASURES
17
In Japanese standards the dynamic wheel unloading is limited to 0.8 for normal track maintenance profiles and 0.37 for analyses with smooth profiles (RTRI, 2007). Moreover, running safety limits for bridge deflection, Figure 2.12, end rotations and differential displacements are given as an alternative to a train–bridge–interaction analysis. The European design code EN 14363 limits the wheel unloading to ΔQ/Q0 < 0.6 for the quasi-static wheel forces, while EN 14067 (CEN, 2010b) applies the limit 0.9 related to cross wind loading.
In the present study, two measures of running safety are adopted:
- filtered wheel unloading ΔQ/Q0 < 0.6, - unfiltered wheel unloading, duration of contact loss < 15 ms.
The filtered wheel unloading is calculated from wheel–rail forces filtered at 20 Hz, as suggested by EN 14363. This implies that short-time contact losses originating from higher oscillation frequencies are filtered out. For oscillations at the 20 Hz filter frequency, contact losses that occur when the peak of the oscillation reach 0 has a maximum time duration of about 25 ms, as shown in Figure 2.11.
Figure 2.11: Illustration of the typical time duration of contact loss, t < 25 ms, for a specific oscillation frequency f = 20 Hz.
In the evaluation of the results, the filtered wheel unloading is compared to the quasi-static EN 14363 limit at 0.6. Secondly, the duration of contact loss from the unfiltered wheel unloading signal is compared to the 15 ms limit. A very rough estimate of the wheel rise that occurs during contact loss is the relative wheel–rail displacement that develops during the contact loss in the 2D model. Recalling Figure 2.10 shows that the maximum wheel rise is well below 30 mm (typical flange height) for time durations up to around 15 ms. The Japanese limit on unfiltered wheel unloading (0.8) is not adopted in the present study, but comparisons are made.
The most relevant conclusions on running safety on bridges can be drawn from a comparison between the running safety indices for trains running on bridges and on a plain track section. This is due to the high influence of the track quality level on the wheel–rail forces.
0 0.05 0.1 0.15Time (s)
-50
0
50
100
150
200
t = T/2, t = 0.025 s
f = 1/T, f = 1/0.05 = 20 Hz

CHAPTER 2. TRAIN–TRACK–BRIDGE INTERACTION
18
Passenger comfort indices 2.7
EN 12299 (CEN, 2009) outlines the general procedure for evaluation of passenger comfort in railway traffic. Mean comfort indices, NMV, are calculated from the root mean square (rms) of a frequency weighted acceleration signal in all three directions. The 95-percetile from 60 samples, each 5 second long, should be used. Partial comfort indices may be calculated for each direction. The weighted 5 second rms samples are denoted continuous comfort indices. The frequency weighing filters take account of the sensitivity of the human body to different vibration frequencies and directions. EN 12299 provides scales for both mean comfort and continuous comfort. The highest comfort level, “very comfortable”, has NMV < 1.5 or continuous rms comfort index < 0.2 m/s2. Procedures for evaluating lateral comfort at curve transitions and discrete events are also given.
Passenger comfort at bridges cannot easily be evaluated according to the same procedure, due to the short time that the train is on the bridge. A 50 m span is passed in less than 1 second at 200 km/h. The influence of the bridge then is outweighed by the track in the 5 second rms values. In the present study, the passenger comfort will therefore be evaluated based on absolute maximum car body acceleration (centre and ends of car body) instead of rms values.
European bridge design guides allow for an indirect verification of the passenger comfort, based on limits for the bridge deck deflection given in EN 1990 A2 (CEN, 2005). These limits, shown in Figure 2.12, are intended to ensure a very good comfort with maximum car body acceleration of 1 m/s2. The maximum relative deflection L/δ are given for simply supported bridges in three or more spans and have multiplication factors that allows for higher deflection for single and two span bridges, as well as continuous bridges in three or more spans. Earlier deflection limits were developed by Committee ORE D160 (ORE, 1988) and Committee ERRI D190 (ERRI, 1995) based on simulations and experiments.
Since the irregular track profiles were not explicitly included in the ERRI D190 simulations, comparisons against the 1 m/s2 limit are here shown for smooth track. Also the increase in car body acceleration between trains running on a plain track section and on bridges is studied.
A comparison against the Japanese serviceability deflection limits for Shinkansen trains (RTRI, 2007) is given in Figure 2.12, along with the Japanese deflection limits for running safety. For longer spans the comfort limits in the two standards are rather similar. However, the Japanese limits are more stringent for spans shorter than 40 m. For short spans, the Japanese limits for safety are instead rather close to the European comfort limits.
In the Chinese standard, Chinese National Railway Administration (2014), the vertical car body acceleration is limited to 1.3 m/s2 and the vertical bridge displacement range from L/1000 to L/1900, depending on speed and span length. The values are multiplied with correction factors for different bridge configurations.

2.8. THEORETICAL VALIDATIONS
19
Figure 2.12: EN 1990 A2 displacement limits for comfort (left), where the L/δ values should be multiplied with 0.7 for single and two span bridges and 0.9 for continuous bridges in three or more spans. Comparison between EN 1990 A2 and Japanese standards (right).
Theoretical validations 2.8
2.8.1 Transition zones
The wheel–rail force at an abrupt change from a bed modulus of 100 MN/m3 to infinitely stiff ground is shown in Figure 2.13. The abrupt change in substructure stiffness is intended to represent an extreme case of an embankment–bridge transition. A joint is typically introduced to the track slab at such a transition; therefore, the slab is modelled as discontinuous. The abrupt stiffness change introduces oscillation in the wheel–rail force with an amplitude of about 5 kN for a perfectly smooth track. However, due to the discontinuity of the track slab at the transition, also the case with continuous substructure stiffness gives similar oscillations. The effect from the abrupt change in substructure stiffness is shown also at an irregular track profile. The increase in maximum wheel–rail force is around 10 kN for unfiltered results and negligible for the filtered (20 Hz) results. Thus, the variation in wheel–rail force from the abrupt change of substructure stiffness is low compared to the variation introduced from the random track irregularities.
The relatively small effect from a change in substructure stiffness motivates a simple model of the track–bridge transition zone with no consideration of transitional structures. The model results should be conservative if the railway track is constructed with a smooth change in track stiffness as long as measures are taken to avoid relative settlements. Transition plates and similar structures are often constructed to minimise settlements between bridge and track embankment. If settlements do occur in the ballasted track there is a risk for a self-perpetuating process where settlements lead to higher wheel–rail forces, which in turn lead to further settlements (Read and Li, 2006). More studies are needed to identify the maximum settlements that can develop at the embankment–bridge transition for slab tracks.
0 20 40 60 80 100 120L (m)
0
500
1000
1500
2000
2500
3000
3500Eurocode deflection limits
v = 120
v = 160
v = 200
v = 220
v = 250
v = 280
v = 300
v = 350
Eurocode 3 simply supp. spans
0 20 40 60 80 100 120L (m)
0
500
1000
1500
2000
2500
3000
3500Eurocode (350 km/h) and Japan (360 km/h) deflection limits
Eurocode 3 simply supp. spansEurocode 3 continuous spansEurocode 1-2 spans
Japan mult. spans (comfort)Japan sinlge span (comfort)Japan mult. spans (safety)Japan sinlge span (safety)

CHAPTER 2. TRAIN–TRACK–BRIDGE INTERACTION
20
Figure 2.13: Wheel–rail force (1st wheel, 20th carriage) for the HSLM A1 train at 384 km/h running at a track section with and without an abrupt change in substructure stiffness. Results for smooth profile and one sample from the German PSD (σ3–25 = 1.0 mm).
2.8.2 Validation of linearized Hertz contact model
The present linearized Hertzian spring model described in Section 2.4 is validated against results from the ERRI D214 committee (ERRI, 1999b), for an ICE-2 train traversing a 20 m single span ballasted bridge. A 3 m long, 6 mm deep dip is located at mid span. The present train–track–bridge model is used with bridge, vehicle and track properties corresponding to the model in ERRI (1999b). The ballasted track model includes rails and sleepers connected by spring–dashpot elements corresponding to the rail pads and ballast/substructure stiffness.
Figure 2.14 shows the unfiltered and filtered bridge deck acceleration at mid span. Both models predict very high unfiltered accelerations for the case with dip.
Figure 2.15 shows the wheel–rail forces with and without dip. For the smooth track profile with no dip, the wheel–rail contact force is in almost perfect agreement. For the case with a dip, a good agreement is obtained, with both models predicting almost identical contact losses and similar amplitudes. Both contact models include a contact
4 4.5 5Time (s)
0
50
100
150
200
Smooth profile, unfiltered
Continuous substructure stiffnessAbrupt change of substructure stiffness
4 4.5 5Time (s)
0
50
100
150
200
Irregular profile, unfiltered
4 4.5 5Time (s)
70
75
80
85
90
95
100
Smooth profile, 20 hz filter
4 4.5 5Time (s)
70
75
80
85
90
95
100
Irregular profile, 20 hz filter

2.8. THEORETICAL VALIDATIONS
21
spring which transmits compression forces only. For comparison, results from the present model with two alternative contact assumptions are shown: (1) linearized Hertzian spring with no loss of contact (spring transmits tension forces) and (2) rigid contact (see Cantero et al. (2016)).
With no dip, there is no contact loss and model (1) gives identical results compared to the model with contact loss. The rigid contact model (2) gives almost identical results. With dip, there are some qualitative differences between the model that allows for contact loss and model (1) and (2). However, this rather abrupt dip is an extreme case compared to a random track profile. Less difference between the contact assumptions is seen even for the low-quality track profile in Section 2.4, Figure 2.9.
Figure 2.14: Present model validated against simulated bridge deck accelerations, redrawn from ERRI (1999b).
Dec
k ac
cele
rati
on a
t mid
spa
n (m
/s2 )

CHAPTER 2. TRAIN–TRACK–BRIDGE INTERACTION
22
Figure 2.15: Present model validated against simulated wheel–rail forces. The simulation results are redrawn from ERRI (1999b).
335 340 345 350 355 360Distance (m)
-200
0
200
400
No dip (330 km/h)
ERRI D214, Hertz (with loss)Present, Hertz (with loss)Present, Hertz (no loss)Present, rigid contact
335 340 345 350 355 360Distance (m)
-200
0
200
400
No dip (350 km/h)
335 340 345 350 355 360Distance (m)
-200
0
200
400
With dip (330 km/h)
335 340 345 350 355 360Distance (m)
-200
0
200
400
With dip (330 km/h)
335 340 345 350 355 360Distance (m)
-200
0
200
400
With dip (350 km/h)
335 340 345 350 355 360Distance (m)
-200
0
200
400
With dip (350 km/h)
2.8. THEORETICAL VALIDATIONS
23
2.8.3 Validation against 2D model results
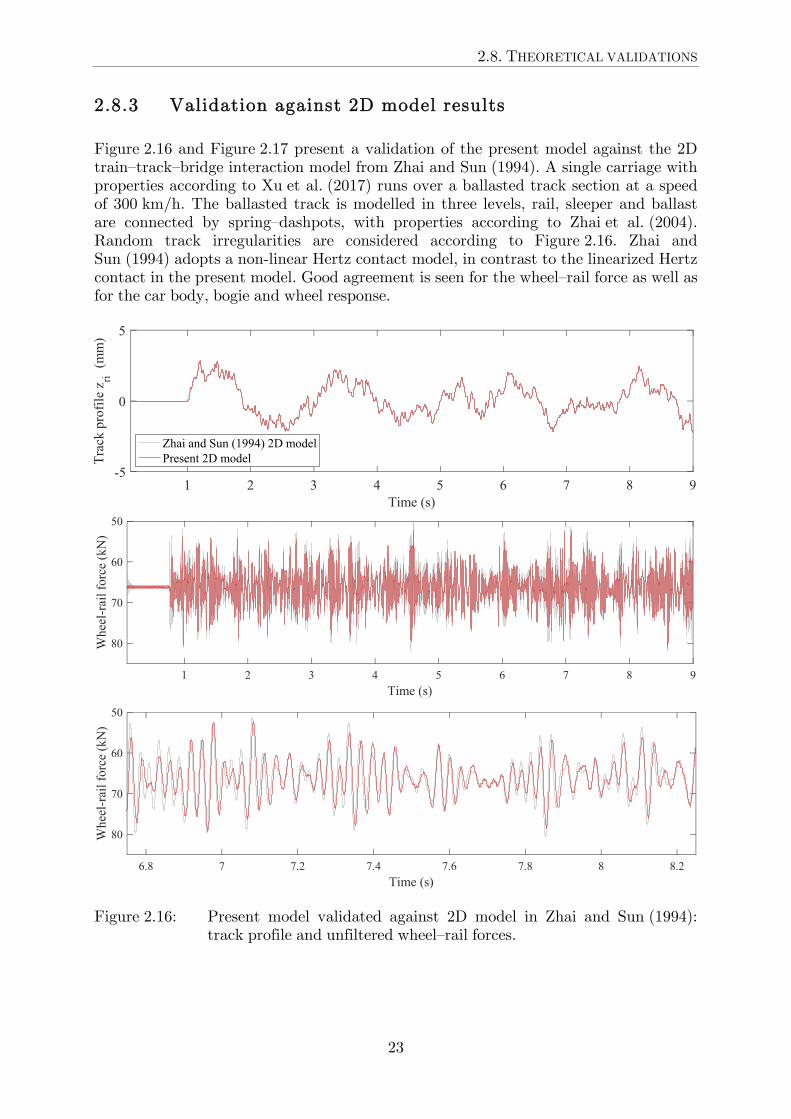
Figure 2.16 and Figure 2.17 present a validation of the present model against the 2D train–track–bridge interaction model from Zhai and Sun (1994). A single carriage with properties according to Xu et al. (2017) runs over a ballasted track section at a speed of 300 km/h. The ballasted track is modelled in three levels, rail, sleeper and ballast are connected by spring–dashpots, with properties according to Zhai et al. (2004). Random track irregularities are considered according to Figure 2.16. Zhai and Sun (1994) adopts a non-linear Hertz contact model, in contrast to the linearized Hertz contact in the present model. Good agreement is seen for the wheel–rail force as well as for the car body, bogie and wheel response.
Figure 2.16: Present model validated against 2D model in Zhai and Sun (1994): track profile and unfiltered wheel–rail forces.
1 2 3 4 5 6 7 8 9Time (s)
-5
0
5
Tra
ck p
rofi
le z
ri (
mm
)
Zhai and Sun (1994) 2D modelPresent 2D model
1 2 3 4 5 6 7 8 9
Time (s)
50
60
70
80Whe
el-r
ail f
orce
(kN
)
6.8 7 7.2 7.4 7.6 7.8 8 8.2
Time (s)
50
60
70
80Whe
el-r
ail f
orce
(kN
)

CHAPTER 2. TRAIN–TRACK–BRIDGE INTERACTION
24
Figure 2.17: Present model validated against 2D model in Zhai and Sun (1994): unfiltered vehicle displacement and acceleration.

2.9. EXPERIMENTAL VALIDATIONS
25
Experimental validations 2.9
2.9.1 Measured wheel–rail forces
The wheel–rail forces calculated from the 2D train–track–bridge model is validated against measured results, see Figure 2.18. Wheel–rail forces and track irregularities were measured at a track section between Skövde and Töreboda within the Green Train project in 2006. The wheel–rail forces were measured through strain gauges at an instrumented wheelset in a Regina type train at 220 km/h. The train and track are modelled according to Li et al. (2008) and Chaar (2007). The present model is in very good agreement with the measured results, both in average amplitude and for the peaks occurring at isolated track defects. The maximum dynamic wheel–rail force is around 40 kN, giving an unfiltered wheel unloading of 0.53. The present model is in good agreement also with theoretical 2D (BV-model) and 3D (Gensys-model) results shown in the figure; see Li et al. (2008) for description of the models.
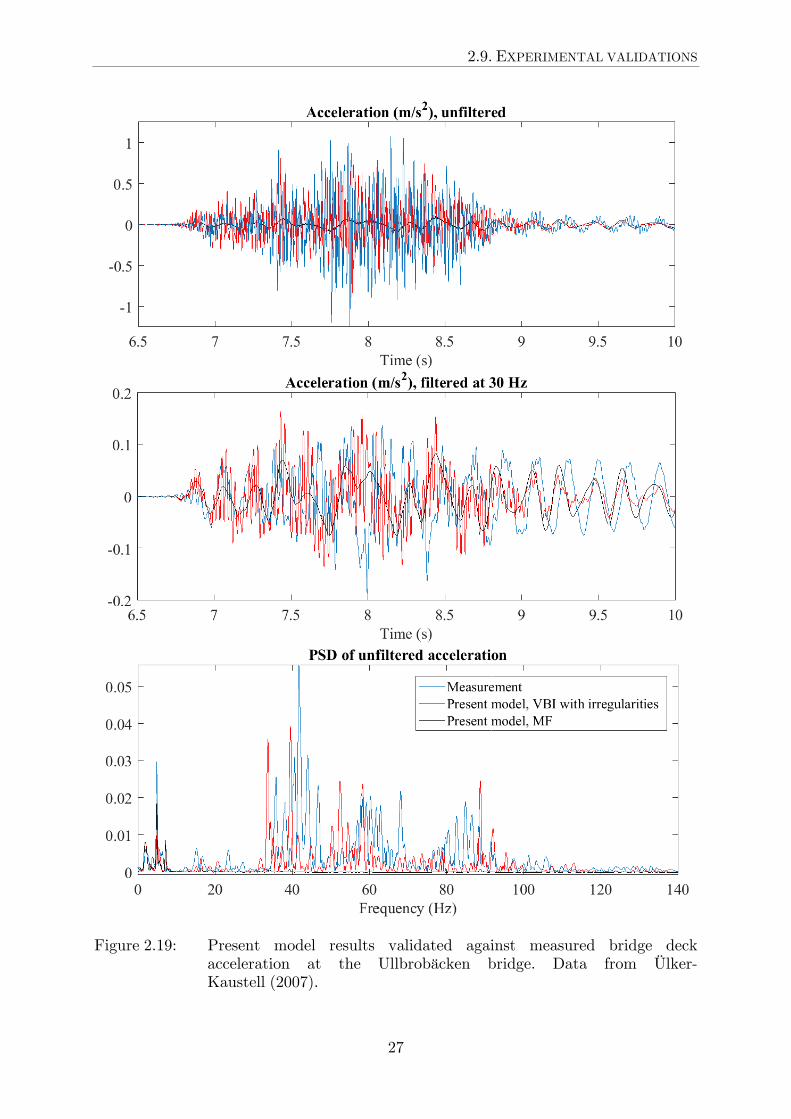
2.9.2 Measured bridge deck acceleration
The bridge deck acceleration from the 2D train–track–bridge model is compared to measured results in Figure 2.19. The measurements are from a post-tensioned concrete beam bridge, carrying two ballasted tracks. The bridge model properties are assumed from design documents and updated based on the measured results. A one-level track model with assumed track stiffness and track profile represents the ballasted track. The Green Train runs at 160 km/h with mechanical properties according to Arvidsson et al. (2014).
The results from the model are in reasonable agreement with the measured results, both in acceleration amplitude and frequency content. The discrepancies can be attributed to uncertainties in bridge, track and train properties as well as in the track profile. Despite the discrepancies, the results show that the high-frequency content present in the model results is also observed experimentally. The higher frequencies are due to the track irregularities and the frequencies of the loaded track traversed by the unsprung wheel mass.
As observed in Figure 2.19, the moving force model cannot predict this high-frequency content. The ballasted track is considered sensitive to vibrations up to 30 Hz (CEN, 2005) which presents a motive to filter the bridge deck acceleration. Up to 30 Hz, the moving force model agrees reasonably well with the measured results. Model updating could possibly improve the results.
Similar high-frequency content is seen in the simulated bridge deck acceleration in Section 2.8.2, Figure 2.18. A further model validation is available in Arvidsson et al. (2017) where measured bridge deck acceleration at a short span portal frame bridge is presented.

CHAPTER 2. TRAIN–TRACK–BRIDGE INTERACTION
26
Figure 2.18: Present model results validated against measured and modelled dynamic wheel–rail forces from the Green Train project. Data from Li et al. (2008).
Dyn
amic
whe
el-r
ail f
orce
(kN
)
Dyn
amic
whe
el-r
ail f
orce
(kN
)
Dyn
amic
whe
el-r
ail f
orce
(kN
)
Dyn
amic
whe
el-r
ail f
orce
(kN
)
Dyn
amic
whe
el-r
ail f
orce
(kN
)
Dyn
amic
whe
el-r
ail f
orce
(kN
)
2.9. EXPERIMENTAL VALIDATIONS
27
Figure 2.19: Present model results validated against measured bridge deck acceleration at the Ullbrobäcken bridge. Data from Ülker-Kaustell (2007).


3.1. INPUT PARAMETERS
29
3 Parametric study
Input parameters 3.1
3.1.1 Bridges
The parametric study covers bridges with spans 10–80 m. Simply supported bridges in one span and continuous bridges in two and three spans are studied, all with fixed supports. The cross-sectional properties are based on the optimised cross-sections for concrete slab bridges, steel–concrete composite bridges and concrete beam bridges presented by Svedholm and Andersson (2016).
The general layout of the cross-sections is shown in Figure 3.1. The height of the cross-section is chosen as the minimum height to fulfil the Eurocode EN 1990 A2 limit for acceleration or displacement. The HSLM A1–A10 trains are considered. The shorter spans (<30–40 m) are limited by the acceleration criterion and the longer spans by the displacement criterion. The purpose is primarily to obtain bridges at the design limit for dynamic loading with reasonably realistic cross-sections. The cross-sections have not been checked for static loading.
The optimising procedure in Svedholm and Andersson (2016) was based on the therein derived design charts. Owing to the resolution of these charts the obtained cross-sections deviate slightly from the design limits. Therefore, using the 2D closed form solution model from Svedholm and Andersson (2016), the cross-sections are further iteratively updated to more exactly meet the design limits. The resulting deck acceleration and displacement are shown in Figure 3.2, together with the optimised cross-sectional properties. Additional data is given in Table 3.1 and Appendix Table A.1. The presented mass includes the track structure on the bridge.
As shown in Museros et al. (2004) and Arvidsson and Karoumi (2014), the train–bridge interaction effects are more pronounced for light bridges. Therefore, single-track bridges are also studied. The optimised cross-sectional properties for the single-track bridges are given in Appendix B. Finally, the short single-track bridges limited by the Eurocode deck acceleration criterion are re-designed. In the re-design of these cross-sections the acceleration criterion is ignored and the displacement criterion alone is allowed to decide the design. Weaker cross-sections are thus obtained (see
Chapter

CHAPTER 3. PARAMETRIC STUDY
30
Appendix C), with a typical reduction in stiffness of around 50 %, and up to 80 % for some bridges. Figure 3.3 shows that these cross-sections are most likely too weak compared to existing bridges. This implies that the cross-section instead would be governed by the static design.
The bridge deck damping ratio follows the lower limit in EN 1991-2, Table 6.6. The damping ratios are differentiated between steel- and composite bridges, prestressed concrete bridges and reinforced concrete bridges. In this study, concrete bridge longer than 30 m has been assumed prestressed.
Slab bridges
bslab = 7.0 m (double-track) bslab = 6.0 m (single-track)
Beam bridges
bbeam = hbeam/2 m (double-track, two beams) bbeam = 3.0 m (single-track, one centred beam)
Composite bridges ttop = 50 mm tbot = 50 mm tw = 30 mm btop = 1.2 m bbot = 2.5 m wtop = 4.5 m (double-track) wtop = 3.0 m (single-track)
Figure 3.1: Bridge cross-sections. Double-track bridges have track distance 4.5 m and single-track bridges have one centred track. B = 12 m for double-track and 7 m for single-track.
Table 3.1: Bridge cross-sectional properties.
Material Edge beam Ec 34 GPa tkb 0.3 m ρc 2500 kg/m3 hkb 0.4 m Es 210 GPa bkb 0.4 m ρs 7850 kg/m3 tko 0.5 m

3.1. INPUT PARAMETERS
31
Figure 3.2: Bridge properties, deck acceleration and displacement at the design limits. Based on a moving force model. EN 1991-2 recommended frequency range and limits for acceleration and displacement are included.
n 0 (H
z)
n 0 (H
z)
n 0 (H
z)
t slab
(m
)m
(to
n/m
)A
ccel
erat
ion
(m/s
2 )D
ispl
acem
ent (
mm
)
h box (
m)
m (
ton/
m)
Acc
eler
atio
n (m
/s2 )
Dis
plac
emen
t (m
m)
h beam
(m
)m
(to
n/m
)A
ccel
erat
ion
(m/s
2 )D
ispl
acem
ent (
mm
)

CHAPTER 3. PARAMETRIC STUDY
32
Figure 3.3: Stiffness of original and reduced single-track bridges compared to regression analysis of Swedish single-track reinforced and prestressed concrete bridges. The range describes the stiffness with 90 % prediction interval for frequency and mean value for mass.
3.1.2 Trains
The HSLM A1–A10 trains are modelled according to Section 2.1 and Table 2.1. Speeds in the range 148–400 km/h are considered. However, an allowable speed limit of 320 km/h is assumed so the maximum results are extracted for speeds up to 320×1.2 = 384 km/h.
For each case the train–track–bridge interaction analyses are performed for only one of the 10 HSLM trains, the one being the critical train for the deciding design limit (bridge deck acceleration or displacement). In the example in Figure 3.4 results for all HSLM trains are instead shown for a 50 m single and double span bridge. As can be seen, the vehicle response is similar between different trains even though the increasing bogie distances means that the peak car body acceleration occurs at increasing speeds for each train, each corresponding to a peak in the bridge deflection curve. No relevant difference in wheel unloading can be seen between the trains. The similarities observed in the vehicle response between the 10 HSLM trains provide a motive to analyse only the critical train.
The car body acceleration is approximately equal to the EN 1990 A2 limit 1 m/s2 at the speed where the bridge deflection meets the deflection criterion. However, the complex relation between the car body frequencies and the bridge vibration can lead to single peaks in the car body acceleration even at low speeds. An example is seen for the single span bridge where the car body acceleration reaches just above 1.5 m/s2 at around 175 km/h. This peak corresponds to a peak in the displacement at a point where the displacement criterion is relaxed due to low speed.
EI
(GN
m2 )
EI
(GN
m2 )

3.1. INPUT PARAMETERS
33
Figure 3.4: Upper limit from HSLM A1–A10 (blue to green lines) on a 50 m one and two span bridge with the lower level of track irregularity. Dash-dotted lines show the Eurocode deflection and comfort limits.
3.1.3 Track and track profile
The non-ballasted track is modelled according to Section 2.2 (Table 2.2). Track profiles are scaled samples from the German track PSD; see Section 2.3, Equation (2.2). Each track irregularity sample has been acquired as the one with the absolute maximum deviation out of 1000 random samples, each 800 m long. Thus, each sample is at the tail of the random distribution and should give critical results.
From such a sample, a 400 m section is selected and the point with maximum deviation is placed at the mid span of the bridge. For two span bridges the maximum deviation is placed at the first span, while for three span bridges at the middle span. For the three span bridges a 500 m track section is instead used to ensure a sufficient approach track length. Thus, a minimum of 150 m approach track is considered in order to ensure that the vehicle has been set into motion from the excitation of the track irregularities before entering the bridge.
Two track quality levels have been considered. The lower track quality has a standard deviation σ3–25 = 1.0 mm which is at the upper limit of EN 13848-6 class D for speeds > 300 km/h, Figure 2.5. This lower track quality gives maximum zero to peak values close to the Eurocode Alert Limit for speeds 300–360 km/h, see Table 2.3 and Figure 2.8. Thus, wheel unloading can be assessed close to the Alert Limit. This track quality corresponds to the German “low disturbance” level as given in Berawi (2013), see Figure 2.6.

CHAPTER 3. PARAMETRIC STUDY
34
A higher track quality level is also considered with a standard deviation scaled to EN 13848-6 Class B, σ3–25 = 0.4 mm for speeds > 300 km/h. The higher track quality should give more realistic car body accelerations, being closer to a well-maintained track for high speeds. The chosen track quality is similar, but slightly lower, compared to the Chinese PSD for non-ballasted tracks, Figure 2.6. Wavelengths 1–150 m are included in the analysis. This includes EN 13484-5 ranges D1–D3, but also wavelengths down to 1 m according to the Swedish standards.
A comparison of the vehicle response from the two track quality levels is provided in Figure 3.5 for a plain track section without the bridge. The wheel unloading increase with speed and contact loss (wheel unloading = 1) occurs at just below 300 km/h for the low track quality. However, as the filtered wheel unloading and the duration of contact loss are low there is no risk for derailment, according to the safety indices in Section 2.6.
No loss of contact occurs for the higher track quality level. Montenegro (2015) obtained similar wheel unloading levels. The car body acceleration for the lower track quality is around 1 m/s2. This corresponds to an rms acceleration within the worst EN 12299 continuous comfort class (‘less comfortable’). For the higher track quality level the car body acceleration lies around 0.5 m/s2 with continuous comfort class between “very comfortable” and “comfortable”. This is in good agreement with car body accelerations reported by Zhai et al. (2015) for a train at 350 km/h under similar track conditions.
The fact that the car body acceleration is significant already for a plain track without any bridge and that it is highly dependent on the track quality level complicates the evaluation of the bridges in terms of passenger comfort. This difficulty was pointed out also in the work by ORE (1988). Similarly, the wheel unloading is highly dependent on the track quality. Therefore, a plain track section with no bridge is used throughout the study as reference to isolate the effect of the bridge. Moreover, a smooth track is used as reference to isolate the effect of the uneven profile.

3.1. INPUT PARAMETERS
35
Figure 3.5: Upper limit of HSLM A1–A10 vehicle response on a plain track section (no bridge) with the two different levels of track irregularity.

CHAPTER 3. PARAMETRIC STUDY
36
3.1.4 Analysis procedure
The analysis procedure is summarised in Figure 3.6. The unfiltered wheel–rail force has considerable high-frequency content due to the track irregularities and the wheel–track interaction. Safety indices are needed to determine whether wheel–rail contact losses are long-lasting enough to pose a risk for derailment. The filtered wheel unloading at 20 Hz is used as running safety index together with the duration of contact loss from the unfiltered signal, according to Section 2.6. The car body acceleration has a low frequency content <20 Hz due to the rigid body assumption with no higher car body modes and the filtering from the primary and secondary suspension system. The car body acceleration is therefore presented unfiltered and unweighted. More specific rms-based comfort indices as discussed in Section 2.7 are not suitable for the present application due to the short time duration of the train passage on the bridge.
All vehicle results are extracted from the time period between when the first wheel in the carriage reach the bridge and when the last wheel in the carriage has travelled one carriage length away from the bridge. To make direct comparison possible, the vehicle results from the plain track section is extracted from the corresponding time period, even though the bridge is removed. The vehicle results are the maximum from all wheels or car bodies in the central articulated train carriages.
The bridge deck acceleration and displacement are filtered at 20 Hz, in line with the filtered wheel–rail force. High-frequency content in the bridge deck acceleration due to the excitation from the track irregularities, as exemplified in Section 2.9.2, is thus filtered out.
Figure 3.6: Parametric study analysis procedure.
For:
Do:
Double-trackbridges
Single-trackbridges
Reducedsection single-track bridges
Slab bridges Compositebridges
Beam bridges
1 span 2 spans 3 spans
Lower trackquality
Higher trackquality
Design charts andanalytic solution
Train-track-bridgemodel
Postprocessing
- Optimal cross sectionswith respect to theEurocode design limits
- Critical HSLM train
- Vehicle and bridgeresponse for 24 profilerealizations
- Max. response comp.to running safety limits
- Comparison againstplain track section

3.2. RESULTS
37
Results 3.2
The results for double- and single-track bridges as well as single-track bridges with reduced cross-sections are summarized in Sections 3.2.1–3.2.3. The full bridge and vehicle results against speed for each bridge can be found in Appendices A–C.
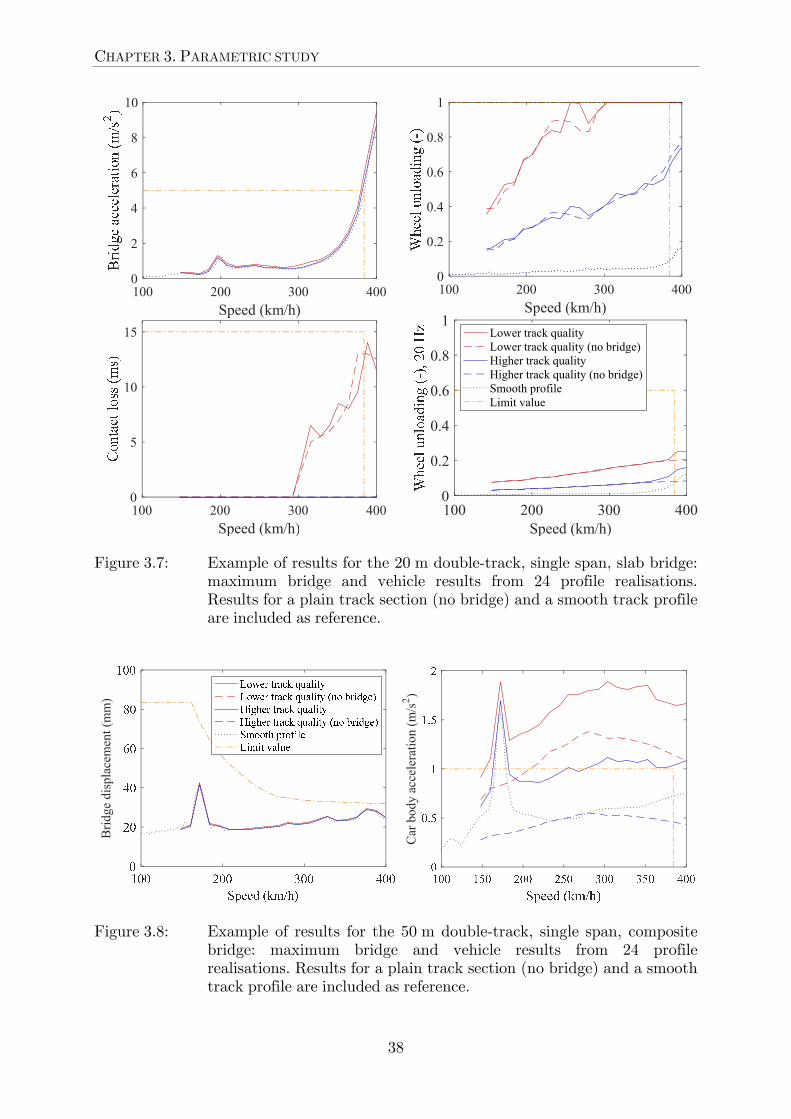
Examples from the results are given in Figure 3.7 for a 20 m slab bridge. The reference case with a smooth profile gives low unfiltered wheel unloading with a slight increase at the bridge deck resonance speed, the dotted lines at around 400 km/h. For the uneven track profiles, this increase is overshadowed by the effect of the track irregularities. The wheel mass travelling over the irregular track profile induces variations in the wheel–rail force which increase with the travelling speed. This increase with speed can clearly be seen in the unfiltered wheel unloading. The wheel unloading at the bridge follows closely the reference case with a plain track section, the solid and dashed lines. For the filtered wheel unloading, there is a slight increase at the bridge resonance speed as compared to the plain track section.
Examples of results for deck displacement and car body acceleration for a 50 m composite bridge are given in Figure 3.8. The reference cases with smooth profile and with no bridge show that the car body acceleration originates partly from the bridge deflection and partly from to the track profile. At the bridge resonance, the main contribution is from the bridge deflection. Here, there is a large difference between the case with bridge and with no bridge, solid and dashed lines at around 175 km/h. Away from resonance on the other hand, a significant part is from the track profile. Here, the difference between the case with bridge and with no bridge is lower, dotted and solid line at around 200–400 km/h.
CHAPTER 3. PARAMETRIC STUDY
38
Figure 3.7: Example of results for the 20 m double-track, single span, slab bridge: maximum bridge and vehicle results from 24 profile realisations. Results for a plain track section (no bridge) and a smooth track profile are included as reference.
Figure 3.8: Example of results for the 50 m double-track, single span, composite bridge: maximum bridge and vehicle results from 24 profile realisations. Results for a plain track section (no bridge) and a smooth track profile are included as reference.
100 200 300 400Speed (km/h)
0
5
10
15
100 200 300 400Speed (km/h)
0
2
4
6
8
10
100 200 300 400Speed (km/h)
0
0.2
0.4
0.6
0.8
1Lower track qualityLower track quality (no bridge)Higher track qualityHigher track quality (no bridge)Smooth profileLimit value
100 200 300 400Speed (km/h)
0
0.2
0.4
0.6
0.8
1B
ridg
e di
spla
cem
ent (
mm
)
Car
bod
y ac
cele
rati
on (
m/s
2 )

3.2. RESULTS
39
3.2.1 Double-track bridges
Figure 3.9 shows the envelope of results for double-track slab- composite- and beam bridges in 1–3 spans. For each bridge, the results are the upper limit of the 24 profile realisations extracted at the most critical speed for the critical HSLM-train. As seen, the bridge deck acceleration is met for the shorter spans up to 30–40 m, while the deflection limit is met for the longer spans.
The following can be noted:
- The unfiltered wheel unloading reaches 1 (loss of contact) for all bridges at the lower track quality.
- For the higher track quality, the unfiltered wheel unloading reaches 0.5–0.7 with no loss of contact.
- The filtered wheel unloading is well below the quasi-static EN 14363 limit (0.6).
- The duration of contact loss is below the limit at 15 ms.
- For the smooth track profile, the car body acceleration is generally below or around the 1 m/s2 comfort limit. The limit is exceeded for some bridges. This is the case mainly at single low speed peaks, as exemplified in Figure 3.4 and Figure 3.8.
- The irregular profile represents an additional excitation and increase the car body acceleration. The car body acceleration is 0.5–1.5 m/s2 for the higher track quality and 1–2 m/s2 for the lower track quality.
The following observations can be made on the increase in vehicle response from running on the bridges, as compared to the plain track section:
- There is no or a negligible amount of increase in unfiltered wheel unloading. As shown in Figure 3.5, the irregular track profile alone causes wheel unloading and, for the lower track quality, loss of contact.
- A very slight increase <0.1 in the filtered wheel unloading can be observed. The increase is close to uniform for all span lengths.
- There is no or a negligible amount of increase in the duration of contact loss.
- At the plain track section the car body acceleration is around 1 m/s2 for the lower track quality and 0.5 m/s2 for the higher (cf. Figure 3.5). The increase at the bridges is similar for the two track quality levels. The increase is <0.5 m/s2 for the short span bridges <30 m that do not meet the bridge deck deflection limit and larger (around 0.5–1.0 m/s2) for the longer spans that meet the deflection limit.
In summary, the running safety indices according to Section 2.6 are not compromised even though short-time contact loss occurs for the low track quality. For the higher track quality, no loss of contact occurs and it can be noted that the Japanese limit on unfiltered wheel unloading < 0.8 is fulfilled. For a perfectly smooth track, the wheel unloading is below 0.2 for all bridges which is lower than the Japanese limit for perfect track (0.37). The full results plotted against speed for each bridge can be found in Appendix A. In terms of running safety, no relevant differences can be observed between the bridge types or between different numbers of span.

CHAPTER 3. PARAMETRIC STUDY
40
Figure 3.9: Double-track bridges: envelope of maximum bridge and vehicle results for slab, beam and composite bridges in 1, 2 and 3 spans. For the lower and higher track quality (24 profile realisations) the additional vehicle response from running on the bridges as compared to the plain track is shown.
Bri
dge
acce
lera
tion
Bri
dge
disp
lace
men
t
Whe
el u
nloa
ding
(-)
Whe
el u
nl. (
-), 2
0 H
zC
onta
ct lo
ss (
ms)
Car
bod
y ac
cele
ratio
n (m
/s2 )
Add
. whe
el u
nl. (
-),
brid
ge -
no
brid
geA
dd. w
heel
unl
. (-)
, 20
Hz,
brid
ge -
no
brid
geA
dd. c
onta
ct lo
ss (
ms)
,br
idge
- n
o br
idge
Add
. car
bod
y ac
c. (
m/s
2 ),br
idge
- n
o br
idge

3.2. RESULTS
41
Figure 3.10: Single-track bridges: envelope of maximum bridge and vehicle results for slab, beam and composite bridges in 1, 2 and 3 spans. For the lower and higher track quality (24 profile realisations), the additional vehicle response from running on the bridges as compared to the plain track is shown.

CHAPTER 3. PARAMETRIC STUDY
42
3.2.2 Single-track bridges
The results for single-track bridges are summarised in Figure 3.10. Full results are given in Appendix B. The main difference between the single- and the double-track bridges are the lower mass of the bridges carrying a single track. A lower mass leads to higher deck acceleration and thus the decisive design limit shifts from deflection to acceleration for some of the medium span, 40–50 m, composite and beam bridges. A comparison between Figure 3.9 and Figure 3.10 shows that the results for both bridge and vehicle are similar to the double-track bridges. Thus, the running safety indices and the passenger comfort are not significantly affected by the lower mass of the single-track bridges.
3.2.3 Single-track bridges with reduced cross-sections
Figure 3.11 summarises the results for the 10–50 m single-track bridges that are optimised for the displacement limit only. The envelope of results for slab-, composite-, and beam bridges in 1–3 spans is given. Many of the original bridges with span 10–50 m are limited by the acceleration limit. These cross-sections can be reduced when the acceleration limit is disregarded, until the deflection limit is met. High and very high acceleration levels (5–30 m/s2, low-pass filtered at 20 Hz) are reached for the reduced cross-sections. The following observations can be made:
- As is the case for the original single-track bridges, the unfiltered wheel unloading reaches 1 (loss of contact) for all bridges at the lower track quality.
- For the higher track quality, the unfiltered wheel unloading reaches 0.8 and is at or below the Japanese limit (0.8) with no loss of contact.
- In contrast to the original cross-sections, a considerable level of wheel unloading is reached also for the smooth track profile (up to 0.5). It can be noted that the unloading for the smooth track is slightly above the Japanese limit for perfect track (0.37).
- The filtered wheel unloading reach 0.4–0.5 for the shortest spans of 10–20 m and is below, but close to, the quasi-static EN 14363 limit (0.6).
- The increase in wheel unloading from the presence of the bridges as compared to the plain track is <0.3. This is higher than for the original cross-sections <0.1.
- No notable increase in the maximum duration of contact loss is observed as compared to the original cross-sections.
- The car body acceleration is increased as compared to the original cross-sections. This is reasonable as the comfort deflection limit is met for the reduced cross-sections.
From the full results presented in Appendix C it can be observed that the highest filtered wheel unloading of about 0.5 is reached for cross-sections with 60–80 % reduction in stiffness and with bridge deck acceleration at about 25–30 m/s2. As shown in Figure 3.3, the bridges with reduced cross-section are most likely weak compared to real bridges. Even if the most extreme results are close to the limits, the running safety indices are not compromised although the bridge deck acceleration is very high.

3.2. RESULTS
43
Figure 3.11: Single-track bridges with reduced cross-section (acceleration limit disregarded): envelope of maximum bridge and vehicle results for slab, beam and composite bridges in 1, 2 and 3 spans. For the lower and higher track quality (24 profile realisations), the additional vehicle response from running on the bridges as compared to the plain track is shown.
Bri
dge
acce
lera
tion
Bri
dge
disp
lace
men
t
Whe
el u
nloa
ding
(-)
Whe
el u
nl. (
-), 2
0 H
zC
onta
ct lo
ss (
ms)
Car
bod
y ac
cele
rati
on (
m/s
2 )
Add
. whe
el u
nl. (
-),
brid
ge -
no
brid
geA
dd. w
heel
unl
. (-)
, 20
Hz,
brid
ge -
no
brid
geA
dd. c
onta
ct lo
ss (
ms)
,br
idge
- n
o br
idge
Add
. car
bod
y ac
c. (
m/s
2 ),br
idge
- n
o br
idge

CHAPTER 3. PARAMETRIC STUDY
44
3.2.4 Correlation between vehicle and bridge response
The parametric study results show that the running safety according to the indices in Section 2.6 is not compromised for any of the studied bridges. Very little additional wheel unloading is present in the bridges with original cross-sections, as compared to a plain track section. For the reduced cross-sections that meet the EN 1990 A2 serviceability deflection limit (disregarding the acceleration limit) there is however some increase in the filtered wheel unloading, as compared to the plain track section. Even though the running safety indices are not compromised it is of interest to determine whether there is a correlation between wheel unloading and the bridge response.
Figure 3.12 shows the additional wheel unloading and car body acceleration (from running on the bridges as compared to the plain track section) against bridge acceleration and relative displacement. Results at one speed (384 km/h) are included. The vehicle response is highly correlated to the vehicle speed (with increasing values for increasing speed). As a result, the speed has to be eliminated in order to observe any relevant trends.
Trends in the wheel unloading are not easily observed for the original cross-sections. However, for the reduced cross-sections a wider range of bridge response is obtained and trends can now be distinguished. An increase in additional filtered wheel unloading for increasing bridge acceleration can be observed. There is also some correlation between the additional filtered unloading and the relative bridge displacement, with larger unloading for larger displacement.
Figure 3.12: Additional vehicle response against bridge acceleration and relative displacement: 10–50 m single-track slab, composite and beam bridges in 1–3 spans for 24 profile realisations at the lower track quality.
0 10 20 30
Bridge acceleration (m/s2)
0
0.1
0.2
0.3
0.4
0 0.0005 0.001Relative bridge displacement /L (-)
0
0.1
0.2
0.3
0.4
0 10 20 30
Bridge acceleration (m/s2)
0
0.5
1
1.5
0 0.0005 0.001Relative bridge displacement /L (-)
0
0.5
1
1.5 Reduced cross sectionsOriginal cross sections

3.2. RESULTS
45
Both for the original and the reduced cross-sections there is an obvious correlation between relative bridge displacement and additional car body acceleration. Higher bridge displacement leads to higher car body acceleration. No clear trends can be distinguished between bridge acceleration and car body acceleration.
Caution has to be taken when evaluating the correlation plots as the variables are not independent. As an example, bridges with high acceleration have typically also relatively large displacement. As already mentioned, the reduced cross-sections with very high bridge deck acceleration are most likely unrealistically weak.
3.2.5 Running safety indices for further reduced cross-sections
It is of interest to show at which reduction in bridge cross-section the running safety indices are compromised. Figure 3.13 shows the bridge and vehicle results for a 20 m slab bridge with successive reductions in bridge cross-section. Results are given for one profile realisation at the lower track quality.
The filtered wheel unloading is above 0.6 only for the weakest cross-section (0.1m, 0.1EI) for which the bridge acceleration is above 40 m/s2. The bridge deck displacement far exceeds the Eurocode limit for this unrealistically weak cross-section, and the car body acceleration at smooth track exceeds 2 m/s2. However, the duration of contact loss is not far above the 15 ms limit.
Results from a smooth track profile are included as reference. The bridge response alone leads to large wheel unloading for the weakest cross-sections, quite close to the unloading for the irregular profile. For the full cross-section, the smooth profile wheel unloading is much lower than that of the irregular profile. For the full cross-section, the origin of the wheel unloading is instead largely due to the track irregularities.
Examples of wheel–rail force time history and frequency content are given in Figure 3.14 for the full and the weakest cross-section. As can be seen, the wheel–rail force is dominated by the loaded track frequency ft ≈ 35 Hz.

CHAPTER 3. PARAMETRIC STUDY
46
Figure 3.13: 20 m single span slab bridge with successive reduction in bridge cross-section: bridge and vehicle results for the HSLM A1 train for the lower track quality (1 profile realisation) and a smooth profile.
Car
bod
y ac
cele
ratio
n (m
/s2 )
Whe
el u
nloa
ding
(-)
Con
tact
loss
(m
s)W
heel
unl
oadi
ng (
-), 2
0 H
z
Bri
dge
acce
lera
tion
(m/s
2 )
Bri
dge
disp
lace
men
t (m
m)

3.2. RESULTS
47
Figure 3.14: 20 m single span slab bridge: wheel–rail force (HSLM A1 20th carriage, 1st wheel) time histories and frequency content at 388 km/h for a track profile at the lower quality level and for a smooth profile.
3.2.6 Rail pad stiffness
The rail pad stiffness has been assumed as 22.5 MN/m. The effect of increasing pad stiffness is shown in Figure 3.15 for the 15 m and 20 m single span slab bridges. The increase from 22.5 MN/m to 40 MN/m leads to a slight increase in unfiltered wheel unloading and contact loss at slightly lower speeds. Further increase in the results is obtained for the 100 MN/m pad. The stiffest pad is more representative for a ballasted track where some elasticity is present also in the ballast bed.
Whe
el-r
ail f
orce
(kN
)W
heel
-rai
l for
ce (
kN)
Whe
el-r
ail f
orce
(kN
)W
heel
-rai
l for
ce (
kN)
PSD
of
whe
el-r
ail f
orce

CHAPTER 3. PARAMETRIC STUDY
48
Figure 3.15 shows that the effect on filtered wheel unloading is negligible. This indicates that higher pad stiffness would lead to slightly higher wheel–rail forces but would not significantly alter the running safety indices. However, the stiffness of the track should be limited to reduce the stress in the track components (UIC, 2008a). The increase in wheel–rail forces with increasing rail support stiffness is discussed also by Thomson (2009) and Arvidsson et al. (2017). The pad stiffness has no relevant effect on the filtered bridge vibration or the car body acceleration, as shown in Appendix A.4.
Figure 3.15: 15 m (HSLM A8) and 20 m (HSLM A1) single span slab bridges: maximum wheel unloading and contact loss for the lower track quality (24 profile realisations).
150 200 250 300 350 400Speed (km/h)
0
5
10
15
150 200 250 300 350 400Speed (km/h)
0
0.2
0.4
0.6
0.8
1
150 200 250 300 350 400Speed (km/h)
0
0.5
115 m
krp
= 22.5 2 MN/m
krp
= 40.0 2 MN/m
krp
= 100.0 2 MN/m
Limit value
150 200 250 300 350 400Speed (km/h)
0
0.5
120 m
150 200 250 300 350 400Speed (km/h)
0
5
10
15
150 200 250 300 350 400Speed (km/h)
0
0.2
0.4
0.6
0.8
1

4.1. GENERAL REMARKS
49
4 Conclusions
General remarks 4.1
The parametric studies in this report indicate that the limit on vertical bridge deck acceleration (5 m/s2) in EN 1990 A2 is unreasonably conservative for the running safety on non-ballasted bridges. The inherent acceleration limit for ballasted bridges due to the risk of ballast instability is not present for bridges with non-ballasted track. Instead, the bridge deck vibrations need to be limited for running safety and passenger comfort. An assumption behind the present bridge deck acceleration criterion for non-ballasted bridges has been that the wheel–rail contact is lost at bridge accelerations above the gravitational acceleration 1 g. Based on the safety indices for filtered wheel unloading and duration of contact loss the parametric studies show that:
- Bridge deck accelerations at 1 g do not in itself lead to loss of contact.
- The running safety indices are not compromised for accelerations up to 30 m/s2. This is the case even for the lower of the two considered track quality levels.
- EN 1990 A2 serviceability deflection limit for passenger comfort is met before running safety indices are compromised.
Ideally, the running safety should be assessed from the wheel–rail forces. However, this requires unnecessarily complicated models in the design stage. Preferably, the design requirement should be based on the bridge response. A preliminary conclusion is that the EN 1990 A2 serviceability deflection limit for passenger comfort is sufficient to ensure running safety for non-ballasted bridges.
It should be noted that the analyses in this report are performed in 2D and does not include the lateral wheel–rail forces. However, neglecting the lateral bridge vibration e.g. from curved bridges, wind or earthquake loading, the motion of the bridge affects primarily the vertical component of the dynamic wheel–rail force. Hence, analyses in 2D can be motivated.
Chapter

CHAPTER 4. CONCLUSIONS
50
Deck acceleration vs. wheel–rail force 4.2
The results from the two considered track quality levels show that the track profile has a large influence on the wheel–rail forces. For the profile with irregularities close to the EN 13848-5 alert limit, loss of wheel–rail contact occurs both at the bridges and at the plain track section. For the track profile with irregularities closer to a well-maintained track, no contact loss occurs even for bridge deck accelerations up to 30 m/s2. The bridge deck accelerations are low-pass filtered at 20 Hz. Hence, the contact losses are more related to the track quality than the bridge response and it is evident that accelerations at 1 g do not in itself lead to loss of contact.
The large influence of the track quality level is also why the running safety on bridges has been evaluated based on the comparison between trains running on bridges and trains running on a plain track section. Moreover, the authors argue that we need to consider running safety indices based on the filtered wheel unloading and the duration of contact loss instead of the unfiltered wheel unloading. The increase in filtered wheel unloading is notable only for some of the studied bridges. These are the shortest of the bridges optimised for EN 1990 A2 deflection limit for comfort, with the acceleration limit disregarded. These bridges have cross-sections with 60–80 % reduction in stiffness and that are shown to most likely be weak compared to real bridges. Based on the short duration of contact loss (<15 ms) and the low magnitude of the filtered wheel unloading (<0.6 at 20 Hz low-pass filter), the running safety indices are not compromised even for these bridges.
Thus, the results show that the EN 1990 A2 deflection limit for comfort is reached before the running safety is compromised. Interestingly, the EN 1990 A2 deflection limits for comfort compare rather well with the deflection limits for running safety given in the Japanese design codes. However, the Japanese limits for comfort are more stringent for short spans compared to the European limits.
As an alternative to the deflection limits, the Japanese design codes give limits on the wheel unloading. The Japanese limits on unfiltered wheel unloading are not adopted in the present study, but comparisons are made. It should be noted that the limit is exceeded for the lower track quality, both at plain track and at the bridges, but not exceeded for the higher track quality. The limit for a smooth track profile is exceeded only for some of the reduced cross-sections which are unrealistically weak compared to real bridges. In the European design codes, on the other hand, the dynamic wheel unloading is not used as a running safety measure.
Rail pads with stiffness 22.5 MN/m per pad is assumed in the parametric study and the track substructure bed modulus is 100 MN/m3. Sensitivity analyses shows that higher pad stiffness would lead to slightly higher unfiltered wheel unloading. The effect on the filtered wheel unloading and the running safety indices is negligible. Moreover, the substructure stiffness is shown to have low effect on the total track stiffness as long as it is above a relatively soft threshold value.
4.3. DECK DISPLACEMENT VS. RIDING COMFORT
51
Deck displacement vs. riding comfort 4.3
The results clearly show a correlation between bridge deflection and car body acceleration. The high influence from the track profile on the car body acceleration, together with the fact that the influence is not equal in the whole speed range, makes absolute conclusions difficult. However, a comparison between the results at a plain track section and at a bridge show the additional amount of car body acceleration originating from the bridge vibrations, and thus the added effect on passenger comfort. For the original cross-sections, the short spans (<30–40 m) with limited deck deflection give low additional car body acceleration. The longer spans, where the Eurocode deflection limit is reached, can give additional accelerations of up to and slightly above 1 m/s2. Slightly higher additional acceleration is obtained for the reduced cross-sections, for which the deflection limit is reached also for the short spans. The results clearly show the relevance of the Eurocode deflection criterion as a measure to ensure passenger comfort.
Further research 4.4
There is an inconsistency in the running safety measures between different design codes. The EN 1990 A2 bridge deck acceleration limit for non-ballasted bridges is motivated based on running safety. However, the Eurocodes impose no limit on the dynamic wheel unloading for trains running on plain track other than what is implicitly given by the limits for track irregularities. In contrast, the Chinese and Japanese design codes stipulate limits for the dynamic wheel unloading. This inconsistency motivates further research towards a harmonisation between the different design codes.
This study has shown the relevance of the EN 1990 A2 deflection limit for passenger comfort. However, given the presented cases where the car body acceleration exceeds 1 m/s2 together with the inconsistencies between the European and the Japanese serviceability limits for passenger comfort, it is of interest to further validate the existing bridge deflection limits. The high influence of the track irregularities makes such an endeavour challenging. Another challenge is the difficulty in obtaining the vehicle data needed for the simulations. A range of vehicle mechanical properties needs to be studied, that encompasses the European rolling stock. Questions also arise concerning the time duration of unacceptable passenger comfort. To what extent is the short-time additional car body acceleration from the passing of bridges acceptable? Do we need to differentiate between bridges with a few spans and viaducts with long sequences of spans?
The present study does not account for relative settlements at the track–bridge transition and the Eurocode limits for bridge rotations at support are not adopted. Svedholm and Andersson (2016) showed that limits for rotations are often exceeded before the deflection limit. However, the limits for rotations are presumably based on ballasted bridges and need to be further analysed for slab track bridges. Further studies need to show whether limits need to be imposed to ensure running safety at the transition zone. Moreover, the bridge supports are presently assumed fixed. The effect on running safety from elastic bridge supports need to be studied.

CHAPTER 4. CONCLUSIONS
52
Acknowledgments 4.5
The simulations were in part performed on resources provided by the Swedish National Infrastructure for Computing (SNIC) at PDC Centre for High Performance Computing (PDC-HPC) at the KTH Royal Institute of Technology.
Dr. Martin Li at Trafikverket and Prof. Mats Berg at KTH Royal Institute of Technology are gratefully acknowledged for providing measured wheel–rail forces from the Green Train project.
Finally, Yu Sun at Southwest Jiaotong University is gratefully acknowledged for providing simulated vehicle response.

BIBLIOGRAPHY
53
Bibliography
Andersson, A., Svedholm, C., 2016. Dynamisk kontroll av järnvägsbroar, inverkan av 3D-effekter. KTH Brobyggnad, rapport KTH/BKN/R-158.
Arvidsson, T. and Karoumi, R., 2014. Train–bridge interaction–a review and discussion of key model parameters, International Journal of Rail Transportation, 2: 147–186.
Arvidsson T., Karoumi R. and Pacoste C., 2014. Statistical screening of modelling alternatives in train–bridge interaction systems. Engineering Structures; 59:693–701.
Arvidsson, T., Zangeneh, A., Cantero, D., and Andersson, A., 2017. Influence of Sleeper Passing Frequency on Short Span Bridges–Validation against Measured Results. First International Conference on Rail Transportation, ICRT2017, Chengdu, China.
Berawi, A.R., 2013. Improving railway track maintenance using power spectral density. Doctoral dissertation, Universidade do Porto, Portugal.
Cantero, D., Arvidsson, T., OBrien, E. and Karoumi, R., 2016. Train–track–bridge modelling and review of parameters. Structure and Infrastructure Engineering, 12: 1051–1064.
CEN, 2005. EN 1990/A1:2005. Basis of structural design annexe A2. European Committee for Standardization.
CEN, 2009. EN 12299 Railway applications–Ride comfort for passengers–Measurements and evaluation. European Committee for Standardization.
CEN, 2010a. EN 1991-2. Actions on structures–Part 2: Traffic loads on bridges. European Committee for Standardization.
CEN, 2010b. EN 14067-6 Railway applications–Aerodynamics–Part 6: Requirements and test procedures for cross wind assessment. European Committee for Standardization.
CEN, 2014. EN 13848-6:2014 Railway applications–Track–Track geometry quality–Part 6: Characterisation of track geometry quality. European Committee for Standardization.

BIBLIOGRAPHY
54
CEN, 2015. FprEN 13848-5:2015 Railway applications–track–track geometry quality–Part 5: geometric quality levels–plain line, switches and crossings. European Committee for Standardization.
CEN, 2016. EN 14363:2016 Railway applications–Testing and Simulation for the acceptance of running characteristics of railway vehicles–Running Behaviour and stationary tests. European Committee for Standardization.
Chaar, N., 2007. Wheelset structural flexibility and track flexibility in vehicle-track dynamic interaction. Doctoral Thesis, KTH Royal Institute of Technology.
Chinese National Railway Administration, 2014. Code for Design of High Speed Railway Bridges, TB 10621-2014 (in Chinese).
Claus, H. and Schiehlen, W., 1998. Modeling and simulation of railway bogie structural vibrations. Vehicle System Dynamics, 29 (1): 538–552.
DB, 2002. Requirements catalog for the construction of the permanent way, Technical notification concerning the body of permanent way technology regulations. DB Systemtechnik, RO 03/2002, 4th revised edition, Frankfurt.
Dinh, V.N., Kim, K.D. and Warnitchai, P., 2009. Simulation procedure for vehicle –substructure dynamic interactions and wheel movements using linearized wheel–rail interfaces. Finite Elements in Analysis and Design, 45: 341–356.
ERRI, 1995. Permissible deflection of steel and composite bridges for velocities v > 160 km/h parametric studies–summary and recommendations final report. European Rail Research Institute, D160. RP 5, Utrecht.
ERRI, 1999a. Rail bridges for speeds > 200 km/h–final report. European Rail Research Institute, D214. RP 9, Utrecht.
ERRI, 1999b. Rail bridges for speeds > 200 km/h–Numerical investigation of the effect of track irregularities at bridge resonance. European Rail Research Institute, D214. RP 5, Utrecht.
Hamid, A. and Yang, T.L., 1982. Analytical descriptions of track-geometry variations. Transportation Research Record, 838: 19–26.
Ishida, H., Matsuo, M., 1999. Safety criteria for evaluation of railway vehicle derailment. Quarterly Report of Railway Technical Research Institute, 40 (1): 18–25.
Iwnicki, S., 2006. Handbook of Railway Vehicle Dynamics. CRC Press.
Kouroussis, G., Connolly, D.P. and Verlinden, O., 2014. Railway-induced ground vibrations–a review of vehicle effects, International Journal of Rail Transportation, 2 (2): 69–110.
Li, M. X. D., Berggren, E. G., Berg, M. and Persson, I., 2008. Assessing track geometry quality based on wavelength spectra and track-vehicle dynamic interaction, Vehicle System Dynamics, 46 (1): 261–276.

BIBLIOGRAPHY
55
Matsudaira, T., 1963. Dynamics of High Speed Rolling Stock. Japanese National Railways RTRI Quarterly Reports, Special Issue.
Montenegro, P.A., 2015. A methodology for the assessment of the train running safety on bridges. Doctoral Thesis, University of Porto.
Museros, P., Castillo-Linares, A. and Alarcón, E., 2004. Wheel-Rail Contact Forces in High-Speed Simply Supported Bridges at Resonance. In: Topping BHV, Mota Soares CA, editors. Proceedings of the seventh international conference on computational structures technology. Stirling: Civil-Comp Press; Paper 223.
ORE, 1988. Permissible deflection of bridges. Office for Research and Experiments of the International Union of Railways, Report 6, Utrecht.
Read D, and Li D., 2006. Design of track transitions. Research results digest 79. Pueblo, CO: Transit Cooperative Research Program, Transportation Research Board of the National Academies.
RTRI, 2007. Design standards for railway structures and commentary (displacement limits). Railway Technical Research Institute. Railway Bureau of the Ministry of Land, Infrastructure and Transport Government of Japan.
Svedholm, C., Andersson A., 2016. Designdiagram för förenklad kontroll av järnvägsbroar. KTH Brobyggnad, rapport KTH/BKN/R-157.
Thompson, D., 2009. Railway Noise and Vibration, Mechanisms, Modelling and Means of Control. Oxford: Elsevier Ltd, 1st Edition.
Trafikverket, 2015. Banöverbyggnad–Spårläge - krav vid byggande och underhåll. TDOK 2013:0347, version 4.
Trafikverket, 2016. Teknisk systemstandard för höghastighetsbanor, krav. TDOK 2016:91649, version 3.0.
UIC, 1971. Interaction between vehicles and track, power spectral density of track irregularities, part 1: Definitions, conventions and available data. International Union of Railways, ORE C 116/RP1.
UIC, 2008a. Vertical elasticity of ballastless track. International Union of Railways.
UIC, 2008b. Application and experience with ballastless Track. International Union of Railways.
Ülker-Kaustell, M., 2007. The dynamic properties of two concrete railway bridges during the testing of Gröna Tåget. KTH Brobyggnad, rapport KTH/BKN/R-117.
Xu, L. and Zhai, W.M., 2017. A new model for temporal–spatial stochastic analysis of vehicle–track coupled systems, Vehicle System Dynamics, 55 (3): 427–448.

BIBLIOGRAPHY
56
Zacher M and Baeßler M, 2009. Dynamic behaviour of ballast on railway bridges. In: Delgado R, Calçada R, Goicolea JM, Gabaldón F, editors. Dynamics of high-speed railway bridges. London: Taylor & Francis, 99–112.
Zhai, W.M. and Sun, X., 1994. A Detailed Model for Investigating Vertical Interaction between Railway Vehicle and Track, Vehicle System Dynamics: International Journal of Vehicle Mechanics and Mobility, 23: 603–615.
Zhai, W.M., Wang, K.Y. and Lin, J.H., 2004. Modelling and experiment of railway ballast vibrations, Journal of sound and vibration, 270: 67–3683.
Zhai, W.M., Liu, P., Lin, J.H. and Wang, K.Y., 2015. Experimental investigation on vibration behaviour of a CRH train at speed of 350 km/h, International Journal of Rail Transportation, 3(1): 1–16.

A.1. INPUT PARAMETERS
57
A Double-track bridges
Section A.1 gives input parameters for the double-track bridges. Section A.2 and A.3 give the full results for the lower and higher track quality, respectively. Bridge and vehicle results against speed are shown for slab, composite and beam bridges in 1–3 spans. The figures also show which HSLM train that is critical for each bridge. Results for a smooth track profile are given as reference. Also, the vehicle response from running on a plain track section is shown in the figures.
The bridge results without track irregularities should lie at either the acceleration or the deflection limit. Any small deviation from the limit originates from the difference between the vehicle–bridge interaction model and the moving force modal superposition model used to obtain the critical cross-section, e.g. vehicle–bridge interaction effects and higher bridge modes. The deck deflection and particularly the deck acceleration generally increase at the presence of track irregularities, see Section 2.9.2. This is why the presented bridge deck acceleration is above 5 m/s2 for some of the spans.
A.1 Input parameters
The input parameters used in the analyses are presented in Table A.1.
Appendix

APPENDIX A. DOUBLE-TRACK BRIDGES
58
Table A.1: Mass and stiffness for double-track bridges.
Slab bridges 1 span 2 spans 3 spans
L (m) m (tonne/m) EI (GNm2) m (tonne/m) EI (GNm2) m (tonne/m) EI (GNm2) 10 23.08 15.43 19.70 7.811 19.03 6.796 15 29.67 44.91 24.44 19.80 22.20 13.02 20 34.90 85.66 29.41 43.33 26.07 26.11 25 41.33 162.1 30.17 48.08 30.00 46.94 30 45.08 222.2 33.72 74.96 33.32 71.52 Composite bridges 1 span 2 spans 3 spans
L (m) m (tonne/m) EI (GNm2) m (tonne/m) EI (GNm2) m (tonne/m) EI (GNm2) 10 19.86 15.81 19.84 14.58 19.76 10.86 20 20.76 191.9 20.26 62.98 20.22 56.33 30 20.91 248.4 20.64 152.0 20.53 123.3 40 21.73 726.8 20.92 255.1 20.70 171.6 50 20.72 177.7 20.60 141.6 20.49 110.7 60 21.00 288.3 20.90 247.5 20.71 176.1 70 21.37 483.5 21.15 360.0 20.89 240.4 80 21.58 622.5 21.36 473.5 21.13 347.7 Beam bridges 1 span 2 spans 3 spans
L (m) m (tonne/m) EI (GNm2) m (tonne/m) EI (GNm2) m (tonne/m) EI (GNm2) 10 19.05 14.30 18.77 11.83 18.05 7.0 20 22.19 57.96 21.77 50.77 20.41 29.96 30 27.59 179.9 21.93 53.41 21.88 52.49 40 23.61 85.30 23.46 82.09 23.11 75.11 50 27.32 172.5 27.21 169.67 24.91 113.4 60 31.83 304.5 30.81 272.4 28.33 199.9 70 37.97 521.3 36.14 452.5 32.76 334.5 80 42.00 684.7 41.89 680.2 34.87 406.8

A.2. LOWER TRACK QUALITY
59
A.2 Lower track quality
Figure A.1: Slab bridges: maximum deck acceleration from 24 profile realisations, filtered at 20 Hz.
150 200 250 300 350 400Speed (km/h)
0
2
4
6
8
10
Bri
dge
acce
lera
tion
(m
/s2 )
L = 10 mHSLM: A9 (1 span), A1 (2 spans), A1 (3 spans)
150 200 250 300 350 400Speed (km/h)
0
2
4
6
8
10
Bri
dge
acce
lera
tion
(m
/s2 )
L = 15 mHSLM: A8 (1 span), A1 (2 spans), A4 (3 spans)
150 200 250 300 350 400Speed (km/h)
0
2
4
6
8
10
Bri
dge
acce
lera
tion
(m
/s2 )
L = 20 mHSLM: A1 (1 span), A6 (2 spans), A5 (3 spans)
150 200 250 300 350 400Speed (km/h)
0
2
4
6
8
10
Bri
dge
acce
lera
tion
(m
/s2 )
L = 25 mHSLM: A4 (1 span), A5 (2 spans), A1 (3 spans)
150 200 250 300 350 400Speed (km/h)
0
2
4
6
8
10
Bri
dge
acce
lera
tion
(m
/s2 )
L = 30 mHSLM: A10 (1 span), A10 (2 spans), A5 (3 spans)
1 span 2 spans 3 spans Limit value

APPENDIX A. DOUBLE-TRACK BRIDGES
60
Figure A.2: Slab bridges: maximum deck displacement from 24 profile realisations, filtered at 20 Hz.
100 150 200 250 300 350 400Speed (km/h)
0
10
20
30
40
50
Bri
dge
disp
lace
men
t (m
m)
L = 10 mHSLM: A9 (1 span), A1 (2 spans), A1 (3 spans)
100 150 200 250 300 350 400Speed (km/h)
0
10
20
30
40
50
Bri
dge
disp
lace
men
t (m
m)
L = 15 mHSLM: A8 (1 span), A1 (2 spans), A4 (3 spans)
100 150 200 250 300 350 400Speed (km/h)
0
10
20
30
40
50
Bri
dge
disp
lace
men
t (m
m)
L = 20 mHSLM: A1 (1 span), A6 (2 spans), A5 (3 spans)
100 150 200 250 300 350 400Speed (km/h)
0
10
20
30
40
50B
ridg
e di
spla
cem
ent (
mm
)
L = 25 mHSLM: A4 (1 span), A5 (2 spans), A1 (3 spans)
100 150 200 250 300 350 400Speed (km/h)
0
10
20
30
40
50
Bri
dge
disp
lace
men
t (m
m)
L = 30 mHSLM: A10 (1 span), A10 (2 spans), A5 (3 spans)
1 spanLimit value
2 spansLimit value
3 spansLimit value

A.2. LOWER TRACK QUALITY
61
Figure A.3: Slab bridges: maximum wheel unloading from 24 profile realisations, unfiltered.
100 150 200 250 300 350 400Speed (km/h)
0
0.2
0.4
0.6
0.8
1
Whe
el u
nloa
ding
(-)
L = 10 mHSLM: A9 (1 span), A1 (2 spans), A1 (3 spans)
100 150 200 250 300 350 400Speed (km/h)
0
0.2
0.4
0.6
0.8
1
Whe
el u
nloa
ding
(-)
L = 15 mHSLM: A8 (1 span), A1 (2 spans), A4 (3 spans)
100 150 200 250 300 350 400Speed (km/h)
0
0.2
0.4
0.6
0.8
1
Whe
el u
nloa
ding
(-)
L = 20 mHSLM: A1 (1 span), A6 (2 spans), A5 (3 spans)
100 150 200 250 300 350 400Speed (km/h)
0
0.2
0.4
0.6
0.8
1W
heel
unl
oadi
ng (
-)
L = 25 mHSLM: A4 (1 span), A5 (2 spans), A1 (3 spans)
100 150 200 250 300 350 400Speed (km/h)
0
0.2
0.4
0.6
0.8
1
Whe
el u
nloa
ding
(-)
L = 30 mHSLM: A10 (1 span), A10 (2 spans), A5 (3 spans)
1 span (no irreg)1 span (no bridge)1 span
2 spans (no irreg)2 spans (no bridge)2 spans
3 spans (no irreg)3 spans (no bridge)3 spans
Limit value

APPENDIX A. DOUBLE-TRACK BRIDGES
62
Figure A.4: Slab bridges: maximum wheel unloading from 24 profile realisations, filtered at 20 Hz.
100 150 200 250 300 350 400Speed (km/h)
0
0.1
0.2
0.3
0.4
0.5
0.6
Whe
el u
nloa
ding
(-)
, 20
Hz
L = 10 mHSLM: A9 (1 span), A1 (2 spans), A1 (3 spans)
100 150 200 250 300 350 400Speed (km/h)
0
0.1
0.2
0.3
0.4
0.5
0.6
Whe
el u
nloa
ding
(-)
, 20
Hz
L = 15 mHSLM: A8 (1 span), A1 (2 spans), A4 (3 spans)
100 150 200 250 300 350 400Speed (km/h)
0
0.1
0.2
0.3
0.4
0.5
0.6
Whe
el u
nloa
ding
(-)
, 20
Hz
L = 20 mHSLM: A1 (1 span), A6 (2 spans), A5 (3 spans)
100 150 200 250 300 350 400Speed (km/h)
0
0.1
0.2
0.3
0.4
0.5
0.6
Whe
el u
nloa
ding
(-)
, 20
Hz
L = 25 mHSLM: A4 (1 span), A5 (2 spans), A1 (3 spans)
100 150 200 250 300 350 400Speed (km/h)
0
0.1
0.2
0.3
0.4
0.5
0.6
Whe
el u
nloa
ding
(-)
, 20
Hz
L = 30 mHSLM: A10 (1 span), A10 (2 spans), A5 (3 spans)
1 span (no irreg)1 span (no bridge)1 span
2 spans (no irreg)2 spans (no bridge)2 spans
3 spans (no irreg)3 spans (no bridge)3 spans
Limit value

A.2. LOWER TRACK QUALITY
63
Figure A.5: Slab bridges: maximum duration of contact loss from 24 profile realisations, unfiltered.
150 200 250 300 350 400Speed (km/h)
0
5
10
15
Con
tact
loss
(m
s)L = 10 m
HSLM: A9 (1 span), A1 (2 spans), A1 (3 spans)
150 200 250 300 350 400Speed (km/h)
0
5
10
15
Con
tact
loss
(m
s)
L = 15 mHSLM: A8 (1 span), A1 (2 spans), A4 (3 spans)
150 200 250 300 350 400Speed (km/h)
0
5
10
15
Con
tact
loss
(m
s)
L = 20 mHSLM: A1 (1 span), A6 (2 spans), A5 (3 spans)
150 200 250 300 350 400Speed (km/h)
0
5
10
15C
onta
ct lo
ss (
ms)
L = 25 mHSLM: A4 (1 span), A5 (2 spans), A1 (3 spans)
150 200 250 300 350 400Speed (km/h)
0
5
10
15
Con
tact
loss
(m
s)
L = 30 mHSLM: A10 (1 span), A10 (2 spans), A5 (3 spans)
1 span (no bridge)1 span
2 spans (no bridge)2 spans
3 spans (no bridge)3 spans
Limit value
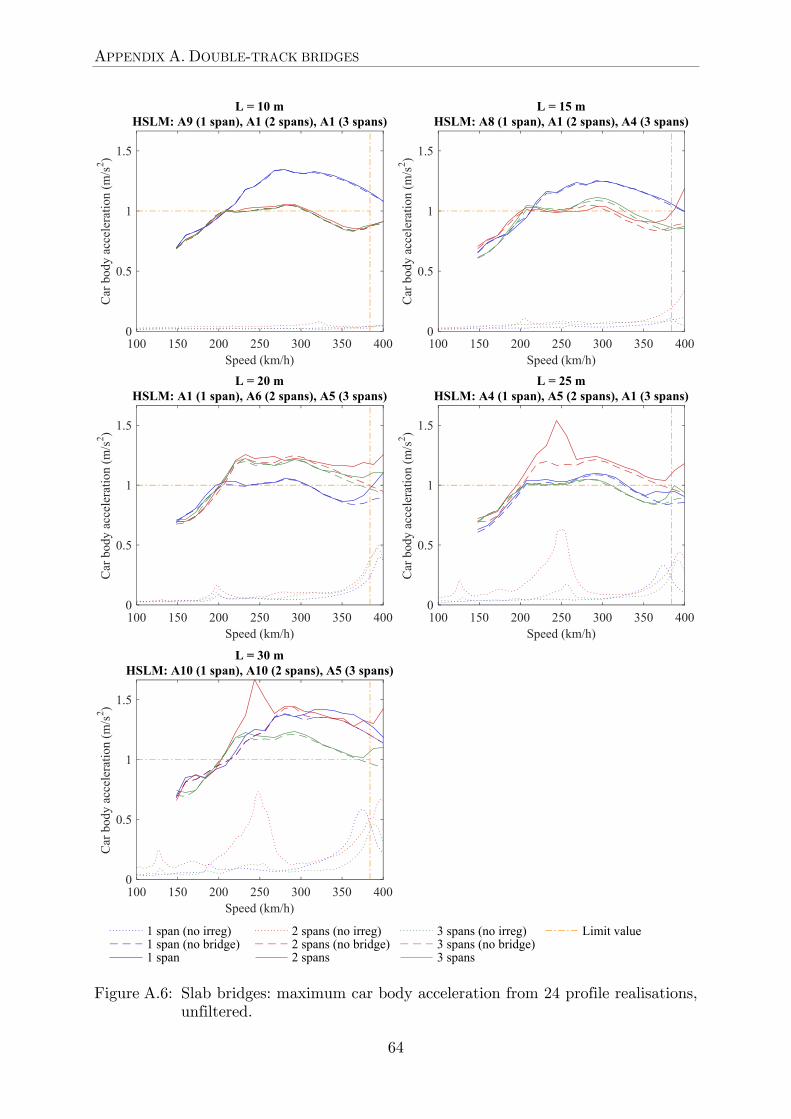
APPENDIX A. DOUBLE-TRACK BRIDGES
64
Figure A.6: Slab bridges: maximum car body acceleration from 24 profile realisations, unfiltered.
100 150 200 250 300 350 400Speed (km/h)
0
0.5
1
1.5
Car
bod
y ac
cele
rati
on (
m/s
2 )L = 10 m
HSLM: A9 (1 span), A1 (2 spans), A1 (3 spans)
100 150 200 250 300 350 400Speed (km/h)
0
0.5
1
1.5
Car
bod
y ac
cele
rati
on (
m/s
2 )
L = 15 mHSLM: A8 (1 span), A1 (2 spans), A4 (3 spans)
100 150 200 250 300 350 400Speed (km/h)
0
0.5
1
1.5
Car
bod
y ac
cele
rati
on (
m/s
2 )
L = 20 mHSLM: A1 (1 span), A6 (2 spans), A5 (3 spans)
100 150 200 250 300 350 400Speed (km/h)
0
0.5
1
1.5
Car
bod
y ac
cele
rati
on (
m/s
2 )
L = 25 mHSLM: A4 (1 span), A5 (2 spans), A1 (3 spans)
100 150 200 250 300 350 400Speed (km/h)
0
0.5
1
1.5
Car
bod
y ac
cele
rati
on (
m/s
2 )
L = 30 mHSLM: A10 (1 span), A10 (2 spans), A5 (3 spans)
1 span (no irreg)1 span (no bridge)1 span
2 spans (no irreg)2 spans (no bridge)2 spans
3 spans (no irreg)3 spans (no bridge)3 spans
Limit value
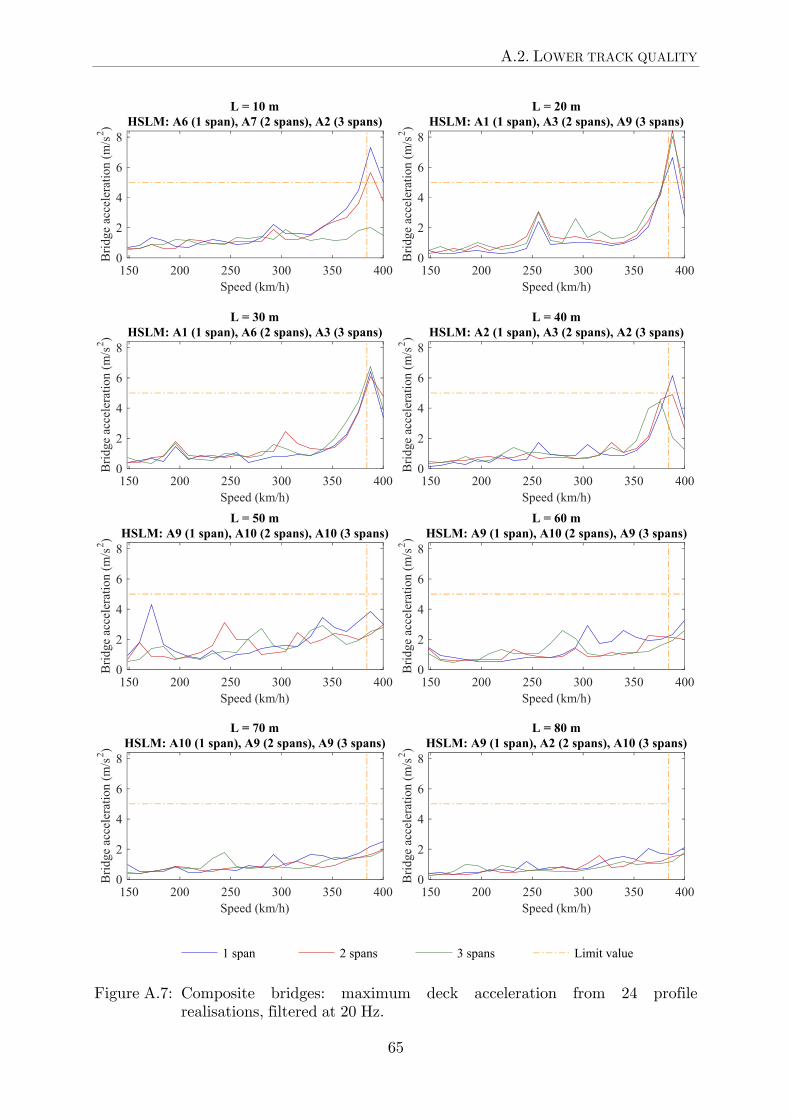
A.2. LOWER TRACK QUALITY
65
Figure A.7: Composite bridges: maximum deck acceleration from 24 profile realisations, filtered at 20 Hz.
150 200 250 300 350 400Speed (km/h)
0
2
4
6
8
Bri
dge
acce
lera
tion
(m
/s2 )
L = 10 mHSLM: A6 (1 span), A7 (2 spans), A2 (3 spans)
150 200 250 300 350 400Speed (km/h)
0
2
4
6
8
Bri
dge
acce
lera
tion
(m
/s2 )
L = 20 mHSLM: A1 (1 span), A3 (2 spans), A9 (3 spans)
150 200 250 300 350 400Speed (km/h)
0
2
4
6
8
Bri
dge
acce
lera
tion
(m
/s2 )
L = 30 mHSLM: A1 (1 span), A6 (2 spans), A3 (3 spans)
150 200 250 300 350 400Speed (km/h)
0
2
4
6
8
Bri
dge
acce
lera
tion
(m
/s2 )
L = 40 mHSLM: A2 (1 span), A3 (2 spans), A2 (3 spans)
150 200 250 300 350 400Speed (km/h)
0
2
4
6
8
Bri
dge
acce
lera
tion
(m
/s2 )
L = 50 mHSLM: A9 (1 span), A10 (2 spans), A10 (3 spans)
150 200 250 300 350 400Speed (km/h)
0
2
4
6
8
Bri
dge
acce
lera
tion
(m
/s2 )
L = 60 mHSLM: A9 (1 span), A10 (2 spans), A9 (3 spans)
150 200 250 300 350 400Speed (km/h)
0
2
4
6
8
Bri
dge
acce
lera
tion
(m
/s2 )
L = 70 mHSLM: A10 (1 span), A9 (2 spans), A9 (3 spans)
150 200 250 300 350 400Speed (km/h)
0
2
4
6
8
Bri
dge
acce
lera
tion
(m
/s2 )
L = 80 mHSLM: A9 (1 span), A2 (2 spans), A10 (3 spans)
1 span 2 spans 3 spans Limit value

APPENDIX A. DOUBLE-TRACK BRIDGES
66
Figure A.8: Composite bridges: maximum deck displacement from 24 profile realisations, filtered at 20 Hz.
100 150 200 250 300 350 400Speed (km/h)
0
50
100
Bri
dge
disp
lace
men
t (m
m)
L = 10 mHSLM: A6 (1 span), A7 (2 spans), A2 (3 spans)
100 150 200 250 300 350 400Speed (km/h)
0
50
100
Bri
dge
disp
lace
men
t (m
m)
L = 20 mHSLM: A1 (1 span), A3 (2 spans), A9 (3 spans)
100 150 200 250 300 350 400Speed (km/h)
0
50
100
Bri
dge
disp
lace
men
t (m
m)
L = 30 mHSLM: A1 (1 span), A6 (2 spans), A3 (3 spans)
100 150 200 250 300 350 400Speed (km/h)
0
50
100
Bri
dge
disp
lace
men
t (m
m)
L = 40 mHSLM: A2 (1 span), A3 (2 spans), A2 (3 spans)
100 150 200 250 300 350 400Speed (km/h)
0
50
100
Bri
dge
disp
lace
men
t (m
m)
L = 50 mHSLM: A9 (1 span), A10 (2 spans), A10 (3 spans)
100 150 200 250 300 350 400Speed (km/h)
0
50
100
Bri
dge
disp
lace
men
t (m
m)
L = 60 mHSLM: A9 (1 span), A10 (2 spans), A9 (3 spans)
100 150 200 250 300 350 400Speed (km/h)
0
50
100
Bri
dge
disp
lace
men
t (m
m)
L = 70 mHSLM: A10 (1 span), A9 (2 spans), A9 (3 spans)
100 150 200 250 300 350 400Speed (km/h)
0
50
100
Bri
dge
disp
lace
men
t (m
m)
L = 80 mHSLM: A9 (1 span), A2 (2 spans), A10 (3 spans)
1 spanLimit value
2 spansLimit value
3 spansLimit value

A.2. LOWER TRACK QUALITY
67
Figure A.9: Composite bridges: maximum wheel unloading from 24 profile realisations, unfiltered.
100 150 200 250 300 350 400Speed (km/h)
0
0.5
1
Whe
el u
nloa
ding
(-)
L = 10 mHSLM: A6 (1 span), A7 (2 spans), A2 (3 spans)
100 150 200 250 300 350 400Speed (km/h)
0
0.5
1
Whe
el u
nloa
ding
(-)
L = 20 mHSLM: A1 (1 span), A3 (2 spans), A9 (3 spans)
100 150 200 250 300 350 400Speed (km/h)
0
0.5
1
Whe
el u
nloa
ding
(-)
L = 30 mHSLM: A1 (1 span), A6 (2 spans), A3 (3 spans)
100 150 200 250 300 350 400Speed (km/h)
0
0.5
1
Whe
el u
nloa
ding
(-)
L = 40 mHSLM: A2 (1 span), A3 (2 spans), A2 (3 spans)
100 150 200 250 300 350 400Speed (km/h)
0
0.5
1
Whe
el u
nloa
ding
(-)
L = 50 mHSLM: A9 (1 span), A10 (2 spans), A10 (3 spans)
100 150 200 250 300 350 400Speed (km/h)
0
0.5
1
Whe
el u
nloa
ding
(-)
L = 60 mHSLM: A9 (1 span), A10 (2 spans), A9 (3 spans)
100 150 200 250 300 350 400Speed (km/h)
0
0.5
1
Whe
el u
nloa
ding
(-)
L = 70 mHSLM: A10 (1 span), A9 (2 spans), A9 (3 spans)
100 150 200 250 300 350 400Speed (km/h)
0
0.5
1
Whe
el u
nloa
ding
(-)
L = 80 mHSLM: A9 (1 span), A2 (2 spans), A10 (3 spans)
1 span (no irreg)1 span (no bridge)1 span
2 spans (no irreg)2 spans (no bridge)2 spans
3 spans (no irreg)3 spans (no bridge)3 spans
Limit value

APPENDIX A. DOUBLE-TRACK BRIDGES
68
Figure A.10: Composite bridges: maximum wheel unloading from 24 profile realisations, filtered at 20 Hz.
100 150 200 250 300 350 400Speed (km/h)
0
0.2
0.4
0.6
Whe
el u
nloa
ding
(-)
, 20
Hz
L = 10 mHSLM: A6 (1 span), A7 (2 spans), A2 (3 spans)
100 150 200 250 300 350 400Speed (km/h)
0
0.2
0.4
0.6
Whe
el u
nloa
ding
(-)
, 20
Hz
L = 20 mHSLM: A1 (1 span), A3 (2 spans), A9 (3 spans)
100 150 200 250 300 350 400Speed (km/h)
0
0.2
0.4
0.6
Whe
el u
nloa
ding
(-)
, 20
Hz
L = 30 mHSLM: A1 (1 span), A6 (2 spans), A3 (3 spans)
100 150 200 250 300 350 400Speed (km/h)
0
0.2
0.4
0.6
Whe
el u
nloa
ding
(-)
, 20
Hz
L = 40 mHSLM: A2 (1 span), A3 (2 spans), A2 (3 spans)
100 150 200 250 300 350 400Speed (km/h)
0
0.2
0.4
0.6
Whe
el u
nloa
ding
(-)
, 20
Hz
L = 50 mHSLM: A9 (1 span), A10 (2 spans), A10 (3 spans)
100 150 200 250 300 350 400Speed (km/h)
0
0.2
0.4
0.6
Whe
el u
nloa
ding
(-)
, 20
Hz
L = 60 mHSLM: A9 (1 span), A10 (2 spans), A9 (3 spans)
100 150 200 250 300 350 400Speed (km/h)
0
0.2
0.4
0.6
Whe
el u
nloa
ding
(-)
, 20
Hz
L = 70 mHSLM: A10 (1 span), A9 (2 spans), A9 (3 spans)
100 150 200 250 300 350 400Speed (km/h)
0
0.2
0.4
0.6
Whe
el u
nloa
ding
(-)
, 20
Hz
L = 80 mHSLM: A9 (1 span), A2 (2 spans), A10 (3 spans)
1 span (no irreg)1 span (no bridge)1 span
2 spans (no irreg)2 spans (no bridge)2 spans
3 spans (no irreg)3 spans (no bridge)3 spans
Limit value
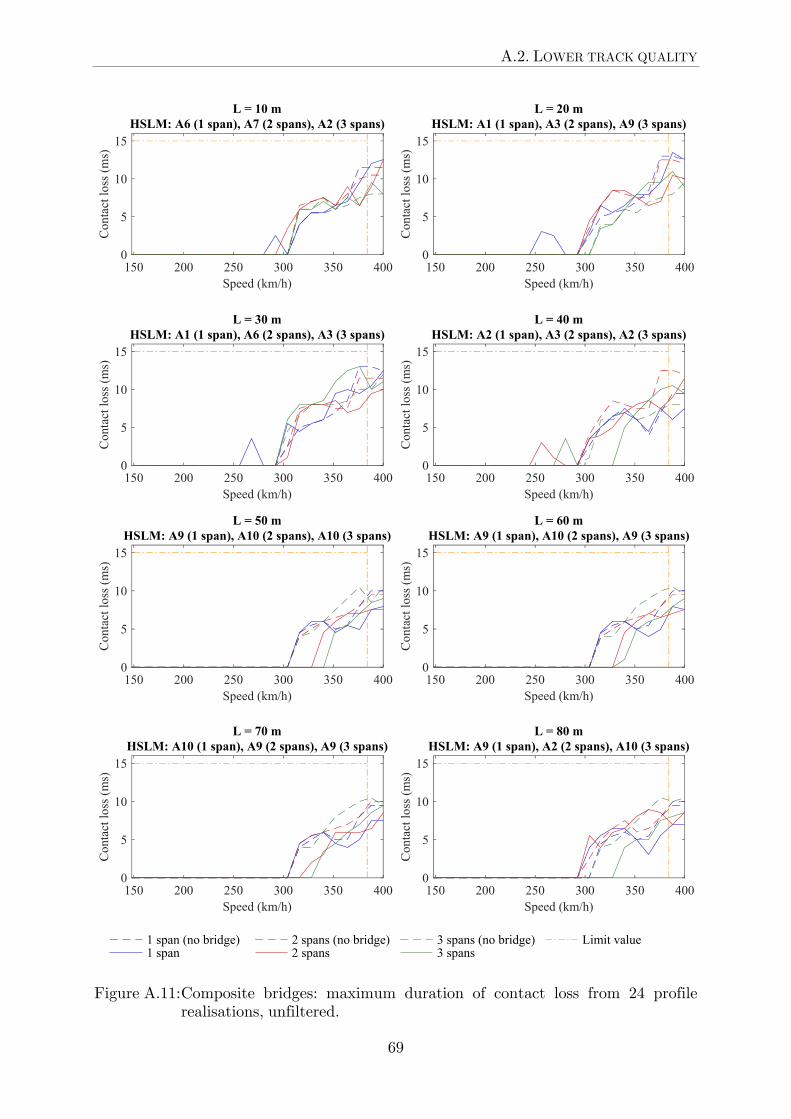
A.2. LOWER TRACK QUALITY
69
Figure A.11: Composite bridges: maximum duration of contact loss from 24 profile realisations, unfiltered.
150 200 250 300 350 400Speed (km/h)
0
5
10
15
Con
tact
loss
(m
s)L = 10 m
HSLM: A6 (1 span), A7 (2 spans), A2 (3 spans)
150 200 250 300 350 400Speed (km/h)
0
5
10
15
Con
tact
loss
(m
s)
L = 20 mHSLM: A1 (1 span), A3 (2 spans), A9 (3 spans)
150 200 250 300 350 400Speed (km/h)
0
5
10
15
Con
tact
loss
(m
s)
L = 30 mHSLM: A1 (1 span), A6 (2 spans), A3 (3 spans)
150 200 250 300 350 400Speed (km/h)
0
5
10
15
Con
tact
loss
(m
s)
L = 40 mHSLM: A2 (1 span), A3 (2 spans), A2 (3 spans)
150 200 250 300 350 400Speed (km/h)
0
5
10
15
Con
tact
loss
(m
s)
L = 50 mHSLM: A9 (1 span), A10 (2 spans), A10 (3 spans)
150 200 250 300 350 400Speed (km/h)
0
5
10
15
Con
tact
loss
(m
s)
L = 60 mHSLM: A9 (1 span), A10 (2 spans), A9 (3 spans)
150 200 250 300 350 400Speed (km/h)
0
5
10
15
Con
tact
loss
(m
s)
L = 70 mHSLM: A10 (1 span), A9 (2 spans), A9 (3 spans)
150 200 250 300 350 400Speed (km/h)
0
5
10
15
Con
tact
loss
(m
s)
L = 80 mHSLM: A9 (1 span), A2 (2 spans), A10 (3 spans)
1 span (no bridge)1 span
2 spans (no bridge)2 spans
3 spans (no bridge)3 spans
Limit value

APPENDIX A. DOUBLE-TRACK BRIDGES
70
Figure A.12: Composite bridges: maximum car body acceleration from 24 profile realisations, unfiltered.
100 150 200 250 300 350 400Speed (km/h)
0
0.5
1
1.5
2
Car
bod
y ac
cele
ratio
n (m
/s2 )
L = 10 mHSLM: A6 (1 span), A7 (2 spans), A2 (3 spans)
100 150 200 250 300 350 400Speed (km/h)
0
0.5
1
1.5
2
Car
bod
y ac
cele
ratio
n (m
/s2 )
L = 20 mHSLM: A1 (1 span), A3 (2 spans), A9 (3 spans)
100 150 200 250 300 350 400Speed (km/h)
0
0.5
1
1.5
2
Car
bod
y ac
cele
rati
on (
m/s
2 )
L = 30 mHSLM: A1 (1 span), A6 (2 spans), A3 (3 spans)
100 150 200 250 300 350 400Speed (km/h)
0
0.5
1
1.5
2
Car
bod
y ac
cele
rati
on (
m/s
2 )
L = 40 mHSLM: A2 (1 span), A3 (2 spans), A2 (3 spans)
100 150 200 250 300 350 400Speed (km/h)
0
0.5
1
1.5
2
Car
bod
y ac
cele
rati
on (
m/s
2 )
L = 50 mHSLM: A9 (1 span), A10 (2 spans), A10 (3 spans)
100 150 200 250 300 350 400Speed (km/h)
0
0.5
1
1.5
2
Car
bod
y ac
cele
rati
on (
m/s
2 )
L = 60 mHSLM: A9 (1 span), A10 (2 spans), A9 (3 spans)
100 150 200 250 300 350 400Speed (km/h)
0
0.5
1
1.5
2
Car
bod
y ac
cele
rati
on (
m/s
2 )
L = 70 mHSLM: A10 (1 span), A9 (2 spans), A9 (3 spans)
100 150 200 250 300 350 400Speed (km/h)
0
0.5
1
1.5
2
Car
bod
y ac
cele
rati
on (
m/s
2 )
L = 80 mHSLM: A9 (1 span), A2 (2 spans), A10 (3 spans)
1 span (no irreg)1 span (no bridge)1 span
2 spans (no irreg)2 spans (no bridge)2 spans
3 spans (no irreg)3 spans (no bridge)3 spans
Limit value

A.2. LOWER TRACK QUALITY
71
Figure A.13: Beam bridges: maximum deck acceleration from 24 profile realisations, filtered at 20 Hz.
150 200 250 300 350 400Speed (km/h)
0
5
10
Bri
dge
acce
lera
tion
(m
/s2 )
L = 10 mHSLM: A7 (1 span), A9 (2 spans), A9 (3 spans)
150 200 250 300 350 400Speed (km/h)
0
5
10
Bri
dge
acce
lera
tion
(m
/s2 )
L = 20 mHSLM: A1 (1 span), A1 (2 spans), A1 (3 spans)
150 200 250 300 350 400Speed (km/h)
0
5
10
Bri
dge
acce
lera
tion
(m
/s2 )
L = 30 mHSLM: A7 (1 span), A9 (2 spans), A4 (3 spans)
150 200 250 300 350 400Speed (km/h)
0
5
10
Bri
dge
acce
lera
tion
(m
/s2 )
L = 40 mHSLM: A9 (1 span), A9 (2 spans), A9 (3 spans)
150 200 250 300 350 400Speed (km/h)
0
5
10
Bri
dge
acce
lera
tion
(m
/s2 )
L = 50 mHSLM: A9 (1 span), A9 (2 spans), A10 (3 spans)
150 200 250 300 350 400Speed (km/h)
0
5
10
Bri
dge
acce
lera
tion
(m
/s2 )
L = 60 mHSLM: A10 (1 span), A9 (2 spans), A10 (3 spans)
150 200 250 300 350 400Speed (km/h)
0
5
10
Bri
dge
acce
lera
tion
(m
/s2 )
L = 70 mHSLM: A10 (1 span), A10 (2 spans), A9 (3 spans)
150 200 250 300 350 400Speed (km/h)
0
5
10
Bri
dge
acce
lera
tion
(m
/s2 )
L = 80 mHSLM: A9 (1 span), A9 (2 spans), A9 (3 spans)
1 span 2 spans 3 spans Limit value

APPENDIX A. DOUBLE-TRACK BRIDGES
72
Figure A.14: Beam bridges: maximum deck displacement from 24 profile realisations, filtered at 20 Hz.
100 150 200 250 300 350 400Speed (km/h)
0
50
100
Bri
dge
disp
lace
men
t (m
m)
L = 10 mHSLM: A7 (1 span), A9 (2 spans), A9 (3 spans)
100 150 200 250 300 350 400Speed (km/h)
0
50
100
Bri
dge
disp
lace
men
t (m
m)
L = 20 mHSLM: A1 (1 span), A1 (2 spans), A1 (3 spans)
100 150 200 250 300 350 400Speed (km/h)
0
50
100
Bri
dge
disp
lace
men
t (m
m)
L = 30 mHSLM: A7 (1 span), A9 (2 spans), A4 (3 spans)
100 150 200 250 300 350 400Speed (km/h)
0
50
100
Bri
dge
disp
lace
men
t (m
m)
L = 40 mHSLM: A9 (1 span), A9 (2 spans), A9 (3 spans)
100 150 200 250 300 350 400Speed (km/h)
0
50
100
Bri
dge
disp
lace
men
t (m
m)
L = 50 mHSLM: A9 (1 span), A9 (2 spans), A10 (3 spans)
100 150 200 250 300 350 400Speed (km/h)
0
50
100
Bri
dge
disp
lace
men
t (m
m)
L = 60 mHSLM: A10 (1 span), A9 (2 spans), A10 (3 spans)
100 150 200 250 300 350 400Speed (km/h)
0
50
100
Bri
dge
disp
lace
men
t (m
m)
L = 70 mHSLM: A10 (1 span), A10 (2 spans), A9 (3 spans)
100 150 200 250 300 350 400Speed (km/h)
0
50
100
Bri
dge
disp
lace
men
t (m
m)
L = 80 mHSLM: A9 (1 span), A9 (2 spans), A9 (3 spans)
1 spanLimit value
2 spansLimit value
3 spansLimit value

A.2. LOWER TRACK QUALITY
73
Figure A.15: Beam bridges: maximum wheel unloading from 24 profile realisations, unfiltered.
100 150 200 250 300 350 400Speed (km/h)
0
0.5
1
Whe
el u
nloa
ding
(-)
L = 10 mHSLM: A7 (1 span), A9 (2 spans), A9 (3 spans)
100 150 200 250 300 350 400Speed (km/h)
0
0.5
1
Whe
el u
nloa
ding
(-)
L = 20 mHSLM: A1 (1 span), A1 (2 spans), A1 (3 spans)
100 150 200 250 300 350 400Speed (km/h)
0
0.5
1
Whe
el u
nloa
ding
(-)
L = 30 mHSLM: A7 (1 span), A9 (2 spans), A4 (3 spans)
100 150 200 250 300 350 400Speed (km/h)
0
0.5
1
Whe
el u
nloa
ding
(-)
L = 40 mHSLM: A9 (1 span), A9 (2 spans), A9 (3 spans)
100 150 200 250 300 350 400Speed (km/h)
0
0.5
1
Whe
el u
nloa
ding
(-)
L = 50 mHSLM: A9 (1 span), A9 (2 spans), A10 (3 spans)
100 150 200 250 300 350 400Speed (km/h)
0
0.5
1
Whe
el u
nloa
ding
(-)
L = 60 mHSLM: A10 (1 span), A9 (2 spans), A10 (3 spans)
100 150 200 250 300 350 400Speed (km/h)
0
0.5
1
Whe
el u
nloa
ding
(-)
L = 70 mHSLM: A10 (1 span), A10 (2 spans), A9 (3 spans)
100 150 200 250 300 350 400Speed (km/h)
0
0.5
1
Whe
el u
nloa
ding
(-)
L = 80 mHSLM: A9 (1 span), A9 (2 spans), A9 (3 spans)
1 span (no irreg)1 span (no bridge)1 span
2 spans (no irreg)2 spans (no bridge)2 spans
3 spans (no irreg)3 spans (no bridge)3 spans
Limit value
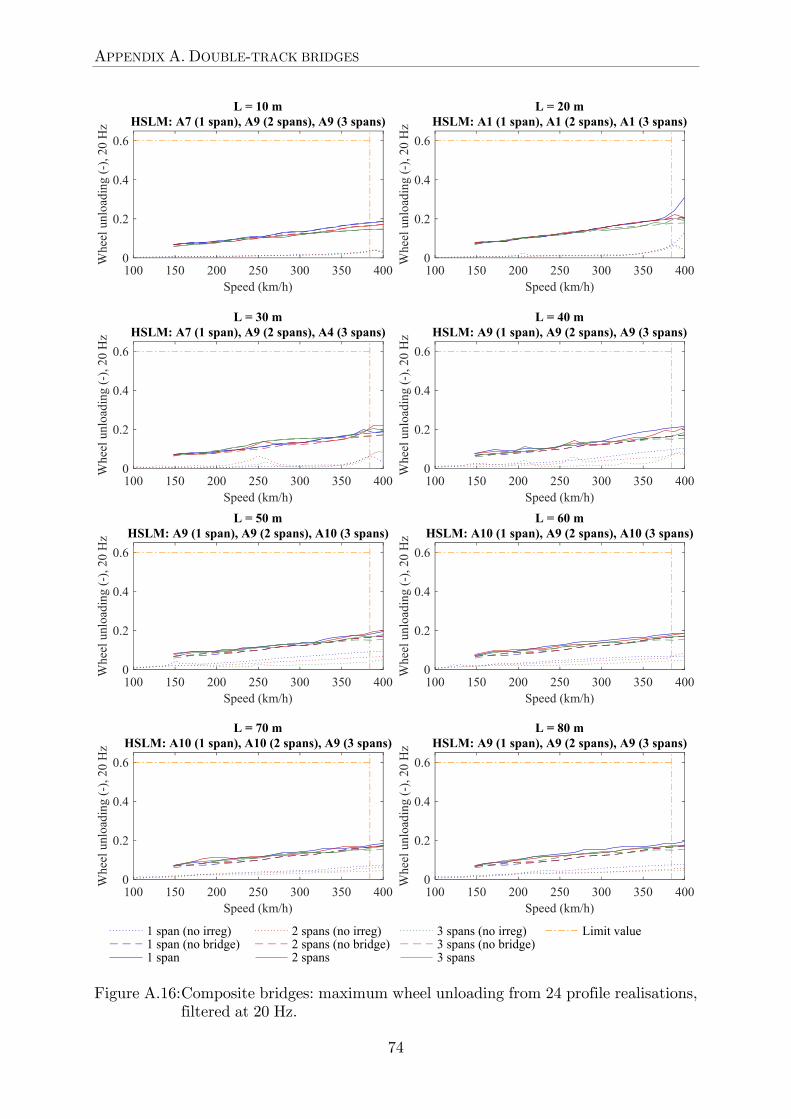
APPENDIX A. DOUBLE-TRACK BRIDGES
74
Figure A.16: Composite bridges: maximum wheel unloading from 24 profile realisations, filtered at 20 Hz.
100 150 200 250 300 350 400Speed (km/h)
0
0.2
0.4
0.6
Whe
el u
nloa
ding
(-)
, 20
Hz
L = 10 mHSLM: A7 (1 span), A9 (2 spans), A9 (3 spans)
100 150 200 250 300 350 400Speed (km/h)
0
0.2
0.4
0.6
Whe
el u
nloa
ding
(-)
, 20
Hz
L = 20 mHSLM: A1 (1 span), A1 (2 spans), A1 (3 spans)
100 150 200 250 300 350 400Speed (km/h)
0
0.2
0.4
0.6
Whe
el u
nloa
ding
(-)
, 20
Hz
L = 30 mHSLM: A7 (1 span), A9 (2 spans), A4 (3 spans)
100 150 200 250 300 350 400Speed (km/h)
0
0.2
0.4
0.6
Whe
el u
nloa
ding
(-)
, 20
Hz
L = 40 mHSLM: A9 (1 span), A9 (2 spans), A9 (3 spans)
100 150 200 250 300 350 400Speed (km/h)
0
0.2
0.4
0.6
Whe
el u
nloa
ding
(-)
, 20
Hz
L = 50 mHSLM: A9 (1 span), A9 (2 spans), A10 (3 spans)
100 150 200 250 300 350 400Speed (km/h)
0
0.2
0.4
0.6
Whe
el u
nloa
ding
(-)
, 20
Hz
L = 60 mHSLM: A10 (1 span), A9 (2 spans), A10 (3 spans)
100 150 200 250 300 350 400Speed (km/h)
0
0.2
0.4
0.6
Whe
el u
nloa
ding
(-)
, 20
Hz
L = 70 mHSLM: A10 (1 span), A10 (2 spans), A9 (3 spans)
100 150 200 250 300 350 400Speed (km/h)
0
0.2
0.4
0.6
Whe
el u
nloa
ding
(-)
, 20
Hz
L = 80 mHSLM: A9 (1 span), A9 (2 spans), A9 (3 spans)
1 span (no irreg)1 span (no bridge)1 span
2 spans (no irreg)2 spans (no bridge)2 spans
3 spans (no irreg)3 spans (no bridge)3 spans
Limit value

A.2. LOWER TRACK QUALITY
75
Figure A.17: Beam bridges: maximum duration of contact loss from 24 profile realisations, unfiltered.
150 200 250 300 350 400Speed (km/h)
0
5
10
15
Con
tact
loss
(m
s)L = 10 m
HSLM: A7 (1 span), A9 (2 spans), A9 (3 spans)
150 200 250 300 350 400Speed (km/h)
0
5
10
15
Con
tact
loss
(m
s)
L = 20 mHSLM: A1 (1 span), A1 (2 spans), A1 (3 spans)
150 200 250 300 350 400Speed (km/h)
0
5
10
15
Con
tact
loss
(m
s)
L = 30 mHSLM: A7 (1 span), A9 (2 spans), A4 (3 spans)
150 200 250 300 350 400Speed (km/h)
0
5
10
15
Con
tact
loss
(m
s)
L = 40 mHSLM: A9 (1 span), A9 (2 spans), A9 (3 spans)
150 200 250 300 350 400Speed (km/h)
0
5
10
15
Con
tact
loss
(m
s)
L = 50 mHSLM: A9 (1 span), A9 (2 spans), A10 (3 spans)
150 200 250 300 350 400Speed (km/h)
0
5
10
15
Con
tact
loss
(m
s)
L = 60 mHSLM: A10 (1 span), A9 (2 spans), A10 (3 spans)
150 200 250 300 350 400Speed (km/h)
0
5
10
15
Con
tact
loss
(m
s)
L = 70 mHSLM: A10 (1 span), A10 (2 spans), A9 (3 spans)
150 200 250 300 350 400Speed (km/h)
0
5
10
15
Con
tact
loss
(m
s)
L = 80 mHSLM: A9 (1 span), A9 (2 spans), A9 (3 spans)
1 span (no bridge)1 span
2 spans (no bridge)2 spans
3 spans (no bridge)3 spans
Limit value

APPENDIX A. DOUBLE-TRACK BRIDGES
76
Figure A.18: Beam bridges: maximum car body acceleration from 24 profile realisations, unfiltered.
100 150 200 250 300 350 400Speed (km/h)
0
0.5
1
1.5
2
Car
bod
y ac
cele
ratio
n (m
/s2 )
L = 10 mHSLM: A7 (1 span), A9 (2 spans), A9 (3 spans)
100 150 200 250 300 350 400Speed (km/h)
0
0.5
1
1.5
2
Car
bod
y ac
cele
ratio
n (m
/s2 )
L = 20 mHSLM: A1 (1 span), A1 (2 spans), A1 (3 spans)
100 150 200 250 300 350 400Speed (km/h)
0
0.5
1
1.5
2
Car
bod
y ac
cele
rati
on (
m/s
2 )
L = 30 mHSLM: A7 (1 span), A9 (2 spans), A4 (3 spans)
100 150 200 250 300 350 400Speed (km/h)
0
0.5
1
1.5
2
Car
bod
y ac
cele
rati
on (
m/s
2 )
L = 40 mHSLM: A9 (1 span), A9 (2 spans), A9 (3 spans)
100 150 200 250 300 350 400Speed (km/h)
0
0.5
1
1.5
2
Car
bod
y ac
cele
rati
on (
m/s
2 )
L = 50 mHSLM: A9 (1 span), A9 (2 spans), A10 (3 spans)
100 150 200 250 300 350 400Speed (km/h)
0
0.5
1
1.5
2
Car
bod
y ac
cele
rati
on (
m/s
2 )
L = 60 mHSLM: A10 (1 span), A9 (2 spans), A10 (3 spans)
100 150 200 250 300 350 400Speed (km/h)
0
0.5
1
1.5
2
Car
bod
y ac
cele
rati
on (
m/s
2 )
L = 70 mHSLM: A10 (1 span), A10 (2 spans), A9 (3 spans)
100 150 200 250 300 350 400Speed (km/h)
0
0.5
1
1.5
2
Car
bod
y ac
cele
rati
on (
m/s
2 )
L = 80 mHSLM: A9 (1 span), A9 (2 spans), A9 (3 spans)
1 span (no irreg)1 span (no bridge)1 span
2 spans (no irreg)2 spans (no bridge)2 spans
3 spans (no irreg)3 spans (no bridge)3 spans
Limit value

A.3. HIGHER TRACK QUALITY
77
A.3 Higher track quality
Figure A.19: Slab bridges: maximum deck acceleration from 24 profile realisations, filtered at 20 Hz.
150 200 250 300 350 400Speed (km/h)
0
2
4
6
8
10
Bri
dge
acce
lera
tion
(m
/s2 )
L = 10 mHSLM: A9 (1 span), A1 (2 spans), A1 (3 spans)
150 200 250 300 350 400Speed (km/h)
0
2
4
6
8
10
Bri
dge
acce
lera
tion
(m
/s2 )
L = 15 mHSLM: A8 (1 span), A1 (2 spans), A4 (3 spans)
150 200 250 300 350 400Speed (km/h)
0
2
4
6
8
10
Bri
dge
acce
lera
tion
(m
/s2 )
L = 20 mHSLM: A1 (1 span), A6 (2 spans), A5 (3 spans)
150 200 250 300 350 400Speed (km/h)
0
2
4
6
8
10
Bri
dge
acce
lera
tion
(m
/s2 )
L = 25 mHSLM: A4 (1 span), A5 (2 spans), A1 (3 spans)
150 200 250 300 350 400Speed (km/h)
0
2
4
6
8
10
Bri
dge
acce
lera
tion
(m
/s2 )
L = 30 mHSLM: A10 (1 span), A10 (2 spans), A5 (3 spans)
1 span 2 spans 3 spans Limit value

APPENDIX A. DOUBLE-TRACK BRIDGES
78
Figure A.20: Slab bridges: maximum deck displacement from 24 profile realisations, filtered at 20 Hz.
100 150 200 250 300 350 400Speed (km/h)
0
10
20
30
40
50
Bri
dge
disp
lace
men
t (m
m)
L = 10 mHSLM: A9 (1 span), A1 (2 spans), A1 (3 spans)
100 150 200 250 300 350 400Speed (km/h)
0
10
20
30
40
50
Bri
dge
disp
lace
men
t (m
m)
L = 15 mHSLM: A8 (1 span), A1 (2 spans), A4 (3 spans)
100 150 200 250 300 350 400Speed (km/h)
0
10
20
30
40
50
Bri
dge
disp
lace
men
t (m
m)
L = 20 mHSLM: A1 (1 span), A6 (2 spans), A5 (3 spans)
100 150 200 250 300 350 400Speed (km/h)
0
10
20
30
40
50B
ridg
e di
spla
cem
ent (
mm
)
L = 25 mHSLM: A4 (1 span), A5 (2 spans), A1 (3 spans)
100 150 200 250 300 350 400Speed (km/h)
0
10
20
30
40
50
Bri
dge
disp
lace
men
t (m
m)
L = 30 mHSLM: A10 (1 span), A10 (2 spans), A5 (3 spans)
1 spanLimit value
2 spansLimit value
3 spansLimit value

A.3. HIGHER TRACK QUALITY
79
Figure A.21: Slab bridges: maximum wheel unloading from 24 profile realisations, unfiltered.
100 150 200 250 300 350 400Speed (km/h)
0
0.2
0.4
0.6
0.8
1
Whe
el u
nloa
ding
(-)
L = 10 mHSLM: A9 (1 span), A1 (2 spans), A1 (3 spans)
100 150 200 250 300 350 400Speed (km/h)
0
0.2
0.4
0.6
0.8
1
Whe
el u
nloa
ding
(-)
L = 15 mHSLM: A8 (1 span), A1 (2 spans), A4 (3 spans)
100 150 200 250 300 350 400Speed (km/h)
0
0.2
0.4
0.6
0.8
1
Whe
el u
nloa
ding
(-)
L = 20 mHSLM: A1 (1 span), A6 (2 spans), A5 (3 spans)
100 150 200 250 300 350 400Speed (km/h)
0
0.2
0.4
0.6
0.8
1W
heel
unl
oadi
ng (
-)
L = 25 mHSLM: A4 (1 span), A5 (2 spans), A1 (3 spans)
100 150 200 250 300 350 400Speed (km/h)
0
0.2
0.4
0.6
0.8
1
Whe
el u
nloa
ding
(-)
L = 30 mHSLM: A10 (1 span), A10 (2 spans), A5 (3 spans)
1 span (no irreg)1 span (no bridge)1 span
2 spans (no irreg)2 spans (no bridge)2 spans
3 spans (no irreg)3 spans (no bridge)3 spans
Limit value

APPENDIX A. DOUBLE-TRACK BRIDGES
80
Figure A.22: Slab bridges: maximum wheel unloading from 24 profile realisations, filtered at 20 Hz.
100 150 200 250 300 350 400Speed (km/h)
0
0.1
0.2
0.3
0.4
0.5
0.6
Whe
el u
nloa
ding
(-)
, 20
Hz
L = 10 mHSLM: A9 (1 span), A1 (2 spans), A1 (3 spans)
100 150 200 250 300 350 400Speed (km/h)
0
0.1
0.2
0.3
0.4
0.5
0.6
Whe
el u
nloa
ding
(-)
, 20
Hz
L = 15 mHSLM: A8 (1 span), A1 (2 spans), A4 (3 spans)
100 150 200 250 300 350 400Speed (km/h)
0
0.1
0.2
0.3
0.4
0.5
0.6
Whe
el u
nloa
ding
(-)
, 20
Hz
L = 20 mHSLM: A1 (1 span), A6 (2 spans), A5 (3 spans)
100 150 200 250 300 350 400Speed (km/h)
0
0.1
0.2
0.3
0.4
0.5
0.6W
heel
unl
oadi
ng (
-), 2
0 H
z
L = 25 mHSLM: A4 (1 span), A5 (2 spans), A1 (3 spans)
100 150 200 250 300 350 400Speed (km/h)
0
0.1
0.2
0.3
0.4
0.5
0.6
Whe
el u
nloa
ding
(-)
, 20
Hz
L = 30 mHSLM: A10 (1 span), A10 (2 spans), A5 (3 spans)
1 span (no irreg)1 span (no bridge)1 span
2 spans (no irreg)2 spans (no bridge)2 spans
3 spans (no irreg)3 spans (no bridge)3 spans
Limit value

A.3. HIGHER TRACK QUALITY
81
Figure A.23: Slab bridges: maximum car body acceleration from 24 profile realisations, unfiltered.
100 150 200 250 300 350 400Speed (km/h)
0
0.2
0.4
0.6
0.8
1
Car
bod
y ac
cele
rati
on (
m/s
2 )L = 10 m
HSLM: A9 (1 span), A1 (2 spans), A1 (3 spans)
100 150 200 250 300 350 400Speed (km/h)
0
0.2
0.4
0.6
0.8
1
Car
bod
y ac
cele
rati
on (
m/s
2 )
L = 15 mHSLM: A8 (1 span), A1 (2 spans), A4 (3 spans)
100 150 200 250 300 350 400Speed (km/h)
0
0.2
0.4
0.6
0.8
1
Car
bod
y ac
cele
rati
on (
m/s
2 )
L = 20 mHSLM: A1 (1 span), A6 (2 spans), A5 (3 spans)
100 150 200 250 300 350 400Speed (km/h)
0
0.2
0.4
0.6
0.8
1C
ar b
ody
acce
lera
tion
(m
/s2 )
L = 25 mHSLM: A4 (1 span), A5 (2 spans), A1 (3 spans)
100 150 200 250 300 350 400Speed (km/h)
0
0.2
0.4
0.6
0.8
1
Car
bod
y ac
cele
rati
on (
m/s
2 )
L = 30 mHSLM: A10 (1 span), A10 (2 spans), A5 (3 spans)
1 span (no irreg)1 span (no bridge)1 span
2 spans (no irreg)2 spans (no bridge)2 spans
3 spans (no irreg)3 spans (no bridge)3 spans
Limit value
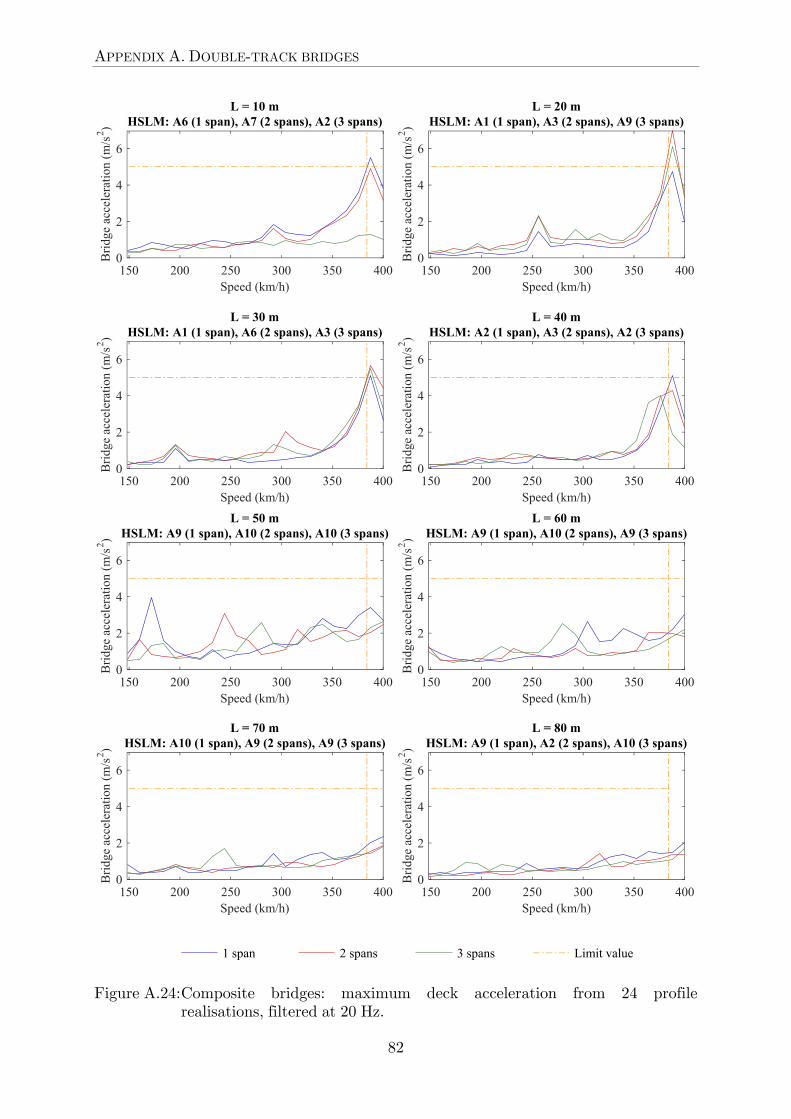
APPENDIX A. DOUBLE-TRACK BRIDGES
82
Figure A.24: Composite bridges: maximum deck acceleration from 24 profile realisations, filtered at 20 Hz.
150 200 250 300 350 400Speed (km/h)
0
2
4
6
Bri
dge
acce
lera
tion
(m
/s2 )
L = 10 mHSLM: A6 (1 span), A7 (2 spans), A2 (3 spans)
150 200 250 300 350 400Speed (km/h)
0
2
4
6
Bri
dge
acce
lera
tion
(m
/s2 )
L = 20 mHSLM: A1 (1 span), A3 (2 spans), A9 (3 spans)
150 200 250 300 350 400Speed (km/h)
0
2
4
6
Bri
dge
acce
lera
tion
(m
/s2 )
L = 30 mHSLM: A1 (1 span), A6 (2 spans), A3 (3 spans)
150 200 250 300 350 400Speed (km/h)
0
2
4
6
Bri
dge
acce
lera
tion
(m
/s2 )
L = 40 mHSLM: A2 (1 span), A3 (2 spans), A2 (3 spans)
150 200 250 300 350 400Speed (km/h)
0
2
4
6
Bri
dge
acce
lera
tion
(m
/s2 )
L = 50 mHSLM: A9 (1 span), A10 (2 spans), A10 (3 spans)
150 200 250 300 350 400Speed (km/h)
0
2
4
6
Bri
dge
acce
lera
tion
(m
/s2 )
L = 60 mHSLM: A9 (1 span), A10 (2 spans), A9 (3 spans)
150 200 250 300 350 400Speed (km/h)
0
2
4
6
Bri
dge
acce
lera
tion
(m
/s2 )
L = 70 mHSLM: A10 (1 span), A9 (2 spans), A9 (3 spans)
150 200 250 300 350 400Speed (km/h)
0
2
4
6
Bri
dge
acce
lera
tion
(m
/s2 )
L = 80 mHSLM: A9 (1 span), A2 (2 spans), A10 (3 spans)
1 span 2 spans 3 spans Limit value

A.3. HIGHER TRACK QUALITY
83
Figure A.25: Composite bridges: maximum deck displacement from 24 profile realisations, filtered at 20 Hz.
100 150 200 250 300 350 400Speed (km/h)
0
50
100
Bri
dge
disp
lace
men
t (m
m)
L = 10 mHSLM: A6 (1 span), A7 (2 spans), A2 (3 spans)
100 150 200 250 300 350 400Speed (km/h)
0
50
100
Bri
dge
disp
lace
men
t (m
m)
L = 20 mHSLM: A1 (1 span), A3 (2 spans), A9 (3 spans)
100 150 200 250 300 350 400Speed (km/h)
0
50
100
Bri
dge
disp
lace
men
t (m
m)
L = 30 mHSLM: A1 (1 span), A6 (2 spans), A3 (3 spans)
100 150 200 250 300 350 400Speed (km/h)
0
50
100
Bri
dge
disp
lace
men
t (m
m)
L = 40 mHSLM: A2 (1 span), A3 (2 spans), A2 (3 spans)
100 150 200 250 300 350 400Speed (km/h)
0
50
100
Bri
dge
disp
lace
men
t (m
m)
L = 50 mHSLM: A9 (1 span), A10 (2 spans), A10 (3 spans)
100 150 200 250 300 350 400Speed (km/h)
0
50
100
Bri
dge
disp
lace
men
t (m
m)
L = 60 mHSLM: A9 (1 span), A10 (2 spans), A9 (3 spans)
100 150 200 250 300 350 400Speed (km/h)
0
50
100
Bri
dge
disp
lace
men
t (m
m)
L = 70 mHSLM: A10 (1 span), A9 (2 spans), A9 (3 spans)
100 150 200 250 300 350 400Speed (km/h)
0
50
100
Bri
dge
disp
lace
men
t (m
m)
L = 80 mHSLM: A9 (1 span), A2 (2 spans), A10 (3 spans)
1 spanLimit value
2 spansLimit value
3 spansLimit value

APPENDIX A. DOUBLE-TRACK BRIDGES
84
Figure A.26: Composite bridges: maximum wheel unloading from 24 profile realisations, unfiltered.
100 150 200 250 300 350 400Speed (km/h)
0
0.5
1
Whe
el u
nloa
ding
(-)
L = 10 mHSLM: A6 (1 span), A7 (2 spans), A2 (3 spans)
100 150 200 250 300 350 400Speed (km/h)
0
0.5
1
Whe
el u
nloa
ding
(-)
L = 20 mHSLM: A1 (1 span), A3 (2 spans), A9 (3 spans)
100 150 200 250 300 350 400Speed (km/h)
0
0.5
1
Whe
el u
nloa
ding
(-)
L = 30 mHSLM: A1 (1 span), A6 (2 spans), A3 (3 spans)
100 150 200 250 300 350 400Speed (km/h)
0
0.5
1
Whe
el u
nloa
ding
(-)
L = 40 mHSLM: A2 (1 span), A3 (2 spans), A2 (3 spans)
100 150 200 250 300 350 400Speed (km/h)
0
0.5
1
Whe
el u
nloa
ding
(-)
L = 50 mHSLM: A9 (1 span), A10 (2 spans), A10 (3 spans)
100 150 200 250 300 350 400Speed (km/h)
0
0.5
1
Whe
el u
nloa
ding
(-)
L = 60 mHSLM: A9 (1 span), A10 (2 spans), A9 (3 spans)
100 150 200 250 300 350 400Speed (km/h)
0
0.5
1
Whe
el u
nloa
ding
(-)
L = 70 mHSLM: A10 (1 span), A9 (2 spans), A9 (3 spans)
100 150 200 250 300 350 400Speed (km/h)
0
0.5
1
Whe
el u
nloa
ding
(-)
L = 80 mHSLM: A9 (1 span), A2 (2 spans), A10 (3 spans)
1 span (no irreg)1 span (no bridge)1 span
2 spans (no irreg)2 spans (no bridge)2 spans
3 spans (no irreg)3 spans (no bridge)3 spans
Limit value

A.3. HIGHER TRACK QUALITY
85
Figure A.27: composite bridges: maximum wheel unloading from 24 profile realisations, filtered at 20 Hz.
100 150 200 250 300 350 400Speed (km/h)
0
0.2
0.4
0.6
Whe
el u
nloa
ding
(-)
, 20
Hz
L = 10 mHSLM: A6 (1 span), A7 (2 spans), A2 (3 spans)
100 150 200 250 300 350 400Speed (km/h)
0
0.2
0.4
0.6
Whe
el u
nloa
ding
(-)
, 20
Hz
L = 20 mHSLM: A1 (1 span), A3 (2 spans), A9 (3 spans)
100 150 200 250 300 350 400Speed (km/h)
0
0.2
0.4
0.6
Whe
el u
nloa
ding
(-)
, 20
Hz
L = 30 mHSLM: A1 (1 span), A6 (2 spans), A3 (3 spans)
100 150 200 250 300 350 400Speed (km/h)
0
0.2
0.4
0.6
Whe
el u
nloa
ding
(-)
, 20
Hz
L = 40 mHSLM: A2 (1 span), A3 (2 spans), A2 (3 spans)
100 150 200 250 300 350 400Speed (km/h)
0
0.2
0.4
0.6
Whe
el u
nloa
ding
(-)
, 20
Hz
L = 50 mHSLM: A9 (1 span), A10 (2 spans), A10 (3 spans)
100 150 200 250 300 350 400Speed (km/h)
0
0.2
0.4
0.6
Whe
el u
nloa
ding
(-)
, 20
Hz
L = 60 mHSLM: A9 (1 span), A10 (2 spans), A9 (3 spans)
100 150 200 250 300 350 400Speed (km/h)
0
0.2
0.4
0.6
Whe
el u
nloa
ding
(-)
, 20
Hz
L = 70 mHSLM: A10 (1 span), A9 (2 spans), A9 (3 spans)
100 150 200 250 300 350 400Speed (km/h)
0
0.2
0.4
0.6
Whe
el u
nloa
ding
(-)
, 20
Hz
L = 80 mHSLM: A9 (1 span), A2 (2 spans), A10 (3 spans)
1 span (no irreg)1 span (no bridge)1 span
2 spans (no irreg)2 spans (no bridge)2 spans
3 spans (no irreg)3 spans (no bridge)3 spans
Limit value

APPENDIX A. DOUBLE-TRACK BRIDGES
86
Figure A.28: Composite bridges: maximum car body acceleration from 24 profile realisations, unfiltered.
100 150 200 250 300 350 400Speed (km/h)
0
0.5
1
1.5
Car
bod
y ac
cele
ratio
n (m
/s2 )
L = 10 mHSLM: A6 (1 span), A7 (2 spans), A2 (3 spans)
100 150 200 250 300 350 400Speed (km/h)
0
0.5
1
1.5
Car
bod
y ac
cele
ratio
n (m
/s2 )
L = 20 mHSLM: A1 (1 span), A3 (2 spans), A9 (3 spans)
100 150 200 250 300 350 400Speed (km/h)
0
0.5
1
1.5
Car
bod
y ac
cele
rati
on (
m/s
2 )
L = 30 mHSLM: A1 (1 span), A6 (2 spans), A3 (3 spans)
100 150 200 250 300 350 400Speed (km/h)
0
0.5
1
1.5
Car
bod
y ac
cele
rati
on (
m/s
2 )
L = 40 mHSLM: A2 (1 span), A3 (2 spans), A2 (3 spans)
100 150 200 250 300 350 400Speed (km/h)
0
0.5
1
1.5
Car
bod
y ac
cele
rati
on (
m/s
2 )
L = 50 mHSLM: A9 (1 span), A10 (2 spans), A10 (3 spans)
100 150 200 250 300 350 400Speed (km/h)
0
0.5
1
1.5
Car
bod
y ac
cele
rati
on (
m/s
2 )
L = 60 mHSLM: A9 (1 span), A10 (2 spans), A9 (3 spans)
100 150 200 250 300 350 400Speed (km/h)
0
0.5
1
1.5
Car
bod
y ac
cele
rati
on (
m/s
2 )
L = 70 mHSLM: A10 (1 span), A9 (2 spans), A9 (3 spans)
100 150 200 250 300 350 400Speed (km/h)
0
0.5
1
1.5
Car
bod
y ac
cele
rati
on (
m/s
2 )
L = 80 mHSLM: A9 (1 span), A2 (2 spans), A10 (3 spans)
1 span (no irreg)1 span (no bridge)1 span
2 spans (no irreg)2 spans (no bridge)2 spans
3 spans (no irreg)3 spans (no bridge)3 spans
Limit value

A.3. HIGHER TRACK QUALITY
87
Figure A.29: Beam bridges: maximum deck acceleration from 24 profile realisations, filtered at 20 Hz.
150 200 250 300 350 400Speed (km/h)
0
5
10
Bri
dge
acce
lera
tion
(m
/s2 )
L = 10 mHSLM: A7 (1 span), A9 (2 spans), A9 (3 spans)
150 200 250 300 350 400Speed (km/h)
0
5
10
Bri
dge
acce
lera
tion
(m
/s2 )
L = 20 mHSLM: A1 (1 span), A1 (2 spans), A1 (3 spans)
150 200 250 300 350 400Speed (km/h)
0
5
10
Bri
dge
acce
lera
tion
(m
/s2 )
L = 30 mHSLM: A7 (1 span), A9 (2 spans), A4 (3 spans)
150 200 250 300 350 400Speed (km/h)
0
5
10
Bri
dge
acce
lera
tion
(m
/s2 )
L = 40 mHSLM: A9 (1 span), A9 (2 spans), A9 (3 spans)
150 200 250 300 350 400Speed (km/h)
0
5
10
Bri
dge
acce
lera
tion
(m
/s2 )
L = 50 mHSLM: A9 (1 span), A9 (2 spans), A10 (3 spans)
150 200 250 300 350 400Speed (km/h)
0
5
10
Bri
dge
acce
lera
tion
(m
/s2 )
L = 60 mHSLM: A10 (1 span), A9 (2 spans), A10 (3 spans)
150 200 250 300 350 400Speed (km/h)
0
5
10
Bri
dge
acce
lera
tion
(m
/s2 )
L = 70 mHSLM: A10 (1 span), A10 (2 spans), A9 (3 spans)
150 200 250 300 350 400Speed (km/h)
0
5
10
Bri
dge
acce
lera
tion
(m
/s2 )
L = 80 mHSLM: A9 (1 span), A9 (2 spans), A9 (3 spans)
1 span 2 spans 3 spans Limit value

APPENDIX A. DOUBLE-TRACK BRIDGES
88
Figure A.30: Beam bridges: maximum deck displacement from 24 profile realisations, filtered at 20 Hz.
100 150 200 250 300 350 400Speed (km/h)
0
50
100
Bri
dge
disp
lace
men
t (m
m)
L = 10 mHSLM: A7 (1 span), A9 (2 spans), A9 (3 spans)
100 150 200 250 300 350 400Speed (km/h)
0
50
100
Bri
dge
disp
lace
men
t (m
m)
L = 20 mHSLM: A1 (1 span), A1 (2 spans), A1 (3 spans)
100 150 200 250 300 350 400Speed (km/h)
0
50
100
Bri
dge
disp
lace
men
t (m
m)
L = 30 mHSLM: A7 (1 span), A9 (2 spans), A4 (3 spans)
100 150 200 250 300 350 400Speed (km/h)
0
50
100
Bri
dge
disp
lace
men
t (m
m)
L = 40 mHSLM: A9 (1 span), A9 (2 spans), A9 (3 spans)
100 150 200 250 300 350 400Speed (km/h)
0
50
100
Bri
dge
disp
lace
men
t (m
m)
L = 50 mHSLM: A9 (1 span), A9 (2 spans), A10 (3 spans)
100 150 200 250 300 350 400Speed (km/h)
0
50
100
Bri
dge
disp
lace
men
t (m
m)
L = 60 mHSLM: A10 (1 span), A9 (2 spans), A10 (3 spans)
100 150 200 250 300 350 400Speed (km/h)
0
50
100
Bri
dge
disp
lace
men
t (m
m)
L = 70 mHSLM: A10 (1 span), A10 (2 spans), A9 (3 spans)
100 150 200 250 300 350 400Speed (km/h)
0
50
100
Bri
dge
disp
lace
men
t (m
m)
L = 80 mHSLM: A9 (1 span), A9 (2 spans), A9 (3 spans)
1 spanLimit value
2 spansLimit value
3 spansLimit value

A.3. HIGHER TRACK QUALITY
89
Figure A.31: Beam bridges: maximum wheel unloading from 24 profile realisations, unfiltered.
100 150 200 250 300 350 400Speed (km/h)
0
0.5
1
Whe
el u
nloa
ding
(-)
L = 10 mHSLM: A7 (1 span), A9 (2 spans), A9 (3 spans)
100 150 200 250 300 350 400Speed (km/h)
0
0.5
1
Whe
el u
nloa
ding
(-)
L = 20 mHSLM: A1 (1 span), A1 (2 spans), A1 (3 spans)
100 150 200 250 300 350 400Speed (km/h)
0
0.5
1
Whe
el u
nloa
ding
(-)
L = 30 mHSLM: A7 (1 span), A9 (2 spans), A4 (3 spans)
100 150 200 250 300 350 400Speed (km/h)
0
0.5
1
Whe
el u
nloa
ding
(-)
L = 40 mHSLM: A9 (1 span), A9 (2 spans), A9 (3 spans)
100 150 200 250 300 350 400Speed (km/h)
0
0.5
1
Whe
el u
nloa
ding
(-)
L = 50 mHSLM: A9 (1 span), A9 (2 spans), A10 (3 spans)
100 150 200 250 300 350 400Speed (km/h)
0
0.5
1
Whe
el u
nloa
ding
(-)
L = 60 mHSLM: A10 (1 span), A9 (2 spans), A10 (3 spans)
100 150 200 250 300 350 400Speed (km/h)
0
0.5
1
Whe
el u
nloa
ding
(-)
L = 70 mHSLM: A10 (1 span), A10 (2 spans), A9 (3 spans)
100 150 200 250 300 350 400Speed (km/h)
0
0.5
1
Whe
el u
nloa
ding
(-)
L = 80 mHSLM: A9 (1 span), A9 (2 spans), A9 (3 spans)
1 span (no irreg)1 span (no bridge)1 span
2 spans (no irreg)2 spans (no bridge)2 spans
3 spans (no irreg)3 spans (no bridge)3 spans
Limit value

APPENDIX A. DOUBLE-TRACK BRIDGES
90
Figure A.32: Beam bridges: maximum wheel unloading from 24 profile realisations, filtered at 20 Hz.
100 150 200 250 300 350 400Speed (km/h)
0
0.2
0.4
0.6
Whe
el u
nloa
ding
(-)
, 20
Hz
L = 10 mHSLM: A7 (1 span), A9 (2 spans), A9 (3 spans)
100 150 200 250 300 350 400Speed (km/h)
0
0.2
0.4
0.6
Whe
el u
nloa
ding
(-)
, 20
Hz
L = 20 mHSLM: A1 (1 span), A1 (2 spans), A1 (3 spans)
100 150 200 250 300 350 400Speed (km/h)
0
0.2
0.4
0.6
Whe
el u
nloa
ding
(-)
, 20
Hz
L = 30 mHSLM: A7 (1 span), A9 (2 spans), A4 (3 spans)
100 150 200 250 300 350 400Speed (km/h)
0
0.2
0.4
0.6
Whe
el u
nloa
ding
(-)
, 20
Hz
L = 40 mHSLM: A9 (1 span), A9 (2 spans), A9 (3 spans)
100 150 200 250 300 350 400Speed (km/h)
0
0.2
0.4
0.6
Whe
el u
nloa
ding
(-)
, 20
Hz
L = 50 mHSLM: A9 (1 span), A9 (2 spans), A10 (3 spans)
100 150 200 250 300 350 400Speed (km/h)
0
0.2
0.4
0.6
Whe
el u
nloa
ding
(-)
, 20
Hz
L = 60 mHSLM: A10 (1 span), A9 (2 spans), A10 (3 spans)
100 150 200 250 300 350 400Speed (km/h)
0
0.2
0.4
0.6
Whe
el u
nloa
ding
(-)
, 20
Hz
L = 70 mHSLM: A10 (1 span), A10 (2 spans), A9 (3 spans)
100 150 200 250 300 350 400Speed (km/h)
0
0.2
0.4
0.6
Whe
el u
nloa
ding
(-)
, 20
Hz
L = 80 mHSLM: A9 (1 span), A9 (2 spans), A9 (3 spans)
1 span (no irreg)1 span (no bridge)1 span
2 spans (no irreg)2 spans (no bridge)2 spans
3 spans (no irreg)3 spans (no bridge)3 spans
Limit value

A.3. HIGHER TRACK QUALITY
91
Figure A.33: Beam bridges: maximum car body acceleration from 24 profile realisations, unfiltered.
100 150 200 250 300 350 400Speed (km/h)
0
0.5
1
1.5
Car
bod
y ac
cele
ratio
n (m
/s2 )
L = 10 mHSLM: A7 (1 span), A9 (2 spans), A9 (3 spans)
100 150 200 250 300 350 400Speed (km/h)
0
0.5
1
1.5
Car
bod
y ac
cele
ratio
n (m
/s2 )
L = 20 mHSLM: A1 (1 span), A1 (2 spans), A1 (3 spans)
100 150 200 250 300 350 400Speed (km/h)
0
0.5
1
1.5
Car
bod
y ac
cele
rati
on (
m/s
2 )
L = 30 mHSLM: A7 (1 span), A9 (2 spans), A4 (3 spans)
100 150 200 250 300 350 400Speed (km/h)
0
0.5
1
1.5
Car
bod
y ac
cele
rati
on (
m/s
2 )
L = 40 mHSLM: A9 (1 span), A9 (2 spans), A9 (3 spans)
100 150 200 250 300 350 400Speed (km/h)
0
0.5
1
1.5
Car
bod
y ac
cele
rati
on (
m/s
2 )
L = 50 mHSLM: A9 (1 span), A9 (2 spans), A10 (3 spans)
100 150 200 250 300 350 400Speed (km/h)
0
0.5
1
1.5
Car
bod
y ac
cele
rati
on (
m/s
2 )
L = 60 mHSLM: A10 (1 span), A9 (2 spans), A10 (3 spans)
100 150 200 250 300 350 400Speed (km/h)
0
0.5
1
1.5
Car
bod
y ac
cele
rati
on (
m/s
2 )
L = 70 mHSLM: A10 (1 span), A10 (2 spans), A9 (3 spans)
100 150 200 250 300 350 400Speed (km/h)
0
0.5
1
1.5
Car
bod
y ac
cele
rati
on (
m/s
2 )
L = 80 mHSLM: A9 (1 span), A9 (2 spans), A9 (3 spans)
1 span (no irreg)1 span (no bridge)1 span
2 spans (no irreg)2 spans (no bridge)2 spans
3 spans (no irreg)3 spans (no bridge)3 spans
Limit value

APPENDIX A. DOUBLE-TRACK BRIDGES
92
A.4 Rail pad stiffness
Additional results from the variation in rail pad stiffness in Section 3.2.6 are presented in Figure A.34.
Figure A.34: 15 m (HSLM A8) and 20 m (HSLM A1) single span slab bridges: maximum bridge acceleration, bridge displacement and car body acceleration for the lower track quality (24 profile realisations).
Bri
dge
acce
lera
tion
(m
/s2 )
Bri
dge
acce
lera
tion
(m
/s2 )
Bri
dge
disp
lace
men
t (m
m)
Bri
dge
disp
lace
men
t (m
m)
Car
bod
y ac
cele
rati
on (
m/s
2 )
Car
bod
y ac
cele
rati
on (
m/s
2 )

B.1. INPUT PARAMETERS
93
B Single-track bridges
Section B.1 gives input parameters for the single-track bridges. Section B.2 and B.3 give the full results for the lower and higher track quality, respectively. Bridge and vehicle results against speed are shown for slab, composite and beam bridges in 1 –3 spans. The figures also show which HSLM train that is critical for each bridge. Results for a smooth track profile are given as reference. Also, the vehicle response from running on a plain track section is shown in the figures.
B.1 Input parameters
The input parameters used in the analyses are presented in Table B.1 and Figure B.1.
Appendix

Appendix B. SINGLE-TRACK BRIDGES
94
Table B.1: Mass and stiffness for single-track bridges.
Slab bridges 1 span 2 spans 3 spans
L (m) m (tonne/m) EI (GNm2) m (tonne/m) EI (GNm2) m (tonne/m) EI (GNm2) 10 15.39 12.47 14.89 11.21 13.17 7.536 15 21.23 35.96 20.96 34.51 16.08 14.42 20 25.45 65.07 24.04 54.03 19.95 29.32 25 33.08 151.6 24.26 55.67 20.86 33.96 30 36.68 210.7 24.73 59.25 24.63 58.47 Composite bridges 1 span 2 spans 3 spans
L (m) m (tonne/m) EI (GNm2) m (tonne/m) EI (GNm2) m (tonne/m) EI (GNm2) 10 12.86 27.02 12.62 10.61 12.53 7.449 20 13.47 140.6 13.41 124.1 13.11 61.12 30 13.89 290.2 13.55 163.3 13.28 94.31 40 14.37 541.0 13.82 259.4 13.52 154.9 50 14.71 769.9 13.84 267.9 13.86 274.4 60 13.83 264.3 13.62 186.4 13.49 148.0 70 14.11 390.3 13.88 284.9 13.69 211.1 80 14.42 567.3 14.10 386.6 13.92 300.7 Beam bridges 1 span 2 spans 3 spans
L (m) m (tonne/m) EI (GNm2) m (tonne/m) EI (GNm2) m (tonne/m) EI (GNm2) 10 13.00 10.86 12.89 10.41 11.83 6.854 20 17.86 48.42 17.21 41.09 15.21 23.29 30 24.00 162.2 19.91 76.98 19.29 67.50 40 20.41 85.29 19.67 73.20 20.43 85.62 50 24.15 166.2 23.66 153.4 21.75 110.2 60 28.46 306.1 26.77 244.7 25.15 193.8 70 32.87 511.3 31.75 453.1 28.39 303.3 80 34.54 607.7 34.23 589.0 29.79 361.0

B.1. INPUT PARAMETERS
95
Figure B.1: Bridge properties and moving force model results for deck acceleration and displacement at the design limits. EN 1991-2 recommended frequency range and limits for acceleration and displacement are included.
n 0 (H
z)
n 0 (H
z)
n 0 (H
z)
t slab
(m
)m
(to
n/m
)A
ccel
erat
ion
(m/s
2 )D
ispl
acem
ent (
mm
)
h box (
m)
m (
ton/
m)
Acc
eler
atio
n (m
/s2 )
Dis
plac
emen
t (m
m)
h beam
(m
)m
(to
n/m
)A
ccel
erat
ion
(m/s
2 )D
ispl
acem
ent (
mm
)

Appendix B. SINGLE-TRACK BRIDGES
96
B.2 Lower track quality
Figure B.2: Slab bridges: maximum deck acceleration from 24 profile realisations, filtered at 20 Hz.
150 200 250 300 350 400Speed (km/h)
0
2
4
6
8
10
Bri
dge
acce
lera
tion
(m/s
2 )
L = 10 mHSLM: A6 (1 span), A7 (2 spans), A2 (3 spans)
150 200 250 300 350 400Speed (km/h)
0
2
4
6
8
10
Bri
dge
acce
lera
tion
(m/s
2 )
L = 15 mHSLM: A7 (1 span), A7 (2 spans), A9 (3 spans)
150 200 250 300 350 400Speed (km/h)
0
2
4
6
8
10
Bri
dge
acce
lera
tion
(m/s
2 )
L = 20 mHSLM: A1 (1 span), A1 (2 spans), A1 (3 spans)
150 200 250 300 350 400Speed (km/h)
0
2
4
6
8
10
Bri
dge
acce
lera
tion
(m/s
2 )
L = 25 mHSLM: A3 (1 span), A3 (2 spans), A10 (3 spans)
150 200 250 300 350 400Speed (km/h)
0
2
4
6
8
10
Bri
dge
acce
lera
tion
(m/s
2 )
L = 30 mHSLM: A9 (1 span), A9 (2 spans), A4 (3 spans)
1 span 2 spans 3 spans Limit value

B.2. LOWER TRACK QUALITY
97
Figure B.3: Slab bridges: maximum deck displacement from 24 profile realisations, filtered at 20 Hz.
100 150 200 250 300 350 400Speed (km/h)
0
10
20
30
40
50
Bri
dge
disp
lace
men
t (m
m)
L = 10 mHSLM: A6 (1 span), A7 (2 spans), A2 (3 spans)
100 150 200 250 300 350 400Speed (km/h)
0
10
20
30
40
50
Bri
dge
disp
lace
men
t (m
m)
L = 15 mHSLM: A7 (1 span), A7 (2 spans), A9 (3 spans)
100 150 200 250 300 350 400Speed (km/h)
0
10
20
30
40
50
Bri
dge
disp
lace
men
t (m
m)
L = 20 mHSLM: A1 (1 span), A1 (2 spans), A1 (3 spans)
100 150 200 250 300 350 400Speed (km/h)
0
10
20
30
40
50B
ridg
e di
spla
cem
ent (
mm
)
L = 25 mHSLM: A3 (1 span), A3 (2 spans), A10 (3 spans)
100 150 200 250 300 350 400Speed (km/h)
0
10
20
30
40
50
Bri
dge
disp
lace
men
t (m
m)
L = 30 mHSLM: A9 (1 span), A9 (2 spans), A4 (3 spans)
1 spanLimit value
2 spansLimit value
3 spansLimit value

Appendix B. SINGLE-TRACK BRIDGES
98
Figure B.4: Slab bridges: maximum wheel unloading from 24 profile realisations, unfiltered.
100 150 200 250 300 350 400Speed (km/h)
0
0.2
0.4
0.6
0.8
1
Whe
el u
nloa
ding
(-)
L = 10 mHSLM: A6 (1 span), A7 (2 spans), A2 (3 spans)
100 150 200 250 300 350 400Speed (km/h)
0
0.2
0.4
0.6
0.8
1
Whe
el u
nloa
ding
(-)
L = 15 mHSLM: A7 (1 span), A7 (2 spans), A9 (3 spans)
100 150 200 250 300 350 400Speed (km/h)
0
0.2
0.4
0.6
0.8
1
Whe
el u
nloa
ding
(-)
L = 20 mHSLM: A1 (1 span), A1 (2 spans), A1 (3 spans)
100 150 200 250 300 350 400Speed (km/h)
0
0.2
0.4
0.6
0.8
1W
heel
unl
oadi
ng (
-)
L = 25 mHSLM: A3 (1 span), A3 (2 spans), A10 (3 spans)
100 150 200 250 300 350 400Speed (km/h)
0
0.2
0.4
0.6
0.8
1
Whe
el u
nloa
ding
(-)
L = 30 mHSLM: A9 (1 span), A9 (2 spans), A4 (3 spans)
1 span (no irreg)1 span (no bridge)1 span
2 spans (no irreg)2 spans (no bridge)2 spans
3 spans (no irreg)3 spans (no bridge)3 spans
Limit value

B.2. LOWER TRACK QUALITY
99
Figure B.5: Slab bridges: maximum wheel unloading from 24 profile realisations, filtered at 20 Hz.
100 150 200 250 300 350 400Speed (km/h)
0
0.1
0.2
0.3
0.4
0.5
0.6
Whe
el u
nloa
ding
(-)
, 20
Hz
L = 10 mHSLM: A6 (1 span), A7 (2 spans), A2 (3 spans)
100 150 200 250 300 350 400Speed (km/h)
0
0.1
0.2
0.3
0.4
0.5
0.6
Whe
el u
nloa
ding
(-)
, 20
Hz
L = 15 mHSLM: A7 (1 span), A7 (2 spans), A9 (3 spans)
100 150 200 250 300 350 400Speed (km/h)
0
0.1
0.2
0.3
0.4
0.5
0.6
Whe
el u
nloa
ding
(-)
, 20
Hz
L = 20 mHSLM: A1 (1 span), A1 (2 spans), A1 (3 spans)
100 150 200 250 300 350 400Speed (km/h)
0
0.1
0.2
0.3
0.4
0.5
0.6
Whe
el u
nloa
ding
(-)
, 20
Hz
L = 25 mHSLM: A3 (1 span), A3 (2 spans), A10 (3 spans)
100 150 200 250 300 350 400Speed (km/h)
0
0.1
0.2
0.3
0.4
0.5
0.6
Whe
el u
nloa
ding
(-)
, 20
Hz
L = 30 mHSLM: A9 (1 span), A9 (2 spans), A4 (3 spans)
1 span (no irreg)1 span (no bridge)1 span
2 spans (no irreg)2 spans (no bridge)2 spans
3 spans (no irreg)3 spans (no bridge)3 spans
Limit value

Appendix B. SINGLE-TRACK BRIDGES
100
Figure B.6: Slab bridges: maximum duration of contact loss from 24 profile realisations, unfiltered.
150 200 250 300 350 400Speed (km/h)
0
5
10
15
Con
tact
loss
(m
s)L = 10 m
HSLM: A6 (1 span), A7 (2 spans), A2 (3 spans)
150 200 250 300 350 400Speed (km/h)
0
5
10
15
Con
tact
loss
(m
s)
L = 15 mHSLM: A7 (1 span), A7 (2 spans), A9 (3 spans)
150 200 250 300 350 400Speed (km/h)
0
5
10
15
Con
tact
loss
(m
s)
L = 20 mHSLM: A1 (1 span), A1 (2 spans), A1 (3 spans)
150 200 250 300 350 400Speed (km/h)
0
5
10
15C
onta
ct lo
ss (
ms)
L = 25 mHSLM: A3 (1 span), A3 (2 spans), A10 (3 spans)
150 200 250 300 350 400Speed (km/h)
0
5
10
15
Con
tact
loss
(m
s)
L = 30 mHSLM: A9 (1 span), A9 (2 spans), A4 (3 spans)
1 span (no bridge)1 span
2 spans (no bridge)2 spans
3 spans (no bridge)3 spans
Limit value

B.2. LOWER TRACK QUALITY
101
Figure B.7: Slab bridges: maximum car body acceleration from 24 profile realisations, unfiltered.
100 150 200 250 300 350 400Speed (km/h)
0
0.5
1
1.5
L = 10 mHSLM: A6 (1 span), A7 (2 spans), A2 (3 spans)
100 150 200 250 300 350 400Speed (km/h)
0
0.5
1
1.5
L = 15 mHSLM: A7 (1 span), A7 (2 spans), A9 (3 spans)
100 150 200 250 300 350 400Speed (km/h)
0
0.5
1
1.5
L = 20 mHSLM: A1 (1 span), A1 (2 spans), A1 (3 spans)
100 150 200 250 300 350 400Speed (km/h)
0
0.5
1
1.5
L = 25 mHSLM: A3 (1 span), A3 (2 spans), A10 (3 spans)
100 150 200 250 300 350 400Speed (km/h)
0
0.5
1
1.5
L = 30 mHSLM: A9 (1 span), A9 (2 spans), A4 (3 spans)
1 span (no irreg)1 span (no bridge)1 span
2 spans (no irreg)2 spans (no bridge)2 spans
3 spans (no irreg)3 spans (no bridge)3 spans
Limit value

Appendix B. SINGLE-TRACK BRIDGES
102
Figure B.8: Composite bridges: maximum deck acceleration from 24 profile realisations, filtered at 20 Hz.
150 200 250 300 350 400Speed (km/h)
0
2
4
6
Bri
dge
acce
lera
tion
(m
/s2 )
L = 10 mHSLM: A2 (1 span), A5 (2 spans), A3 (3 spans)
150 200 250 300 350 400Speed (km/h)
0
2
4
6
Bri
dge
acce
lera
tion
(m
/s2 )
L = 20 mHSLM: A3 (1 span), A1 (2 spans), A3 (3 spans)
150 200 250 300 350 400Speed (km/h)
0
2
4
6
Bri
dge
acce
lera
tion
(m
/s2 )
L = 30 mHSLM: A10 (1 span), A1 (2 spans), A7 (3 spans)
150 200 250 300 350 400Speed (km/h)
0
2
4
6
Bri
dge
acce
lera
tion
(m
/s2 )
L = 40 mHSLM: A1 (1 span), A6 (2 spans), A9 (3 spans)
150 200 250 300 350 400Speed (km/h)
0
2
4
6
Bri
dge
acce
lera
tion
(m
/s2 )
L = 50 mHSLM: A7 (1 span), A8 (2 spans), A3 (3 spans)
150 200 250 300 350 400Speed (km/h)
0
2
4
6
Bri
dge
acce
lera
tion
(m
/s2 )
L = 60 mHSLM: A9 (1 span), A9 (2 spans), A9 (3 spans)
150 200 250 300 350 400Speed (km/h)
0
2
4
6
Bri
dge
acce
lera
tion
(m
/s2 )
L = 70 mHSLM: A10 (1 span), A2 (2 spans), A10 (3 spans)
150 200 250 300 350 400Speed (km/h)
0
2
4
6
Bri
dge
acce
lera
tion
(m
/s2 )
L = 80 mHSLM: A10 (1 span), A9 (2 spans), A10 (3 spans)
1 span 2 spans 3 spans Limit value

B.2. LOWER TRACK QUALITY
103
Figure B.9: Composite bridges: maximum deck displacement from 24 profile realisations, filtered at 20 Hz.
100 150 200 250 300 350 400Speed (km/h)
0
50
100
Bri
dge
disp
lace
men
t (m
m)
L = 10 mHSLM: A2 (1 span), A5 (2 spans), A3 (3 spans)
100 150 200 250 300 350 400Speed (km/h)
0
50
100
Bri
dge
disp
lace
men
t (m
m)
L = 20 mHSLM: A3 (1 span), A1 (2 spans), A3 (3 spans)
100 150 200 250 300 350 400Speed (km/h)
0
50
100
Bri
dge
disp
lace
men
t (m
m)
L = 30 mHSLM: A10 (1 span), A1 (2 spans), A7 (3 spans)
100 150 200 250 300 350 400Speed (km/h)
0
50
100
Bri
dge
disp
lace
men
t (m
m)
L = 40 mHSLM: A1 (1 span), A6 (2 spans), A9 (3 spans)
100 150 200 250 300 350 400Speed (km/h)
0
50
100
Bri
dge
disp
lace
men
t (m
m)
L = 50 mHSLM: A7 (1 span), A8 (2 spans), A3 (3 spans)
100 150 200 250 300 350 400Speed (km/h)
0
50
100
Bri
dge
disp
lace
men
t (m
m)
L = 60 mHSLM: A9 (1 span), A9 (2 spans), A9 (3 spans)
100 150 200 250 300 350 400Speed (km/h)
0
50
100
Bri
dge
disp
lace
men
t (m
m)
L = 70 mHSLM: A10 (1 span), A2 (2 spans), A10 (3 spans)
100 150 200 250 300 350 400Speed (km/h)
0
50
100
Bri
dge
disp
lace
men
t (m
m)
L = 80 mHSLM: A10 (1 span), A9 (2 spans), A10 (3 spans)
1 spanLimit value
2 spansLimit value
3 spansLimit value

Appendix B. SINGLE-TRACK BRIDGES
104
Figure B.10: Composite bridges: maximum wheel unloading from 24 profile realisations, unfiltered.
100 150 200 250 300 350 400Speed (km/h)
0
0.5
1
Whe
el u
nloa
ding
(-)
L = 10 mHSLM: A2 (1 span), A5 (2 spans), A3 (3 spans)
100 150 200 250 300 350 400Speed (km/h)
0
0.5
1
Whe
el u
nloa
ding
(-)
L = 20 mHSLM: A3 (1 span), A1 (2 spans), A3 (3 spans)
100 150 200 250 300 350 400Speed (km/h)
0
0.5
1
Whe
el u
nloa
ding
(-)
L = 30 mHSLM: A10 (1 span), A1 (2 spans), A7 (3 spans)
100 150 200 250 300 350 400Speed (km/h)
0
0.5
1
Whe
el u
nloa
ding
(-)
L = 40 mHSLM: A1 (1 span), A6 (2 spans), A9 (3 spans)
100 150 200 250 300 350 400Speed (km/h)
0
0.5
1
Whe
el u
nloa
ding
(-)
L = 50 mHSLM: A7 (1 span), A8 (2 spans), A3 (3 spans)
100 150 200 250 300 350 400Speed (km/h)
0
0.5
1
Whe
el u
nloa
ding
(-)
L = 60 mHSLM: A9 (1 span), A9 (2 spans), A9 (3 spans)
100 150 200 250 300 350 400Speed (km/h)
0
0.5
1
Whe
el u
nloa
ding
(-)
L = 70 mHSLM: A10 (1 span), A2 (2 spans), A10 (3 spans)
100 150 200 250 300 350 400Speed (km/h)
0
0.5
1
Whe
el u
nloa
ding
(-)
L = 80 mHSLM: A10 (1 span), A9 (2 spans), A10 (3 spans)
1 span (no irreg)1 span (no bridge)1 span
2 spans (no irreg)2 spans (no bridge)2 spans
3 spans (no irreg)3 spans (no bridge)3 spans
Limit value

B.2. LOWER TRACK QUALITY
105
Figure B.11: Composite bridges: maximum wheel unloading from 24 profile realisations, filtered at 20 Hz.
100 150 200 250 300 350 400Speed (km/h)
0
0.2
0.4
0.6
Whe
el u
nloa
ding
(-)
, 20
Hz
L = 10 mHSLM: A2 (1 span), A5 (2 spans), A3 (3 spans)
100 150 200 250 300 350 400Speed (km/h)
0
0.2
0.4
0.6
Whe
el u
nloa
ding
(-)
, 20
Hz
L = 20 mHSLM: A3 (1 span), A1 (2 spans), A3 (3 spans)
100 150 200 250 300 350 400Speed (km/h)
0
0.2
0.4
0.6
Whe
el u
nloa
ding
(-)
, 20
Hz
L = 30 mHSLM: A10 (1 span), A1 (2 spans), A7 (3 spans)
100 150 200 250 300 350 400Speed (km/h)
0
0.2
0.4
0.6
Whe
el u
nloa
ding
(-)
, 20
Hz
L = 40 mHSLM: A1 (1 span), A6 (2 spans), A9 (3 spans)
100 150 200 250 300 350 400Speed (km/h)
0
0.2
0.4
0.6
Whe
el u
nloa
ding
(-)
, 20
Hz
L = 50 mHSLM: A7 (1 span), A8 (2 spans), A3 (3 spans)
100 150 200 250 300 350 400Speed (km/h)
0
0.2
0.4
0.6
Whe
el u
nloa
ding
(-)
, 20
Hz
L = 60 mHSLM: A9 (1 span), A9 (2 spans), A9 (3 spans)
100 150 200 250 300 350 400Speed (km/h)
0
0.2
0.4
0.6
Whe
el u
nloa
ding
(-)
, 20
Hz
L = 70 mHSLM: A10 (1 span), A2 (2 spans), A10 (3 spans)
100 150 200 250 300 350 400Speed (km/h)
0
0.2
0.4
0.6
Whe
el u
nloa
ding
(-)
, 20
Hz
L = 80 mHSLM: A10 (1 span), A9 (2 spans), A10 (3 spans)
1 span (no irreg)1 span (no bridge)1 span
2 spans (no irreg)2 spans (no bridge)2 spans
3 spans (no irreg)3 spans (no bridge)3 spans
Limit value

Appendix B. SINGLE-TRACK BRIDGES
106
Figure B.12: Composite bridges: maximum duration of contact loss from 24 profile realisations, unfiltered.
150 200 250 300 350 400Speed (km/h)
0
5
10
15
Con
tact
loss
(m
s)L = 10 m
HSLM: A2 (1 span), A5 (2 spans), A3 (3 spans)
150 200 250 300 350 400Speed (km/h)
0
5
10
15
Con
tact
loss
(m
s)
L = 20 mHSLM: A3 (1 span), A1 (2 spans), A3 (3 spans)
150 200 250 300 350 400Speed (km/h)
0
5
10
15
Con
tact
loss
(m
s)
L = 30 mHSLM: A10 (1 span), A1 (2 spans), A7 (3 spans)
150 200 250 300 350 400Speed (km/h)
0
5
10
15
Con
tact
loss
(m
s)
L = 40 mHSLM: A1 (1 span), A6 (2 spans), A9 (3 spans)
150 200 250 300 350 400Speed (km/h)
0
5
10
15
Con
tact
loss
(m
s)
L = 50 mHSLM: A7 (1 span), A8 (2 spans), A3 (3 spans)
150 200 250 300 350 400Speed (km/h)
0
5
10
15
Con
tact
loss
(m
s)
L = 60 mHSLM: A9 (1 span), A9 (2 spans), A9 (3 spans)
150 200 250 300 350 400Speed (km/h)
0
5
10
15
Con
tact
loss
(m
s)
L = 70 mHSLM: A10 (1 span), A2 (2 spans), A10 (3 spans)
150 200 250 300 350 400Speed (km/h)
0
5
10
15
Con
tact
loss
(m
s)
L = 80 mHSLM: A10 (1 span), A9 (2 spans), A10 (3 spans)
1 span (no bridge)1 span
2 spans (no bridge)2 spans
3 spans (no bridge)3 spans
Limit value

B.2. LOWER TRACK QUALITY
107
Figure B.13: Composite bridges: maximum car body acceleration from 24 profile realisations, unfiltered.
100 150 200 250 300 350 400Speed (km/h)
0
0.5
1
1.5
2
Car
bod
y ac
cele
ratio
n (m
/s2 )
L = 10 mHSLM: A2 (1 span), A5 (2 spans), A3 (3 spans)
100 150 200 250 300 350 400Speed (km/h)
0
0.5
1
1.5
2
Car
bod
y ac
cele
ratio
n (m
/s2 )
L = 20 mHSLM: A3 (1 span), A1 (2 spans), A3 (3 spans)
100 150 200 250 300 350 400Speed (km/h)
0
0.5
1
1.5
2
Car
bod
y ac
cele
rati
on (
m/s
2 )
L = 30 mHSLM: A10 (1 span), A1 (2 spans), A7 (3 spans)
100 150 200 250 300 350 400Speed (km/h)
0
0.5
1
1.5
2
Car
bod
y ac
cele
rati
on (
m/s
2 )
L = 40 mHSLM: A1 (1 span), A6 (2 spans), A9 (3 spans)
100 150 200 250 300 350 400Speed (km/h)
0
0.5
1
1.5
2
Car
bod
y ac
cele
rati
on (
m/s
2 )
L = 50 mHSLM: A7 (1 span), A8 (2 spans), A3 (3 spans)
100 150 200 250 300 350 400Speed (km/h)
0
0.5
1
1.5
2
Car
bod
y ac
cele
rati
on (
m/s
2 )
L = 60 mHSLM: A9 (1 span), A9 (2 spans), A9 (3 spans)
100 150 200 250 300 350 400Speed (km/h)
0
0.5
1
1.5
2
Car
bod
y ac
cele
rati
on (
m/s
2 )
L = 70 mHSLM: A10 (1 span), A2 (2 spans), A10 (3 spans)
100 150 200 250 300 350 400Speed (km/h)
0
0.5
1
1.5
2
Car
bod
y ac
cele
rati
on (
m/s
2 )
L = 80 mHSLM: A10 (1 span), A9 (2 spans), A10 (3 spans)
1 span (no irreg)1 span (no bridge)1 span
2 spans (no irreg)2 spans (no bridge)2 spans
3 spans (no irreg)3 spans (no bridge)3 spans
Limit value

Appendix B. SINGLE-TRACK BRIDGES
108
Figure B.14: Beam bridges: maximum deck acceleration from 24 profile realisations, filtered at 20 Hz.
150 200 250 300 350 400Speed (km/h)
0
2
4
6
8
Bri
dge
acce
lera
tion
(m
/s2 )
L = 10 mHSLM: A6 (1 span), A6 (2 spans), A2 (3 spans)
150 200 250 300 350 400Speed (km/h)
0
2
4
6
8
Bri
dge
acce
lera
tion
(m
/s2 )
L = 20 mHSLM: A1 (1 span), A1 (2 spans), A1 (3 spans)
150 200 250 300 350 400Speed (km/h)
0
2
4
6
8
Bri
dge
acce
lera
tion
(m
/s2 )
L = 30 mHSLM: A7 (1 span), A9 (2 spans), A9 (3 spans)
150 200 250 300 350 400Speed (km/h)
0
2
4
6
8
Bri
dge
acce
lera
tion
(m
/s2 )
L = 40 mHSLM: A3 (1 span), A9 (2 spans), A10 (3 spans)
150 200 250 300 350 400Speed (km/h)
0
2
4
6
8
Bri
dge
acce
lera
tion
(m
/s2 )
L = 50 mHSLM: A10 (1 span), A9 (2 spans), A10 (3 spans)
150 200 250 300 350 400Speed (km/h)
0
2
4
6
8
Bri
dge
acce
lera
tion
(m
/s2 )
L = 60 mHSLM: A10 (1 span), A9 (2 spans), A10 (3 spans)
150 200 250 300 350 400Speed (km/h)
0
2
4
6
8
Bri
dge
acce
lera
tion
(m
/s2 )
L = 70 mHSLM: A9 (1 span), A10 (2 spans), A9 (3 spans)
150 200 250 300 350 400Speed (km/h)
0
2
4
6
8
Bri
dge
acce
lera
tion
(m
/s2 )
L = 80 mHSLM: A9 (1 span), A9 (2 spans), A2 (3 spans)
1 span 2 spans 3 spans Limit value

B.2. LOWER TRACK QUALITY
109
Figure B.15: Beam bridges: maximum deck displacement from 24 profile realisations, filtered at 20 Hz.
100 150 200 250 300 350 400Speed (km/h)
0
50
100
Bri
dge
disp
lace
men
t (m
m)
L = 10 mHSLM: A6 (1 span), A6 (2 spans), A2 (3 spans)
100 150 200 250 300 350 400Speed (km/h)
0
50
100
Bri
dge
disp
lace
men
t (m
m)
L = 20 mHSLM: A1 (1 span), A1 (2 spans), A1 (3 spans)
100 150 200 250 300 350 400Speed (km/h)
0
50
100
Bri
dge
disp
lace
men
t (m
m)
L = 30 mHSLM: A7 (1 span), A9 (2 spans), A9 (3 spans)
100 150 200 250 300 350 400Speed (km/h)
0
50
100
Bri
dge
disp
lace
men
t (m
m)
L = 40 mHSLM: A3 (1 span), A9 (2 spans), A10 (3 spans)
100 150 200 250 300 350 400Speed (km/h)
0
50
100
Bri
dge
disp
lace
men
t (m
m)
L = 50 mHSLM: A10 (1 span), A9 (2 spans), A10 (3 spans)
100 150 200 250 300 350 400Speed (km/h)
0
50
100
Bri
dge
disp
lace
men
t (m
m)
L = 60 mHSLM: A10 (1 span), A9 (2 spans), A10 (3 spans)
100 150 200 250 300 350 400Speed (km/h)
0
50
100
Bri
dge
disp
lace
men
t (m
m)
L = 70 mHSLM: A9 (1 span), A10 (2 spans), A9 (3 spans)
100 150 200 250 300 350 400Speed (km/h)
0
50
100
Bri
dge
disp
lace
men
t (m
m)
L = 80 mHSLM: A9 (1 span), A9 (2 spans), A2 (3 spans)
1 spanLimit value
2 spansLimit value
3 spansLimit value

Appendix B. SINGLE-TRACK BRIDGES
110
Figure B.16: Beam bridges: maximum wheel unloading from 24 profile realisations, unfiltered.
100 150 200 250 300 350 400Speed (km/h)
0
0.5
1
Whe
el u
nloa
ding
(-)
L = 10 mHSLM: A6 (1 span), A6 (2 spans), A2 (3 spans)
100 150 200 250 300 350 400Speed (km/h)
0
0.5
1
Whe
el u
nloa
ding
(-)
L = 20 mHSLM: A1 (1 span), A1 (2 spans), A1 (3 spans)
100 150 200 250 300 350 400Speed (km/h)
0
0.5
1
Whe
el u
nloa
ding
(-)
L = 30 mHSLM: A7 (1 span), A9 (2 spans), A9 (3 spans)
100 150 200 250 300 350 400Speed (km/h)
0
0.5
1
Whe
el u
nloa
ding
(-)
L = 40 mHSLM: A3 (1 span), A9 (2 spans), A10 (3 spans)
100 150 200 250 300 350 400Speed (km/h)
0
0.5
1
Whe
el u
nloa
ding
(-)
L = 50 mHSLM: A10 (1 span), A9 (2 spans), A10 (3 spans)
100 150 200 250 300 350 400Speed (km/h)
0
0.5
1
Whe
el u
nloa
ding
(-)
L = 60 mHSLM: A10 (1 span), A9 (2 spans), A10 (3 spans)
100 150 200 250 300 350 400Speed (km/h)
0
0.5
1
Whe
el u
nloa
ding
(-)
L = 70 mHSLM: A9 (1 span), A10 (2 spans), A9 (3 spans)
100 150 200 250 300 350 400Speed (km/h)
0
0.5
1
Whe
el u
nloa
ding
(-)
L = 80 mHSLM: A9 (1 span), A9 (2 spans), A2 (3 spans)
1 span (no irreg)1 span (no bridge)1 span
2 spans (no irreg)2 spans (no bridge)2 spans
3 spans (no irreg)3 spans (no bridge)3 spans
Limit value

B.2. LOWER TRACK QUALITY
111
Figure B.17: Beam bridges: maximum wheel unloading from 24 profile realisations, filtered at 20 Hz.
100 150 200 250 300 350 400Speed (km/h)
0
0.2
0.4
0.6
Whe
el u
nloa
ding
(-)
, 20
Hz
L = 10 mHSLM: A6 (1 span), A6 (2 spans), A2 (3 spans)
100 150 200 250 300 350 400Speed (km/h)
0
0.2
0.4
0.6
Whe
el u
nloa
ding
(-)
, 20
Hz
L = 20 mHSLM: A1 (1 span), A1 (2 spans), A1 (3 spans)
100 150 200 250 300 350 400Speed (km/h)
0
0.2
0.4
0.6
Whe
el u
nloa
ding
(-)
, 20
Hz
L = 30 mHSLM: A7 (1 span), A9 (2 spans), A9 (3 spans)
100 150 200 250 300 350 400Speed (km/h)
0
0.2
0.4
0.6
Whe
el u
nloa
ding
(-)
, 20
Hz
L = 40 mHSLM: A3 (1 span), A9 (2 spans), A10 (3 spans)
100 150 200 250 300 350 400Speed (km/h)
0
0.2
0.4
0.6
Whe
el u
nloa
ding
(-)
, 20
Hz
L = 50 mHSLM: A10 (1 span), A9 (2 spans), A10 (3 spans)
100 150 200 250 300 350 400Speed (km/h)
0
0.2
0.4
0.6
Whe
el u
nloa
ding
(-)
, 20
Hz
L = 60 mHSLM: A10 (1 span), A9 (2 spans), A10 (3 spans)
100 150 200 250 300 350 400Speed (km/h)
0
0.2
0.4
0.6
Whe
el u
nloa
ding
(-)
, 20
Hz
L = 70 mHSLM: A9 (1 span), A10 (2 spans), A9 (3 spans)
100 150 200 250 300 350 400Speed (km/h)
0
0.2
0.4
0.6
Whe
el u
nloa
ding
(-)
, 20
Hz
L = 80 mHSLM: A9 (1 span), A9 (2 spans), A2 (3 spans)
1 span (no irreg)1 span (no bridge)1 span
2 spans (no irreg)2 spans (no bridge)2 spans
3 spans (no irreg)3 spans (no bridge)3 spans
Limit value

Appendix B. SINGLE-TRACK BRIDGES
112
Figure B.18: Beam bridges: maximum duration of contact loss from 24 profile realisations, unfiltered.
150 200 250 300 350 400Speed (km/h)
0
5
10
15
Con
tact
loss
(m
s)L = 10 m
HSLM: A6 (1 span), A6 (2 spans), A2 (3 spans)
150 200 250 300 350 400Speed (km/h)
0
5
10
15
Con
tact
loss
(m
s)
L = 20 mHSLM: A1 (1 span), A1 (2 spans), A1 (3 spans)
150 200 250 300 350 400Speed (km/h)
0
5
10
15
Con
tact
loss
(m
s)
L = 30 mHSLM: A7 (1 span), A9 (2 spans), A9 (3 spans)
150 200 250 300 350 400Speed (km/h)
0
5
10
15
Con
tact
loss
(m
s)
L = 40 mHSLM: A3 (1 span), A9 (2 spans), A10 (3 spans)
150 200 250 300 350 400Speed (km/h)
0
5
10
15
Con
tact
loss
(m
s)
L = 50 mHSLM: A10 (1 span), A9 (2 spans), A10 (3 spans)
150 200 250 300 350 400Speed (km/h)
0
5
10
15
Con
tact
loss
(m
s)
L = 60 mHSLM: A10 (1 span), A9 (2 spans), A10 (3 spans)
150 200 250 300 350 400Speed (km/h)
0
5
10
15
Con
tact
loss
(m
s)
L = 70 mHSLM: A9 (1 span), A10 (2 spans), A9 (3 spans)
150 200 250 300 350 400Speed (km/h)
0
5
10
15
Con
tact
loss
(m
s)
L = 80 mHSLM: A9 (1 span), A9 (2 spans), A2 (3 spans)
1 span (no bridge)1 span
2 spans (no bridge)2 spans
3 spans (no bridge)3 spans
Limit value

B.2. LOWER TRACK QUALITY
113
Figure B.19: Beam bridges: maximum car body acceleration from 24 profile realisations, unfiltered.
100 150 200 250 300 350 400Speed (km/h)
0
0.5
1
1.5
2
Car
bod
y ac
cele
ratio
n (m
/s2 )
L = 10 mHSLM: A6 (1 span), A6 (2 spans), A2 (3 spans)
100 150 200 250 300 350 400Speed (km/h)
0
0.5
1
1.5
2
Car
bod
y ac
cele
ratio
n (m
/s2 )
L = 20 mHSLM: A1 (1 span), A1 (2 spans), A1 (3 spans)
100 150 200 250 300 350 400Speed (km/h)
0
0.5
1
1.5
2
Car
bod
y ac
cele
rati
on (
m/s
2 )
L = 30 mHSLM: A7 (1 span), A9 (2 spans), A9 (3 spans)
100 150 200 250 300 350 400Speed (km/h)
0
0.5
1
1.5
2
Car
bod
y ac
cele
rati
on (
m/s
2 )
L = 40 mHSLM: A3 (1 span), A9 (2 spans), A10 (3 spans)
100 150 200 250 300 350 400Speed (km/h)
0
0.5
1
1.5
2
Car
bod
y ac
cele
rati
on (
m/s
2 )
L = 50 mHSLM: A10 (1 span), A9 (2 spans), A10 (3 spans)
100 150 200 250 300 350 400Speed (km/h)
0
0.5
1
1.5
2
Car
bod
y ac
cele
rati
on (
m/s
2 )
L = 60 mHSLM: A10 (1 span), A9 (2 spans), A10 (3 spans)
100 150 200 250 300 350 400Speed (km/h)
0
0.5
1
1.5
2
Car
bod
y ac
cele
rati
on (
m/s
2 )
L = 70 mHSLM: A9 (1 span), A10 (2 spans), A9 (3 spans)
100 150 200 250 300 350 400Speed (km/h)
0
0.5
1
1.5
2
Car
bod
y ac
cele
rati
on (
m/s
2 )
L = 80 mHSLM: A9 (1 span), A9 (2 spans), A2 (3 spans)
1 span (no irreg)1 span (no bridge)1 span
2 spans (no irreg)2 spans (no bridge)2 spans
3 spans (no irreg)3 spans (no bridge)3 spans
Limit value

Appendix B. SINGLE-TRACK BRIDGES
114
B.3 Higher track quality
Figure B.20: Slab bridges: maximum deck acceleration from 24 profile realisations, filtered at 20 Hz.
150 200 250 300 350 400Speed (km/h)
0
2
4
6
8
10
Bri
dge
acce
lera
tion
(m/s
2 )
L = 10 mHSLM: A6 (1 span), A7 (2 spans), A2 (3 spans)
150 200 250 300 350 400Speed (km/h)
0
2
4
6
8
10
Bri
dge
acce
lera
tion
(m/s
2 )
L = 15 mHSLM: A7 (1 span), A7 (2 spans), A9 (3 spans)
150 200 250 300 350 400Speed (km/h)
0
2
4
6
8
10
Bri
dge
acce
lera
tion
(m/s
2 )
L = 20 mHSLM: A1 (1 span), A1 (2 spans), A1 (3 spans)
150 200 250 300 350 400Speed (km/h)
0
2
4
6
8
10
Bri
dge
acce
lera
tion
(m/s
2 )
L = 25 mHSLM: A3 (1 span), A3 (2 spans), A10 (3 spans)
150 200 250 300 350 400Speed (km/h)
0
2
4
6
8
10
Bri
dge
acce
lera
tion
(m/s
2 )
L = 30 mHSLM: A9 (1 span), A9 (2 spans), A4 (3 spans)
1 span 2 spans 3 spans Limit value

B.3. HIGHER TRACK QUALITY
115
Figure B.21: Slab bridges: maximum deck displacement from 24 profile realisations, filtered at 20 Hz.
100 150 200 250 300 350 400Speed (km/h)
0
10
20
30
40
50
Bri
dge
disp
lace
men
t (m
m)
L = 10 mHSLM: A6 (1 span), A7 (2 spans), A2 (3 spans)
100 150 200 250 300 350 400Speed (km/h)
0
10
20
30
40
50
Bri
dge
disp
lace
men
t (m
m)
L = 15 mHSLM: A7 (1 span), A7 (2 spans), A9 (3 spans)
100 150 200 250 300 350 400Speed (km/h)
0
10
20
30
40
50
Bri
dge
disp
lace
men
t (m
m)
L = 20 mHSLM: A1 (1 span), A1 (2 spans), A1 (3 spans)
100 150 200 250 300 350 400Speed (km/h)
0
10
20
30
40
50B
ridg
e di
spla
cem
ent (
mm
)
L = 25 mHSLM: A3 (1 span), A3 (2 spans), A10 (3 spans)
100 150 200 250 300 350 400Speed (km/h)
0
10
20
30
40
50
Bri
dge
disp
lace
men
t (m
m)
L = 30 mHSLM: A9 (1 span), A9 (2 spans), A4 (3 spans)
1 spanLimit value
2 spansLimit value
3 spansLimit value

Appendix B. SINGLE-TRACK BRIDGES
116
Figure B.22: Slab bridges: maximum wheel unloading from 24 profile realisations, unfiltered.
100 150 200 250 300 350 400Speed (km/h)
0
0.2
0.4
0.6
0.8
1
Whe
el u
nloa
ding
(-)
L = 10 mHSLM: A6 (1 span), A7 (2 spans), A2 (3 spans)
100 150 200 250 300 350 400Speed (km/h)
0
0.2
0.4
0.6
0.8
1
Whe
el u
nloa
ding
(-)
L = 15 mHSLM: A7 (1 span), A7 (2 spans), A9 (3 spans)
100 150 200 250 300 350 400Speed (km/h)
0
0.2
0.4
0.6
0.8
1
Whe
el u
nloa
ding
(-)
L = 20 mHSLM: A1 (1 span), A1 (2 spans), A1 (3 spans)
100 150 200 250 300 350 400Speed (km/h)
0
0.2
0.4
0.6
0.8
1W
heel
unl
oadi
ng (
-)
L = 25 mHSLM: A3 (1 span), A3 (2 spans), A10 (3 spans)
100 150 200 250 300 350 400Speed (km/h)
0
0.2
0.4
0.6
0.8
1
Whe
el u
nloa
ding
(-)
L = 30 mHSLM: A9 (1 span), A9 (2 spans), A4 (3 spans)
1 span (no irreg)1 span (no bridge)1 span
2 spans (no irreg)2 spans (no bridge)2 spans
3 spans (no irreg)3 spans (no bridge)3 spans
Limit value
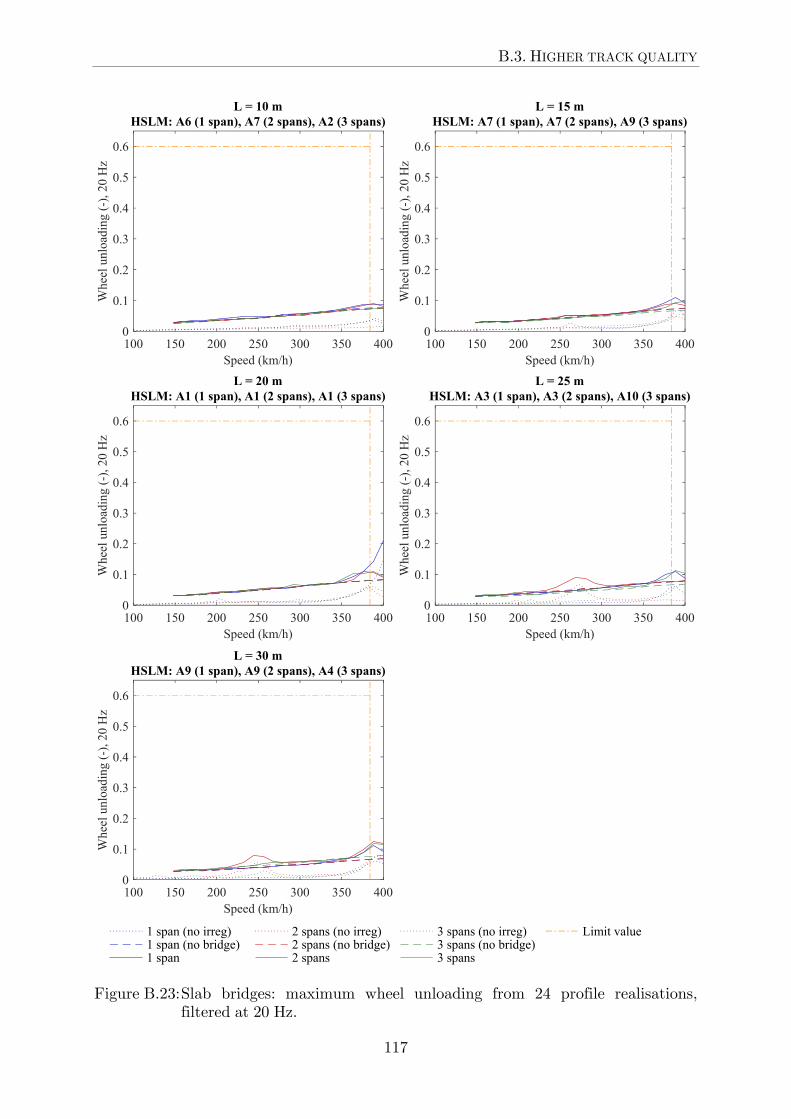
B.3. HIGHER TRACK QUALITY
117
Figure B.23: Slab bridges: maximum wheel unloading from 24 profile realisations, filtered at 20 Hz.
100 150 200 250 300 350 400Speed (km/h)
0
0.1
0.2
0.3
0.4
0.5
0.6
Whe
el u
nloa
ding
(-)
, 20
Hz
L = 10 mHSLM: A6 (1 span), A7 (2 spans), A2 (3 spans)
100 150 200 250 300 350 400Speed (km/h)
0
0.1
0.2
0.3
0.4
0.5
0.6
Whe
el u
nloa
ding
(-)
, 20
Hz
L = 15 mHSLM: A7 (1 span), A7 (2 spans), A9 (3 spans)
100 150 200 250 300 350 400Speed (km/h)
0
0.1
0.2
0.3
0.4
0.5
0.6
Whe
el u
nloa
ding
(-)
, 20
Hz
L = 20 mHSLM: A1 (1 span), A1 (2 spans), A1 (3 spans)
100 150 200 250 300 350 400Speed (km/h)
0
0.1
0.2
0.3
0.4
0.5
0.6
Whe
el u
nloa
ding
(-)
, 20
Hz
L = 25 mHSLM: A3 (1 span), A3 (2 spans), A10 (3 spans)
100 150 200 250 300 350 400Speed (km/h)
0
0.1
0.2
0.3
0.4
0.5
0.6
Whe
el u
nloa
ding
(-)
, 20
Hz
L = 30 mHSLM: A9 (1 span), A9 (2 spans), A4 (3 spans)
1 span (no irreg)1 span (no bridge)1 span
2 spans (no irreg)2 spans (no bridge)2 spans
3 spans (no irreg)3 spans (no bridge)3 spans
Limit value

Appendix B. SINGLE-TRACK BRIDGES
118
Figure B.24: Slab bridges: maximum car body acceleration from 24 profile realisations, unfiltered.
100 150 200 250 300 350 400Speed (km/h)
0
0.2
0.4
0.6
0.8
1
1.2
Car
bod
y ac
cele
rati
on (
m/s
2 )L = 10 m
HSLM: A6 (1 span), A7 (2 spans), A2 (3 spans)
100 150 200 250 300 350 400Speed (km/h)
0
0.2
0.4
0.6
0.8
1
1.2
Car
bod
y ac
cele
rati
on (
m/s
2 )
L = 15 mHSLM: A7 (1 span), A7 (2 spans), A9 (3 spans)
100 150 200 250 300 350 400Speed (km/h)
0
0.2
0.4
0.6
0.8
1
1.2
Car
bod
y ac
cele
rati
on (
m/s
2 )
L = 20 mHSLM: A1 (1 span), A1 (2 spans), A1 (3 spans)
100 150 200 250 300 350 400Speed (km/h)
0
0.2
0.4
0.6
0.8
1
1.2C
ar b
ody
acce
lera
tion
(m
/s2 )
L = 25 mHSLM: A3 (1 span), A3 (2 spans), A10 (3 spans)
100 150 200 250 300 350 400Speed (km/h)
0
0.2
0.4
0.6
0.8
1
1.2
Car
bod
y ac
cele
rati
on (
m/s
2 )
L = 30 mHSLM: A9 (1 span), A9 (2 spans), A4 (3 spans)
1 span (no irreg)1 span (no bridge)1 span
2 spans (no irreg)2 spans (no bridge)2 spans
3 spans (no irreg)3 spans (no bridge)3 spans
Limit value

B.3. HIGHER TRACK QUALITY
119
Figure B.25: Composite bridges: maximum deck acceleration from 24 profile realisations, filtered at 20 Hz.
Bri
dge
acce
lera
tion
(m
/s2 )
Bri
dge
acce
lera
tion
(m
/s2 )
Bri
dge
acce
lera
tion
(m
/s2 )
Bri
dge
acce
lera
tion
(m
/s2 )
Bri
dge
acce
lera
tion
(m
/s2 )
Bri
dge
acce
lera
tion
(m
/s2 )
Bri
dge
acce
lera
tion
(m
/s2 )
Bri
dge
acce
lera
tion
(m
/s2 )

Appendix B. SINGLE-TRACK BRIDGES
120
Figure B.26: Composite bridges: maximum deck displacement from 24 profile realisations, filtered at 20 Hz.
Bri
dge
disp
lace
men
t (m
m)
Bri
dge
disp
lace
men
t (m
m)
Bri
dge
disp
lace
men
t (m
m)
Bri
dge
disp
lace
men
t (m
m)
Bri
dge
disp
lace
men
t (m
m)
Bri
dge
disp
lace
men
t (m
m)
Bri
dge
disp
lace
men
t (m
m)
Bri
dge
disp
lace
men
t (m
m)

B.3. HIGHER TRACK QUALITY
121
Figure B.27: Composite bridges: maximum wheel unloading from 24 profile realisations, unfiltered.
Whe
el u
nloa
ding
(-)
Whe
el u
nloa
ding
(-)
Whe
el u
nloa
ding
(-)
Whe
el u
nloa
ding
(-)
Whe
el u
nloa
ding
(-)
Whe
el u
nloa
ding
(-)
Whe
el u
nloa
ding
(-)
Whe
el u
nloa
ding
(-)

Appendix B. SINGLE-TRACK BRIDGES
122
Figure B.28: Composite bridges: maximum wheel unloading from 24 profile realisations, filtered at 20 Hz.
Whe
el u
nloa
ding
(-)
, 20
Hz
Whe
el u
nloa
ding
(-)
, 20
Hz
Whe
el u
nloa
ding
(-)
, 20
Hz
Whe
el u
nloa
ding
(-)
, 20
Hz
Whe
el u
nloa
ding
(-)
, 20
Hz
Whe
el u
nloa
ding
(-)
, 20
Hz
Whe
el u
nloa
ding
(-)
, 20
Hz
Whe
el u
nloa
ding
(-)
, 20
Hz

B.3. HIGHER TRACK QUALITY
123
Figure B.29: Composite bridges: maximum car body acceleration from 24 profile realisations, unfiltered.
Car
bod
y ac
cele
rati
on (
m/s
2 )
Car
bod
y ac
cele
rati
on (
m/s
2 )
Car
bod
y ac
cele
rati
on (
m/s
2 )
Car
bod
y ac
cele
rati
on (
m/s
2 )
Car
bod
y ac
cele
rati
on (
m/s
2 )
Car
bod
y ac
cele
rati
on (
m/s
2 )
Car
bod
y ac
cele
rati
on (
m/s
2 )
Car
bod
y ac
cele
rati
on (
m/s
2 )

Appendix B. SINGLE-TRACK BRIDGES
124
Figure B.30: Beam bridges: maximum deck acceleration from 24 profile realisations, filtered at 20 Hz.
Bri
dge
acce
lera
tion
(m
/s2 )
Bri
dge
acce
lera
tion
(m
/s2 )
Bri
dge
acce
lera
tion
(m
/s2 )
Bri
dge
acce
lera
tion
(m
/s2 )
Bri
dge
acce
lera
tion
(m
/s2 )
Bri
dge
acce
lera
tion
(m
/s2 )
Bri
dge
acce
lera
tion
(m
/s2 )
Bri
dge
acce
lera
tion
(m
/s2 )

B.3. HIGHER TRACK QUALITY
125
Figure B.31: Beam bridges: maximum deck displacement from 24 profile realisations, filtered at 20 Hz.
Bri
dge
disp
lace
men
t (m
m)
Bri
dge
disp
lace
men
t (m
m)
Bri
dge
disp
lace
men
t (m
m)
Bri
dge
disp
lace
men
t (m
m)
Bri
dge
disp
lace
men
t (m
m)
Bri
dge
disp
lace
men
t (m
m)
Bri
dge
disp
lace
men
t (m
m)
Bri
dge
disp
lace
men
t (m
m)

Appendix B. SINGLE-TRACK BRIDGES
126
Figure B.32: Beam bridges: maximum wheel unloading from 24 profile realisations, unfiltered.
Whe
el u
nloa
ding
(-)
Whe
el u
nloa
ding
(-)
Whe
el u
nloa
ding
(-)
Whe
el u
nloa
ding
(-)
Whe
el u
nloa
ding
(-)
Whe
el u
nloa
ding
(-)
Whe
el u
nloa
ding
(-)
Whe
el u
nloa
ding
(-)

B.3. HIGHER TRACK QUALITY
127
Figure B.33: Beam bridges: maximum wheel unloading from 24 profile realisations, filtered at 20 Hz.
Whe
el u
nloa
ding
(-)
, 20
Hz
Whe
el u
nloa
ding
(-)
, 20
Hz
Whe
el u
nloa
ding
(-)
, 20
Hz
Whe
el u
nloa
ding
(-)
, 20
Hz
Whe
el u
nloa
ding
(-)
, 20
Hz
Whe
el u
nloa
ding
(-)
, 20
Hz
Whe
el u
nloa
ding
(-)
, 20
Hz
Whe
el u
nloa
ding
(-)
, 20
Hz

Appendix B. SINGLE-TRACK BRIDGES
128
Figure B.34: Beam bridges: maximum car body acceleration from 24 profile realisations, unfiltered.
Car
bod
y ac
cele
rati
on (
m/s
2 )
Car
bod
y ac
cele
rati
on (
m/s
2 )
Car
bod
y ac
cele
rati
on (
m/s
2 )
Car
bod
y ac
cele
rati
on (
m/s
2 )
Car
bod
y ac
cele
rati
on (
m/s
2 )
Car
bod
y ac
cele
rati
on (
m/s
2 )
Car
bod
y ac
cele
rati
on (
m/s
2 )
Car
bod
y ac
cele
rati
on (
m/s
2 )

C.1. INPUT PARAMETERS
129
C Single-track bridges with reduced cross-section
Section C.1 gives input parameters for the single-track bridges. Section C.2 and C.3 give the full results for the lower and higher track quality, respectively. Bridge and vehicle results against speed are shown for slab, composite and beam bridges in 1–3 spans. The figures also show which HSLM train that is critical for each bridge. Results for a smooth track profile are given as reference. Also, the vehicle response from running on a plain track section is shown in the figures.
C.1 Input parameters
The input parameters used in the analyses are presented in Table C.1 and Figure C.1.
Appendix

Appendix C. SINGLE-TRACK BRIDGES WITH REDUCED CROSS-SECTION
130
Table C.1: Mass and stiffness for single-track bridges with reduced cross-sections.
Slab bridges 1 span 2 spans 3 spans
L (m) m (tonne/m) EI (GNm2) m (tonne/m) EI (GNm2) m (tonne/m) EI (GNm2) 10 11.11 4.479 9.162 2.961 7.585 1.817 15 15.27 12.17 14.01 10.44 11.56 5.796 20 22.23 41.82 18.27 24.08 15.62 14.67 25 26.24 71.84 18.73 26.05 17.98 22.90 30 27.43 82.96 21.43 39.88 19.02 27.35
Composite bridges 1 span 2 spans 3 spans
L (m) m (tonne/m) EI (GNm2) m (tonne/m) EI (GNm2) m (tonne/m) EI (GNm2) 10 12.53 4.887 12.53 3.563 12.53 2.634 20 12.89 31.08 12.77 19.73 12.71 15.15 30 13.22 81.83 13.06 52.97 12.91 33.18 40 13.41 125.6 13.15 67.61 13.16 69.89 50 13.53 160.1 13.39 121.0 13.26 89.33
Beam bridges 1 span 2 spans 3 spans
L (m) m (tonne/m) EI (GNm2) m (tonne/m) EI (GNm2) m (tonne/m) EI (GNm2) 10 10.52 4.104 10.35 3.135 10.35 2.286 20 16.33 32.44 14.76 20.17 13.55 13.32 30 20.40 85.10 16.67 35.69 15.76 27.51 40 20.22 82.04 19.67 73.20 18.67 58.71 50 24.15 166.2 23.66 153.4 21.75 110.2

C.1. INPUT PARAMETERS
131
Figure C.1: Bridge properties and moving force model results for deck acceleration and displacement at the design limits. EN 1991-2 recommended frequency range and limits for acceleration and displacement are included.
n 0 (H
z)
n 0 (H
z)
n 0 (H
z)
h sect
ion (
m)
m (
ton/
m)
Acc
eler
atio
n (m
/s2 )
Dis
plac
emen
t (m
m)
redu
ctio
n in
EI
(%)
h sect
ion (
m)
m (
ton/
m)
Acc
eler
atio
n (m
/s2 )
Dis
plac
emen
t (m
m)
redu
ctio
n in
EI
(%)
h sect
ion (
m)
m (
ton/
m)
Acc
eler
atio
n (m
/s2 )
Dis
plac
emen
t (m
m)
redu
ctio
n in
EI
(%)

Appendix C. SINGLE-TRACK BRIDGES WITH REDUCED CROSS-SECTION
132
C.2 Lower track quality
Figure C.2: Slab bridges: maximum deck acceleration from 24 profile realisations, filtered at 20 Hz.
150 200 250 300 350 400Speed (km/h)
0
5
10
15
20
25
30
Bri
dge
acce
lera
tion
(m/s
2 )
L = 10 mHSLM: A3 (1 span), A7 (2 spans), A5 (3 spans)
150 200 250 300 350 400Speed (km/h)
0
5
10
15
20
25
30
Bri
dge
acce
lera
tion
(m/s
2 )
L = 15 mHSLM: A1 (1 span), A1 (2 spans), A1 (3 spans)
150 200 250 300 350 400Speed (km/h)
0
5
10
15
20
25
30
Bri
dge
acce
lera
tion
(m/s
2 )
L = 20 mHSLM: A3 (1 span), A7 (2 spans), A5 (3 spans)
150 200 250 300 350 400Speed (km/h)
0
5
10
15
20
25
30
Bri
dge
acce
lera
tion
(m/s
2 )
L = 25 mHSLM: A9 (1 span), A6 (2 spans), A10 (3 spans)
150 200 250 300 350 400Speed (km/h)
0
5
10
15
20
25
30
Bri
dge
acce
lera
tion
(m/s
2 )
L = 30 mHSLM: A10 (1 span), A10 (2 spans), A6 (3 spans)
1 span 2 spans 3 spans Limit value

C.2. LOWER TRACK QUALITY
133
Figure C.3: Slab bridges: maximum deck displacement from 24 profile realisations, filtered at 20 Hz.
100 150 200 250 300 350 400Speed (km/h)
0
10
20
30
40
50
Bri
dge
disp
lace
men
t (m
m)
L = 10 mHSLM: A3 (1 span), A7 (2 spans), A5 (3 spans)
100 150 200 250 300 350 400Speed (km/h)
0
10
20
30
40
50
Bri
dge
disp
lace
men
t (m
m)
L = 15 mHSLM: A1 (1 span), A1 (2 spans), A1 (3 spans)
100 150 200 250 300 350 400Speed (km/h)
0
10
20
30
40
50
Bri
dge
disp
lace
men
t (m
m)
L = 20 mHSLM: A3 (1 span), A7 (2 spans), A5 (3 spans)
100 150 200 250 300 350 400Speed (km/h)
0
10
20
30
40
50B
ridg
e di
spla
cem
ent (
mm
)
L = 25 mHSLM: A9 (1 span), A6 (2 spans), A10 (3 spans)
100 150 200 250 300 350 400Speed (km/h)
0
10
20
30
40
50
Bri
dge
disp
lace
men
t (m
m)
L = 30 mHSLM: A10 (1 span), A10 (2 spans), A6 (3 spans)
1 spanLimit value
2 spansLimit value
3 spansLimit value

Appendix C. SINGLE-TRACK BRIDGES WITH REDUCED CROSS-SECTION
134
Figure C.4: Slab bridges: maximum wheel unloading from 24 profile realisations, unfiltered.
100 150 200 250 300 350 400Speed (km/h)
0
0.2
0.4
0.6
0.8
1
Whe
el u
nloa
ding
(-)
L = 10 mHSLM: A3 (1 span), A7 (2 spans), A5 (3 spans)
100 150 200 250 300 350 400Speed (km/h)
0
0.2
0.4
0.6
0.8
1
Whe
el u
nloa
ding
(-)
L = 15 mHSLM: A1 (1 span), A1 (2 spans), A1 (3 spans)
100 150 200 250 300 350 400Speed (km/h)
0
0.2
0.4
0.6
0.8
1
Whe
el u
nloa
ding
(-)
L = 20 mHSLM: A3 (1 span), A7 (2 spans), A5 (3 spans)
100 150 200 250 300 350 400Speed (km/h)
0
0.2
0.4
0.6
0.8
1W
heel
unl
oadi
ng (
-)
L = 25 mHSLM: A9 (1 span), A6 (2 spans), A10 (3 spans)
100 150 200 250 300 350 400Speed (km/h)
0
0.2
0.4
0.6
0.8
1
Whe
el u
nloa
ding
(-)
L = 30 mHSLM: A10 (1 span), A10 (2 spans), A6 (3 spans)
1 span (no irreg)1 span (no bridge)1 span
2 spans (no irreg)2 spans (no bridge)2 spans
3 spans (no irreg)3 spans (no bridge)3 spans
Limit value

C.2. LOWER TRACK QUALITY
135
Figure C.5: Slab bridges: maximum wheel unloading from 24 profile realisations, filtered at 20 Hz.
100 150 200 250 300 350 400Speed (km/h)
0
0.1
0.2
0.3
0.4
0.5
0.6
Whe
el u
nloa
ding
(-)
, 20
Hz
L = 10 mHSLM: A3 (1 span), A7 (2 spans), A5 (3 spans)
100 150 200 250 300 350 400Speed (km/h)
0
0.1
0.2
0.3
0.4
0.5
0.6
Whe
el u
nloa
ding
(-)
, 20
Hz
L = 15 mHSLM: A1 (1 span), A1 (2 spans), A1 (3 spans)
100 150 200 250 300 350 400Speed (km/h)
0
0.1
0.2
0.3
0.4
0.5
0.6
Whe
el u
nloa
ding
(-)
, 20
Hz
L = 20 mHSLM: A3 (1 span), A7 (2 spans), A5 (3 spans)
100 150 200 250 300 350 400Speed (km/h)
0
0.1
0.2
0.3
0.4
0.5
0.6
Whe
el u
nloa
ding
(-)
, 20
Hz
L = 25 mHSLM: A9 (1 span), A6 (2 spans), A10 (3 spans)
100 150 200 250 300 350 400Speed (km/h)
0
0.1
0.2
0.3
0.4
0.5
0.6
Whe
el u
nloa
ding
(-)
, 20
Hz
L = 30 mHSLM: A10 (1 span), A10 (2 spans), A6 (3 spans)
1 span (no irreg)1 span (no bridge)1 span
2 spans (no irreg)2 spans (no bridge)2 spans
3 spans (no irreg)3 spans (no bridge)3 spans
Limit value
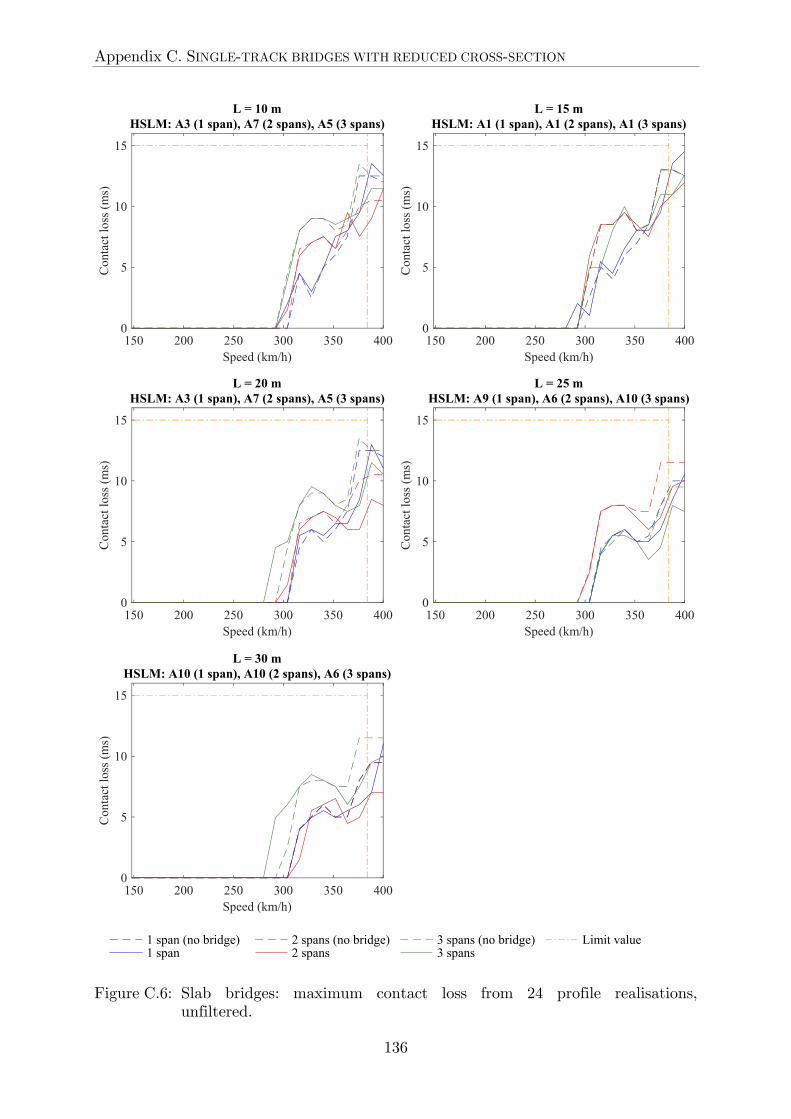
Appendix C. SINGLE-TRACK BRIDGES WITH REDUCED CROSS-SECTION
136
Figure C.6: Slab bridges: maximum contact loss from 24 profile realisations, unfiltered.
150 200 250 300 350 400Speed (km/h)
0
5
10
15
Con
tact
loss
(m
s)L = 10 m
HSLM: A3 (1 span), A7 (2 spans), A5 (3 spans)
150 200 250 300 350 400Speed (km/h)
0
5
10
15
Con
tact
loss
(m
s)
L = 15 mHSLM: A1 (1 span), A1 (2 spans), A1 (3 spans)
150 200 250 300 350 400Speed (km/h)
0
5
10
15
Con
tact
loss
(m
s)
L = 20 mHSLM: A3 (1 span), A7 (2 spans), A5 (3 spans)
150 200 250 300 350 400Speed (km/h)
0
5
10
15C
onta
ct lo
ss (
ms)
L = 25 mHSLM: A9 (1 span), A6 (2 spans), A10 (3 spans)
150 200 250 300 350 400Speed (km/h)
0
5
10
15
Con
tact
loss
(m
s)
L = 30 mHSLM: A10 (1 span), A10 (2 spans), A6 (3 spans)
1 span (no bridge)1 span
2 spans (no bridge)2 spans
3 spans (no bridge)3 spans
Limit value
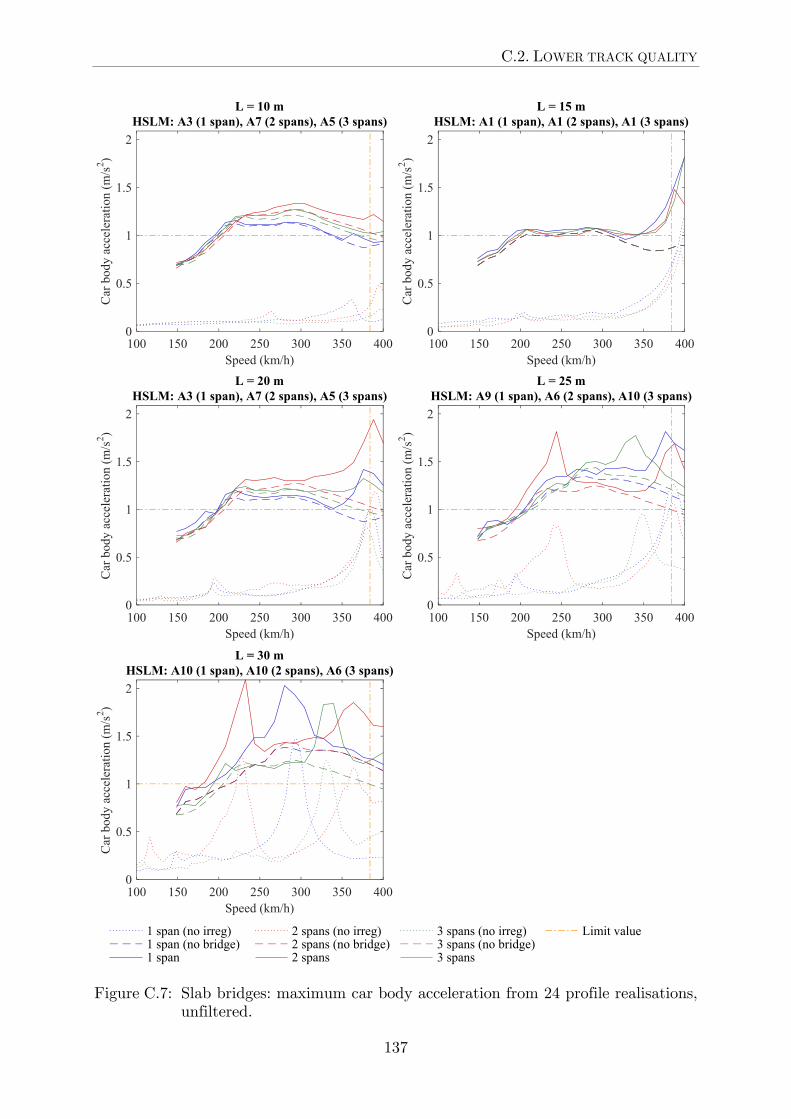
C.2. LOWER TRACK QUALITY
137
Figure C.7: Slab bridges: maximum car body acceleration from 24 profile realisations, unfiltered.
100 150 200 250 300 350 400Speed (km/h)
0
0.5
1
1.5
2
Car
bod
y ac
cele
rati
on (
m/s
2 )L = 10 m
HSLM: A3 (1 span), A7 (2 spans), A5 (3 spans)
100 150 200 250 300 350 400Speed (km/h)
0
0.5
1
1.5
2
Car
bod
y ac
cele
rati
on (
m/s
2 )
L = 15 mHSLM: A1 (1 span), A1 (2 spans), A1 (3 spans)
100 150 200 250 300 350 400Speed (km/h)
0
0.5
1
1.5
2
Car
bod
y ac
cele
rati
on (
m/s
2 )
L = 20 mHSLM: A3 (1 span), A7 (2 spans), A5 (3 spans)
100 150 200 250 300 350 400Speed (km/h)
0
0.5
1
1.5
2C
ar b
ody
acce
lera
tion
(m
/s2 )
L = 25 mHSLM: A9 (1 span), A6 (2 spans), A10 (3 spans)
100 150 200 250 300 350 400Speed (km/h)
0
0.5
1
1.5
2
Car
bod
y ac
cele
rati
on (
m/s
2 )
L = 30 mHSLM: A10 (1 span), A10 (2 spans), A6 (3 spans)
1 span (no irreg)1 span (no bridge)1 span
2 spans (no irreg)2 spans (no bridge)2 spans
3 spans (no irreg)3 spans (no bridge)3 spans
Limit value

Appendix C. SINGLE-TRACK BRIDGES WITH REDUCED CROSS-SECTION
138
Figure C.8: Composite bridges: maximum deck acceleration from 24 profile realisations, filtered at 20 Hz.
150 200 250 300 350 400Speed (km/h)
0
5
10
15
20
25
30
35
Bri
dge
acce
lera
tion
(m/s
2 )L = 10 m
HSLM: A5 (1 span), A9 (2 spans), A7 (3 spans)
150 200 250 300 350 400Speed (km/h)
0
5
10
15
20
25
30
35
Bri
dge
acce
lera
tion
(m/s
2 )
L = 20 mHSLM: A1 (1 span), A5 (2 spans), A1 (3 spans)
150 200 250 300 350 400Speed (km/h)
0
5
10
15
20
25
30
35
Bri
dge
acce
lera
tion
(m
/s2 )
L = 30 mHSLM: A8 (1 span), A7 (2 spans), A9 (3 spans)
150 200 250 300 350 400Speed (km/h)
0
5
10
15
20
25
30
35B
ridg
e ac
cele
rati
on (
m/s
2 )
L = 40 mHSLM: A3 (1 span), A10 (2 spans), A10 (3 spans)
150 200 250 300 350 400Speed (km/h)
0
5
10
15
20
25
30
35
Bri
dge
acce
lera
tion
(m
/s2 )
L = 50 mHSLM: A10 (1 span), A9 (2 spans), A10 (3 spans)
1 span 2 spans 3 spans Limit value

C.2. LOWER TRACK QUALITY
139
Figure C.9: Composite bridges: maximum deck displacement from 24 profile realisations, filtered at 20 Hz.
100 150 200 250 300 350 400Speed (km/h)
0
20
40
60
80
Bri
dge
disp
lace
men
t (m
m)
L = 10 mHSLM: A5 (1 span), A9 (2 spans), A7 (3 spans)
100 150 200 250 300 350 400Speed (km/h)
0
20
40
60
80
Bri
dge
disp
lace
men
t (m
m)
L = 20 mHSLM: A1 (1 span), A5 (2 spans), A1 (3 spans)
100 150 200 250 300 350 400Speed (km/h)
0
20
40
60
80
Bri
dge
disp
lace
men
t (m
m)
L = 30 mHSLM: A8 (1 span), A7 (2 spans), A9 (3 spans)
100 150 200 250 300 350 400Speed (km/h)
0
20
40
60
80B
ridg
e di
spla
cem
ent (
mm
)
L = 40 mHSLM: A3 (1 span), A10 (2 spans), A10 (3 spans)
100 150 200 250 300 350 400Speed (km/h)
0
20
40
60
80
Bri
dge
disp
lace
men
t (m
m)
L = 50 mHSLM: A10 (1 span), A9 (2 spans), A10 (3 spans)
1 spanLimit value
2 spansLimit value
3 spansLimit value

Appendix C. SINGLE-TRACK BRIDGES WITH REDUCED CROSS-SECTION
140
Figure C.10: Composite bridges: maximum wheel unloading from 24 profile realisations, unfiltered.
100 150 200 250 300 350 400Speed (km/h)
0
0.2
0.4
0.6
0.8
1
Whe
el u
nloa
ding
(-)
L = 10 mHSLM: A5 (1 span), A9 (2 spans), A7 (3 spans)
100 150 200 250 300 350 400Speed (km/h)
0
0.2
0.4
0.6
0.8
1
Whe
el u
nloa
ding
(-)
L = 20 mHSLM: A1 (1 span), A5 (2 spans), A1 (3 spans)
100 150 200 250 300 350 400Speed (km/h)
0
0.2
0.4
0.6
0.8
1
Whe
el u
nloa
ding
(-)
L = 30 mHSLM: A8 (1 span), A7 (2 spans), A9 (3 spans)
100 150 200 250 300 350 400Speed (km/h)
0
0.2
0.4
0.6
0.8
1W
heel
unl
oadi
ng (
-)
L = 40 mHSLM: A3 (1 span), A10 (2 spans), A10 (3 spans)
100 150 200 250 300 350 400Speed (km/h)
0
0.2
0.4
0.6
0.8
1
Whe
el u
nloa
ding
(-)
L = 50 mHSLM: A10 (1 span), A9 (2 spans), A10 (3 spans)
1 span (no irreg)1 span (no bridge)1 span
2 spans (no irreg)2 spans (no bridge)2 spans
3 spans (no irreg)3 spans (no bridge)3 spans
Limit value

C.2. LOWER TRACK QUALITY
141
Figure C.11: Composite bridges: maximum wheel unloading from 24 profile realisations, filtered at 20 Hz.
100 150 200 250 300 350 400Speed (km/h)
0
0.1
0.2
0.3
0.4
0.5
0.6
Whe
el u
nloa
ding
(-)
, 20
Hz
L = 10 mHSLM: A5 (1 span), A9 (2 spans), A7 (3 spans)
100 150 200 250 300 350 400Speed (km/h)
0
0.1
0.2
0.3
0.4
0.5
0.6
Whe
el u
nloa
ding
(-)
, 20
Hz
L = 20 mHSLM: A1 (1 span), A5 (2 spans), A1 (3 spans)
100 150 200 250 300 350 400Speed (km/h)
0
0.1
0.2
0.3
0.4
0.5
0.6
Whe
el u
nloa
ding
(-)
, 20
Hz
L = 30 mHSLM: A8 (1 span), A7 (2 spans), A9 (3 spans)
100 150 200 250 300 350 400Speed (km/h)
0
0.1
0.2
0.3
0.4
0.5
0.6
Whe
el u
nloa
ding
(-)
, 20
Hz
L = 40 mHSLM: A3 (1 span), A10 (2 spans), A10 (3 spans)
100 150 200 250 300 350 400Speed (km/h)
0
0.1
0.2
0.3
0.4
0.5
0.6
Whe
el u
nloa
ding
(-)
, 20
Hz
L = 50 mHSLM: A10 (1 span), A9 (2 spans), A10 (3 spans)
1 span (no irreg)1 span (no bridge)1 span
2 spans (no irreg)2 spans (no bridge)2 spans
3 spans (no irreg)3 spans (no bridge)3 spans
Limit value

Appendix C. SINGLE-TRACK BRIDGES WITH REDUCED CROSS-SECTION
142
Figure C.12: Composite bridges: maximum contact loss from 24 profile realisations, unfiltered.
150 200 250 300 350 400Speed (km/h)
0
5
10
15
Con
tact
loss
(m
s)L = 10 m
HSLM: A5 (1 span), A9 (2 spans), A7 (3 spans)
150 200 250 300 350 400Speed (km/h)
0
5
10
15
Con
tact
loss
(m
s)
L = 20 mHSLM: A1 (1 span), A5 (2 spans), A1 (3 spans)
150 200 250 300 350 400Speed (km/h)
0
5
10
15
Con
tact
loss
(m
s)
L = 30 mHSLM: A8 (1 span), A7 (2 spans), A9 (3 spans)
150 200 250 300 350 400Speed (km/h)
0
5
10
15C
onta
ct lo
ss (
ms)
L = 40 mHSLM: A3 (1 span), A10 (2 spans), A10 (3 spans)
150 200 250 300 350 400Speed (km/h)
0
5
10
15
Con
tact
loss
(m
s)
L = 50 mHSLM: A10 (1 span), A9 (2 spans), A10 (3 spans)
1 span (no bridge)1 span
2 spans (no bridge)2 spans
3 spans (no bridge)3 spans
Limit value

C.2. LOWER TRACK QUALITY
143
Figure C.13: Composite bridges: maximum car body acceleration from 24 profile realisations, unfiltered.
100 150 200 250 300 350 400Speed (km/h)
0
0.5
1
1.5
2
Car
bod
y ac
cele
rati
on (
m/s
2 )L = 10 m
HSLM: A5 (1 span), A9 (2 spans), A7 (3 spans)
100 150 200 250 300 350 400Speed (km/h)
0
0.5
1
1.5
2
Car
bod
y ac
cele
rati
on (
m/s
2 )
L = 20 mHSLM: A1 (1 span), A5 (2 spans), A1 (3 spans)
100 150 200 250 300 350 400Speed (km/h)
0
0.5
1
1.5
2
Car
bod
y ac
cele
rati
on (
m/s
2 )
L = 30 mHSLM: A8 (1 span), A7 (2 spans), A9 (3 spans)
100 150 200 250 300 350 400Speed (km/h)
0
0.5
1
1.5
2
Car
bod
y ac
cele
rati
on (
m/s
2 )
L = 40 mHSLM: A3 (1 span), A10 (2 spans), A10 (3 spans)
100 150 200 250 300 350 400Speed (km/h)
0
0.5
1
1.5
2
Car
bod
y ac
cele
rati
on (
m/s
2 )
L = 50 mHSLM: A10 (1 span), A9 (2 spans), A10 (3 spans)
1 span (no irreg)1 span (no bridge)1 span
2 spans (no irreg)2 spans (no bridge)2 spans
3 spans (no irreg)3 spans (no bridge)3 spans
Limit value

Appendix C. SINGLE-TRACK BRIDGES WITH REDUCED CROSS-SECTION
144
Figure C.14: Beam bridges: maximum deck acceleration from 24 profile realisations, filtered at 20 Hz.
150 200 250 300 350 400Speed (km/h)
0
5
10
15
20
25
30
Bri
dge
acce
lera
tion
(m/s
2 )L = 10 m
HSLM: A5 (1 span), A8 (2 spans), A6 (3 spans)
150 200 250 300 350 400Speed (km/h)
0
5
10
15
20
25
30
Bri
dge
acce
lera
tion
(m/s
2 )
L = 20 mHSLM: A2 (1 span), A6 (2 spans), A5 (3 spans)
150 200 250 300 350 400Speed (km/h)
0
5
10
15
20
25
30
Bri
dge
acce
lera
tion
(m
/s2 )
L = 30 mHSLM: A10 (1 span), A10 (2 spans), A6 (3 spans)
150 200 250 300 350 400Speed (km/h)
0
5
10
15
20
25
30
Bri
dge
acce
lera
tion
(m
/s2 )
L = 40 mHSLM: A10 (1 span), A9 (2 spans), A9 (3 spans)
150 200 250 300 350 400Speed (km/h)
0
5
10
15
20
25
30
Bri
dge
acce
lera
tion
(m
/s2 )
L = 50 mHSLM: A10 (1 span), A9 (2 spans), A10 (3 spans)
1 span 2 spans 3 spans Limit value

C.2. LOWER TRACK QUALITY
145
Figure C.15: Beam bridges: maximum deck displacement from 24 profile realisations, filtered at 20 Hz.
100 150 200 250 300 350 400Speed (km/h)
0
20
40
60
80
Bri
dge
disp
lace
men
t (m
m)
L = 10 mHSLM: A5 (1 span), A8 (2 spans), A6 (3 spans)
100 150 200 250 300 350 400Speed (km/h)
0
20
40
60
80
Bri
dge
disp
lace
men
t (m
m)
L = 20 mHSLM: A2 (1 span), A6 (2 spans), A5 (3 spans)
100 150 200 250 300 350 400Speed (km/h)
0
20
40
60
80
Bri
dge
disp
lace
men
t (m
m)
L = 30 mHSLM: A10 (1 span), A10 (2 spans), A6 (3 spans)
100 150 200 250 300 350 400Speed (km/h)
0
20
40
60
80B
ridg
e di
spla
cem
ent (
mm
)
L = 40 mHSLM: A10 (1 span), A9 (2 spans), A9 (3 spans)
100 150 200 250 300 350 400Speed (km/h)
0
20
40
60
80
Bri
dge
disp
lace
men
t (m
m)
L = 50 mHSLM: A10 (1 span), A9 (2 spans), A10 (3 spans)
1 spanLimit value
2 spansLimit value
3 spansLimit value

Appendix C. SINGLE-TRACK BRIDGES WITH REDUCED CROSS-SECTION
146
Figure C.16: Beam bridges: maximum wheel unloading from 24 profile realisations, unfiltered.
100 150 200 250 300 350 400Speed (km/h)
0
0.2
0.4
0.6
0.8
1
Whe
el u
nloa
ding
(-)
L = 10 mHSLM: A5 (1 span), A8 (2 spans), A6 (3 spans)
100 150 200 250 300 350 400Speed (km/h)
0
0.2
0.4
0.6
0.8
1
Whe
el u
nloa
ding
(-)
L = 20 mHSLM: A2 (1 span), A6 (2 spans), A5 (3 spans)
100 150 200 250 300 350 400Speed (km/h)
0
0.2
0.4
0.6
0.8
1
Whe
el u
nloa
ding
(-)
L = 30 mHSLM: A10 (1 span), A10 (2 spans), A6 (3 spans)
100 150 200 250 300 350 400Speed (km/h)
0
0.2
0.4
0.6
0.8
1W
heel
unl
oadi
ng (
-)
L = 40 mHSLM: A10 (1 span), A9 (2 spans), A9 (3 spans)
100 150 200 250 300 350 400Speed (km/h)
0
0.2
0.4
0.6
0.8
1
Whe
el u
nloa
ding
(-)
L = 50 mHSLM: A10 (1 span), A9 (2 spans), A10 (3 spans)
1 span (no irreg)1 span (no bridge)1 span
2 spans (no irreg)2 spans (no bridge)2 spans
3 spans (no irreg)3 spans (no bridge)3 spans
Limit value

C.2. LOWER TRACK QUALITY
147
Figure C.17: Beam bridges: maximum wheel unloading from 24 profile realisations, filtered at 20 Hz.
100 150 200 250 300 350 400Speed (km/h)
0
0.1
0.2
0.3
0.4
0.5
0.6
Whe
el u
nloa
ding
(-)
, 20
Hz
L = 10 mHSLM: A5 (1 span), A8 (2 spans), A6 (3 spans)
100 150 200 250 300 350 400Speed (km/h)
0
0.1
0.2
0.3
0.4
0.5
0.6
Whe
el u
nloa
ding
(-)
, 20
Hz
L = 20 mHSLM: A2 (1 span), A6 (2 spans), A5 (3 spans)
100 150 200 250 300 350 400Speed (km/h)
0
0.1
0.2
0.3
0.4
0.5
0.6
Whe
el u
nloa
ding
(-)
, 20
Hz
L = 30 mHSLM: A10 (1 span), A10 (2 spans), A6 (3 spans)
100 150 200 250 300 350 400Speed (km/h)
0
0.1
0.2
0.3
0.4
0.5
0.6
Whe
el u
nloa
ding
(-)
, 20
Hz
L = 40 mHSLM: A10 (1 span), A9 (2 spans), A9 (3 spans)
100 150 200 250 300 350 400Speed (km/h)
0
0.1
0.2
0.3
0.4
0.5
0.6
Whe
el u
nloa
ding
(-)
, 20
Hz
L = 50 mHSLM: A10 (1 span), A9 (2 spans), A10 (3 spans)
1 span (no irreg)1 span (no bridge)1 span
2 spans (no irreg)2 spans (no bridge)2 spans
3 spans (no irreg)3 spans (no bridge)3 spans
Limit value

Appendix C. SINGLE-TRACK BRIDGES WITH REDUCED CROSS-SECTION
148
Figure C.18: Beam bridges: maximum contact loss from 24 profile realisations, unfiltered.
150 200 250 300 350 400Speed (km/h)
0
5
10
15
Con
tact
loss
(m
s)L = 10 m
HSLM: A5 (1 span), A8 (2 spans), A6 (3 spans)
150 200 250 300 350 400Speed (km/h)
0
5
10
15
Con
tact
loss
(m
s)
L = 20 mHSLM: A2 (1 span), A6 (2 spans), A5 (3 spans)
150 200 250 300 350 400Speed (km/h)
0
5
10
15
Con
tact
loss
(m
s)
L = 30 mHSLM: A10 (1 span), A10 (2 spans), A6 (3 spans)
150 200 250 300 350 400Speed (km/h)
0
5
10
15C
onta
ct lo
ss (
ms)
L = 40 mHSLM: A10 (1 span), A9 (2 spans), A9 (3 spans)
150 200 250 300 350 400Speed (km/h)
0
5
10
15
Con
tact
loss
(m
s)
L = 50 mHSLM: A10 (1 span), A9 (2 spans), A10 (3 spans)
1 span (no bridge)1 span
2 spans (no bridge)2 spans
3 spans (no bridge)3 spans
Limit value

C.2. LOWER TRACK QUALITY
149
Figure C.19: Beam bridges: maximum car body acceleration from 24 profile realisations, unfiltered.
100 150 200 250 300 350 400Speed (km/h)
0
0.5
1
1.5
2
Car
bod
y ac
cele
rati
on (
m/s
2 )L = 10 m
HSLM: A5 (1 span), A8 (2 spans), A6 (3 spans)
100 150 200 250 300 350 400Speed (km/h)
0
0.5
1
1.5
2
Car
bod
y ac
cele
rati
on (
m/s
2 )
L = 20 mHSLM: A2 (1 span), A6 (2 spans), A5 (3 spans)
100 150 200 250 300 350 400Speed (km/h)
0
0.5
1
1.5
2
Car
bod
y ac
cele
rati
on (
m/s
2 )
L = 30 mHSLM: A10 (1 span), A10 (2 spans), A6 (3 spans)
100 150 200 250 300 350 400Speed (km/h)
0
0.5
1
1.5
2
Car
bod
y ac
cele
rati
on (
m/s
2 )
L = 40 mHSLM: A10 (1 span), A9 (2 spans), A9 (3 spans)
100 150 200 250 300 350 400Speed (km/h)
0
0.5
1
1.5
2
Car
bod
y ac
cele
rati
on (
m/s
2 )
L = 50 mHSLM: A10 (1 span), A9 (2 spans), A10 (3 spans)
1 span (no irreg)1 span (no bridge)1 span
2 spans (no irreg)2 spans (no bridge)2 spans
3 spans (no irreg)3 spans (no bridge)3 spans
Limit value

Appendix C. SINGLE-TRACK BRIDGES WITH REDUCED CROSS-SECTION
150
C.3 Higher track quality
Figure C.20: Slab bridges: maximum deck acceleration from 24 profile realisations, filtered at 20 Hz.

C.3. HIGHER TRACK QUALITY
151
Figure C.21: Slab bridges: maximum deck displacement from 24 profile realisations, filtered at 20 Hz.

Appendix C. SINGLE-TRACK BRIDGES WITH REDUCED CROSS-SECTION
152
Figure C.22: Slab bridges: maximum wheel unloading from 24 profile realisations, unfiltered.

C.3. HIGHER TRACK QUALITY
153
Figure C.23: Slab bridges: maximum wheel unloading from 24 profile realisations, filtered at 20 Hz.

Appendix C. SINGLE-TRACK BRIDGES WITH REDUCED CROSS-SECTION
154
Figure C.24: Slab bridges: maximum car body acceleration from 24 profile realisations, unfiltered.

C.3. HIGHER TRACK QUALITY
155
Figure C.25: Composite bridges: maximum deck acceleration from 24 profile realisations, filtered at 20 Hz.

Appendix C. SINGLE-TRACK BRIDGES WITH REDUCED CROSS-SECTION
156
Figure C.26: Composite bridges: maximum deck displacement from 24 profile realisations, filtered at 20 Hz.
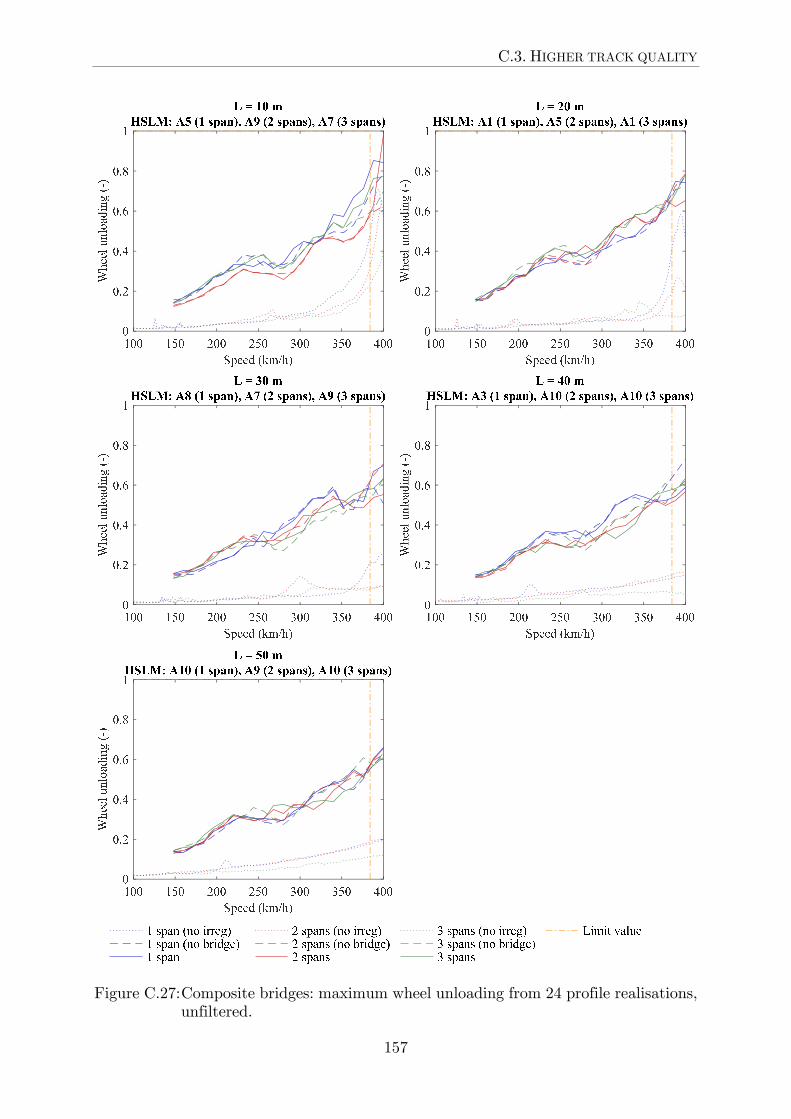
C.3. HIGHER TRACK QUALITY
157
Figure C.27: Composite bridges: maximum wheel unloading from 24 profile realisations, unfiltered.

Appendix C. SINGLE-TRACK BRIDGES WITH REDUCED CROSS-SECTION
158
Figure C.28: Composite bridges: maximum wheel unloading from 24 profile realisations, filtered at 20 Hz.

C.3. HIGHER TRACK QUALITY
159
Figure C.29: Composite bridges: maximum car body acceleration from 24 profile realisations, unfiltered.

Appendix C. SINGLE-TRACK BRIDGES WITH REDUCED CROSS-SECTION
160
Figure C.30: Beam bridges: maximum deck acceleration from 24 profile realisations, filtered at 20 Hz.

C.3. HIGHER TRACK QUALITY
161
Figure C.31: Beam bridges: maximum deck displacement from 24 profile realisations, filtered at 20 Hz.

Appendix C. SINGLE-TRACK BRIDGES WITH REDUCED CROSS-SECTION
162
Figure C.32: Beam bridges: maximum wheel unloading from 24 profile realisations, unfiltered.

C.3. HIGHER TRACK QUALITY
163
Figure C.33: Beam bridges: maximum wheel unloading from 24 profile realisations, filtered at 20 Hz.

Appendix C. SINGLE-TRACK BRIDGES WITH REDUCED CROSS-SECTION
164
Figure C.34: Beam bridges: maximum car body acceleration from 24 profile realisations, unfiltered.

165
TRITA‐BKN. Report 165, 2017
ISSN 1103‐4289
ISRN KTH/BKN/R‐‐165‐‐SE
www.kth.se