rick meeker, p.e. florida state university, center for ... pv studies of florida ... circuit 345 to...
TRANSCRIPT

Solar Forum 2013 High Penetration
F e b 1 3 - 1 4 , S a n D i e g o , C A
HIGH PENETRATION SOLAR PV TEST CASES IN THE FLORIDA GRID
Rick Meeker, P.E. Florida State University, Center for Advanced Power Systems Houtan Moaveni Univ. of Central Florida, Florida Solar Energy Center
The Sunshine State Solar Grid Initiative SUNGRIN

Solar Forum 2013 High Penetration
F e b 1 3 - 1 4 , S a n D i e g o , C A 2
Project Sponsors and Partners
Florida State University Center for Advanced Power Systems
Solar Forum 2013 High Penetration
F e b 1 3 - 1 4 , S a n D i e g o , C A 3
Team FSU CAPS: Rick Meeker, P.E., Mischa Steurer, Ph.D., Hui (Helen) Li, Ph.D., Omar
Faruque, Ph.D., Karl Schoder, Ph.D., Peter McLaren, Ph.D., Harsha Ravindra*, Liming Liu, Ph.D., Yan Zhou*, Ye Yang*, Ran Mo*, Jianwu Cao*, Isaac Leonard, Krystal Wright, James Langston, Tim Chiocchio, Mike Andrus
• UCF FSEC: Dave Click, Bob Reedy, P.E., Houtan Moaveni
FMPA: Tom Reedy, Ann Beckwith
FPL: Daniel Waugh, John Shaffer
FRCC: Eric Senkowicz, P.E.
GRU: David Kvaltine, Darko Kovac, Hamid Rezaei, Ernie Hodge, Hector Zamot-Ayala
JEA: Jay Worley, Tom Ventresca
Lakeland Electric: Jeff Curry, Phuong Tran, Lien Nguyen, Jackie Hayes, Willie Mathis
OUC: Jennifer Szaro, Eva Reyes, Orangel Garcia, Sam Griffin, Orlando Alancastro
AMEC: Mike Allman
OSISoft: Len Uronis, Candace Keyes
SMA: Elie Nasr
* students

Solar Forum 2013 High Penetration
F e b 1 3 - 1 4 , S a n D i e g o , C A 4
Focus Areas
PV and load variability characterization and impact Power system circuit model development
(distribution and transmission; Florida circuits) High-penetration PV impact analysis with FL utility
circuit models and data Development and testing (including HIL) of Power
electronics, storage, and control solutions and strategies
Outreach and engagement

Solar Forum 2013 High Penetration
F e b 1 3 - 1 4 , S a n D i e g o , C A 5
PV Variability at High-Pen Sites Data: • Satellite: SolarAnywhere data at 1 km spatial
and 1-min temporal resolution • Ground Measurements: PV site measured
data, typically 1 min., 15 min. Approach: • Classify and compare variability, temporal and
geographic, using Variability Index • Distribution of ramps of irradiance and
modeled power output • Estimate the reduction in variability due to
geographic smoothing • Quantify the amplitude and frequency of
occurrence of fluctuations at each timescale using a stationary wavelet transform
Conclusion: • Geographic smoothing offers a strong benefit
over short timescales • This benefit decreases with longer timescales
and increased spatial correlation

Solar Forum 2013 High Penetration
F e b 1 3 - 1 4 , S a n D i e g o , C A 6
High-Penetration PV Studies of Florida Distribution Circuits
1
2
3 4
5
6
7
8 9
JEA Circuit 345 to Jacksonville Solar Plant (Ph. 1-2)
GRU Circuit 435 GRU Circuit 432 (Ph. 2-3)
NASA KSC Circuit (w/FPL) (Ph. 1, 4-5)
Lakeland Electric Lakeland Airport 2 circuits (Ph. 2-4)
OUC Stanton Solar (Ph. 3-4)

Solar Forum 2013 High Penetration
F e b 1 3 - 1 4 , S a n D i e g o , C A 7
Modeling Tools Real Time Digital Simulator (RTDS)
• Electromagnetic Transient Program (EMTP) solution • 3-phase time-domain solution • >110,000 MFLOPS; 14 “racks”, parallel processing
• EMTP type simulation covers load-flow, harmonic, dynamic, and transient regime • 50 µs timestep simulation in real-time; <2 µs possible for portions of the simulation • 66 real-time electrical nodes per “rack” x 14 racks = 924 nodes • Extensive digital and analog I/O for interfacing hardware to simulation (>2500 analog,
>200 digital). Can connect in real-time to any electrical node within the simulation.
OpenDSS (EPRI) • Frequency domain solution – power flow, dynamics, harmonics • Running from MATLAB (where other processing, analysis, and plotting occurs)
PSSE (Siemens PTI) • Phasor-based load flow • Primarily used for transmission grid modeling
Solar Forum 2013 High Penetration
F e b 1 3 - 1 4 , S a n D i e g o , C A 8
Model Validation Approaches and Challenges Software based validation
• Cross-validation against other model results from SynerGEE and OpenDSS • Both steady-state and fault situations were compared (RTDS vs. OpenDSS
and RTDS vs. Synergee) • Fault currents at different locations provided by the utility are compared
against simulation results
Field measurement based validation • Voltage, current, real and reactive power at substation and along circuit • Synchronized data from 3-5 locations are sought • Imperfect knowledge of load variation along circuit and across phases
• Circuit load at substation and recloser (if present) known from field msmt.’s • Loads distributed based on the transformer’s kVA ratings and utility estimates
of typical transformer loading vs. load type (residential / commercial)
Solar Forum 2013 High Penetration
F e b 1 3 - 1 4 , S a n D i e g o , C A 9
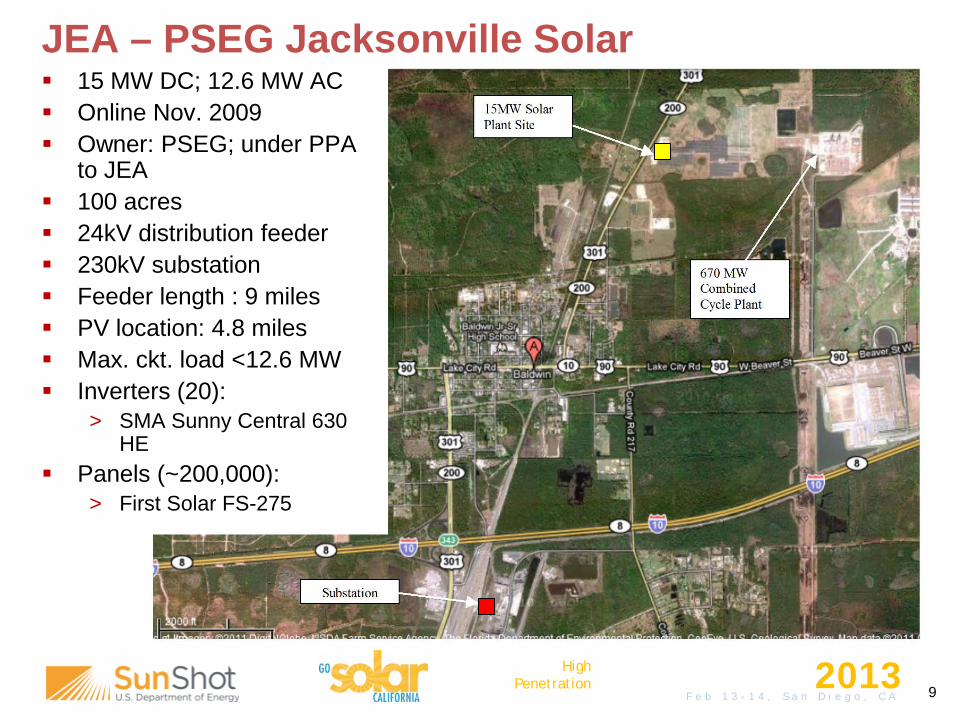
JEA – PSEG Jacksonville Solar 15 MW DC; 12.6 MW AC Online Nov. 2009 Owner: PSEG; under PPA
to JEA 100 acres 24kV distribution feeder 230kV substation Feeder length : 9 miles PV location: 4.8 miles Max. ckt. load <12.6 MW Inverters (20):
> SMA Sunny Central 630 HE
Panels (~200,000): > First Solar FS-275

Solar Forum 2013 High Penetration
F e b 1 3 - 1 4 , S a n D i e g o , C A 10
JEA Circuit Model Validation Power flow validation against field measurements
For simulation runs at four different time periods, various times of day: Voltage at substation breaker in agreement within
1.97% to 2.21% Voltage at PV plant in agreement within 1.25% to
1.56% Current at substation breaker in agreement within
3.24% to 4.92%

Solar Forum 2013 High Penetration
F e b 1 3 - 1 4 , S a n D i e g o , C A 11
JEA Circuit Model – Voltage Profile Analysis • Examined voltage profile for varying X/R ratio,
• Circuit X/R is about 4.5 • At higher X/R (>7), low voltages would occur beyond
~7 km out • Examined voltage for varying load, and PV production,
• With loading greater than 8 MVA, at low PV production, and 11 MVA, at high PV production, it is possible to see low voltages on the feeder
• Examined voltage regulation, • With no regulation (actual circuit), traditional
regulation, and PV participation, single plant vs. multiple plants,
• Without regulation, using severe load swing, slightly low voltage can occur at end of feeder, but overall voltage tends to be quite stable and in limits
• Traditional regulation alleviates somewhat • PV regulation exhibits very good control (in simulation) • Multiple PV plants – concern with control interaction
0 2 4 6 8 10 12 14
0.86
0.88
0.9
0.92
0.94
0.96
0.98
1
1.02
1.04
1.06
Voltage profile for different loadings on the feeder
Length of the feeder in km
2.24.46.68.811.113.315.517.720.0
Service voltage upper limit 1.05pu
Service voltage lower limit 0.96pu
Volta
ge in
pu
PV power at 3 MW
Upper limit of service voltage (1.058pu)
Regulation Upper limit (1.03 pu)
Near Substation
Near PV
End of feeder

Solar Forum 2013 High Penetration
F e b 1 3 - 1 4 , S a n D i e g o , C A 12
Protection Impact Analysis for JEA Feeder & Substation Relay settings provided by JEA Substation & protection modeled in RTDS
• 2-Rack real time (60 µs) case • 5-Rack non-real time (1 µs) case with detailed
feeder data PV inverters are current limited to 1.3 p.u. Substation, which has strong source (230kV). Various types of faults applied at different
locations on substation for, • NO PV penetration. • PV penetration on 1 feeder. • PV penetration on many feeders.
Impact of PV location with respect to the fault location also studied
Conclusions: No sympathetic tripping on the PV feeder
breaker from adjacent feeder fault Results specific to this site. Need to examine
others
Phase A
Phase C
Phase B
Phase A
Phase B
Phase C
Current through breaker 344 for fault on FDR 344, Phase A, with 0.1 ohm fault impedance
Fault current from 12.6 MW PV system on FDR 345, due to
fault on FDR 344 Phase A

Solar Forum 2013 High Penetration
F e b 1 3 - 1 4 , S a n D i e g o , C A 13
GRU Circuit 435 Feeder (“6th St. Solar)
Substation Voltage Reg. Recloser Capacitors PV (large)
12.47 kV circuit with overhead primary about 4.5 miles.
Peak loading on the feeder 9 MVA.
Peak PV installed capacity 2.6MW distributed:
Recloser at around 2.2 miles from substation.
Four capacitor banks Voltage regulator installed
near substation. A fairly typical mix of
residential and commercial loads
Solar Forum 2013 High Penetration
F e b 1 3 - 1 4 , S a n D i e g o , C A 14
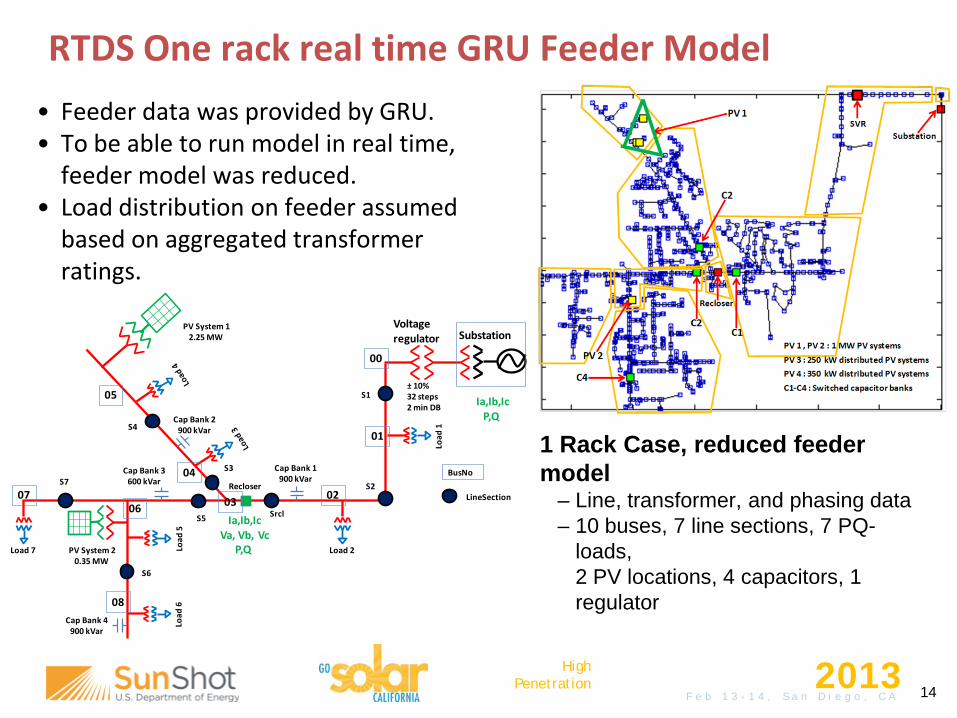
RTDS One rack real time GRU Feeder Model
1 Rack Case, reduced feeder model
– Line, transformer, and phasing data – 10 buses, 7 line sections, 7 PQ-
loads, 2 PV locations, 4 capacitors, 1 regulator
Load 2
Load
1
Load 7 Load
5Lo
ad 6
SubstationVoltageregulator
Ia,Ib,IcP,Q
Ia,Ib,IcVa, Vb, Vc
P,Q
Recloser
Cap Bank 1900 kVar
Cap Bank 2900 kVar
Cap Bank 3600 kVar
Cap Bank 4900 kVar
PV System 12.25 MW
PV System 20.35 MW
± 10% 32 steps2 min DB
S1
S2
Srcl
S3
S5
S4
S6
S7
00
01
0203
04
05
0607
08
BusNo
LineSection
• Feeder data was provided by GRU. • To be able to run model in real time,
feeder model was reduced. • Load distribution on feeder assumed
based on aggregated transformer ratings.

Solar Forum 2013 High Penetration
F e b 1 3 - 1 4 , S a n D i e g o , C A 15
0 10 20 30 40 50 60200220240260280
Phase A
0 10 20 30 40 50 60220240260280300
Phase B
Cur
rent
in A
MeasuredSimulated
0 10 20 30 40 50 60240
260
280
300
320Phase C
Time in mins
• Compared RTDS power flows against field data at breaker, recloser, and PV plant.
• Results of one hour simulation validation case for 5/14/2012 from 4.00 – 5.00 P.M.
• Average loading 7 MW for duration.
• Figure shows plot of measured vs. simulated breaker currents for 3 phases for one hour.
Field Measurement Based Validation of GRU Circuit 435
• Voltages at recloser location agree within less than 2.5% error • Average error for currents varies between 1.97% and 8.46%, depending upon
phase and location, with maximum error of 16.11%
Solar Forum 2013 High Penetration
F e b 1 3 - 1 4 , S a n D i e g o , C A 16
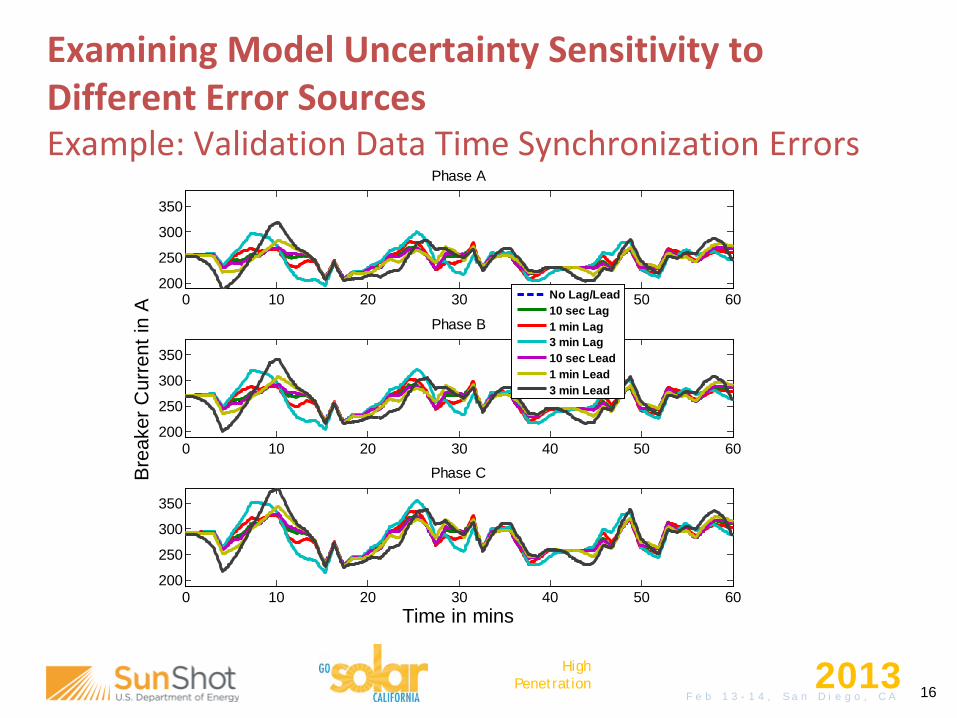
0 10 20 30 40 50 60200
250
300
350
Phase A
0 10 20 30 40 50 60200
250
300
350
Phase B
Bre
aker
Cur
rent
in A
0 10 20 30 40 50 60200
250
300
350
Phase C
Time in mins
No Lag/Lead10 sec Lag1 min Lag3 min Lag10 sec Lead1 min Lead3 min Lead
Examining Model Uncertainty Sensitivity to Different Error Sources Example: Validation Data Time Synchronization Errors
Solar Forum 2013 High Penetration
F e b 1 3 - 1 4 , S a n D i e g o , C A 17
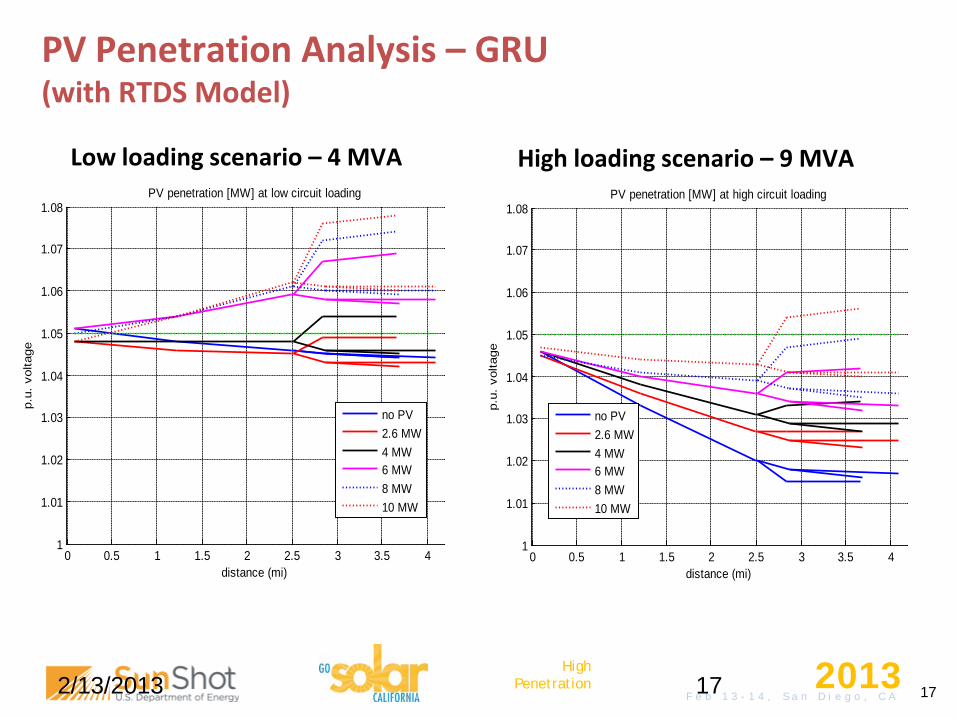
PV Penetration Analysis – GRU (with RTDS Model)
High loading scenario – 9 MVA
2/13/2013 17
0 0.5 1 1.5 2 2.5 3 3.5 41
1.01
1.02
1.03
1.04
1.05
1.06
1.07
1.08
distance (mi)
p.u.
vol
tage
PV penetration [MW] at high circuit loading
no PV2.6 MW4 MW6 MW8 MW10 MW
0 0.5 1 1.5 2 2.5 3 3.5 41
1.01
1.02
1.03
1.04
1.05
1.06
1.07
1.08
distance (mi)
p.u.
vol
tage
PV penetration [MW] at low circuit loading
no PV2.6 MW4 MW6 MW8 MW10 MW
Low loading scenario – 4 MVA

Solar Forum 2013 High Penetration
F e b 1 3 - 1 4 , S a n D i e g o , C A 18
PV Participation in Voltage Regulation GRU Circuit – High Loading
2/13/2013 18
0 0.5 1 1.5 2 2.5 3 3.5 40.99
1
1.01
1.02
1.03
1.04
1.05
1.06
1.07
1.08
distance (mi)
p.u.
vol
tage
Voltage profile for different regulation schemes - High loading scenario
No RegulationConstant pfConstant QSet Point V primaryGerman LV curve 0.90 pfVolt - Var CurveVolt - pf curve 0.95Volt - pf curve 0.90
0 0.5 1 1.5 2 2.5 3 3.5 40.99
1
1.01
1.02
1.03
1.04
1.05
1.06
1.07
1.08
distance (mi)
p.u.
vol
tage
Voltage profile for different regulation schemes - Low loading scenario
No RegulationConstant pfConstant QSet Point V primaryGerman LV curve 0.90 pfVolt - Var CurveVolt - pf curve 0.95Volt - pf curve 0.90
High loading scenario – 9 MVA Low loading scenario – 4 MVA

Solar Forum 2013 High Penetration
F e b 1 3 - 1 4 , S a n D i e g o , C A 19
Dynamic Model of the Florida Transmission Grid PSSE Validation of 154-bus Model Against Very Large Utility Planning and Event Analysis Model • Developing reduced size FL grid model that
captures important behavior, for investigation into grid changes like high-pen. PV effects
• Currently validating 154 bus PSSE model • A model of <300 busses to be built in RTDS

Solar Forum 2013 High Penetration
F e b 1 3 - 1 4 , S a n D i e g o , C A 20
Summary Some Observations from Work-to-date - Modeling Models that capture dynamic behavior will be needed for
investigation of control behavior and interactions Distribution circuits often exhibit significant phase imbalance;
(individual) phase analysis will be needed in some cases Validation of current measurements (more sensitive) in
addition to voltage provides increased confidence in model Common sources of modeling and simulation error:
• Field measurement time synchronization • Load estimates (spatial, temporal, and per phase) • Operation and settings of regulation devices

Solar Forum 2013 High Penetration
F e b 1 3 - 1 4 , S a n D i e g o , C A 21
Summary Some Observations from Work-to-date - Analysis Percent penetration and 15% screen is a poor metric Seeking a classification of circuit types and more appropriate
metrics than % penetration – must look at many circuits first PV can be very effective (usually exceeding performance using
traditional means) in voltage regulation System dynamics and interaction of regulation equipment can
cause issues Control and protection schemes, algorithms and settings –
challenge and opportunity Hardware-in-the-loop simulation is useful for evaluation and
testing of dynamic behavior in system context

Solar Forum 2013 High Penetration
F e b 1 3 - 1 4 , S a n D i e g o , C A 22
Future Work Arrive at meaningful penetration metrics (screens) through
analysis of a large no. of circuits Reduce, refine, and streamline modeling and analysis
processes and tools Develop and demonstrate hardware-in-the-loop evaluation
methods and rationale for improved anti-islanding and islanded operation inverter testing
Examine transmission level benefits (e.g. “230 kV DG”) through integrating distribution and transmission simulation-assisted analysis
Develop a basis for PV capacity credit PV as mitigation of FIDVR
Solar Forum 2013 High Penetration
F e b 1 3 - 1 4 , S a n D i e g o , C A 23
Publications Zhou, Y., Li, H., Liu, L., “Integrated Autonomous Voltage Regulation and Islanding Detection for High Penetration PV
Applications”, IEEE Transactions on Power Electronics, Vol 28., No. 6, June 2013. Langston, J., Schoder, K., Steurer, M., Faruque, O., Hauer, J., Bogdan, F., Bravo, R., Mather, B., Katiraei, F., “Power
hardware-in-the-loop testing of a 500 kW photovoltaic array inverter”, IECON 2012 - 38th Annual Conference on IEEE Industrial Electronics Society, Oct. 2012.
Ravindra, H., Faruque, O., McLaren, P., Schoder, K., Steurer, M., Meeker, R., “Impact of PV on Distribution Protection System”, Proceedings, North American Power Symposium, Sept. 2012.
Liu,. X., Aichhorn, A., Liu, L., Li, H., “Coordinated Control of Distributed Energy Storage System with Tap Changer Transformers for Voltage Rise Mitigation Under High Photovoltaic Penetration”, IEEE Transactions on Smart Grid, Vol. 3., No. 2, June 2012.
Ravidra, H., Faruque, O., Schoder, K., Steurer, M., McLaren, P., Meeker, R., “Dynamic Interactions Between Distribution Network Voltage Regulators for Large and Distributed PV Plants”, Proceedings of the IEEE Power Engineering Society, Transmission and Distribution Conference and Exposition, Orlando, FL, IEEE , May 2012.
Click, D., Moaveni, H., Davis, K., Meeker, R., Reedy, R., Pappalardo, A., Krueger, R., “Effects of Solar Resource Variability on the Future Florida Transmission and Distribution System”, ”, Proceedings of the IEEE Power Engineering Society, Transmission and Distribution Conference and Exposition, Orlando, FL, IEEE , May 2012.
Meeker, R., Domijan, A., Islam, M., Omole, A., Islam, A., Damnjanovic, A., “Characterizing Solar PV Output Variability and Effects on the Electric System in Florida, Initial Results”, Proceedings of the 5th International Conference on Energy Sustainability, ASME, Aug., 2011.
Meeker, “Integrating High-Penetration Levels of Renewables into the Grid – What we Know Now”, accepted, ASME Energy Committee Colloquium, June 2012.
Click, et al, “Effects of Solar Resource Variability on the Future Florida Transmission and Distribution System”, accepted, IEEE PES T&D, May 2012.
Allman, M., Meeker, R., Reedy, B., Senkowicz, E., “Integrating Solar PV into the Grid”, Relay, the quarterly magazine of the Florida Municipal Electric Association (FMEA), Winter 2009.

Solar Forum 2013 High Penetration
F e b 1 3 - 1 4 , S a n D i e g o , C A
Q &A AND DISCUSSION
Contact:
R. H. (Rick) Meeker, Jr., P.E. [email protected] 850-645-1711
http://www.caps.fsu.edu/sungrin