review aquaculture: global status and...
TRANSCRIPT

on July 2, 2018http://rstb.royalsocietypublishing.org/Downloaded from
Phil. Trans. R. Soc. B (2010) 365, 2897–2912
doi:10.1098/rstb.2010.0170
Review
* Autho
While ththe viewand do
One conworld in
Aquaculture: global status and trendsJohn Bostock1,*, Brendan McAndrew1, Randolph Richards1,
Kim Jauncey1, Trevor Telfer1, Kai Lorenzen2, David Little1,
Lindsay Ross1, Neil Handisyde1, Iain Gatward1 and Richard Corner1
1Institute of Aquaculture, University of Stirling, Stirling FK9 4LA, UK2Division of Biology, Imperial College London, Ascot, UK
Aquaculture contributed 43 per cent of aquatic animal food for human consumption in 2007(e.g. fish, crustaceans and molluscs, but excluding mammals, reptiles and aquatic plants) andis expected to grow further to meet the future demand. It is very diverse and, contrary to many per-ceptions, dominated by shellfish and herbivorous and omnivorous pond fish either entirely or partlyutilizing natural productivity. The rapid growth in the production of carnivorous species such assalmon, shrimp and catfish has been driven by globalizing trade and favourable economics oflarger scale intensive farming. Most aquaculture systems rely on low/uncosted environmentalgoods and services, so a critical issue for the future is whether these are brought into companyaccounts and the consequent effects this would have on production economics. Failing that,increased competition for natural resources will force governments to allocate strategically orleave the market to determine their use depending on activities that can extract the highestvalue. Further uncertainties include the impact of climate change, future fisheries supplies (forcompetition and feed supply), practical limits in terms of scale and in the economics of integrationand the development and acceptability of new bio-engineering technologies.
In the medium term, increased output is likely to require expansion in new environments, furtherintensification and efficiency gains for more sustainable and cost-effective production. The trendtowards enhanced intensive systems with key monocultures remains strong and, at least for theforeseeable future, will be a significant contributor to future supplies. Dependence on externalfeeds (including fish), water and energy are key issues. Some new species will enter productionand policies that support the reduction of resource footprints and improve integration could leadto new developments as well as reversing decline in some more traditional systems.
Keywords: aquaculture; resources; integration; development; competitiveness
1. THE AQUACULTURE SECTOR: KEY FEATURESAND TRENDS(a) Output, value and regional overview
(i) Current statusGlobal aquaculture (figure 1) has grown dramaticallyover the past 50 years to around 52.5 million tonnes(68.3 million including aquatic plants) in 2008 worthUS$98.5 billion (US$106 billion including aquaticplants) and accounting for around 50 per cent of theworld’s fish food supply. Asia dominates this prod-uction, accounting for 89 per cent by volume and 79per cent by value, with China by far the largestproducer (32.7 million tonnes in 2008). The rapidgrowth in this region has been driven by a variety offactors, including pre-existing aquaculture practices,
r for correspondence ([email protected]).
e Government Office for Science commissioned this review,s are those of the author(s), are independent of Government,not constitute Government policy.
tribution of 23 to a Theme Issue ‘Food security: feeding the2050’.
2897
population and economic growth, relaxed regulatoryframework and expanding export opportunities.
Aquaculture development in Europe and NorthAmerica was rapid during the 1980s–1990s but hassince stagnated, probably owing to regulatory restric-tions on sites and other competitive factors, althoughas markets for fish and seafood they have continuedto grow.
(ii) Growth ratesThe growth rate of aquaculture between 1970 and2006 was 6.9 per cent per annum (FAO 2009a),although it appears to be slowing (average 5.8%between 2004 and 2008). This reflects the typical pat-tern, which can be seen at the national level, ofadoption followed by rapid growth, which then slowswith increasing competition and other constraints.
The highest relative growth rates between 2006and 2007 are in countries with relatively lowproduction, such as Lesotho (6450%), Rwanda(909.5%) and Ukraine (590.8%). Although thesecan be a useful indicator of new initiatives, smaller per-centage growth in countries with already substantial
This journal is # 2010 The Royal Society

Africa 1.8%
Americas 4.6%Asia 88.9%
(a)(b)
Europe 4.4%Oceania 0.3%
other 11.1%
Africa 2%
Americas 9%Asia 79%
Europe 9%Oceania 1%
other 21%
Figure 1. Global aquaculture production by region. Source: FAO (2010). (a) Aquaculture by quantity 2008 (excluding aquaticplants). (b) Aquaculture by value 2008 (excluding aquatic plants). Dark blue, Africa; brown, Americas; light green, Asia;violet, Europe; light blue, Oceania.
Figure 2. Average annual growth rate of all aquaculture production in terms of quantity over a 5-year period. Calculated usingthe difference between mean values from the periods 2000–2002 and 2005–2007. Red, greater than 210%; orange, 23 to210%; rose, 0 to 23%; violet, 0–3%; light blue, 3–10%; dark blue, greater than 10%. Source: FAO (2009b).
Figure 3. Average annual growth rate of all aquaculture production in terms of value over a 5-year period. Calculated using thedifference between mean values from the periods 2000–2002 and 2005–2007. Red, greater than 210%; orange, 23 to210%; rose, 0 to 23%; violet, 0–3%; light blue, 3–10%; dark blue, greater than 10%. Source: FAO (2009b).
2898 J. Bostock et al. Review. Aquaculture
on July 2, 2018http://rstb.royalsocietypublishing.org/Downloaded from
production has a greater impact. For instance, 5.2 percent growth in China represented 52.3 per cent of thetotal increase in global aquaculture supply for 2007.The second most important country in this respectwas Vietnam, which contributed 16.7 per cent of theadditional aquaculture production with a growth rateof 30.1 per cent (figures 2 and 3).
A small number of countries with substantiveproduction experienced contraction in 2007, mostnotably Thailand, Spain and Canada. Reasons forthis were mainly market and competitiveness related,although disease and one-off environmental eventscan also play a role in single-year figures. Overall,these reductions amounted to the equivalent of
Phil. Trans. R. Soc. B (2010)
1.6 per cent of global supplies (i.e. more thancompensated by growth elsewhere).
(iii) Species producedExcluding aquatic plants, 310 species were recordedby FAO as cultured in 2008. However, the top fivespecies accounted for around 33 per cent of theoutput (19% by value), the top 10 for 53 per cent(45% by value) and the top 20 species for 74 percent of production by volume (63% by value). Fresh-water fish production is dominated by various speciesof carp, although tilapia and later pangasius catfishhave become more significant (table 1). Coastal

carps, barbelsand other cyprinids
miscellaneousfreshwater fishes
clams, cockles, arkshells
oysters
shrimps, prawns
tilapias and other cichlids
salmons, trouts, smelts
mussels
scallops, pectens
freshwatercrustaceans
miscellaneousmarine molluscs
others
carps, barbels andother cyprinids
shrimps, prawns
salmons, trouts,smelts
miscellaneousfreshwater fishes
freshwater crustaceans
clams, cockles, arkshells
tilapias and other cichlids
miscellaneous coastal fishes
oysters
scallops, pectens musselsothers
(a)
(b)
Figure 4. Aquaculture production by output and value for major species groups in 2008. Source: FAO (2010), excludingaquatic plants. (a) Aquaculture by output 2008 (excluding aquatic plants). (b) Aquaculture by value 2008 (excluding plants).
Table 1. Most significant species (more than 1 million tonnes in 2008), by quantity and value. Developed from Fishstat dataFAO (2010). nei, not elsewhere included.
number ofcountries
output
(tonnes)
% change value, ’000
US$
US$
per kg
% change
2008 1 year 10 years mean 2008 2008 1 year 10 years
silver carp 50 3 848 258 5.5 2.8 4 864 708.1 1.26 13.4 8.5grass carp (¼white amur) 57 3 775 267 4.3 4.0 4 797 278.6 1.27 12.2 9.5cupped oysters nei 18 3 385 382 24.5 3.1 2 023 425.8 0.60 7.8 21.3Japanese carpet shell 13 3 141 851 3.2 13.4 3 185 467.0 1.01 14.7 7.7common carp 100 3 000 529 5.5 3.7 3 758 752.0 1.25 7.2 6.7
Nile tilapia 74 2 334 432 8.6 22.2 3 208 560.8 1.37 8.2 27.5bighead carp 28 2 321 513 7.2 6.3 2 975 411.8 1.28 14.2 13.0catla 5 2 281 838 7.9 31.1 3 303 123.8 1.45 11.4 49.7whiteleg shrimp 36 2 259 183 21.7 106.7 8 985 288.8 3.98 20.8 78.1Atlantic salmon 31 1 456 721 5.6 11.2 7 204 151.8 1.44 1.0 23.6
pangas catfishes nei 5 1 380 702 52.4 220.1 1 994 685.4 1.43 49.1 197.8freshwater fishes nei 97 1 247 859 225.1 21.2 1 778 408.2 1.15 229.1 1.6roho labeo 6 1 159 454 19.6 7.6 1 334 192.7 1.42 20.1 20.5scallops nei 7 1 137 379 22.4 9.9 1 615 936.3 1.26 9.1 10.2
Review. Aquaculture J. Bostock et al. 2899
Phil. Trans. R. Soc. B (2010)
on July 2, 2018http://rstb.royalsocietypublishing.org/Downloaded from

2900 J. Bostock et al. Review. Aquaculture
on July 2, 2018http://rstb.royalsocietypublishing.org/Downloaded from
aquaculture primarily comprises whiteleg and, to alesser extent, tiger shrimp, oyster, scallop and mussels,with Atlantic salmon as the leading intensively farmedmarine fish.
(b) Aquaculture systems and environments
(i) Freshwater ponds and tanksFreshwaters were the source for 60 per cent of theworld aquaculture production in 2008 (56% byvalue), despite they only constituting 3 per cent ofthe planet’s waters and only 0.3 per cent of thatbeing surface water (figure 4). Of this, 65.9 per centwere carp and other cyprinids which are mostly cul-tured in ponds using semi-intensive methods (waterfertilization with inorganic and organic fertilizers andsupplementary feeding with low-protein materials).Salmonid farming (mainly rainbow trout in fresh-water) constituted only 1.5 per cent, typically usingponds, concrete raceways and other types of tankthat require higher throughputs of water to maintaina good water quality. Stocking densities are typicallytwo to five times as high as in semi-intensive pondsand fully formulated diets are fed. Species such as tila-pia (7.6% of freshwater production) are cultured in amix of systems, from extensive to highly intensive.
(ii) Freshwater cagesCage-based aquaculture in both freshwater lakes andrivers has flourished in many countries, althoughsome are now regulating use due to concerns overenvironmental impacts. In Egypt, over 10 per cent offreshwater aquaculture production in 2005 was fromcages in the River Nile. However, by 2006, almost80 per cent were removed (down from 12 495 to2702). Rapid expansion of cage-based catfish farmingin the Mekong is giving similar cause for concern, buthas not led to such a drastic regulatory response,although the expansion of pond farms is now apparent.In unregulated conditions, eutrophication from cagefarms can impact on farms downstream, on otherwater uses and ecosystems in general.
Globally, Asia and especially China has the greatestfreshwater aquaculture production in relation to landarea, although some European and African countriesare also significant (figure 5). The Americas in par-ticular are notable for relatively low freshwateraquaculture production per unit area.
(iii) Coastal ponds and tanksCoastal ponds and lagoons and have been exploited insimple ways for fish, mollusc, crustacean and seaweedproduction for centuries. However, production hasbeen expanded and intensified over the past 30 years.In warmer countries, the penaeid shrimps havetended to dominate brackish-water culture due tohigh-value, short production cycles and accessibletechnologies. Production has increased almost expo-nentially since the mid-1970s (figure 6) and nowaccounts for about 58 per cent of aquaculture prod-uction from brackish water (72% by value).1 Inmore temperate climates, brackish-water fish speciesare the main crop with varying degrees ofintensification.
Phil. Trans. R. Soc. B (2010)
Further expansion of brackish-water aquaculture ispossible, especially in relatively unexploited regionsof Africa and Latin America. However, a strengtheningenvironmental lobby as well as competition for landresources in some areas is likely to limit developmentsof the kind seen in some Asian countries.
Coastal aquaculture using onshore tanks has devel-oped in some areas (e.g. South Korea, Spain, Iceland),usually where other types of aquaculture would not bepossible. Most use pumped water that passes throughthe tanks once before being discharged to the environ-ment. However, an increasing number treat and reusethe water flow, providing greater isolation from theenvironment and hence biosecurity.
(iv) Coastal cage farmsFor marine fish species with mid to high-value, floatingcages have proved the most cost-effective productionsystem across a range of farm sizes and environments(as determined by conventional financial appraisal;Halwart et al. 2007). The open exchange of waterthrough the nets replenishes oxygen and removes dis-solved and solid wastes. Most rely on feeding eithercomplete diets or, for some species, trash fish. Cageunits can be sized and arranged flexibly to meet theneeds of the farm. Expansion is straightforward byincreasing cage volume or number of units. Largercages, especially in more exposed locations, becomedifficult and costly to manage with manual labour, soa range of specialist service vessels and equipmenthas been developed, especially in the salmon sector,to overcome such constraints (figure 7). Economiesof scale supported by mechanization have helped toreduce production costs substantially.
(v) Marine molluscs and aquatic plantsThe cultivation of marine molluscs (mainly bivalves)and seaweed using simple methods has a long historyin many countries and has become widely establishedas a coastal livelihood activity involving high labourinputs. Since the 1990s, however, there has been sig-nificant upscaling of production and the introductionof specialized equipment allowing larger sites andgreater labour efficiencies. Total output of molluscsfrom coastal waters in 2008 was 12.8 million tonnesvalued at US$12.8 billion. A further 15.7 milliontonnes of seaweeds were cultivated in coastal watersin 2008 valued at US$7.4 billion.
2. RESOURCE AND DEVELOPMENTINTERACTIONS(a) Factors in aquaculture development
The development of aquaculture depends on the inter-action of a wide variety of factors as summarized intable 2.
It is instructive to study individual aquacultureindustries in relation to these factors. The primary fac-tors are market demand (and competition), theavailability of environmental resource, the develop-ment or transfer of appropriate technology and afavourable business environment that allows entrepre-neurs to profit from their investment in the sector.However, there are many examples of failure of

Review. Aquaculture J. Bostock et al. 2901
on July 2, 2018http://rstb.royalsocietypublishing.org/Downloaded from
development, especially in Africa and parts of LatinAmerica, due to the lack of well-developed marketsor the ability to reach them due to infrastructureissues, including the lack of adequate quality controlsfor export. Weak institutional systems and lack ofinvestment have also been important constraints inmany countries.
(b) Sector participants
The aquaculture sector overall is highly diverse andfragmented, ranging from smallholder ponds inAfrica providing a few kilos of fish per year to inter-national companies with annual turnover in excess ofUS$1 billion. An estimated 9 million people wereengaged in fish farming in 2006 (FAO 2009a),around 94 per cent in Asia. Average output perperson per year was 5.96 tonnes, but this varied from0.57 tonnes in Indonesia, where aquaculture systemstend to be labour intensive, to 161.22 tonnes inNorway, which is highly industrialized (table 3).
For many participants, aquaculture is one of a morelimited range of economic activities available in thespecific coastal or rural location and is particularlyimportant in countries such as Bangladesh, Indiaand Vietnam, as both subsistence and cash crop. Thenumber of small–medium enterprises and sole tradersin Europe is also high, with 13 139 companies with anaverage of 2.6 full-time employees and turnover ofaround E270 000 (Framian 2009). However, trendstowards industrialization and consolidation are strongfor some species, especially commodity products thatare internationally marketed. For instance, four com-panies now account for 70 per cent of Scottishsalmon production and two for over 50 per cent ofindustry value.
There are critical linkages between market chainstructure and viable company size. In Europe, the smal-lest companies tend to market directly to consumersand local hotels and restaurants, gaining a valuablepremium on normal wholesale market prices. This isnot an option for slightly larger producers who wouldsaturate local markets. Scale economies become moreimportant when producers are competing in larger mar-kets and when there are minimum purchase quantitiesimposed by much larger buyers. The formation ofproducer cooperatives has sometimes enabled smallercompanies to work with more consolidated marketchains, most frequently when consolidation of sites isnot physically possible.
International market chains are also impacting onpreviously small-scale producers in Asia. For instance,consolidation is apparent in the Vietnamese catfishindustry, mainly driven by the implementation of west-ern quality standards, initially in processing, butincreasingly stretching into production. Elsewhere inAsia, complex chains involving many small companiesstill exist. Efficiency comes through specialization andcompetition on flexibility and quality of service. A keyexample of this is the production of live marine fish forrestaurants and specialist markets in Korea, HongKong, China and other parts of Southeast Asiawhere values are very different from those of theWestern markets.
Phil. Trans. R. Soc. B (2010)
(c) Resource interactions and dependencies
(i) Land water and energyWhile beneficial in many ways, the growth of aquacul-ture is increasing pressure on natural resource inputs,notably water, energy and feed, although sites in abroader sense are also an issue. There is also the ques-tion of the use of, and impact on, environmentalservices, particularly for the dispersion and treatmentof farm effluents. Aquaculture systems are very diversewith respect to their dependence on these resources(table 4).
Freshwater farming uses a range of systems, fromstatic water ponds through to high flow-through tanks.Most involve intake of water from the environmentand a post-production effluent stream, so that waterconsumption does not equate to water intake. However,the quality of discharge water is usually diminished andwater can be lost through evaporation and seepage. As aworst case, pond systems in tropical countries can lose20 per cent of their volume per day (Beveridge 2004).However, pond aquaculture can also contribute towater management as it acts to catch and store surfacewater (rain and run-off) that might otherwise be lostfrom local agroecosystems or which might causedamaging floods (e.g. in the Czech Republic).Implementation of water reuse and recirculation sys-tems can reduce consumption substantially, althoughusually at the cost of higher energy inputs.
The majority of freshwater aquaculture is pond basedusing semi-intensive methods that rely on controlledeutrophication for their productivity, using a wide var-iety of organic and inorganic fertilizers as well assupplementary feedstuffs. The production of feedmaterials for aquaculture, particularly grain and similarcrops, incurs additional freshwater use (up to3000 m3 tonne21 according to Verdegem & Bosma2009). Solid wastes produced from such systems oftenhave a use as fertilizers for other crops. Dissolvednutrients can often be lost through necessarywater replacement regimes and sometimes causeproblems in areas with extensive aquaculture productionor with otherwise oligotroiphic or mesotrophic environ-ments. Better optimization of freshwater productionsystems with respect to water and feed managementcould triple production without increasing freshwaterusage according to Verdegem & Bosma (2009).
Given the presently increasing pressures on fresh-water supplies, future aquaculture developmentmight be expected to utilize more abundant brackishand sea water resources. However, environmentalissues are no less complex.
(ii) Productivity in relation to energy inputsThe energy cost and linked implications for carbonemissions of aquaculture activities is receivinggreater attention. A distinction needs to be drawnin analysis between direct energy use (e.g. fueland electricity consumed directly in the productionprocess) and the more comprehensive approachesto auditing energy inputs. For instance, these mayinclude consideration of industrial energy (energyused in the manufacture and supply of equipment,feeds and other inputs) or embodied energy,

Figure 5. Mean aquaculture production from freshwater systems as a function of land area (kg km22 yr21) for the period
2005–2007. Dark green, 0–50 kg km22; light green, 50–100 kg km22; yellow, 100–250 kg km22; light orange,250–500 kg km22; dark orange, 500–1000 kg km22; red, 1000–3000 kg km22; maroon, greater than 3000 kg km22.Source: FAO (2009b).
0
500 000
1 000 000
1 500 000
2 000 000
2 500 000
3 000 000
3 500 000
4 000 000
4 500 000
1960
1963
1966
1969
1972
1975
1978
1981
1984
1987
1990
1993
1996
1999
2002
2005
2008
prod
uctio
n (t
onne
s)
Figure 6. Total world production for culture of brackish-water species (blue) and for penaied shrimp (red). SourceFAO (2010).
0
500
1000
1500
2000
2500
3000
3500
4000
0
100 000
200 000
300 000
400 000
500 000
600 000
700 000
800 000
900 000
1994
1995
1996
1997
1998
1999
2000
2001
2002
2003
2004
2005
2006
2007
num
ber o
f em
ploy
ees
inon
grow
ing
prod
ucti
on
prod
ucti
on (
tonn
es)
Figure 7. Development of production volume of Atlanticsalmon and rainbow trout in Norway and number ofemployees (blue), illustrating trends in industrializationof production (red) systems. Source: Fiskeridirektoratet(2008).
Figure 8. Mean production quantities from coastal aquaculture systems as function of coastline length (kg km21 yr21) for the
period 2005–2007. Dark green, less than 10 kg km21 yr21; light green, 10–25 kg km21 yr21; yellow, 25–50 kg km21 yr21;light orange, 50–100 kg km21 yr21; dark orange, 100–250 kg km21 yr21; red, 250–500 kg km21 yr21; maroon, greaterthan 500 kg km21 yr21. Source: FAO (2009b).
2902 J. Bostock et al. Review. Aquaculture
on July 2, 2018http://rstb.royalsocietypublishing.org/Downloaded from
which also takes into account photosynthesis andsunlight energy or calorific values, etc. Another con-sideration is whether the energy sources arerenewable or not.
Life cycle analysis (LCA) carried out by Tyedmers &Pelletier (2007) found energy dependence correlatedwith production intensity. This is mainly due to theenergy input in the production and delivery of feed(Gronroos et al. 2006). More variable is the energy
Phil. Trans. R. Soc. B (2010)
required for other on-farm activities which can rangefrom virtually zero up to about 3 kWh kg21. Forland-based farms, most of the power is likely to be pro-vided by electricity from the central grid. Cage-basedfarms rely mainly on diesel or other fossil fuel.Table 5 shows typical embodied energy levels andratios for different production systems, with seaweedand mussel culture requiring much more modestinput levels.

31
17
13
10
8
7
4
3
2
2
1
0 5 10 15 20 25 30 35
feeding carp
marine shrimp
tilapia
catfish
marine fish
salmon
freshwater crustaceans
trout
milkfish
misc. freshwater fish
eel
%
Figure 9. Estimated global compound aquafeed production in 2008 for major farmed species (as percentage of total aquafeedproduction, dry feed basis. Source: Tacon & Metian (in preparation).
27
20
14
7
6
5
6
4
6
4
24
23
17
17
6
5
2
5
0 5 10 15 20 25 30
shrimp
marine finfish
salmon
carps
trout
eel
catfish
tilapia
freshwater crustaceans
misc. freshwater fish
%
Figure 10. Estimated use of fish meal (percentage of dry feed basis) within aquafeeds in 2008. Blue, Tacon estimate 2008;
red, IFFO estimate 2007. Sources: Tacon & Metian (in preparation); IFFO (2008).
40
22
0
17
13
1
3
0
3
2
43
14
13
11
10
3
1
1
1
0 5 10 15 20 25 30 35 40 45 50
salmon
marine finfish
tilapia
trout
shrimp
milkfish
eel
catfish
freshwater crustaceans
misc. freshwater fish
%
Figure 11. Estimated global use of fish oil (percentage of dry feed basis) in 2008. Blue, Tacon 2008; red, IFFO 2007. Sources:Tacon & Metian (in preparation); IFFO (2008).
Review. Aquaculture J. Bostock et al. 2903
Phil. Trans. R. Soc. B (2010)
on July 2, 2018http://rstb.royalsocietypublishing.org/Downloaded from

Table 2. Factors in the development of the aquaculture sector. Developed from Muir & Young (1998).
factor implications
market demand good demand and high prices for selected species in traditional markets offering initial targets forproducers; steadily growing developed markets for major species (market competitiveness a central
factor in shaping viable production systems)environments initial availability of inland waters, lagoons, sheltered bays, with suitable water quality, production
temperatures, nutrient supply for shellfish and other systems (influenced by consideration ofenvironmental impacts, conflicts or synergies with other resource users and policy with respect toland and water area ownership or rental)
infrastructure available or improving transport, power, communications, access to major markets, good informationsystem; scientific support structure
technical capability emerging and rapidly establishing techniques for hatchery production, husbandry, feeds, ponds, cageand other culture systems; improvements to traditional systems, opportunities for integration with
other activities and sectorsinvestment local, national and regional private, commercial and institutional investment; incentives and support
schemes for development, and technical researchhuman resources initial nucleus of primary technical skills, developed through pioneer companies and development
centres; increasing level of management skills in core groups
institutional system generally positive and proactive environment, providing strategic research inputs, adapting to changingneeds of industry, development of legal and regulatory systems
Table 3. Examples of aquaculture employment, output and value. Adapted from FAO (2009a).
location
employment, ’000
growth % yr21
aquaculture, 2006
output, tonnes per pers value, US$ per pers2000 2006 million tonnes billion US$
world 7671.6 8662.6 2 51.65 78.76 5.96 9092China 3722.3 4502.8 3.2 34.43 38.42 7.65 8532Indonesia 2142.8 2275.0 1 1.29 2.25 0.57 989Norway 4.6 4.4 20.8 0.71 2.72 161.22 617 620
2904 J. Bostock et al. Review. Aquaculture
on July 2, 2018http://rstb.royalsocietypublishing.org/Downloaded from
(iii) Coastal zone pressures and ecosystem impactsAquaculture, especially in coastal zones, is frequentlyin competition with other uses of the resource thatcan often take precedence (e.g. tourism and portdevelopments; figure 8). However, there are alsocases where aquaculture has outcompeted otherusers, such as shrimp farming, which has comeunder scrutiny due to over-exploitation and destruc-tion of mangrove resources, as well as otherenvironmental impacts and serious disease problems.The wider ecosystem value of these environments isnow recognized and suitable protection given in mostregions, although much remains to be done withrespect to rebuilding lost area. More recent moves bythe shrimp industry inland have also caused problemswith saline intrusion into agricultural soils.
The development of marine fish farming in cageshas also raised concerns over wider environmental,ecosystem and biodiversity impacts. At modest scalesof development, these are hard to detect apart fromlocalized changes to sediments beneath the cages.Larger scale development has the potential for widerimpacts due to the release of nutrient or chemicalwastes directly into the environment, or the effects ofescaped fish or disease transfer on wild populations.
The most immediate problem is often conflictsbetween cage-based farming and other interests, suchas boating and navigation, recreation, preservation ofseascape scenery and protection of wildlife. InEurope, these issues are considered during the
Phil. Trans. R. Soc. B (2010)
licensing process or increasingly through the develop-ment of coastal zone plans. Similar issues apply tocoastal pond and pump-ashore tank systems. Recircu-lated water systems overcome a number of theseconstraints, but except for more specialist applicationshave so far been unable to compete financially.
(iv) FeedsMost mollusc culture requires no feed inputs and themajority of freshwater fish production utilizes low-protein, grain-based supplementary diets and organicfertilizers. Much of the crustacean farming, mostmarine species and other intensive fish aquaculturerequire a higher quality diet, usually containing fishmeal and often fish oil. Some aquaculture, notablytuna fattening and much of the marine cage culturein Asia, relies directly on wild-caught small pelagicfish with relatively low market price. The processtransforms fish protein from low to high value forhuman consumption. However, the efficiency of thisis both an ecological issue and one of social justice(e.g. consumers of farmed salmon and shrimp mayeffectively outcompete rural poor for this fish resource;Tacon & Metian 2009). Fish meal has also tradition-ally been used in intensive livestock rearing,especially pork and poultry, so the issues are notunique to aquaculture. However, it is aquaculturethat is taking a growing and majority share of thisresource as substitutes are more easily found forlivestock and poultry.

Table 4. Typical aquaculture resource demands by species. Sources: Muir & Beveridge (1987), Phillips et al. (1991), EIFAC
(2000), FAO (2000), Green & Engle (2000), Troell et al. (2004) and Tyedmers et al. (2007). Protein energy per tonne forall fish/shellfish species ¼ 4.73 GJ; for aquatic plants ¼ 3.55 GJ.
production perunit area (landor water) t ha21
water use per unit ofproduction’000 m3 tonne21
input : outputenergy ratio system features
salmon, trout and othersalmonids
1750 2260a 50 intensively fed cage/ponds
sea bass, bream and similar 1125 2500 40 intensively fed cages
halibut, turbot, sole, etc. 2676 2000 45 intensive onshore tankscod, haddock, hake, etc. 1200 2500 45 experimental cage systemscarp, tilapia, catfish 2 5a 30 fertilized pondseels, sturgeon, perch, zander, etc. 190 0.1a 35 extensive stocked water bodies
tuna 300 3000 50 intensively fed cagesmussels 76 3000 10 raft or longline systemsoysters and scallops 25 2000 5 rafts or longlines—lanternsclams, cockles, etc. 0.5 2000 5 extensive coastal bedsnew non-fish aquaculture sp. 150 0.2 20 range of systems
aquatic plants 1 2000 1 coastal beds/stakes and lines
aWater consumption is mainly of concern in freshwater systems (the category salmon and trout covers a mix of both freshwater and seawater). These figures contrast with those of Verdegem & Bosma (2009) who estimated total water withdrawal for freshwater aquaculture at16 900 m3 tonne21, although this does not take account of water returned to the aquifer.
Table 5. Total embodied energy relationships, for equivalent area. Developed from Muir (2005), Troell et al. (2004) and
Tyedmers et al. (2007).
quantity seaweed culture mussel culture cage salmonid culture
energy inputs (kcal � 105)solar/renewable (%) 0.30 (4.5%) 0.75–2.05 (71.4–85.4%) 470–830 (81.0–87.4%)fossil/non-renewable (%) 6.35 (95.5%) 0.30–0.35 (28.6–14.6%) 110–120 (19.0–12.6%)total energy 6.65 1.05–2.40 580–950
protein output (kcal) 6605 255–440 22 420
input/output ratio 100 410–545 2585–4235
Review. Aquaculture J. Bostock et al. 2905
on July 2, 2018http://rstb.royalsocietypublishing.org/Downloaded from
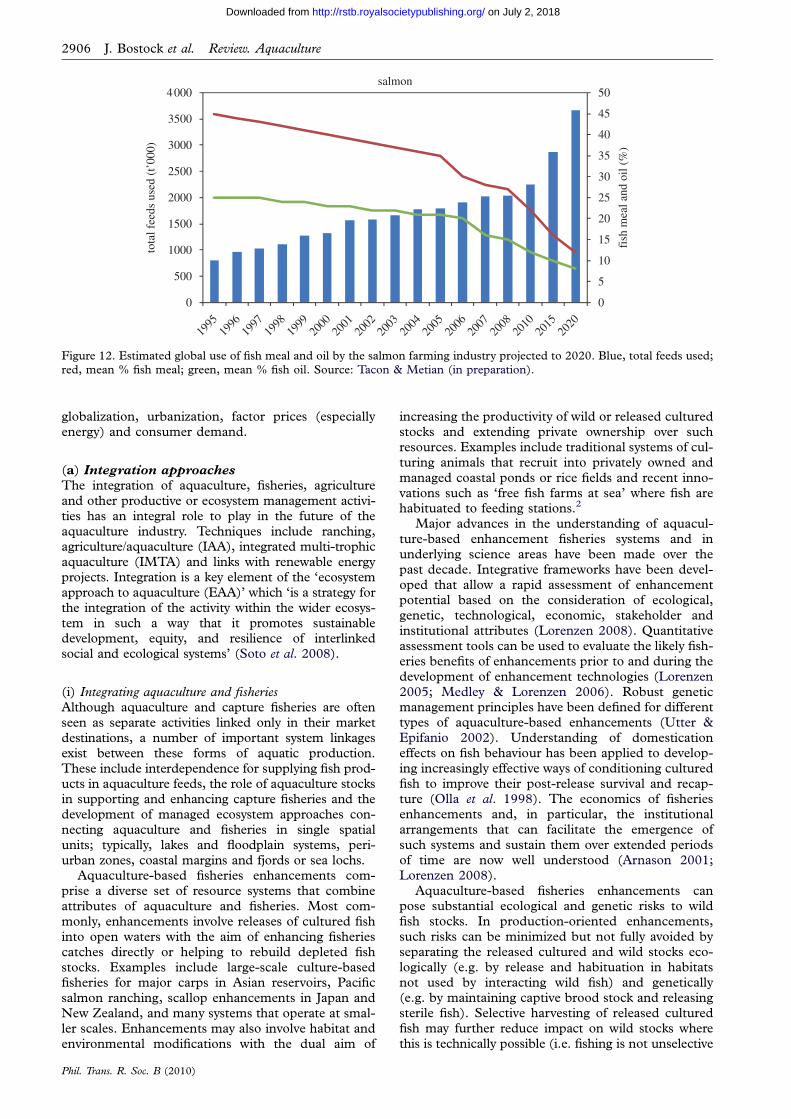
Wild-caught supplies of fish meal and oil have variedat around 5–6 million and 1 million tonnes annually forat least the past 20 years, suggesting that such levels arelikely to be sustained in the future. However, in 2008,approximately 90 per cent of the fish oil available world-wide, and 71 per cent of the fish meal, was consumed inaquaculture practices (Tacon & Metian in preparation).Unless alternative higher value markets develop, aqua-culture will continue to consume the majority of fishmeal and oil produced but this will not be sufficientto meet ever-increasing demands for aquafeed ingredi-ents (figures 9–12).
Feeds for herbivorous and omnivorous species(carps and tilapias) often contain fish meal and some-times fish oil, although this is not essential on purelynutritional grounds. However, rapidly expanding cul-ture of carnivorous species such as cobia andpangasius catfish could increase the pressure on fishmeal and oil supplies. An overarching factor that hassignificantly impacted demands for fish meal and oilis improvements in food conversion efficiency asfeeds and feeding technologies improve. Up to 25per cent of fish meal is now obtained from fish proces-sing waste, and ingredient substitution is alsoincreasing the efficiency of fish meal and oil utilization.In the wild, the conversion efficiency (fish intake tofish output, FIFO) is commonly taken as 10 : 1
Phil. Trans. R. Soc. B (2010)
between one trophic level and the next (e.g. carnivor-ous fish eating plankton-feeding fish). Between 1995and 2006, input : output ratios for salmon improvedfrom 7.5 to 4.9, trout from 6.0 to 3.4, marine fishfrom 3.0 to 2.2 and shrimp from 1.9 to 1.4. Herbivor-ous and omnivorous finfish and some crustaceanspecies showed net gains in output, with ratios in2006 of 0.2 for non-filter feeding Chinese carp andmilkfish, 0.4 for tilapia, 0.5 for catfish and 0.6 forfreshwater crustaceans (Tacon & Metian 2008). Cal-culations of FIFO for the global aquaculture industryinclude 0.7 (Tacon & Metian 2008), 0.63 (Nayloret al. 2009) and 0.52 Jackson (2009). Overall, thefinite supply of fish meal and oil is not expected tobe a major constraint, but demand for alternativefeed materials will increase—in turn placing greaterpressure on the wider agro-feed system.
3. ADDRESSING THE CHALLENGESOF AQUACULTURE DEVELOPMENTLooking forward, there is strong focus on improvingthe efficiency of resource utilization through manage-ment and integration or more technological solutionsavailable through advances in engineering and bio-science. Both approaches will be important and influ-enced by wider social and economic factors including
0
5
10
15
20
25
30
35
40
45
50
0
500
1000
1500
2000
2500
3000
3500
4 000
fish
mea
l and
oil
(%)
tota
l fee
ds u
sed
(t’0
00)
salmon
1995
1996
1997
1998
1999
2000
2001
2002
2003
2004
2005
2006
2007
2008
2010
2015
2020
Figure 12. Estimated global use of fish meal and oil by the salmon farming industry projected to 2020. Blue, total feeds used;red, mean % fish meal; green, mean % fish oil. Source: Tacon & Metian (in preparation).
2906 J. Bostock et al. Review. Aquaculture
on July 2, 2018http://rstb.royalsocietypublishing.org/Downloaded from
globalization, urbanization, factor prices (especiallyenergy) and consumer demand.
(a) Integration approaches
The integration of aquaculture, fisheries, agricultureand other productive or ecosystem management activi-ties has an integral role to play in the future of theaquaculture industry. Techniques include ranching,agriculture/aquaculture (IAA), integrated multi-trophicaquaculture (IMTA) and links with renewable energyprojects. Integration is a key element of the ‘ecosystemapproach to aquaculture (EAA)’ which ‘is a strategy forthe integration of the activity within the wider ecosys-tem in such a way that it promotes sustainabledevelopment, equity, and resilience of interlinkedsocial and ecological systems’ (Soto et al. 2008).
(i) Integrating aquaculture and fisheriesAlthough aquaculture and capture fisheries are oftenseen as separate activities linked only in their marketdestinations, a number of important system linkagesexist between these forms of aquatic production.These include interdependence for supplying fish prod-ucts in aquaculture feeds, the role of aquaculture stocksin supporting and enhancing capture fisheries and thedevelopment of managed ecosystem approaches con-necting aquaculture and fisheries in single spatialunits; typically, lakes and floodplain systems, peri-urban zones, coastal margins and fjords or sea lochs.
Aquaculture-based fisheries enhancements com-prise a diverse set of resource systems that combineattributes of aquaculture and fisheries. Most com-monly, enhancements involve releases of cultured fishinto open waters with the aim of enhancing fisheriescatches directly or helping to rebuild depleted fishstocks. Examples include large-scale culture-basedfisheries for major carps in Asian reservoirs, Pacificsalmon ranching, scallop enhancements in Japan andNew Zealand, and many systems that operate at smal-ler scales. Enhancements may also involve habitat andenvironmental modifications with the dual aim of
Phil. Trans. R. Soc. B (2010)
increasing the productivity of wild or released culturedstocks and extending private ownership over suchresources. Examples include traditional systems of cul-turing animals that recruit into privately owned andmanaged coastal ponds or rice fields and recent inno-vations such as ‘free fish farms at sea’ where fish arehabituated to feeding stations.2
Major advances in the understanding of aquacul-ture-based enhancement fisheries systems and inunderlying science areas have been made over thepast decade. Integrative frameworks have been devel-oped that allow a rapid assessment of enhancementpotential based on the consideration of ecological,genetic, technological, economic, stakeholder andinstitutional attributes (Lorenzen 2008). Quantitativeassessment tools can be used to evaluate the likely fish-eries benefits of enhancements prior to and during thedevelopment of enhancement technologies (Lorenzen2005; Medley & Lorenzen 2006). Robust geneticmanagement principles have been defined for differenttypes of aquaculture-based enhancements (Utter &Epifanio 2002). Understanding of domesticationeffects on fish behaviour has been applied to develop-ing increasingly effective ways of conditioning culturedfish to improve their post-release survival and recap-ture (Olla et al. 1998). The economics of fisheriesenhancements and, in particular, the institutionalarrangements that can facilitate the emergence ofsuch systems and sustain them over extended periodsof time are now well understood (Arnason 2001;Lorenzen 2008).
Aquaculture-based fisheries enhancements canpose substantial ecological and genetic risks to wildfish stocks. In production-oriented enhancements,such risks can be minimized but not fully avoided byseparating the released cultured and wild stocks eco-logically (e.g. by release and habituation in habitatsnot used by interacting wild fish) and genetically(e.g. by maintaining captive brood stock and releasingsterile fish). Selective harvesting of released culturedfish may further reduce impact on wild stocks wherethis is technically possible (i.e. fishing is not unselective

Review. Aquaculture J. Bostock et al. 2907
on July 2, 2018http://rstb.royalsocietypublishing.org/Downloaded from
for cultured/wild fish). Environmental modificationsand feeding could lead to further impacts on wildstocks and the natural ecosystem. In initiatives aimedat rebuilding wild stocks, the aim is for cultured fishto interact with wild fish and particular care must betaken in stock and genetic management to avoid detri-mental impacts on the depleted or even endangeredwild stock. Captive breeding and supplementationprogrammes can aid conservation and restoration ofsuch stocks, but the management strategies in thiscase are very different from those employed inproduction-oriented enhancements.
Aquaculture-based fisheries enhancements are nowsuccessfully implemented in over 27 countries world-wide, involving over 80 species and yielding anestimated 2 million tonnes of fisheries products. It istherefore likely that interest in enhancements anddemand for research and technology development inthis area will increase.
(ii) Integrated multi-trophic aquacultureIMTA systems can be described as culture systems thatuse species from different trophic levels grown in com-bination within the same water body or through someother water-based linkage (for land-based systems).Scale does not necessarily have to be large, providedthe layout of the species being grown and the quan-tities being grown are compatible. In all cases wateris the nutrient transport vector for dissolved and par-ticulate wastes, the releases from one species actingas food for other species at a lower trophic level.
The combination of species from different trophicgroups creates a synergistic relationship which, inturn, acts as a bioremediation measure. In a perfectIMTA system the processing of biological and chemicalwastes by other species would make the whole pro-duction cycle environmentally neutral. There areIMTA systems at or near commercial scale in China,Chile, Canada, Ireland, South Africa and the UK,and ongoing research in many other countries. Suchsystems face a number of challenges, particularly inselecting species that integrate well, but that also havesufficient economic value to attract investment. Theinternalization of environmental costs within the sys-tems (environmental economics) could substantiallyalter this (Soto 2009), as could the development ofnew products from marine species (Barrington et al.2009). Other constraints include existing regulationsrestricting further aquaculture development or thepotential for unintended interactions between systems.However, the potential of the approach in addressingsustainability objectives is clear.
(iii) Integrated aquaculture/agricultureIAA is most common in developing countries, where itprovides a means for rural systems to diversify andmaximize output. The culture method differs frommono-culture, which is often too risk intensive forresource-poor farmers. Integrated systems benefitfrom the synergies among the different componentsand they have diversity in production that results in arelative environmental soundness (Prein 2002).
Phil. Trans. R. Soc. B (2010)
IAA systems range from simple integration to multi-component integrated systems using commercialfertilizers and feeds. Examples of IAA include the cul-ture of fish in rice fields or the use of livestock manurefrom terrestrial farming for both feed and fertilizer infish ponds. Integration can be categorized into: (i)polyculture (multiple species co-cultured; (ii) sequen-tial (waste flows directed sequentially between cultureunits); (iii) temporal (replacement of species withinthe same holding site to benefit from waste generatedby preceding species); and (iv) mangrove integration(using mangroves as biofilters) (Troell 2009).
Dey et al. (2010) evaluated the impact of a World-Fish-supported programme that introduced IAA tosmallholders in Malawi and found adopters of thetechnology realized an 11 per cent rise in total factorproductivity (TFP), 35 per cent higher technical effi-ciency scores, 134 per cent higher farm income perhectare and 60 per cent higher income overall com-pared with non-adopters. Non-adopters had higherincome from off-farm activities, but adopters hadhigher overall returns to family labour and thushigher household incomes (almost 1.5 times higher).The authors suggest this illustrates the potential forIAA to contribute to poverty reduction and livelihoodimprovements in Malawi and probably other countriesthat have similar conditions.
Where IAA is practised on a larger scale andwith commercial products, further challenges haveemerged. For instance, quality can be variable withconcerns about contamination, e.g. with pesticideswhere irrigation water is used, or off-flavour taints,which inhibit acceptance and certification, particularlyfor international markets (Little & Edwards 2003). Todate, the benefits of IAA have focused mainly on foodproduction, but more efficient use of freshwater andenergy may become equally important.
In developed countries, there is growing interestand activity with small-scale aquaponic systems,which combine freshwater aquaculture in a recircu-lated system with hydroponic horticulture, usuallyherbs and salad vegetables. The horticultural cropis mostly fertilized by the nitrogen waste from fishculture. Owing to scaling issues, these systems havenot proved attractive commercially, but are suitablefor ‘back-yard’ food production, which is emergingas a candidate strategy for increasing sustainablefood production.
(b) Technical responses to resource issues
(i) Fish meal and fish oil replacement/substitutionSubstitution of the protein (essential amino acids) andother nutrients derived from fish meal is nutritionallystraightforward and considerable advances in thisfield have been made over the past 30 years. For proteinsupply, the issue is largely one of economics and for-mulation as well as continual assessment of potentialnovel sources of protein (such as: the biomass derivedfrom bioethanol production; cereal glutens; microbialproteins; improved oilseed and legume meals, etc.).Even for carnivorous species (high dietary proteinlevels, sensitivity to the palatability of the feed), upto 75 per cent of the fish meal in a standard feed can
2908 J. Bostock et al. Review. Aquaculture
on July 2, 2018http://rstb.royalsocietypublishing.org/Downloaded from
easily be replaced (Bell & Waagbo 2008). Foromnivorous and herbivorous species, fish meal isunnecessary and is only presently used because it iseconomically viable to do so.
There is a general issue of whether it is ethical, orimpacts fish welfare, when carnivorous species arefed on ‘vegetarian’ diets. In addition, there is evidencethat soya bean induces enteritis in Atlantic salmon andit is possible that plant proteins in general (which con-tain wide ranges of nutrient and non-nutrient fractionsto which fish are not normally exposed) may haveimpacts on fish welfare.
Substitution of fish oil is considerably moreproblematic as n 2 3 HUFA (highly unsaturatedfatty acids; EPA and DHA) supplied by fish oil, andessential in the diets of truly marine species, are notcommercially available from any other source at pre-sent. Neither is it desirable to reduce the n 2 3content of farmed species with respect to humanhealth benefits. Considerable progress has thereforebeen made towards substitution of most or all of thefish oil during the growth phase before introducing afinishing diet, rich in fish oil, that ‘washes out’ then 2 6 fatty acids accumulated during growth. Thisresults in a high n 2 3 HUFA final product thatresembles wild individuals of the same species.
For future supply of HUFA that can be incorporatedin aquafeeds, some microorganisms (bacteria and algaeparticularly) have shown promise and HUFA yieldswill undoubtedly be increased through conventionalselection, improved culture techniques and/or the useof genetically modified organisms. It may even bepossible to combine production of useful protein bio-mass and HUFA in this way (Olsen et al. 2008).
One further potential source of feed protein and oilis krill (a collective name for a group of approximately80 species of small, pelagic, shoaling crustacea). Thenutritional issues of product quality (rapid spoilage)and fluorine content have been successfully addressedand viable methodologies for capture and processingdeveloped. CCAMLR3 estimates a total allowablecatch that would provide approximately 1 teratonneof krill meal and 32 000 million tonne of krill oil peryear from Antarctic waters. However, aquaculturefaces strong competition for the krill resource fromincreasing use of high grade krill for direct humanconsumption and production of pharmacologicalgrade krill oils. The potential impact on marine foodwebs should also be seriously considered.
(ii) Genetic management and stock improvementThe bulk of aquaculture production still comes fromwild or recently domesticated stocks. A lack of geneticmanagement and poor hatchery procedures, particu-larly but not only in developing countries, hassignificantly degraded the performance of manyfarmed species through inbreeding, genetic drift anduncontrolled hybridization. The reduction in perform-ance and viability means that hatchery stocks oftenneed to be routinely replaced by wild fish or bettermanaged stock from other farms. In contrast, properlymanaged selective breeding programmes have showncontinual improvements in performance and quality.
Phil. Trans. R. Soc. B (2010)
Atlantic salmon breeding companies have shownmore than 100 per cent improvement in growth per-formance in around six generations, with significantimprovements in disease resistance and delays in theonset of sexual maturation. The vast majority offarmed Atlantic salmon eggs and smolts are nowsourced from such breeding companies and similarapproaches are now being introduced in some otherspecies.
Selective breeding can improve the year-on-yearperformance of farmed fish stocks for a wide rangeof traits, but it is still often necessary to includesome other techniques that enable these fish to achievetheir full potential. Sexual maturation in productionfish can significantly reduce the final yield, as maturingfish can become aggressive, stop growing, lose con-dition and become more susceptible to disease. Inmany species one sex or another is preferred, e.g.because it grows faster or is still immature at harvestsize. In salmonids, females usually mature later thanmales. In rainbow trout being grown to portion size(more than 300 g), all-female production is nowalmost universally used in Europe as females are stillimmature at harvest. In tilapia, all-male production ispreferred: even though the males mature, the lack offemales avoids the unwanted production of frycommon in mixed sex on-growing systems.
In some species and under certain conditions, anysexual maturation is detrimental. This can be avoidedby the production of sterile fish using chromosome setmanipulation techniques that produce animals withthree sets of chromosomes, known as induced trip-loidy. This approach is now used in the productionof large rainbow trout (more than 3 kg) whichcontinue to grow and remain in prime condition.Triploidy is also widely used for the production of‘all-year-round’ oysters.
Transgenic technology has been applied to anumber of fish species in recent years, althoughmostly for research. Recent studies in salmonidsshow that the spectacular improvements in growthseen by incorporating growth hormone gene con-structs into slow-growing wild strains were notrepeated when the same constructs were incorporatedinto fast-growing domesticated stock (Devlin et al.2009). This suggests that the same improvement ingrowth could be achieved using selective breedingtechniques which have the advantage of selectingacross a range of commercial traits, raising the overallperformance of the strain as well as maintaining itsgenetic integrity. Transgenic strains are by necessityderived from a small number of individuals, makingfurther improvement in other commercial traits lesslikely. In the EU, the high level of public concernabout GM technology would suggest that the wide-spread adoption of transgenic fish for a single traitsuch as growth performance, even if it were licensed,would meet with consumer resistance.
(iii) Welfare and health managementDisease has proved a major constraint to efficient prod-uction in some intensive aquaculture systems. Majorimprovements in the understanding of the aetiology

Review. Aquaculture J. Bostock et al. 2909
on July 2, 2018http://rstb.royalsocietypublishing.org/Downloaded from
and epidemiology of fish diseases have been made inrecent years and aquaculture producers in manycountries have dramatically improved their husbandrypractices with greater focus now on fish welfare. Con-trol of many serious infectious diseases has beenachieved through new medicines and vaccines, andthis is especially true for bacterial diseases. However,new disease problems are emerging, and previouslyrare diseases becoming much more prevalent, socontinued vigilance and solution development isrequired.
Vaccines have been very effective for bacterial fishpathogens where there are resources to developthem, but success against virus disease has beenmore limited. Nevertheless, fish viral diseases wereamong the first to be tackled using recombinantDNA technology, specifically for infectious pancreaticnecrosis, and subsequently direct DNA vaccination,which appears very promising. As this involves atransfer of genes, there are significant issues of safetyand consumer acceptance to be addressed. Anotherapproach showing promise is the use of proteomicsand epitope mapping for the identification of vaccineantigens and the subsequent development of peptidevaccines. It is hoped that this approach might besuitable against parasites such as salmon lice. Furthermethods include the use of virus-like particles whichhave been reportedly used against grouper nervousnecrosis virus or recombinant viral proteins producedin yeast (Renault 2009).
For the moment, new therapies developed usinggenomic tools appear some way off, but some potentialhas been demonstrated using dsRNA for disease pro-tection and RNA-i-based gene therapies in shrimp(Renault 2009). Antimicrobial peptides are alsobeing studied as a potential therapeutant. Aquaculturediets are also under scrutiny with respect to potentialfor delivery of immunostimulants and better under-standing of interactions between gut microflora,pathogens and micronutrients, including probioticeffects (Gatesoupe 2009).
(iv) Engineering and systems technologyWith respect to the engineering of culture systems,aquaculture largely takes and adapts technology fromother sectors, such as fisheries, water treatment or off-shore oil. However, as the sector grows, morespecialized equipment develops, such as the wellboats now currently employed by the salmon industry.Of particular interest for reducing pressure onwater resources and minimizing impacts on sensitivefreshwater or coastal environments, are recirculatedaquaculture systems (RAS) and offshore cagetechnology.
(v) Recirculating aquaculture systemsRAS culture systems are typically land-based, usingcontainment systems such as tanks or raceways forthe fish. A percentage of the water is passed from theoutflow back through the system following treatmentand removal of wastes. The level of waste treatmentand water reuse depends largely on the requirementsof the fish, the environmental parameters and the
Phil. Trans. R. Soc. B (2010)
technology available. Reusing water gives the farmera greater degree of control over the environment,reduces water consumption and waste discharge andenables production close to markets (Sturrock et al.2008). Owing to relatively high capital costs, highenergy dependencies and more complex technology,RAS is largely restricted in its use to higher valuespecies or life stages (especially hatcheries where con-trol over environmental conditions is more critical andunit values higher). However, it could become a morecompetitive approach if economic factors change.
(vi) Offshore cagesMoving systems further offshore removes a number ofthe challenges faced by near shore systems such asvisual impacts, local environmental impacts andspace constraints. In most cases, predation issues anddisease risks could also be substantially reduced.Expansion of the offshore industry would allowincreases in the scale of project and could thereforeimprove efficiency as well. Competition with otherinterests such as tourism and inshore fisheries mightbe reduced and waste discharges would be morereadily diffused. However, other problems and risksassociated with intensive cage-based aquaculturewould remain or even increase.
There is no internationally agreed definition of off-shore cage aquaculture. In Norway, sites are classifiedaccording to significant wave height, whereas in theUSA offshore aquaculture is defined as operations inthe exclusive economic zone from the three mile terri-torial limit of the coast to 200 miles offshore (James &Slaski 2006). In general, offshore farming can becharacterized as more than 2 km from shore, subjectto large oceanic swells, variable winds, reduced phys-ical accessibility and requiring mostly remoteoperations including automated feeding and distancemonitoring. For these reasons, offshore aquaculturesystems need to be robust structures and associatedsystems which are able to function with minimumintervention in a high-energy environment (Sturrocket al. 2008). There are also substantial issues overstaff safety which increase cost over near shoresystems.
The large size required and amount of new technol-ogy mean that offshore cage farms will have largecapital requirements, which will restrict use untilfarms and companies reach a scale of operationswhere offshore investment becomes feasible. Thereare signs that this is starting to happen with MarineHarvest, the largest salmon farming company, whichhas announced an intention to apply for and developoffshore sites. This is for salmon farming, but severalspecies have been promoted as potentially suitablefor offshore farms (on the basis of biology and econ-omics), with cobia perhaps receiving the mostinterest and investment.
(vii) Information technologyAdvances in information and communications tech-nology is benefiting the aquaculture industry withimproved monitoring and control systems and betterreal-time information for managers. The development

2910 J. Bostock et al. Review. Aquaculture
on July 2, 2018http://rstb.royalsocietypublishing.org/Downloaded from
of micro-sensors combined with greater sophisticationin electronic tags is opening up possibilities for datacollection from individual fish within an aquacultureenvironment. Particularly, when combined with gen-omic tools, this is a potentially powerful researchapproach and may also play a role in managementfeedback (Bostock 2009). A notable development inthe British trout sector is the linking of data frommany farms to provide both a benchmarking tool forfarm management and stock performance, and datafor real-time epidemiological modelling. This isbased on changes in mortality patterns reported bythe farm and their geographical location and basicenvironmental data such as water temperatures. Suchtools can potentially provide early warning of diseaseoutbreaks in the industry and allow precautionaryactions to be put in place.
4. CONCLUSIONSAll forward projections anticipate a need for increasedsupply of fish protein to meet the health needs andgeneral aspirations of societies. Furthermore, this willneed to be at affordable levels in relation to incomeand other proteins. As with terrestrial animal proteins,production of fish protein is more ecologically expens-ive than production of plant protein due to the highertrophic level, although some systems (e.g. enrichedpolyculture ponds) compare very well. Bivalve shellfishshould also not be overlooked as an animal proteinalready well ahead on sustainability criteria.
With respect to fisheries and aquaculture, it may behelpful to break the market down into commodityproducts that are used in a wide range of foodpresentations and outlets (such as whitefish, salmon,tuna and prawns), and products that are differentiatedthrough distinctive attributes and that have bothsmaller production and market bases. Bulk supply ismost likely to come through growth in the globalizedcommodity products based on economies of scale,while growth in the more specialist products wouldbe through diversification of products and productionsystems.
Underlying development of sustainable aquacultureof all types, but especially commodity products, is theneed to improve the basic conversion of feed materialsinto edible fish flesh and minimize utilization and con-version of premium resource. This involves speciesselection, production systems, animal genetics, goodhealth management and optimized feed and feeding.These are also linked to some extent through thedeveloping understanding of animal welfare, which isalso reaching into other physiological and environ-mental interactions. The interactions of aquaculturewith the environment, with respect to both goodsand services, are also critical and need to be evaluatedin a rational way that allows the benefit of environ-mental services to be used but not over-exploitedand impacted on.
At the policy level, important questions exist aboutthe priority given to conserving the environmentversus the exploitation of natural resources for foodproduction. While richer nations in Europe may beable to offset reduced food production by increasing
Phil. Trans. R. Soc. B (2010)
imports, the environmental impact is transferred toother countries where options or control are more lim-ited. Imposing high environmental standards on bothlocal production and imports would encourage tech-nology development and uptake, although most likelyat the cost of increased food prices.
With the market of central importance to the direc-tion of future development, there is growingmomentum to educate and influence market demandto play a more responsible role in shaping future prod-uction systems. Many campaign groups are active onspecific issues, which is at least stimulating debateand further developments. Most notably, there isnow a clear trend towards the establishment of varioustypes of standards that can be measured, monitoredand certificated by independent bodies to provide pro-ducers with clear guidelines and consumers andmarket chain participants with confidence in theenvironmental or social provenance of the product.The development of appropriate standards can,however, be challenging. Within aquaculture, thereare now many initiatives, perhaps most significantlyGLOBALGAP,4 which is private sector-basedbusiness-to-business certification focusing on foodsafety, animal welfare, environmental protection andsocial risk assessment standards. This now has certifi-cation schemes for shrimp, salmon, pangasius andtilapia and is developing a standard for aquaculturefeeds. While GLOBALGAP has strong take-up, itdoes not involve a specific consumer label, such as‘Friend of the Sea’,5 ‘Freedom Foods’6 or variousorganic labels. So far, aquaculture products have nothad a consumer label with the degree of recognitionof the Marine Stewardship Council mark for sustain-able capture fisheries. This is expected to changewith the formation of the Aquaculture StewardshipCouncil7 which is taking forward a long programmeof stakeholder dialogues organized by the WWF8 onstandards for 12 major aquaculture products andimplementing a consumer-oriented certificationscheme.
The WWF aquaculture dialogues have highlightedthe problems in developing robust measures of sustain-ability, particularly as definitions move beyond simplemeasures of environmental impact to more complexassessments of ecological efficiency. Parallel initiativesby international policy and academic organizationshave therefore focused on the development of assess-ment tools. LCA is one of the key approaches,measuring parameters such as total energy consump-tion or carbon emissions throughout the production,distribution, consumption or disposal of individualproducts. This allows a ready comparison betweenproducts and helps to identify stages in the productlife cycle where efficiency gains might be realized.While LCA provides a useful headline figure, it isless useful for understanding the dependencies ofproducts on natural resources and service or linkagesto other production processes. For this reason, FAOand partners are developing assessment frameworksbased on the concept of an EAA9. This uses anumber of measures including the concept of ecologi-cal footprints which help assess the dependence ofspecific activities on ecosystem support. A further

Review. Aquaculture J. Bostock et al. 2911
on July 2, 2018http://rstb.royalsocietypublishing.org/Downloaded from
tool that may prove useful is the ‘Global AquaculturePerformance Index’10 developed by the University ofVictoria, Canada, and based on the Yale and Colum-bia University’s Environmental Performance Index11.This uses a range of weighted metrics and statisticalanalysis to provide comparative scores for assessingspecies choices or performance differences betweencountries or regions.
While the creation and use of international stand-ards may appear an irrelevance to smallholdersystems in many countries, there is also a risk thatthey could create substantial barriers to development,by denying them access to wider markets. The impli-cations of globalizing trade, standards andcertification, development and sustainability andhow these interrelate are being researched by theEC-funded SEAT project,12 which aims to build abroader scoring system encompassing a range ofethical issues.
Future policy development will clearly need tomove beyond simple objectives of economic develop-ment and employment or environmental protectionand conservation. The complexity of the seafoodmarket suggests there are many opportunities for seg-mentation and innovative approaches to sustainableaquaculture that could be exploited with policysupport.
END NOTES1In 2008, brackish-water aquaculture produced 4.1 million tonnes
valued at US$13.1 billion; shrimp and prawn production was 2.4
million tonnes valued at US$9.4 billion.2http://www.atc.stir.ac.uk/FFFS/Bg.html.3http://www.ccamlr.org.4http://www.globalgap.org.5http://www.friendofthesea.org.6http://www.rspca.org.uk/freedomfood.7http://www.ascworldwide.org.8http://www.worldwildlife.org/what/globalmarkets/aquaculture/
aquaculturedialogues.html.9http://www.fao.org/fishery/topic/16035/en.10http://web.uvic.ca/~gapi.11http://epi.yale.edu/Home.12http://seatglobal.eu.
REFERENCESArnason, R. 2001 The economics of ocean ranching: experi-
ences, outlook and theory. FAO fisheries technical paperno. 413. Rome, Italy: Food and Agriculture Organizationof the United Nations.
Barrington, K., Chopin, T. & Robinson, S. 2009 Integratedmulti-trophic aquaculture (IMTA) in marine temperatewaters. In Integrated mariculture: a global review (ed. D.Soto). FAO fisheries and aquaculture technical paper.no. 529, pp. 7–46. Rome, Italy: Food and Agriculture
Organization of the United Nations.Bell, J. G. & Waagbo, R. 2008 Safe and nutritious aquacul-
ture produce: benefits and risks of alternative sustainableaquafeeds. In Aquaculture in the ecosystem (eds M. Holmer,K. Black, C. M. Duarte, N. Marba & I. Karakassis),
pp. 185–225. Berlin, Germany: Springer.Beveridge, M. C. M. 2004 Cage aquaculture, 3rd edn.
Oxford, Germany: Blackwell.Bostock, J. C. 2009 Use of information technology in aqua-
culture. In New technologies in aquaculture: improvingproduction efficiency, quality and environmental management,
Phil. Trans. R. Soc. B (2010)
ch. 35 (eds G. Burnell & G. Allan), pp. 1064–1118.Oxford, UK: Woodhead Publishing.
Devlin, R. H., Sakhrani, D., Tymchuk, W. E., Rise, M. L. &
Goh, B. 2009 Domestication and growth hormone trans-genesis cause simiar changes in gene expression in cohosalmon (Oncorhynchus kisutch). Proc. Natl Acad. Sci.USA 106, 3047–3052. (doi:10.1073/pnas.0809798106)
Dey, M. M., Paraguas, F. J., Kambewa, P. & Pemsl, D. E.
2010 The impact of integrated aquaculture–agricultureon small-scale farms in Southern Malawi. Agric. Econ.41, 67–79. (doi:10.1111/j.1574-0862.2009.00426.x)
EIFAC 2000 Aquatic resources management in European
aquaculture. A study report by the EIFAC Ad hocWorking Party on Aquatic Resources Management inAquaculture. European Inland Fisheries AdvisoryCommission, 21st Session, Budapest, Hungary, 1–7June 2000. See http://www.fao.org/docrep/meeting/
x7228e.htmFAO 2000 Aquaculture production 1998. FAO yearbook of
fishery statistics, vol. 86/2. Rome, Italy: Food and Agricul-ture Organization of the United Nations.
FAO 2009a The state of world fisheries and aquaculture 2008.
Rome, Italy: Food and Agriculture Organization of theUnited Nations. See http://www.fao.org/fishery/sofia/en.
FAO 2009b FishStat fishery statistical collections: aquacul-ture production (1950–2007; released March 2009).Rome, Italy: Food and Agriculture Organization of the
United Nations. See http://www.fao.org/fishery/statistics/software/fishstat/en
FAO 2010 FishStat fishery statistical collections: aquacultureproduction (1950–2008; released March 2010). Rome,
Italy: Food and Agriculture Organization of theUnited Nations. See http://www.fao.org/fishery/statistics/software/fishstat/en
Fiskeridirektoratet 2008 Key figures from the aquacultureindustry—2007. Bergen, Norway: Norwegian Directorate
of Fisheries. http://www.fiskeridir.no/english/content/download/13652/108100/version/3/file/Nokkeltall_Havbruk_2007.pdf
Framian, B. V. 2009 Definition of data collection needs foraquaculture: Part 1. Review of the EU aquaculture
sector and results of costs and earnings survey.FISH/2006/15-Lot 6. See http://ec.europa.eu/fisheries/documentation/studies/data_collection/index_en.htm.
Gatesoupe, E. J. 2009 Diet and husbandry techniques toimprove disease resistance: new technologies and pros-
pects. In New technologies in aquaculture: improvingproduction efficiency, quality and environmental management,ch. 10 (eds G. Burnell & G. Allan), pp. 267–311. Oxford,UK: Woodhead Publishing.
Green, B. W. & Engle, C. R. 2000 Commercial tilapia aqua-culture in Honduras. In Tilapia aquaculture in the Americas,vol. 2 (eds B. A. Costa-Pierce & J. E. Rakocy), pp. 151–170. Baton Rouge, LA: World Aquaculture Society.
Gronroos, J., Seppala, J., Silvenius, F. & Makinen, T. 2006
Life cycle assessment of Finnish cultivated rainbowtrout. Boreal Environ. Res. 11, 401–414. http://www.borenv.net/BER/pdfs/ber11/ber11-401.pdf.
Halwart, M., Soto, D. & Arthur, J. R. (eds) 2007 Cage aqua-culture: regional reviews and global overview. Rome, Italy:
FAO fisheries technical paper no. 498. Rome, Italy:Food and Agriculture Organization of the UnitedNations.
IFFO 2008 Fishmeal and fish oil statistical yearbook.St Albans, UK: International Fishmeal and Fish Oil
Organisation. See http://www.iffo.net.Jackson, A. 2009 Fish in–fish out ratios explained. Aquacult.
Eur. 34, 5–10.James, M. A. & Slaski, R. 2006 Appraisal of the opportunity
for offshore aquaculture in UK waters. Report of Project

2912 J. Bostock et al. Review. Aquaculture
on July 2, 2018http://rstb.royalsocietypublishing.org/Downloaded from
FC0934, commissioned by Defra and Seafish from FRMLtd. See http://www.seafish.org/resources/publications.asp?a=A
Little, D. C. & Edwards, P. 2003 Integrated livestock-fishfarming systems. Rome, Italy: Food and AgricultureOrganization of the United Nations. See http://www.fao.org/docrep/006/y5098e/y5098e00.htm.
Lorenzen, K. 2005 Population dynamics and potential of
fisheries stock enhancement: practical theory for assess-ment and policy analysis. Phil. Trans. R. Soc. B 360,171–189. (doi:10.1098/rstb.2004.1570)
Lorenzen, K. 2008 Understanding and managing enhance-
ment fisheries systems. Rev. Fish. Sci. 16, 10–23.(doi:10.1080/10641260701790291)
Medley, P. A. H. & Lorenzen, K. 2006 EnhanceFish: adecision support tool for aquaculture-based fisheries enhance-ment. London, UK: Imperial College. See http://www.
aquaticresources.org/enhancefish.html.Muir, J. 2005 Managing to harvest? Perspectives on the
potential of aquaculture. Phil. Trans. R. Soc. B 360,191–218. (doi:10.1098/rstb.2004.1572)
Muir, J. F. & Beveridge, M. C. M. 1987 Water resources
and aquaculture development. Arch. Hydrobiol. 28,321–324.
Muir, J. F. & Young, J. A. 1998 Aquaculture and marine fish-eries: will capture fisheries remain competitive? J. Northw.Atl. Fish. Sci. 23, 157–174.
Naylor, R. L. et al. 2009 Feeding aquaculture in an era offinite resources. Proc. Natl Acad. Sci. USA 106, 15103–15110. (doi:10.1073/pnas.0905235106)
Olla, B. L., Davis, M. W. & Ryer, C. H. 1998 Understanding
how the hatchery environment represses or promotes thedevelopment of behavioral survival skills. Bull. MarineSci. 62, 531–550.
Olsen, Y., Otterstad, O. & Duarte, C. 2008 Status and futureperspectives of marine aquaculture. In Aquaculture in theecosystem (eds M. Holmer, K. Black, C. M. Duarte, N.Marba & I. Karakassis). Berlin, Germany: Springer.
Phillips, M. J., Beveridge, M. C. M. & Clarke, R. 1991Impact of aquaculture on water resources. Advances inworld aquaculture, vol. 3 (eds D. E. Bruno & J. R.
Tomasso), pp. 568–591. Baton Rouge, LA: World Aqua-culture Society.
Prein 2002 Integration of aquaculture into crop–animal sys-tems in Asia. Agric. Syst. 71, 127–146. (doi:10.1016/S0308-521X(01)00040-3)
Renault, T. 2009 Controlling viral diseases in aquaculture:new developments: new technologies and prospects.In New technologies in aquaculture: improving productionefficiency, quality and environmental management, ch. 9(eds G. Burnell & G. Allan), pp. 244–266. Oxford,UK: Woodhead Publishing.
Soto, D. (ed.) 2009 Integrated mariculture: a globalreview. FAO fisheries and aquaculture technical paperno. 529. Rome, Italy: Food and Agriculture Organization
of the United Nations.
Phil. Trans. R. Soc. B (2010)
Soto, D. et al. 2008 Applying an ecosystem-based approachto aquaculture: principles, scales and some managementmeasures. In Building an ecosystem approach to aquaculture.FAO/Universitat de les Illes Balears Expert Workshop,Palma de Mallorca, Spain, 7–11 May 2007, FAO Fisheriesand Aquaculture Proc. No. 14 (eds D. Soto, J. Aguilar-Manjarrez & N. Hishamunda), pp. 15–35. Rome,Italy: Food and Agriculture Organization of the United
Nations.Sturrock, H., Newton, R., Paffrath, S., Bostock, J., Muir, J.,
Young, J., Immink, A. & Dickson, M. 2008 Prospectiveanalysis of the aquaculture sector in the EU. Part 2: character-isation of emerging aquaculture systems. Spain: EuropeanCommission Joint Research Centre.
Tacon, A. G. J. & Metian, M. 2008 Global overview on theuse of fish meal and fish oil in industrially compoundedaquafeeds: trends and future prospects. Aquaculture 285,
146–158. (doi:10.1016/j.aquaculture.2008.08.015)Tacon, A. G. J. & Metian, M. 2009 Fishing for feed or fish-
ing for food: increasing global competition for smallpelagic forage fish. Ambio 38, 294–302.
Tacon, A. G. J. & Metian, M. In preparation. Global trends
in feed ingredient use within the aquaculture industry: areview.
Troell, M. 2009 Integrated marine and brackishwater aqua-culture in tropical regions: research, implementation andprospects. In Integrated mariculture: a global review. FAO
fisheries and aquaculture technical paper no. 529 (ed.D. Soto), pp. 47–131. Rome, Italy: Food and AgricultureOrganization of the United Nations.
Troell, M., Tyedmers, P., Kautsky, N. & Ronnback, P. 2004
Aquaculture and energy use. In Encyclopedia of energy 1(ed. C. Cleveland), pp. 97–108. Amsterdam, TheNetherlands: Elsevier.
Tyedmers, P. & Pelletier, N. 2007 Biophysical accountingin aquaculture: insights from current practice and the
need for methodological development. In Comparativeassessment of the environmental costs of aquaculture andother food production sectors: methods for meaningfulcomparisons. FAO/WFT Expert Workshop, Vancouver,Canada, 24–28 April 2006. FAO Fisheries Proc. No. 10(eds D. M. Bartley, C. Brugere, D. Soto, P. Gerber &B. Harvey), pp. 229–241. Rome, Italy: Food and Agricul-ture Organization of the United Nations.
Tyedmers, P., Pelletier, N. & Ayer, N. 2007 Marine aquacul-ture and the sustainability of seafood production systems:
a comparative analysis. A report to the United StatesMarine Aquaculture Task Force, convened by theWoods Hole Oceanographic Institution.
Utter, F. & Epifanio, J. 2002 Marine aquaculture: genetic
potentials and pitfalls. Rev. Fish Biol. Fish. 12, 59–77.(doi:10.1023/A:1022644021870)
Verdegem, M. C. J. & Bosma, R. H. 2009 Water withdrawalfor brackish and inland aquaculture, and options to prod-uce more fish in ponds with present water use. WaterPolicy 11, 52–68.