reverse transduction measured in the living cochlea by … · reverse transduction measured in the...
TRANSCRIPT

ARTICLE
Received 24 Jun 2015 | Accepted 25 Nov 2015 | Published 6 Jan 2016
Reverse transduction measured in the livingcochlea by low-coherence heterodyneinterferometryTianying Ren1, Wenxuan He1 & Peter G. Barr-Gillespie1
It is generally believed that the remarkable sensitivity and frequency selectivity of mammalian
hearing depend on outer hair cell-generated force, which amplifies sound-induced vibrations
inside the cochlea. This ‘reverse transduction’ force production has never been demonstrated
experimentally, however, in the living ear. Here by directly measuring microstructure
vibrations inside the cochlear partition using a custom-built interferometer, we demonstrate
that electrical stimulation can evoke both fast broadband and slow sharply tuned responses of
the reticular lamina, but only a slow tuned response of the basilar membrane. Our results
indicate that outer hair cells can generate sufficient force to drive the reticular lamina over all
audible frequencies in living cochleae. Contrary to expectations, the cellular force causes a
travelling wave rather than an immediate local vibration of the basilar membrane; this
travelling wave vibrates in phase with the reticular lamina at the best frequency, and results in
maximal vibration at the apical ends of outer hair cells.
DOI: 10.1038/ncomms10282 OPEN
1 Oregon Hearing Research Center, Department of Otolaryngology, Oregon Health & Science University, Portland, Oregon 97239, USA. Correspondence andrequests for materials should be addressed to T.R. (email: [email protected]).
NATURE COMMUNICATIONS | 7:10282 | DOI: 10.1038/ncomms10282 | www.nature.com/naturecommunications 1
The electromechanical feedback system of the mammaliancochlea amplifies sound-induced vibrations using forcegenerated by outer hair cells1–11 through somatic and
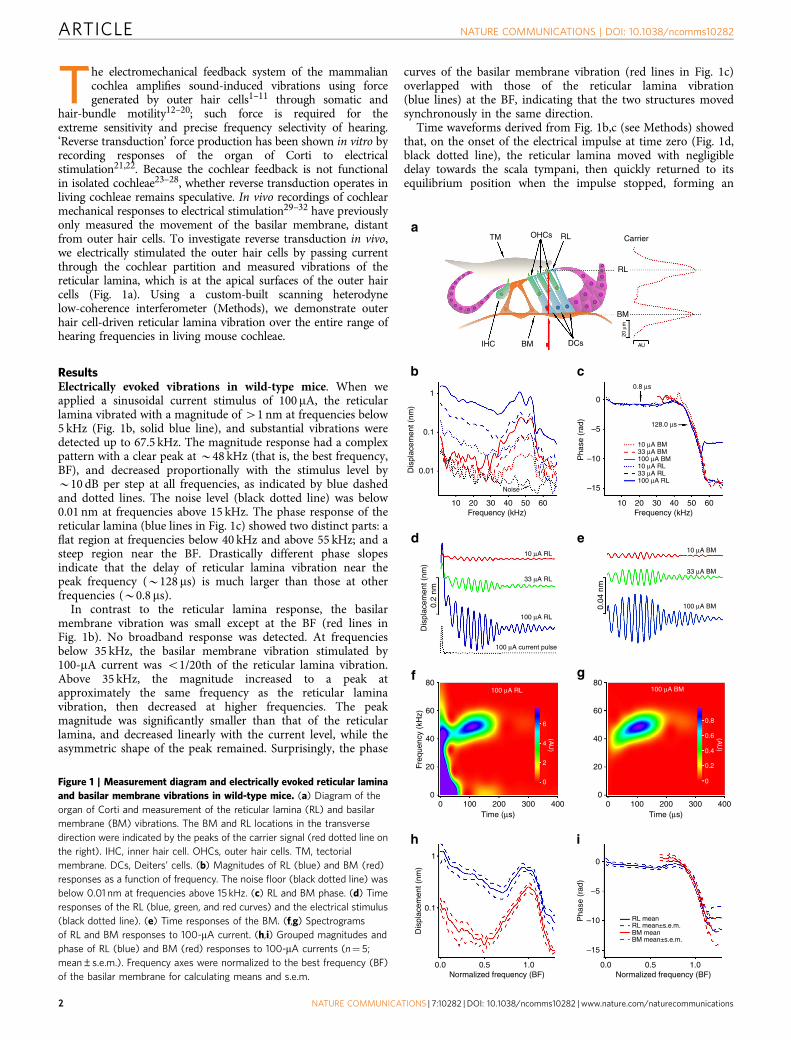
hair-bundle motility12–20; such force is required for theextreme sensitivity and precise frequency selectivity of hearing.‘Reverse transduction’ force production has been shown in vitro byrecording responses of the organ of Corti to electricalstimulation21,22. Because the cochlear feedback is not functionalin isolated cochleae23–28, whether reverse transduction operates inliving cochleae remains speculative. In vivo recordings of cochlearmechanical responses to electrical stimulation29–32 have previouslyonly measured the movement of the basilar membrane, distantfrom outer hair cells. To investigate reverse transduction in vivo,we electrically stimulated the outer hair cells by passing currentthrough the cochlear partition and measured vibrations of thereticular lamina, which is at the apical surfaces of the outer haircells (Fig. 1a). Using a custom-built scanning heterodynelow-coherence interferometer (Methods), we demonstrate outerhair cell-driven reticular lamina vibration over the entire range ofhearing frequencies in living mouse cochleae.
ResultsElectrically evoked vibrations in wild-type mice. When weapplied a sinusoidal current stimulus of 100mA, the reticularlamina vibrated with a magnitude of 41 nm at frequencies below5 kHz (Fig. 1b, solid blue line), and substantial vibrations weredetected up to 67.5 kHz. The magnitude response had a complexpattern with a clear peak at B48 kHz (that is, the best frequency,BF), and decreased proportionally with the stimulus level byB10 dB per step at all frequencies, as indicated by blue dashedand dotted lines. The noise level (black dotted line) was below0.01 nm at frequencies above 15 kHz. The phase response of thereticular lamina (blue lines in Fig. 1c) showed two distinct parts: aflat region at frequencies below 40 kHz and above 55 kHz; and asteep region near the BF. Drastically different phase slopesindicate that the delay of reticular lamina vibration near thepeak frequency (B128 ms) is much larger than those at otherfrequencies (B0.8 ms).
In contrast to the reticular lamina response, the basilarmembrane vibration was small except at the BF (red lines inFig. 1b). No broadband response was detected. At frequenciesbelow 35 kHz, the basilar membrane vibration stimulated by100-mA current was o1/20th of the reticular lamina vibration.Above 35 kHz, the magnitude increased to a peak atapproximately the same frequency as the reticular laminavibration, then decreased at higher frequencies. The peakmagnitude was significantly smaller than that of the reticularlamina, and decreased linearly with the current level, while theasymmetric shape of the peak remained. Surprisingly, the phase
curves of the basilar membrane vibration (red lines in Fig. 1c)overlapped with those of the reticular lamina vibration(blue lines) at the BF, indicating that the two structures movedsynchronously in the same direction.
Time waveforms derived from Fig. 1b,c (see Methods) showedthat, on the onset of the electrical impulse at time zero (Fig. 1d,black dotted line), the reticular lamina moved with negligibledelay towards the scala tympani, then quickly returned to itsequilibrium position when the impulse stopped, forming an
TMa
b
d
f
h i
e
g
c
IHC
10
100 200 300 4000
20 30Frequency (kHz)
Dis
plac
emen
t (nm
)
Dis
plac
emen
t (nm
)Fr
eque
ncy
(kH
z)
Pha
se (
rad)
40
Normalized frequency (BF) Normalized frequency (BF)0.5 0.51.0 1.00.0 0.0
Noise
128.0 μs
10 μA BM
RL mean
BM meanRL mean±s.e.m.
BM mean±s.e.m.
10 μA BM
33 μA BM
33 μA BM
100 μA BM
100 μA BM
10 μA RL33 μA RL
33 μA RL
Time (μs)100 200 300 4000
Time (μs)
100 μA RL
100 μA RL
100 μA RL 100 μA BM
6 0.8
0.6
0.4
0.2
0
4
(AU
)
(AU
)
2
0
100 μA current pulse
10 μA RL
0.8 μs
50 60 10 20 30Frequency (kHz)
40 50 60
1
0.1
0.01
Dis
plac
emen
t (nm
)
1
0.1
80
60
40
20
0
80
60
40
20
0
0.2
nm
0.04
nm
–15
–10
–5
0
Pha
se (
rad)
–15
–10
–5
0
BM
Carrier
AU
BM
20 μ
m
DCs
OHCs RL
RL
Figure 1 | Measurement diagram and electrically evoked reticular lamina
and basilar membrane vibrations in wild-type mice. (a) Diagram of the
organ of Corti and measurement of the reticular lamina (RL) and basilar
membrane (BM) vibrations. The BM and RL locations in the transverse
direction were indicated by the peaks of the carrier signal (red dotted line on
the right). IHC, inner hair cell. OHCs, outer hair cells. TM, tectorial
membrane. DCs, Deiters’ cells. (b) Magnitudes of RL (blue) and BM (red)
responses as a function of frequency. The noise floor (black dotted line) was
below 0.01 nm at frequencies above 15 kHz. (c) RL and BM phase. (d) Time
responses of the RL (blue, green, and red curves) and the electrical stimulus
(black dotted line). (e) Time responses of the BM. (f,g) Spectrograms
of RL and BM responses to 100-mA current. (h,i) Grouped magnitudes and
phase of RL (blue) and BM (red) responses to 100-mA currents (n¼ 5;
mean±s.e.m.). Frequency axes were normalized to the best frequency (BF)
of the basilar membrane for calculating means and s.e.m.
ARTICLE NATURE COMMUNICATIONS | DOI: 10.1038/ncomms10282
2 NATURE COMMUNICATIONS | 7:10282 | DOI: 10.1038/ncomms10282 | www.nature.com/naturecommunications

initial large peak (Fig. 1d, blue line). Before returning tothe resting position, a periodic oscillation started. This delayedresponse reached its maximum at B100 ms and graduallydecreased to a minimum at B200 ms. A second episode of smallperiodic oscillations occurred between 200 and 350 ms.The magnitude of the time waveforms decreased linearly withcurrent level (green and red lines in Fig. 1d,e). The exponentialdecay with a time constant of B28ms (solid blue line in Fig. 1d)likely resulted from a decrease in the outer hair cell’s membranepotential. Except for the lack of initial peak, the delayed periodicvibrations of the basilar membrane (Fig. 1e) were similar to thoseof the reticular lamina.
A spectrogram showed that the reticular lamina fast responseoccurred immediately on impulse onset and extended to460 kHz, while the delayed response was detected only nearthe BF (Fig. 1f). In addition, the instantaneous frequency ofthe delayed response increased with time33–37 and reached theBF at B100 ms. By contrast, the spectrogram of the basilarmembrane vibration showed only the delayed component nearthe BF (Fig. 1g). Frequency responses, time waveforms, andspectrograms were similar across animals. Grouped data from100-mA stimulation (Fig. 1h,i) were similar to those of Fig. 1b,c,with the exception that the peak frequency of the reticular laminawas slightly lower than that of the basilar membrane. Thus, inliving mouse cochleae, electrically evoked reticular laminavibration includes a fast broadband component and a delayedsharply tuned component, while the basilar membrane vibrationshows only the delayed response.
Acoustically evoked vibrations in wild-type mice. To determinethe physiological relevance of the reticular lamina and basilarmembrane responses to electrical stimulation, we measuredacoustically induced responses using 30-dB SPL pure tones(Fig. 2). Contrasting with the responses to electrical stimulation,both reticular lamina and basilar membrane responses to toneswere sharply tuned and their phase decreased quickly near thepeak frequency (Fig. 2a,b). Time waveforms and spectrogramsshowed only the delayed tuned component, but no fastbroadband response (Fig. 2c–f). Consistent with the electricallyevoked responses, grouped acoustically induced reticular laminavibrations were significantly larger than basilar membraneresponses and they were in phase at the BF (Fig. 2g,h).The similarity of acoustically and electrically inducedresponses indicates that the delayed response caused by electricalstimulation is a conventional cochlear travelling wave.
Electrically evoked vibrations in TectaC1509G/C1509G mice. Todetermine the role of functional cochlear feedback on reversetransduction, we measured electrically evoked reticular laminaand basilar membrane vibrations in TectaC1509G/C1509G mice(referred to here as TectaG/G). Because of deficientmechanoelectrical transduction38 and altered tectorial membraneresonance39–44 caused by the shortened tectorial membrane(Fig. 3a), these mice have no functional cochlear feedback andsuffer from severe hearing loss (blue line in Fig. 3b) but havenormal electrically evoked otoacoustic emissions. In these mice,the reticular lamina response to 100-mA current again displayed alarge broadband response, but strikingly did not show a responsepeak or fast phase accumulation near the BF (blue lines inFig. 3c,d). The basilar membrane vibration (red line in Fig. 3c)was much smaller than the reticular lamina vibration. The timewaveform and spectrogram of the reticular lamina responseshowed only an initial peak and fast broadband response, butno delayed component (Fig. 3e,g); the time waveform andspectrogram of the basilar membrane (Fig. 3f,h) showed no
significant response. This observation was confirmed by thegrouped data from seven TectaG/G mice (Fig. 3i,j). These dataunambiguously show that reverse transduction can generatesubstantial force over all audible frequencies and is not tuned, anddemonstrate that the delayed tuned response depends on afunctional cochlear feedback system. Furthermore, because thedecoupling between hair bundles and the shortened tectorialmembrane in TectaG/G mice38 did not decrease the reticularlamina vibration significantly, the data also suggest that reverse
0.1
a
c
e
g h
f
d
b0
–10
–200.01
0.1
0.01
8030 dB SPL RL 30 dB SPL BM
1.0
0.5
(AU
)
(AU
)
0.0 0.0
0.1
0.2
0.360
40
20
0
80
60
40
20
–10
–20
0
0
0 100
0.0 0.5
Normalized frequency (BF)
1.0 0.0 0.5
Normalized frequency (BF)
1.0
200Time (μs)
300 400 0 100 200Time (μs)
300 400
0.05 0.05
0.00 0.00
–0.05 –0.05
10
RL 30 dB SPLBM 30 dB SPL
RL mean
BM meanBM mean±s.e.m.
RL mean±s.e.m.
20 30Frequency (kHz)
Freq
uenc
y (k
Hz)
Frequency (kHz)40 50 60 100 20 30 40 50 60
Dis
plac
emen
t (nm
)D
ispl
acem
ent (
nm)
Dis
plac
emen
t (nm
)
Pha
se (
rad)
Pha
se (
rad)
Figure 2 | Acoustically evoked reticular lamina and basilar membrane
vibrations in wild-type mice. (a) Magnitudes of reticular lamina (RL)
(blue) and basilar membrane (BM) (red) responses to 30-dB SPL tones as a
function of frequency. (b) RL and BM phase responses. (c) The time
waveform of the RL response showed only delayed periodic oscillations
without the initial peak. (d) Time waveform of the BM is similar to the RL
response except for a small magnitude. (e,f) Spectrograms of the
RL and BM only show the delayed tuned component. (g,h) Grouped
magnitudes and phase of the RL (blue) and BM (red). Data are presented
as mean±s.e.m. (n¼ 7).
NATURE COMMUNICATIONS | DOI: 10.1038/ncomms10282 ARTICLE
NATURE COMMUNICATIONS | 7:10282 | DOI: 10.1038/ncomms10282 | www.nature.com/naturecommunications 3

transduction is likely to depend on the somatic motility of theouter hair cells.
Salicylate reduces electrically evoked vibrations. We confirmedthe role of the somatic motility of outer hair cells by examiningthe effect of sodium salicylate45,46. Local application of sodiumsalicylate reduced acoustically evoked distortion productotoacoustic emissions (Fig. 4a,b), as well as electrically evokedreticular lamina and basilar membrane vibrations (Fig. 4c,d) tothe noise floor. Salicylate inhibits outer hair cell somatic motilityin vitro47 and in situ21, and suppresses electrically evokedotoacoustic emissions and the cochlear amplifier in vivo48,49,likely by interacting with chloride50. Our results are thusconsistent with somatic motility underlying reverse transduction.
DiscussionSince the apical surfaces of outer hair cells are a part of the reticularlamina, but their bases connect to the basilar membrane throughthe Deiters’ cells38,51, force generated by the somatic motility ofouter hair cells is coupled directly to the reticular laminabut indirectly to the basilar membrane (Fig. 5a). In their in vitroexperiments, Mammano and Ashmore21 interpreted electricallyevoked antiphase motions of the basilar membrane and thereticular lamina in isolated cochlea (Fig. 5b) as direct evidence thatcochlear amplification arises from the outer hair cells. Here westudied reverse transduction of outer hair cells in the living cochleawith physiologically relevant stimuli. While membrane potentialchange of outer hair cells induced by the 33-mA current (B4 mV;see Methods) is comparable to that caused by B19% modulationof the transducer channel conductivity at B50 kHz52, the actualmembrane potential change likely was smaller because the reticularlamina vibration was not saturated at 100-mA current level(Fig. 1b,d), and the directly measured transmembrane potential ofouter hair cells induced by a 200-mA current was about 0.5 mV inisolated cochleae21. Thus, the large fast broadband response of thereticular lamina in vivo (Fig. 1b,d,f,h and the blue line at 5ms inFig. 5c) demonstrated that reverse transduction-generated forcecan drive the reticular lamina over the entire audible frequencyrange in the living mouse cochlea (Fig. 5d). The negligible fastresponse of the basilar membrane at frequencies below the BFindicates that the structure of the basal region of the living mousecochlea is very stiff, that hair cells are coupled inefficiently to thebasilar membrane, or both. The delayed sharply tuned response(Figs 1 and 5c at 100ms) and its similarity to the acousticallyevoked response (Fig. 2) indicates that electrical stimulationinduces a conventional basilar membrane travelling wave32
(Fig. 5e).
The phase relationship between the reticular lamina and basilarmembrane vibration is critical because it determines how thecochlea feedback system works21,22,40,53–62. Surprisingly, wefound the basilar membrane vibrates in phase with the reticularlamina at the BF. As the basilar membrane vibration travelsforward, it reaches its maximum at the BF location. When the
ShortenedTM
a
c
e
g
i
h
j
f
d
bDecoupled
hair bundlesRL
IHC BM
Sou
nd le
vel (
dB S
PL)
Pha
se (
rad)
Pha
se (
rad)
Dis
plac
emen
t (nm
)D
ispl
acee
mnt
(nm
)D
ispl
acem
ent (
nm)
100
80
60
40
20
TectaG/G (n=6)CBA/CaJ (n=10)
100 μA BM
100 μA BM
100 μA RL
RL mean
BM meanRL mean±s.e.m.
BM mean±s.e.m.
100 μA RL
30
25
20
(AU
)
15
10
5
0
Time (μs) Time (μs)
0
0
1
0.1
0.01
0.4
0.2
0.0
80
60
40
20
0
1
0.1
0.01
80
60
40
20
0
0
–5
–10
0 100 200 300 400 0 100 200 300 400
–0.2
0.4
0.2
0.0
–0.2
–5
–10
10 20 30Frequency (kHz)
Frequency (kHz)Frequency (kHz)
Freq
uenc
y (k
Hz)
40 50 60
10 20 30 40 50 60
Frequency (kHz)10 20 30 40 50 60
Frequency (kHz)10 20 30 40 50 60
10 20 30 40 50 60
Figure 3 | Electrically evoked reticular lamina and basilar membrane
vibrations in TectaG/G mice. (a) Diagram shows the shortened and
detached tectorial membrane (TM), which disables mechanoelectrical
transduction of outer hair cells and the cochlear feedback system.
(b) Thresholds of compound action potentials of the auditory nerve.
(c) Magnitudes of reticular lamina (RL) (blue) and basilar membrane (BM)
(red) responses to 100-mA sinusoidal currents as a function of frequency.
(d) RL phase response. The BM phase is not shown because it was
dominated by noise due to the low response amplitude. (e) The time
waveform of the RL response shows only an initial peak and no delayed
periodic oscillation. (f) Time waveform of the BM shows no significant
response. (g) Spectrogram of the RL demonstrates only the fast broadband
component. (h) Spectrogram of the BM shows no fast or delayed
component. (i) Grouped magnitudes of the RL (blue) and BM (red)
responses to 100-mA currents. (j) Grouped RL phase. Data are presented by
mean and standard error (mean±s.e.m., n¼ 7).
ARTICLE NATURE COMMUNICATIONS | DOI: 10.1038/ncomms10282
4 NATURE COMMUNICATIONS | 7:10282 | DOI: 10.1038/ncomms10282 | www.nature.com/naturecommunications

outer hair cells ride on the basilar membrane travelling wave, theyalso change their length in response to the membrane potentialchange caused by mechanoelectrical transduction current. Thein-phase vibration of the reticular lamina and basilar membraneresults in maximal vibration at apical ends of outer hair cells(Fig. 5f), which increases hearing sensitivity.
The current in vivo data showing that the electrically evokedreticular lamina vibration was larger than the basilar membranevibration is consistent with previous in vitro observations21. Thein-phase vibrations of the reticular lamina and basilar membranenear the BF observed in the current experiment do not necessarilyconflict with observations of antiphase vibration recorded in vitroat very low frequencies. Antiphase vibrations could not observed inour experiments because the electrically evoked basilar membranevibration cannot be detected at very low frequencies due to sharptuning in living cochleae. While the current magnitude data, whichshow that the reticular lamina vibration is larger than the basilarmembrane vibration, are similar to those in guinea pigs53, thepresent data show no significant phase or BF difference betweenthe reticular lamina and basilar membrane vibrations near theresponse peak. Compared with the mouse apical micromechanicaldata26,63, although vibrations of both the reticular lamina andtectorial membrane were larger than the basilar membranevibration, the tectorial membrane, but not the reticular laminavibration, phase leads the basilar membrane phase near the bestfrequencies. These data suggest a phase difference between thereticular lamina and tectorial membrane, which may correspond tothe expected shearing motion as hair bundles are deflected.The inconsistency between the present study and others likely
resulted from differences in phase detection techniques, animalspecies and measurement locations. Despite these differences, allcochlear micromechanical measurements demonstrate a complexmechanical response inside the cochlear partition, which requiresfurther refined measurements to reveal its mechanism and roles inhearing.
In summary, reverse transduction generates substantial forcein vivo at all audible frequencies, and this remarkably fast cellularforce is produced mainly through somatic motility of outerhair cells. Moreover, force elicited by outer hair cells causes aconventional basilar membrane travelling wave rather thansimply an immediate local vibration of the basilar membrane.The travelling wave vibrates in phase with the reticular laminanear the BF, which results in maximal vibration at the apical endsof outer hair cells and consequently boosts hearing sensitivity.
MethodsAnimals. Forty-one CBA/CaJ and 23 TectaG/G mice38 at age of 3 to 5 weeks ofeither sex were used in this study. The animal use protocol was approved by theOregon Health & Science University Institutional Animal Care and UseCommittee.
The custom-built heterodyne low-coherence interferometer. Different fromcoherent light, such as laser light, low-coherence light has a constant wavelengthand phase only over a small distance along the light beam. Taking advantage of thesmall coherence length, an interferometer using low-coherence light can measurevibration with a high axial resolution26,53,64,65. Low-coherence light with centralwavelength of 680 nm and spectral width of B10 nm was coupled into asingle-mode optic fibre. The collimated light beam was divided into the object andreference beams at polarizing beam splitter BS1 (Fig. 6a). The object light throughbeam splitter BS2 was focused on the cochlear partition through a long-working-
20a
b d
c
1
0.1
0.01
0
0
–5
–10
–15
–20
–5
0
5
Salicylate
RL
RL after sal.BM after sal.
BM
Noise
Time (s) Frequency (kHz)
0 50 100 150 200 10 20 30 40 50 60
Sou
nd le
vel (
dB S
PL)
Dis
plac
emen
t (nm
)
Pha
se (
rad)
Pha
se (
rad)
Figure 4 | Sodium salicylate suppressed electrically evoked reticular lamina and basilar membrane vibrations. (a) Magnitude of acoustically evoked
distortion product otoacoustic emission at 27 kHz (red solid line) and the noise floor (black dotted line). Salicylate induced a significant decrease of
the otoacoustic emission in less than 3 min. (b) The phase of the otoacoustic emission became random when the magnitude approached the noise floor.
(c) Magnitudes of reticular lamina (RL) and basilar membrane (BM) responses to 100-mA currents before (solid) and after (dotted) sodium salicylate
application. Salicylate reduced the RL and BM responses to the noise floor. (d) Phase responses of the RL and BM before salicylate application.
NATURE COMMUNICATIONS | DOI: 10.1038/ncomms10282 ARTICLE
NATURE COMMUNICATIONS | 7:10282 | DOI: 10.1038/ncomms10282 | www.nature.com/naturecommunications 5

distance objective lens (Plan Apo � 20, numerical aperture (NA) 0.42, Mitutoyo,Japan). Doppler-shifted backscattered light was collected and sent back to beamsplitter BS3 through the objective lens and BS2. The reference light with frequencymodulated by a Bragg cell was combined with backscattered object light at BS3 andprojected onto a photodetector. When the lengths of the object and reference armswere equal, achieved by moving the mirror, interference occurred. The vibrationmagnitude and direction in the optical axis was derived from the electrical signal ofthe detector using a digital frequency demodulator.
Sensitivity and frequency response of the interferometer were demonstrated bymeasuring vibration of a miniature front mirror driven by a piezoelectric actuatorthrough a 2.5-OD neutral density filter. The piezoelectric actuator was calibratedusing a laser interferometer. The noise floor was o1 pm at frequencies above 8 kHz(Fig. 6c), and the frequency response was approximately flat up to 100 kHz (solidred curve). The measured displacement increased linearly with vibrationmagnitude from 0.01 to 1,000 nm (Fig. 6d). The level of the backscattered light, thatis, carrier, from a glass surface in air as a function of the distance from the focallocation had full-width at half maximum (FWHM) of B13mm, equivalent toB10mm in water (Fig. 6e). FWHM was determined by the coherence length of thelight, NA of the objective lens, and refractive index of the media. Thus, ourlow-coherence interferometer had sufficient sensitivity, frequency bandwidth, andaxial resolution for measuring the reticular lamina and basilar membranevibrations at high frequencies in mouse cochleae.
Measurement of the cochlear partition vibration. Animal experiments wereconducted on a vibration isolation table inside an acoustically attenuated double-wall booth. Under anaesthesia induced by ketamine and xylazine (100 mg kg� 1
and 10 mg kg� 1 intraperitoneally), a tracheotomy was performed and natural freebreathing was maintained. Body temperature was kept at 38 �C using a heatingblanket that was feedback-controlled through a rectal temperature probe. Theanimal’s head was held firmly using a custom-built holder, which was mounted ona three-dimensional translational stage with rotation capability. The surgery forvisualizing the cochlear partition through the intact round widow membrane was
developed based on previous methods used for gerbils24,66,67 and mice5. Aventrolateral surgical approach was used to expose the left bulla and to transect theexternal ear canal. An acoustic probe connected with two electrostatic speakers(EC1, Tucker-Davis Technologies, Alachua, FL) and a microphone was coupled tothe remaining bony ear canal to form a closed sound field. Two tones at f1 and f2frequencies of 36 and 45 kHz and at 50 dB SPL (referred to 20 mPa) werecontinuously presented to the ear canal, and the evoked distortion productotoacoustic emission at 2f1–f2 (27 kHz) was displayed on a dynamic signal analyzer(SR785, Stanford Research Systems, Sunnyvale, CA) and recorded through a digitallock-in amplifier (SR830 DSP, Stanford Research Systems, Sunnyvale, CA). Nosignificant change in distortion product otoacoustic emission was assured duringexperiments. Hearing sensitivity was also confirmed by measuring the compoundaction potential of the auditory nerve68.
When the basilar membrane was positioned approximately in the horizontalplane, a white light beam through an optical fibre was brought close to the lateralbony wall of the scala vestibuli and scala media. With this transillumination,landmarks of the cochlear partition were visible through the intact round windowmembrane. Under direct visualization, low-coherence light from the interferometerwas focused on the center of the outer hair cell region through the long-working-distance objective lens (Fig. 6b). The transverse locations of the basilar membraneand reticular lamina were determined by measuring the backscattered light level asthe focal spot scanned along the transverse direction through the outer hair cellregion. Scanning was performed by a computer-controlled three-dimensionalpositioning system24,66–68. As the focal spot moved from the scala tympani to scalamedia, the backscattered light level increased and formed a peak (red dotted line onthe right in Fig. 1a and red and blue lines in Fig. 6h), where the image of the focalspot of the low-coherence light beam was the sharpest. The light level thendecreased and increased, forming the second peak at the reticular lamina location.Because of the transition of refractive index at the interfaces between the cochlearfluid and basilar membrane and between outer hair cells and the tectorialmembrane, the backscattered light increased at these locations. The carrier signalwas also likely enhanced by the integration of the spatially coherent backscatteredlight from the tissue in the focal spot, that is, low-coherence-enhanced
RLa d
e
f
b
c
RL
DC
RL
RL
RL
DCs
FOHC
FOHC
FOHC
+P
–P
In vitro
BM BM
Apex
BF
At time 5 μs
At time 100 μs100 μs5 μs
100
μA0.
3 nm
BM
BM
BM
Current
BM
DC
OHCs
Figure 5 | Effects of outer hair cell-generated force on cochlear micromechanics in vitro and in vivo. (a) The structure formed by the triangle of Corti and
the reticular lamina (RL) is likely rigid, so outer hair cell (OHC)-generated force can act directly on the RL and indirectly on the basilar membrane (BM)
through Deiters’ cells (DCs). (b) Antiphase motion of the RL and BM recorded in vitro indicates that the cellular force pulls the RL and BM together and
causes the rigid structure to rotate towards scala tympani21. (c) Time waveforms of RL and BM responses to a 100-mA electrical impulse in living cochlea.
(d) An impulse current induced a large fast RL displacement at time 5 ms without significant BM response in vivo. (e) Like an externally given acoustic click,
the electrical impulse evoked a conventional travelling wave, that is, the delayed tuned response. (f) At time B100 ms, the travelling wave reached the
maximum at the best frequency (BF) location. When OHCs rode on the BM, they changed their length in response to membrane voltage variation caused
by mechanoelectrical transduction current. The in-phase vibrations of the RL and BM results in a maximum vibration at the apical ends of OHCs. FOHC, OHC
force. þ P and � P, the travelling wave-related pressures in scala media (þ P) and scala tympani (� P).
ARTICLE NATURE COMMUNICATIONS | DOI: 10.1038/ncomms10282
6 NATURE COMMUNICATIONS | 7:10282 | DOI: 10.1038/ncomms10282 | www.nature.com/naturecommunications

backscattering69. Thus, the two peaks of the carrier signal were used to determinethe basilar membrane and reticular lamina locations in the transverse direction.This assignment was supported by the observation that the B49-mm separationbetween the two peaks of carrier signal (Fig. 6h) is comparable to the distancebetween the basilar membrane and reticular lamina at the base of mouse cochlea(B50 mm)38,51. Furthermore, magnitudes and phase of the cochlear partitionvibration in response to acoustical stimuli at the basilar membrane location weredifferent from those at the reticular lamina location (Fig. 6f,g), confirming distinctmechanical properties at the two locations.
The current experimental method is advantageous both because the cochlearemained intact, that is, unopened, and because both reticular lamina and basilarmembrane vibrations could be measured through the intact round windowmembrane. This configuration allowed us to study reverse transduction in thehealthy cochlea, where cochlear feedback is functional. In addition to its sufficientspatial and temporal resolution, our heterodyne low-coherence interferometer hasan exceptionally low noise floor (o1 pm in Fig. 6c). This sensitivity is critical formeasuring high-frequency cochlear partition vibration in the mouse cochleabecause vibration at the cochlear base is much smaller than that at the apex. Due toits use of the heterodyne principle, our low-coherence interferometer also has awide dynamic range, no 180-degree phase ambiguity, and high temporal resolution.
Electrical stimulation of the cochlea. Using a custom-made micro drill, twoB30-mm holes were made on the lateral bony walls of the scala tympani and scalamedia at the same longitudinal location as for the vibration measurement at thefirst turn (B0.85 mm from the cochlear base). Two electrodes made of 25-mmdiameter platinum–iridium wire were used to deliver the electrical current. Toavoid high-frequency hearing loss, the electrode in the lateral wall of the scalamedia was inserted through the bony layer but not soft tissues, while the tip of theother electrode was advanced into the scala tympani’s perilymph. Due to therelatively high electrical conductance of the soft tissue and the cochlear fluid, theelectrical impedance between the two electrodes was o100 kO. Current passingthrough the electrodes created an electrical field that activated reverse transductionof outer hair cells. To estimate resulting membrane potential change of outer haircells, current injection-induced AC potential in the scala media was recorded usinga micro glass electrode referred to the scala tympani potential70 in three CBA/caJmice. A 33-mA sinusoidal current at 50 kHz, which evoked the cochlear partitionvibrations comparable to those induced by B30-dB SPL tones, resulted inB66-mV scala media AC potential. According to the equivalent electrical circuitfor the outer hair cell52, assuming that the capacitance of hair-bundle bearingmembrane is much smaller than that of the basolateral membranes, the ratio of theresulting membrane AC potential of the outer hair cells (Vm) to the AC potential inthe scala media (Vsc) was derived from equation Vm/Vsc¼ 1/(1þ q*(1þ j*f/fc)),where f is the stimulus frequency, fc the cutoff frequency of the outer hair cell, j thesquare root of minus one, and q the ratio of the conductance of the hair bundle atrest (GMT0) to the basolateral conductance (GK). On the basis of establishedparameters by Johnson et al.52, the AC membrane potential induced by a 33-mAcurrent was B4.1 mV, which is B6.2% of the AC potential over the scala media.After the electrodes were fixed on the bony edge of the opened bulla using dentalcement, the animal’s head was adjusted to the position for vibration measurement.
Although all animals survived anaesthesia and surgery, insensitive cochlearconditions and poor transparency of the round window membrane often preventedus from collecting useful data. Drilling into the cochlea and installing electrodesoften caused high-frequency hearing loss. Despite these technical difficulties,sufficient data were collected for this study; micromechanical data reported in thispaper were collected from 12 of 41 wild-type mice and 7 of 23 TectaG/G mice.Compound action potentials were recorded from 10 wild-type and 6 TectaG/G mice.
Signal generation and data acquisition. A computer-controlled digital lock-inamplifier (SR830 DSP, Stanford Research Systems, Sunnyvale, CA) was used forsignal generation and data acquisition. A continuous sinusoidal signal wasgenerated by the internal function generator of the lock-in amplifier. The frequencyof the signal was changed from 0.75 to 67.5 kHz by 0.75 kHz per step, and thecurrent level was varied from 100 to 10 mA by B10 dB per step. The sinusoidalsignal was used to drive an optically isolated current stimulator to generateconstant currents. The electrodes were connected to the output of the currentstimulator with shielded wire. A 1-kO resistor was connected in the output circuitin series, and the current level was monitored by measuring the voltage across theresistor.
Since B4-ms electrical pulses were used to stimulate the reverse transduction inthe isolated cochlea21, we used similar electrical current pulses to stimulate theliving cochlea in pilot experiments of this study. Electrical current pulses up to100 mA did not evoke significant basilar membrane vibration. Currents largerthan 100 mA were not used because they distorted the stimulus and produced
Fibera
b
c
d
e h
g
f
Collimator
BS1
BS4
Bragg cell
Detector
Apex
1 pm
50 dB SPL CBA/CaJ
70 dB SPL TectaG/G
y=0.99629x
∼12 dB
20 0 50 100 150 200
0 50 100 150 200
0 50 100 150 200
40Frequency (kHz)
60 80 100
100
4
3
2
1
0
0
–2
–4
–6
10–1
10–2
10–3
Dis
plac
emen
t (nm
)D
ispl
acem
ent (
nm)
Car
rier
leve
l (a.
u.)
Car
rier
leve
l (a.
u.)
Pha
se (
rad)
Displacement (nm)
Distance from focal plane (μm) Transverse location (μm)
Dis
plac
emen
t (nm
)
10–4
10–5
1,000
1,000
100
100
10
10
1
1
0.1
0.10.01
1.0
0.8
0.6
0.2
0.4
0.0
1.0
0.8
0.6
0.4
0.2
0.0
0.01
–40 –20
Below Above BM RL
∼13μm
FWHM
0 20 40
150 μm
Base
Lenses
Z
Y X
BS3
BS2
Videocamera
Dichroicmirror
Osseousspiral lamina
Focallocation
Fiberilluminator
Mirror
Figure 6 | The custom-built heterodyne low-coherence interferometer
and its performance. (a) Diagram of the interferometer. BS1-4, polarization
maintaining beam splitters. (b) The intravital image of the cochlear partition
taken through the intact round window membrane using the microscope
with white light transillumination. The object light beam was focused on the
outer hair cell region, which was confirmed visually by changing the focal
plane. (c) The noise floor of the measurement is o1 pm at frequency above
8 kHz (red dotted line), and the frequency response is up to 100 kHz (red
solid line). (d) The displacement measured using the low-coherence
interferometer increased linearly with vibration magnitude from 0.01 to
1,000 nm. (e) The peak of the backscattered light level from a glass surface
in air had full-width at half maximum (FWHM) B13mm, equivalent to
B10mm in water, which was determined by the coherence length of the
light and numerical aperture of the objective lens. (f,g) Magnitude and
phase responses to acoustical stimuli in a wild-type (red) and a TectaG/G
(blue) mouse as a function of the transverse location. (h) The carrier signal
peaked at the BM and RL locations.
NATURE COMMUNICATIONS | DOI: 10.1038/ncomms10282 ARTICLE
NATURE COMMUNICATIONS | 7:10282 | DOI: 10.1038/ncomms10282 | www.nature.com/naturecommunications 7

high-frequency hearing loss. The lack of electrical pulse-induced responses wascaused likely by high stiffness and best frequencies of the cochlear partition at thebase of the mouse cochlea. At the apex, where the BF and stiffness are low,electrical pulses are expected to produce significant responses.
When the object beam of the interferometer was focused on the basilarmembrane, or reticular lamina, electrical or acoustical stimuli at differentfrequencies and levels were delivered to the cochlea. The magnitude and phase ofthe output signal at the stimulus frequency from the interferometer were measuredby the lock-in amplifier and recorded on a computer.
Local application of sodium salicylate. After the electrically evoked reticularlamina and basilar membrane vibrations were measured under the normal cochlearcondition, a small crystal (B0.027 mm3) of sodium salicylate (Sigma-Aldrich, Inc.,Milwaukee, WI) was placed on the round window membrane48. Once the effect ofsodium salicylate was confirmed by a significant decrease of acoustically evokeddistortion product otoacoustic emissions, the electrically evoked reticular laminaand basilar membrane vibrations were measured again. The effect of salicylate onthe reverse transduction of the outer hair cells was shown by the difference betweenthe reticular lamina responses before and after the salicylate application.
Data analysis and statistical methods. Igor Pro (Version 6.35A5, WaveMetrics,Lake Oswego, OR) was used for processing and analysing the data. The frequencybandwidth of the reverse transduction was presented by plotting magnitude andphase of the reticular lamina response as a function of frequency. The delaysintroduced by the interferometer and the current stimulator were removed fromthe presented data. To show the temporal response, time waveforms were obtainedthrough inverse fast Fourier transform of the frequency-domain data. The electricalimpulse was derived from the magnitude and phase spectra of the current from thestimulator at current level of 100mA. The electrical impulse is a brief (B5 ms) pulse(dotted black line in Fig. 1d) not a step input. The spectrograms were producedthrough Wigner transform of time waveforms. The grouped results were presentedby mean and s.e.m. calculated across the animals at given stimulus level, frequencyand cochlear conditions.
References1. Dallos, P. Cochlear amplification, outer hair cells and prestin. Curr. Opin.
Neurobiol. 18, 370–376 (2008).2. Ashmore, J. et al. The remarkable cochlear amplifier. Hear. Res. 266, 1–17
(2010).3. Hudspeth, A. J. Making an effort to listen: mechanical amplification in the ear.
Neuron 59, 530–545 (2008).4. Fettiplace, R. Active hair bundle movements in auditory hair cells. J. Physiol.
576, 29–36 (2006).5. Russell, I. J. et al. Sharpened cochlear tuning in a mouse with a genetically
modified tectorial membrane. Nat. Neurosci. 10, 215–223 (2007).6. de Boer, E. On active and passive cochlear models--toward a generalized
analysis. J. Acoust. Soc. Am. 73, 574–576 (1983).7. Neely, S. T. Mathematical modeling of cochlear mechanics. J. Acoust. Soc. Am.
78, 345–352 (1985).8. Davis, H. An active process in cochlear mechanics. Hear. Res. 9, 79–90 (1983).9. Gold, T. Hearing.II. The physical basis of the action of the cochlea. Proc. Natl
Acad. Sci. USA 135, 492–498 (1948).10. Reichenbach, T. & Hudspeth, A. J. The physics of hearing: fluid mechanics and
the active process of the inner ear. Rep. Prog. Phys. 77, 076601 (2014).11. Ni, G., Elliott, S. J., Ayat, M. & Teal, P. D. Modelling cochlear mechanics.
Biomed. Res. Int. 2014, 150637 (2014).12. Brownell, W. E., Bader, C. R., Bertrand, D. & de Ribaupierre, Y. Evoked
mechanical responses of isolated cochlear outer hair cells. Science 227, 194–196(1985).
13. Martin, P., Bozovic, D., Choe, Y. & Hudspeth, A. J. Spontaneous oscillation byhair bundles of the bullfrog’s sacculus. J. Neurosci. 23, 4533–4548 (2003).
14. Ricci, A. Active hair bundle movements and the cochlear amplifier. J. Am.Acad. Audiol. 14, 325–338 (2003).
15. He, D. Z. & Dallos, P. Somatic stiffness of cochlear outer hair cells isvoltage-dependent. Proc. Natl Acad. Sci. USA 96, 8223–8228 (1999).
16. Zheng, J. et al. Prestin is the motor protein of cochlear outer hair cells. Nature405, 149–155 (2000).
17. Santos-Sacchi, J. Asymmetry in voltage-dependent movements of isolated outerhair cells from the organ of Corti. J. Neurosci. 9, 2954–2962 (1989).
18. Bozovic, D. & Hudspeth, A. J. Hair-bundle movements elicited bytransepithelial electrical stimulation of hair cells in the sacculus of the bullfrog.Proc. Natl Acad. Sci. USA 100, 958–963 (2003).
19. Liberman, M. C. et al. Prestin is required for electromotility of the outer haircell and for the cochlear amplifier. Nature 419, 300–304 (2002).
20. Kennedy, H. J., Crawford, A. C. & Fettiplace, R. Force generation bymammalian hair bundles supports a role in cochlear amplification. Nature 433,880–883 (2005).
21. Mammano, F. & Ashmore, J. F. Reverse transduction measured inthe isolated cochlea by laser Michelson interferometry. Nature 365, 838–841(1993).
22. Nowotny, M. & Gummer, A. W. Nanomechanics of the subtectorial spacecaused by electromechanics of cochlear outer hair cells. Proc. Natl Acad. Sci.USA 103, 2120–2125 (2006).
23. Robles, L. & Ruggero, M. A. Mechanics of the mammalian cochlea. Physiol. Rev.81, 1305–1352 (2001).
24. Ren, T. Longitudinal pattern of basilar membrane vibration in the sensitivecochlea. Proc. Natl Acad. Sci. USA 99, 17101–17106 (2002).
25. Rhode, W. S. Observations of the vibration of the basilar membrane in squirrelmonkeys using the Mossbauer technique. J. Acoust. Soc. Am. 49, 1218–1231(1971).
26. Lee, H. Y. et al. Noninvasive in vivo imaging reveals differences betweentectorial membrane and basilar membrane traveling waves in the mousecochlea. Proc. Natl Acad. Sci. USA 112, 3128–3133 (2015).
27. Versteegh, C. P. & van der Heijden, M. Basilar membrane responses to tonesand tone complexes: nonlinear effects of stimulus intensity. J. Assoc. Res.Otolaryngol. 13, 785–798 (2012).
28. Cooper, N. P. & Rhode, W. S. Basilar membrane tonotopicity in the hookregion of the cat cochlea. Hear. Res. 63, 191–196 (1992).
29. Xue, S., Mountain, D. C. & Hubbard, A. E. Electrically evoked basilarmembrane motion. J. Acoust. Soc. Am. 97, 3030–3041 (1995).
30. Nuttall, A. L. & Ren, T. Electromotile hearing: evidence from basilar membranemotion and otoacoustic emissions. Hear. Res. 92, 170–177 (1995).
31. Grosh, K., Zheng, J., Zou, Y., de Boer, E. & Nuttall, A. L. High-frequencyelectromotile responses in the cochlea. J. Acoust. Soc. Am. 115, 2178–2184(2004).
32. He, W. & Ren, T. Basilar membrane vibration is not involved in the reversepropagation of otoacoustic emissions. Sci. Rep. 3, 1874 (2013).
33. Recio, A., Rich, N. C., Narayan, S. S. & Ruggero, M. A. Basilar-membraneresponses to clicks at the base of the chinchilla cochlea. J. Acoust. Soc. Am. 103,1972–1989 (1998).
34. Carney, L. H., McDuffy, M. J. & Shekhter, I. Frequency glides in theimpulse responses of auditory-nerve fibers. J. Acoust. Soc. Am. 105, 2384–2391(1999).
35. Shera, C. A. Frequency glides in click responses of the basilar membraneand auditory nerve: their scaling behavior and origin in traveling-wavedispersion. J. Acoust. Soc. Am. 109, 2023–2034 (2001).
36. Ren, T., He, W., Li, Y., Grosh, K. & Fridberger, A. Light-induced vibration inthe hearing organ. Sci. Rep. 4, 5941 (2014).
37. de Boer, E. & Nuttall, A. L. The mechanical waveform of the basilar membrane.I. Frequency modulations ("glides") in impulse responses and cross-correlationfunctions. J. Acoust. Soc. Am. 101, 3583–3592 (1997).
38. Xia, A. et al. Deficient forward transduction and enhanced reverse transductionin the alpha tectorin C1509G human hearing loss mutation. Dis. Model. Mech.3, 209–223 (2010).
39. Zwislocki, J. J. & Kletsky, E. J. Tectorial membrane: a possible effect onfrequency analysis in the cochlea. Science 204, 639–641 (1979).
40. Gummer, A. W., Hemmert, W. & Zenner, H. P. Resonant tectorial membranemotion in the inner ear: its crucial role in frequency tuning. Proc. Natl Acad.Sci. USA 93, 8727–8732 (1996).
41. Allen, J. B. Cochlear micromechanics--a physical model of transduction.J. Acoust. Soc. Am. 68, 1660–1670 (1980).
42. Ghaffari, R., Aranyosi, A. J., Richardson, G. P. & Freeman, D. M. Tectorialmembrane travelling waves underlie abnormal hearing in Tectb mutant mice.Nat. Commun. 1, 96 (2010).
43. Gueta, R. et al. Structural and mechanical analysis of tectorial membrane tectamutants. Biophys. J. 100, 2530–2538 (2011).
44. Lukashkin, A. N., Richardson, G. P. & Russell, I. J. Multiple roles for thetectorial membrane in the active cochlea. Hear. Res. 266, 26–35 (2009).
45. Kakehata, S. & Santos-Sacchi, J. Effects of salicylate and lanthanides on outerhair cell motility and associated gating charge. J. Neurosci. 16, 4881–4889(1996).
46. Murugasu, E. & Russell, I. Salicylate ototoxicity: the effects on basilarmembrane displacement, cochlear microphonics, and neural responses in thebasal turn of the guinea pig cochlea. Aud. Neurosci. 1, 139–150 (1995).
47. Shehata, W. E., Brownell, W. E. & Dieler, R. Effects of salicylate on shape,electromotility and membrane characteristics of isolated outer hair cells fromguinea pig cochlea. Acta Otolaryngol. 111, 707–718 (1991).
48. Drexl, M., Lagarde, M. M., Zuo, J., Lukashkin, A. N. & Russell, I. J. The roleof prestin in the generation of electrically evoked otoacoustic emissions in mice.J. Neurophysiol. 99, 1607–1615 (2008).
49. Fisher, J. A., Nim, F., Reichenbach, T., Uthaiah, R. C. & Hudspeth, A. J. Thespatial pattern of cochlear amplification. Neuron 76, 989–997 (2012).
50. Santos-Sacchi, J. & Song, L. Chloride and salicylate influence prestin-dependentspecific membrane capacitance: support for the area motor model. J. Biol.Chem. 289, 10823–10830 (2014).
ARTICLE NATURE COMMUNICATIONS | DOI: 10.1038/ncomms10282
8 NATURE COMMUNICATIONS | 7:10282 | DOI: 10.1038/ncomms10282 | www.nature.com/naturecommunications

51. Soons, J. A., Ricci, A. J., Steele, C. R. & Puria, S. Cytoarchitecture of the mouseorgan of corti from base to apex, determined using in situ two-photon imaging.J. Assoc. Res. Otolaryngol. 16, 47–66 (2015).
52. Johnson, S. L., Beurg, M., Marcotti, W. & Fettiplace, R. Prestin-driven cochlearamplification is not limited by the outer hair cell membrane time constant.Neuron 70, 1143–1154 (2011).
53. Chen, F. et al. A differentially amplified motion in the ear for near-thresholdsound detection. Nat. Neurosci. 14, 770–774 (2011).
54. Markin, V. S. & Hudspeth, A. J. Modeling the active process of the cochlea:phase relations, amplification, and spontaneous oscillation. Biophys. J. 69,138–147 (1995).
55. Nilsen, K. E. & Russell, I. J. Timing of cochlear feedback: spatial and temporalrepresentation of a tone across the basilar membrane. Nat. Neurosci. 2, 642–648(1999; ; erratum 2, 848 (1999).
56. Dong, W. & Olson, E. S. Detection of cochlear amplification and its activation.Biophys. J. 105, 1067–1078 (2013).
57. Ramamoorthy, S., Deo, N. V. & Grosh, K. A mechano-electro-acoustical modelfor the cochlea: response to acoustic stimuli. J. Acoust. Soc. Am. 121, 2758–2773(2007).
58. Zha, D. et al. In vivo outer hair cell length changes expose the active process inthe cochlea. PLoS ONE 7, e32757 (2012).
59. Yoon, Y. J., Steele, C. R. & Puria, S. Feed-forward and feed-backwardamplification model from cochlear cytoarchitecture: an interspeciescomparison. Biophys. J. 100, 1–10 (2011).
60. Liu, Y., Gracewski, S. M. & Nam, J. H. Consequences of location-dependentorgan of corti micro-mechanics. PLoS ONE 10, e0133284 (2015).
61. Maoileidigh, D. O. & Hudspeth, A. J. Effects of cochlear loading on themotility of active outer hair cells. Proc. Natl Acad. Sci. USA 110, 5474–5479(2013).
62. Meaud, J. & Grosh, K. Response to a pure tone in a nonlinearmechanical-electrical-acoustical model of the cochlea. Biophys. J. 102,1237–1246 (2012).
63. Gao, S. S. et al. Vibration of the organ of Corti within the cochlear apex in mice.J. Neurophysiol. 112, 1192–1204 (2014).
64. Hong, S. S. & Freeman, D. M. Doppler optical coherence microscopy for studiesof cochlear mechanics. J. Biol. Opt. 11, 054014 (2006).
65. Ren, T. & He, W. Measurement of basilar membrane, reticular lamina, andtectorial membrane vibrations in the intact mouse cochlea. AIP Conf. Proc.1403, 423–429 (2011).
66. Ren, T. Reverse propagation of sound in the gerbil cochlea. Nat. Neurosci. 7,333–334 (2004).
67. He, W., Fridberger, A., Porsov, E., Grosh, K. & Ren, T. Reverse wavepropagation in the cochlea. Proc. Natl Acad. Sci. USA 105, 2729–2733 (2008).
68. Ren, T., He, W. & Gillespie, P. G. Measurement of cochlear power gain in thesensitive gerbil ear. Nat. Commun. 2, 216 (2011).
69. Kim, Y. L. et al. Low-coherence enhanced backscattering: review of principlesand applications for colon cancer screening. J. Biol. Opt. 11, 041125 (2006).
70. He, W., Porsov, E., Kemp, D., Nuttall, A. L. & Ren, T. The group delay andsuppression pattern of the cochlear microphonic potential recorded at theround window. PLoS ONE 7, e34356 (2012).
AcknowledgementsWe thank Alfred L. Nuttall, John Brigande and other colleagues at Oregon HearingResearch Center for helpful discussion of the data, Edward Porsov for technical help, thereviewers of Nature Communications for suggestions for estimating the membranepotential of outer hair cells and for comparison of the current results with those in theliterature and Wavemetrics, Inc. for consultation on signal analysis. This study wasfunded by NIH grants R01 DC004554, R01 DC002368 and P30 DC005983.
Author contributionsT.R. designed the experiments, built the interferometer, collected and analysed the data,and wrote the manuscript. W.H. performed surgeries, collected and processed the data,and wrote the manuscript. P.G.B.G. analysed the data and wrote the manuscript.
Additional informationCompeting financial interests: The authors declare no competing financial interests.
Reprints and permission information is available online at http://npg.nature.com/reprintsandpermissions/
How to cite this article: Ren, T. et al. Reverse transduction measured in the livingcochlea by low-coherence heterodyne interferometry. Nat. Commun. 7:10282doi: 10.1038/ncomms10282 (2016).
This work is licensed under a Creative Commons Attribution 4.0International License. The images or other third party material in this
article are included in the article’s Creative Commons license, unless indicated otherwisein the credit line; if the material is not included under the Creative Commons license,users will need to obtain permission from the license holder to reproduce the material.To view a copy of this license, visit http://creativecommons.org/licenses/by/4.0/
NATURE COMMUNICATIONS | DOI: 10.1038/ncomms10282 ARTICLE
NATURE COMMUNICATIONS | 7:10282 | DOI: 10.1038/ncomms10282 | www.nature.com/naturecommunications 9