returns to education-china - wiego goals and outline presentation goal: to provide preliminary...
TRANSCRIPT

The Returns to Education in Formaland Informal Sector
Albert ParkDepartment of Economics, University of Oxford
Xiaobo QUInstitute of Population and Labor Economics, CASS

Presentation goals and outline
Presentation goal: to provide preliminary empirical evidence anddemonstrate features of returns to education in formal and informal sector in urban china.
Outline :
• Background review
• Data, definition and method
• To discuss returns to education in formal and informal sector
• Preliminary conclusion
Background review
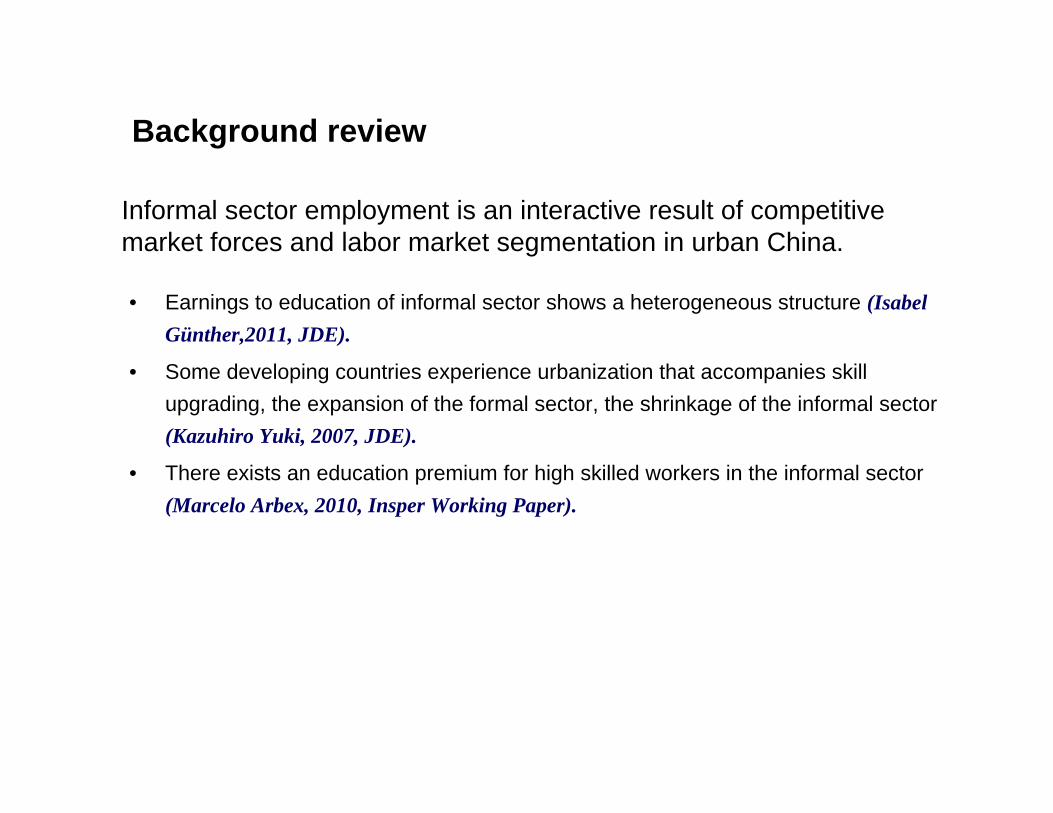
• Earnings to education of informal sector shows a heterogeneous structure (Isabel Günther,2011, JDE).
• Some developing countries experience urbanization that accompanies skill upgrading, the expansion of the formal sector, the shrinkage of the informal sector (Kazuhiro Yuki, 2007, JDE).
• There exists an education premium for high skilled workers in the informal sector(Marcelo Arbex, 2010, Insper Working Paper).
Informal sector employment is an interactive result of competitive market forces and labor market segmentation in urban China.
• Studies on the returns to education for China mainly focuses on urban residents, rural residents, local workers in urban and migrant workers….
• But What about the returns to education in formal and informal sector, there is no detailed research yet. So my study aims to give a preliminary introduction.
• It is point out that terms like formal/informal sector, or formal/ informal job position,or formal/informal employment, these are all defined and identified from different levels and perspectives, my report only focus on returns to education of formal and informal sector in urban China.

Data, definition and method
• Data from third round China Urban Labor Survey(CULS3)
• Definition of Informal sector is Private enterprises with less than 7 employees, Employer's households, Land contractor and others.
• Identifying standards for formal and informal sector according to classification proposed by professor Wu Yaowu.
• Method: statistical analysis, estimating wage equation

68.46%
31.54%
0.00%
10.00%
20.00%
30.00%
40.00%
50.00%
60.00%
70.00%
80.00%
f or mal sect or i nf or mal sect or
30.62%
0.92%0.00%
5.00%
10.00%
15.00%
20.00%
25.00%
30.00%
35.00%
Private enterprises with less than 7employees
Employer's households and Landcontractor
Employment size in informal sector
Source: CULS3

7.25%
41.94%
0.00%
5.00%
10.00%
15.00%
20.00%
25.00%
30.00%
35.00%
40.00%
45.00%
size of formal in local workers size of informal in local workers
26.51%24.29%
0.00%
5.00%
10.00%
15.00%
20.00%
25.00%
30.00%
35.00%
40.00%
45.00%
size of formal in migrant workers size of informal in migrant workers
Migrant workers account for principal proportion in Informal sector compare to local workers.
Source: CULS3

-4-2
02
46
0 5 10 15 20schooling
hourlywage Fitted values-4
-20
24
6
0 5 10 15 20schooling
hourlywage Fitted values
Log Hourly wage plot in formal sector Log Hourly wage plot in informal sector
the line of fitted value in informal sector tend more horizontal than formal sector, the slop of fitted value line in formal sector is evident bigger than informal sector.

The density of log-monthly wages in the formal and informal sector overlap to large extent.
Source: CULS3
0.1
.2.3
.4kd
ensi
ty d
istri
butio
n
-4 -2 0 2 4 6log hourly_wage
formal sector informal sector

Source: “China Statistical Yearbook”, NBS(2010)
NBS annual data shows share of informal sector size declining trend with GDP per capital.
.1.2
.3.4
.5Th
e pr
opor
tion
of In
form
al s
ize
0 5000 10000 15000 20000 25000
GDP Per Capital
informal_size Fitted values
The Proportion of Informal Size and GDP Per Capital(1990-2009)

The CULS3 shows share of informal sector in the city falling with GDP per capita.
There is a relationship between the size of informal sector in a city and returns to education for individuals.
Source: CULS3

Sector Employment Pooled
Formal Informal Formal Informal
Age 38.2 38.6 39.4 35.6 38.5
Sex (male=1) 57.4 53.8 58.7% 52.2% 51.3%
Spoused (yes=1) 78.9% 87.7% 80.9% 79.6% 76.0%
Schooling years 12.7 10.2 13.0 10.6 11.9
Middle school and below 22.8% 55.8% 19.3% 50.8% 32.4%
Regular high school 27.1% 27.1% 27.9% 25.2% 29.5%
Vocational high school 10.2% 7.5% 10.3% 8.5% 9.11%
Vocational higher education 21.0% 6.6% 22.0% 10.1%
15.9%
Regular College and above 18.9% 3.0% 20.6% 5.5% 13.0%
Work experience 19.4 22.1 20.4 18.7 22.0
Monthly wage 2622.9 2658.3 2654.8 2569.6 2424.0
Weekly working hours 46.4 65.7 44.2 60.1 47.3
Hourly wage (Yuan) 14.3% 11.1 14.4 9.5 11.9
Obs 7570 3471 5278 5757 11,041
Note: Statistical results of all variables is weighted. Source: CULS3
Statistical results of human capital and individual characteristics for Women Aged 16 to 55 and Men aged 16 to 60.
Formal sector Informal sectorOLS Heckman OLS Heckman
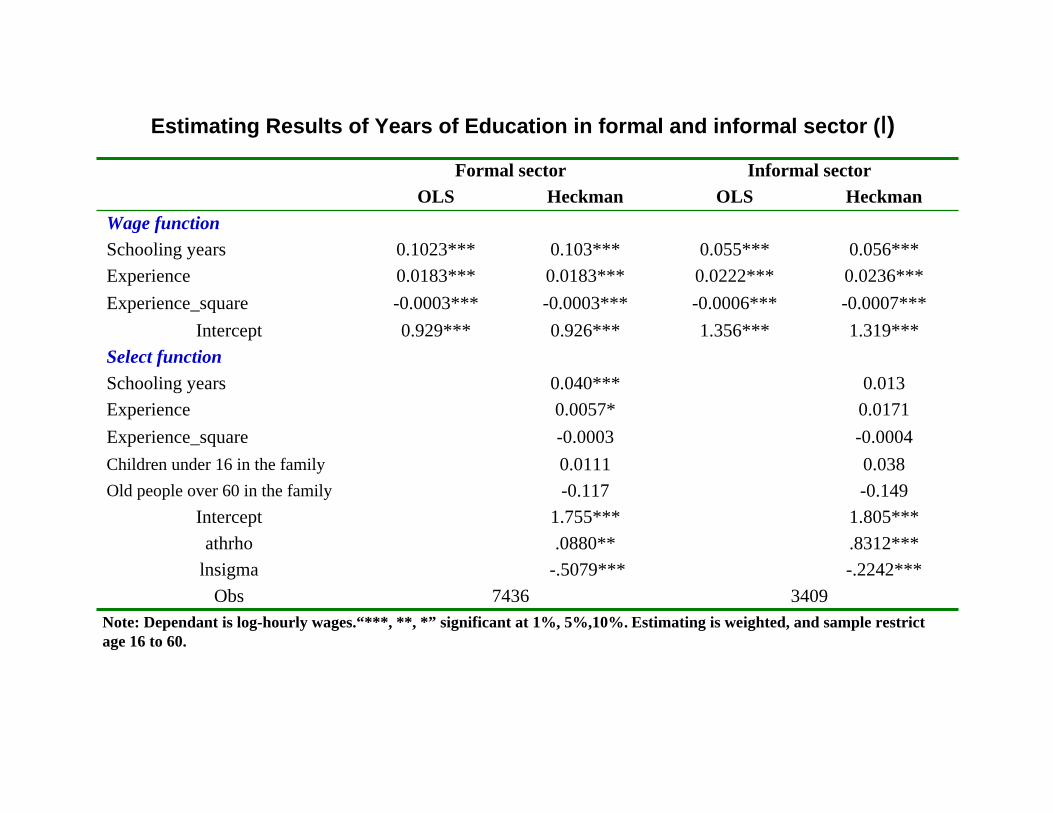
Wage functionSchooling years 0.1023*** 0.103*** 0.055*** 0.056***Experience 0.0183*** 0.0183*** 0.0222*** 0.0236***Experience_square -0.0003*** -0.0003*** -0.0006*** -0.0007***
Intercept 0.929*** 0.926*** 1.356*** 1.319***Select functionSchooling years 0.040*** 0.013Experience 0.0057* 0.0171Experience_square -0.0003 -0.0004Children under 16 in the family 0.0111 0.038Old people over 60 in the family -0.117 -0.149
Intercept 1.755*** 1.805***athrho .0880** .8312***
lnsigma -.5079*** -.2242***Obs 7436 3409
Note: Dependant is log-hourly wages.“***, **, *” significant at 1%, 5%,10%. Estimating is weighted, and sample restrict age 16 to 60.
Estimating Results of Years of Education in formal and informal sector (Ⅰ)

Formal sector Informal sectorOLS Heckman OLS Heckman
Wage functionSchooling years 0.105*** 0.106*** 0.068*** 0.067***Experience 0.027*** 0.027*** 0.0224*** 0.0231**Experience_square -0.0005*** -0.0005*** -0.0006*** -0.0006***Sex (male=1) 0.205*** 0.205*** 0.252*** 0.248***Wuhan (Shanghai=0) -0.391*** -.0396*** -0.680*** -0.646***Shenyang (Shanghai=0) -0.547*** -0.548*** -0.511*** -0.512***Fuzhou (Shanghai=0) -0.256*** -0.257*** -0.222*** -0.229***Xi’an (Shanghai=0) -0.636*** -0.636*** -0.532*** -0.489***Guangzhou (Shanghai=0) 0.0212 0.021 0.220*** 0.261***
Intercept 0.917*** 0.916*** 1.289*** 1.334***Select functionSex (male=1) 0.008 0.254**Schooling years 0.039** -0.073Experience -0.0056 0.015Experience_square 0.0003 -0.0005Children under 16 in the family 0.013 0.042Old people over 60 in the family -0.124 -0.124
City dummy Yes YesIntercept 1.893*** 1.640***
Obs 7434 3409
Estimating Results of Returns to Education in formal and informal sector (Ⅱ)
Note: Dependant is log-hourly wages.“***, **, *” significant at 1%, 5%,10%. Estimating is weighted, and sample restrict age 16 to 60.

Formal sector Informal sectorOLS Heckman OLS Heckman
Wage functionRegular high school 0.221*** 0.221*** 0.202*** 0.204***Vocational high school 0.310*** 0.311*** 0.207*** 0.192***Vocational higher education 0.595*** 0.596*** 0.443*** 0.428***Regular College and above 0.901*** 0.901*** 0.802*** 0.802***Experience 0.032*** 0.032*** 0.027*** 0.027***Experience_square -0.0006*** -0.0006*** -0.0007*** -0.0007***Sex (male=1) 0.207*** 0.207*** 0.268*** 0.275***City dummy Yes Yes Yes Yes
Intercept 1.835*** 1.836*** 1.807*** 1.768***Select functionSex (male=1) 0.008 0.233Regular high school -0.024 0.062Vocational high school 0.270 -0.485**Vocational higher education 0.209 -0.285Regular College and above 0.383** 0.055Experience 0.0005 -0.008Experience_square 0.0002 -0.0003Children under 16 in the family 0.012 0.043Old people over 60 in the family -0.121 -0.120
City dummy Yes YesIntercept 2.240*** 1.816***
Obs 7434 3409
Estimating Results of Returns to Education in formal and informal sector (Ⅲ)
Note: Dependant is log-hourly wages.“***, **, *” significant at 1%, 5%,10%. Estimating is weighted, and sample restrict age 16 to 60.

Coefficients Std. Err
Schooling 0.1527*** 0.062
Experience 0.0251*** 0.003
Experience2 -0.0005*** 0.000
Sex 0.2174*** 0.015
city_infshare -3.9441*** 0.823
gdp_per capital 0.0806*** 0.018
gdp_rate -8.8827* 5.305
gov_pay per capital 0.0000** 0.000
Educ*city_infshare 0.2801*** 0.064
Educ* gdp_per capital -0.0003 0.001
Educ* gdp_rate -0.7050* 0.427
Educ* gov_pay per capital 0.0000 0.000
_cons 2.3655*** 0.765
Obs 10844
Note: “***, **, *” significant at 1%, 5%, and 10%. Dependent variable is log-hourly wage.
Estimating Results of Returns to Education controlled city variables by OLS

0.1510.9056***_cons
0.0260.0091Guangzhou (shanghai=0)
0.030-0.5993***Xian (shanghai=0)
0.027-0.2863***Fuzhou (shanghai=0)
0.028-0.5403***Shenyang (shanghai=0)
0.026-0.4601***Wuhan (shanghai=0)
0.0160.2147***Sex ( male=1)
0.000-0.0005***experience2
0.0030.0214***experience
0.0080.1122***Schooling
Log hourlywage (infemp=0)
0.0801.4224***_cons
0.0310.1550***Guangzhou (shanghai=0)
0.031-0.6163***Xian (shanghai=0)
0.031-0.2082***Fuzhou (shanghai=0)
0.030-0.4649***Shenyang (shanghai=0)
0.029-0.5766***Wuhan (shanghai=0)
0.0170.2335***Sex ( male=1)
0.000-0.0008***experience2
0.0030.0299***experience
0.0080.0444***Schooling
Log hourlywage (infemp=1)
Std. ErrCoefficientsVariable
Estimating Results of Switching Regression Model for Formal and Informal Workers

10843Obs
0.083-0.2636*/r2
0.0910.2160**/r1
0.010-0.5860***/lns2
0.013-0.4724***/lns1
0.1054.5396***_cons
0.031-0.4176***Formal_othern (identifying variable)
0.048-0.1497***Guangzhou (shanghai=0)
0.0490.4328***Xian (shanghai=0)
0.0490.0239Fuzhou (shanghai=0)
0.0500.0780Shenyang (shanghai=0)
0.0460.1048**Wuhan (shanghai=0)
0.0280.0021Sex (male=1)
0.000-0.0003**experience2
0.005-0.0356***experience
0.006-0.2991***Schooling
infemp (selection equation)
Note: “***, **, *” significant at 1%, 5%, 10%. Sample is women Aged 16 to 55 and Men aged 16 to 60. Definition of formal
and informal employment is just based on social insurance in this table.

Preliminary conclusion
• In terms of hourly wage, returns to education of formal sector is obviously higher than informal sector, after control dummy variable such as individual features and city, returns to education of informal sector is about less than 4% formal sector.
• With the rise of education level, returns to education in both formal and informal sector tend to increase. In addition, returns to vocational high school are higher than that of regular high school. But at similar educational level, earnings of informal sector is still below than formal sector.
• Share of informal sector in cities falls with the rise of GDP per capita and it also interact with individual earnings of education.
• Earnings of informal sector in urban China share similar features with some other developing countries, for example

Thanks!