returns to education in transition and advanced european
TRANSCRIPT
PATRIMONIO EN PLANES DE PENSIONES PRIVADOS INDIVIDUALES, NIVEL EDUCATIVO Y HÁBITOS FINANCIEROS DE LAS FAMILIAS EN ESPAÑA
CAPÍTULO 5: CAPITAL HUMANO Y CRECIMIENTO ECONÓMICO 865
Returns to education in transition and advanced European countries: The role
of an expansion of higher education
MARTINA MYSÍKOVÁAB
JIŘÍ VEČERNÍKAB ab
The Institute of Sociology of the Czech Academy of Sciences, Prague, and abNational Training Fund, Prague
e-mail: [email protected]
Abstract: Cross-national comparisons on returns to education were so far based on secondary evidence from national studies. Unlike in Western European countries, in Eastern countries the data on the levels and development of returns since 1990 shows a uniform upward trend in returns to higher education. Since 2004, the European Union Statistics on Income and Living Conditions (EU-SILC) provides a unique comparative database. In 2009, midway through the period observed by EU-SILC, came the breaking point when rising returns to tertiary education started to decrease, albeit slightly. In general, differences over time are not as big as differences between individual countries. Although converging, the returns to tertiary education in Eastern and Western countries remain still far apart, considerably higher in Eastern countries. Panel analysis with economic, demographical and institutional characteristics of countries shows also substantial differences in factors of returns to tertiary education in Eastern and Western Europe. The assumed negative
relationship between the share of tertiary educated workers in the working age population and the returns to tertiary education was confirmed only in Western Europe. Job vacancy rate has a significant negative impact on returns to tertiary education only in Eastern Europe. It seems that in the West, the labour market reacts on labour supply, while labour demand plays more important role in the East. Key words: returns to education; tertiary education; Europe; transition countries Acknowledgements: Work on this paper was supported by grant no. P402/12/G130 ‘The relationships between skills, schooling and labour market outcomes: A longitudinal study’ from the Czech Science Foundation. The EU-SILC datasets were made available on the basis of contract no. EU-SILC/2007/16 between the European Commission, Eurostat, and the Institute of Sociology of the Czech Academy of Sciences. The authors are solely responsible for the findings presented in the article.

INVESTIGACIONES DE ECONOMÍA DE LA EDUCACIÓN NÚMERO 10
866 CHAPTER 5: HUMAN CAPITAL AND ECONOMIC GROWTH
1. INTRODUCTION
In the mainstream economy, higher returns to education of workers are related to the higher
productivity of their work (Becker, 1964; Mincer, 1974). It can therefore be said that when
labour productivity rises the returns to education increase. In contrast, in accordance with the
law of diminishing returns the returns are expected to decrease with the increase in well
qualified labour (Spillman and Lang, 1924). In labour economics, the Becker’s ‘Woytinsky
Lecture Hypothesis’ (Becker, 1975, chapter 3) was developed, according to which marginal
returns to higher education fall as the proportion of the population with higher education
rises.
Twenty five years ago, this explanation was supported by evidence collected over various
periods up to mid-1980s by Psacharopoulos (1989, 227-228) for a set of developed and
developing countries. He found that educational expansion is usually followed with a decline in
returns to education and concluded that ‘the evidence seems to be more consistent with the
human capital theory of the relationship between education and earnings, rather than the
alternative theories of screening, segmentation, or the maintenance of the status quo from
generation to generation’.
However, the returns would remain stable if the growing supply of better educated workers
was balanced with higher demand for workers’ skills due to technological change and more
complex management in the knowledge-based society. To determine the effect of education
on wages, Barth and Lucifora (2006) examined twelve European countries between 1985 and
2000. They found that while the relative supply of tertiary education was on average 20%, such
a ‘supply shock’ did not affect the wage premium attached to tertiary education, which
remained stable. This suggests that the expansion of the educational system was closely
matched by demand shifts caused by (positively skill biased) technological change.
In fact, as we will further demonstrate, the changes of returns to education in the West varied
in their direction and scale. On the contrary, education was undervalued under the planned
economy (Campos and Jolliffe, 2003, for Hungary) and the returns to education have increased
rapidly and noticeably during the market liberalisation in transitory countries. Yet, explaining
their development with the human capital theory is hardly acceptable. Although the Eastern
bloc prided with rather high-quality education which was immediately profitable under the
market regime, it cannot be assumed that just due to the economic changes labour
productivity rose fast enough to explain for the fast increase of the returns.
In their synthesizing study, Fleisher et al. (2005) offered two explanations: the first stresses
reforms which allowed easing the legal, regulatory, and institutional constraints on wage-
setting. Thus, the faster the reforms run, the faster the returns to education adjust to the
market rates. The other hypothesis follows Schultz (1975) and stresses the structural
transformations, disruptions and economic disequilibrium which make highly educated
individuals able to respond to and profit from changing opportunities.
RETURNS TO EDUCATION IN TRANSITION AND ADVANCED EUROPEAN COUNTRIES: THE ROLE OF AN EXPANSION OF HIGHER EDUCATION
CAPÍTULO 5: CAPITAL HUMANO Y CRECIMIENTO ECONÓMICO 867
Apparently, the rapid increase of returns to education in transitory countries is not only a
matter of economy. In addition to economic disequilibria and mobility opportunities, transition
and reforms brought about also a change in value system, which importantly affected the
‘market rates’ of education. Since marginal productivity of labour of higher-educated people
or, simply, productive force of education as such cannot be exactly measured, to explain the
sudden change we have first to think on the position of education under communist ideology
and related economic system (Večerník, 2009, chapter 4).
While these societies declared to follow Marx’s dictum about the principle of reward in
socialist society – ‘from each according to his abilities, to each according to his work’ – in
reality Marx’s labour theory of value was applied. According to the theory, the capitalist
exploits the worker by receiving the whole product while paying the worker only for his
subsistence and reproduction. Actual rewarding was thus governed by the principle of meeting
basic needs: workers should be nourished and their families should reproduce themselves. In
consequence, the effect of education for pay was minor or even negative since non-manual
workers do not need to ‘eat as much’ as manual workers.
Further, according to the Marxist political economy, only the ‘immediately productive work’
produced economic value while the rest of labour is rewarded from redistribution of the
primary material product. The Marxist value theory also underpinned the idea that the
working class is the leading social class while ‘intelligentsia’ was taken as a rather marginal
social group. Moreover, the rewards for educated people were suppressed under the
assumption that if education is provided by the state, its returns should belong to all people. In
spite of some later reforms, wages for educated people remained relatively low in all
communist countries, even if the relation varied from country to country.
The sudden rise of rewards to education during transition paralleled abrupt changes in political
and economic system of post-communist countries. Apparently, the ‘communist human
capital’ was sufficient for capitalist markets (Chase, 1998; Flanagan, 1998). The new regime
stopped the further degradation of higher education and mental labour imposed by the
communist ideology. Suddenly, high-skilled labour and managerial positions were valued, not
because their productivity would have miraculously risen but because the value system of the
society changed. Wages were now determined by free market and, in the state administration
sector, education was valued more than before.
When considering education, the human capital theory concentrated mainly on its productive
function, while neglecting its, so called, ‘signalling function’, which assumes that better
educated people are more adaptive, more apt to use the opportunities provided by the new
system as far as careers and rewards are concerned. The important ‘credential society effect’
should also not be forgotten. According to Collins (1979), often the eligibility for jobs is based
on diplomas and/or degrees which in reality are not immediately needed for the job
performance. Also, the increase in demand for skilled workers is partly purely administrative,
with higher education required for jobs which remain basically the same. We should remind
here also the obsession by titles and degrees characteristic for Central European countries in
line with the traditions of Austro-Hungarian monarchy.

INVESTIGACIONES DE ECONOMÍA DE LA EDUCACIÓN NÚMERO 10
868 CHAPTER 5: HUMAN CAPITAL AND ECONOMIC GROWTH
Due to the far-reaching changes in the overall position of education and, equally importantly,
the new opportunities, schools providing higher education mushroomed and the numbers of
students surged up. Soon enough, the labour market was faced with an increasing number of
people with university diplomas. The question is what will happen when the number of people
with diplomas exceeds the demand of the labour market (even the exaggerated requirements
of the state administration) and continues to rise. Although some transition countries are still
faced with shortage of skilled workers (Rutkowski, 2007), the increase in rewards for highly
educated people cannot be endless and should instead slow down, stop or reverse eventually.
The considerably variable empirical evidence from across Europe shows that no simple theory
can be applied: one country shows high returns to education, another low, the returns
increase, decrease, or remain stable, depending on the country we observe. There are many
factors which are interlinked in various ways and the attempts to explain all parts of the puzzle
is therefore bound to end in vain. Our task here is to gather the available information and
contribute with new facts regarding the recent development of returns to tertiary education
across Europe, their trends and factors. A special interest will be put on the effect of transition
in post-communist countries. The main aim of our study is to provide comparable estimates of
returns to tertiary education across European countries and consequently to analyse the role
of an expansion of tertiary education in both transition and advanced countries.
The rest of the article is organized as follows: The second section presents results that have so
far been collected regarding the relevant trends in Western advanced economies and Central
European transitional countries, and describes the development of returns to education during
transition. In the third section, more recent data are introduced and European countries are
analysed based on the EU-SILC surveys of 2005-2012. In the fourth section, a macro-level is
added to examine the effect of the increasing supply of educated labour on returns to tertiary
education. The fifth section concludes the article.
2. TRENDS IN THE 1990S: SECONDARY EVIDENCE
The trends in returns to education and their various aspects in Western countries were
investigated specifically in two large comparative projects financed by EU research
programmes. The project ‘Public funding and private returns to education’ (PURE) was carried
out in 15 EU countries in 1998-2000 which described the period 1985-1995 (Harmon et al.,
2001). Another project ‘Education and wage inequality in Europe’ (EDWIN) was effectuated in
2002-2005 in 12 EU countries and described the period 1984-2003 (Dolton et al., 2009).

RETURNS TO EDUCATION IN TRANSITION AND ADVANCED EUROPEAN COUNTRIES: THE ROLE OF AN EXPANSION OF HIGHER EDUCATION
CAPÍTULO 5: CAPITAL HUMANO Y CRECIMIENTO ECONÓMICO 869
Table 1 Returns to education in West European countries in the 1980s and 1990s (coefficients of Mincerian equations)
Country Period Men Women
Coefficients Trend Coefficients Trend
Austria 1981-1997 0.103-0.074 Downward 0.116-0.080 Downward
Denmark 1981-1995 0.051-0.061 Upward 0.031-0.044 Upward
Finland 1984-1995 0.095-0.089 Downward 0.079-0.095 Upward
France* 1985-1998 n.a. Stable n.a. Stable
Germany 1984-1997 Graph only Upward Graph only Upward
Greece 1974-1994 0.057-0.063 Upward 0.076-0.086 Upward
Ireland 1987-1995 0.097-0.115 Upward 0.142-0.109 Downward
Italy 1981-1995 0.039-0.062 Upward 0.051-0.077 Upward
Netherlands 1986-1996 0.058-0.063 Upward 0.062-0.051 Downward
Norway 1980-1995 0.037-0.057 Upward 0.054-0.053 Stable
Portugal 1982-1995 0.102-0.106 Upward 0.108-0.108 Upward
Sweden 1991-1996 0.041-0.039 Downward 0.037-0.031 Downward
Switzerland 1992-1999 0.091-0.088 Downward 0.078-0.079 Stable
UK 1981-1995 0.058-0.065 Downward 0.102-0.091 Downward
Source: Harmon, Walker, Westergård-Nielsen 2001.
Notes: * Because comparable information about France is missing in the national chapter of
the book sourced in the Table 1, we use instead information provided by Thélot and Selz
(2004). The authors state that returns to education decreased from 11% in 1964 to 9% in 1985
and remained stable since.
Regarding the development of the returns to education, the Final Report of the PURE project
states: ‘There does not seem to be a clear pattern in the trends, however. In total there
appears to be 15 cases of no trend, 7 cases of increasing returns, and 7 cases of decreasing
returns. Countries characterised by decreasing returns for both males and females are Austria,
Switzerland and Sweden. Countries characterised by increasing returns are Denmark, Portugal,
Finland and Italy. The remaining PURE countries are either characterised by no trend or by
different male–female trends’ (PURE, 2001, 15). The results of national studies produced
under this project are compiled in Table 1.
The Final Report of the EDWIN project states: ‘Based on the changes in average wage
premiums, the nine countries divide into four categories: (1) decreasing trend at all
educational degree levels with the decline rising with the educational level (France, Portugal,
Sweden); (2) opposite trends across educational degree levels with decline at the tertiary level
and increase at the lower level(s) (Finland, Germany, the UK); (3) opposite trends across
educational degree levels with increase at the tertiary level and decline at the lower level(s)
(Norway); (4) increasing trend at all educational degree levels with the increase growing with
the educational level (Greece, Italy)’ (EDWIN, 2006, 39).
While the trends in various advanced countries differ, there are certainly several countries
where the returns decrease in line with the theoretical expectation that the more widespread

INVESTIGACIONES DE ECONOMÍA DE LA EDUCACIÓN NÚMERO 10
870 CHAPTER 5: HUMAN CAPITAL AND ECONOMIC GROWTH
the higher skills, the lower their returns in comparison with lower levels of education. For the
UK, Moffitt (2007) estimated marginal returns to higher education and demonstrated that
these returns fall as the proportion of the population with higher education rises. For Sweden,
a steady decrease of returns to education was documented by Björklund (2000). For Austria,
Fersterer and Winter-Ebmer (2003) revealed that returns to education have considerably fallen
in the period 1981-1997.
In contrast to the diverging development in Western countries and the frequent decline of
returns to education, the statistical data for post-communist countries consistently
demonstrate increasing returns to education, in particular during the early transition. A
particularly large literature is available on the Czech Republic (Filer et al., 1999; Jurajda, 2003;
Munich et al., 2005; Večerník 1995, 2012, 2013). The evidence collected by various authors
shows a substantial rise in the three Central-European reform countries (Table 2).
Table 2 Returns to education in Central European countries (%)
Primary Vocational Secondary Tertiary
Czech Republic
Men 1988 reference 4.3 12.4 33.9
1992 reference 9.8 26.0 52.5
1996 reference 16.6 39.1 73.1
Women 1988 reference 5.5 18.2 45.3
1992 reference 9.6 37.0 64.2
1996 reference 10.7 42.1 75.7
Hungary
Men 1989 reference 11.6 24.8 67.8
1992 reference 14.5 34.9 83.9
1996 reference 7.8 39.3 96.7
Women 1989 reference 12.8 26.0 74.1
1992 reference 14.2 35.7 86.7
1996 reference 11.6 33.1 88.0
Poland
Men 1992 -9.3 reference (-4.1)-8.6 29.7
1995 -10.3 reference 7.6-13.6 44.1
Women 1992 -8.6 reference 14.2-15.8 30.2
1995 -3.5 reference 7.4-12.3 43.2
Sources:
Czech Republic – authors’ computations on Microcensus 1989, 1992 and 1996 (budget and non-budget sectors,
controlled for sex, experience, experience2). Hungary – Kertesi and Köllő, 1999 (non-budget sector, controlled for
sex, experience, experience2, occupation, productivity, capital/labour ratio, firm size, industry). Poland – figures on
all employees according to Rutkowski, 2001 (budget and non-budget sectors, controlled for sex , experience,
experience2, industry); figures on men and women according to Kertesi and Köllő, 1999 (budget sector, controlled for
experience, experience2, occupation, residence, industry, household type, local unemployment rate, previous
employment status and disability); last column according to Rutkowski, 2001 (budget and non-budget sectors,
controlled for sex , experience, experience2, industry).
RETURNS TO EDUCATION IN TRANSITION AND ADVANCED EUROPEAN COUNTRIES: THE ROLE OF AN EXPANSION OF HIGHER EDUCATION
CAPÍTULO 5: CAPITAL HUMANO Y CRECIMIENTO ECONÓMICO 871
Also the data on Slovenia suggest important rise in returns to education (Orazem and
Vodopivec, 1995; Stanovnik 1997). The evidence from the abovementioned and several other
countries (Estonia, Romania, Russia and Ukraine) was summarized by Fleisher et al. (2005),
who showed fairly steep increase of returns to education in all of them. According to their
calculations, the average return for one year of education increased in transition economies
from 5% in 1989 to 8% by mid-1990s.
Despite the well-grounded evidence, the increase of returns to education was not confirmed
unanimously. Contrary to convincing evidence based on statistical surveys, Flabbi et al. (2008)
offered quite a different picture based on data of the International Social Survey Programme
(ISSP) collected between 1991 and 2002. According to them, except in Hungary and Russia, the
trend or rising returns to education over the transition period is generally weak. As a result,
they divided transition countries into three groups: countries of high returns to education
(Hungary and Poland), medium returns (Bulgaria, Latvia, Slovenia and Russia) and low returns
(Czech Republic and Slovakia). The average estimated returns in advanced and transitory
countries were seen as similar.
Another comparison based on ISSP surveys was made by Trostel et al. (2002), who collected
evidence on 28 countries over the period of 1985–1995. They found a considerable variation in
the rates of returns to education across countries, yet no evidence of their rise. Instead, they
observed rather a slight decline in the worldwide average, particularly for women. In many
countries, xx figures considerably differ from the results based on statistical surveys. For
instance, for 1995 Czech figures (0.035 for men and 0.043 for women) are even below the level
of returns to education at the end of the communist period (0.040 for men and 0.051 in 1988).
While this is the most striking difference of statistical and ISSP figures, it is far from being the
only one. Such questionable results only unveil the inappropriateness of ISSP surveys for such
a purpose.
3. CROSS EUROPE COMPARISON IN THE 2000S: THE MICRO-LEVEL
Psacharopoulos and Patrinos (2004, 114) wrote that ‘(t)he real reason one should be sceptical
about indiscriminate rate of return compilations, and in spite of the efforts of the compilers, is
that in the original works the estimates are rarely fully comparable. There are two main
sources of non-comparability: data sample coverage and methodology. Ideally, a rate of return
to investment in education should be based on a representative sample of the country’s
population. But in reality this is the exception rather than the rule.’
Fortunately, for the 2000s, two new sources emerged, which allow better comparison of EU
countries. Every four years Eurostat produces the national Structure of Earnings Survey (SES),
which collects information on remuneration from enterprises of at least 10 employees in the
Industry and Services sector. So far the survey is available for 2002, 2006 and 2010. The
European Union Statistics on Income and Living Conditions (EU-SILC) dataset contains files with
personal information about gross/net earnings and is available for all EU countries since 2005,
with the first record indicating earnings and incomes for 2004.

INVESTIGACIONES DE ECONOMÍA DE LA EDUCACIÓN NÚMERO 10
872 CHAPTER 5: HUMAN CAPITAL AND ECONOMIC GROWTH
Solely SES 2010 data on earnings by education level were published by Eurostat (Bezzina,
2012) but SES 2002 and 2006 data were kindly provided by this author. Using them, we could
make a rough comparison of earnings of workers with low, middle and high education in EU-
SILC and SES. We found neither substantial differences between the two sources, nor a general
rule suggesting that one of the sources shows bigger disparities in earnings. For sake of brevity,
the comparison of SES and EU-SILC data is thus not reproduced in the article. Due to primary
data availability reasons, our analysis is based on data from EU-SILC surveys.
3.1 Heckman selection model methodology
In our analysis, we use the selection wage model to estimate returns to tertiary education. The
Heckman’s (1979) selection procedure is a two-stage model. First, a probit model for the
probability of having a job is applied. In the second stage, predicted individual probabilities are
added as an explanatory variable to the wage equation. If the unobservables in the
participation equation are correlated with the unobservables in the wage equation, the
estimates without correction (in an OLS model) would be biased. This basically means that the
unobservables in the selection (or choice) of working affect also the wage equation. In other
words, selection into the sample of working individuals is a non-random process, affected by
different unobservables. The estimated wage function under the selection-corrected Heckman
model is:
(1)
where vector Xi includes all explanatory variables of the wage equation, and signify
standard normal density and distribution functions, respectively, Vi represents the vector of
explanatory variables of the participation equation that should differ from the one included in
the wage equation, is the correlation coefficient of the wage and participation equations and
σε is the standard deviation. Robust standard errors were applied in order to avoid
heteroscedasticity. Wald test of independence equations is used to identify if ρ significantly
differs from zero. The results showed that there was no significant selection into employment
in several countries in some years. In such cases, however, the coefficient obtained from
Heckman model differed only negligibly from the one obtained from standard OLS wage
regression. The estimations are weighted by personal cross-sectional weights.
3.2 Data sample and variables
The analysis uses EU-SILC 2005-2012 cross-sectional individual data to estimate returns to
tertiary education. The sample includes 30 European countries, 12 new EU member states
accessing since 2004 (except Malta), here called Eastern Europe for simplicity, and 18 western
European countries (EU-15 plus Switzerland, Iceland and Norway). The income reference
period is the previous calendar year (except for the UK and Ireland, where the income
reference period is the current year and the last twelve months, respectively). Therefore,
returns to education obtained from, for instance, EU-SILC 2005 are used for year 2004 and
returns to education obtained from EU-SILC 2012 are used for year 2011.

RETURNS TO EDUCATION IN TRANSITION AND ADVANCED EUROPEAN COUNTRIES: THE ROLE OF AN EXPANSION OF HIGHER EDUCATION
CAPÍTULO 5: CAPITAL HUMANO Y CRECIMIENTO ECONÓMICO 873
The selection of prime-age (25-54) respondents ensures that their job choice (and
corresponding wage level) is influenced by neither studies (in the bottom tail of age
distribution), nor retirement (in the top tail). Current part-time or full-time employees were
selected for the wage equation estimation. Self-employed were excluded because their
fluctuating earnings would bias the analysis. In order to estimate the first step of Heckman
model, the sample was complemented by not-working individuals, namely by unemployed,
people fulfilling domestic tasks and care responsibilities and other inactive persons. Due to
limited job choice, students, (early) retired, disabled and people in compulsory military service
were excluded.
The dependent variable in the main wage equation is logarithm of hourly gross wage. As this
variable is not directly available in EU-SILC datasets, it was derived from the gross annual wage
adjusted to the number of months of part-time and full-time employment during the year
under observation and to the number of hours usually worked per week. In the early years of
EU-SILC survey, countries could choose whether net or gross earnings will be provided. Gross
annual wage was missing in several countries in 2005-2006 but, fortunately, gross monthly
earnings (albeit only as an optional variable), was provided for all countries except Latvia.
Outliers with hourly gross wage below 1 and over 100 EUR were then excluded.
In a majority of countries collecting EU-SILC surveys, hours worked and other job
characteristics are related to current situation, while the earnings are related to the previous
calendar year. Therefore, in countries where this variable is available workers who changed
their job during the previous year were excluded in order to avoid the possibility that job
characteristics and working hours would not correspond to the earnings.
Our primary focus is placed on education, more precisely a dummy variable for tertiary
education (isced 5 and 6). A dummy for low education (isced 0 to 2) is included as well. Hence,
the reference group consists of respondents with secondary education (isced 3 and 4). The
wage equation includes a dummy variable for males and work experience measured in years
(and its square). The direct variable indicating the number of years spent in paid work is not
available, or includes inacceptable share of missing values in some countries. In these cases,
years of work experience were derived as the year of survey minus the year when the highest
level of education was attained.
The wage equation further includes the following set of available job characteristics. First of
all, it introduces two dummies for employees working in a local unit with a maximum number
of 10 workers and 11-49 workers (reference group 50+ workers). As large companies typically
offer higher wages, these two variables are expected to have a negative impact on wage level.
We also have a dummy for workers with an unlimited employment contract (reference group
is workers with limited contract, temporary jobs and with jobs without any contract; missing in
Denmark and in the UK in several waves), a dummy for supervisory or managerial position and
a dummy for living in larger cities (missing in Netherlands and Slovenia) and finally 7 dummies
for occupation type.
Education and gender dummies are included as explanatory variables in the selection
equation. Additionally, this equation includes two dummies for age categories (24-35 and 35-

INVESTIGACIONES DE ECONOMÍA DE LA EDUCACIÓN NÚMERO 10
874 CHAPTER 5: HUMAN CAPITAL AND ECONOMIC GROWTH
44), dummies for the presence of children aged 0-2 and 3-5 years old, a dummy for living with
a partner and a dummy for non-earned income. The latter equals 1 if the unearned household
gross income (income from rental of a property or land, interest, dividends and profit from
capital investments, regular inter-household cash transfer received, family and children related
allowances, housing allowances, and other benefits related to social exclusion) represents
more than one half of a national poverty line, and zero otherwise. Gross values were missing in
the early years of EU-SILC in several countries, hence, net values were used (Spain, Greece,
Italy, Portugal and France).
3.3 Results of the analysis
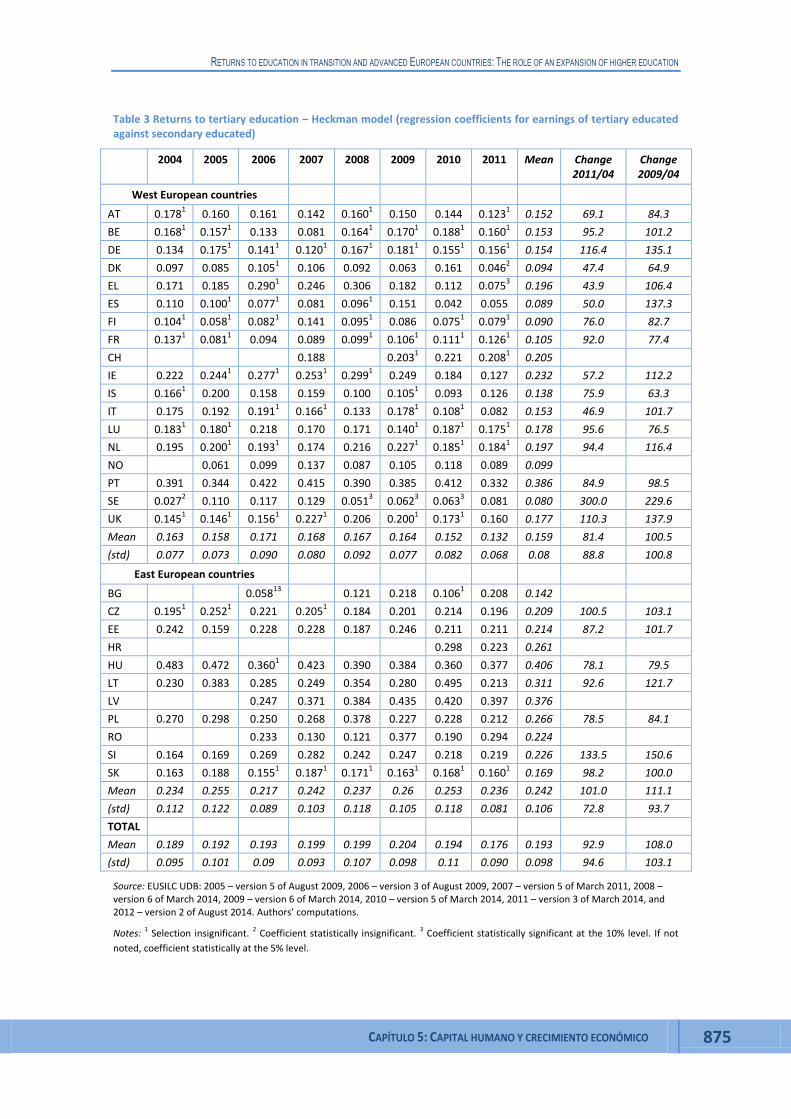
According to EU-SILC data, the level of returns to tertiary education differs considerably across
Europe (Table 3). The coefficients in Heckman regressions which indicate relative rewards of
tertiary-educated workers in comparison with secondary-educated ones fluctuate between
roughly 0.1 and 0.4. After eight years of observations, the average lowest returns occur in
Scandinavia and Spain, the highest returns were reached in Hungary, Portugal, Latvia and
Lithuania. Returns are high in transitional countries in general, but among them, the Czech
Republic is nearly last and Slovakia is the very last.
During the period under observation almost no country displayed a consistent upward or
downward trend, or a perfect stability. On average, the values increased until 2009, after this
year they started falling until they reached levels slightly lower than the 2004 figure. The
increase was caused mainly by the development of returns to tertiary education in transition
countries, which was, in spite of an opposite development in Hungary and Poland, on average
upward. In the West, in 2004-2009 the returns were decreasing in all countries except for
Germany, Spain and the UK, where they were increasing.
The above described show the year 2009, the year of the beginning of the economic recession,
as the breaking point when the so far rising returns to tertiary education started to decrease.
However, the connection is valid only in average. The prevailing picture of rising returns before
this point was influenced by several, particularly transition countries. In general, changes over
time were always much smaller than the differences between countries which remained on
quite a similar level. The returns to tertiary education are thus still considerably higher in
Eastern than in Western Europe. Among transition countries, tertiary-educated workers have
outstanding position in Hungary, Latvia and Romania. All other, except Slovakia, display a
lower, but still above EU-average level.
RETURNS TO EDUCATION IN TRANSITION AND ADVANCED EUROPEAN COUNTRIES: THE ROLE OF AN EXPANSION OF HIGHER EDUCATION
CAPÍTULO 5: CAPITAL HUMANO Y CRECIMIENTO ECONÓMICO 875
Table 3 Returns to tertiary education – Heckman model (regression coefficients for earnings of tertiary educated against secondary educated)
2004 2005 2006 2007 2008 2009 2010 2011 Mean Change 2011/04
Change 2009/04
West European countries
AT 0.1781 0.160 0.161 0.142 0.1601 0.150 0.144 0.1231 0.152 69.1 84.3
BE 0.1681 0.1571 0.133 0.081 0.1641 0.1701 0.1881 0.1601 0.153 95.2 101.2
DE 0.134 0.1751 0.1411 0.1201 0.1671 0.1811 0.1551 0.1561 0.154 116.4 135.1
DK 0.097 0.085 0.1051 0.106 0.092 0.063 0.161 0.0462 0.094 47.4 64.9
EL 0.171 0.185 0.2901 0.246 0.306 0.182 0.112 0.0753 0.196 43.9 106.4
ES 0.110 0.1001 0.0771 0.081 0.0961 0.151 0.042 0.055 0.089 50.0 137.3
FI 0.1041 0.0581 0.0821 0.141 0.0951 0.086 0.0751 0.0791 0.090 76.0 82.7
FR 0.1371 0.0811 0.094 0.089 0.0991 0.1061 0.1111 0.1261 0.105 92.0 77.4
CH
0.188
0.2031 0.221 0.2081 0.205
IE 0.222 0.2441 0.2771 0.2531 0.2991 0.249 0.184 0.127 0.232 57.2 112.2
IS 0.1661 0.200 0.158 0.159 0.100 0.1051 0.093 0.126 0.138 75.9 63.3
IT 0.175 0.192 0.1911 0.1661 0.133 0.1781 0.1081 0.082 0.153 46.9 101.7
LU 0.1831 0.1801 0.218 0.170 0.171 0.1401 0.1871 0.1751 0.178 95.6 76.5
NL 0.195 0.2001 0.1931 0.174 0.216 0.2271 0.1851 0.1841 0.197 94.4 116.4
NO
0.061 0.099 0.137 0.087 0.105 0.118 0.089 0.099
PT 0.391 0.344 0.422 0.415 0.390 0.385 0.412 0.332 0.386 84.9 98.5
SE 0.0272 0.110 0.117 0.129 0.0513 0.0623 0.0633 0.081 0.080 300.0 229.6
UK 0.1451 0.1461 0.1561 0.2271 0.206 0.2001 0.1731 0.160 0.177 110.3 137.9
Mean 0.163 0.158 0.171 0.168 0.167 0.164 0.152 0.132 0.159 81.4 100.5
(std) 0.077 0.073 0.090 0.080 0.092 0.077 0.082 0.068 0.08 88.8 100.8
East European countries
BG
0.05813
0.121 0.218 0.1061 0.208 0.142
CZ 0.1951 0.2521 0.221 0.2051 0.184 0.201 0.214 0.196 0.209 100.5 103.1
EE 0.242 0.159 0.228 0.228 0.187 0.246 0.211 0.211 0.214 87.2 101.7
HR
0.298 0.223 0.261
HU 0.483 0.472 0.3601 0.423 0.390 0.384 0.360 0.377 0.406 78.1 79.5
LT 0.230 0.383 0.285 0.249 0.354 0.280 0.495 0.213 0.311 92.6 121.7
LV
0.247 0.371 0.384 0.435 0.420 0.397 0.376
PL 0.270 0.298 0.250 0.268 0.378 0.227 0.228 0.212 0.266 78.5 84.1
RO
0.233 0.130 0.121 0.377 0.190 0.294 0.224
SI 0.164 0.169 0.269 0.282 0.242 0.247 0.218 0.219 0.226 133.5 150.6
SK 0.163 0.188 0.1551 0.1871 0.1711 0.1631 0.1681 0.1601 0.169 98.2 100.0
Mean 0.234 0.255 0.217 0.242 0.237 0.26 0.253 0.236 0.242 101.0 111.1
(std) 0.112 0.122 0.089 0.103 0.118 0.105 0.118 0.081 0.106 72.8 93.7
TOTAL
Mean 0.189 0.192 0.193 0.199 0.199 0.204 0.194 0.176 0.193 92.9 108.0
(std) 0.095 0.101 0.09 0.093 0.107 0.098 0.11 0.090 0.098 94.6 103.1
Source: EUSILC UDB: 2005 – version 5 of August 2009, 2006 – version 3 of August 2009, 2007 – version 5 of March 2011, 2008 – version 6 of March 2014, 2009 – version 6 of March 2014, 2010 – version 5 of March 2014, 2011 – version 3 of March 2014, and 2012 – version 2 of August 2014. Authors’ computations.
Notes: 1 Selection insignificant.
2 Coefficient statistically insignificant.
3 Coefficient statistically significant at the 10% level. If not
noted, coefficient statistically at the 5% level.
INVESTIGACIONES DE ECONOMÍA DE LA EDUCACIÓN NÚMERO 10
876 CHAPTER 5: HUMAN CAPITAL AND ECONOMIC GROWTH
4. CROSS EUROPE COMPARISON IN THE 2000S: THE MACRO-LEVEL
In recent decades, European countries have experienced a boom of tertiary education. A long-
term development of the proportion of tertiary-educated workers in the labour force can be
obtained from ILO database, although it is somewhat incomplete for the 1990s. We can
estimate that on average this percentage in Western countries was about 20% in the beginning
of the 1990s and it has reached 32% in 2012. In transition countries, the percentage was about
14% in the 1990s and 27% in 2012. Apparently, the number of workers with tertiary education
grew faster in transition countries and in spite of a continuing rise in the West, the gap
between the two regions was cut considerably.
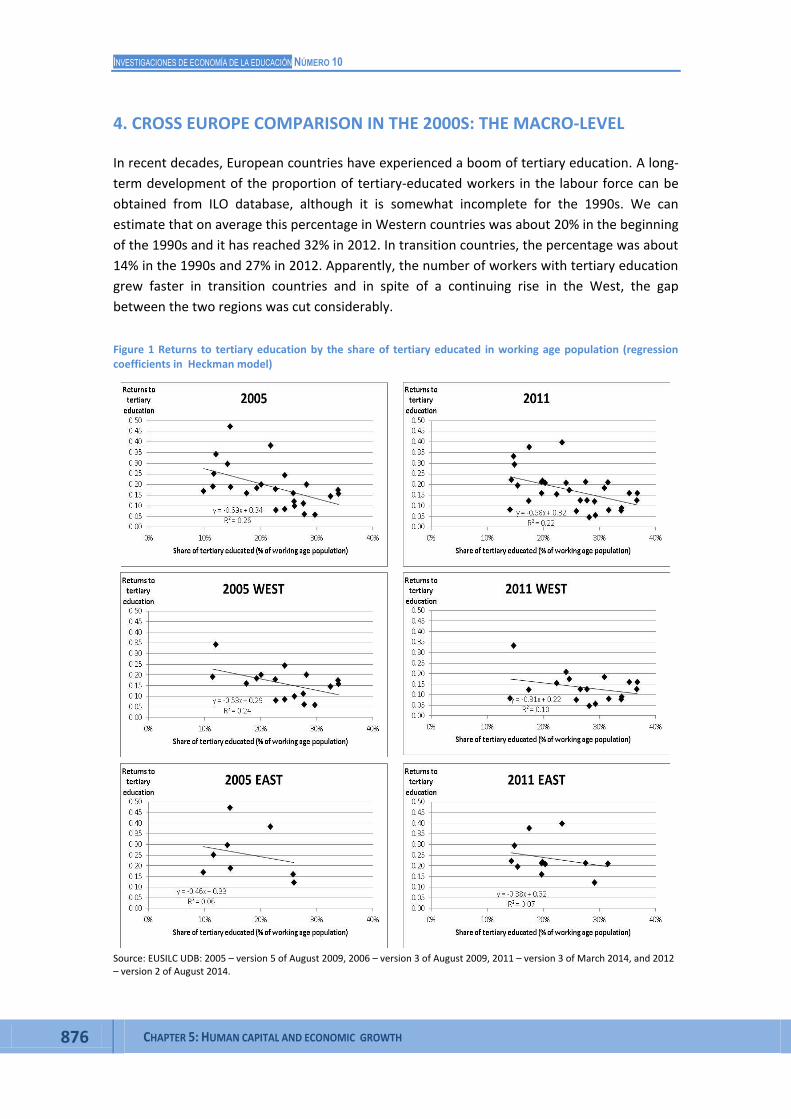
Figure 1 Returns to tertiary education by the share of tertiary educated in working age population (regression coefficients in Heckman model)
Source: EUSILC UDB: 2005 – version 5 of August 2009, 2006 – version 3 of August 2009, 2011 – version 3 of March 2014, and 2012 – version 2 of August 2014.

RETURNS TO EDUCATION IN TRANSITION AND ADVANCED EUROPEAN COUNTRIES: THE ROLE OF AN EXPANSION OF HIGHER EDUCATION
CAPÍTULO 5: CAPITAL HUMANO Y CRECIMIENTO ECONÓMICO 877
Notes: For 2005, returns to tertiary education stem from EU-SILC 2006 and share of tertiary
educated from EU-SILC 2005; for 2011, returns to tertiary education stem from EU-SILC 2012
and share of tertiary educated from EU-SILC 2011.
If we take 1998, when the ILO evidence is available for nearly all transition countries, as the
base we see that Poland showed the fastest rise until 2012 (2.5 multiple), followed by Slovenia
and Romania (about twice as much). On next places we find the Czech Republic and Slovakia
(1.9-1.8) and Hungary (1.6), and Estonia (1.2) on the last place, where, apparently, a rapid
increase occurred as early as during the early 1990s. In 2012, all the three Baltic countries
display the highest levels of tertiary-educated workers (31-37%) compared to rather low
percentages in the Czech Republic and Slovakia (20%) or the lowest in Romania (18%).
In this section, we aim to test a hypothesis that an increase in supply of educated labour
reduces its marginal product and thus the educational wage differences (Mincer, 1991). If the
growth of educated labour supply is higher than the increase in the demand, ceteris paribus,
returns to (tertiary) education should decrease. At the same time, returns to education might
increase under slow or no growth of the supply excess.
To begin, we present a simple relationship between returns to tertiary education estimated by
Heckman model in the previous section and the percentage of people with tertiary education
among the working age population (Figure 1). When comparing the East and the West of
Europe in two time observations, we can first see that, in general, the returns are indeed lower
in countries with a higher share of educated workers. However, while the association is strong
in Western countries it is very weak in transition countries. Second, this relationship
considerably attenuated across time in the West and it did not strengthen in the East. This
suggests that the labour markets are far from being saturated by tertiary-educated workers.
4.1 Methodology and data
A more detailed analysis in this section applies panel regression models, with a country as a
unit of observation. For all the below presented models, Hausman test (Greene, 2008)
indicates that random-effects model is more suitable than the fixed-effects model.
Furthermore, Breusch-Pagan (Breusch and Pagan, 1980) LM test confirmed that random-
effects panel model is more fitting than simple OLS regression for all models. Robust standard
errors are applied to avoid heteroscedasticity. The random effects model is:
, (2)
where is the between-country error and is the within-country error term. The
dependent variable is returns to tertiary education for each country i and year t obtained from
Heckman selection models based on cross-sectional individual data described in the previous
section. Vector includes explanatory variables. The variable of interest is the share of
individuals with tertiary education in the working age population (16-65), as obtained from EU-
SILC. As noted earlier, the income reference period in EU-SILC is the previous calendar year,
while education is related to the time of survey. Hence, each two subsequent waves are
combined in order to obtain the returns to tertiary education and share of tertiary educated in
time t. The panel data thus covers seven years, with t ranging from 2005 to 2011.
INVESTIGACIONES DE ECONOMÍA DE LA EDUCACIÓN NÚMERO 10
878 CHAPTER 5: HUMAN CAPITAL AND ECONOMIC GROWTH
The full set of control variables included the following country-level indicators:
Job vacancy rate (number of job vacancies as a share of number of occupied posts plus
number of job vacancies, percentage, Eurostat). Job vacancies serve as a measure of labour
demand. An ideal variable for our purposes would be the ratio of vacancies for people with
tertiary and secondary education. Unfortunately, such a division is not available and we
have to make do with the information on vacancies in the whole labour market.1 In most
countries, the majority of employed people have secondary as opposed to tertiary
education. In majority of eastern European countries this difference is as large as two-fold.
It can therefore be expected that if labour demand increases, the demand for secondary
educated people rises faster than the demand for tertiary educated, the wage gap between
tertiary and secondary educated decreases, which would result in a negative impact on
returns to tertiary education.
GDP (annual, in PPS per inhabitant, Eurostat). The effects of GDP lagged by one year and by
two years were tested as well, and all variants were tested also in logarithm. The empirics
show that returns to education are larger in poor countries, and so a negative impact on
returns to education is expected (Banerjee and Duflo, 2005, 488).
Employment in services (in percentage of total employment, Eurostat). Based on the
empirics, compared to manufacturing, not only do services attract more tertiary educated
people, but also the wages are higher here (among others, a positive gap between the
average wage in services and manufacturing adjusted for skill composition was shown by
Genre et al., 2005). A positive effect might therefore be expected.
Implicit tax rate on labour (ratio of direct taxes, indirect taxes and compulsory actual social
contributions paid by employers and employees to employed labour income, Eurostat). The
effect of tax rate is unclear, mainly dependant on the progressivity of the tax system (see,
e.g., Mendolicchio and Rhein, 2014).
Life expectancy at birth (Eurostat). Income inequality is negatively correlated with life
expectancy (e.g., Mayrhofer and Schmitz, 2014; seminal study by Preston, 1975). Longevity
is a concave function of income on an individual level and, hence, income redistribution in a
country leads to a higher life expectancy. In this sense, life expectancy might serve as a
proxy for an overall tendency for a more egalitarian income distribution of a country and
lower wage differentials, hence, a negative impact on returns to tertiary education can be
expected.
Total intramural R&D expenditure (in euro per inhabitant, PPS per inhabitant at constant
2005 prices or in percentage of GDP, Eurostat). The overall skill-biased technological change
and the related higher investments into R&D should have a positive impact on returns to
tertiary education. With the growing productivity of educated labour due to technological
changes increases the demand for it and hence the returns to education (Mincer, 1991). A
positive effect on returns to tertiary education can, therefore, be expected.
1 Although Eurostat organizes job vacancy rate by type of occupation (ISCO), which allows selecting occupations
with a higher concentration of tertiary educated workers, this information is only available for a few countries and cannot therefore be used.

RETURNS TO EDUCATION IN TRANSITION AND ADVANCED EUROPEAN COUNTRIES: THE ROLE OF AN EXPANSION OF HIGHER EDUCATION
CAPÍTULO 5: CAPITAL HUMANO Y CRECIMIENTO ECONÓMICO 879
Trade union density (share of trade union members among the total number of paid
employees, OECD). The empirical results are rather ambiguous, however, several
explanations for the ‘flattering’ hypothesis can be found (e.g., Ashley, 1999). According to
it, the effect of education on wages for union members is lower than for non-union
members, and, hence, a negative impact of trade union density is expected.
Index of strictness of employment protection legislation (OECD). EPL lowers the flexibility of
the labour market and tends to aim at the lower tail of wage distribution. Therefore, a
negative effect is expected.
4.2 Results of the analysis
Table 4 shows the results of a basic panel regression without control variables. The expected
negative impact of the share of tertiary educated population on returns to education was
confirmed for Europe as a whole.2 A dummy for Eastern Europe did not indicate any significant
difference between the east and the west of Europe (model 2); however, the Chow test (Chow,
1960) confirmed that the model coefficients for Eastern and Western Europe are significantly
different. As shown by models (4) and (6), the negative impact of the share of tertiary
education decreases returns to education only in Western Europe, while there is no effect in
Eastern Europe at all.3
In order to capture unmeasured effects of, among others, welfare-system or culture within
Europe, we added five dummies for European regions: the Visegrád Four (the Czech Republic,
Hungary, Poland and Slovakia), the Baltics, the rest of Eastern Europe, Scandinavia, and
Southern Europe (with the rest of Western Europe for reference). Except for the Baltics
(significantly positive effect) and Scandinavia (significantly negative effect), these coefficients
showed significant impact on returns to education neither in the model for whole Europe, nor
for Eastern and Western Europe.
Table 5 shows the final results including the control variables described in previous subsection.
Only variables statistically significant at least at the 10% level in at least one region were finally
included. The negative impact of the share of tertiary education remains significant for all of
Europe. Similarly to the basic model in Table 4, the dummy variable for Eastern Europe is not
significant. Chow test indicates that it is appropriate to run the model separately for Eastern
and Western Europe. Moreover, Chow predictive tests, which test a subgroup versus the total
2 The causality between returns to tertiary education and the share of tertiary educated population might be
questioned. Granger’s predictive causality test was performed in order to indicate that the share of tertiary educated population Granger-causes returns to tertiary education and not vice versa. The test (including up to three lags) rejected the null hypothesis of no Granger causality while the same cannot be said about the opposite direction. Moreover, an IV panel regression, where the share of tertiary educated population was instrumented by its (up to three) lags, was run to further support the idea that the direction of the causality in the applied regression models is correct. The results were the same regarding the significance and the sign and the coefficients were even higher.
3 Wald test indicated that the models for East Europe in Table 4 are not appropriate, see columns (4) and (5) in Table 3.

INVESTIGACIONES DE ECONOMÍA DE LA EDUCACIÓN NÚMERO 10
880 CHAPTER 5: HUMAN CAPITAL AND ECONOMIC GROWTH
sample, suggest that West European subsample should be separated while the East European
subsample should not.4 The models for Eastern Europe therefore seem unstable.
Table 4 Returns to education – panel regression, random effects, 2005-2011
(1) Europe (2) Europe (3) Europe (4)
East
(5)
East
(6)
West
(7)
West
Share of tertiary educated
-0.446*** -0.380** -0.401** 0.129 -0.100 -0.630*** -0.600**
East --- 0.057 --- --- --- --- ---
V4 --- --- 0.050 --- 0.073 --- ---
Baltic --- --- 0.128*** --- 0.124** --- ---
Rest of EE --- --- -0.016 --- --- --- ---
Scandinavia --- --- -0.064*** --- --- --- -0.057***
South WE --- --- 0.008 --- --- --- -0.007
Constant 0.294*** 0.256*** 0.274*** 0.217*** 0.203*** 0.319*** 0.326***
No. of obs. 194 194 194 72 72 122 122
No. of groups 30 30 30 12 12 18 18
R2 within 0.033 0.033 0.033 0.011 0.011 0.168 0.168
R2 between 0.226 0.293 0.531 0.011 0.362 0.227 0.342
R2 overall 0.194 0.263 0.435 0.011 0.254 0.212 0.302
Tests p-values
Wald Chi2 0.008 0.000 0.000 0.647 0.074 0.008 0.000
Hausman 0.307 --- --- 0.453 --- 0.788 ---
B-P LM 0.000 0.000 0.000 0.000 0.000 0.000 0.000
Chow 0.000 --- --- --- --- --- ---
Source: EUSILC UDB: 2005 – version 5 of August 2009, 2006 – version 3 of August 2009, 2007 – version 5 of March 2011, 2008 – version 6 of March 2014, 2009 – version 6 of March 2014, 2010 – version 5 of March 2014, 2011 – version 3 of March 2014, and 2012 – version 2 of August 2014. Authors’ computations.
Notes: * statistically significant at the 10% level, ** statistically significant at the 5% level, ***
statistically significant at the 1% level.
Regions: East=all East European countries, V4=Visegrád four (CZ, HU, PL, SK), Baltic=EE, LT, LV,
Rest of EE=BG, HR, RO, SI, Scandinavia= DK, FI, IS, NO, SE, South WE=EL, ES, IT, PT.
The results in the east and west of Europe differ substantially. Only life expectancy showed the
same significant effect in both regions. Life expectancy serves as a proxy for more egalitarian
income distribution policy in a country and its negative effect on wage educational differences
was confirmed. Tax rate also showed significant effect in both regions, but while the effect on
4 Chow predictive test is a variation of Chow test. When West Europe represents a subsample of Europe, we can
reject the null hypothesis of parameter constancy while when East Europe is tested versus the whole Europe, we cannot. The statistics is: Chow predictive test is a variation of Chow test. When West Europe represents a subsample of Europe, we can reject the null hypothesis of parameter constancy while when East Europe is
tested versus the whole Europe, we cannot. The statistics is:
⁄ .

RETURNS TO EDUCATION IN TRANSITION AND ADVANCED EUROPEAN COUNTRIES: THE ROLE OF AN EXPANSION OF HIGHER EDUCATION
CAPÍTULO 5: CAPITAL HUMANO Y CRECIMIENTO ECONÓMICO 881
returns to tertiary education was positive in the East, it was negative in the West. The higher
the taxes on labour in Western Europe are, the lower is the difference in wages for workers
with tertiary and secondary education. Thus, while the tax system has an equalising effect on
educational wage differences in Western Europe, the effect is quite opposite in Eastern
Europe. Employment in services increase returns to tertiary education only in the East.
Table 5 Returns to education – panel regression, random effects, 2005-2011, control variables
(1) Europe (2) Europe (3) Europe (4)
East
(5)
East
(6)
West
(7)
West
Share of tertiary educated
-0.468** -0.474* -0.483* -0.046 0.026 -0.493** -0.499*
East --- 0.015 --- --- --- --- ---
V4 --- --- 0.039 --- 0.012 --- ---
Baltic --- --- 0.071* --- 0.003 --- ---
Rest of EE --- --- 0.001 --- --- --- ---
Scandinavia --- --- -0.071** --- --- --- -0.028
South WE --- --- 0.061 --- --- --- -0.001
Job vacancy rate -0.025*** -0.024*** -0.021** -0.024** -0.022** -0.004 -0.005
Empl. in services 0.004* 0.004* 0.005** 0.006* 0.006* -0.001 0.000
Tax rate 0.000 0.000 0.001 0.007** 0.006 -0.005*** -0.004
Life expectancy -0.015*** -0.014*** -0.013* -0.017*** -0.016 -0.014* -0.015
Constant 1.300*** 1.210*** 1.003** 1.025*** 1.009 1.668*** 1.620***
No. of obs. 145 145 145 68 68 77 77
No. of groups 25 25 25 11 11 14 14
R2 within 0.070 0.072 0.076 0.095 0.101 0.142 0.147
R2 between 0.570 0.554 0.662 0.678 0.643 0.747 0.743
R2 overall 0.492 0.481 0.555 0.536 0.512 0.639 0.641
Tests p-values
Wald Chi2 0.000 0.000 0.000 0.000 0.000 0.000 0.000
Hausman 0.491 --- --- 0.836 --- 0.175 ---
B-P LM 0.000 0.000 0.000 0.000 0.000 0.000 0.000
Chow 0.000 --- --- --- --- --- ---
Source: EU-SILC for returns to education and share of tertiary educated population (see Table 4), Eurostat. Authors’ computations.
Notes: * statistically significant at the 10% level, ** statistically significant at the 5% level, ***
statistically significant at the 1% level. Five countries were excluded due to missing data
(Denmark, Croatia, Iceland, Italy, and Switzerland).
The negative relationship between the share of tertiary education and returns to education
was confirmed only in Western Europe. In the East, the share of tertiary education has no
effect on returns to tertiary education. On the contrary, job vacancy rate has a significant
negative impact on returns to tertiary education in the Eastern Europe and no effect in
Western Europe. In the West, the labour market reacts on labour supply while labour demand
plays more important role in the East.

INVESTIGACIONES DE ECONOMÍA DE LA EDUCACIÓN NÚMERO 10
882 CHAPTER 5: HUMAN CAPITAL AND ECONOMIC GROWTH
In both regions, the explained within-country variance in returns to tertiary education is
considerably smaller than the explained between-country variance. Hence, variables included
in the models capture differences among countries relatively well while they fail to explain
changes over time within countries.
5. DISCUSSION AND CONCLUSION
So far, cross-national comparison on returns to education was based on secondary evidence.
The results of individual national studies, which presented analyses of data provided by
statistical and sociological surveys and used various sets of explanatory variables, were
arranged into various comparisons of selected countries in certain periods. Changes in this
area could be observed on a very long-term basis (as many as 20 years or even more) in many
Western European countries, unfortunately the same applies to only few transition countries.
In Western countries this problem is addressed by numerous studies, which are available even
for less recent periods. Mostly they show no uniform trend in the level of returns to education
during the 1980s and 1990s. Instead, we observe a rather mixed picture of small increases or
decreases (often almost stability). The overall picture thus does not clearly indicate how and
due to which factors the returns to education changed in developed economies over time. The
level of returns to education among Western European countries (for one year of schooling)
ranges considerably – from about 4% in Sweden and Norway to 10% in Ireland and Portugal.
For countries of the former soviet-bloc data are rather rare. Večerník (2009) documented
stable low returns to education in the Czech Republic between 1970 and 1988 (4% return for
one year of education for men and 5% for women). In their study Andrén et al. (2005) offered
a long-term analysis of changes in Romania based on retrospective evidence gathered in a
1994 survey. Here, estimated figures for men and women together oscillated between 1950-
54 and 1985-89 between 2.4% and 4.7% with ups and downs, without any consistent trend.
Since 1990, due to availability of large statistical surveys, the data on East European countries
grows and shows a uniform upward trend in rewards to higher education. Apparently, instead
of degradation of education under the ‘working class rule’ in communist countries, it started to
be valued under the democratic and market system. In parallel with rising private profitability
of education, its supply expanded. Also the research is much more interested in this topic.
Since mid-2000s, the European Union Statistics on Income and Living Conditions (EU-SILC)
provides a unique comparative database on earnings of persons and incomes of households.
However, this database was so far only rarely used for an over-time analysis of returns to
education implementing a larger set of controlling variables. So far this source covers eight
years, with the first survey on earnings in 2004 which was conducted in 2005. Midway through
this period economic recession started.
Indeed, 2009 appears as a breaking point when rising returns to education started to decrease.
This is valid, however, only if we look at the cross-country average, as the general picture of
rising returns before this point has been affected by several, in particular, transition countries.
In general, changes over time were always much smaller than the differences between

RETURNS TO EDUCATION IN TRANSITION AND ADVANCED EUROPEAN COUNTRIES: THE ROLE OF AN EXPANSION OF HIGHER EDUCATION
CAPÍTULO 5: CAPITAL HUMANO Y CRECIMIENTO ECONÓMICO 883
countries which remained on quite a similar level. The returns to tertiary education are thus
still considerably higher in East Europe than in Western countries.
In search for factors of different returns to education across countries, a large set of economic,
demographical and institutional characteristics was applied in the panel analysis. The results in
the East and West of Europe differ substantially. Only life expectancy showed the same
significant effect in both regions. Life expectancy serves as a proxy for more egalitarian income
distribution policy in a country and its negative effect on wage educational differences was
confirmed. Tax rate also showed significant effect in both regions, but while the effect on
returns to tertiary education was positive in the East, it was negative in the West.
The assumed negative relationship between tertiary education and the returns to education
was confirmed only in Western Europe while in Eastern Europe no such effect has so far been
established. On the contrary, job vacancy rate has a significant negative impact on returns to
tertiary education only in Eastern Europe and no effect in Western Europe. Apparently in
Western Europe, the labour market reacts on labour supply, while labour demand plays more
important role in Eastern Europe.
REFERENCES
Andrén, Daniela, John S. Earle, and Dana Săpătoru. 2005. ‘The Wage Effects of Schooling under Socialism and in Transition: Evidence from Romania, 1950–2000.’ Journal of Comparative Economics 33(2):300–323.
Ashley, Terry. 1999. ‘Union Membership Effects on Black-White Differences in Returns to Education.’ Review of Black Political Economy 27(2):13–32.
Banerjee Abhijit V. and Esther Duflo. 2005. ‘Growth Theory through the Lens of Development Economics.’ In Handbook of Economic Growth, Volume 1A, 473–552, edited by Philippe Aghion and Steven N. Durlauf. Amsterdam: North-Holland.
Barth, Erling, and Claudio Lucifora. 2006. ‘Wage Dispersion, Markets and Institutions: The Effects of the Boom in Education on the Wage Structure.’ IZA Discussion Papers 2181:1–42.
Becker, Gary S. 1975. Human Capital: A Theoretical and Empirical Analysis, with Special Reference to Education, 2nd Edition. New York: National Bureau of Economic Research.
Bezzina, Eusebio. 2012. ‘In 2010, 17% of Employees in the EU Were Low-Wage Earners.’ Statistics in Focus 48:1–7.
Björklund, Anders. 2000. ‘Education Policy and Returns to Education.’ Swedish Economic Policy Review 7(1):71–105.
Breusch, Trevor S., and Adrian R Pagan. 1980. ‘The Lagrange Multiplier Test and its Applications to Model Specification in Econometrics.’ Review of Economic Studies 47(1):239–253.
Campos, Nauro F., and Dean Jolliffe. 2003. ‘After, Before and During: Returns to Education in Hungary (1986-1998).’ Economic Systems 27(4):377–390.
Chase, Robert S. 1998. ‘Markets for Communist Human Capital: Returns to Education and Experience in the Czech Republic and Slovakia.’ Industrial and Labor Relations Review 51(3):401–23.
Chow, Gregory C. 1960. ‘Tests of Equality Between Sets of Coefficients in two Linear Regressions.’ Econometrica 28(3):591–605.
Collins, Randall. 1979. The Credential Society: A Historical Sociology of Education and Stratification. New York: Academic Press.

INVESTIGACIONES DE ECONOMÍA DE LA EDUCACIÓN NÚMERO 10
884 CHAPTER 5: HUMAN CAPITAL AND ECONOMIC GROWTH
Dolton, Peter, Rita Asplund, and Erling Barth. 2009. Education and Inequality across Europe. Cheltenham, UK and Northampton, MA: Edward Elgar.
EDWIN. 2006. ‘Education and Wage Inequality in Europe – Final Report.’ http://www.etla.fi/edwin/HPSE-CT-2002-00108_EDWIN_Final_report_16012006.pdf
Fersterer, Josef, and Rudolf Winter-Ebmer. 2003. ‘Are Austrian Returns to Education Falling Over Time?’ Labour Economics 10(1):73–89.
Filer, Randall K., Štěpán Jurajda, and Ján Plánovský. 1999. ‘Education and Wages in the Czech and Slovak Republics during Transition.’ Labour Economics 6(4):581–593.
Flabbi, Luca, Stefano Paternostro, and Erwin R Tiongson. 2008. ‘Returns to Education in the Economic Transition: A Systematic Assessment Using Comparable Data.’ Economics of Education Review 27(6):724–740.
Flanagan, Robert. 1998. ‘Were Communists Good Human Capitalists? The Case of the Czech Republic.’ Labour Economics 5(2):295–312.
Fleisher, Belton M., Klara Sabirianova, and Xiaojun Wang. 2005. ‘Returns to Skills and the Speed of Reforms: Evidence from Central and Eastern Europe, China, and Russia.’ Journal of Comparative Economics 33(2):351–370.
Genre, Véronique, Daphne Momferatou, and Gilles Mourre. 2005. ‘Wage Diversity in the Euro Area. An Overview of Labour Costs Differentials across Industries.’ ECB Occasional Paper 24:1–47.
Greene, William H. 2008. Econometric analysis, 6th edition. Upper Saddle River, NJ: Prentice Hall.
Harmon, Colm, Ian Walker, and Niels Westergård-Nielsen. 2001. Education and Earnings in Europe: A Cross Country Analysis of the Returns to Education. Cheltenham, UK and Northampton, MA: Edward Elgar.
Heckman, James. 1979. ‘Sample Selection Bias as a Specification Error.’ Econometrica 47(1):153–163.
Jurajda, Štěpán. 2003. ‘Gender Wage Gap and Segregation in Enterprises and the Public Sector in Late Transition Countries.’ Journal of Comparative Economics, 31(2):199–222.
Kertesi, Gábor, and János Köllő. 1999. ‘Economic Transformation and the Return to Human Capital. The Case of Hungary, 1986-1996.’ Budapest Working Papers on the Labour Market 1999/6.
Mayrhofer, Thomas, and Hendrik Schmitz. 2014. ‘Testing the Relationship between Income Inequality and Life Expectancy: A Simple Correction for the Aggregation Effect when Using Aggregated Data.’ Journal of Population Economics 27(3):841–856.
Mendolicchio, Concetta, and Thomas Rhein. 2014. ‘The Gender Gap of Returns on Education across West European Countries.’ International Journal of Manpower 35(3):219–249.
Mincer, Jacob. 1974. Schooling, Experience and Earnings. New York: Columbia University Press.
Mincer, Jacob. 1991. ‘Human Capital, Technology, and the Wage Structure: What Do Time Series Show?’ NBER Working Paper 3581:1–54.
Moffitt, Robert. 2007. ‘Estimating Marginal Returns to Higher Education in the UK.’ NBER Working Paper 13534:1–39.
Munich, Daniel, Jan Švejnar, and Katherine Terrell. 2005. ‘Returns to Human Capital under the Communist Wage Grid and During the transition to a Market Economy.’ Review of Economics and Statistics 87(1):100–123.
Orazem, Peter F., and Milan Vodopivec. 1995. ‘Winners and Losers in Transition: Returns to Education, Experience, and Gender in Slovenia.’ World Bank Economic Review 9(2):201–230.
PURE 2001. ‘The TSER-financed project on Public funding and private returns to education – Final Report.’ http://cordis.europa.eu/documents/documentlibrary/70781481EN6.pdf
RETURNS TO EDUCATION IN TRANSITION AND ADVANCED EUROPEAN COUNTRIES: THE ROLE OF AN EXPANSION OF HIGHER EDUCATION
CAPÍTULO 5: CAPITAL HUMANO Y CRECIMIENTO ECONÓMICO 885
Psacharopoulos, George. 1989. ‘Time Trends of the Returns to Education: Cross-National Evidence.’ Economics of Education Review 8(3):225–231.
Psacharopoulos, George, and Harry A Patrinos. 2004. ‘Returns to Investment in Education: A Further Update.’ Education Economics 12(2):111–134.
Preston, Samuel H. 1975. ‘The Changing Relation between Mortality and Level of Economic Development.’ Population Studies 29(2):231–248.
Rutkowski, Jan. 2001. ‘Earnings Inequality in Transition Economies of Central Europe. Trends and Patterns during the 1990s.’ SP Discussion Papers 0117:1–54.
Rutkowski, Jan. 2007. ‘From the Shortage of Jobs to the Shortage of Skilled Workers: Labor Markets in the EU New Member States.’ IZA Discussion Paper 3202:1–28.
Schultz, Theodore. 1975. ‘The Value of the Ability to Deal with Disequilibria.’ Journal of Economic Literature 13(3):827–846.
Spillman, William J., and Emil Lang. 1924. The Law of Diminishing Returns. New York: World Book Company.
Stanovnik, Tine. 1997. ‘The Returns to Education in Slovenia.’ Economics of Education Review 16(4):443–49.
Thélot, Claude, and Marion Selz. 2004. ‘The Returns to Education and Experience: Trends in France over the Last Thirty-Five Years.’ Population 59(1):9–47.
Trostel, Philip, Ian Walker, and Paul Woolle. 2002. ‘Estimates of the Economic Return to Schooling for 28 Countries.’ Labour Economics 9(1):1–16.
Večerník, Jiří. 1995. ‘Changing Earnings Distribution in the Czech Republic. Survey Evidence from 1988-1994.’ Economics of Transition 3(3):355–371.
Večerník, Jiří. 2009. Czech Society in the 2000s: A Report on Socio-Economic Policies and Structures. Praha: Academia.
Večerník, Jiří. 2012. ‘Earnings Disparities and Income Inequality in CEE Countries: An Analysis of Development and Relationships.’ Eastern European Economics 50(3):29–52.
Večerník, Jiří. 2013. ‘The Changing Role of Education in the Distribution of Earnings and Household Income. The Czech Republic, 1988–2009.’ Economics of Transition 21(1):111–133.
