making sense of labor market returns to higher education · making sense of labor market returns to...
TRANSCRIPT

FROM COLLEGE TO JOBS: MAKING SENSE OF
LABOR MARKET RETURNS TO HIGHER EDUCATION

THE ASPEN INSTITUTE’S COLLEGE EXCELLENCE PROGRAM
The Aspen Institute’s College Excellence Program aims to advance higher education practices, policies, and leadership that signifi-cantly improve student outcomes in four areas:
• COMPLETION. Do students earn degrees and other meaningful credentials while in college?
• EQUITY. Do colleges work to ensure equitable outcomes for minority and low-income students, and others often under-served?
• LABOR MARKET. Do graduates get well-paying jobs?
• LEARNING. Do colleges and their faculty set expectations for what students should learn, measure whether they are doing so, and use that information to improve?
THE ASPEN INSTITUTE would like to thank the authors who provided papers for this report:
• Peter Riley Bahr• Thomas Bailey• Kathy Booth• Anthony P. Carnevale• Matthew Gianneschi• Andrew R. Hanson• Patrick Kelly• Ben Miller• Mark Schneider• Christina Whitfield
We also appreciate the contributions of Keith Witham, who worked in partnership with Joshua Wyner and KC Deane to research and craft the summary that opens this report.
We gratefully acknowledge the generous support of the Bill & Melinda Gates Foundation for funding the research, develop-ment, and publication of this guide. The findings and conclusions contained within are those of the authors and do not necessarily reflect positions or policies of the Bill & Melinda Gates Foundation.

FROM COLLEGE TO JOBS: MAKING SENSE OF
LABOR MARKET RETURNS TO HIGHER EDUCATION

4

INTRODUCTION
THE FUNDAMENTAL BUT THORNY QUESTION THAT LIES AT THE CORE OF BOTH POLICYMAKER AND PUBLIC CONCERNS ABOUT HIGHER EDUCATION IS THIS: HOW CAN THE VALUE OF A COLLEGE EDUCATION BE MEASURED?
Though the United States has arguably the most dynamic and accessible post-secondary education system in the world, future demand for workers with the skills and abilities provided by postsecondary education is projected to outstrip supply.1 Economists debate the extent and nature of today’s “skills gap,” but there can be little doubt that the long-term economic and social health of the country is tied closely to the educational attainment of its citizenry.
Understanding the importance of college-level skills in a global, knowledge-based economy, U.S. political leaders have over the past decade increasingly focused on raising higher education attainment rates. President Obama and many Republican and Democratic governors have set ambi-tious goals for increasing the number of degrees—as well as other postsecondary credentials—awarded annually by commu-nity colleges and four-year colleges and universities. And states have, among other policy changes, begun to shift the basis for some public higher education funding from how many students enroll to how many students graduate. The attention to college completion is well justified: Evidence overwhelmingly shows that, on average, a college education pays off for individuals—especially for those who earn a credential—and for entire communities.2
But higher education credentials are incred-ibly varied, and the increased attention to completion as a singular goal fails to acknowledge key distinctions. The fact is, while most students benefit from higher education, other students—disproportion-ately those from populations historically underserved by mainstream higher educa-tion institutions—take on high debt loads to enroll in postsecondary programs that provide questionable value.3 The rising costs of college and increasing labor market demand for college-educated workers have caused policymakers—and institutions—to recognize that counting credentials is an imperfect measure of what’s really at stake: Making sure students acquire meaningful skills and abilities that will enable them to lead productive and engaged lives.
The fundamental but thorny question that lies at the core of both policymaker and public concerns about higher education is this: How can the value of a college educa-tion be measured?
This question is not new to policymakers, college and university leaders, or students and families. But there is a new urgency to find thoughtful ways to answer it. With state and federal policy increasingly aiming to ramp up completion rates and with the price of a college degree rising, everyone who invests in and benefits from higher educa-
tion stands to benefit from better and more complete ways of understanding its value.
This report addresses the question of post-secondary education value by looking at one important measure: returns to higher education in the labor market. Of course, college graduates’ labor market outcomes—that is, the rate of employment and accom-panying earnings—reflect only part of the value conferred by higher education. But most policymakers and individuals recog-nize that, although higher education may provide immeasurable value in terms of personal growth and civic engagement, it is also an investment—one that everyone hopes will pay off for students in terms of employment and earnings, and for entire communities in terms of economic strength and quality of life.
Students, institutions, and policymakers need significantly better information than is currently available about the economic returns of a college education. Presenting eight short papers by leading experts in the field, this report provides a timely perspective from pioneering analysts on the trends, technical challenges, and poten-tial benefits associated with using labor market outcomes data to assess the value of postsecondary education. The report also poses significant conceptual questions about the ways we conceive of, collect,
1 Carnevale, A.P. Smith, R., & Strohl, J. (2013, June). “Recovery: Projections of jobs and education requirements through 2020.” Washington, DC: Georgetown University, Center on Education and the Workforce. Retrieved from http://cew.georgetown.edu/recovery2020.
2 Carnevale, A.P., Jayasundera, T., & Cheah, B. (2012, August). “The college advantage: Weathering the economic storm.” Washington, DC: Georgetown University, Center on Education and the Workforce. Retrieved from https://cew.georgetown.edu/collegepayoff. Cortright, J. (2005, December). “The young and the restless in a knowledge economy.” Cleveland, OH: CEOs for Cities. Retrieved from: http://www.ceosforcities.org/pagefiles/CEOs_YNR_FINAL.pdf.
3 PayScale. “The Most Underemployed Majors.” Retrieved from: http://www.payscale.com/data-packages/underemployment/most-underemployed-majors. Abel, J. R., Deitz, R., & Su, Yaqin. (2014). “Are recent college graduates finding good jobs?” Current Issues in Economics and Finance 20 (1). New York, NY: Federal Reserve Bank of New York. Retrieved from: http://www.newyorkfed.org/research/ current_issues/ci20-1.pdf. Schneider, M. (2014, May). “Are graduates from public universities gainfully employed? Analyzing student debt and gainful employment.” Education Outlook. Washington, DC: American Enterprise Institute. Retrieved from: http://www.aei.org/publication/are-graduates-from-public-universities-gainfully-employed-analyzing-student-loan-debt-and-gainful-employment/.
5

and use information about labor market outcomes to guide the decisions of policy-makers, institutional leaders, and students.
Some of the findings across the eight papers are surprising, at times even contrary to prevailing understanding about the value of various degrees and programs. For example:
• Students follow many varied path-ways to credentials, and some path-ways—even those resulting in the same degree—offer better labor market outcomes than others.
• Increases in income that accompany higher education do not always translate into a positive return on investment, due to variable higher education costs and accompanying debt loads. Infor-
mation on employment and earnings among those who earn credentials can be misleading if they don’t also account for non-completers’ outcomes.
• Skills valued by employers are not always confined to a given field of study—competencies associated with STEM degrees, for example, are highly valued across many non-STEM fields and occupations.
• Completion generally pays off, but it may not be the only metric of success. In some cases, clusters of courses not leading to a specific credential provide significant boosts in employment and earnings.
• Some credentials that do not appear to have free-standing value may have
significant value when assessed as part of a collection of higher education credentials that, together, lead to strong labor market returns.
It may take years for the kinds of analyses presented in these papers to provide a complete picture of labor market returns to a college education, organized in ways that are readily usable by a variety of audiences. But, even now, recent efforts and tools reveal trends that can inform the actions of students, policymakers, and college and university leaders alike, all of whom share a common goal: Increasing the chances that students succeed in higher education and in life after college.
PURPOSES OF LABOR MARKET ANALYSISOver the past several years, many promising new attempts have been made to analyze the labor market returns to a college educa-tion. The rapid release of such analyses has made it difficult for many potential end users to become aware of the findings, let alone synthesize them in useful ways. To aid in this process, Aspen asked leading scholars and policy researchers to describe the types of analyses they are currently conducting that link postsecondary education and labor market outcomes data, the data sources they use for these analyses, and the limitations of existing data for answering critical questions.
In this report we summarize a number of the key findings emerging from recent anal-yses of labor market data. One of the most important lessons evident across this set of papers is that labor market analyses are valuable to answer a range of questions for a variety of stakeholders. Spurred by the U.S. Department of Education’s Gainful
Employment regulations, much of the national conversation on the use of labor market outcomes data has centered on questions of accountability. But the kinds of analyses germane to gainful employment considerations (described in Miller’s paper) are only one way labor market outcomes data can add value. As the papers collected here illustrate, there are many different types of questions currently being asked by labor market analysts, including:
• For students: Which programs, majors, credentials, or institutions provide the best likelihood of accessing jobs that match their interests and provide solid earnings and employment opportunities?
• For institutions: Which programs are well aligned to the actual needs of employers and available opportunities for graduates, and which programs may need to be improved, redesigned, expanded, or eliminated?
• For policymakers and system leaders: How well are the state’s institutions meeting the needs of regional or state employers, driving economic growth, and advancing the social well-being of the state’s citizens? How should institu-tions be funded to meet these needs?
In addition to providing insight about the economic returns of specific programs or credentials, labor market outcomes anal-yses also hold the potential to help many audiences better understand and plan for the changing nature of work and the skills and abilities higher education must provide to prepare students for future work. By examining such trends as well as actual returns to different higher education offerings, students, college and university leaders, and policymakers can improve their decision-making in ways that strengthen outcomes for students, communities, busi-nesses, and the nation as a whole.
REPORT OVERVIEWPart 1 of this report summarizes key themes that emerge from the eight short papers; how that information can inform state, system, and institutional decisions; and how it can be used to provide better guidance to students. Part 2 summarizes key limitations in current data and offers recommendations for improving labor market data systems. Part 3 offers a brief discussion about how
future labor market outcomes analyses may need to change in order to be aligned with today’s and tomorrow’s higher education structures and pathways. Specifically, we consider whether the effective future use of labor market outcomes to measure value of educational attainment will require a funda-mental re-thinking of the unit of analysis—a shift away from analyzing returns to discrete
credentials, majors, and institutions and towards analyzing returns to comprehensive pathways of educational experiences across institutions that, combined, have demon-strable labor market value. The final section of this report presents eight brief papers from leading scholars and policy analysts about the labor market returns to different higher education offerings.
6

4 College Excellence Program. (2014, October). “Using labor market data to improve student success.” Washington, DC: The Aspen Institute. Retrieved from: http://www.aspeninstitute.org/publications/ using-labor-market-data-improve-student-success.
5 For a brief explanation of the Wage Record Interchange System 2, see page 22 of “Using Labor Market Data to Improve Student Success,” The Aspen Institute, College Excellence Program (2013). Available at: http://www.aspeninstitute.org/sites/default/files/content/docs/pubs/LaborMarketDataGuide.pdf.
WHAT DATA SOURCES ARE TYPICALLY USED TO ASSESS LABOR MARKET OUTCOMES?Labor market data are largely collected by states and the federal government, which provide limited public access. Data based on student demographics and other characteris-tics—as well as many educational outcomes—are controlled primarily by institutions, systems, or state educational admin-istrative offices, and are likewise highly restricted. Moreover, labor market and educational data are typically not merged together. Access to accurate and fine-grained data to conduct labor market outcomes analyses thus remains a significant challenge. Some data sources provide information about individuals’ outcomes, which can then be aggregated up to field of study, program, institution, region, or state-level outcomes. Other data sources provide local, regional, or state-level information at the aggregate level only.
State data sources for individual, program, and institution-level analysesState unemployment insurance (UI) data systems contain the most commonly used source of state- and institution-level data on earnings and employment outcomes. Though the UI Program is federally mandated and regulated, rules regarding the terms under which UI data can be made available are established separately by each state. Among those states that have chosen to make these data available, students’ social security numbers are matched with records from the state UI database after securing data-sharing agree-ments that include significant layers of protection to ensure that information cannot be used to identify outcomes for specific individuals. Through this match, analyses can show individuals’ wages and employment status (and industry in some cases) prior to and after enrolling in postsecondary education, but only for students who work in the same state in which the college they attended is located.4 The Center for Analysis of Postsecondary Education and Employment (CAPSEE) research described by Bailey, the College Measures initiative described by Gianneschi and Schneider, as well as research undertaken by Whitfield in Kentucky, all rely on matching between postsecondary data systems and state-level UI databases. Additionally, several states have estab-lished multi-state data-sharing agreements, and the federal government has attempted to gain agreement among states to increase their ability to access each other’s UI data.5
National data sources for program and institution-level analysesThe Gainful Employment initiative at the U.S. Department of Education, described by Miller, draws on earnings and employment data from the federal Social Security Admin-
istration. These data are similar to those contained in state UI databases in that they provide earnings information at different points in time after education and include rules to protect the privacy of individuals. These data are different from state UI data in important ways, however. In some ways they are more limited—for example, they analyze earn-ings only for career-oriented programs—and in other ways more expansive—for example, they capture information for individuals who move across state lines after leaving their college or university.
National data sources for aggregate-level analyses of labor market outcomesFor questions like those addressed by Carnevale and Hanson with respect to occupational outlook and growth, and by Kelly with respect to credential pathways, national data sets provide a broad perspective. The U.S. Census offers a range of publicly available data from monthly surveys, including the Current Population Survey (CPS) and the American Commu-nity Survey (ACS) that support national, regional, and state-level analyses of household income and educational attain-ment. Unlike state UI data, these surveys do not contain individual-level variables that support longitudinal analysis (e.g., before and after education).
Additionally, private firms like EMSI, Inc. and Burning Glass (described by Carnevale and Hanson) collect data on earn-ings and employment for clients (including colleges and universities, government agencies, and industry groups) in order to provide specialized analyses of occupational growth, educational program and labor market alignment, and economic development strategies. These data are privately controlled but have been increasingly available to researchers and policymakers to support the development of scholarship and public policy.
Though there are many other sources of local or specialized labor market data, the datasets described above support the vast majority of current research. As several of the analysts in this report point out, several obstacles stand in the way of using these data sets to conduct robust labor market analyses: limited access to the data, the decentralized and unstandardized nature of the data, and the fact that labor market returns play out over a long period (often five or more years following college exit) and therefore require data that cover a sizeable period of time to produce the most mean-ingful estimates.
7

PART 1: UNDERSTANDING AND USING INFORMATION ABOUT VALUE AND RETURN ON INVESTMENTOn average, completion of a college credential leads to increased earnings. When labor market data are used to ask more detailed questions, the findings uncover significant variation in the value of different postsecondary offerings and pathways through college.
SUMMARY OF KEY FINDINGS
COMPLETING A COLLEGE DEGREE OR CERTIFICATE GENERALLY RESULTS IN HIGHER INCOME.
Evidence in the papers presented in this report and across the field demonstrates clearly that graduating from college results in higher employment rates and earnings. Carnevale and Hanson point out, for example, that over a lifetime college graduates earn $2.3 million on average, compared to $1.3 million for high school graduates. In his analysis of Colorado data, Gianneschi observes that during the few years after graduation, “in nearly every instance, the data show that college completers earned higher wages than employees with no college degree.” Looking across several states, CAPSEE research described by Bailey concludes that returns often increase substantially over graduates’ early post-college years.
The questions that drive current analyses of labor market outcomes in relation to higher education programs and creden-tials are thus not primarily about whether higher education has, on average and in general, positive returns on lifetime earn-ings but rather about the relative value of particular types of postsecondary path-
ways, programs, and credentials both immediately after college completion and over the long-term.
HIGHER INCOME DOES NOT ALWAYS TRANSLATE INTO A POSITIVE RETURN ON INVESTMENT.
The economic return on investment for a college education depends on two factors: employment/earnings and the level of student costs and debt upon leaving a program. Both Miller and Gianneschi analyze labor market outcomes through this lens. Miller points to programs with high typical earnings for graduates and high default rates: “[O]f the 4,420 programs that have both earnings and default rate information in the [gainful employment] data, 538 (12 percent) have annual earnings greater than $25,000 but a default rate of over 15 percent.” In other words, even relatively high (or higher than pre-college) earnings for graduates do not necessarily translate into a positive return on invest-ment for all students who enroll in the program (including those who don’t grad-uate), if the earnings are not adequate to enable borrowers to service the debt they acquired. And, citing the diminished
8

returns to some degrees after analyzing direct and indirect costs that students incur, Gianneschi recommends that, when choosing a field of study, students should consider both potential earnings and how much debt they will have to take on.6 CAPSEE research finds that students in for-profit colleges in particular run the risk of high debt that cannot be recouped through higher earnings.
L ABOR MARKE T RE T URN S VARY CONSIDERABLY BY FIELD OF STUDY, AS WELL AS BY DEGREE TYPE.
On average, each additional level of higher education an individual completes results in higher earnings and stronger likeli-hood of employment. Looking across all degree-holders, those who hold doctoral or professional degrees (MBA, JD) typi-cally earn more than those with master’s degrees, who earn more than bachelor’s degree holders, and so on.
By cutting the labor market data differ-ently, however, several analyses show that students’ post-graduation earnings also depend heavily on the nature of their field of study which, at times, has more influence on earnings than the type of credential students earn. Carnevale and Hanson conclude, for example, that 30 percent of associate’s degree recipients earn more than the median worker with a bachelor’s degree. Both CAPSEE research and Schneider’s survey of earnings data across multiple states reveal that, among students who earn two-year degrees (without further higher education), tech-nical degrees typically lead to higher earn-ings than other associate’s degrees (which are generally intended to provide the first two years of a four-year program). CAPSEE research also finds that the returns to associate’s degrees in health fields far exceed those for degrees in other fields.
In each case, the analyses suggest that many vocationally and technically oriented credentials tied to specific high-demand jobs provide stronger earn-ings than many other two- and four-year degrees, assuming no further higher education. This assessment may change when labor market outcomes for multiple higher education degrees are examined in combination. Without conducting such analyses, interpreting such findings as an indication that certain credentials have no (or nominal) value may be misleading, as discussed further in Part 3 of this report.
IN SOME C ASES AND FOR SOME STUDENTS, COMPLETING A SET OF COUR S E S WI T H OU T E A RN I N G A CREDENTIAL MAY PROVIDE POSITIVE LABOR MARKET RETURNS.
Conventional knowledge suggests that students who enroll in college but never earn a credential face an undesirable outcome: They leave college having borne the costs (and often related debt) of a college education but without the creden-tial needed to help them recover those costs and succeed in the labor market. For most students and in most fields of study, this general pattern is substantiated by the data. But there appear also to be some interesting exceptions that may have significant implications for attainment goals and related policy. Bahr and Booth find, for example, that non-completing students in certain career and technical education fields can earn as much as students who complete a credential in these fields. In fact, as few as one or two courses in some fields can result in mean-ingful earnings gains, and “skills-builder” students appear to be capitalizing on this fact. These students, often working adults who enroll in college to update their skills, are making rational decisions to take courses needed to boost their earnings and employment options without completing a full credential program to do so. Such outcomes suggest that comple-tion may not be the only success metric to use, especially for a set of adult learners for whom taking specific courses may confer significant value.
SKILLS VALUED BY EMPLOYERS ARE NOT ALWAYS IN FIELD OF STUDY.
Labor market analyses on the value of career and technical education programs often include an examination of whether graduates work in jobs related to their field of study. Carnevale and Hanson offer a counterpoint to this method of assessing value, citing data showing that, even though only five percent of all jobs are considered STEM occupa-tions, 40 percent of all jobs “value” STEM competencies. Specifically, they find that students who gain STEM-related skills in college—regardless of whether they earned STEM credentials or work in STEM fields—may experience boosts in labor market outcomes relative to their peers.
GREATER SELEC TIVIT Y DOES NOT ALWAYS EQUATE TO HIGHER VALUE.
In society at large, institutional reputation has long been seen as a proxy for quality. Labor market outcomes analyses offer one concrete way of testing this assumption. Gianneschi, for example, observes that differences in earnings for graduates from institutions across Colorado are not fully explained by differences in institutional prestige or selectivity. Using data from a number of states, Schneider similarly finds that, in some fields of study, graduates from many public regional campuses earn as much as, and at times more than, grad-uates of public flagship universities.
ENROLLMENT PAT TERNS SUGGEST THAT STUDENTS’ CHOICES ABOUT PROGRAM OF STUDY ARE OFTEN NOT ADEQUATELY INFORMED BY LABOR MARKET OUTCOMES INFORMATION.
One of the most troubling trends emerging from current research is that enrollment patterns within career and technical programs are not aligned to the labor market returns students receive from those programs. The federal gainful employment data in particular suggest a sizeable gap between the supply of graduates and labor market returns in some fields. Miller cites data revealing, for example, low wage and poor employ-ment outcomes for many graduates of career certificate programs with very high enrollments, such as medical assisting and cosmetology. “Of the 15 certificate programs with the most graduates,” he notes, “10 have typical earnings of $18,000 or less.” Examining labor market returns to programs between and within institutions, Bailey posits that within-in-stitutional variation is as important as cross-institutional variation.
This variation in outcomes, combined with evidence that a large number of students enroll in programs of study with low rela-tive earnings, underscores the importance of policymakers, prospective students, and higher education institutions themselves looking not just at completion rates but labor market outcomes as well. Only then can everyone investing in and delivering higher education ensure that the focus on advancing graduation rates does not accelerate completion of large numbers of degrees and certificates that provide grad-uates negligible improvements in earnings and employment opportunities.
6 See also Schneider, M. (2014, May). “Are graduates from public universities gainfully employed? Analyzing student debt and gainful employment.” Education Outlook. Washington, DC: American Enterprise Institute. Retrieved from: http://www.aei.org/publication/are-graduates-from-public-universities-gainfully-employed-analyzing-student-loan-debt-and-gainful-employment/.
9

IMPLICATIONS FOR USERS OF LABOR MARKET DATA
Research on labor market outcomes is gener-ating significant and often surprising findings that have the potential to help policymakers, institutional leaders, and students/families make wiser and more informed decisions.Synthesizing and building on ideas and findings contained in the eight papers that follow, this summary explores ways that such findings (and similar analyses) can be used to support smarter decision-making about investments in and delivery of higher education.
USE LABOR MARKET DATA TO ALIGN INSTITUTIONAL COURSE AND PROGRAM OFFERINGS WITH SKILLS AND DEGREES THAT WILL HELP STUDENTS SUCCEED.
Recent changes in state policy are pushing many higher education institutions to grad-uate more students at a lower cost. While graduating students and controlling costs are important goals, measuring those two things alone could incent institutions to continue drawing students into degree programs that cost less to deliver, but also offer less post-graduation value, than other programs. As Miller shows, many of the career and technical certificate programs with the highest enrollment have the lowest post-graduation earnings. By continuing to enroll large numbers of students in such programs, institutions will deliver completed credentials, but (often unwit-tingly) fail to ensure they have value.
Even if imperfect, labor market data provide important signals about the types of credentials that are likely or unlikely to provide real benefit to students and the economy over the short- and long-term. By examining such information and conducting follow-up conversations with employers, colleges can decide whether to improve those programs, take steps to reduce enroll-ments in them, or close them altogether—and by doing so ensure that large propor-tions of graduates do not end up at risk of defaulting on student loans, which not only harms students but also reflects poorly on the institution (and may threaten federal funding under gainful employment rules).
IDENTIFY VALUABLE COURSE CLUSTERS AND TREAT THEM LIKE “CREDENTIALS.”
The primary focus in state and federal policy on completion of a credential (versus the attainment of a particular skillset) is pragmatic given the lack of standardized ways to measure the broad range of knowl-edge and skills acquired during college. But measuring the benefits of postsecondary attainment only among those who complete a credential prevents understanding the value that clusters of courses may have for students looking to upgrade their skills. As Bahr and Booth point out, research based on California data shows that some course clus-ters have stand-alone value, even without degree completion. Based on their findings, policymakers and institutions should assess how common this is by:
• Identifying course clusters in applied fields of study that are commonly pursued by students who often do not finish their degrees or who enroll declaring an interest in improving skills rather than earning a credential, and
• Gathering employment and earnings outcomes for students who complete those course clusters, whether or not they finish a degree or certificate.
Course clusters with strong labor market returns should be maintained, and students should be encouraged to complete them, even if they do not result in completed credentials. Policymakers and institutional leaders should consider translating high-value course clusters into certificate programs.
USE LABOR MARKET DATA TO ALIGN PUBLIC INVESTMENTS WITH SOCIAL MOBILITY AND ECONOMIC GOALS.
Public funding for higher education declined dramatically during the recent recession, and many states have not seen rebounds in appropriations during the recovery. Limited state funding means that policymakers and system leaders have to make hard choices about how to invest in higher education, and those choices are often guided by stra-tegic plans outlining ambitious goals for economic and human capital development.
In this context especially, examining facts about actual labor market returns to different higher education offerings can help policymakers align public investments to the results they value. For example, if policymakers in a state find that (as several of the papers here suggest) substantial numbers of graduates with associate’s degrees earn more than the average bach-elor’s degree holder earns, then the state might create incentives to expand those high-value programs at community colleges. Similarly, state policymakers’ decisions about relative investments might change if they learn that, as Gianneschi and Schneider suggest, graduates in some fields of study from regional colleges and universities earn just as much as graduates of the flagship universities in the same state. Financial aid—both federal and state—might also be reconfigured to better align public invest-ment with specific goals. For example, CAPSEE research cited in Bailey’s paper examines how Federal Work-Study rules can affect academic outcomes. Finally, if state policymakers want to promote delivery of certain types of degrees and certificates, they could allocate some portion of perfor-mance funding to delivery of those creden-tials. Indeed, states like Texas, Virginia, and Pennsylvania now reward institutions—or provide institutions with the option to be rewarded—for conferring degrees in high-demand fields (frequently STEM).7 At the same time, as CAPSEE research from multiple states shows, it is critical that policy decisions not be based solely on earnings and employment of students immediately after graduation. As discussed in Parts 2 and 3 of this paper, examining only short-term labor market outcomes for graduates may under-assess the value of some degrees that have strong outcomes over the longer term (such as certain liberal arts bachelor’s degrees), or over-assess the value of some credentials (including certain certificates) that give graduates a short-term bump in earnings but do not increase the rate of earnings growth over the longer term as much as other credentials do. Colleges and university leaders would be wise to gather both short- and long-term labor market
7 National Conference of State Legislatures. (2014, March). “Performance-based funding for higher education.” Denver, CO. Retrieved from: http://www.ncsl.org/research/education/performance-funding.aspx.
10
data to understand for themselves, and to inform policymakers about, the value that programs within their institutions bring to the state and to their graduates.
ASSIST STUDENTS IN MAKING BETTER DECISIONS.
Labor market outcomes analyses can help students decide where to enroll, what to study, and how to finance their educa-tion. None of the authors goes so far as to encourage students and families to rely on labor market outcomes data alone to assess the quality of different educational offer-ings. But, the authors suggest, students’ choices about colleges and programs can be improved if these data are combined with three other data elements: graduation rates, college cost and price, and contextual information on region- or locality-specific average earnings. In combination, such data can be used in the following ways.
Help students understand the long-term prospects and considerations associ-ated with different career paths. Labor market outcomes data enable students to compare not just institutions, but creden-tials in different fields of study. Thoughtfully collected and presented, these data can help students understand which creden-tials in which fields of study will most likely result in a job with strong wages in the shortest time possible as well as which are most likely to offer the greatest returns over the long term. This clarity can also provide focus for students as they pursue their studies, decreasing the chance that
something will divert them away from a longer pathway through higher education and, as a result, increasing the chance that they will complete. Even if a student wants to leave open the possibility of more school later, he or she would do well to consider carefully which degree and field of study to use as the starting point. As Carnevale and Hanson note in their paper, for example, “majoring in non-STEM, academic majors typically results in a longer, more gradual career climb than majoring in STEM or career-focused majors.” In contrast, a liberal arts associate’s degree may not have much value without subsequent comple-tion of a bachelor’s degree. To this point, Schneider encourages students to “consider your long-term educational goals when you first enroll. If you are enrolled in a two-year program with lower earnings post-comple-tion, consider whether you are prepared to continue your studies at a four-year institu-tion.” Labor market outcomes information can be especially important for lower-in-come and returning adult students who often do not have the luxury of waiting many years before seeing a return on their educational investment.
Help high school students select their postsecondary program. High school guidance offices—central conduits of information to students and families about college options—generally focus on helping students choose institutions rather than programs. By incorporating information about program-level labor market returns into their counseling, high school guidance offices can help students (1) make more
informed choices about the return they are likely to receive from their investments, and (2) differentiate between similar programs offered at multiple institutions. In both instances, more informed counseling can help students understand the true value—rather than the value based on reputa-tion—of attending particular higher educa-tion institutions and enrolling in specific programs.
Help college and university students choose a program of study. Many students rely on colleges and univer-sities to help them make well-informed choices about which program of study to pursue. Higher education institutions can use labor market outcomes data to help students choose and complete programs by:
• Providing students clear information about the net price and likely wages of different programs of study.
• Encouraging students to select a program of study as soon as possible after they enroll, which research suggests increases their chances of completing.8
• Creating clear program pathways to completion in fields with strong post-graduation outcomes.
In sum, as part of a comprehensive approach to academic and career decision-making, labor market outcomes data can be used to improve the chances that students will succeed both while in college and after they graduate.9
8 Jenkins, D. & Cho, S-W. (2014). “Get With the Program…And Finish It: Building Guided Pathways to Accelerate Student Learning And Success.” In B.C. Phillips, & J.E. Horowitz, Eds., New Directions for Community Colleges. (Special Issue: The College Completion Agenda: Practical Approaches for Reaching the Big Goal). Volume 2013, Issue 164, pgs. 27-35, Winter 2013.
9 Jenkins & Cho (2014). See also Karp, M. M. (2013). “Entering a program: Helping students make academic and career decisions.” (CCRC Working Paper No. 59). New York, NY: Columbia University, Teachers College, Community College Research Center.
EVEN IF IMPERFECT, LABOR MARKET DATA PROVIDE IMPORTANT SIGNALS ABOUT THE TYPES OF CREDENTIALS THAT ARE LIKELY OR UNLIKELY TO PROVIDE REAL BENEFIT TO STUDENTS AND THE ECONOMY OVER THE SHORT- AND LONG-TERM.
11

PART 2: UNDERSTANDING AND ADDRESSING LIMITATIONS OF LABOR MARKET ANALYSESAs the papers presented here demonstrate, analyses of labor market outcomes can be used to improve decision-making and planning for students, institutional leaders, and policymakers. But to avoid unintended negative consequences that could result, end users should keep in mind several limitations in existing data sets.
SUMMARY OF KEY THEMESAnalysts for each of the eight papers were asked to describe the limitations in the data available for their analyses, and several common themes emerged.
E M P L O Y M E N T A N D E A R N I N G S PATTERNS FROM THE PAST MAY NOT PREDIC T FUTURE L ABOR MARKET RETURNS.
Many analysts (and students) are inter-ested in learning from labor market analyses how earnings will improve after completion of a degree or a set of courses in a given field. But jobs and the skills they require often change, and the pace of change is accelerating. The degree that garnered significant value last year may no longer have the same value for students who graduate two, five, or 10 years from now. Labor market changes in some fields may require students to return to postsecondary education repeatedly during their careers. Accordingly, the predictive power of the types of analyses demonstrated in these eight papers is necessarily limited. The value of labor market analysis can be improved, however, if combined with two additional pieces of information: projections based on labor market trends and conversations with employers about where industries appear to be headed, and analyses of the durability of each credential’s returns over time.
“VALUE ADDED” ANALYSES THAT CONSIDER PRE-EDUCATION WAGES ARE BETTER THAN ANALYSES THAT ONLY EX AMINE POST-EDUC ATION EARNINGS, ESPECIALLY FOR STUDENTS WITH SIGNIFICANT PRIOR WORK EXPE-RIENCE.
Many papers in this report utilize data about the post-graduation employment and earnings power of different educational offerings, without examining pre-gradu-ation earnings. An inherent weakness of such analyses is that they do not reveal the extent to which the employment and earnings of graduates are related to the education they received. An exception is CAPSEE, which has carried out “value added” analyses in several states. Bahr and Booth’s paper shows why comparing pre- and post-graduation earnings is important: Utilizing such a comparison, they are able to show that a common assumption—that the value of college emerges only with degree completion—is not always true. And CAPSEE analyses of returns to certif-icates show that they are influenced by pre-college labor market experience. For
12

students who transition into college imme-diately after high school, gathering pre-col-lege earnings may not reveal much, as very few high school students earn high wages. For older students, however, gathering data about pre-college earnings may reveal more fully the labor market value of the education they received.
LIMITED DATA ON COST PER CREDEN-TIAL PREVENTS ROBUST ANALYSES OF RETURN ON INVESTMENT.
As Miller describes, even for some programs where graduates’ earnings are strong, there are students who incur significant debt and default on their loans. But while the return on investment to a credential is ultimately a function of both labor market outcomes and overall cost to the student, information on costs is hard to gather. Publicly available data on college costs typically provide the “sticker price” of enrolling at a given insti-tution—that is, the non-discounted tuition and fees for a credit hour, semester, or year of education. But many college students receive grants to cover a portion of college costs, others rely on various financial aid packages, and others work throughout their entire college enrollment to defray costs.10 Moreover, the average time to earn a degree varies substantially by college and level of student preparation. These vari-ations in “true” costs are not reflected in most data, making it extremely difficult to accurately assess how actual returns—as a function of both cost and outcomes—vary across institutions and programs.11
FAILURE TO CAPTURE OUTCOMES OF GRADUATES CROSSING STATE LINES AND ABOUT STUDENTS AT PRIVATE INSTITUTIONS LIMITS THE VALUE OF STATE-LEVEL DATA.
Most of the analyses described in these reports rely on state-level data sets, which capture earnings and employment outcomes only for students who (i) grad-uate from a public college within a state and
(ii) go on to have a non-federal job in the same state. Institutions that graduate large numbers of students likely to leave the state (e.g., public flagships or those near state borders) may thus have large numbers of students for whom no match can be made in the state UI database. The same is true for states where a large number of students are enrolled in private colleges, because many state-level educational data sets include information only from public institutions.12
In some cases, these limitations result in analyses that capture fewer than half of all graduates, making the subsequent findings about employment rates particularly unreli-able. If the graduates who elect to move out of state or attend a private institution are more likely to fare well in the labor market, whether because of their field of study or the reputational quality of the institutions they attended, the aggregate labor market outcomes of those who are included will be lower than those excluded. Alternatively, because unemployed graduates are not included in the state’s UI database, a low match rate in a region or state experiencing economic hardship might lead to inflation in aggregate earnings outcomes.
IMPORTANT CONTEXTUAL INFORMA-TION IS OFTEN MISSING.
The types of analyses described in these papers typically examine labor market outcomes in absolute rather than relative terms—that is, employment and earnings data are presented as stand-alone data points without consideration of the many complex economic and social factors that may affect labor market returns.13 Though data on absolute returns can be useful as one tool for consumers to help decide where and in what programs or fields to study, using labor market outcomes data out of context may also result in significant distortions. Comparing the salaries of nurses who completed college in New York City with those completing in rural northeastern New York state, for example, will reveal little
information about relative quality of the programs in those two locales. Analyses should instead support the ability of institu-tional leaders, policymakers, and students—taking into account labor market conditions at the time of employment—to evaluate outcomes for:
• Graduates of the same program over time,
• Graduates of a program compared to other regional workers in that field, and
• Graduates from the same programs at other institutions that are located in similar regional labor markets.
The authors of the eight papers that follow are careful to describe limitations in the data sets they use, offering cautions about how inappropriate conclusions can be avoided. The types of analyses they describe, however, demonstrate that through thoughtful collection and interpre-tation, currently available data can signifi-cantly improve higher education choice, policy, and delivery.
10 Net Price Calculators, required by the US Department of Education, are frequently criticized for their lack of transparency. Moreover, they are hard to access for comparative analyses, since individual schools are responsible for their own calculators and efforts to aggregate outputs have received push-back from the institutions.
11 Some analyses do include such information. For example, data presented at www.MyFutureTX.com includes the average time to attain a degree by program, and provides users with an estimate of the overall cost of attaining different degrees.
12 Virginia requires any not-for-profit campus that takes state student scholarship money to report their SUR data for matching. Arkansas and Colorado datasets built in collaboration with College Measures also include information from many not-for-profit institutions.
13 Some analyses do include such information. For example, CAPSEE research in North Carolina takes into account labor market conditions in its analysis of employment outcomes.
13

IMPLICATIONS FOR FUTURE LABOR MARKET DATA SYSTEMSWeaknesses in current labor market outcomes data not only limit rigorous analyses of trends that could point to new areas for growth and expansion, but can also lead to distortions that impair decision-making by students, institutions, and policymakers. To increase the quality and availability of labor market outcomes data and advance effective use of those data, federal and state policymakers should consider the following:
ENSURE AVAILABILITY OF PRE- AND POST-ENROLLMENT EARNINGS DATA.
In the past, most labor market analyses evaluated employment and earnings only after completion of a degree. Longitudinal employment data sets should be structured to allow analysts to compare employment and earnings for individuals before and after completing higher education, thus controlling for some unmeasured student characteristics. This is especially important for analyses of the earnings of older students with meaningful work histories.
PERMIT BROADER USE OF FEDERAL DATA AND/OR FURTHER DE VELOP CROSS-STATE DATA SETS AND DATA-SHARING FRAMEWORKS.
Without the ability to track graduates across state lines, labor market data fail to capture outcomes for many students. A federal student unit record system tied to IRS wage records could resolve this problem. In the absence of a federal system, state Unem-ployment Insurance systems can be better connected through enhanced regional data-sharing partnerships or expanded access
through the federal Wage Record Informa-tion System, both of which could improve understanding of labor market outcomes among students who move to a different state after leaving college.14
INCLUDE PRIVATE INSTITUTIONS.
While the federal government and a few states gather data on both public and private institutions, most states do not have private institution data to match with employment and earnings data. State leaders can establish voluntary or legal frameworks for engaging private institu-tions in both broad state completion goals and the sharing of data necessary to opera-tionalize and evaluate those goals, including through the tracking of graduates’ labor market outcomes.
THE FEDERAL GOVERNMENT OR FOUN-DATIONS SHOULD DEVELOP STANDARD PROTOCOLS FOR THE USE OF UNIT RECORD SYSTEMS BY RESEARCHERS.
The logistics of acquiring and using state unit record systems requires significant time and resources, which could be substantially
reduced through the establishment and adoption of more standardized procedures. Specifically, research would be greatly facil-itated if standards on data access, sharing, maintenance, and confidentiality were established and adopted by the many enti-ties that collect, aggregate, and maintain data, including colleges, system offices, state departments of commerce and labor, the National Student Clearinghouse, and K-12 institutions and systems.
While these improvements will require action by policymakers, institutional leaders should become advocates for increases in data quality and availability. Better labor market outcomes data can help institutional leaders improve planning and program design, and can also help them demonstrate the value of their colleges’ and universities’ educational offerings to students, legisla-tors, and other stakeholders.
14 For a brief explanation of the Wage Record Interchange System, see page 22 of “Using Labor Market Data to Improve Student Success,” The Aspen Institute, College Excellence Program (2013). Available at: http://www.aspeninstitute.org/sites/default/files/content/docs/pubs/LaborMarketDataGuide.pdf.
14

On the surface, this finding isn’t surprising given what we know about the nature of many jobs. In order to work as a social worker or a lawyer, for example, you gener-ally have to earn a master’s or law degree, respectively. Entry into those graduate programs requires the completion of bache-lor’s degrees and, for many students, those bachelor’s degrees are in social or behav-ioral sciences (sociology, psychology, polit-ical science) that alone may not be associ-ated with significant labor market returns. For many students, the completion of that bachelor’s degree was made possible by first attending a community college, where
a student may or may not have completed an associate’s degree before transferring to a four-year program. Again, that associate’s degree may have little stand-alone value in the labor market. While intuitive, this pattern is not fully reflected in the labor market outcomes analyses contained in this report or in the way higher education poli-cymakers today conceive of and measure the value of higher education attainment.
Comparing outcomes for graduates in different fields is challenging because, in some fields but not others, significant labor market value requires multiple
PART 3: RE-CONCEPTUALIZING THE RELATIONSHIP BETWEEN HIGHER EDUCATION AND THE LABOR MARKET: START WITH THE END IN MINDOne of the most compelling and thought-provoking notions that emerges from the papers in this report is that strong labor market returns for many postsecondary offerings result not from completion of a single credential but rather from completion of a cumulative postsecondary trajectory of which each credential is an essential piece.
COMPARING OUTCOMES FOR GRADUATES IN DIFFERENT FIELDS IS CHALLENGING BECAUSE, IN SOME FIELDS BUT NOT OTHERS, SIGNIFICANT LABOR MARKET VALUE REQUIRES MULTIPLE HIGHER EDUCATION CREDENTIALS.
15

higher education credentials. Most of the analyses in this report compare employ-ment and earnings for similar degrees in different fields (e.g., a bachelor’s degree in nursing is compared to a bachelor’s degree in history). While this analytic approach normalizes some important variables, such as the length of time and cost asso-
ciated with attaining the degree, it ignores the fact that some fields of study require additional higher education for the full labor market value to emerge while others do not. Users of these analyses must be careful not to assume that credentials with low labor market outcomes have no value, especially in fields where jobs typically
require advanced degrees. The diagram below illustrates the point at which labor market returns tend to emerge across cumulative educational pathways of five careers with relatively strong labor market outcomes.
ENG
INEE
RIN
GN
URS
ING
LAW
HVAC
TEC
HCY
BER
SECU
RITY
Bachelor’s Degree Graduate Degree
Graduate Degree
Bachelor’s Degree
Limited labor market return
Limited labor market return
High labor market return
High labor market return
labor market return
High labor market return
Moderate labor market return
Moderate labor market returnHigh labor market return
+
++
++
FIGURE 1: EMERGING VALUE OF CREDENTIALS ACROSS SELECT CAREER TRAJECTORIES
Note: This diagram illustrates the possible postsecondary educational trajectories associated with five careers with relatively strong labor market outcomes, demonstrating the variable initial and additional labor market value of individual credentials within each educational pathway.
+ +Bachelor’s Degree
Bachelor’s Degree Graduate Degree
16

THOUGH LABOR MARKET VALUE MAY NOT EMERGE FROM EARNING A SINGLE CREDENTIAL, THAT DOESN’T MEAN THE CREDENTIAL HAS NO LABOR MARKET VALUE.
Several authors cite the limited free-standing labor market value of associate’s of arts degrees conferred by many commu-nity colleges, for example. But this does not mean the value of those degrees cannot be increased. Rather, the implications of such findings are that students stopped their education too soon. Accordingly, institutions should not automatically stop offering (and policymakers stop supporting the delivery of) such degrees. For many postsecondary pathways, doing so would be like shutting down grades one through 10 because high school dropouts cannot get good jobs. Rather, community colleges and policymakers should redefine success for students in such programs as attain-ment of not just an associate’s degree, but a bachelor’s degree as well, and then take steps to ensure that many more students complete that pathway.15 And, future research should consider the labor market returns for students who earned various credentials with low independent value but who continue their education.
S T U D E N T S’ T I M E , M O N E Y, A N D PERSONAL CIRCUMSTANCES SHOULD BE CONSIDERED IN THE CONTEXT OF THE ENTIRE EDUCATIONAL PATHWAY NEEDED FOR A CAREER, NOT JUST THE COMPLETION OF ONE CREDENTIAL.
In many ways, our systems of higher educa-tion financing and delivery are premised on helping students enter and finish a degree at one institution. That can work well for students who complete all the education they need at a single college or university where financial aid, course selection, and the pace of completion can be mapped comprehensively to their career goals. But if the path to a family-sustaining job requires multiple degrees and institutions, students and the leaders and staff of all of the insti-tutions they attend—starting with the first—must help the student carefully project and plan for the amount of time and resources that will be required in the context of a longer-range trajectory of postsecondary enrollment and completion.
INCREASINGLY, INSTITUTIONS MAY NOT BE THE BEST OR MOST USEFUL UNIT OF ANALYSIS FOR ASSESSING LABOR MARKET OUTCOMES.
Industries with the most job growth are rapidly evolving, often faster than many
institutions can respond with changes to their programs or curricula. New delivery models—competency-based education and assessment, online courses and certifi-cates, and badges—are being developed and championed by everyone from policymakers to foundations to higher education associ-ations as ways of helping students demon-strate their skills and abilities to employers alongside (and in some cases instead of) degrees. The advent and spread of such new models will require that analytic approaches to evaluating labor market returns are able to directly assess students’ skills—rather than just credentials as a proxy for those skills—and match them to employment and earnings outcomes. Shifting to such an approach will not be simple nor is it likely to be done soon, but those engaged in labor market outcomes analyses as well as those who rely on the findings of such research must consider the extent to which shifts in delivery implicate fundamental shifts in the analytic approach.
15 While the majority of students entering community college report a goal of earning a bachelor’s degree, research shows that only 15 percent attain one within six years of entering community college. For more, see: Shapiro et al. Baccalaureate Attainment: A National View of the Postsecondary Outcomes of Students who Transfer from Two-Year to Four-Year Institutions. NSCRC Report 2013. Available at: http://nscresearchcenter.org/signaturereport5/
Understanding the labor market returns that result from completing a cumulative education pathway, as opposed to completing an individual credential within that pathway, has important implications for students, institutional leaders, and policymakers. Most notably:
COMMUNITY COLLEGES AND POLICYMAKERS SHOULD REDEFINE SUCCESS FOR STUDENTS IN SUCH PROGRAMS AS ATTAINMENT OF NOT JUST AN ASSOCIATE’S DEGREE, BUT A BACHELOR’S DEGREE AS WELL, AND THEN TAKE STEPS TO ENSURE THAT MANY MORE STUDENTS COMPLETE THAT PATHWAY.
17
CONCLUSION
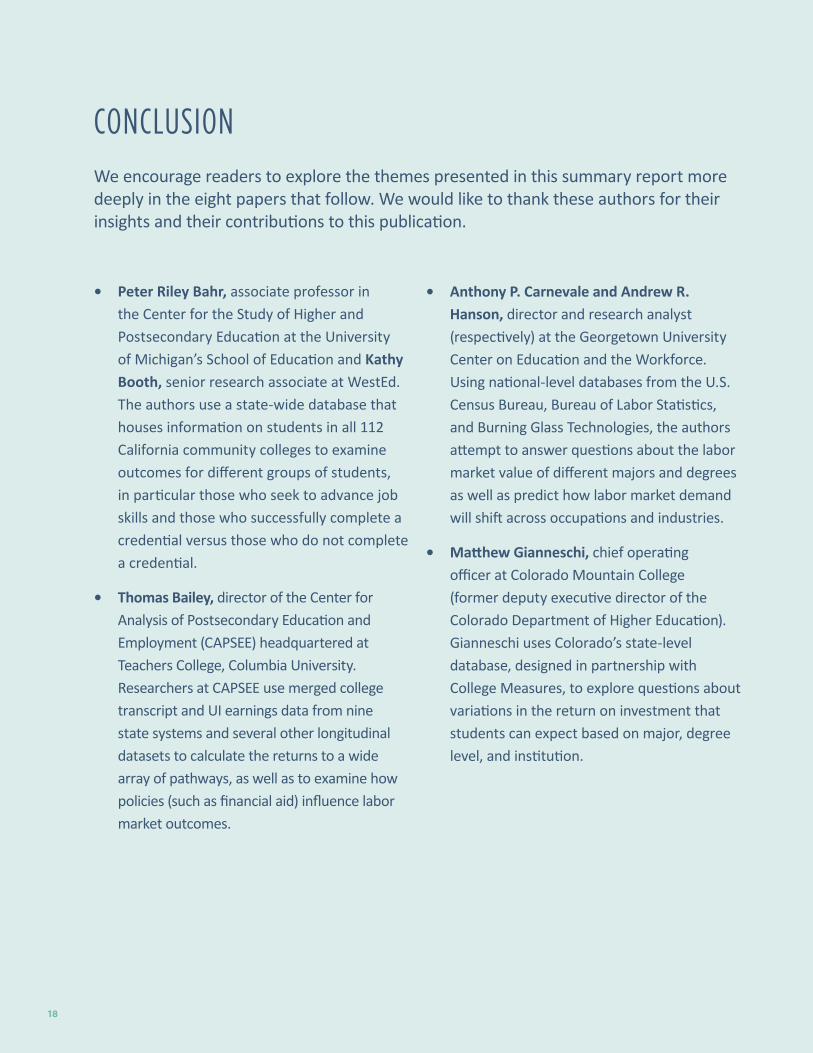
We encourage readers to explore the themes presented in this summary report more deeply in the eight papers that follow. We would like to thank these authors for their insights and their contributions to this publication.
• Peter Riley Bahr, associate professor in the Center for the Study of Higher and Postsecondary Education at the University of Michigan’s School of Education and Kathy Booth, senior research associate at WestEd. The authors use a state-wide database that houses information on students in all 112 California community colleges to examine outcomes for different groups of students, in particular those who seek to advance job skills and those who successfully complete a credential versus those who do not complete a credential.
• Thomas Bailey, director of the Center for Analysis of Postsecondary Education and Employment (CAPSEE) headquartered at Teachers College, Columbia University. Researchers at CAPSEE use merged college transcript and UI earnings data from nine state systems and several other longitudinal datasets to calculate the returns to a wide array of pathways, as well as to examine how policies (such as financial aid) influence labor market outcomes.
• Anthony P. Carnevale and Andrew R. Hanson, director and research analyst (respectively) at the Georgetown University Center on Education and the Workforce. Using national-level databases from the U.S. Census Bureau, Bureau of Labor Statistics, and Burning Glass Technologies, the authors attempt to answer questions about the labor market value of different majors and degrees as well as predict how labor market demand will shift across occupations and industries.
• Matthew Gianneschi, chief operating officer at Colorado Mountain College (former deputy executive director of the Colorado Department of Higher Education). Gianneschi uses Colorado’s state-level database, designed in partnership with College Measures, to explore questions about variations in the return on investment that students can expect based on major, degree level, and institution.
18

• Patrick Kelly, senior associate at the National Center for Higher Education Management Systems (NCHEMS). Drawing on a number of data sources including state-level databases, federal data sets, and the National Student Clearinghouse, Kelly synthesizes findings from a series of recent research projects that, together, explore questions about graduates’ expected earnings and outcomes, the capacity of states to conduct labor market outcomes analyses, and whether there are useful ways to standardize labor market analyses across systems and institutions.
• Ben Miller, senior policy analyst in the education policy program at New America. Miller uses recent analyses conducted under the federal Gainful Employment regulations to answer questions about enrollment patterns and the returns of different postsecondary programs in the context of student debt borrowed to pay for those programs.
• Mark Schneider, vice president and institute fellow at American Institutes for Research and president of College Measures. Schneider synthesizes program-level College Measures data from multiple partner states to uncover how much graduates of different programs earn at various points after graduation, ranging from 18 months to 10 years after completion.
• Christina Whitfield, vice chancellor for research and analysis in the Kentucky Community & Technical College System (KCTCS). Whitfield analyzes student unit record data from KCTCS and Kentucky’s state-level UI files to better understand the expected labor market outcomes of KCTCS academic programs and how well the system is progressing toward the goals outlined in its strategic plan.
19
Peter Riley Bahr & Kathy Booth
1. Briefly describe the data set(s) you are using to analyze the labor market returns of different higher education offerings.
Several studies of the California Community Colleges System have been conducted to better understand the labor market returns associated with various programs of study, both among degree/certificate holders across programs and between those who do and do not attain a degree or certificate within specific programs. These analyses have tapped into two different sources of data. Greaney’s (2013) research is based on a survey of career and technical education students from 35 California community colleges, distributed about 18 months after they either graduated or otherwise stopped attending college. She examined employment outcomes of the 11,512 students who responded to the survey and who either earned a credential or had taken nine or more vocational credits before leaving college (without earning a credential).
Research by Bahr (2013, 2014) and Fuller (2013, 2014) leveraged a statewide database that tracks the characteristics, course taking, and college outcomes of students in California’s 112 community colleges. This database has been linked to the state’s unemployment insurance (UI) earnings database. Fuller (2013) investigated the course taking and earnings of 67,800 students who, upon entering college in fall 2010, described their academic goal as “update job skills.” Later, Fuller (2014) used a sample of 68,772 students from 2002–2007 to explore the differences in earnings gains between students who completed credentials and those who left college without a credential and did not transfer to a four-year institution.
Bahr (2013) first examined earnings gains in a study of 174,864 students who entered California community colleges for the first time between 2002 and 2006 and engaged in a “skills building” pattern of course-taking, characterized by part-time attendance over a short duration of time and a very high rate of course success. The following year, Bahr (2014) extended and expanded his research to study earnings gains for all students who entered the California community colleges for the first-time between 2002 and 2006, producing a report addressing the earnings gains of 759,489 students.
2. What specific questions does your analysis answer?
The California research has focused on labor market returns associated with different educational pathways, comparing, for example, earnings before attending college with earnings after either graduating or ceasing coursework. These studies did not investigate students’ returns relative to the cost of educational offerings, although the California Community Colleges System has one of the lowest tuition rates in the country. Statewide, students pay $46 per unit. The cost of full-time enrollment for a year, including fees, is just $1,104.
Each of the studies examined a slightly different aspect of earning gains.
• Greaney examined a broad range of self-reported employ-ment outcomes, including whether students were employed in their field of study, whether they earned a third-party
credential, and hourly wages before and after attending community college.
• Fuller’s 2013 study explored the average earnings gains of students seeking to upgrade their job skills.
• Fuller’s 2014 study was a descriptive analysis of the relative earnings gains of those who completed credentials and those who left without a credential and did not transfer to a four-year institution.
• Bahr’s 2013 study of low-credit course-taking used advanced statistical methods to determine whether highly successful students who participate in community college for only a short time follow coherent pathways of study and whether these pathways lead to earnings gains, focusing particularly on the returns experienced by career and tech-nical education students.
• Bahr’s more comprehensive 2014 study again applied sophisticated statistical methods to quantify the labor market returns in earnings to a community college educa-tion, including the returns to degrees and certificates in 23 fields of study and the returns to course credits in each of 181 subfields of study.
3. What are the most important things this analysis reveals about labor market returns of different educational offer-ings (in light of your level of analysis)?
This suite of California studies provides a very different picture of employment outcomes for community college students—particularly those taking career and technical education courses—than has been provided by previous research. One important confounding factor in previous studies of earnings gains is that the earnings of students who completed a commu-nity college credential have been compared with the earnings of students who did not secure a certificate or degree (i.e., non-completing students), which assumes incorrectly that non-completing students are a homogenous group (see Bahr, 2014, for a complete discussion of this problem). Bahr, Fuller, and Greaney all have documented sizable earnings gains for certain groups of students who complete credits but do not complete a community college credential. Bahr, in partic-ular, demonstrated the high level of variability of earnings among non-completing students, revealing clearly the error of assuming that this group is homogenous. Combined, their research makes a compelling case for expanding success metrics beyond completion of a college credential.
California community college graduates see a positive return on investment.
Bahr (2014) found that students experienced significant increases in their earnings after completing a community college credential, including an average 7 percent gain for students who earned an associate’s degree, an average 17 percent increase for long-term certificates (more than 29 units), an average 13 percent jump for short-term certificates (6-29 units), and an average 11 percent boost for a low-credit award (less than 6 units—or about two classes).
20

Earnings gains vary significantly depending on students program of study.
While average returns to community credentials were strong, Bahr (2014) found that earnings gains varied substantially by program of study. For example, earnings gains for associate’s degrees were observed in eight of thirteen career and technical education fields, varying from 3 percent in family & consumer sciences to 106 percent in health. Associate’s degrees in only two career and technical education fields were associated with net losses of earnings—media & communications (-8 percent) and commercial services (-14 percent)—while three fields showed neither significant gains nor losses in earnings.
In contrast, returns to associate’s degrees in the ten non-ca-reer and technical education fields were either negative or did not differ significantly from zero. The fields in which negative returns were observed constitute much of the core of liberal arts education, including biological sciences (-10 percent), fine & applied arts (-10 percent), foreign languages (-14 percent), humanities (-5 percent), physical sciences (-13 percent), social sciences (-5 percent), and interdisciplinary studies (-1 percent). One might be inclined to attribute these average declines in earnings to the greater propensity to transfer to a four-year institution among associate’s degree recipients in these fields, but the effects of these credentials were calculated after accounting for this differential propensity. This suggests that these negative returns are real, at least within the nine-to-thirteen-year time span that students’ earnings were observed (including 2.5 years prior to entering college).
Bahr (2014) also found that earnings gains sometimes varied by the type of award within a given field of study. For example, in the field of engineering & industrial technologies, short-term certificates, long-term certificates, and associate’s degrees all improved earnings by roughly the same amount—11 percent to 12 percent. However, in public & protective services (e.g., law enforcement, fire technology), the highest value was found with short-term certificates (32 percent) and long-term certificates (27 percent), while lower gains were observed for low-credit awards (13 percent) and associate’s degrees (11 percent).
Many career and technical education students who did not graduate still had significant earnings gains.
In his study of short-term course-takers, Bahr (2013) found that a meaningful fraction of first-time students—about 1 in 7—elect to take only a few courses over a short time frame and then complete these courses with an exceptionally high rate of success. Bahr documented significant earnings gains for non-completing students in 16 of 24 career and technical education subfields in which these students are likely to be found. Returns to six completed credits (about two classes) ranged from 2 percent (automotive technology) to 66 percent (chemical technology).
Bahr’s (2014) more comprehensive analysis demonstrated that the earnings gains associated with most combinations of credential level (e.g., associate’s degree, long-term certificate) and field of study (e.g., information technology, business & management) did not differ significantly from the earnings gains
associated with similar coursework without the credential. In other words, in most cases, a student who completes a given credential and a student who takes similar coursework but does not complete that credential will experience similar earnings gains, though a noteworthy exception was the field of health, in which the completion of a community college credential was a significant factor in earnings gains. In explaining this finding, Bahr reasoned that community college coursework, particularly coursework in career and technical education, teaches skills that are valuable in the labor market, but that many commu-nity college credentials have low signaling value to employers. In short, workers are able to translate the competencies that they master in college directly to their work or to securing a certification or license given by a third party, both of which have greater value in the workforce than a community college certificate or degree.
In line with Bahr’s findings, research is beginning to emerge that third-party credentials may help to explain earnings gains from a community college education. For example, Ewert and Kominski (2014) found that third-party credentials have a significant impact on the incomes of workers who reported having “some college” or an associate’s degree. Greaney’s study found that almost a third (31 percent) of survey respondents had gone on to earn an industry certification, state license, or journey status.
While Bahr’s (2013, 2014) research is the most advanced and definitive of the studies discussed here, the findings of the other studies are worthy of mention. In particular, Fuller’s 2013 descriptive analysis of students seeking to update their job skills found that, although most of these students did not earn a community college credential, their median annual earnings increased by an average of 11 percent within one year, rising from $49,000 to $54,600.
Fuller’s 2014 comparison of earnings for completers and non-completers was mixed, particularly when looking at specific demographic groups, genders, age ranges, programs of study, and economic regions. Overall, completers experienced larger increases in earnings than non-completers. However, income patterns were different for students aged 35 and older, students aged 25 or older taking ten units or less, and those who selected “personal development” or “update job skills” as their goals. In these cases, college participation appeared to be part of a steady increase in wages, which were higher both before and after taking college courses. For example, among students who took 10 or fewer units (about three classes or less), non-com-pleting students entered college making $70,000 a year and increased their earnings to $75,000 after one year and $80,000 after five years—a steady upward climb. In contrast, completers entered college making $45,000 and increased their earnings to $55,000 after one year and $60,000 after five years—a bigger initial increase, but at a much lower income total.
Greaney found that more than one-third (35 percent) of survey respondents did not complete a community college creden-tial and did not transfer to a four-year university. Eighteen months after their final term in college, these non-completing students had wages that were similar to those of completing students. However, as in Fuller’s 2014 study, Greaney found
21
that non-completing students had higher wages before begin-ning their studies, indicating that the wage gains experienced by completing students were greater than those of non-com-pleting students.
This pattern may have been a function of experience, with non-completers entering college with more time in the work-force and more prior training than that of completers. For example, Greaney found that non-completers’ average age was 37. This student profile is also found in Bahr’s (2013) research on short-term non-completers, who had an average age of 37, and Fuller’s (2013) research on students seeking to update job skills, who had an average age of 38.
In addition to being older, many non-completing students have already succeeded in higher education. Greaney found that 27 percent of non-completing survey respondents had earned a bachelor’s degree or a higher degree prior to enrolling in community college coursework. Fuller’s (2013) skills-upgrade research found that 33 percent of students had attended a four-year college prior to enrolling in community college. (Because Bahr’s research focused on first-time students, his analysis did not include the earnings gains of these “returning” students.) Fuller and Greaney’s research appears to support a common argument made by community college practitioners, namely that students enroll to fill skills gaps as part of their overall career growth, rather than to build an entirely new set of skills (Booth, 2014).
4. What are the limitations of your data/analysis?
The biggest limitation in studies of labor market returns is the earnings data on which these studies are built. Currently, there are only two sources of earnings data commonly available to colleges—UI databases and students’ self-reported data gath-ered through surveys. UI data do not capture earnings from self-employment and informal cash arrangements, military and federal civilian employment, employment in other states, and a few other sectors. These data “blind spots” can lead to inaccurate estimates of earnings. For example, real estate is one of the larger programs within the field of business & manage-ment. Bahr (2014) found a negative return to credits completed in real estate (-9 percent to 12 credits). However, many real estate workers are self-employed. Hence, the apparent reduc-tion in earnings actually may represent students moving from employment sectors that are captured in the UI earnings data to sectors that are not captured (self-employment in this case).
Survey data also have flaws. With a 24 percent response rate, the students who responded to Greaney’s survey may not be a representative sample of all students who have participated in career and technical education coursework in the California Community Colleges System, making it problematic to draw inferences or conclusions for the larger population.
It is important to note that research on earnings gains for non-completing students is a new area of inquiry, and there are many questions that this research raises. For example, it is not clear yet what role third-party credentials, such as state licenses and industry certifications, play in students’ earnings
gains. Also, even with the lengthy period of time in which earn-ings were observed in Bahr’s (2014) study, a still longer timeline may be needed to fully understand the evolution of earnings for students who complete community college credentials in non-career and technical education fields and then transfer to a four-year institution. Finally, research in California has just begun to explore the relationship between course-taking pathways and employment retention.
5. What are the implications of your analysis and conclu-sions—specifically as they relate to student success—that are important to convey to students, policymakers, and institutional leaders?
To effectively measure community college outcomes, account-ability needs to be predicated on an understanding of the many different types of students who are served by community colleges, not all of whom are seeking to earn a community college certificate or degree. The studies by Greaney, Fuller (2014), and Ewert and Kominski demonstrate that a large number of students already hold postsecondary or third-party credentials and are using the community college to develop new skills throughout their careers. There still is an urgent need to provide longer-term foundational training for tradi-tional college-age students, but the concept of college needs to be expanded to encompass the training needs of students of non-traditional age as well. Bahr and Booth (2012) coined the term “skills-builder” to describe these students and make them more visible to policymakers, researchers, administrators, and practitioners.
Success metrics for community colleges, particularly for career and technical education programs, should quantify the extent to which students have acquired (through their community college education) the necessary skills to gain and retain mean-ingful employment. In addition to traditional metrics, such as the completion of degrees and certificates, these new metrics could include:
• Earnings gains
• Securing employment and employment retention
• Completing third-party certifications
Although few colleges currently have comprehensive access to this information, there are a number of actions that various parties could take, based on the research findings:
Students
• Dig deeper into earnings information: Many resources that list earnings for college students focus on overall returns for graduates, rather than earnings based on specific fields of study or earnings gains for short-term programs. Students should examine average earnings for specific disciplines, and older students should be aware that publicly available figures are for those who complete a program of study rather than those who fill a discrete skill gap.
• Know which path is right: Determine the appropriate training options for a given set of interests, experience
Peter Riley Bahr & Kathy Booth
22

levels, and skills gaps. Colleges may have multiple tracks, including comprehensive programs for students just starting out and short-term training for those expanding a skill set or transitioning between careers.
Policymakers
• Expand community college success metrics: Limiting success metrics to completion of a college credential misses important ways that community colleges support the work-force. Despite the prevalence of short-term job training programs that do not lead to a degree, metrics often focus on graduates. Even when post-college outcomes like earn-ings are taken into account, data sets are limited to those who complete a postsecondary certificate or degree. To better understand how colleges help bridge skills gaps, workforce education success metrics should incorporate employment retention, attainment of living wages, earnings gains, and securing third-party credentials that are valued by employers.
• Improve access to data: Although employment, earnings, and third-party credential metrics are of clear value, few colleges or states have access to this information. Poli-cies that allow for automatic data sharing between state licensing agencies and community colleges, as well as agreements that share earnings data with other states, would foster more comprehensive analyses of community college impact.
College Leaders
• Examine local pathways: As a first step toward evaluating the success of individual programs, colleges first need to determine where short-term course-taking pathways fit in their curricula, how these course clusters relate to industry needs, and which types of students benefit most from particular pathways. This information then can be used to drive goal-setting, program evaluation, program develop-ment, and student advising.
• Assess programs based on more comprehensive metrics: Once program pathways and likely outcomes are clear, ensure that program review and departmental improve-ment efforts are informed by appropriate data. For example, a longer-term program that serves recent college graduates might be evaluated using program completion rates and attainment of living wages. Short-term programs targeting displaced workers might be evaluated using third-party credentials, job placement rates, and earnings gains.
• Establish policies for students seeking to fill skills gaps: Students seeking to fill skills gaps have a different set of needs than do those pursuing degree pathways. Colleges should set appropriate rules for low-credit career and technical education students, particularly regarding devel-opmental education assessments, educational planning, and limitations on course repeatability.
References
Bahr, P. R. (2013). Well-worn non-completing pathways in career and technical education fields in the California Community College system. Ann Arbor, Michigan: Center for the Study of Higher and Postsecondary Education, School of Education, University of Michigan.
Bahr, P. R. (2014). The labor market return in earnings to community college credits and credentials in California. Ann Arbor, Michigan: Center for the Study of Higher and Postsecondary Education, School of Education, University of Michigan. Retrieved from http://www.soe.umich.edu/people/profile/peter_riley_bahr/.
Bahr, P. R., & Booth, K. (2012). What’s completion got to do with it?: Using course-taking behavior to understand community college success. Berkeley, California: Research and Planning Group for California Community Colleges. Retrieved from http://www.rpgroup.org/resources/completion-inquiry-guide-and-research-tools.
Booth, K. (2014). The ones that got away: Why completing a college degree is not the only way to succeed. Oakland, California: LearningWorks & WestEd. Retrieved from http://www.wested.org/resources/the-ones-that-got-away-why-completing-a-college-degree-is-not-the-only-way-to-succeed/.
Ewert, S., & Kominski, R. (2014). Measuring alternative educational credentials: 2012. Washington, DC: Census Bureau, U.S. Department of Commerce. Retrieved from https://www.census.gov/prod/2014pubs/p70-138.pdf.
Fuller, R. (2013). Identifying skills building students. September 27, 2013, presentation to the California Community Colleges Chancellor’s Office Vocational Research and Accountability Committee.
Fuller, R. (2014). Exploring labor market returns for California community college awards by comparing wages of completers and leavers. April 11, 2014 presentation to the Research and Planning Group for California Community Colleges Conference. Retrieved from http://www.rpgroup.org/resources/exploring-labor-market-returns-california-community-college-awards-comparing-wages-complet.
Greaney, K. (2013). CTE employment outcomes survey results. September 27, 2013, presentation to the California Community Colleges Chancellor’s Office Vocational Research and Accountability Committee.
23

Thomas Bailey
1. Briefly describe the data set(s) you are using to analyze the labor market returns of different higher education offerings.
The Center for Analysis of Postsecondary Education and Employment (CAPSEE) is a national research center headquar-tered at Teachers College, Columbia University, and is directed by Professor Thomas Bailey. It is funded through a grant from the Institute of Education Sciences of the U.S. Department of Education.16 CAPSEE is composed of research teams at Teachers College, University of Michigan, University of California–Davis, Harvard University, and Stanford University.17 Examples of CAPSEE research papers are provided in a brief references section below.
CAPSEE researchers conduct rigorous analyses of the economic returns to postsecondary education and on the effectiveness of selected policies and programs in increasing the economic value of college. The research takes account of differences in student characteristics, program and major, intensity and sequence of enrollment, working while enrolled, financial aid characteris-tics, institution type, and in some cases individual institutions. The research pays particular attention to the implications of non-completion.
To conduct these analyses, researchers at CAPSEE use a wide range of datasets, with information at the individual, college, and state levels spanning multiple cohorts and institutional types. The primary type of CAPSEE analysis uses system-wide student-record datasets from several states. The full datasets are merged from three sources. First, we have student-level transcripts, including courses taken, grades, awards, time in college, and financial aid, as well as basic demographic data. In most cases, the full datasets are for community college students, but in some cases, some detailed data on students in high school and four-year colleges are available. Second, we have transfer data for students who attend multiple colleges, including each college the student subsequently attended, their time in college, and their award. In some cases, these data come from statewide datasets, but in most cases they come from the National Student Clearinghouse. Third, we have wage data from Unemployment Insurance (UI) records that span the period before the student enrolled in college, while they were enrolled, and the time after they exited college. These datasets are for entire cohorts (e.g., all students who first enrolled in a college in a given year) and cover cohorts who entered college between 2001 and 2010.
CAPSEE researchers are analyzing these system-wide data-sets in eight states. In North Carolina and Virginia, CAPSEE researchers are analyzing the labor market returns to cohorts of community college students; these analyses cover all students in each system. In Michigan, CAPSEE researchers are analyzing the labor market returns for a sample of colleges within the Michigan community college system. In Ohio and Arkansas,
CAPSEE researchers have information on all students in postsec-ondary education in those states and so are looking at returns to two-year and four-year institutions. CAPSEE researchers are also analyzing the returns to college in California, with a focus on students in career and technical education, and in Florida, with a focus on the returns to occupational programs. Finally, CAPSEE researchers had previously examined the labor market returns to community college in Washington State.
CAPSEE researchers are also using other national and newly-cre-ated datasets to analyze the labor market returns to college. These datasets are also at the individual student level. CAPSEE researchers have used national survey data to look at returns to awards using: the National Longitudinal Survey of Youth 1997, the Beginning Postsecondary Students Longitudinal Study 2004/2009, and the Education Longitudinal Study 2002-2012. A CAPSEE research team has also created its own dataset on employment probabilities from responses to resumes mailed out to prospective employers.
These datasets are formed from data on individual students, and the majority of the analysis is at the student level—including many subgroup analyses by student characteristics. However, CAPSEE researchers have aggregated the data to look at returns to individual colleges and groups of colleges, as well as the returns to enrollment in the for-profit sector. CAPSEE researchers have also performed course-level analysis, looking at the returns to online learning and to math courses.
2. What specific questions does your analysis answer?
What are employment/earnings benefits of educational path-ways and awards?
The research estimates the labor market returns to a compre-hensive array of student pathways. These include returns to: baccalaureate and sub-baccalaureate awards, including certifi-cates; subjects/programs (generally and per award); non-credit programs; and credit accumulation.
Returns are also calculated for different student groups, including those who: transfer across colleges; do not complete; never declare a major; begin in developmental education; exit their state to find alternative employment; enroll in online courses; and those who enroll in or transfer to a for-profit college.
The purpose of these investigations is to identify where labor market returns are high and where they are low across different pathways through college and across different groups of college students.
What institutional programs and public policies improve completion rates and employment/earnings?
CAPSEE researchers are looking at how other factors—beyond individual student choices—influence returns. Studies focus specifically on four main areas:
16 Grant number R305C110011.
17 See the CAPSEE website (www.capseecenter.org) for a list of CAPSEE participants and a description of all of the projects.
24

• Working and employment while enrolled in college
• Financial aid and its many influences on enrollment, persistence, and earnings over time
• Providing students with more detailed and useful infor-mation about the economic value of college programs and pathways through One-Stop Centers and other career exploration programs for students
• Institutional differences and especially the role of minori-ty-serving institutions.
The purpose of these studies is to examine the relative impor-tance of contextual and policy factors in determining the returns to college.
Most of the CAPSEE research focuses on estimating the gross returns to college (i.e., without subtracting the costs of college). However, in some analyses CAPSEE researchers have calcu-lated the net rate of return to college. For the overall returns to awards and credits, CAPSEE researchers in North Carolina have estimated the net present value (internal rate of return) to community college. This figure is very large from the student perspective because fees at community colleges (particularly those in North Carolina) are so low. Also, CAPSEE researchers have calculated the returns to for-profit college, including fees and accounting for student debt loads post-college. These returns are very low relative to enrollment in a public institu-tion; this is primarily because the fees at for-profit colleges are typically much higher.
For each question (and area of investigation), CAPSEE researchers focus on returns over the early adult lifetime across different types of postsecondary education. That is, as well as looking at returns at a fixed date after exiting college, CAPSEE researchers examine labor market profiles before, during, and after enrollment and model the trajectory of earnings growth over this extended period. These examinations compare returns across college students (not between college students and high school graduates).
3. What are the most important things this analysis reveals about labor market returns of different educational offer-ings (in light of your level of analysis)?
More intensive postsecondary education yields positive, robust, sustained, and consistent earnings gains for the vast majority of enrollees.
Specifically, CAPSEE researchers have identified very large returns to associate’s degree completion, to transfer and completion of bachelor’s degrees, and to completion of certifi-cates/diplomas, as well to as credit accumulation. That is, when-ever we compare students with more postsecondary education to those with less postsecondary education, we almost always find that, on average, the former group has higher earnings than the latter. This finding applies not only to those who attain credentials, but also to those who just accumulate credits.
We find these gains are substantially meaningful (e.g., in North Carolina an associate’s degree adds 25-61 percent to earnings over community college enrollees who do not complete). We find them to be robust to alternative empirical specifications (including fixed effects, which compare student earnings before, during, and after their college enrollment; Mincerian earnings equations, which compare the earnings of individuals with different levels of education; and subgroup analysis, which compares the earnings of individuals with the same level of education from different demographic groups). They are also evident across most institutions within a state (Kalleberg & Dunn, 2014). We do not find any evidence that the Great Reces-sion (2007-09) adversely affected these returns. Also, we find these gains to persist over the post-college years for which we have earnings data. Finally, we find that the earnings gains are generally consistent across states and that the evidence thus yields a plausible consensus about positive returns to college (see the discussion in Belfield & Bailey, 2011).
There are a few exceptions to these conclusions. First, the earn-ings gains from shorter certificates tend to dissipate a few years after exiting college, and associate’s degrees in liberal arts or general studies have quite low returns generally (Liu, Belfield, & Trimble, 2015). Associate’s degrees in these areas are designed for students planning to transfer and earn a bachelor’s degree, so the payoff would primarily result from completion of the four-year degree. Second, students in for-profit colleges do not have high returns primarily because these colleges charge much higher fees (Deming, Goldin, & Katz, 2013; Deming et al., 2014; Liu & Belfield, 2014). These are the areas where postsecondary education has limited value.
Student pathways through college are extremely diverse, and this influences the variation in returns.
It is difficult to summarize the diversity in patterns of students, particularly those in community colleges. These students are enrolled in programs leading to a range of awards (associate’s degrees, certificates, diplomas), and some accumulate more than one award. Many want to transfer to a four-year institution (others transfer to colleges that look similar to their original college); some students switch sectors, from public to for-profit or private colleges. Many enroll part-time or temporarily “stop out”; most completers take considerably longer to graduate than what the program requirements indicate. Although many of them are working full-time while enrolled, college students have access to a diverse set of financial aid options. And of course the students enroll in programs with different require-ments and subject material.
All of these different factors can influence the returns to college. This heterogeneity suggests that some students will follow pathways that are more successful than others in terms of labor market returns (regardless of whether they receive an award or not). For example, students who access Federal Work-Study appear to have superior academic outcomes when work-study substitutes for other types of work (Scott-Clayton & Minaya, 2014).
25

The concept of “the returns to college” develops over a very long time period.
Analysis of the returns to college requires a substantial amount of detail over a long period of time. First, it is important to have information about students before they enroll in college—either their high school education or their prior work experience and earnings. Second, it is important to know what pathway the student follows through college. But these pathways often take years to emerge: Many students go part-time, work while enrolled, switch or transfer institutions; only 59 percent of students at four-year colleges complete their degree within six years.18 The fact that many students are working means that researchers must pay attention to how working comple-ments—or detracts from—studying and whether the returns to college are not partly returns to work experience. The fact that many students transfer means that the returns to college might actually be returns to a series of credentials (e.g., an associate’s degree and then a bachelor’s degree). And finally, earnings data are needed for at least five years after exiting college in order to get a reasonably accurate depiction of earnings growth and labor market returns. Overall, the full articulation of “the returns to college” requires at least a decade of data on each individual student. Data that do not span this amount of time are likely to yield an incomplete and potentially misleading picture of the returns to college.
4. What are the limitations of your data/analysis?
The main limitation of the analyses of the system-wide and longitudinal datasets that CAPSEE conducts is that, for the most part, they do not permit causal interpretation. This is true of almost every large-scale dataset used by CAPSEE researchers (but not the CAPSEE resume audit study). However, it means that we cannot assume that, for example, the higher returns to a bachelor’s degree in a particular field reflect a causal effect of that award; it might be that motivation or other unmeasured attributes are actually causing the returns to be higher.
It is unclear how important this limitation is. Generally, research evidence finds that standard approaches to returns to broad degree levels of education (associate’s or bachelor’s degrees or years of schooling) do yield results that are close to those from a causal estimate; so this limitation may not be damaging. Also, we apply a fixed effects estimation that does control for unobservable time-varying characteristics (an improvement over standard approaches); and we can estimate ”bias on observables” to see how robust the results are to changes in model specification. Finally, we are able to exploit exogenous variations in policies and college practices to estimate treat-ment effects in some studies.
The second limitation is that while the datasets we use are longitudinal, they do not follow students for a long enough period of time. This limitation is surprising because we expected to have a sufficient window for analysis. For example, we have transcript information for students who entered college in
2003, ostensibly for a two-year degree, and we have earnings data for them from the 1990s up to 2013. However, there are two factors that make this window too short. First, students are increasingly taking longer to complete: A student who begins in 2003 might not complete until 2007. Second, the returns to degrees grow as the student ages: A student who completes in 2007 will still, even by 2013, be experiencing a growth in returns (i.e., not just their own wages will be growing but the difference between their wages and those with less education will be growing).
This second limitation is important. It means that estimates of labor market returns are probably understated. Also, it makes it very difficult to estimate labor market returns in a timely way: Unless the researcher has data that cover at least ten years after the student first enrolled, the estimates of returns are likely to be significantly biased. And this also means that the most accurate analyses are for educational pathways that are at least a few years old. This is a problem in an era of reform in which programs are changing, because it thwarts the measurement of returns to recent reforms.
Third, there are limitations of the available data. Our datasets include the population of students within a state, allowing for extensive subgroup analysis. And they are very detailed over time, allowing for estimates with time-varying fixed effects. However, there are some domains where the data are missing. First, the transfer data do not cover all colleges that students might transfer to (some colleges do not submit reports on where their students had previously enrolled). Second, the UI earnings data for a given state typically do not include students who move out-of-state for employment, and they do not include all workers; they exclude independent contractors, military personnel, some federal personnel, and those working in the informal sector (e.g., informal laborers). Finally, state-level systems often do not merge high school data with their postsecondary education data. Thus, it is often very difficult or impossible to control for prior academic achievement.
These limitations are not trivial but they are probably modest. Lack of coverage in the transfer data affects only a small subset of students (almost all large/public schools report their transfers to the National Student Clearinghouse). The missing earnings data means that in practice around 10 percent of all workers do not have earnings data over the full period of analysis. These limitations affect subsets of students: The non-reporting colleges are more likely to be in the for-profit sector; and the missing earnings data are biased against college programs where the occupational intent is self-employment. The impact of the final limitation—bias from unobservable ability—depends on what comparison groups are used and which econometric specification is applied. In CAPSEE research, ability bias does not appear to be large (if we control for first-se-mester college GPA), and the fixed effects specifications (which should offset time-invariant ability bias) are not substantially different from standard earnings specifications.
18 Snyder, Thomas D. (2014). Table 326.10. “Graduation rates of first-time, full-time bachelor’s degree-seeking students at 4-year postsecondary institutions, by race/ethnicity, time to completion, sex, and control of institution: Selected cohort entry years, 1996 through 2006.” Digest of Education Statistics, 2013 (NCES 2014-085). National Center for Education Statistics, Institute of Educational Sciences, U.S. Department of Education. Washington, DC. Available at: http://nces.ed.gov/programs/digest/d13/tables/dt13_326.10.asp.
Thomas Bailey
26

Lastly, it is often difficult and time consuming to gain access to both the statewide longitudinal education data and the UI data. For outside researchers, such as the CAPSEE partic-ipants, gaining access, even within one state, often requires negotiations with multiple state agencies. Access depends on developing relationships with individuals in state agencies and can be limited or terminated when personnel leave or when interpretations of legislation such as the Family Educational Rights and Privacy Act (FERPA) change.19 Under the best circum-stances, the process involves unanticipated delays in acquiring data. These difficulties severely limit the use of these types of datasets for research purposes. They also indicate the need for a mechanism whereby researchers can gain access to de-iden-tified data of this sort from across states.
5. What are the implications of your analysis and conclu-sions—specifically as they relate to student success—that are important to convey to students, policymakers, and institutional leaders?
Students
• Choose your pathway carefully. There are many pathways through college, and some pathways lead to greater (and more rapid) labor market success than others. Almost all the students who complete an award in the health fields have high returns, for example. Career-technical programs in community colleges tend to have good returns, but it depends on the field. However, accumulating general course credits that are then bundled into a generic associate’s degree in liberal arts, for example, is unlikely to maximize the returns to college, unless it leads to a higher-level degree. Slow progression through college also delays the time before which students can utilize their skills in the labor market.
• Be strategic about changing institutions. Many students transfer across colleges. But if this slows down course completion—or requires retaking many courses—it is unlikely to be optimal. If a student enrolls in a for-profit college, he or she should be very mindful about the relatively high fees that these colleges charge and the consequent increase in student debt after college. Students who transfer without obtaining an award from their original college are gambling that they will receive an award from the destina-tion college. Students who do not earn an award before transferring and who do not earn a bachelor’s degree (or take a long time to do so) end up with no degree and thus do not enjoy the economic benefits that come from having earned one.
• Weigh all the options when contemplating dropping out. Generally, dropping out of college is ”leaving money on the table.” Although it is not always true, in the vast majority of analyses we find that students with more credits do better in the labor market. Thus, even staying in college for an extra semester can help. A student should think about whether dropping out will foreclose occupational choices.
• Understand your financial aid situation. Financial aid programs are complicated and students may not be fully availing themselves of all the grants, loans, subsidized work-study, and scholarships that are available. The key decision factor is the net return to college; students with access to more generous financial aid will therefore have a higher net return because they will have lower costs.
Policymakers
• Provide students and colleges with more data. Given the heterogeneity in pathways and length of time needed for college to pay off, both students and colleges require a substantial amount of information to make optimal deci-sions. However, adequately collecting that information and analyzing it is almost certainly far too much of a practical burden for individual students or colleges. Policymakers should therefore provide resources for the collection and analysis of data on optimal college choices and provide the information to students in a timely fashion. This will help students “vote with their feet” and help colleges reorganize their offerings to best serve students.
• Use information on returns to better regulate colleges, but take account of different student characteristics and differences in program mix. CAPSEE evidence on the rela-tively poor returns for students attending for-profit colleges suggests that these colleges are not being adequately scrutinized. In particular, the low returns stem from higher college fees rather than from low earnings. Policymakers should look at the prices colleges charge as an immediate indicator of how high the returns to college would have to be in order to justify higher prices. However, policymakers should be mindful of the substantial within-institution variation. Differences in average earnings for graduates of particular colleges may reflect differences in the mix of students served and programs offered by the college as much or more than differences in the average quality of the programs at each college.
• Consider why state funding is not being increased. If the overall conclusion is correct—that the returns to college are substantial, robust, and persistent—then this raises the question: Why have state governments been reducing their support for postsecondary education? Policymakers should consider whether the current funding is too low and, if so, why it is not being increased to serve more students.
Institutional Leaders
• Ensure that programs are aligned with labor market and further education requirements in high-return fields. Most comprehensive institutions offer a wide array of courses and programs. Students often report being confused by the large number of choices available to them and unclear about the optimal path to program completion and employment and further education goals. As a result, many students do not take optimal paths through college, taking courses that do not count toward their intended degree or, for community
19 U.S. Department of Education. (2014, June). “Family Educational Rights and Privacy Act (FERPA).” Retrieved from: http://www2.ed.gov/policy/gen/guid/fpco/ferpa/index.html.
27

college students, taking courses that will not transfer for junior standing in their desired major. Colleges need to take steps to ensure that the paths through programs are clearly specified and that program learning goals are well-aligned with the requirements for success in employment and further education in fields offering strong career prospects for their students. To accomplish this, colleges need to work closely with employers and institutions at the next level to define program learning goals and monitor program quality. Colleges should also monitor student progress into and through their programs of study, providing frequent feedback to students and intervening when students struggle or fall off-path.
• Help entering students choose an appropriate program of study. Despite the importance to long-term earnings of a student’s choice of a program of study, many, if not most, colleges do not provide intensive assistance to help students explore career opportunities, choose a field of interest, and develop an academic plan for pursuing that interest when they first enter college. Many students arrive at college without clear goals for college and careers; most, and particularly those from educationally and economically disadvantaged backgrounds, probably do not have a clear sense of the available options. Most colleges offer career services, but these tend to be offered for students to use on a voluntary basis, are typically disconnected from academic programs, and focus more on students who are nearing the end of their programs rather than on those starting out.
• Recognize that some pathways and some programs are more efficient than others. Even as more students should probably be enrolling or persisting in college, it is still important that they choose an appropriate pathway. Unavoidably, some pathways offer higher returns, and colleges need to orient provision to get more students onto those pathways and off alternative (inferior) pathways. For example, the returns to nursing and health fields are extremely high and yet enrollments in these fields have not expanded. Conversely, non-vocational courses that lead to general awards such as an associate’s degree in liberal arts pay off primarily if the student transfers and earns a bach-elor’s degree. For students who enroll in such programs, colleges should work jointly with target four-year colleges to facilitate their transfer and successful completion of a bachelor’s degree. Students who are not likely to transfer should be encouraged to enroll in programs that pay off at the certificate or associate’s degree level.
• Help students with their transition into the labor market. The returns to college will be higher if students can start out on successful careers as soon as possible: The longer the delay between leaving college and getting a good job, the lower the returns. This logic is compounded when, as is the case for current generations of students, they have large student loan burdens. If colleges can successfully help students transition into the labor market, this will benefit students immediately and enhance the long-term returns to college.
References
Belfield, C., & Bailey, T. (2011). The benefits of attending community college: A review of the evidence. Community College Review, 39(1), 46–68.
Deming, D. J., Goldin, C., & Katz, L. F. (2013). For-profit colleges. The Future of Children, 23(1), 137–163.
Deming, D. J., Yuchtman, N., Abulafi, A., Goldin, C., & Katz, L. F. (2014). The value of postsecondary credentials in the labor market: An experimental study (CAPSEE Working Paper). New York, NY: Center for Analysis of Postsecondary Education and Employment.
Gelblum, M. (2014). The early impact of postsecondary career and technical education: Do workers earn more in occupations related to their college major? (CAPSEE Working Paper). New York, NY: Center for Analysis of Postsecondary Education and Employment.
Kalleberg, A. L., & Dunn, M. (2014). Institutional determinants of labor market outcomes for community college students in North Carolina (CAPSEE Working Paper). New York, NY: Center for Analysis of Postsecondary Education and Employment.
Liu, Y. T., Belfield, C. R., & Trimble, M. J. (2015). The Medium-Term Labor Market Returns to Community College Awards: Evidence From North Carolina. Economics of Education Review, 44, 42–55.
Liu, Y. T., & Belfield, C. (2014). Evaluating for-profit higher education: Evidence from the Education Longitudinal Study (CAPSEE Working Paper). New York, NY: Center for Analysis of Postsecondary Education and Employment.
Schudde, L., & Scott-Clayton, J. (2014). Pell grants as performance-based aid? An examination of satisfactory academic progress requirements in the nation’s largest need-based aid program (CAPSEE Working Paper). New York, NY: Center for Analysis of Postsecondary Education and Employment.
Scott-Clayton, J., & Minaya, V. (2014). Should student employment be subsidized? Conditional counterfactuals and the outcomes of work-study participation (CAPSEE Working Paper). New York, NY: Center for Analysis of Postsecondary Education and Employment.
Xu, D., & Trimble, M. J. (2014). What about certificates? Evidence on the labor market returns to non-degree community college awards in two states (CAPSEE Working Paper). New York, NY: Center for Analysis of Postsecondary Education and Employment.
Thomas Bailey
28
Anthony P. Carnevale & Andrew R. Hanson
1. Briefly describe the data set(s) you are using to analyze the labor market returns of different higher education offerings.
Since 2010, the Georgetown University Center on Education and the Workforce (CEW) has released a series of reports analyzing the returns to college. We have primarily relied on data from the U.S. Census Bureau, Bureau of Labor Statistics (BLS), and Burning Glass Technologies.
We use two major cross-sectional surveys from the U.S. Census Bureau: the Current Population Survey (CPS) and the American Community Survey (ACS). The CPS is a monthly survey of 60,000 U.S. households. CEW frequently utilizes CPS’ Annual Social and Economic Supplement, which is administered in March of each year and contains more detailed labor market infor-mation than the monthly survey. The ACS is a monthly survey of 250,000 households, or 3 million each year. Due to its large sample size, the ACS is ideal for conducting regional, state, and sub-state analyses. We have also used the Survey of Income and Program Participation (SIPP), a panel survey that follows up to 50,000 households for up to four years, to analyze labor market outcomes for postsecondary certificate holders.
The BLS’ Occupational Outlook Handbook contains information on more than 1,000 occupations, projections of job growth, and education requirements. We use these data, in partnership with Economic Modeling Specialists, Intl. (EMSI), to conduct our own projections of the demand for education in the national, regional, and state labor markets. The BLS’ Occupational Infor-mation Network (O*NET) contains data on the competencies—knowledge, skills, abilities, work interests, work values, and personality traits—that are important for different occupa-tions. We use these data to analyze labor market outcomes for workers with different competencies, and how the demand for different kinds of competencies has changed over time.
Burning Glass Technologies has a database of online job adver-tisements, sometimes referred to as “real-time labor market information (LMI),” that contains data on job openings by occu-pation, industry, and education requirements for job openings that require a college degree. We use these data to analyze labor market demand for different levels of education across occupations and industries.
2. What specific questions does your analysis answer?
Our analyses answer the following questions:
• Which occupations will undergo the strongest job growth over the next decade? How much education will they require?
• How much can a student in a given major expect to earn in the labor market? How likely is a college graduate with a given major to be gainfully employed?
• How much is a college degree worth: How much more can a college degree holder earn relative to a high school grad-uate? How much is a certificate worth?
• How do labor market returns by education vary by gender, race/ethnicity, class, and age?
• How do the returns to a degree or certificate vary by major or field of study?
• What specific competencies—knowledge, skills, abilities, work interests, work values, and personality traits—are in demand in the national labor market, as well as specific occupations and industries (e.g., healthcare, STEM)?
• Which degrees, certificates, licenses, and certifications are in demand in national and state labor markets?
In some cases, such as our 2012 report Certificates, we incor-porate data on cost by institutional sector (e.g., community colleges compared to for-profit colleges). However, our analyses are largely restricted to labor market outcomes.
3. What are the most important things this analysis reveals about labor market returns of different educational offer-ings (in light of your level of analysis)?
On average, more education pays.
Over a lifetime, college graduates earn $2.3 million on average, compared to $1.3 million for high school graduates.20 This earn-ings gap appears to be widening: The wage premium workers receive from a college education—the difference in earnings between high school and college graduates—increased from 40 percent in 1970 to 84 percent in 2010.
Majors and fields of study have an even larger influence on earnings than degree level.
Within and across degree levels, workers have vastly different earnings:
• College graduates who majored in the highest-paying fields earn up to three times as much as those who majored in the lowest-paying fields making the difference in earnings between the most- and least-paid college graduates greater than the difference between the average college and high school graduates.21
• A bachelor’s degree in petroleum engineering translates into a median annual wage of $120,000, compared with $29,000 per year for a bachelor’s degree in counseling psychology.22 And while degrees from prestigious institu-tions do confer advantages, a teacher with a bachelor’s degree from Harvard still typically makes less than an engi-neer with an associate’s degree from a community college.
• The choice of majors also affects college graduates’ chances of landing a job in the first place. The unemployment rate of recent college graduates with degrees in information systems, for instance, was nearly 14.7 percent, compared to 4.8 percent for graduates who majored in nursing.23
• The importance of field of study is so powerful that workers with less education in one field frequently earn higher
20 Carnevale, A. P., Rose, S. J., & Cheah, B. (2011). The college payoff. Washington, DC: Georgetown University, Center on Education and the Workforce. Retrieved from http://cew.georgetown.edu/collegepayoff/.
21 Earnings data are calculated using median earnings for full-time, full-year workers of ages 18-64 population, 2010. Carnevale, A. P., Strohl, J., & Melton, M. (2011). What’s It Worth? The Economic Value of College Majors. Washington, DC: Georgetown University, Center on Education and the Workforce. Retrieved from http://cew.georgetown.edu/whatsitworth.
22 Ibid. 29

wages than those with more education in another. Overall, 30 percent of workers with an associate’s degree earn more than the median worker with a bachelor’s degree24 and one-quarter of male certificate holders earn more than the median male bachelor’s degree holder.25
Occupations also play a strong role in determining wage and employment outcomes.
Workers with less education can out-earn those with more education if they gain access to high-paying occupations. For example, an engineering technician with an associate’s degree typically earns more than a high school guidance counselor with a master’s degree.
Our analysis of labor market outcomes for certificate holders reveals that there are many certificates—especially in fields of study with high concentrations of women—that do not confer a substantial wage premium over a high school degree. In some cases, such as cosmetology and food service certificates, female certificate holders earn less than the median high school-ed-ucated female worker. By contrast, certificate fields with high concentrations of men largely offer substantially higher wages relative to the median high school-educated male worker.
At the bachelor’s degree level, career-focused majors tend to result in high earnings, while non-STEM, academic majors, such as psychology, typically require a graduate degree to secure a substantial earnings premium.
4. What are the limitations of your data/analysis?
The major limitation of our analyses is that we are not able to analyze labor market outcomes by program of study. Programs of study, not institutions, are the fundamental units that transmit economic value to students. Assessing labor market outcomes at the program level represents the current state of the art in measuring postsecondary education and training.
Second, except in rare instances, our analyses do not factor in the cost side of the cost-benefit equation. Yet, in determining whether a particular postsecondary program of study is worth pursing, labor market outcomes are made more meaningful when combined with data on the relative costs of particular programs.
Last, our analyses are largely restricted to the private economic returns to particular degrees, certificates, majors or fields of study, or competencies. They therefore underestimate the social returns of education that result from a more productive workforce and higher levels of economic growth, higher tax revenues, and lower crime for example.
5. What are the implications of your analysis and conclu-sions—specifically as they relate to student success—that are important to convey to students, policymakers, and institutional leaders?
Students should recognize that what you make in the labor market depends on what you take in college. Our analyses can help students make informed choices about what to study, so they understand the likely labor market outcomes of any postsec-ondary program before they decide to enroll in it. This includes the likelihood of employment at different stages in the career ladder, expected annual earnings, and the likelihood of working in the same career field as a student’s major or field of study.
Students
Students should recognize that majoring in non-STEM, academic majors typically results in a longer, more gradual career climb than majoring in STEM or career-focused majors. For these students, further education or training is typically needed to gain traction in the labor market. Healthcare career fields offer a high probability of finding employment and, for healthcare professional and technical professions, relatively high earnings. Finally, getting into a high quality program of study is more important than choosing the right college or institution, though they often go hand in hand.
Institutional Leaders
Institutional leaders should prioritize counseling students about which programs to enroll in based on the likely labor market outcomes of the programs. Projections data and real-time LMI can provide institutional leaders with a sense of which career fields—such as healthcare, STEM, and community services—are projected to grow over the next decade and have substantial numbers of job openings. Institutional leaders can use these data to counsel students about relative labor market value of different programs of study as well as inform decisions about which programs of study to offer or expand.
Institutional leaders should recognize that programs are not valuable only for preparing students for particular career fields, but in breeding competencies that are valuable across many career fields. For example, STEM occupations represent only 5 percent of all jobs, but more than 40 percent of jobs place a high value on STEM competencies. Consequently, STEM majors typically earn high wages regardless of whether they work in STEM occupations. In fact, they often earn more when employed in non-STEM careers.
Policymakers
For policymakers, the lesson is that the costs, risks, and returns on postsecondary education and training programs are highly variable. For today’s high school graduates, and an increasing share of middle-aged adults, decisions about whether to enroll in college, which institution to attend, and which program of study to pursue will have critical economic consequences.
As things now stand, however, they are making those decisions in an information vacuum. The U.S. postsecondary education
23 Carnevale, A. P. & Cheah, B. (2012). Hard Times: College Majors, Unemployment, and Earnings. Washington, DC: Georgetown University, Center on Education and the Workforce. Retrieved from: http://cew.georgetown.edu/unemployment.
24 Carnevale, A. P., Rose, S. J., & Cheah, B. (2011). The college payoff. Washington, DC: Georgetown University, Center on Education and the Workforce. Retrieved from http://cew.georgetown.edu/collegepayoff/.
25 Carnevale, A.P., Rose, S.J. & Hanson, A.R. (2012). Certificates: Gateway to Gainful Employment and College Degrees. Washington, DC: Georgetown University, Center on Education and the Workforce. Retrieved from http://cew.georgetown.edu/certificates.
Anthony P. Carnevale & Andrew R. Hanson
30

system is a kaleidoscope of institutions and interests, and educational policies vary from state to state. Most importantly, there is no unified data system that connects postsecondary fields of study and degrees with actual labor market demands. Such a system would enable students to better understand how their training is likely to fit into the real-world job market, and it would also motivate institutions to be more accountable for shaping their programs to fit their students’ needs.
The good news is that the data and technology needed to create such a system already exist, and the costs of integrating them into a unified whole are relatively low.
Policymakers should determine standards against which post-secondary programs of study whose stated purpose is gainful employment should be judged to determine whether they should qualify for public funds.
Matthew Gianneschi
1. Briefly describe the data set(s) you are using to analyze the labor market returns of different higher education offerings.
The dataset used for this analysis is “Economic Success Measures-Colorado”, a database designed in partnership between the Colorado Department of Higher Education and College Measures, a non-profit policy research organization.26 The College Measures data set combines state unit-level records for recent college completers with state Unemployment Insur-ance (UI) records, which contain quarterly wage records for all individuals employed by organizations that participate in the state UI system (typically all non-federal employers). Though several states have produced College Measures data sets, this paper reflects only the data set prepared by the Colorado Department of Higher Education.
2. What specific questions does your analysis answer?
By matching postsecondary completion records, including details regarding each student’s degree type and major/disci-pline, with wage records from the Colorado Department of Labor’s UI dataset, the College Measures site allows students, administrators, and policymakers to observe labor market returns (annual wages) and wage differentials for recent college graduates of all levels. This dataset provides answers to the following questions:
• What are actual first-year wages for recent college gradu-ates by major, degree level, and institution?
• To what extent do degree types and academic majors explain wage differentials among recent college graduates?
• To what extent does the institution from which a credential is earned explain initial wage differences among recent college graduates? That is, does the market seem to favor certain institutions over others?
• How much money should a student with a particular academic background expect to earn in his or her first year after graduating college?
• To what extent should a student expect to receive a return on his or her investment in education, including money (direct and indirect), time, and effort?
3. What are the most important things this analysis reveals about labor market returns of different educational offer-ings (in light of your level of analysis)?
From a human capital perspective, the most important finding confirmed by the data is that college degrees matter. In nearly every instance, the data show that college completers earned higher wages than employees with no college degree. In other words, regardless of the level of training, investments in college typically resulted in higher wages. By and large, the data confirm other conventional expectations regarding initial labor market returns: graduates of programs in applied sciences, such as engineering and health fields, command higher than average returns to degree; graduates with degrees in general liberal arts and the performing arts generally command wages at or below average levels; and graduates of professional or certificated fields, such as nursing or fire science, command higher wages, initially at least, than graduates of non-certificated fields such as sociology or general studies.
The data reveal a few noteworthy surprises as well.
• At the undergraduate level, graduates of two-year applied programs (“associate’s of applied sciences” degrees in career and technical education fields) earned substantially more on average than graduates of four-year programs.
• Even after controlling for program discipline and degree level, earnings among recent graduates often vary widely across institutions, especially in non-certificated fields with robust supply such as business and the social sciences. And, some of the differences in earnings appear to have little to do with the selectivity or prestige of the institution from which the degree was earned, information that could be of particular import to students and families attempting to estimate whether the costs—including debt—at a particular institution represent a good value.
• Finally, the data uncover that additional levels of educa-tion can result in diminished returns to the individual after considering the direct (money, time, and effort) and indirect (foregone earnings) investments for additional levels of education. It’s true that wages do not—and should not—be the only criterion used to justify additional levels of education, but data like those provided by the College
16 For more information, visit: www.collegemeasures.org/esm/colorado/
31

Measures site can help individuals make more informed decisions regarding their consumption of and investments in education.
4. What are the limitations of your data/analysis?
The use of initial wage records presents several important limitations related to time of collection, state-based conditions, and students’ demographic and employment characteristics.
• Time of Data Collection. The first and most obvious is that the data do not show wage growth over time. The data only reveal initial wages immediately following graduation; they are silent regarding lifetime earnings, an important consid-eration for individuals who plan to enter careers that pay modest initial wages that may grow dramatically over time.
• Level of Collection. Because the data are derived from state-level sources, they do not allow the user to compare returns to degree across states, at least not directly. In other words, because the data are limited to a single state and do not include graduates who move out of state after gradu-ating, they are indicative of state market conditions only.
• Student Characteristics. The data do not control for students’ background characteristics, such as age, gender, or race/ethnicity, so it is not possible to detect the extent to which a graduate’s age, gender, or prior work experience may explain perceived wage differentials. In other words, marketplace biases, if present, are imperceptible by way of the College Measures data set.
• Graduates’ Employment. Finally, the data only reveal labor market outcomes for graduates who (a) work full-time, (b) are not continuously enrolled in college, or (c) are not employed by the federal government. This means that the data do not capture wages for part-time employees, those who continued their education, or those who are employed by the federal government, which could affect the results for certain degree fields such as forestry or natural resource management. As a result of the foregoing, it is not unusual for the College Measures data, at least those at the college major level, to suffer from limitations associated with small sample sizes.
5. What are the implications of your analysis and conclu-sions—specifically as they relate to student success—that are important to convey to students, policymakers, and institutional leaders?
Students
Human capital theory rests on an assumption that individuals will invest in themselves—most typically through higher levels of education as their abilities permit—when they expect to enjoy a return on their investments of time, money, and effort. Importantly, in order to maximize their investments, students need access to accurate information regarding expected future earnings. That is, to make “rational” decisions regarding optimal levels of educational investments, students should be able to reasonably approximate their probable earnings and compare
this information to the costs of their investments—the sum of direct costs (including debt) and indirect costs (such as fore-gone earnings). From a human capital perspective, inaccurate information impairs rational decision-making and can lead to miscalculations regarding the consumption of education and expected individual returns.
Historically, college students have had access to imprecise information regarding labor market outcomes. They under-stood that college degrees matter and that certain degree or fields are more handsomely compensated than others, but their information was generic and unspecific. Most data on wages, such as national survey information or census reports, only present labor market returns within certain occupations (e.g., “nursing” or “accounting”) or within degree levels (e.g., “baccalaureate,” “master’s,” “professional,” etc.). Such data do not allow students to explore differences in particular majors at specific institutions or to investigate variations across insti-tutions within a regional marketplace. The consequence is that individual decisions regarding human capital investments can be compromised.
Data from Colorado’s College Measures site would be helpful to prospective students, especially in dispelling certain myths about which academic programs lead to prosperous careers, and should be used by high school and college advisors to help students select programs of study and institutions in which to enroll. Data concerning college outcomes not only improve students’ awareness of current labor market conditions, but also help students establish and maintain academic goals, improve their decision making, and sustain the momentum needed to persist and complete their studies.
Finally, labor market data like those found in the College Measures dataset are central to addressing the nation’s most pressing education policy concern: The need to successfully educate millions more citizens, primarily those who represent communities traditionally underserved by American colleges and universities. The Georgetown Center on Education and the Workforce (2013) estimates that by 2020, 65 percent of all new jobs in the U.S. will require education beyond high school. Moreover, the Western Interstate Commission on Higher Educa-tion (2014) estimates that by the time current kindergarteners reach the 12th grade, the majority of high school graduates in America will be traditionally underserved students, particularly Hispanic/Latino students, who often come from families with limited familiarity with colleges and universities. The conver-gence of these trends demands better and more accurate data. To convince millions more Americans, primarily first-generation college students, to increase their investments in their own human capital and advise them on advantageous pathways into successful careers requires, in part, the availability of precise information on college costs and expected outcomes. Datasets with accurate labor market information that can be viewed by campus, degree, and major field will play an important role in helping millions more Americans understand their college choices and thereby make better education investment and consumption decisions.
Matthew Gianneschi
32

Policymakers
Policymakers have had access to generally incomplete informa-tion regarding public investment in colleges and universities and estimates of the “public returns” to degree. Each year gover-nors and legislatures throughout the nation are called upon to increase public investments in postsecondary education, decisions that require policymakers to estimate the extent to which the “utility” of spending on postsecondary education will meet or exceed that of other competing public priorities such as early childhood education, health care, transportation, public safety, and the like. Before analyses like College Measures were available, policymakers had to stitch together information on the utility of college investments based on general employment trends, broad estimates of wages in certain occupations, and analyses of inputs (e.g., state appropriations) at peer insti-tutions (usually provided by the institution requesting addi-tional revenues) or other states. “Outcomes” data, information regarding the effect of college, were generally unavailable. Data from College Measures increase policymakers’ understanding of the effect of college on initial wages and, accordingly, allow them to more accurately predict the effect on individuals of policy decisions to increase or decrease public expenditures on higher education.
Importantly, in recent years governors and state lawmakers have become increasingly concerned about the pace of increases in tuition and fees in higher education. They often cite their frustration with the seeming lack of transparency in higher education finance, particularly in pricing decisions. While the College Measures data set will not improve policymakers’ knowledge of finance decisions inside the academy, it will help enlighten their perspectives regarding individual and public returns to degree. This is powerful information for determining the greatest “bang for the public buck” and identifying strategic or targeted uses of limited taxpayer revenues.
Institutional Leaders
Though the missions of colleges and universities and the effects of advanced education extend well beyond initial wages, educators and college administrators would be mistaken to disregard the importance of labor market outcomes data to students and parents, public officials, and other stakeholders such as board members or donors. In survey after survey, public opinions regarding higher education consistently cite two prevailing perceptions. First, the public overwhelmingly
subscribes to the idea that postsecondary education is essential to personal success. So, the good news for education advocates is that the public is largely convinced that college is a neces-sary investment. Second, however, students and parents cite ever-increasing costs of tuition and fees and student loan debt among their greatest concerns.
In good faith, college administrators try to address these worries, but too often do so with incomplete or generic infor-mation. Data on initial wages by degree level, major, and institution can help students and parents place costs and debt into an accurate context and thus improve their deci-sion-making as well as help inform college administrators’ communications with their stakeholders. These data can also help institutional leaders better understand the market demand for graduates of their programs, information that can be used for improved student advising and career counseling as well as ongoing program development. Moreover, data on labor market outcomes provide critical feedback on academic programs—especially in ones that are technical or at the sub-baccalaureate level—that is indispensable for both practical and policy reasons.
On the practical side, labor market outcomes data can assist institutional leaders in determining which academic programs should be offered, enhanced, modified or discontinued. It allows institutional leaders to look beyond traditional “within program” quality measures and include market-based infor-mation concerning the demand for and initial outcomes expe-rienced by their graduates. If graduates aren’t being hired and the skills developed in a particular program aren’t desired by employers, campus administrators would be wise to pay attention to these discrepancies. Moreover, from a policy perspective, with accrediting agencies’ increased emphasis on student outcomes and federal officials’ interest in developing institutional performance indexes and measures of “gainful employment” or the incidence of student loan defaults, access to authentic labor market outcomes information regarding recent graduates may well prove increasingly valuable to admin-istrative and academic leaders working to keep their institutions in good standing with accreditors and the U.S. Department of Education.
Consensus on how to evaluate institutions may remain elusive for years to come, but it is a fact: Outcomes matter, and poli-cymakers, parents, government officials, and, most important, students are increasingly paying attention to the statistics.
33

Patrick Kelly
1. Briefly describe the data set(s) you are using to analyze the labor market returns of different higher education offerings.
In recent years, NCHEMS has worked on a variety of projects that link postsecondary unit record databases to state unem-ployment insurance (UI) unit record databases. In the summer and fall of 2012, NCHEMS worked with 20 postsecondary institutions and systems to link postsecondary education and UI data, in order to generate employment outcomes for their recent graduates (i.e., the percentage who were employed one and five years after college and their quarterly earnings). For the Gates Foundation funded project, institutions and systems volunteered to participate—testing the feasibility and utility of generating a variety of new metrics, in addition to employ-ment outcomes of college graduates. In the summer and fall of 2013, for a National Governors Association’s (NGA) initiative on efficiency and effectiveness metrics, NCHEMS collected nearly identical data on employment outcomes of college completers for state public systems of postsecondary education. Finally, from 2011 through 2014, NCHEMS collected similar employ-ment outcomes data for completers of the 10 finalist colleges for the Aspen Prize for Community College Excellence. With the exception of the Aspen Prize, which did not include field of study, the following data were collected and reported for these projects:
• Percentage of graduates employed one and five years after completion—by level of credential (undergraduate certificate, associate’s, bachelor’s, master’s, doctorate, and professional) and general field of study (education, business and communication, social and behavioral sciences, health, STEM, trades).
• The highest quarterly earnings one and five years after college completion—by level and field of study.
• Continued enrollment after completion—by level and field of study. The completers who continued to enroll were not reported in the percentage who were employed and the quarterly earnings because of the likelihood that they were not employed in an occupation related to their last field of study, but were pursuing additional credentials.
The data systems that were utilized in each of these projects are:
• State, system, and institution level student unit record systems. The variables typically used from these longitu-dinal databases include the completers’ social security numbers (SSNs), field of study, level of credential earned, and continued enrollment within the institution or state system.
• In some cases, the National Student Clearinghouse (NSC) data-base. This database was used to capture continued enrollment in other postsecondary institutions within and outside of the state. The NSC database includes approximately 95 percent of the postsecondary enrollment in the U.S.
• State UI databases. Variables used from these databases include SSN, employment, quarterly earnings, and (in some
cases) industry of employment. The SSN is the variable that links the student unit record, UI, and NSC databases.
• U.S. Census Bureau, American Community Survey (Public Use Microdata Samples). This database contains de-identi-fied person records of the respondents to the ACS. These data were not necessary for matching postsecondary and employment outcomes, but were used to determine whether the earnings of recent college graduates exceeded a certain threshold (e.g., above the state’s or region’s median earnings for a just a high school graduate, 150 or 200 percent of the poverty level, etc.). These data were used to provide evidence that completers from certain colleges and/or academic programs earn more or less than their counterparts who have either not completed college or are struggling to earn a living wage.
2. What specific questions does your analysis answer?
What is the capacity of states, systems, and institutions to do these types of matches?
Particularly for the Gates and NGA analyses, one of the driving questions was—given all of the recent development in state longitudinal data systems—how many institutions and systems can actually conduct the analyses needed to determine the employment outcomes of college graduates. In two of the three cases, it was much more difficult than one might imagine. Even with a fairly generous turn-around time (several months), less than half of the 20 volunteer postsecondary institutions and systems in the Gates initiative were able to conduct the anal-yses and report the data, and none of the private non-profit institutions in the consortium provided the data. For the NGA project, we only received employment outcomes data for 16 of the 50 state postsecondary systems. Because there was more at stake (recognition and prize money), all of the 10 finalist community colleges in the first two rounds of the Aspen Prize were able to report these data.
What percentages of graduates are employed one and five years after completion—by level of award and general field of study?
Not surprisingly, the percentages of students employed after completion vary dramatically across different types of creden-tials and programs of study.
What are the quarterly and annual earnings of graduates employed one and five years after completion—by level of award and general field of study?
As with the percentage employed upon completion, the wages vary tremendously across programs of study. NCHEMS also added some analyses to determine which levels and fields of study led to wages that were above or below those associated with workers that just have a high school diploma and a living wage.
What percentages of completers continue to enroll upon completion—in a different field of study or in a more advanced program in a related field of study?
34

Completers who continue their education are much more likely to not be employed in a field of study related to their previous creden-tial. But their continued pursuit is positive, and therefore, they should not be included in the employment outcomes calculations.
How can these types of analyses become more standardized, to facilitate comparison across institutions and systems?
There are many types of employment outcomes analyses done across institutions and state systems, with no standardization. Since the data are not reported to NCES or any other required reporting system, the types of analyses are very random and specifically targeted to policy questions within states.
3. What are the most important things this analysis reveals about labor market returns of different educational offer-ings (in light of your level of analysis)?
There is enormous variation in employment outcomes (both in percentage of completers employed and their earnings) for the same types of programs across states and regions within the state. For a recent article in Change Magazine, Christina Whitfield (from the Kentucky Community & Technical College System) and I discovered that the annual earnings of program completers for the very standardized program of Licensed Prac-tical Nursing (in terms of its delivery and content) across the 16 Kentucky community colleges ranged from $13,000 to $34,000. 27 And the percentage of completers for the program who were employed the following year (i.e., matched in the UI database) ranged from 50 percent to 77 percent across colleges. Finally, the earnings also varied dramatically from one year to the next for many of the colleges. From the work NCHEMS conducted for the Gates and NGA initiatives, there is just as much variability across states for graduates of the same types of programs.
A very important consideration when interpreting these data is the impact of local and state economies on employment outcomes. In fact, the jobs available and what employers pay for them are likely driving the outcomes as much (or more) than the institutional training. The example of the Kentucky Commu-nity & Technical Colleges and the state-to-state differences that resulted from the Gates and NGA projects (mentioned above) prove this case. While not perfect relationships, it certainly appears that in Kentucky the wages for LPN graduates depended a great deal on the demand for them (the percentage who were employed after completion) and the median wages in the local area. From the Gates and NGA projects, there was as much variation across institutions and states for the same types of graduates. In addition, a recent article in Inside Higher Ed listed 15 community colleges in the U.S. that are under scrutiny for high loan default rates.28 Nearly all (if not all of them) are located in areas with desperately poor economic conditions. Colleges should certainly play a role in fostering local economic develop-ment and offering programs that are in demand locally, but they have little control over what the employers will pay for these jobs. Therefore, accountability efforts directed at institutions (and in
some cases, programs within institutions) should be applied with many of these nuances taken into account.
There is a big misconception associated with the recent devel-opment of state longitudinal data systems (i.e., the ability of institutions and state systems to conduct these types of anal-yses). The variation in capacity across states and institutions to do them—despite the federal investment in state longitudinal data systems—continues to vary dramatically. Albeit voluntary, NCHEMS could not get any private non-profit institutions to participate in the Gates project, mainly because of their inability to work with their state labor agencies in a manner timely to the project. In many states, the same is still true for public institutions and systems, as evidenced in their lack of ability to provide data for the NGA project.
4. What are the limitations of your data/analysis?
For many institutions and state systems, there remains the inability to match employment records/outcomes across state lines. This is particularly problematic for institutions that are close to state borders, and even more so for those close to state borders in major metropolitan areas where there are a lot of cross-border commuting patterns. The U.S. Department of Labor has created a voluntary Wage Record Interchange System (WRIS 2) that provides the ability for states and institutions to match wage records from other participating states (currently 35 states). However, the process is reportedly still arduous, and the data provided back are at such a high level of aggregation that they are very difficult to use for anything but interpreting very general outcomes of college graduates.29 The only viable alternative is to generate data sharing/matching agreements with neighboring states. This requires a great deal of negotia-tion from state-to-state—both legally and in the specification of how the matches get done and what variables to include, and so forth. It is particularly prohibitive to states that have five, six, or seven states on their border.
In nearly all states, there is no access to the employment outcomes of federal employees. Not only is this an issue with states that have relatively large numbers of federal employees, but it is particularly problematic for colleges that are located near military bases or large federal labs. If a college is on the state’s border and close to a military base, it has two strikes against it regarding the measurement of employment outcomes.
Most matches for employment outcomes are done relatively soon after college credential completion (e.g., between 1 and 3 years out)—which makes sense for sub-baccalaureate tech-nical programs that are linked directly to jobs, but is a poor measurement for many other fields and levels of study. For many baccalaureate programs, completers don’t realize their earnings potential until they are in their mid-40s. These data (unfortunately) are not available for the U.S. at the sub-bacca-laureate level.
27 Kelly, P. & Whitfield, C. (2014). “Playing the Numbers: Employment Outcomes in the Two-Year Sector: The Witch Hunt for College Programs that Don’t Pay Off,” Change: The Magazine of Higher Learning, 46:3, 60-63.
28 Fain, P. (2014, July 30). “The Default Trap.” Inside Higher Ed. Retrieved from: https://www.insidehighered.com/news/2014/07/30/looming-default-rates-could-penalize-community-colleges-where-few-students-borrow.
29 For example, it is impossible to get program-level results for college completers without submitting records for one program at a time, because the program codes are not provided in the aggregate tables returned from WRIS 2.
35

The big exclusion in the UI database in nearly all states is the occupation code for which they are employed. It is impossible to determine whether recent completers are employed in an occupation that is related to their field of study. This is prob-lematic for state policy and institutional planning.
5. What are the implications of your analysis and conclu-sions—specifically as they relate to student success—that are important to convey to students, policymakers, and institutional leaders?
For the Gates and NGA projects, NCHEMS attempted to create a more standardized way of approaching these analyses, to determine the capacity of the postsecondary community to do them, and provide some comparisons across institutions and state systems. The target audience was the postsecondary policy community. For NGA, the analyses were targeted specif-ically to governors and other state policymakers.
The analyses generated for the Aspen Prize for Community College Excellence are targeted to postsecondary policymakers and community and technical college leaders to highlight the employment outcomes of some of the most high-achieving community and technical colleges in the country.
A few closing points for consideration when expanding these databases and the capacity to use them:
• Postsecondary policymakers and analysts need to build better capacity for these types of databases. Namely, they should include the occupational codes in order to deter-mine whether or not graduates are employed in the types of occupations for which they were trained (particularly in sub-baccalaureate and trade fields).
• The databases (and/or the ability to link them for research purposes) should be much more inclusive of private non- and for-profit institutions. Currently, it is very rare that these institutions are included in these types of analyses.
• Many states do not have the capacity to analyze the data effectively once the databases are in place. This became clear in many of the cross-state and institutional collections we have done for the projects mentioned above.
• The data are good enough for institutions to use them more effectively for students and parents. Because of local and regional differences in employment outcomes across programs of study, they should be better informed of types of programs that yield better outcomes, and know that if they major in certain fields, they may need to move out of the local area or region in order to experience substantial wage gains.
All said, these data are very important to the postsecondary community. Despite the warts mentioned above, they are all we have to gauge the employment and earnings of college graduates. They are good enough to give us a sense of which levels and fields of study yield positive outcomes for college graduates. They are here, and we should use them in the best ways we possibly can.
Patrick Kelly
36

Ben Miller
1. Briefly describe the data set(s) you are using to analyze the labor market returns of different higher education offerings.
Gainful employment data provide information on the mean or median earnings of graduates from more than 5,500 postsecondary programs across 2,100 institutions of higher education. As the table below shows, about three-quarters of these programs are offered at private for-profit institutions, with another 20 percent coming from public colleges.
Type of College # of Programs % of Programs # of Graduates % of GraduatesPublic 1,093 20% 63,853 8%Private Nonprofit 253 5% 30,491 4%Private For-Profit 4,193 76% 722,614 88%Total 5,539 816,958 The data set includes information on all types of undergraduate and graduate credentials, but as the table below shows, the vast majority of programs are either certificates or associate’s degrees.
# Programs % of Programs # Graduates % GraduatesCertificate 3,870 70% 507,169 62%Associate’s Degree 971 18% 130,317 16%Bachelor’s Degree 407 7% 90,996 11%Master’s Degree 171 3% 76,239 9%Other Graduate Credentials 120 2% 12,237 1%Total 5,539 816,958 Note: Income information represents the typical earnings of students who graduated three and four years previously and received federal student aid from the U.S. Department of Education. To be included, programs must have at least 30 graduates who received federal financial aid.
These data are produced by the U.S. Department of Education using earnings information from the Social Security Administration. They are the result of a regulatory process that attempts to increase the accountability around certain types of career training programs that are required under the Higher Education Act to show they are providing students with a program that prepares them for “gainful employment in a recognized occupation.” Because the Higher Education Act only applies that gainful employment phrase to certificate programs at public and private nonprofit colleges, the data do not include information on any associate’s, bachelor’s, master’s, or other degree programs at these types of institutions. The data do, however, include all programs at private for-profit colleges, because all of them are subject to the gainful employment requirement under federal law.30
In addition to earnings information, the data include the amount of student loan payments graduates must make every year. The data set also reports the percentage of all federal student loan borrowers—including those who graduated and those who did not—that defaulted on their debts within three years of beginning to repay their loans.31
2. What specific questions does your analysis answer?
The data are designed to answer questions about the returns of different postsecondary programs in the context of student debt borrowed to pay for that program. The Department of Education has indicated an interest in measuring, by program, the percentage of graduates’ typical income that is needed to cover annual payments on student loans. This is a different estimation of labor market return than many others in that it assesses programs based upon whether or not graduates are likely to struggle with their debt obligations instead of just the amount they earn.
The data have use beyond the specific accountability questions they are supposed to answer. Knowing actual earnings and debt information at the campus and program level can help students
choose a college and program based upon which one results in higher-earning graduates. For example, Carrington College and Kaplan College both offer dental assisting certificates in Sacra-mento. But graduates from Carrington College have typical earnings of over $17,500, while those from Kaplan make just $12,960. Armed with this information, prospective students could know to choose the lesser-known Carrington over the national Kaplan chain.
The data can also help students choose among programs that have similar graduate earnings but different levels of student debt to earn a credential. For example, graduates from the certificate program in airframe mechanics program at the Aviation Institute of Maintenance in Philadelphia typically earn $34,439. That’s nearly identical to the $34,428 earned by grad-uates in the same program at Teterboro School of Aeronautics
30 There are some slightly older liberal arts programs that are excluded.
31 The final gainful employment regulations published in October 2014 eliminated the use of the program-level student loan default rate as an accountability measure. For more, see: Fain, Paul. (2014, October 30). “Gainful Employment Arrives.” Inside Higher Ed. Retrieved from: https://www.insidehighered.com/news/2014/10/30/final-gainful-employment-rules-drop-loan-default-rate.
37

in Teterboro, NJ. But graduates from the Aviation Institute of Maintenance have average annual debt payments that are more than four times higher—$3,248 versus $746. So while the earnings are similar, the college in Teterboro, NJ offers a better average return on the debt investment.
Similarly, if a student has already selected a college, he can use these data to understand which programs within that institution might result in better earnings. For example, if a student is trying to choose among computer-related certificate programs at the Edison, NJ, branch of the Lincoln Technical Institute, he could see that graduates from the computer systems networking and telecommunications program earn nearly $27,000, while those from the information technology or computer and information sciences and support services make just $19,300 and $11,700, respectively.
3. What are the most important things this analysis reveals about labor market returns of different educational offer-ings (in light of your level of analysis)?
Program choice matters, even within the same field.
On a student basis, medical assisting and licensed vocational nursing are the first and third most common programs with earnings data. They are both linked to entry-level healthcare jobs that require no more than a one-year certificate. Despite seeming similar, the two program types have wildly different earnings. The typical graduate with a certificate in medical assisting earns about $15,309. By contrast, the typical grad-uate with a certificate in licensed vocational nursing makes $33,962—more than double the salary of medical assistants.
While there’s clearly a higher earnings premium for licensed vocational nursing over medical assisting, students who make choices based only on immediate expenses like time to comple-tion or student debt could end up making suboptimal decisions. For example, certificates for licensed vocational nursing take about one year to finish, while a medical assisting program may be a few months shorter. That longer time to finish likely trans-lates into greater levels of student debt. For example, annual debt payments for graduates of medical assisting programs at for-profit colleges are $1,027 versus $1,745 for licensed voca-tional nursing graduates at these same institutions. But if a student only focuses on these immediate costs, they may miss the bigger picture of likely higher return on investment based on stronger long-term earnings.
The most popular programs are linked to low-wage occupations.
One goal of postsecondary education is to help graduates improve their financial standing and get on a path toward the middle class. But one of the troubling findings in the data is that the most popular programs are frequently linked to very low-wage occupations. This includes some so low that graduates likely have little to no discretionary income and will struggle to manage any accompanying student loan debt.
The predominance of low-earnings programs is particularly apparent at the certificate level. Of the 15 certificate programs with the most graduates, 10 have typical earnings of $18,000
or less. This includes the two largest program types—medical assisting and cosmetology—which have typical earnings of $15,309 and $12,272, respectively. Apart from licensed voca-tional nursing, the other better-paying programs are preparing students for more hands-on technical jobs, such as automotive technician (typical earnings $23,603), electrician ($20,710), commercial vehicle operation ($24,672), or heating and air conditioning technician ($21,457). By contrast, the lower-earning programs are linked to entry-level medical positions for jobs like dental assistants, pharmacy technicians, or admin-istrative medical office assistants.
The data also show a difference in the number of certificates awarded in programs with lower graduate earnings based upon the type of institution. In particular, the most common types of certificates offered by public colleges produced higher typical earnings than the most popular certificate programs at private for-profit colleges. For example, licensed vocational nursing is far and away the most common type of certificate issued at public colleges, producing more graduates than the next 44 largest programs combined. By contrast, for-profit institutions had six graduates in medical assisting for every student who finished a licensed vocational program. And its two largest programs—medical assisting and cosmetology—have typical earnings not far removed from what someone making the minimum wage would earn in a year.
Earnings alone may not be a guarantor of quality.
The gainful employment data only include the post-completion earnings of graduates. This makes sense since graduates are the only individuals colleges can reasonably expect to receive the full economic payoff from their studies. But looking only at graduates’ earnings can also create a distorted impression of quality, where graduates appear to be doing well while large numbers of dropouts are not.
For example, the University of Phoenix’s associate’s degree in office management and supervision appears to be a good option for students based upon its graduate earnings of more than $38,500 and a moderate debt burden that’s less than 5 percent of annual income. But, of the over 27,500 individuals who borrowed loans to attend this program, more than 9,800 defaulted—a rate of almost 36 percent. What at first appeared to be a good choice suddenly looks more like a lottery ticket: Those who graduate do well, but more than one out of every three borrowers ends up in difficult financial circumstances. Such programs are not isolated examples in the data. In fact, of the 4,420 programs that have both earnings and default rate information, 538 (12 percent) have annual earnings greater than $25,000 but a default rate of over 15 percent.
4. What are the limitations of your data/analysis?
The data suffer from a few limitations. First, only certifi-cate programs have earnings information for public, private non-profit, and private for-profit institutions. For all other credentials, only earnings results at for-profit colleges are available. This means that it is not possible to compare the labor market outcomes of associate’s degrees at for-profit colleges with the same credential at community colleges.
Ben Miller
38

A second limitation is that the data only include earnings information for individuals who received federal student aid from the U.S. Department of Education. To the extent that students who can pay for college without assistance have greater incomes, this may bias the earnings information down-ward. In addition, the rate at which students rely on federal aid varies significantly based upon the type of institution they attend. As the chart below shows, just 38 percent of students in certificate programs at public colleges received federal aid versus 82 percent at private, for-profit institutions.
Third, the earnings data only include information on students who completed a program. This means that programs where a large percentage of students do not graduate may appear to have better earnings results than the typical student who actually attended the program. This limitation is somewhat miti-gated by the program student loan default rate, which includes students regardless of whether or not they graduated. The inclu-sion of dropouts in this measure matters because students who took out loans but did not finish are much more likely to default than those who graduated. A 2012 study by Education Sector found that nearly 17 percent of borrowers who started college in the 2003-04 academic year but did not finish defaulted on their loans versus 3.7 percent of those who graduated.32
Two final points: First, because gainful employment analyses are based on income reported to the federal government, actual earnings for occupations in which workers tend to underreport income may be misstated. This is most likely true for jobs in which substantial income is earned in tips, such as restaurant servers or hair stylists. Second, since the data are tied to a rule that is currently being legally challenged, their continued publication may depend upon future judicial rulings.
5. What are the implications of your analysis and conclu-sions—specifically as they relate to student success—that are important to convey to students, policymakers, and institutional leaders?
Students
College is an expensive investment, both in terms of dollars and time. This is particularly true for the older, working students that typically enroll in career-oriented programs. For these reasons, they are likely to put a premium on shorter options tailored to their schedules. But the large number of students enrolled in programs with low graduate wages suggests that students should focus more on workforce results, not just ease of completion. This means that colleges should be pushed to disclose actual earnings data of graduates, and students, guidance counselors, and others advising students should work to increase their understanding about valuable debt loads and outcomes.
Policymakers
America’s higher education system is intentionally decentral-ized, allowing institutions to start, grow, or close programs as they (and sometimes their public systems) choose. This flexi-bility enables colleges to nimbly respond to student and work-force demand. But unchecked it can encourage the creation of programs that are easier and cheaper to operate but tied to low-paying occupations.
Policymakers at each level can play a different role in raising the quality of available programs. At the state level, policymakers should revisit their licensing practices to ensure they aren’t encouraging the creation of potentially unnecessary programs or requiring more hours of instruction than the jobs require. And while state policymakers may not be able to exercise greater oversight of private colleges, they should at least work with their public institutions and local employers to ensure that programs are tailored to meet workforce demand at a price and length that is reasonable for students.
The federal government lacks the capacity to oversee and approve each and every program, but it can create broad policy incentives to shape institutional behavior and play an important role in transparency. In terms of oversight, this means paying greater attention to the amount of debt programs are asking students to take on, especially in the context of actual earnings, and attaching consequences and rewards based upon whether results are poor or excellent. The federal government should also leverage its existing database of information on federal student aid recipients to produce similar earnings data for graduates of all other institutions, ideally broken down at least by the type of degree earned, if not the program or major.
Institutional Leaders
Institutions (and their public systems) decide what to offer on their campuses. For them, these data represent previously unavailable information on actual labor market outcomes of their graduates. As such, these earnings data should become part of a feedback loop that informs pricing as well as the expansion, closure, or creation of programs. It should also serve as an improvement tool that prompts discussions with local employers about how to improve when earnings appear much lower than expected.
PERCENTAGE OF STUDENTS RECEIVING FEDERAL AID, 2011-12
Institution Type Program Level % Receiving Federal Aid
Public Undergraduate Certificate 38
Public Graduate Certificate 22
Private Nonprofit Undergraduate Certificate 73
Private Nonprofit Graduate Certificate 28
Private For-Profit Overall 80
Private For-Profit Undergraduate Certificate 82
Private For-Profit Associate’s Degree 83
Private For-Profit Bachelor’s Degree 78
Private For-Profit Graduate Credentials 60
Source: Author calculations from the 2011-12 National Postsecondary Student Aid Study administered by the Institute of Education Sciences.
32 Nguyen, M. (2012, February). “Degreeless in Debt: What Happens to Borrowers Who Drop Out.” Washington, DC: Education Sector. Retrieved from: http://www.educationsector.org/sites/default/files/publications/DegreelessDebt_CYCT_RELEASE.pdf, page 4.
39

Mark Schneider
1. Briefly describe the data set(s) you are using to analyze the labor market returns of different higher education offerings.
College Measures helps states link student level data (“student unit records”) and unemployment insurance (UI) wage data. Student-level data are collected at the institutional program level (usually the six-digit CIP code) for all students who attend a public two- or four-year institution.33 While these detailed data are available on the College Measures website, published reports only present findings at the two- or four-digit CIP code level.34 Data are also “rolled up” to both the institution level (to compare wages of graduates across multiple universities) and the field-of-study level (for instance, how do psychology graduates’ earnings compare to business graduates’ earnings from the same school). Every analysis, no matter the level of aggregation, is based on the fundamental building block of College Measures work: program level data.
2. What specific questions does your analysis answer?
The reported information varies based on the state data system and any legislative mandates. The most significant difference is the timeframe that the dataset includes. At the core are wage data: How much do graduates of different programs earn at various points after graduation? At the outset, we presented an 18-month snapshot. Now, we are reporting data from graduates from up to 10 years earlier. College Measures has reported these longer-term wage outcomes in Tennessee, Texas, and Florida, with other states to follow. In addition to wage data, we report some or all of the following program-level data: time to degree, graduation rate, percent continuing in higher education, percent on public assistance, and wages.
Our analysis shows far greater variance across programs within a college/university than there is across institutions. To put it differently: What a student studies is usually more important than where the student studies.
While our work concentrates on delivering wage outcomes data in summary form, we have built a cost calculator for the Texas website so that interested students can assess costs and likely wages associated with different college and program options.35 The default calculation of costs is based on IPEDS data (using institutional net price), but we also allow students to enter individualized information about expected costs (this can be gleaned from their financial aid offer). We then calculate a time to degree based on 4-, 5-, and 6-year graduation rates and an estimated cost of degree that uses net price and average time to completion. Alternatively, students can enter their own esti-mate of time to degree rather than the average estimated from IPEDS. This gives students a more personalized estimate of their own total cost.
3. What are the most important things this analysis reveals about labor market returns of different educational offer-ings (in light of your level of analysis)?
Non-technical two-year degrees don’t pay well.
Completers with non-technical two-year degrees who are in the labor market do not experience high rates of return (and may even experience negative ones). For instance, two-year (or less) credentials in liberal arts have very little market value. Of course many students earning these credentials intend to go on to earn a four-year degree, but the reality is that, according to the most recent federal Postsecondary Student Survey, only about 4 percent of students who entered two-year schools in the 2003-04 academic year had earned a bachelor’s degree 6 years later. For most students, their two-year degree is the “terminal” degree and has limited market value.
These lower rates of return persist over time.
The maxim seems to be “start low, end low.” That is, a philos-ophy major is likely to be fairly low down in the wage distribution one year, five years, and even 10 years after completion. The single most notable exception is biology bachelor’s degree grad-uates, who on average start low but 10 years out are among the highest paid graduates. This is no doubt driven by the number of graduates who enter medicine.
Technical two-year degrees do pay.
For example, in Texas, a year after graduation, students with two-year technical degrees average first-year median earnings of more than $50,000, just over $11,000 more than graduates of bachelor’s degree programs across the state. These earnings are about $30,000 more than average earnings for students who completed academically-oriented two-year degrees and are now in the labor market.
The skills you acquire and your terminal degree matter.
There are some selection effects here. Students who start in a community college, transfer to a four-year college, and fail to graduate may have different skill levels than students who earn the bachelor’s degree—and those differences may drive labor market outcomes (consider the example of the biology graduate above). Likewise, we suspect that some of the high pay associated with technical certificates may in fact be associated with degree holders returning to college, especially community colleges, to acquire or improve marketable skills.
4. What are the limitations of your data/analysis?
Time horizon
The first round of College Measures’ work was focused on data collected 18 months after graduation—and we were criticized for this short time horizon. We were told repeatedly that a liberal arts graduate working as a barista in a coffee shop today would be a high-paid barrister 10 years from now, while the high-paid person with a two-year technical degree working in the Texas oil patch would be replaced by a robot. Turns out that, as noted above, there is a fair amount of stability over time
33 Virginia requires any not-for-profit campus that takes state student scholarship money to report their SUR data for matching. Arkansas had many not-for-profits in its data set. Colorado had three campuses that voluntary worked with the state to get the matched labor market data.
34 For more information, visit www.collegemeasures.org/esm
35 For more information, visit www.MyFutureTx.com.
40

in earnings by program. It is true that over time, on average, bachelor’s degree graduates have a steeper positive earnings curve than graduates with two-year degrees, but in many cases, depending on the field, the initial gap in favor of two-year technical degrees persists for years. And even if in the long run bachelor’s graduates’ earnings may outpace on average the wages of associate’s degree holders, the bachelor’s degree is not an option for many students. For those students, a two-year technical degree may be the right ticket into a well-paying job.
State boundaries
A second problem is that the UI data we use covers only in-state workers. Many graduates—depending on the state, the school, and the major—may not stay in the state where they attended college. Therefore, even if, on average nationwide, around 90 percent of a state’s civilian workforce is covered by the UI system, the full benefits of many college programs may not be adequately measured. The ban on a federal student unit record system made impossible the best way of dealing with the issue (that is, using Social Security Administration data linked to student-level data). That being the case, the linked UI/student unit data may be the best we can do.
For state officials, knowing how different schools and programs contribute to the state’s human capital is important informa-tion—even if the data do not reflect the full benefit of any given program because of inter-state migration. We are exploring how WRIS 2 (the Wage Record Interchange System) might help account for some portion of graduates that move out of state, and whether WRIS 2 data show any systematic biases in UI data compared to wages paid to out of state workers. But the few states that have tried to tap into WRIS 2 data have found very low match rates—in Minnesota, for example, the match rate was around 5 percent—and the entire WRIS 2 system is cumbersome to use.
5. What are the implications of your analysis and conclu-sions—specifically as they relate to student success—that are important to convey to students, policymakers, and institutional leaders?
Students
• Know before you owe. Don’t borrow excessively, where “excessive” depends on the wages you are likely to command given your program of study.
• Love what you study, but always master a set of skills that can help you in the job market. The skills currently associ-ated with some programs of study do not seem to command success in the labor market.
• What you study is often more important than where you study. This requires that you consider what you expect to earn after completion, how much the degree will cost you, and the likelihood of future earnings increases. Based on these considerations, two-year technical degrees appear particularly remunerative.
• There are many regional campuses where graduates earn as much if not more than graduates from the flagships. This
is a message of hope—if you are unable to attend a flagship university, there are alternatives that can lead to success in the labor market.
• Consider your long-term educational goals when you first enroll. If you are enrolled in a two-year program with lower earnings post-completion, consider whether you are prepared to continue your studies at a four-year institution. If you decide that you would like to transfer to a four-year school, put in the work to follow through. The consequences of not doing so are steep—in terms of costs and future earn-ings potential—for many non-technical programs.
Policymakers
• There is large variation in the rate of return across majors and across institutions. Some of this variation is attributable to local labor market conditions and some attributable to differences in the characteristics of the students that schools service. Setting peer groups for comparison or tracking how program graduates perform over time can be used to create benchmarks against which individual programs or institutions can be compared. Florida uses the labor market success of its graduates as part of its perfor-mance budgeting system and other states are considering this option as well.
• Encourage people to think about upgrading their technical skill set—this can be done through credentials with high market value. A full four- or even two-year degree program may not always be necessary.
• Help students understand the consequences of their choices. This includes publicizing the wage data that many states have already collected but failed to provide to users in an accessible format.
Institutional Leaders
• Monitor the ROI for various programs offered. Many insti-tutions of higher education see this kind of question as anathema to their view of creating an informed citizenry and imparting “deep thinking” and “critical analytic skills” to their students. But students want careers and high earnings at the end of their college careers. And state policymakers have the right to know what happens to the billions of dollars they invest in postsecondary education. How do we balance these expectations? How do we make sure that completers are gainfully employed without turning every college into a technical training school?
• Incorporate ROI information into the institutional deci-sion-making process about which programs to open or close, expand or contract. This information can help insti-tutional leaders understand how best to improve existing programs to ensure that students graduate with the skills and knowledge that they need to succeed in the labor market.
• Incorporate ROI findings into students’ academic advising process so that they can make more informed decisions about their program selection and course enrollment.
41

Christina Whitfield
1. Briefly describe the data set(s) you are using to analyze the labor market returns of different higher education offerings.
The Kentucky Community and Technical College System (KCTCS) is comprised of Kentucky’s sixteen public two-year institutions. Many administrative and research functions, including an enterprise-wide student unit record system, are housed at the KCTCS system office. Since 2004, KCTCS has regularly matched its student unit record files with Unemployment Insurance (UI) files housed at the Kentucky Office of Employment and Training. KCTCS has information on pre-enrollment employment status, enrollment of employed students, and employment outcomes for leavers and graduates for up to five years. These matches include all students enrolled for academic credit. Subject to suppression rules, these results are available at the system, college, and program level.36 In addition to UI matches, KCTCS utilizes traditional labor market information resources (i.e., Bureau of Labor Statistics projections) and real-time labor market information tools (Burning Glass, EMSI).
2. What specific questions does your analysis answer?
What are the expected labor market outcomes of KCTCS academic programs?
KCTCS uses BLS projections to categorize occupations and academic programs (at the system level) in wage and demand quadrants. Occupations that pay at or above the 75th percentile for the state are considered “high wage,” and those growing at a rate equal to or greater than the state average or with at least 100 annual job openings are considered “high demand.” Occupations associated with programs beyond the scope of the KCTCS mission (typically requiring a baccalaureate or higher) are excluded. Using this schema, registered nursing is a “high wage, high demand” occupation, while child care work is a “low wage, high demand” occupation. Academic programs are associated with these occu-pational categories using a customized CIP/SOC conversion table. The categorizations are adjusted biannually as BLS projections are updated, and used to inform a number of KCTCS accountability and planning efforts. The chart below demonstrates the wage/demand categorization for health occupations.
FIGURE 2: HEALTHCARE SECTOR IN KENTUCKY (STATEWIDE)
Source: Kentucky Community & Technical College System, Office of Research and Policy Analysis.
Note: The size of the circles represents the number of annual job openings. Blue circles indicate programs offered by KCTCS, purple circles indicate occupations for which KCTCS does not provide training.
42
Is KCTCS making progress toward its strategic plan goals?
One of five goals associated with KCTCS’s 2010-16 Strategic Plan is to “enhance the economic and workforce development of the Commonwealth.” Metrics developed to monitor progress toward this goal include:
• “High Wage/High Demand Completions.” This measure builds on the wage/demand quadrant categorization process described above. Annual performance targets are established at the system and college levels to increase production of graduates in high wage/high demand fields. The list of programs that meet these criteria are dominated by nursing and allied health programs. Registered nursing, occupational and physical therapy assistants, and dental hygiene are among the most lucrative and highly demanded fields for which training is available at KCTCS.
• “Wage Index.” This measure uses UI records to determine the median income of KCTCS graduates six months after leaving the system. This median wage is indexed to the state median wage (a score of 100 would indicate that the median wage of recent graduates is equal to the state median). College- and system-level performance targets aim to achieve an index score of 100.
These metrics are interrelated. To the extent that colleges succeed in shifting program offerings away from low-wage/low-demand occupations and increasing offerings in more lucrative fields, they increase the likelihood that their gradu-ates’ median wages will exceed the state median. The intent of both metrics is to encourage colleges to be flexible in their program offerings and responsive to changing workforce needs.
The system has made progress on the first of these performance metrics; the number of high wage/high demand credentials awarded increased nearly 19 percent between 2009-10 and 2011-12. These credentials still account for a small proportion of the total credentials awarded by KCTCS, however, and the system has experienced annual declines in the “wage index” measure since the beginning of the strategic plan (see below for a discus-sion of the broader economic factors influencing this measure).
What new programs should KCTCS offer?
All new college programs must be approved by KCTCS. Wage and demand categorizes are used in the system’s program approval process. A college seeking permission to open a new academic program must consider the anticipated wage and demand quadrants for associated occupations, and colleges are strongly encouraged to open only high wage/high demand programs. A college seeking to open a program that lies in another quadrant must provide justification regarding local economic conditions or community needs not discernible in labor market projections.
How well are KCTCS programs aligned with evolving work-force needs?
Many forms of labor market information are incorporated in the Dynamic Skills Audit (DSA)—a curriculum review process
piloted by KCTCS. The DSA provides a process and template for colleges to consider employer demand (using both traditional and real-time labor market information), supply (graduates of related programs from the local college and other Kentucky postsecondary institutions), and the employment rate of recent graduates. The template calculates ratios that estimate the number of experienced workers available to compete for job openings, and the gap between supply and demand. The DSA process includes building a skills matrix, which allows institu-tions to compare their curricula with the skills and industry certifications most frequently listed in real-time job postings, and includes a fit/gap analysis. Colleges use the DSA process to inform conversations with industry advisory groups, and to make recommendations for curricular changes. For example, increasing numbers of job postings in Kentucky list a prefer-ence for Spanish speakers; nursing program requirements do not include foreign language instruction. Statewide curriculum committees will soon consider adding this requirement.
3. What are the most important things this analysis reveals about labor market returns of different educational offer-ings (in light of your level of analysis)?
Field and level of study are crucial in determining labor market outcomes.
Aggregated at the system level and by general occupational fields, all KCTCS programs have labor market value—graduates’ incomes are higher than the median income for Kentuckians whose educational attainment is high school or below—but these results vary widely by field and level of program. Associ-ate’s degree graduates in health fields earn, on average, more than twice what their counterparts in social and behavioral sciences make. Less intuitively, certificate programs in STEM disciplines achieve almost the same median income as STEM associate’s degree graduates (for example, engineering tech-nology certificates are more lucrative than computer science associate’s degrees).
Economic conditions and regional variation are also significant.
When KCTCS established its “Wage Index” metric, baseline figures exceeded a score of 90 (the median wage for KCTCS graduates was more than 90 percent of the median wage for all workers in the state), and were approaching the state median wage ($30,309 in 2009-10). Soon after the establishment of the plan, the Great Recession sparked a steady decline in index scores (dropping from 97.9 percent in 2006-07 to 83.3 percent in 2011-12). Rising unemployment exerted downward pressure on two-year college graduates’ wages, as displaced workers with more experience and higher-level credentials competed with recent graduates for entry-level positions, a factor that was not anticipated when the strategic plan was developed. Regional variation among graduates of a single academic program may be even greater than variation across disciplines. Analyzed at the college level, graduates of the KCTCS LPN program with the highest median wage after graduation make
36 See page 44 of this report for a complete explanation of the suppression rules.
37 For more information on this analysis, see: Kelly, P. & Whitfield, C. (2014). “Playing the Numbers: Employment Outcomes in the Two-Year Sector: The Witch Hunt for College Programs that Don’t Pay Off,” Change: The Magazine of Higher Learning, 46:3, 60-63.
43
almost three times the median wage of graduates of the college with the lowest median wage.37 Labor market outcomes are strongly related to local economic conditions, but the relation-ship is multi-dimensional. Graduates of KCTCS LPN programs in urban areas (with higher incomes than rural areas of the state) have relatively low median wages, presumably due to a larger supply of qualified workers. While systems and colleges have an important role to play in economic development, factors influencing labor market outcomes—large-scale economic trends and regional economic differences—may be beyond the scope of institutional influence.
Develop a nuanced perspective on “negative” employment outcomes.
The programs with consistently low employment outcomes at KCTCS cluster in two groups. The first group includes occupa-tions associated with skilled trades and predominantly male employment (masonry, carpentry, automotive repair). Our theory about these generally well-regarded occupations is that the median wages and match rates available through UI information is suppressed by the relatively high proportion of graduates in these fields who are wholly or partially self-em-ployed. The second group includes programs in “caring” occu-pations and predominantly female employment (early childcare instructors, social workers, cosmetologists). When considering the employment outcomes of some graduates, median wage may be an incomplete gauge. Early childhood workers provide the easiest example—these jobs pay very low wages, but are consistently considered “high demand,” and provide an important community service.
Graduates of traditional associate’s of arts or associate’s of sciences programs have limited employment value compared to many other two-year degrees.
These programs are not designed to lead to immediate employ-ment, but to prepare students to transfer to a four-year institu-tion. KCTCS’s next labor market research priority is to combine information about transfer students from the National Student Clearinghouse with labor market outcomes to determine what AA/AS graduates’ earning potential is after alumni complete a baccalaureate degree.
4. What are the limitations of your data/analysis?
Suppression Rules
To protect student privacy, and to adhere to its agreement with the Kentucky Office of Employment and Training, KCTCS established rigorous suppression rules. In analyses of annual employment outcomes at the program and college level, cell sizes are often too small to report without compromising student privacy. Analysts must decide which is preferable: Roll up multiple years of data, thereby allowing reporting on a wider range of programs (but sacrificing timeliness), or adhere to annual figures for a more limited group of programs?
Coverage
Though sometimes couched as an “employment rate,” the UI match rate is not a true employment rate, and should be interpreted in the appropriate context. UI databases are state-specific; graduates who cross state boundaries to find employment are not reflected in match rates. Graduates who are self-employed or who work for the federal government or the military are also excluded. These limitations are nearly universal, but their effect on college-level match rates is signif-icant. Within KCTCS, the two colleges with the highest and lowest match rates are in the same region of the state and offer a similar program mix. The large discrepancy is explained not by program quality, but by the location of the college with the low match rate—adjacent to the state border and a large military base. There are efforts underway that have the potential to alleviate these concerns. The Wage Record Interchange System 2 (WRIS2) and the Federal Employment Data Exchange System (FEDES) offer the possibility of aggregated cross-state and federal employment matches. States have also begun to form themselves into groups to enable cross-border analysis of labor markets, most notably the four-state data exchange piloted by the Western Interstate Cooperative for Higher Education. To date, researchers’ access to these databases is very limited.
Data Elements
The data elements included in UI matches limit the extent of the analyses that can be performed. UI matches typically include quarterly earnings, employment status, and an industry code. UI records do not include hours worked, without which it not possible to determine if an individual is a highly-paid part-time worker or a poorly-paid full-time worker. UI records do not include occupation, severely limiting the ability to determine if a graduate is employed “in field.” In some cases, industry can be used as a proxy for occupation. Using the industry code, KCTCS analysis shows a decisive shift in the employment patterns of its nursing students. Prior to entering KCTCS, their employment is concentrated in retail and service industries. After graduation, a large majority work in hospitals and other medical facilities. Conversely, no such pattern exists for business graduates, who are widely disbursed across industries before and after their business training.
Lack of Direct Matches
A similar issue exists in the more traditional labor market infor-mation used for supply and demand analyses. Shorter-term and more technical academic programs (i.e., a certificate program in welding) are more likely to match directly with an occupation in the BLS projections. More general credentials (associate’s of arts) do not match directly with any occupation, rather, indi-rectly with many. This lack of one-to-one matches for programs at the associate’s degree level and above explains in part why four-year institutions have been slower to undertake this work than two-year institutions.
Christina Whitfield
44

5. What are the implications of your analysis and conclu-sions—specifically as they relate to student success—that are important to convey to students, policymakers, and institutional leaders?
Students
Program choice matters! Postsecondary education continues to “pay” at all levels, but program choice has important impli-cations for employment success after graduation. Students who decide—for reasons of preference, preparation, or social utility—to enroll in programs with less positive labor market outcomes should carefully consider the cost of the program and their willingness to accumulate debt for returns that are lower than those offered by other programs.
Policymakers
Encourage the use of labor market outcomes as consumer information, and develop accountability systems with care. Many state systems (the California Community Colleges System and the State Council of Higher Education for Virginia notable among them) have made detailed college- and program-level employment outcomes information available to the public. Policymakers elsewhere should facilitate the data exchanges that make these matches possible and encourage wider access
to consumer information for parents and students. Via the White House College Scorecard, the proposed Postsecondary Institution Ranking System, and gainful employment regula-tions, federal policymakers are promoting the use of employ-ment outcomes as accountability measures. Several states have included labor market outcomes in performance funding models, and many others are discussing the possibility. When designing these systems, policymakers should acknowledge that many factors related to employment outcomes—most notably the health of the labor market into which students graduate—are outside of institutional control and should be taken into account in funding allocations.
Institutional Leaders
Use limited institutional resources wisely. In an era of constrained fiscal resources for postsecondary institutions, institutional leaders must make difficult decisions about closing, expanding, and opening academic programs. This will mean shifting institutional resources from programs with poor labor market returns or high cost to those with more positive outcomes. Institutional leaders will need to think and act creatively to overcome the challenges associated with these transitions (tenure systems, the need to retrain faculty, and the slow pace of academic change).
45


One Dupont Circle, NW, Suite 700Washington, DC 20036
© 2015 by The Aspen Institute, College Excellence Program | Published in the United States of America in 2015 by The Aspen Institute | All rights reserved. Printed in the United States of America | 15/07