return to , . qot/rsc
TRANSCRIPT

... TA 710 .E93 1984 c.2 " J'
'SSOURI COOPERATIVE HIGHWAY RESEARCH PROGR'AM FINAL REPORt
, .
RETURN TO , . QOT/rsc ' ~ ..
{ECHNICAL tNfORMAnOO CENTDt ... I
EVALUATION OF THE EFFECTIVENESS " ' "
OF VARIOUS VEGETATIVE COVERS IN CONTROLLING SLOPE DISTRESS , _~ v '
"
. -
, .

. " f IV • c. '1':' 1- 10"", c.. .L.
1~2Z6~O 7
EVALUATION OF THE EFFECTIVENESS OF VARIOUS VEGETA~IVE COVERS IN CONTROLLING SLOPE DISTRESS
STUDY NO. 81-1
Prepared By
MISSOURI HIGHWAY AND TRANSPORTATION DEPARTMENT
Division of Materials and Research
Final Report
October 1984
in cooperation with
U. S. DEPARTMENT OF TRANSPORTATION
Federal Highway Administration
The opinions, findings, and conclusions expressed in this publication are not necessarily those of the Federal Highway Administration.

ABSTRACT
Distressed highway slopes and randomly chosen, nondistressed slopes were selected throughout Missouri and
surveyed to determine type and density of vegetation, soil
properties, slope geometry and orientation and types of any
distress. Several sites were instrumented and depths of
freezing monitored as were seasonal moisture variations.
The study confirmed some expected relationships between
slope performance and slope geometry, soil properties and
vegetation type and density. Although limited data
suggested some positive influence by vines, brush and trees,
no significant differences could be confirmed among other
vegetation types in controlling the occurrence of slides
and sloughs.

Introduction
Conclusion
Implementation
Scope
Slope Survey
TABLE OF CONTENTS
Frost Depth Penetration
Soil Moisture Contents
Page
1
2
4
5
6
20
39

LIST OF FIGURES
Figure Page
I. Example of a Completed Field Slope Survey Form 7
2. Soil Regions of Missouri 9
3. Location of Freeze-Tube Installations 20
4. Frost Penetration Diagram for Sites 1,2,4,5 & 7 25
5. Frost Penetration Diagram for Sites 3,6, & 8 25
6. Frost Penetration Diagram for Site 9 26
7. Frost Penetration Diagram for Site 10 26
8. Frost Penetration Diagram for Site 11 27
9. Frost Penetration Diagram for Sites 12,14,16 & 17 27
10. Frost Penetration Diagram for Sites 13,15,19 & 20 28
II. Frost Penetration Diagram for Sites 18 & 21 28
12. Frost Penetration Diagram for Site 22 29
13. Frost Penetration Diagram for Sites 23,24,25 & 28 29
14. Frost Penetration Diagram for Sites 26 & 27 30
15. Frost Penetration Diagram for Sites 29,30 & 31 30
16. Frost Penetration Diagram for Sites 32 & 33 31
17. Frost Penetration Diagram for Sites 34,35,41 & 42 31
18. Frost Penetration Diagram for Sites 36,37 & 38 32
19. Frost Penetration Diagram for Sites 39,40 & 43 32
20. Frost Penetration Diagram for Sites 44,46,47 & 48 33
21. Frost Penetration Diagram for Site 45 33
22. Frost Penetration Diagram for Sites 49 & 51 34
23. Frost Penetration Diagram for Sites 50,52 & 53 34
24. Frost Penetration Diagram for Site 54 35

LIST OF FIGURES (Continued)
Figure Page
25. Frost Penetration Diagram for Site 55 35
26. Frost Penetration Diagram for Site 56 36
27. Frost Penetration Diagram for Site 59 36
28. Frost Penetration Diagram for Sites 57 & 58 37
29. Frost Penetration Diagram for Site 60 37

LIST OF TABLES
Table
1. Distribution of Surveyed Slopes and Types of Distress by Soil Region
2. ASTM Soil Classification of Surveyed Slopes
3.
4.
5.
6.
7.
Slope Performance and Plasticity Index (PI)
Slope Performance and Degree of Slope
Slope Performance and Slope Height
Slope Performance and Slope Orientation
Performance of Cuts Versus Fills
Page
10
11
12
13
14
14
15
8. Slope Performance and Vegetation Type 16
9. Slope Performance Vs. Vegetation Types Occupying 50% or More of Slope Area 16
10. Vegetation Types on Sliding and Sloughing Slopes by Soil Region 18
11. Vegetation Types on Eroded Slopes by Soil Region 19
12. Freeze Tube Installations 21
13. Average Depths of Frost Penetration in Inches for Principal Vegetation Types by Slope Exposure Direction 22
14. Average Frost Penetration Depth Under Various Vegetative Covers 24
15. Soil Moisture Content (Wnl By Depth Increment and Slope Exposure Averaged for All Sites 39
16. Average Soil Moisture Content 40

INTRODUCTION
The Missouri Highway and Transportation Department has
established criteria for cut and fill slope design based on
the geologic origin and ASTM classification of the soils
involved. Highway slopes built to these criteria have a
low incidence of the sloughs and slides which continue to
be experienced on many miles of highway slopes which were
constructed steeper than would be permitted by present
design criteria.
It has been observed that many, if not most, slope failures
are initially quite shallow. It is believed that many such shallow failures involve softening of the slope surface as
a consequence of swell, a loss of cohesion from desiccation
cracking and the introduction of seepage stresses by rain-
fall filling the cracks. A recent research project l established
that development of ice lenses was responsible for some
failures of near vertical slopes in loess. This phenomenon
has also been suspected in failures of flatter slopes in
other soils.
Some observers have suggested that some ground covers are
more effective than others in controlling such shallow slope
failures. It is postulated that a dense vegetative mat may
tend to insulate the slopes from extreme moisture and
temperature changes and that the roots may reinforce the zone
subject to damage by desiccation cracking and freeze-thaw
cycles.
This study was established in an attempt to determine
if some commonly used types of vegetation have been more
effective than others in controlling shallow sloughs and
slides and, where possible, to determine the comparative
degree of soil moisture change and depth of frost penetration
as a function of type of vegetation cover. A secondary
objective was to determine if certain forms of vegetation
have been more effective than others in controlling erosion.
1

CONCLUSIONS
1. No conclusive evidence was found of significant
variation in the incidence of slides and sloughs which could
be attributed to the presence of any of the cornmon legumes,
grasses or weeds found in the slope survey. However, the
limited data available for a subgroup which included all
vines, brush and trees tended to confirm a positive
influence in controlling slides and sloughs.
2. The relative density of vegetation was found to be
related to the occurrence of all forms of distress, i.e.,
the less dense the cover of whatever kind, the greater the
likelihood of slides, sloughs and erosional problems.
3. As expected, it was found that the legumes, excepting
crownvetch, were associated with a higher frequency of
erosional problems than were the grasses.
4. Of those types of vegetation on instrumented slopes,
only creeping juniper was associated with a significantly
greater freezing depth which is believed due to the drying
effect from continued moisture demand during the winter.
Sericea lespedeza was found associated with the least depth of
freezing within similar climatic and soil conditions and with
the highest measured soil moisture contents, perhaps due to
low moisture demand except during the summer growing season.
Due to the limited number of test sites with Sericea, additional
study would be required to confirm the latter observations.
5. A number of relationships were confirmed with
respect to slope performance and soil properties and slope
geometry. Among these are the following.
(1) High-plasticity clay soils, CH by ASTM classifi
cation, were disproportionally associated with higher
frequencies of all forms of distress, including
erosion. Also highly erosive were the gravelly and
sandy clays and all of the non-plastic soils. Least
erosive were low-plasticity clay soils, CL by ASTM
classification.
2

(2) The incidence of all forms of distress
increased with increasing plasticity as well
as with increasing slope height.
(3) Slope performance is influenced by the
direction the slopes face. North and east
facing slopes were found most prone to slides
and sloughs while west and south facing slopes
were found most erosion prone. North facing
slopes were consistently wettest.
(4) Cut slopes were found to be more erosion
prone than fills.
(5) Slope performance is related to soil regions.
The northern glacial regions were found to be the
most prone to slides while the southwestern prairie,
west Ozark border and Ozark regions were most prone
to erosional problems.
3

IMPLEMENTATION
This report will be disseminated throughout the Depart
ment for informational purposes. However, this study did
not result in findings of such significance as to justify
recommendations for changes in present practices.
4

SCOPE
A survey of distressed and failing roadway slopes was
conducted throughout the State of Missouri o The Missouri
Highway and Transportation Department's ten districts were
requested to list at least twenty specific locations where
slope maintenance problems were prevalent. Distress forms
were categorized as slides, sloughing, or severe erosion.
Both fill and cut slopes were surveyed but failures involv
ing foundation soils under fills were excluded. These areas
were then surveyed for types of vegetation cover, vegetation
density, soil types, slope geometry and any other factors
possibly related to the observed distress. Soil samples
were secured for indices and classification tests. To
establish a base for comparison, slopes having no distress
were randomly selected and similarly surveyed. A few
comparative sites were monitored for seasonal soil moisture
changes through continued routine sampling. Using frost
tubes at these sites, comparative depths of frost penetra
tion were also determined under various types of vegetation.
The derived data was evaluated to attempt to determine
if certain types of vegetation are more effective than others
in controlling shallow slope failures and erosion.
5

SLOPE SURVEY
A survey of distressed slopes and of randomly chosen,
nondistressed slopes was conducted during 1981 and 1982,
mainly during the summers. In all, 280 distressed slopes and 191 randomly chosen slopes were surveyed.
Conventions of the Survey
Distressed slope locations were chosen by each of the
Department's 10 districts which were requested to list at
least 20 specific locations where slope maintenance problems were prevalent. No criteria was established for the
districts in compiling the submitted lists except that
foundation failures were to be excluded.
Failure or distress forms were categorized as slides,
sloughs and erosional problems. Sloughs are considered to
be shallow failures principally involving the sod or root zone and, in no case exceeding 3 feet in depth. Obviously
sloughs may be precursors of slides and differ from slides
only in degree.
The randomly chosen, non-distressed slopes were all
selected by the principal researcher. While no attempt was
made to select slopes by vegetation or soil type, for
example, selection criteria did include requirements that
slopes must be at least 10 feet in height, must include
both cuts and fills (except in the southeast lowlands where
only fills meet the first requirement) and must be essentially
divided between east-west and north-south oriented roads. Ultimately some additional slopes were added to more nearly
equalize the number of slopes surveyed in each of seven soil
regions.
The survey included photographs, sketches, soil sampling
and completion of a detailed check list which included the
major vegetation types, vegetation density, soil types,
degree of slope, height, orientation, and, where appropriate,
the degree and forms of distress or failure. Testing was
6
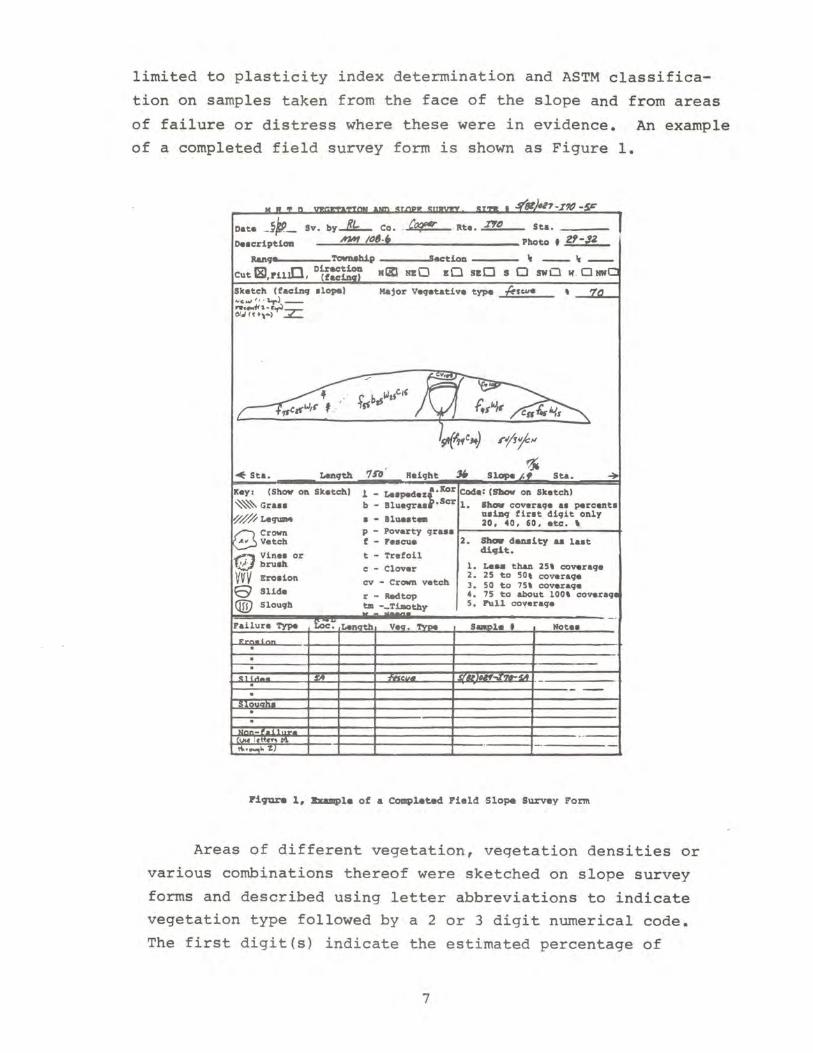
limited to plasticity index determination and ASTM classifica
tion on samples taken from the face of the slope and from areas
of failure or distress where these were in evidence. An example
of a completed field survey form is shown as Figure 1.
Date_~p_ av. by"'&- Co • . C'!'f"" ate. 1YD Sta. ___ _
D .. cdptLoa #1M /D'.+ Photo • 2'-/Z
1Wl9' TowuhJ.p hctioD ----
Cut l8J,rUlD, D~:~~~ "aD nO EO SED s Sketch (faciDq .1opel "'ctJ' · ·~) __ re_i<t •• .fl 01,/( .. ,4) .:z:
~ Sta. LanCJth
Kay. (Sh_ OIl Sketchl
~Gra ..
~#La~ Crown
~Vetch
~ Vine. or tV bruah
WY Broaion e Slid.
® SlouCJh
Failure Type
'.n fi",,, .... ,,-z
Major V..,etative type .ff,.... , 'it
, ~ 7SO RaiCJht 3+ S10pe /.~ St.. ~
b - B1ueCJru'·scr 1. Shaw coveraCJe .. parcanta 1 - La.pade.~.JtorICode: (m.ow on Sketch)
11 t u.iDCJ fir.t diCJit only · - u.... 20, 40, 60, ate. , p - Poverty CJru. f - .... cue 2. II'- dauity ulan t _ Trefoil diqit.
c - Clover 1. La .. thaD 25' cover.CJe 2. 25 to 50, coveraCJe
cv - Crown vetch 3. 50 to 15' ~veraCJe r - RHtop 4. 75 to about 100' coveraCJ ta -_Tt.otby 5. Full coveraCJe
1. • Note.
I ii(lC;Z01f:M I
Piqure 1, ltumple of a Completed Pield Slope Survey Form
Areas of different vegetation, veqetation densities or
various combinations thereof were sketched on slope survey
forms and described using letter abbreviations to indicate vegetation type followed by a 2 or 3 digit numerical code.
The first digit(s) indicate the estimated percentage of
7

the area occupied by that type of vegetation in 10 percent
increments with 1 indicating 10 percent, 2 indicating
20 percent, etc. The last digit, which varies from 1 to 5,
indicates the estimated density of the vegetation in 25 per
cent increments with 1 indicating that more than 75 percent
of the ground is visible, etc. For example, the descripti6n
for the area of vegetation in the center of the slope
sketched in Figure 1 is f5S b 2S w2S cIS. This indicates
that this area is estimated to be 50 percent fescue, 20
percent bluegrass, 20 percent weeds and 10 percent clover,
totalling 100 percent. All of the last digits are 5
indicating that the density of coverage approaches 100
percent, i.e., the ground is virtually obscured.
Field data were subsequently retabulated to convert
vegetation density factors to percent bare ground with the
vegetation types as percents of an area proportionally
reduced to this new base such that percents of vegetation
types plus percent bare ground total 100. Finally, all
data were recalculated to determine overall percentages
of each vegetation type and of bare ground (100 total) for
the entire slope with weighting based upon relative area
sizes as sketched on the field survey form.
The variety of vegetation types encountered in signifi
cant amounts was not as great as had been initially supposed.
However, some grouping was still required both to expedite
the survey and facilitate analysis. Major subgroups of this
survey include: (1) grasses, (2) legumes, (3) broadleaf
weeds, and (4) vines, brush, and trees (VB and T). The
grasses were further subdivided into the following categories:
(1) common grasses (timothy, redtop, etc.); (2) fescue, all
types; (3) orchard and brome grass; (4) light grasses (cheat,
foxtail, etc.); (5) broomsedge; (6) Bermuda grass, and
(7) native grasses (bluestem, switchgrass, etc.).
The legumes were subdivided as follows: (1) Korean
lespedeza, (2) Sericea lespedeza, (3) birdsfoot trefoil,
(4) clover (all types), and (5) crownvetch.
8

The broadleaf weed subgroup is self-explanatory. The
fourth subgroup, vines, brush, and trees, is composed almost
exclusively of naturally seeded native varieties. The
principal exceptions include honeysuckle and some ornamentals
(trees comprise a very small percentage of this subgroup).
Distribution of Distress Forms by Soil Region
The data obtained were first evaluated according to
geographic location based on general soil regions as
adapted from definitions by the University of Missouri's
College of Agriculture2 • The soil regions are: northern
Missouri, southwestern prairie, west Ozark region, Ozark
region, east Ozark border, and southeast lowland. For
this study, the largest, northern Missouri, was further
subdivided into northeast glacial and northwest glacial
for a total of seven soil regions. The general outlines
of these regions are shown in Figure 2.
rj
~ Northvtlat Glacial \
"-,
; ) North •• lt Glacial
---...-l--- .... \ : \. - ./ Soutllvelt.m Prairie ... ,-' '_./
...... , .. \ Z •• t Ozark Border / ......... ~... , .. - ..... . ........... , .. , , : . ,
" .. ' ..... "\ , , , , , ' , ' \ t \ . . \ t' \
• w;.;t ';urk BorcSu; ,..,- ..... .. 1'-··-· ......... ...,.
Ourk R.qlon
Plqur. Z. SOil Reqlonl of Mialourl
(Adapted troll Rater.nc. Z).
9
./ .' .'

Table 1 summarizes the distribution of the surveyed
slopes and the types of distress reported for these soil
regions. Slides comprised 52 percent of all distress
forms reported statewide and 64 percent or more of the
reported distress in the two soil regions north of the
Missouri River, in the southeast lowlands and the east
Ozark border. When slides and sloughs, a related distress
form differing in degree, are combined, percentages for
these four regions vary from 83 to 100. Erosional problems
were reported more frequently than other distress forms in
the southwestern prairie, west Ozark border and Ozark
regions.
Soil Re2ion (See FiSZ.
Northeast Glacial
Northwest Glacial
East Ozark Border
Southwestern Prairie
West Ozark Border
Ozark Region
Southeast Lowland
Averages:
Tl\BLE 1
Distribution of Surveyed Slopes and Types of Distress by Soil Region
2) No. of SloEes
Random D1stressed T~Ees of Distress. , for Re2ion
S11 es S10uSZhs ~10n
33 51 88 8 4
33 53 70 13 17
29 25 64 32 4
24 39 15 8 77
20 51 10 35 55
30 32 38 22 40
22 29 76 24 0
52 20 28
Slope Performance Related to Soil Properties
The survey data were next analyzed to determine the
relationship of performance to physical soil properties as
indicated by ASTM soil c1assification3 and plasticity index
(PI). In these and some subsequent tables, the percentage
of occurrence of a particular property as found in the
random survey of non-distressed slopes was used as a base
to establish a ratio to the percentage of occurrence of
that property among the slopes having one or more forms of
distress. These ratios, shown in parentheses, provide a
10

more convenient means of assessing the significance of the
data presented. Such ratios were omitted where there were
less than 4 observations for a property for either the dis
tress form-or for the random survey base.
Tables 2 and 3 show the percentages of the various
distress forms and of the randomly surveyed slopes by ASTM
soil classifications and by PI ranges. Most of the surveyed
slopes are composed of high or low PI clay soils (CH or CL).
Other individual soil types generally are 5 percent or less
of the total for each form of distress. The most significant
relationship shown here is that CH soils, as a ratio of their
percentage of occurrence, were found more frequently in
association with all forms of distress than in the random
survey. Only 22 percent of the non-distressed slopes of
the random survey were composed of CH soils while 35 percent,
or 1.6 times as many, of the slides surveyed occurred on
slopes composed of CH soils. This ratio was even higher,
1.9 and 1.8, for sloughs and erosion respectively.
Gravelly and sandy clays (GC & SC) are also shown to
be disproportionally erosion prone. The sands and silty
sands (SP, SW & SM) also exhibited higher erosion ratios
but not as much as might be expected. Insufficient data
were developed to confirm the expected high erosion potential
of the silts (ML). TABLE 2
ASTM Soil Classification of Surveyed Slopes
ASTH % of Distress Form by Soil Class. Soil (Ratio to Random % Base) , of Random
Classification ~ Sloughs Erosion Surver SloEes
eH 35 (1.6) 41 (1. 9) 3<1 (1. 8) 2 2
CL 60 (0.9) 45 (0.7) 40 (0.6) 64
CL-CH 1 6 2 1
CL-ML 1 2
MH 2 2 2 3
ML 4 1 3
GC , SC 11
SM, SP & sw 1 2 6 (1. 2) 5
Number of Tests 142 54 83 191
11

Table 3 indicates a general trend of soils with higher
PI ranges being associated with an increased incidence of
distress in all forms. Surprisingly, the incidence of erosion
in the highest PI bracket is especially high. This is not
inconsistent with the association, indicated in Table 2,
of sandy and gravelly clays with erosion. It should be
kept in mind that PI is based on only that fraction of the
soil which passes the No. 40 sieve. The over-40 PI's
include many gravelly residual clays which may have a very
low percentage of material passing the No. 40 sieve. This
is also consistent with the high reported incidence of
erosion from those soil regions where residual soils pre-
dominate (Table 1).
PI Range
0-9
10-19
20-29
30-39
40+
No. Tests :
Avg. PI:
Avg. LL:
TABLE 3
Slope Performance ann Plasticity Index (PI)
, of Distress Form by PI Range (Ratio to Random , Base)
STides Sloughs Erosion
4 (0.3)
24 (0 . 8)
35 (0.9)
24 (1.6)
13 (3.3)
143
27
48
6
26 (0.9)
44 (1.1)
15 (1. 0)
9 (2.3)
54
25
44
11 (0.9)
28 (0.9)
14 (0.4)
16 (1.1)
31 (7.8)
83
28
48
, of Random Survey Slopes
12
30
39
15
4
191
22
44
Slope Performance Related to Slope Geometry and Orientation
Survey data were next tabulated to assess possible
influences on performance of degree of slope, slope height,
and direction faced by the slope. These data are summarized
on Tables 4, 5, and 6.
12

Table 4 could be interpreted to suggest that slope
performance is inversely related to steepness of slope, i.e.,
the steeper the slope, the lower the likelihood of distress.
It is believed that the limited data for 1.5:1 slopes is
anomalous. Certainly the bulk of the data is for 2:1 slopes
which experience all forms of distress in about the same
proportion as 2:1 slopes occur in the random survey of nondistressed slopes. Table 5 confirms an expected trend for a
higher incidence of slides and sloughs with increasing slope
height and also shows increased erosion on the highest slopes.
Table 6 indicates that more erosion occurs on south and west
facing slopes which are presumably subject to more drying and
a somewhat higher frequency of sloughs and slides occur on
the wetter and more frost susceptible north and east facing
slopes.
Slope*
1. 5: 1
2:1
2.5:1
3:1
No. Obs:
Avg. Slope:
TABLE 4
Slope Performance and Oeqrea of Slope
Sl1des and Sloughs ErosIon
9 (0.5)
68 (1.1)
14 (1.2)
9 (1.3)
196
2.2:1
8 (0.4)
62 (1.0)
19 (1.6)
11 (1.6)
83
2.2:1
*Slopes were sorted to closest fit to ranges noted.
13
, of Random Survey Slopes
18
63
12
7
191
2.1:1

Slope Hei~ht, ft.
< 19
20-29
30-39
40-49
50+
No. Obs:
Avg. Height:
Slope Exeosure
North
South
East
West
No. Obs.
TABLE 5
Slope Performance and Slope Height
, of Distress Form by Height (Ratio*to Random' Base)
sI1aes ana sIou~ns ErOS10n
39 (0.7)
28 (1. 0)
20 (1.7)
8
5
197
26
(2.0)
(1.7)
TABLE 6
46 (0.9)
25 (0.9)
11 (0.9)
6 (1. 5)
8 (2.7)
83
26
, of Random Surve:z: Sloees
53
28
12
4
3
191
23
Slope Performance and Slope Orientation
, of Distress Form by Slope Exposure (Ratio to , of All Distressed Sloees)
Slides and Slougns Erosion All Distressed Sloees, \
34 (1. 3) 8 (0.3) 26
27 (0.9) 36 (1. 2) 30
19 (1.0) 17 (0.9) 19
20 (0.8) 39 (1. 6) 25
197 83 280
14

,
Performance of Cuts Vs. Fills
Table 7 shows that cut and fill slopes experience significantly different rates of erosion. Slides and
sloughs were equally common on both fills and cuts while
erosional problems were nearly twice as frequent on cut
slopes.
Cuts
Fills
TABLE 7
Pertormance of Cuts Versus Fills
\ of Distress Form (Ratio to \ of All Distressed Slopes)
No. Obs.
SlIdes ana Slough. Ere.lon
72 (1.0)
28 (1.1)
213
72 (1.0)
13 (0.5)
85
Slope Performance and Vegetation Type
All Di5tressed Stopes, ,
75
25
298
Because there was insufficient data for detailed
breakdowns by most specific varieties of vegetation, major
vegetation subgroups were used in compiling the tables of
this section •. However, two varieties, crownvetch and
fescue, were included due to their p~evalence. The average percentages of total slope areas occupied by
the various subgroups and varieties are shown in Table 8
while Table 9 is based on percentages of slopes where one
vegetation type occupies 50 percent or more of the slope area. For this table, slides and sloughs are grouped together due
to the smaller data base. A breakdown is provided by soil
region of the average percentages of total slope areas occupied by the various vegetation types for slides and
sloughs combined in Table 10 and for eroded slopes in Table 11.
15

TABLE 8
Slope Performance and Vegetation Type
Average \ of Slope Area for Distress Form % of Vegetation (Ratio to Random \ Base) Slope Area of
SubSirouE Shoes sIouSins Erosl.on Random Surve:t
Grass 52 (0.9) 40 (0.7) 30 (0.5) 55
(Fescue) (40) (0.9) (29) (0.6) (29) (0.6) (46)
Legumes 19 (1. 0) 26 (1. 3) 28 (1. 4) 20
(Crownvetch) (11) (1. 4) (10) (1. 3) 7 ) (0.9) 8)
Weeds 9 (1.1 ) 9 (1.1 ) 7 (0.9) 8
VB I< T 6 (0.7) 7 (0.8) 1 9
Bare 14 (1. 8) 18 (2. 3 ) 34 (4.3) 8
No. Obs. 145 54 84 210
,,"
Table 8 shows a markedly higher association for all
forms of distress, most notably erosion, with "bare" ground.
(As noted in the discussion of the survey conventions,
"bare" is used here as an indication of average vegetation
density for the total slope.) This association indicates
that type of vegetation is less significant than the density.
The next strongest association shown is a relatively
low incidence of erosion with the grasses and a relatively
high incidence of erosion with all legumes combined.
Interestingly, this association is not confirmed for
crownvetch alone. A surprising trend of Table 8 is the
higher association of crownvetch (but not all legumes)
with slides and sloughs. Not surprisingly, the incidence
of slides and sloughs associated with vines, brush and
trees (VB & T) is low although perhaps not as low as
might be revealed if a larger data base were available
for this cateqory.
16
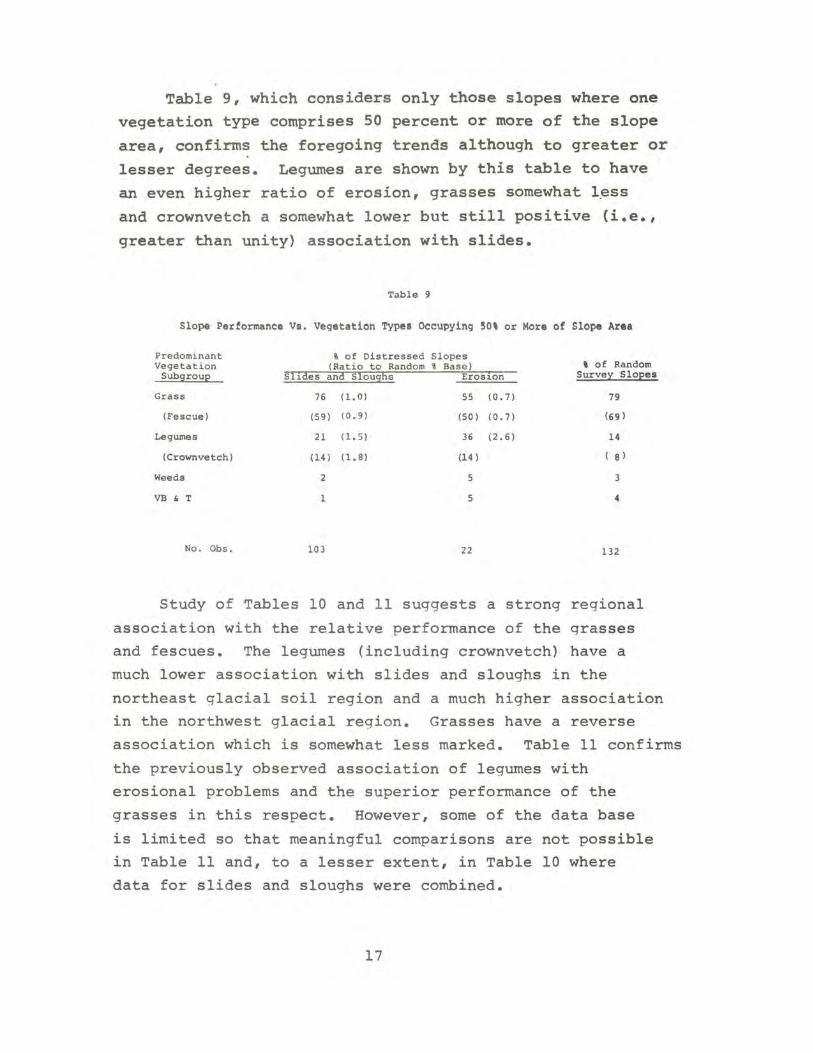
Table 9, which considers only those slopes where one vegetation type comprises 50 percent or more of the slope
area, confirms the foregoing trends although to greater or
lesser degrees. Legumes are shown by this table to have
an even higher ratio of erosion, grasses somewhat l~ss
and crownvetch a somewhat lower but still positive (i.e.,
greater than unity) association with slides.
Table 9
Slope Pertormanee Va. Vegetation Typel Occupying 50' or More of Slope Area
Predominant , of Distressed Slopes Vegetation (Ratio to Random % Base) , of Random
Subgroul2 sl~aes ana SloughS Eros~on Surve:z:: Slol2es
Grass 76 (1.0) 55 (0.7) 79
(Fescue) (59) (0.9) (50 ) (0.7) (69)
Legumes 21 (1.5) 36 (2.6) 14
(CroWllvetch) (14) (1.8) (14 ) 8 )
Weeds 2 5 3
VB & T 1 5 4
No. Obs. 103 22 132
Study of Tables 10 and 11 suggests a strong regional
association with the relative performance of the qrasses and fescues. The legumes (including crownvetch) have a
much lower association with slides and sloughs in the
northeast glacial soil region and a much higher association in the northwest glacial region. Grasses have a reverse
association which is somewhat less marked. Table 11 confirms
the previously observed association of legumes with erosional problems and the superior performance of the
grasses in this respect. However, some of the data base
is limited so that meaningful comparisons are not possible in Table 11 and, to a lesser extent, in Table 10 where
data for slides and sloughs were combined.
17
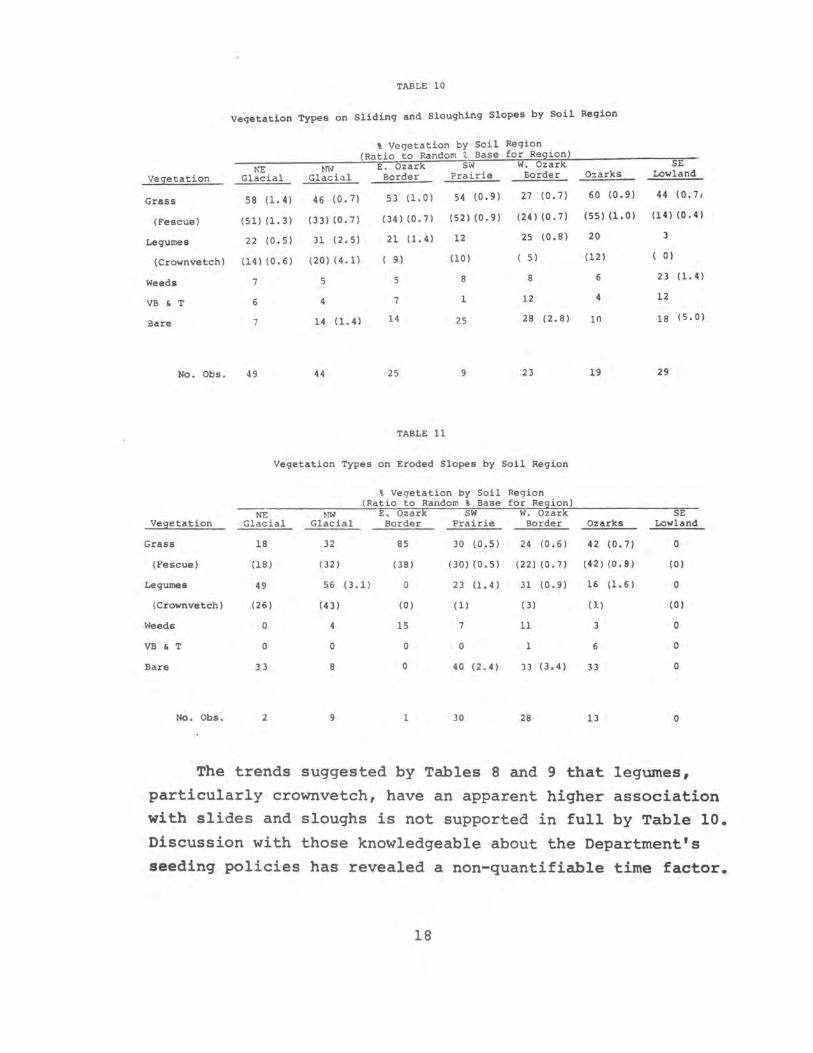
TABLE 10
Vegetation Types on Sliding and Sloughing Slopes by Soil Region
\ Vegetation by Soil Region (Ratio to Random t Base for Re2ion)
!>.'E NN' E, Ozark SW w. ozark SE
Vegetation Glacial Glacial Border Prairie Border Ozarks Lowland
Grass 58 (1. 4) 46 (0.7) 53 (1.0) 54 (0.9) 27 (0.7) 60 (0.9) 44 (0.71
(Fescue) (51) (1. 3) (33) (0.7) (34) (0.7) (52) (0.9) (24) (0.7) (55) (1.0) (14) (0.4)
Legumes 22 (0.5) 31 (2.5) 21 (1.4) 12 25 (0.8) 20 3
(Crownvetch) (14) (0.6) (20) (4.1) 9) (10) 5) (12) 0)
Weedll 7 5 5 8 8 6 23 (1. 4)
VB , T 6 4 7 1 12 4 12
Bare 7 14 (1.4) 14 25 28 (2.8) 10 18 (5.0)
No. Obs. 49 44 25 9 23 19 29
TABLE 11
Vegetation Types on Eroded Slopes by Soil Region
% Vegetation by Soil Region (Ratio to Random % Base for Re2ion)
NE NW E. Ozark sw w. ozark SE Vegetation Glacial Glacial Border Prairie Border Ozarks ~nd
Grass 18 32 85 30 (0.5) 24 (0.6) 42 (0.7) 0
(Fescue) (18) (32) (38) (30) (0.5) (22) (0.7) (42) (0.8) (0)
Legumes 49 56 (3.1) 0 23 (1.4) 31 (0.9) 16 (1.6) 0
(Crownvetch) (26) (43) (0) (1) ( 3) (J.) (0)
Weeds 0 4 15 7 11 3 0
VB , T 0 0 0 0 1 6 0
Bare 33 8 0 40 (2.4) 33 (3.4) 33 0
No. Obs. 2 9 1 30 28 13 o
The trends suggested by Tables 8 and 9 that legumes,
particularly crownvetch, have an apparent higher association
with slides and sloughs is not supported in full by Table 10.
Discussion with those knowledgeable about the Department's
seeding policies has revealed a non-quantifiable time factor.
18

Crownvetch, in particular, has been overseeded on older
slopes, many of which were already so distressed by slides,
sloughs, and erosional problems that establishment of some
form of vegetation not requiring mowing on dangerously
steep slopes was a departmental objective. It is concluded
that while there is a logical and positive link between the
occurrence of legumes and erosional problems, no definite
conclusions can be drawn with regard to such a link between
crownvetch and the occurrence or non-occurrence of slides and
sloughs.
19

FROST .DEPTH PENETRATION
A secondary objective of this study was to determine
if depth of frost penet~ation was influenced by types of
vegetation. For this purpose, freeze tubes were installed during the fall of 1981 at selected sites and monitored
through the winter of 1981-82. This winter was extremely
cold with significant but variable snow cover. An attempt was also made to monitor selected installations in the
central part of the state during the winter of 1982-83.
However, this winter was unusually mild and so little freezing was observed that no meaningful comparisons are
possible. Therefore, the data reported is limited to the
winter of 1981-82.
(Approx~ta Pr ... inq Ind.x Contoura) 600 Deqr .. daya below )20,,25 y.ar av.raq ••
< / ... (lwf. 2)
500
-4: ) ""4 100 ,- (
6
AaL..S. -D
'iqur. 1, Location of 'r •••• -TUb. Inatallationa
20
) ,r-' 100

General locations selected for freeze-tube installations
are shown in relation to mean freezing index contours in
Figure 3. The contours are based on climatological data for a period of 25 or more years4.
Freeze-tubes were constructed of clear plastic tubing filled with a diluted solution of methylene blue which
freezes clear. Flexible 3/8-inch diameter acrylic tubing was plugged at each end and vented at the top. These were installed in casings consisting of 3/4-inch PVC pipe which
had been placed in the ground and capped at selected locations to depths of at least 36 inches. Freezing depth was determined by measuring the depth of clear ice above
the blue solution in the bottom of the tube.
Table 12 summarizes the various instrumentation sites, the general location, the direction of slope exposure and
the type of vegetation immediately surrounding the installation.
TABLE 12 Freeze-Tube Installations
Site Located Slope principal Area Site Located Slope Principal
!.2.:.- !!!!!.- Faces V!9:etation NO.* No. !!ll- Faces Vegetation 1 St. Joseph South Fescue 3 31 columbia East Crownvetch 2 St. Joseph South Fescue 3 32 columbia South Creep. Juniper 3 St. Joseph North F •• cue 3 33 Columbia South Fescue 4 St. Jo.eph South Orchard & Br"",e 3 34 columbia East Crownvetch 5 St. Jos.ph South Bar •• lope 3 35 Columbia East Bare Slope
6 St. Joseph North Orchard & Br"",. 3 36 Columbia West Fescue 7 St. Jo.eph South Crownvotch 3 37 columbia West Bare Slope a St . Jo •• ph North Fescue 3 38 Columbia West Crownvetch 9 St. Jo.eph North Crownvetch 3 39 Columbia East Fescue
10 St. Joseph East Orchard & Brome 3 40 Columbia East Fescue
11 St. Joseph liest Orchard , Brome H Columbia East Crownvetch 12 I nd.pendence South Fescue 3 42 Columbia East Fescue 13 Ind.pendence North Crownvetch 3 43 columbia East Fescue 14 Independence South Hon.ysuckle 3 44 Eldon East Sericea Les. 15 Indep.ndence North Orchard , Brome 3 45 Eldon West Sericea Les.
16 Independence South Crownv.tch 3 46 Eldon East Crownvetch 17 Independence South Orchard , Brome 3 47 Eldon East Bare Slope 18 I nd.p.nd.nce Ea.t Bar. Slope 3 48 Eldon East Fescue 19 I nd.pend.nca North Hon.ysuckle 4 49 Kirkwood East Fescue 20 Ind.pend.nce North F •• cue 4 50 Kirkwood East Crownvetch
21 Independ.nce East Orchard , Brome 4 51 Kirkwood East Crownvetch 22 I ndapend.nce West Orchard , Brome 4 52 Kirkwood West Fescue 23 Columbia North Cre.p. Juniper 4 53 Kirkwood West Bare Slope 24 Colwabia North Bare Slope 4 54 Kirkwood North Crownvetch 25 Columbia North F •• cue 4 55 Kirkwood South Fescue
26 colwabia w.st F •• cu. 5 56 Sike.ton East Fescu. 27 Columbia West crownvetch 5 57 Sike.ton West F.scu. 28 colUlibia North Crownvatch 5 58 sike.ton w.st B.rauda 29 Columbia East Creep. Juniper 5 59 Sike.ton North .... cu. 30 Columbia East Crownv.tch 5 60 Sike.ton South aerauda
*See Fi9ure 3
21

Freezing depths at each location, snow cover, and daily
local temperature extremes are plotted on Figures 4 through
35. Table 13 summarizes average and maximum freezing depths for the principal vegetation types by slope exposure
direction while Table 14 summarizes average and average maximum freezing depths recorded for all vegetation types including bare slopes. "Average freezing depths" are
TABLE 13
Average Depths of Frost Penetration in Inches for
Principal Vegetation Types by Slope EXposure Direction
Direction Faced by Sl02e East west North South
* ~ ~ ~ Avg. Max. No. Avg. Max. No. Avg. Max. No. Avg.
Fescue 1 1 5.0 16.8 2 8.4 17.4 2 5.5 2 1 7.0 13.9 1 3.5 3 4 6.7 14.1 2 7.2 15.1 1 8.0 15.7 1 2.6 4 1 4.9 13.3 2 7.7 16.0 1 1.8
Avg. 2, 3 & 4 5.8 13.7 7.5 15.6 7.5 14.8 2.6
5 1 1.0 4.6 1 1.3 4.5 1 2.8 5.2
Crownvetch 1 1 5.6 13.5 1 5.0 2 1 3.9 6.5 1 1.4 3 5 5.1 11.5 2 8.8 15 . 8 10.0 17.8 1 4.1 4 1 3.6 9.2 1 7.8 13.5
Avg. 2, 3 & 4 4.4 10.4 7.2 12.6 2.8
Orchard & Brome Grass 1 2 9.9 18.2 1 8.2 15.5 1 9.0
2 1 4.7 9.5 1 4.1 1l.8 1 5.7 10.5 1 3.9
* Reference Figure 3
referenced to a common time frame which is the longest
period for which frost was recorded at any site in the state, regardless of latitude. "Average maximum freezing
depths" are averages of actual maximums for the indicated
areas as referenced to Figure 3. It should also be noted that "bare" as used here means that the ground around the
installation is essentially barren of all vegetation and
is not to be interpreted as an indicator of relative vegetation density as in the slope survey portion of this study.
22
Max.
10.4 9.4 6.4 7.3 7.7
8.5 4.2 9.5
6.9
16.7 10.2

Direct comparison of the various sites is complicated
by many factors, most notably snow cover depth, soil moisture,
latitude, degree of slope and slope orientation~ However,
some trends seem evident when comparisons are restricted to sites within the same general latitudes or zones of mean
freezing index contours as shown in Figure 3. Those sites
in Area 1 are in a somewhat colder zone than those sites in Areas 2, 3, and 4 where climatic differences are small and for which data c~n be averaged and compared. Sites in
Area 5 are in a much warmer zone. Average frost depths recorded in Area 5 in the southeast
lowlands were relatively insignificant, averaging only 1.7
inches and with only a 5.2 inch maximum depth. These are only about one third of the magnitude of the frost depths recorded, both average and maximum, in the central and
northwestern parts of the State. Moreover, Figures 26
through 29 indicate that there was no snow cover to mitigate
freezing depths at these sites. ~he freezing depths recorded
seemed unlikely to be a source of slope degradation in this part of the state. The same cannot be said of the freezing
depths recorded in the central and northwest part of the state which appear sufficient to normally exceed the depth reinforced by the root zones of most sods. While the
reported data was recorded during a winter which was
considered severe, none of the freezing depths came close to the maximum values reported in standard tables and charts
for Missouri. In general, the maximum values cited in the literature exceed the maximum observed values by factors of
2 to 3. Table 13 indicates significant variation in recorded
freezing depths as a function of the direction faced by the
slope. As would be expected, north facing slopes have the greatest freezing depth, followed closely by west facing, and then by east and south facing slopes. In general,
south facing slopes were found to freeze to depths of only
1/2 to 1/3 that of north and west facing slopes.
23
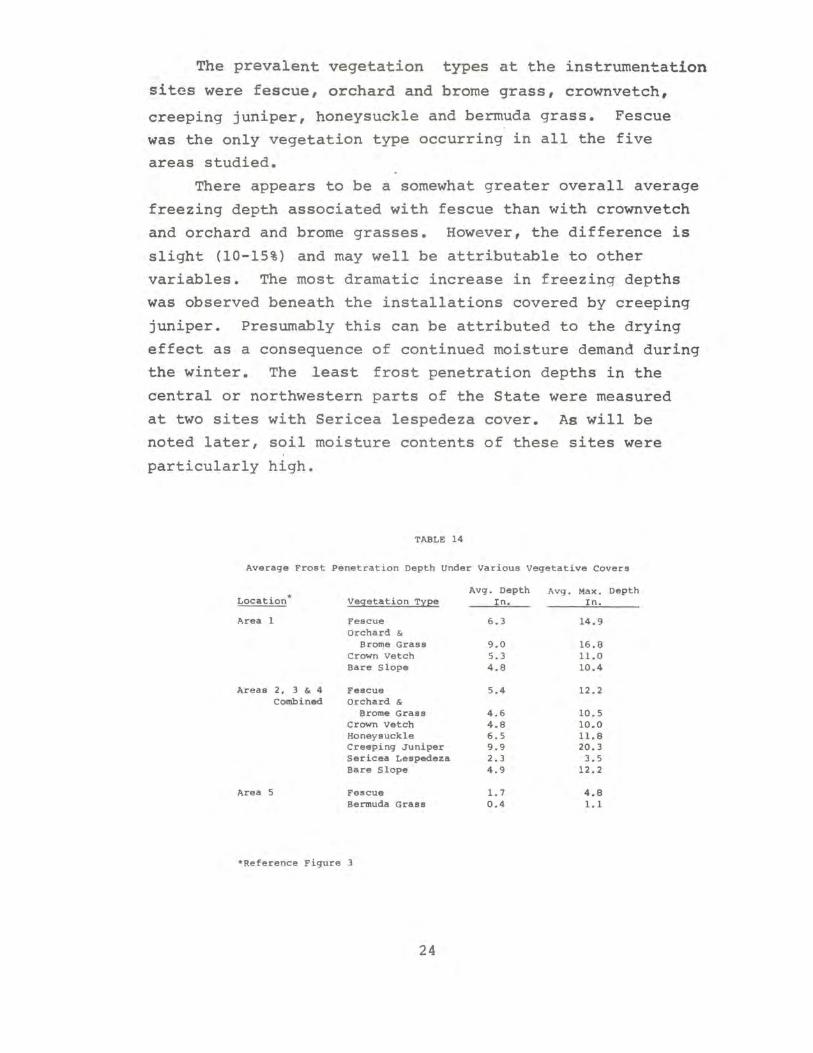
The prevalent vegetation types at the instrumentation
sites were fescue, orchard and brome grass, crownvetch,
creeping juniper, honeysuckle and bermuda grass. Fescue
was the only vegetation type occurring in all the five
areas studied.
There appears to be a somewhat greater overall average
freezing depth associated with fescue than with crownvetch
and orchard and brome grasses. However, the difference is
slight (10-15%) and may well be attributable to other
variables. The most dramatic increase in freezing depths
was observed beneath the installations covered by creeping
juniper. Presumably this can be attributed to the drying
effect as a consequence of continued moisture demand during
the winter. The least frost penetration depths in the
central or northwestern parts of the State were measured
at two sites with Sericea lespedeza cover. As will be
noted later, soil moisture contents of these sites were
particularly high.
TABLE 14
Average Frost Penetration Depth Under Various vegetative Covers
Location*
Area 1
Areas 2, 3 & 4 Combined
Area 5
vegetation TYEe
Fescue Orchard &
Brome Grass Crown Vetch Bare Slope
Fescue Orchard &
Brome Grass Crown Vetch Honeysuckle creeping Juniper Sericea Lespedeza Bare Slope
Fescue Bermuda Grass
*Reference Figure 3
24
Avg. Depth Avg. Max. Depth In. In.
6.3 14.9
9.0 16.8 5.3 11.0 4.8 10.4
5.4 12.2
4.6 10.5 4.8 10.0 6.5 11.8 9.9 20.3 2.3 3.5 4.9 12.2
1.7 4.8 0.4 1.1

1.5
Snow 1.0 Cover Ft. 0.5
0
0.5 ~
Frost Lo ! Depth
Ft. 1.5
100
50 Temp. 32 of
0
50
1.5
Snow 1.0 Cover Ft. 0.5
0
0.5
Location: E. of St. Joseph Slopes facel South
Site 1 - Fescue, short \ - - Site 2 Fescue, tall
-- -- -- -- Site 4 - Orchard-Brame ~rass \ - - - - - - Site 5 - Bare Slope '\ -- • - • -- • Site 7 - Crownvetch
\ / ........ ~--- .........
:f \. ""\., - --.{ -" /1 /, , ~' [-- -- - - -'- .. __ .,-\------ I
..... /' '----,.",
.~ .- .Maximum
- 320
Minilllulll 0
Figure 4, Frost Penetration Diagram for Sites 1,2,4,5,6 7.
------.---_.-. --l.---- -- ------ -~ I I
Location: E. of St. Joseph Slopes face: North
____________ Site 3 - Fescue _ ___ Site 6 - Orchard-Brome grass
Site 8 - Fescue
Frost. 1.0 ... -------------.-
~/ 'I/I~ _ _ -II
Depth Ft.
1.5
100
50 Temf· 32
of 0
50
~/ ~~r
:-, ,~ -":.::.::..-/
" '. .---- MaxJ.JIWI
- n /' ,I ~ -" .. . ' .. ' • c;o-v j ._ 320 j • ; I.> .. ~ . • \. . J V \ ~ _ I!liAiIIIuIII
o
Dec. L Jan.
1981 1982
reb.
Figure 5, Frost Penetration Diaqram for Sites 3,6,6 8.
25
1.5
lo·i Snow Cover Ft. 0.5
0
0.5
Frost 1.0 Depth Ft.
1.5
100
50 ~.-'
Temp. 32 ~
of 0
50
1.5
Snow 1.0 Cover Ft. 0.5
0
0.5
Frost 1.0 Depth Ft.
1.5
100
50 Temp. 32
of 0
50
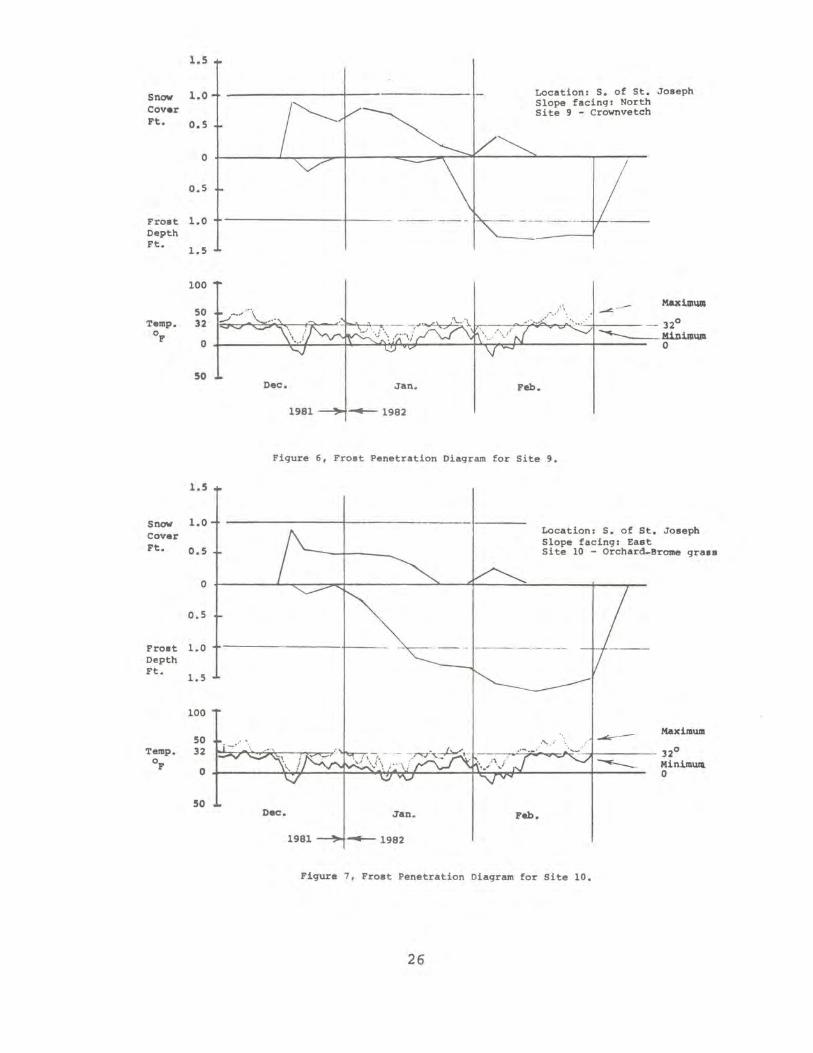
L_ Location: S. of St. Joseph Slope facing: North
I~ Site 9 - Crownvetch
-""-Maximl.\lll
- 320
____ .1tini"~ 0
Figure 6, Frost Penetration Diagram for Site 9.
Location: S. of St. Joseph Slope facing: East Site 10 - Orchard-Brame gra.s
-.-- MaximWII
. J 320 ---. MinimWII. o
Figure 7, Frost Penetration Diagram for Site 10.
26

..
1.5
Cover Slope facing: Wellt Snow 1.0 t L Location: S. of St. JOlleph
Ft. 0.5 ~ Site 11 - Orchard-Brame gra~1I
o
0.5
Frost 1.0 Depth Pt. 1.5
lOOb$~ 'j _ SO ..... ,-,.-t'" ... ---Temp. 32 ~ ~' - - ----~.~ '~~J--'" --320 '. . . . . "-' ," . g '-../ ----o \ " '.': \ .1 ". ,' .... .' ....... ', j - ___ Min:i,1IIUID Po ~"~- 0 . /1«1
50
1.5
Snow 1.0 Cover pt. 0.5
0
0.5
Frost 1.0 Depth Ft.
1.5
100
SO Temp. 32
OF 0
50
Figure 8, Frost Penetration Diagram for Site 11.
Location: Independence Slopes face: South
----------- Site 12 - Fescue --- --- --- Site 14 - HoneYlluckle -- -- -- -- Site 16 - Crownvetch ----------- Site 17 - Orchard-
Brome grass
Maxl111U1D
- --- 320
~ --4---- Ml~ll11U11l ---- o
Figure 9, Frost Penetration Diagram for Sites 12,14 16&17.
27

Snow Cover Ft.
Frost Depth Ft.
Temp. of
Snow Cover Ft.
Frost Depth Ft.
Temp. OF
1.5
1.0
0.5
0
0.5
Location: Independence Slopes facing: North
----- Site 13 - Crownvetch - - Site IS - Orchard grass - - - - Site 19 - Honeysuckle
Site 20 - Fescue
, 1 \", ......... /-,
1.0
\ "." ' .'1 , """' .::- ,' 1 ________ +-_ _ ~. _._._._ ....... ' /1
" ..- ~---f-! ' ___ " , ., / 1
, ~':-~.:.:~'/ 1.5
100
Maximum SO t ,,-, \ 32 .-' ,
0 t-- --- 32° D ~ ...... ----- ~inimum fa v-s ~~) AV6z$:v
50
1.5
1.0
0.5
0
0.5
1.0
1.5
100
SO 32
0
SO
Figure 10, Frost Penetration Diagram for Sites 13,15,19&20.
Location: Independence Slopes facing: East
- ---- Site 7 -Bare Slope -- - Site 10 - Orchard-
Bromegrass
Maximum
~ 32° .... ,. - I ~- I- J ",--I Hi nimum ' - 0 ~
Dec. ~ Jan.
1981 -1982
Feb.
Figure 11, Frost Penetration Diagram for Sites 18&21.
28

Snow Cover Ft.
Fro.t Depth Ft.
Tetllp. OF
Snow Cover Ft.
Fro.t Depth Ft.
Temp. OF
1.5
1.0
0.5
0
0.5
1.0
1.5
100
SO 32
0
50
1.5
1.0
0.5
o
0.5
1.0
1.5
100
SO 32
0
50
Location: Independence Slope faces: West Site 11 - Orchard-Bromegrass
Maximum
I&"V\.~'J A~ o~l~ ··-~~:imum \ F4J 0 0
Figure 12, Fro.t Penetration Diagram for Site 22.
I I
._----- - .. ---. -- -- j"- - - - -- - .-
I I
I
I ------------ .-. t· I i
Dec. I Jan.
1981 +.- 1982
r -I I
Location: E. of columbia Slopes facing: North
Site 23 - Creeping Juniper
_____ Site 24 - Bare slope ____ Site 25 - Fescue ___ . _ . Site 28 - crownvetch
/
. 1-
Feb.
I I
I
, ~
:,/
1
-... ....... MAximum
o
Figure 13, Frost Penetration Diagram for Sites 23,24,25&28.
29

Snow Cover Ft.
Frost Depth Ft.
Temp. of
Snow Cover Ft.
Frost Depth Ft.
Temp. OF
1.5
1.0
0.5
I I ._-_._-_ ._--_._- --j '- - -- -- -- - _ ...
I I
I I
I .. t-
I I
Location: E. of Columbia Slopes facing: West
----- Site 26- Fescue - - Site 27- Crownvetch
o I ! V'· I 7><> L '~I 'I'
0.5
1.0
1.5
100
50 32
0
SO
1.5
1.0
0.5
0
0.5
1.0
1.5
100
50 12
0
SO
I
I I I /
/
\
, I --------.- .--- - to.
, . . - .. {/.' -.' - ./ I
\" ... ------\ __ /
A ' " , , ,
I
I -,', I ---'" \ . Maximum
," , . \ ' , 0 -. to <,-"b ' ,. ~("I .- 32 ' > c. , < i > I ~ Minimum
o
Dec. I Jan.
1981 + .- 1982
Feb.
Figure 14, Frost Penetration Diagram for Sites26,27.
I -----_ .. _. __ .. _- --j"'- - - .- -- - -_ ... -
I I
I I
I .. t--
I I I ,
Location: E. of Columbia Slopes facing: East
_____ Site 29 - Creeping Juniper
_ _ _ Site 30 - Crownvetch Site 31 - Crownvetch
J-_j~
1- I
I
I I ' ¥' ,
+ ! I
i ,1-. -- Maxiaawa
1":.,(' > I,-:.J., ,f, ~ ,: &C'''''';;i i ._ 320 ___ Minilllwa
o
Dec. I Jan.
1981 +.- 1982
Feb.
Figure 15, Frost Penetration Diagram for Sites 29,30&31.
30

Snow COVer Ft.
Froet Depth Ft.
Temp. of
Snow Cover Ft.
Frost Depth Ft.
Temp. of
1.5
1.0 I i
.----... . ~ .- ... -. ·-t·- - -- -- _ . . .. t --Locations E. of Columbia Slopes facing: South
Site 32 - Creeping Juniper
- - Site 33 - Fescue 0.5
0
0.5
1.0
1.5
100
50 32
0
50
1.5
1.0
0.5
0
0.5
I I
I
I ,
1
/
,,~- ---_ . .// ... ,..... I
' . --" 1
:
7 1
V / 1
I , ~ -~ - - ---. ---I t -- -....
! 1 i , I
Maxillwa
.; -;.e' < " b to .. " r-w-{ '="'>l' .- 320
• . .. " , , . • ~h" MinJ.aw.
I I
Dec. I Jan.
1981 ~.- 1982
o
Fab.
Figure 16, Frost Penetration Diagram for Sitee 32533 .
I , I
1 , I
~-1
Location: S. of Columbia Slopes facing:
Site 34 -Site 35
_ _ _ _ Site 41 -Site 42 -
Eaet Crownvetch Bare slope Crown vetch Fescue
:~: r------- ········ r -I I ,
100
50 t .. '! '" 32
Maxilllulll
. ":'>' .- 320 . " i . ) "l b , .J r=;--' =1 I - <. ) < , < • . ~ ---.... Minimum
--. 0 o
50 Dec. I Jan.
1981 + .- 1982
Fab.
Figure 17, Frost Penetrati on Diagram for Sites 34,35,41&42.
31

1.S
Snow 1.0 Cove" Ft. 0.5
0
0.5 +-
I ----- .... -- .... ·-t-- -- -- - .. - ., . I
, I
I ~ ,
Location: S. of Columbia Slopes facing: West
------ Site 36 - Fescue - - Site 37 - Bare slape
Site 38 - Crownvetch
Frost 1.0 r------.- I Depth '.'. '.'r-Ft. 1.5 i I
, ·1 ! I
Temp. of
Snow Cova" Ft.
Frollt Depth Ft.
Temp. of
100
50 32
0
50
1.5
1.0
O.S
o
0.5
1.0
1.5
100
50 32
0
50
I . ~...... -\ "
Max1lllWl
,. .:X.. ,. -e 'i .' r-< c.;::::-<"'-""V' 1 . - 3 20 . . > , < " ., . > - MinimUIII
----- o
Oac. I Jan.
1981 + .- 1982
Feb.
Figure 18, Frollt Penetration Diagram for Sites 36,37'38.
I .----.---.: ......... -~-. -- --
I
I
I , I t -I i ,
I , I .. t -_. I I '
Location: S. of Columbia Slopes Facing: East
__________ Site 39 - Fescue __ __ Site 40 - Fescue ___ Site 43 - Fe!'cue
I I
"
MaxilllUlll ~ --l' . 0 .' • -'t / c'=¥"V"),," I .- 32 ~ ~ '. . .. '-" (\i" .... '" /3I<:'c , < , , J -I ~" Minimum
o
Oec. I Jan.
1981+-1982
Feb.
Figure 19, Frollt Penetration Diagram for Sites 39,40&43.
32

Snow COVer Ft.
Fro.t Depth Ft.
Temp. 01"
Snow Cover Ft.
Frost Depth Ft.
Temp. 01'
1.5
1.0
0.5
0
0.5
1.0
1.5
100
50 32
0
50
1.5
1.0
0.5
0
0.5 .j..
I
------ .:-.-- --- --.,..- ------- .. ··t--I . I ' I
d\
Location: S. of Zldon Slope. facing:
----- Site 44 -
Site 46 Site 47 Site 48 -
Za.t Sericea Lespedeza Crownvetch Bare Slope Fescue
\ I \" . I \\~ // "~, \. I \\ ~ " (-. -J... ' \
\ \ I, I . r..J " . -. +-., l.. .-'-' - ' - : '--"" I ._ . \ " '-;-""r -----------_ ... r .. -\- .~.../f- j -l I \.. -) \ " . I' I ,_- I
I
, ~ I . J- --\ ~ . 0 I C>.c. ( ) '" I .- 32 7\ :> = I __________ _ Hinimwl
Maxillnull
o
Dec. I Jan.
19814-1982
Peb.
Figure 20, Frost Penetration Diagram for Sites 44,46,47'48
~
I
I I
I
I I I
~ ---I I
Location: S. of Eldon Slope faces: West
------ Site 45 - Sericea Lespedeza
. :~: r--------·---·-· r . . -. . - .. - I -1
!
100
50 "",," -~iIIIum
32
0
<>¢o ( )..- I 320 :x 7'\ I p v= _____ Hinilllunl
o
50 Dec. I Jan.
1981 + .- 1982
reb.
Figure 21 , Fro.t Penetration Diagram for Si te 45.
33

Snow Cover Ft.
Frost Depth Ft.
Temp. of
Snow Cover Ft.
Frost Depth Ft.
Temp. of
1.5
1.0
0.5
I '--'- -.'-.'--"-' '-j-- - -- - - - .- ., .
I I
I I
I ., t --.-I I
Location: W. of Kirkwood Slopes facing: East
----------- Site 49 - Fescue - -- Site 51 - Crownvetch
o I ~ »
0.5
1.0
1.5
100
50 32
o
50
1.5
1.0
0.5
o
0 . 5
1.0
1.5
100
I~
i "', " I
I ------- --- ---· ··t ·· i
o
-I I o
I
. HUimIa . '14\ .'~' , 3,1, l ' .... 0 . • ; • rj,' I • < __ • 32°
-. Minim O~
Dec. I Jan.
1981+-1982
Feb.
Figure 22, Frost Penetration Diagram for Sites 49,51.
I I ._-----_ .. ...... _-j"_. - - ----
I I
r -I I
Location: W. of Kirkwood Slopes facing: West
-------- Site 50 - Fescue - - Site 52 - Fescue
-- -- -- Site 53 - Bare Slope
" - I ./.. -I /
I .
M&xiJawa
.~ .'. t'·t . { ,;:..<\, i>.~: i .- 320 50 T ."-' -" . 1::X -',! \ } c Mi.~
o
32
0 --50
Dec. I Jan.
1981 + .- 1982
Feb.
Figure 23, Frost Penetration Diagram for Sites 50,52&53.
34

1.5 ~ I : , I Location, W. of ~irkwood
Slope face., North ---------- Site 54 - Crownvetch ~~~r :::r------"-----'l------- ' .. t-_·
o
0.5
, Frost 1.0 --- - ---- - - - - -- -- -I . -.- . - .. Depth
Ft. 1.5
100
50 Temp. 32
! I
.1Wc1Iwa
'. "14 - ; ... " 0( ' I ' - 320
of
,: 1 Doc. I J.n. • ...
.1'\ c v ., H\ .<.., J • 1I.1JU.Iau
o ---
Snow Cover Ft.
Frost Depth Ft.
Temp. of
1.5
1.0
0.5
o
0.5
1.0
1.5
100
50 32
0
50
1981 + .- 1982
Figure 24, Frost Penetration Diagram for Site 54.
lI
.------- ._---_.-- '-j" - - - - -- -- .,.- .. - .. t I' I I' I
\
t - I
Location: W. of Kirkwood Slope faces: South
___________ Site 55 - Fescue
-I I ,
I : "_1-< MaxilllUlll
" ';;' " .. .. \1, . l, ' ( > . /) e;/ i 32° L --
I~
Dec. I Jan.
1981 + .- 1982
Peb.
Figure 25, Frost Penetration Diagram for Site 55.
35
Minimwa o

Snow Cover Ft.
1.5
1.0
0.5
0
0.5 4-
-----------.-~ ----_. __ ...
I
I
I I
I I
1 -. t
I I I
Location: S. of Sikeston Slope faces: East
---------- Site 56 - Fescue
I I .
~~:: 1.0 r------- -. -. ----r-Ft. 1.5 I
.-- -- ... --1 - . -- .- - - -.. -f . . - - -- --I I
I
100
50 Temp. 32 or
0
50
1.5
Snow 1.0 Cover Ft. 0.5
0
0.5
Froet 1.0 Depth Ft.
1.5
100
50 Temp. ·u
°F 0
50
I I
I I
HuiRNII ''""," \ ' .", ~ • • e . .. • • "-",,. At· ,,',,' c::C:> 0 ·'·· .. I 32° ~ ,,~O A ~ L7"","'-, __ .,\ , ? \. !> . ' .... , j .J; eo ~ H~
o
Dec. I Jan.
1981+-1982
reb.
Figure 26, Frost Penetration Diagram for Site 56.
. I, I ----.-.-- -- ----.-.. ·-t-- - -- -- - .---.- - -- t
I' I I' :
I
I I
I --------.--- ---t- . -- - --- -- · _· --1
Location: S. of Sikeston Slope faces: North
---------- Site 59 - Fescue
, - - ... i · .
I , I
_M&x1DNm
. ' '- - v ' ~C>,,"". • r.. c<:> <"> -.- ~ 320 , - _ .. \ , 7( <.\ -' ,j, 00 ~ _ __ Ki~
o
Dec. I Jan.
1981 + -- 1982
Feb.
Figure 27 , Frost Penetration Diagram for Site 59.
36
1.5
Snow 1.0 Covel' Pt. 0.5
Froet Depth Ft.
Temp. OF
Snow Covel' Pt.
Froet Depth Ft.
Temp. or
0
0.5
1.0
1.5
100
50 32
0
50
1.5
1.0
0.5
o
0.5
1.0
1.5
100
50 32
0
50
---.. -.----~-- .-~ --- - - . -_ .-. ~ . ~ I
I
I I
I
I I
....JI I
I
I
I -------_._-_._._, . -- . - ----- 1 I I
I Dec. I Jan.
1981 ~ 1982
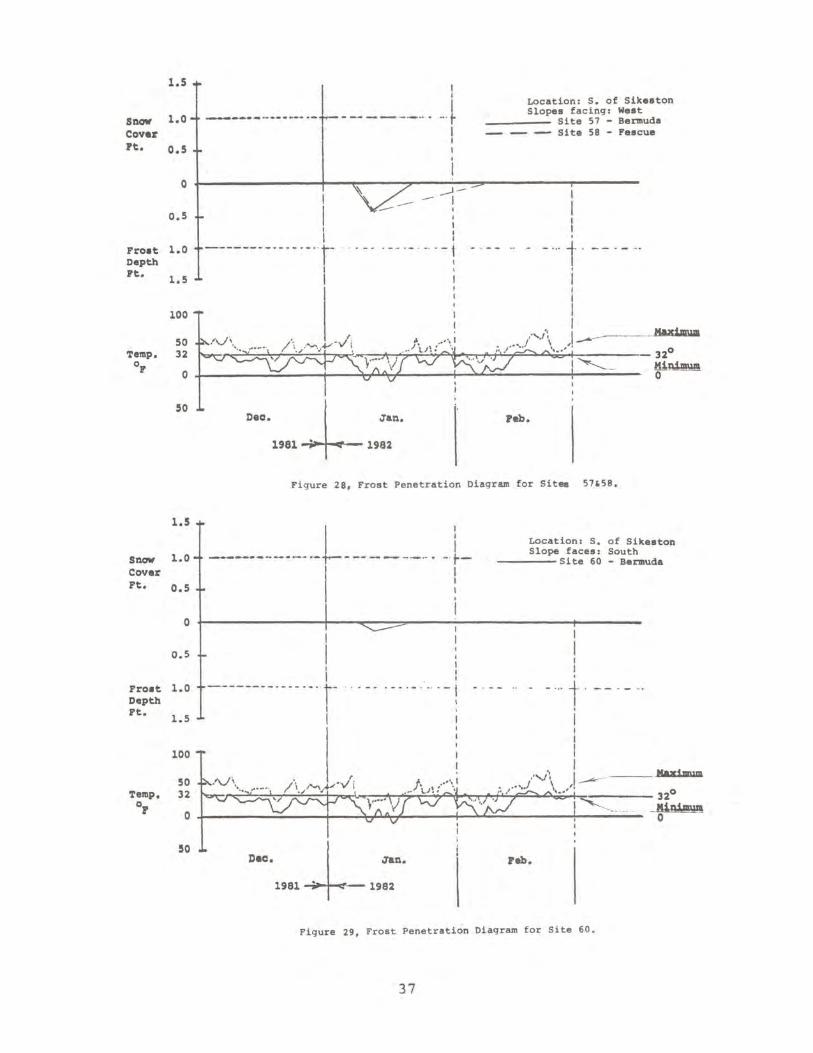
Location: S. of Sikeston Slopes facing: West
Site 57 - Bermuda --- --- Site 58 - Fescue
. -.. ' t -I
I
. - Haxillwa ,''''.1\ 1_.___--
. . ••. j \ / . 320 t , l,o:C> 0"::'; I
!~- - f~
Feb.
Figure 28, Frost Penetration Diagram for Sites 57.58.
----.. _----_.-- .-~. -- - - ----. I I
I ~ - r-
1
I I
I I
I --------------··r-I I
I I I
. -- -- _.-'-1
Location: S. of Sikeston Slope faces: South
----- Site 60 - Bermuda
. . '-' t -I
I
Maximum
~ ,"~,)' ;".1 ~"l ;0\:\" ,'-...... \ 1';' ,J.~·;Ot ~<: ... ,_I.{,",,:::.c> 03:: i <= 32°
Dec. I Jan.
1981 + -- 1982
Peb.
Figure 29, Frost Penetration Diagram for Site 60.
37
M11Wawa o
It is concluded that, within similar climatic zones
and conditions, there was little significant difference
between overall average freezing depths beneath most of the vegetation types studied and even beneath bare ground.
The most notable exception was the much greater freezing depth beneath creeping juniper. The much lesser observed
freezing depth beneath the two sites covered with Sericea
lespedeza deserves further study to determine whether or not this was an anomalous condition.
38

SOIL MOISTURE CONTENTS
Soil moisture content samples were secured in the fall
of 1981 and the spring and fall of 1982 at most of the
sites where frost tube indicators were installed. Samples were obtained at 6 inch intervals to a maximum depth of 30
inches except where prevented by high rock content in the
soils (for example the sites under Sericea lespedeza cover where rocky residual soils severely limited ability to secure samples).
TABU 15
Soil IIol.ture Content. (Wn) By Depth Incr_nt and Slope Expoaure Aver_qed Por All Sit ••
rall, 1911 Sprinq, 19'2 roll. 19.2 Avg_ Wn ., AY9_ tin " Avq. wn "
!!!2!h Por Sl02!. "acinl, Por Sl02!. "acinl Por Sl02!. ,.aclni
_N _ _ 1- _8_ ....!L ~ _ N_ _1- _8 _ ....!L ~ _" _ _ I- _ 5_ _W _ ~
6· 26.5 20.6 20 . 6 23 . 2 23 . 2 30.3 23 . 6 23.7 24 . 5 26 . 0 22 . 3 22 . 0 21. 5 22.3 22 . 2
U· 23.6 21.3 20.6 22.4 22.4 21.1 23 . 1 23 . 7 26 . 4 25 •• 26 . 4 20.4 25.3 23.5 24 . 4
11· 25.6 21.3 20.7 23.4 23 . 4 26 . 0 22 . 5 23 . 1 23.6 24.5 27 . 3 23.7 21. 4 22 . 5 24.4
24· 24.' n.3 20.4 22.5 22.5 25 . 0 21.1 22.7 23.4 23.4 25.3 21.4 23 . ' 24.2 H.O
3D· 23 . 7 22.0 19.' 22.3 22.3 25 . 4 23 . 0 22.5 23.1 23. , 24 . ) 24 . ) 22.7 22.7 23.' II ... 24.' 21. ) 20.4 24 . 4 22 •• 26 . , 22.7 2).1 24.2 24.7 25.5 22.4 2).6 23.0 24.1
All available data were averaged by depth increment for
all slope exposures and vegetation types in Table 15. This
table shows that north and west facing slopes were wettest
and south facing slopes driest. Average moisture contents did not vary greatly by depth increment but were somewhat
higher in the fall in the 12 to l8-inch depth range and
lowest in the spring at the 24 to 30-inch depths. In the spring, soil moistures had increased at all depths, but
were highest toward the surface.
All moisture contents were averaged for each area and vegetation type, in Table 16, for each season sampled and
by direction of slope exposure. Average plasticity indexes
were also included to aid in interpretation of the significance of the indicated values. For example, the two sites in
Area 5 had abnormally low moistures which can be attributed
39

'l'AllLII 11
Averaq_ &011 Molature contant..
Pall 1"1 Sprln9 un Pall un Veqatat.lon 11"9. SIp:! Facies SloDe raclni Slf! PaciAS
!!!!! !D!! ..!L ..L __ .L ..L ..L I .L ..L ..L __ .L ..L Orchard. 17.] 11.1 21.1 2].0 32.9 22.1 21.2 2].5 n . 1 25 .• 21.6 ......
1 •• .cue 11.1 19.' 27.9 22 . 7 U.5 22.6 1 Crownvetch 22.6 n.' 26 . 5 14.6 30.' 15 . ] 1 lare 25 . ] 2 •. ] 31.' 32.3 2 Orchard H.O 25.2 n.5 25.7 11.2 2'.1 25.9 21.5 2'. , ]1. 0 25 . ' ll.9 n.o 2 '.KU. n.5 24.2 30.1 26.9 2 Crownvetch n.1 21.0 25.2 23.2 n.o n.' 20.7 2 Boneyauek 1. 23.6 25.2 n.2 30.1 26.1 25 . ' 20 . 7 2 Ian 20.0 n.9 26.2 H . I 3 F •• cue 20.4 19 . ' n.1 20.9 ] Crownvetch 11.7 n.1 23.1 19 . 1 3 Cr •• p. Jun. 11.0 n.o 20.7 n.' 23.7 21 . 1 24.0 3 ieI'. Lea. n •• 11. 5 37.7 2'.2 n . l 21.9 3 lar. 1 ••• 27.4 27 . 1 26 .5 n.' 22 •• 21.0 21. , ll.5 26.4 4 •• .cue 20.3 25.7 25.2 19 • • 27. ] 1l . 5 n.o ll.' ll.7 25.0 4 Crown •• tch 20. ] U.6 24 •• n.1 26.2 25 .• H.7
• a.r. ll . l 19.1 21.5 n.o 5 ' •• cue lIP 10.7 10 . 7 11.' 1l.9 9 .• 5 •• 5 .. raoda lIP 1.3 7.5 ••• 10 •• ..6 9.1
._ P1.,..r. 1
to the non-plastic sandy soils. Within soils of generally
similar plasticity, the sites with Sericea lespedeza which
has high moisture demand only during the summer growing
season, had the highest moisture contents (and also experienced
the least depth of freezing) while the creeping juniper sites
had the lowest moistures (and also experienced the greatest
freezing depth, probably due to continued moisture demand
during the winter) • With the foregoing exceptions, differences
in moisture contents associated with the various vegetation types does not appear to be significant •
•
40

REFERENCES
1. Missouri Highway and Transportation Department, Study
No. 74-1, "Development of Design Criteria for Cut Slopes in Loess", April, 1978.
2. University of Missouri, College of Agriculture, Agriculture Experiment Station Progress Report No. 12, October, 1950.
3. American Society for Testing and Materials, Annual
Book of ASTM Standards, Volume 04.08, Soil, Rock: Building Stones, March 1983, Standard Test Method 0-1586.
4. National Oceanic and Atmospheric Administration, Environmental Data Reporting Service, National Climatic
Center, Asheville, N. C.
41


1~~WI!i~li~I~I~~ : . RD0009213
- ,
,. .:.....
f J . . ' ',. . ,
,- ~ -. .... ', ~"': . . ;. If ~ ;.., r', ,,::.. •
. :'
':. : \,' '" ", r ~ :,:. 'C, " " ",', " :." ,: ... , • - ': !.", .'
" . . ,
. .' . , ."
. ", ~ ..' :
, , "
. . . .-'~ .' I .
I'