resource - weizmann institute of science
TRANSCRIPT
Toward Rigorous Comprehension of BiologicalComplexity: Modeling, Execution, and Visualizationof Thymic T-Cell MaturationSol Efroni,1,2,3 David Harel,1 and Irun R. Cohen21Computer Science Department and 2Department of Immunology, Weizmann Institute of Science, Rehovot, Israel
One of the problems biologists face is a data set too large to comprehend in full. Experimenters generate data at anever-growing pace, each from their own niche of interest. Current theories are each able, at best, to capture andmodel only a small part of the data. We aim to develop a general approach to modeling that will help broadenbiological understanding. T-cell maturation in the thymus is a telling example of the accumulation of experimentaldata into a large disconnected data set. The thymus is responsible for the maturation of stem cells into mature Tcells, and its complexity divides research into different fields, for example, cell migration, cell differentiation,histology, electron microscopy, biochemistry, molecular biology, and more. Each field forms its own viewpoint andits own set of data. In this study we present the results of a comprehensive integration of large parts of this data set.The integration is performed in a two-tiered visual manner. First, we use the visual language of Statecharts, whichmakes specification precise, legible, and executable on computers. We then set up a moving graphical interface thatdynamically animates the cells, their receptors, the different gradients, and the interactions that constitute thymicmaturation. This interface also provides a means for interacting with the simulation.
[Supplemental material is available online at www.genome.org and at www.wisdom.weizmann.ac.il/sol/sysbio2002/.]
What Do Biologists Try to Understand?Biologists aim at understanding biological systems. Motivationvaries from a desire to cure disease to pure fascination with livingsystems. The mark of biological systems is their complexity.Physicists have been the pioneers in trying to understand natureby reducing physical systems to component parts, which theyanalyze in detail. The biological equivalent has been to reducecomplex organisms to their component cells and molecules andto analyze their behavior (Efroni and Cohen 2002, 2003). Biolo-gists have taken up this challenge, and are in the process of cata-loging the component parts of organisms at various scales. How-ever, biological systems seem to resist this “understandingthrough reduction” for the following two reasons: (1) living sys-tems are more complex than physical systems, and (2) in dissect-ing the molecular data, we remain far away from understandingthe integrated living system.
Many groups have used mathematical tools to gain a betterunderstanding of immunological data (for review, see Hood et al.1980; Mehr et al. 1997, 1998; Gett and Hodgkin 2000; Hershberget al. 2001; Bergmann et al. 2002; De Boer et al. 2003; Kesmir andDe Boer 2003; Louzoun et al. 2003). The approach of thesegroups, however, differs fundamentally from ours in ways thatwill become apparent as we progress. Some of the differenceshave to do with our use of object-oriented visual specifications,and extensive run-time experimentation and visualization.
In this study, we use specific analytical data to construct anintegrated dynamic representation. We carry out the integrationvia two interwoven facets. The first calls for specifying the dataset in a way that makes it amenable to execution on a computer.The second generates an embodiment of the execution, repre-senting the objects that are explicitly specified in the first facet,
cells, and molecules. The end result is a moving visual simulationof the biological process—intuitive, visual, and interactive.
To form the first facet, a detailed description of the relevantobjects is prepared. The task of collecting the data and translatingit into a well-defined, executable specification is complex in it-self. Scientific papers—the sources of the data—provide the dataset in text, tables, and figures that are difficult to translate intoother media. The language spoken in biological papers is usuallycomprehensible only to the specific field of research. Our goalhere is to translate this data set into a generic and usable me-dium, which we refer to as the specification (or sometimes as theset of specifications).
The specifications derived from the actual data are used asinstructions that guide the simulation. The cellular and molecu-lar agents comprising the system refer, as it were, to these in-structions to know how to respond to stimuli. The stimuli may beinteractions with other cells, interactions with other molecules,or various internal events, such as the passage of time.
The task of specifying such a large data set needs its ownspecial tools (for review, see Meier-Schellersheim 1999). Withoutsuch tools, it is difficult to control the immense set of data. Thetool we use for specification (and, as we will show later, also forintegration) is the language of Statecharts (Harel 1987), a visualformalism invented to aid in the design of complex man-madereactive systems, and later proposed as a viable tool for specifyingbiological systems in (N. Kam, I.R. Cohen, and D. Harel, in prep.).Below, we shall discuss the reasons for using this particular lan-guage. We begin here by detailing the problems mentionedabove, as they arise in our model biological system—the thymus.
The Thymus as an Example of Disjoint ResearchStem cells arrive at the thymus from the bone marrow, and thedeveloping T cells go through a series of interactions in differentlocations inside the thymus. The processes that a single cell goesthrough take about 2 wk (Anderson and Jenkinson 2001), during
3Corresponding author.E-MAIL [email protected]; FAX 972-8-9342945.Article and publication are at http://www.genome.org/cgi/doi/10.1101/gr.1215303.
Resource
13:2485–2497 ©2003 by Cold Spring Harbor Laboratory Press ISSN 1088-9051/03 $5.00; www.genome.org Genome Research 2485www.genome.org
which time, the cell may proliferate into 106 offspring cells (Eger-ton et al. 1990). The thymic environment is divided anatomicallyinto lobes and lobules, and the lobules are further divided intothe areas of the cortex and the medulla. Because the thymicoutput of mature T cells is the basis of the immunological rep-ertoire, the physiological function of the thymus is relevant tothe study of many diseases, specifically AIDS and autoimmunediseases (Holoshitz et al. 1985; Cohen 2000; Douek et al. 2001,2002).
Different agents constitute the thymus; epithelial cells forma mesh throughout the organ and interact with developing Tcells to activate and regulate many of the processes needed fortheir maturation (Anderson and Jenkinson 2001; Germain 2002).Epithelial cells are separated into different subtypes by molecularmarkers or by anatomical location (Von Gaudecker et al. 1997).Macrophages perform mainly housekeeping tasks to clear thethymus of dead cells (Platt et al. 1996). Cytokines are the mol-ecules responsible for signaling between the cells (Khaled andDurum 2002). Chemokines are molecules that signal cell move-ment along gradients (Norment and Bevan 2000; Zlotnik andYoshie 2000). Short segments of proteins, called peptides, com-bine with other molecules (major histocompatibility molecules,MHC) to induce different T-cell selection events (e.g., Nanda andSercarz 1995; Yasutomo et al. 2000). Thymocytes (T cells in thethymus) express many different surface molecules that serve asinteractions with other cells and molecules. Epithelial cells, mac-rophages, cytokines, chemokines, peptides, thymocytes, and cellmarkers are all further divided into dozens of subgroups, whichwe need not detail here.
The thymic environment, loaded with these different ob-jects, presents a challenge to many researchers from differentfields who have detailed knowledge of some of its parts, but yetwish to comprehend the whole. Consider three scales of analy-sis—molecules, cells, and the whole organ.
MoleculesThe molecules most relevant for researchers of the thymus, as wehave said, are chemokines, cytokines, and receptors on the cellsurface. Specialists in cell migration, for example, study how che-mokines cause cell migration. They measure chemokine expres-sion levels in different areas of the thymus, on different cells ofthe thymic stroma, and record the responses of thymocytes dur-ing different stages of their development. Biophysicists study theinteractions between chemokine receptors and their chemokineligands at the atomic level. Other researchers study cytokines andtheir influences on events in thymic development. Cytokines arethe main vehicle for signaling between cells, and, therefore, areimportant in almost every process. Other molecules allow thy-mocytes to bind to other cells and to the extra-cellular matrix(ECM).
Other fields of research look at these molecules in a differentway. In microscopy, molecules are used as markers to distinguishbetween different cells under the microscope. Researchers in sig-nal transduction look at the same molecules to see how theyinfluence a cascade of events inside the cell.
CellsThe questions asked at the cellular level are as follows. Whichcells respond to which stimuli? How many cells of each type arein each thymic area? How many cell types are in various areas?What are the events that will drive a cell toward one fate and notanother? What stages does a cell go through during develop-ment? Where is the cell during different stages of development?What are the paths two cells follow when they interact? Whichselection events are the most influential? How does mutationinfluence cell survival?
OrganResearchers looking at the thymus as one whole often see theorgan as a black box. Their questions include the following:What is the number of cells the thymus produces under specificconditions? How many cells enter the thymus every day/hour/minute? What are the effects of removing the thymus (thymec-tomy)? Why does the thymus diminish in size with age? Whatare the influences of diseases on the thymus, and what is theinfluence of the thymus on disease? Are there mathematical for-mulas that can recapture thymic output behavior?
However, the thymus is one whole. Disjointed research par-cels the same molecules and cells into separate fields, and pro-duces data that must be joined if we are to ever understand T-cellmaturation in the whole organ. Currently, there is no way tointegrate this broad spectrum of different types of data into oneview that would be as coherent as the biological environmentthat produced them. The work we present here is aimed at suchintegration. We take the data generated by reductionist biologyand integrate them into a specification model using Statecharts.We then execute the model. The results of the execution are usedto drive an animated visual image of cells and molecules andtheir interactions. This type of representation is friendly to hu-man minds, and yet, does not sacrifice mathematical precision.Moving cells and molecules are interactive with the thoughts ofthe user, and the format provides the user with tools to choosespecific views and to mediate particular types of execution.
Moreover, we have designed representation to express dif-ferent theories. Immunology, like other complex and incom-pletely characterized fields, uses theories to integrate both knownand unknown information. Theories are proposed scenarios. Ourmodel and simulation can accommodate different theories.Whenever an interaction takes place, the user (or the simulationitself) can choose one theory from a collection of available theo-ries and instantiate that particular theory to its completion in thesimulation. The instantiated theory then sends conclusions backto the simulation. The user can choose a particular theory eitherduring run-time or during specification. The outcomes of varioustheories can be compared and contrasted.
RESULTS
Specifying the Thymus With Statecharts
States and Transitions as Descriptors of Cell BehaviorFor specification and modeling, we use the language of State-charts, a visual language invented by David Harel in 1984 (Harel1987; Harel and Politi 1998) to assist in the development of theavionics system of a new aircraft. Statecharts has since becomethe subject of research for many groups (Wieringa 2003) as themain formalism used to specify the behavior of complex reactivesystems in a variety of industries, and has been adopted as thecentral medium for describing behavior in the Unified ModelingLanguage (UML), a world standard for object-oriented specifica-tion and design of systems (Kobryn 1999).
Behavior in Statecharts is described using states and eventsthat cause transitions between states. States may contain sub-states, thus enabling description at multiple levels, and zoomingin and zooming out between levels. States may also be dividedinto orthogonal states, thus modeling concurrency, allowing thesystem to reside simultaneously in several different states. A cell,for example, may be described orthogonally as expressing severalreceptors, no receptors, or any combination of receptors at dif-ferent stages of the cell cycle and in different anatomical com-partments. Statecharts are rigorous and mathematically well de-fined, and are, therefore, amenable to execution by computers.Several tools have been built to support Statecharts-based mod-
Efroni et al.
2486 Genome Researchwww.genome.org
eling and execution, and to enable automatic translation fromstatecharts to machine code. We use a tool called Rhapsody(Harel and Gery 1997), commercially available from I-Logix, Inc.
It is not intuitively obvious that cells and molecules may benaturally described by states and transitions. In fact, there is noconsensus on how one should describe cells. However, immu-nologists, whether they know it or not, do use states to describecells. A cell is usually described by the collection of markers itexpresses on its surface (Sant’Angelo et al. 1998). For example, aT cell is called double negative when neither of the CD4 and CD8molecules is expressed. A human T cell is referred to as a memorycell when it expresses a molecule called CD45RO+ (Dutton et al.1998) and as a suppressor cell when it coexpresses CD25 and CD4without being activated (Cohen and Wekerle 1973; Mor et al.1996; Elias et al. 1999; Coutinho et al. 2001; Shevach 2002).Immunologists call these molecules markers, but we refer tothem, during specification, as orthogonal states of the cell. Onemay object to describing cells according to markers that are notchemically accurate descriptions. However, we use the notation,as it is the basis of most immunological reports and immuno-logical terminology.
In Statecharts, transitions take the system from one state toanother. In cell modeling, transitions are the result of biologicalprocesses or the result of user intervention. A biological processmay be the result of an interaction between two cells, or betweena cell and various molecules.
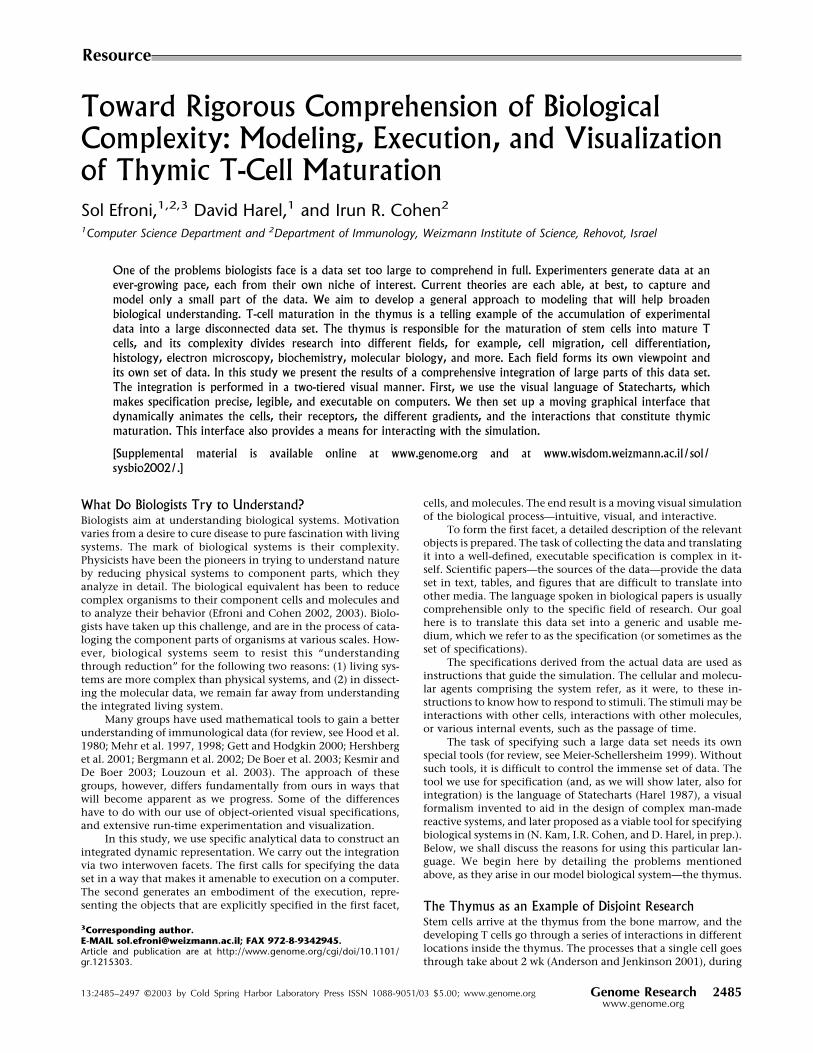
Dealing With a Large Data SetStatecharts provide a controllable way to handle the enormousdata set of cell behavior by providing us with the ability tospecify separation into orthogonal states and by allowing transi-tions. For example, see Figure 1, which shows the statecharts of asingle thymocyte. The thymocyte is a very complicated agent. Toavoid clutter, the figure does not include all states and transi-tions, or all of the titles of the states it shows. By way of illustra-tion, we have separated some of the orthogonal states and haveindicated some of their sub-statecharts.
Examples
Example 1: Modeling Thymocyte MovementTo demonstrate the way in which we convert data into specifi-cation, we shall follow the way thymocytes move in the thymus.Thymocytes receive signals from different cells in different loca-tions. To make sure signals are received at the right time is actu-ally to make sure that the right thymocyte is in the right place atthe right time. The molecules responsible for directing cells alonga gradient path are called chemokines. We focus on the role ofthe following four chemokines: CCL25 (TECK), CXCL12 (SDF),CCL22 (MDC), and CCL21 (SLC). Thymocytes search their envi-ronment for chemokines and move according to the chemokinegradient. We should therefore make sure that (1) the simulatinggradient is correct, and (2) the thymocyte responds only to gra-dients it can currently interact with. To find out the right gradi-ent, we survey the scientific literature to learn which chemokineis expressed where, and at what level. This information is avail-able from different studies, ranging from papers whose subject isone specific chemokine and its expression in the thymus (Zait-seva et al. 2002), to papers dealing with one specific area in thethymus and the expression of different chemokines in that area(e.g., Chantry et al. 1999), to papers reviewing chemokine ex-pression patterns in the thymus as a whole (e.g., Savino et al.2002).
We integrate the chemokine data set to a four-dimensionallattice, in which each dimension stands for the concentration ofone chemokine. Thymocytes first find out which of the gradientsthey should probe (we will explain how below), calculate therelevant gradient, and finally move.
To find which of the gradients a thymocyte may now probe,we use the notion, presented in the previous section, of cell typesas cell states. In our model (as in immunology), we distinguishbetween cells according to surface markers. We ask which gradi-ents are relevant at some specific stage. In other words, given acell in a state characterized by the expression of certain markersand given a certain gradient, where will the cell move?
The scientific literature provides seven cell markers as rel-
Figure 1 A pseudo statechart of a thymocyte. The three-dimensional representation is our way of representing statecharts from different levels andshowing their interrelationships.
Toward Rigorous Comprehension
Genome Research 2487www.genome.org
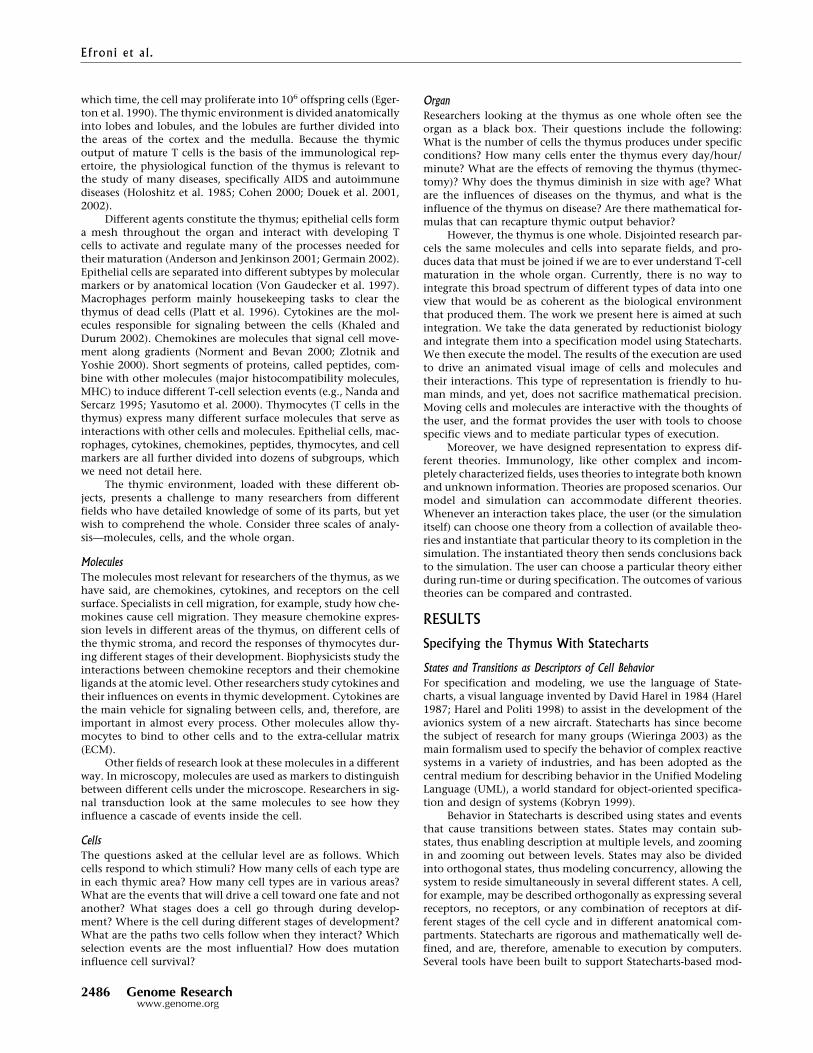
evant for gradient decisions. Five of them may be either ex-pressed or unexpressed, and two of them have an intermediatelevel of expression termed “low”. The overall number of relevantstates is therefore 25 � 32 = 288. At run time, a cell scans throughthese 288 states, finds the one it is in, and determines whichchemokines it may respond to. Our job during specification is togo through these 288 states, find an equivalent in scientific pa-pers and provide the biological meaning. During simulation, weuse a decision tree to scan through the collection of possiblestates (Fig 2). Decisions (leafs of the last row) in the tree corre-spond to cell states. When the scan reaches a conclusion (a leaf),the simulation generates events that tell the cell to which che-mokine gradients it may now respond.
Example 2: Modeling Epithelial CellsAnother example of specification is how we include epithelialcells in the model. Epithelial cells in the thymus are stationary;yet their behavior is reactive and changes continuously in re-sponse to various stimuli. The literature divides epithelial cellsinto many types. Because most of the work has been done usingmicroscopy, the cell types are usually separated by their locationand their size. To this microscopic division, we add temporalbehavior, which is the expression of different chemokines andcytokines in response to different events. For example, medullaryepithelial cells have shorter processes (arms) than other epithelialcell and are usually no longer than 30 µm in length. Medullaryepithelial cells are considered the main elements in a processcalled negative selection, and, therefore, have been measuredextensively for levels of expression of MHC class I and class IImolecules.
We characterize epithelial cells as having not only a loca-tion, but also a structure. The structure is the cell processes(arms). As thymocytes and other cells move through the thymus,they interact with the processes of epithelial cells.
Specifying InteractionWhen two cells meet during run time, we need directions to tellus how their interaction should proceed. Researchers do not al-ways know all the details of the interaction, and so they usedifferent hypotheses to suggest possible outcomes of the interac-tion. We refer to the hypotheses and their suggested outcomes astheories, and outline them as objects with a behavior specifiedwith Statecharts. Figure 3, for example, is the statechart of whatwe refer to as the classical epithelial cell—T-cell interaction.When we choose this theory, an instance of the theory is createdevery time a T cell and an epithelial cell meet.
The statecharts of the instance are then executed, and ac-cording to different parameters, a conclusion of this interactionis reached. The conclusion may be the death of the T cell, in-structions to express one or another marker, instructions to ex-press cytokines, instructions to proliferate, and more. Eventually,the instance reaches the state marked with “T”, which means theinstance is terminated and will receive no further references.When another interaction of the same kind takes place, anotherinstance of the same kind will be instantiated. Notice that manyinstances may coexist as the result of many thymocyte-epithelialcell interactions occurring at the same time. According to a par-ticular theory, a single epithelial cell may interact with manydifferent T cells.
Using Statecharts to Communicate TheoriesThe diagrammatic nature of Statecharts makes them legible toscientists from different disciplines. To describe a theory withstatecharts, we transform a description given in text and nonfor-mal diagrams into a rigorous, diagrammatic language. The result-ing description is easy to communicate. Figure 3, mentionedabove, shows one such theory—the interaction of a T cell and anepithelial cell as described classically in textbooks (Janeway2001).
Figure 2 The 288 final nodes represent the final decisions of a thymocyte regarding which chemokine it may respond to. (The graph representingthe tree was built with the DiGraph drawing algorithm described in Carmel et al. (2002).
Efroni et al.
2488 Genome Researchwww.genome.org

Running TheoriesBy regarding theory as a separate component, we can choose toplug in or unplug a theory on demand. We build a collection ofavailable theories and choose one of them. The choice of whichtheory should be instantiated may be made before we start thesimulation. For example, we can decide that all interactions be-tween thymocytes and cortical epithelial cells should follow onetheory, whereas all other interactions follow a different theory. Achoice of theory may also be made at run time, and the user canchoose to switch between theories. The choice may also be madeat run time by the simulation itself, when the right conditionsdevelop. Theory, in our simulation, thus becomes interchange-able during the run. The simulation is only committed to thedata, not to its interpretation.
The Front-End: An Interactive AnimationWhile the simulation runs, a front-end to its activities is gener-ated and presented to the user. We have built the front-end as aninteractive visual interface that embodies cells and molecules.
The user can actually see what the cells and molecules are doing.The architecture to achieve this representation is described in theMethods section.
The General SetupThe representation is a large collection of Flash movie clips thatare the embodiment of agents and their states as they appear inthe simulation running in Rhapsody. While the simulation isgenerating events and is changing the properties of the interact-ing agents, the simulation sends information about thesechanges to generate the Flash movie. The animation is generatedon the fly. The animation is neither an end result of the simula-tion, processed at post-run, nor a preprogrammed movie. It is aliving image capturing the look and feel of the physical image ofthe simulated cells and molecules during run-time.
Movie M1 in the supporting online material shows a simu-lation during run-time. Briefly, we show an example of the in-teraction between the animation, the simulation, and the user intext and figures. Figure 4 gives a high-level view of a lobule at
Figure 3 A theory of interactions between thymic epithelial cells and thymocytes presented as a statechart.
Toward Rigorous Comprehension
Genome Research 2489www.genome.org
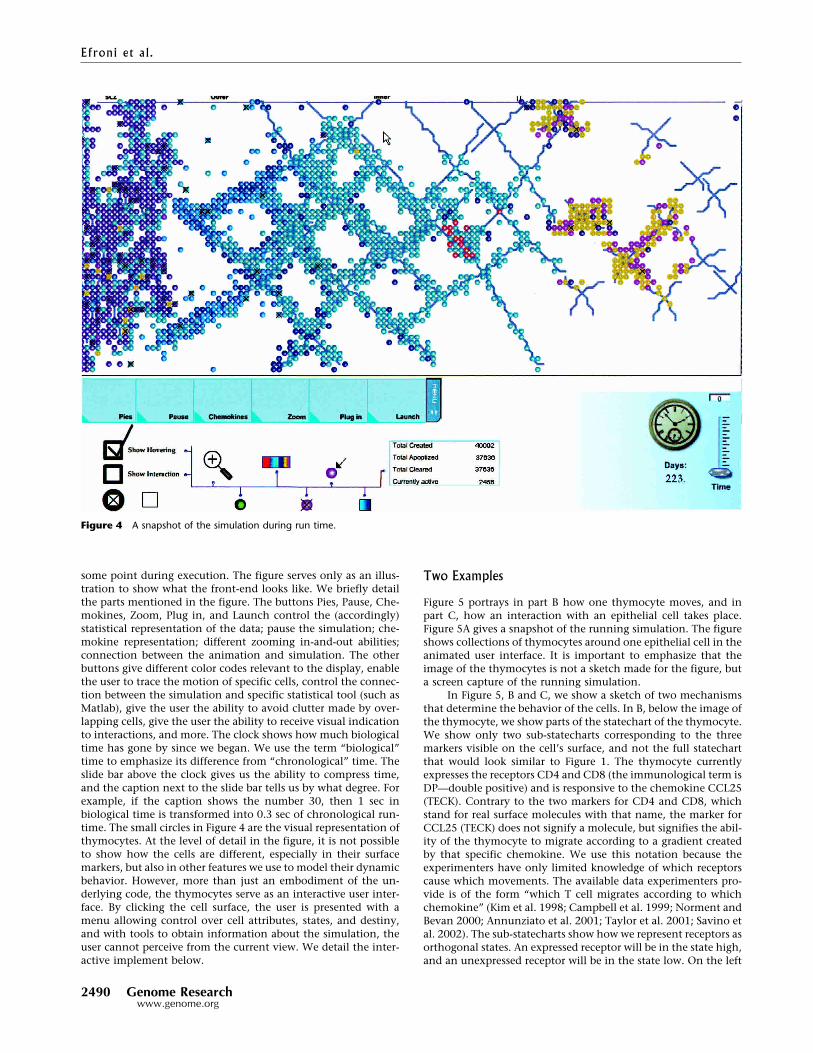
some point during execution. The figure serves only as an illus-tration to show what the front-end looks like. We briefly detailthe parts mentioned in the figure. The buttons Pies, Pause, Che-mokines, Zoom, Plug in, and Launch control the (accordingly)statistical representation of the data; pause the simulation; che-mokine representation; different zooming in-and-out abilities;connection between the animation and simulation. The otherbuttons give different color codes relevant to the display, enablethe user to trace the motion of specific cells, control the connec-tion between the simulation and specific statistical tool (such asMatlab), give the user the ability to avoid clutter made by over-lapping cells, give the user the ability to receive visual indicationto interactions, and more. The clock shows how much biologicaltime has gone by since we began. We use the term “biological”time to emphasize its difference from “chronological” time. Theslide bar above the clock gives us the ability to compress time,and the caption next to the slide bar tells us by what degree. Forexample, if the caption shows the number 30, then 1 sec inbiological time is transformed into 0.3 sec of chronological run-time. The small circles in Figure 4 are the visual representation ofthymocytes. At the level of detail in the figure, it is not possibleto show how the cells are different, especially in their surfacemarkers, but also in other features we use to model their dynamicbehavior. However, more than just an embodiment of the un-derlying code, the thymocytes serve as an interactive user inter-face. By clicking the cell surface, the user is presented with amenu allowing control over cell attributes, states, and destiny,and with tools to obtain information about the simulation, theuser cannot perceive from the current view. We detail the inter-active implement below.
Two Examples
Figure 5 portrays in part B how one thymocyte moves, and inpart C, how an interaction with an epithelial cell takes place.Figure 5A gives a snapshot of the running simulation. The figureshows collections of thymocytes around one epithelial cell in theanimated user interface. It is important to emphasize that theimage of the thymocytes is not a sketch made for the figure, buta screen capture of the running simulation.
In Figure 5, B and C, we show a sketch of two mechanismsthat determine the behavior of the cells. In B, below the image ofthe thymocyte, we show parts of the statechart of the thymocyte.We show only two sub-statecharts corresponding to the threemarkers visible on the cell’s surface, and not the full statechartthat would look similar to Figure 1. The thymocyte currentlyexpresses the receptors CD4 and CD8 (the immunological term isDP—double positive) and is responsive to the chemokine CCL25(TECK). Contrary to the two markers for CD4 and CD8, whichstand for real surface molecules with that name, the marker forCCL25 (TECK) does not signify a molecule, but signifies the abil-ity of the thymocyte to migrate according to a gradient createdby that specific chemokine. We use this notation because theexperimenters have only limited knowledge of which receptorscause which movements. The available data experimenters pro-vide is of the form “which T cell migrates according to whichchemokine” (Kim et al. 1998; Campbell et al. 1999; Norment andBevan 2000; Annunziato et al. 2001; Taylor et al. 2001; Savino etal. 2002). The sub-statecharts show how we represent receptors asorthogonal states. An expressed receptor will be in the state high,and an unexpressed receptor will be in the state low. On the left
Figure 4 A snapshot of the simulation during run time.
Efroni et al.
2490 Genome Researchwww.genome.org
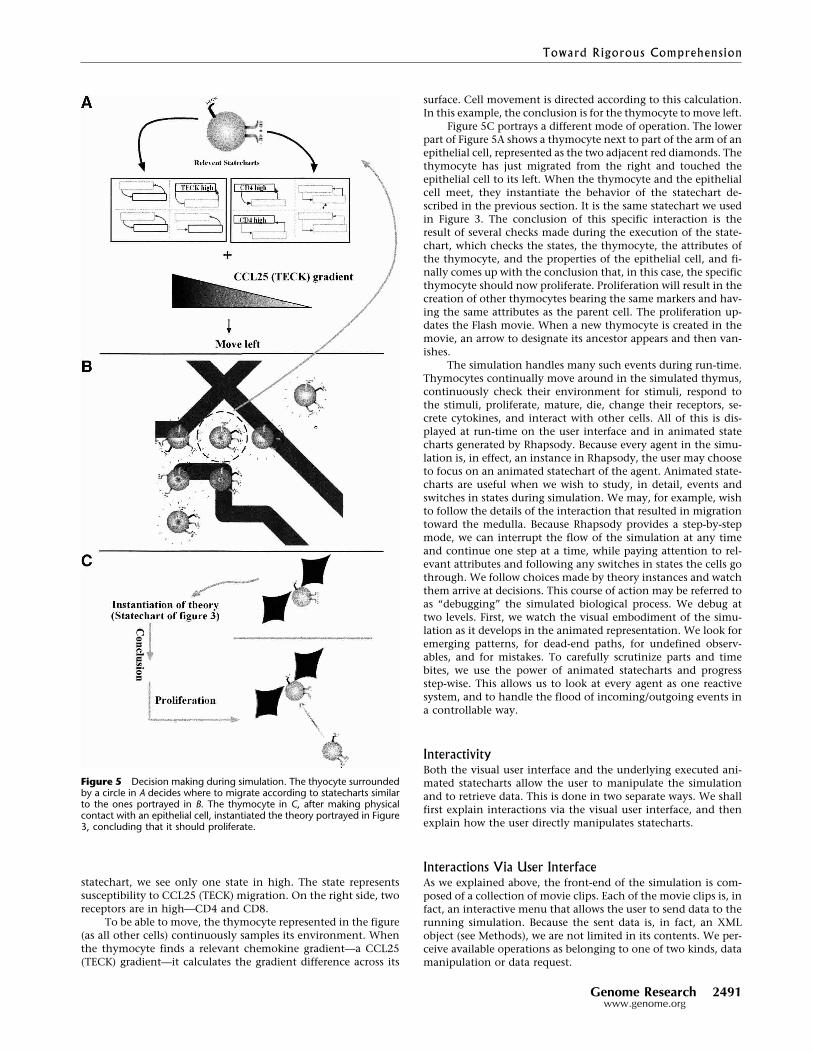
statechart, we see only one state in high. The state representssusceptibility to CCL25 (TECK) migration. On the right side, tworeceptors are in high—CD4 and CD8.
To be able to move, the thymocyte represented in the figure(as all other cells) continuously samples its environment. Whenthe thymocyte finds a relevant chemokine gradient—a CCL25(TECK) gradient—it calculates the gradient difference across its
surface. Cell movement is directed according to this calculation.In this example, the conclusion is for the thymocyte to move left.
Figure 5C portrays a different mode of operation. The lowerpart of Figure 5A shows a thymocyte next to part of the arm of anepithelial cell, represented as the two adjacent red diamonds. Thethymocyte has just migrated from the right and touched theepithelial cell to its left. When the thymocyte and the epithelialcell meet, they instantiate the behavior of the statechart de-scribed in the previous section. It is the same statechart we usedin Figure 3. The conclusion of this specific interaction is theresult of several checks made during the execution of the state-chart, which checks the states, the thymocyte, the attributes ofthe thymocyte, and the properties of the epithelial cell, and fi-nally comes up with the conclusion that, in this case, the specificthymocyte should now proliferate. Proliferation will result in thecreation of other thymocytes bearing the same markers and hav-ing the same attributes as the parent cell. The proliferation up-dates the Flash movie. When a new thymocyte is created in themovie, an arrow to designate its ancestor appears and then van-ishes.
The simulation handles many such events during run-time.Thymocytes continually move around in the simulated thymus,continuously check their environment for stimuli, respond tothe stimuli, proliferate, mature, die, change their receptors, se-crete cytokines, and interact with other cells. All of this is dis-played at run-time on the user interface and in animated statecharts generated by Rhapsody. Because every agent in the simu-lation is, in effect, an instance in Rhapsody, the user may chooseto focus on an animated statechart of the agent. Animated state-charts are useful when we wish to study, in detail, events andswitches in states during simulation. We may, for example, wishto follow the details of the interaction that resulted in migrationtoward the medulla. Because Rhapsody provides a step-by-stepmode, we can interrupt the flow of the simulation at any timeand continue one step at a time, while paying attention to rel-evant attributes and following any switches in states the cells gothrough. We follow choices made by theory instances and watchthem arrive at decisions. This course of action may be referred toas “debugging” the simulated biological process. We debug attwo levels. First, we watch the visual embodiment of the simu-lation as it develops in the animated representation. We look foremerging patterns, for dead-end paths, for undefined observ-ables, and for mistakes. To carefully scrutinize parts and timebites, we use the power of animated statecharts and progressstep-wise. This allows us to look at every agent as one reactivesystem, and to handle the flood of incoming/outgoing events ina controllable way.
InteractivityBoth the visual user interface and the underlying executed ani-mated statecharts allow the user to manipulate the simulationand to retrieve data. This is done in two separate ways. We shallfirst explain interactions via the visual user interface, and thenexplain how the user directly manipulates statecharts.
Interactions Via User InterfaceAs we explained above, the front-end of the simulation is com-posed of a collection of movie clips. Each of the movie clips is, infact, an interactive menu that allows the user to send data to therunning simulation. Because the sent data is, in fact, an XMLobject (see Methods), we are not limited in its contents. We per-ceive available operations as belonging to one of two kinds, datamanipulation or data request.
Figure 5 Decision making during simulation. The thyocyte surroundedby a circle in A decides where to migrate according to statecharts similarto the ones portrayed in B. The thymocyte in C, after making physicalcontact with an epithelial cell, instantiated the theory portrayed in Figure3, concluding that it should proliferate.
Toward Rigorous Comprehension
Genome Research 2491www.genome.org
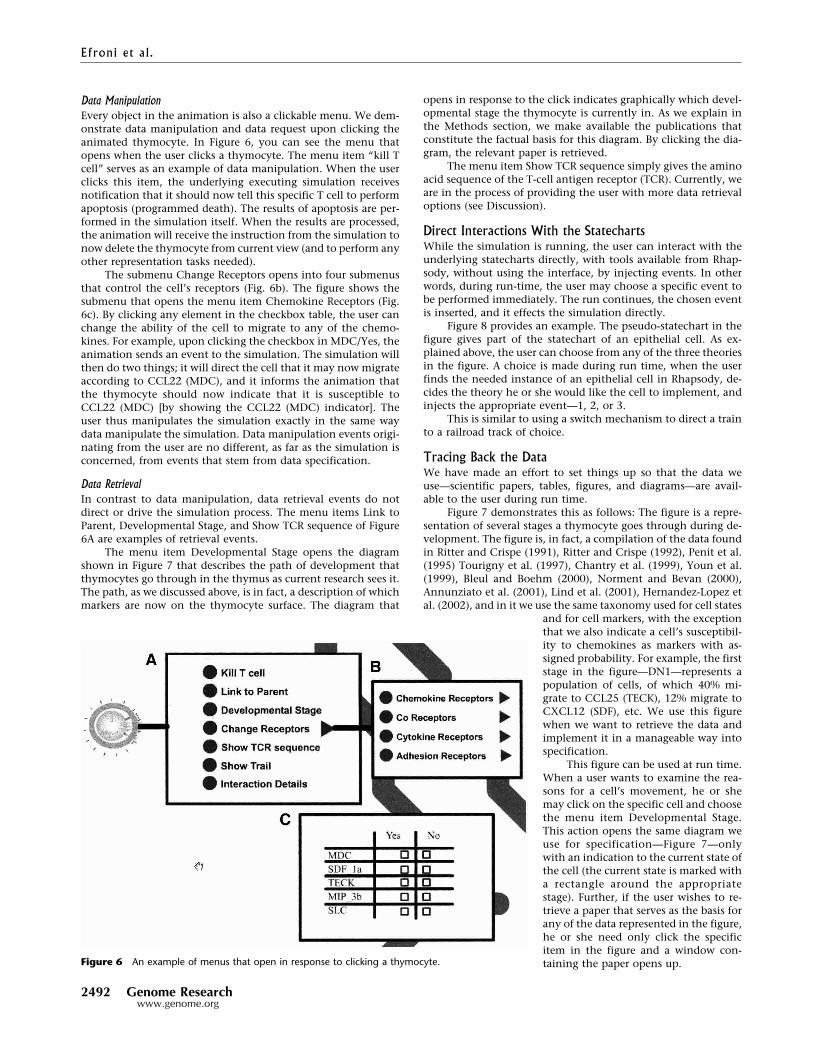
Data ManipulationEvery object in the animation is also a clickable menu. We dem-onstrate data manipulation and data request upon clicking theanimated thymocyte. In Figure 6, you can see the menu thatopens when the user clicks a thymocyte. The menu item “kill Tcell” serves as an example of data manipulation. When the userclicks this item, the underlying executing simulation receivesnotification that it should now tell this specific T cell to performapoptosis (programmed death). The results of apoptosis are per-formed in the simulation itself. When the results are processed,the animation will receive the instruction from the simulation tonow delete the thymocyte from current view (and to perform anyother representation tasks needed).
The submenu Change Receptors opens into four submenusthat control the cell’s receptors (Fig. 6b). The figure shows thesubmenu that opens the menu item Chemokine Receptors (Fig.6c). By clicking any element in the checkbox table, the user canchange the ability of the cell to migrate to any of the chemo-kines. For example, upon clicking the checkbox in MDC/Yes, theanimation sends an event to the simulation. The simulation willthen do two things; it will direct the cell that it may now migrateaccording to CCL22 (MDC), and it informs the animation thatthe thymocyte should now indicate that it is susceptible toCCL22 (MDC) [by showing the CCL22 (MDC) indicator]. Theuser thus manipulates the simulation exactly in the same waydata manipulate the simulation. Data manipulation events origi-nating from the user are no different, as far as the simulation isconcerned, from events that stem from data specification.
Data RetrievalIn contrast to data manipulation, data retrieval events do notdirect or drive the simulation process. The menu items Link toParent, Developmental Stage, and Show TCR sequence of Figure6A are examples of retrieval events.
The menu item Developmental Stage opens the diagramshown in Figure 7 that describes the path of development thatthymocytes go through in the thymus as current research sees it.The path, as we discussed above, is in fact, a description of whichmarkers are now on the thymocyte surface. The diagram that
opens in response to the click indicates graphically which devel-opmental stage the thymocyte is currently in. As we explain inthe Methods section, we make available the publications thatconstitute the factual basis for this diagram. By clicking the dia-gram, the relevant paper is retrieved.
The menu item Show TCR sequence simply gives the aminoacid sequence of the T-cell antigen receptor (TCR). Currently, weare in the process of providing the user with more data retrievaloptions (see Discussion).
Direct Interactions With the StatechartsWhile the simulation is running, the user can interact with theunderlying statecharts directly, with tools available from Rhap-sody, without using the interface, by injecting events. In otherwords, during run-time, the user may choose a specific event tobe performed immediately. The run continues, the chosen eventis inserted, and it effects the simulation directly.
Figure 8 provides an example. The pseudo-statechart in thefigure gives part of the statechart of an epithelial cell. As ex-plained above, the user can choose from any of the three theoriesin the figure. A choice is made during run time, when the userfinds the needed instance of an epithelial cell in Rhapsody, de-cides the theory he or she would like the cell to implement, andinjects the appropriate event—1, 2, or 3.
This is similar to using a switch mechanism to direct a trainto a railroad track of choice.
Tracing Back the DataWe have made an effort to set things up so that the data weuse—scientific papers, tables, figures, and diagrams—are avail-able to the user during run time.
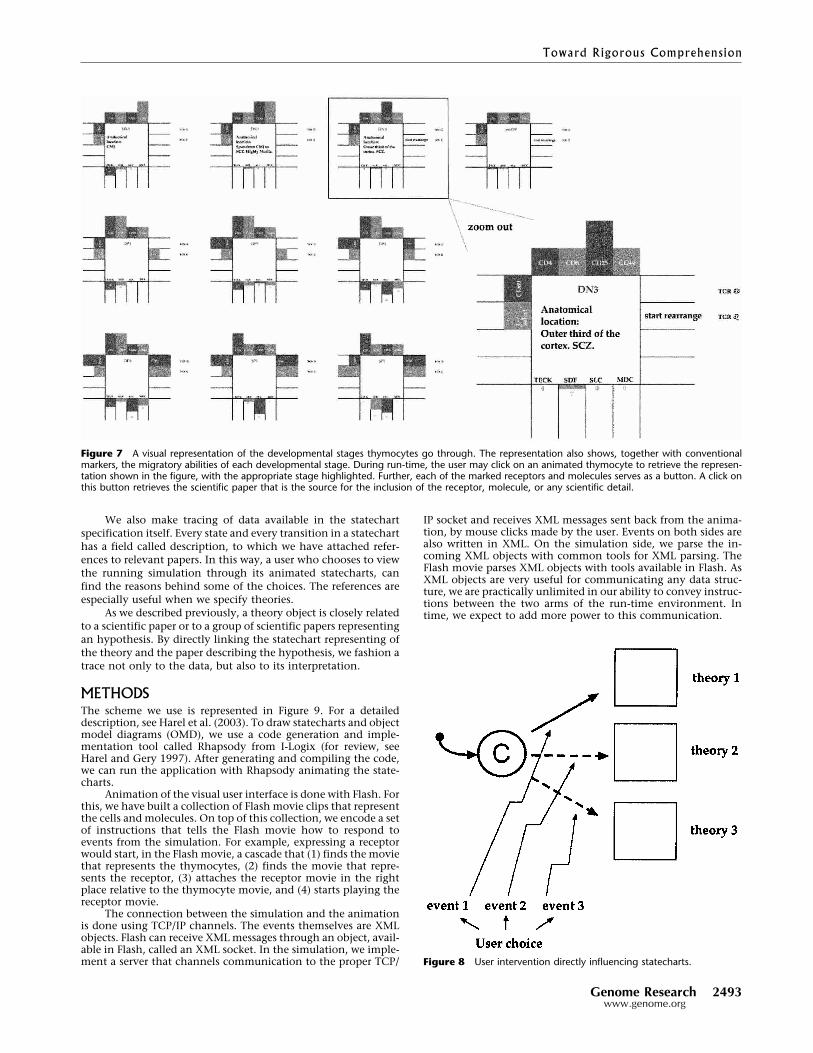
Figure 7 demonstrates this as follows: The figure is a repre-sentation of several stages a thymocyte goes through during de-velopment. The figure is, in fact, a compilation of the data foundin Ritter and Crispe (1991), Ritter and Crispe (1992), Penit et al.(1995) Tourigny et al. (1997), Chantry et al. (1999), Youn et al.(1999), Bleul and Boehm (2000), Norment and Bevan (2000),Annunziato et al. (2001), Lind et al. (2001), Hernandez-Lopez etal. (2002), and in it we use the same taxonomy used for cell states
and for cell markers, with the exceptionthat we also indicate a cell’s susceptibil-ity to chemokines as markers with as-signed probability. For example, the firststage in the figure—DN1—represents apopulation of cells, of which 40% mi-grate to CCL25 (TECK), 12% migrate toCXCL12 (SDF), etc. We use this figurewhen we want to retrieve the data andimplement it in a manageable way intospecification.
This figure can be used at run time.When a user wants to examine the rea-sons for a cell’s movement, he or shemay click on the specific cell and choosethe menu item Developmental Stage.This action opens the same diagram weuse for specification—Figure 7—onlywith an indication to the current state ofthe cell (the current state is marked witha rectangle around the appropriatestage). Further, if the user wishes to re-trieve a paper that serves as the basis forany of the data represented in the figure,he or she need only click the specificitem in the figure and a window con-taining the paper opens up.Figure 6 An example of menus that open in response to clicking a thymocyte.
Efroni et al.
2492 Genome Researchwww.genome.org
We also make tracing of data available in the statechartspecification itself. Every state and every transition in a statecharthas a field called description, to which we have attached refer-ences to relevant papers. In this way, a user who chooses to viewthe running simulation through its animated statecharts, canfind the reasons behind some of the choices. The references areespecially useful when we specify theories.
As we described previously, a theory object is closely relatedto a scientific paper or to a group of scientific papers representingan hypothesis. By directly linking the statechart representing ofthe theory and the paper describing the hypothesis, we fashion atrace not only to the data, but also to its interpretation.
METHODSThe scheme we use is represented in Figure 9. For a detaileddescription, see Harel et al. (2003). To draw statecharts and objectmodel diagrams (OMD), we use a code generation and imple-mentation tool called Rhapsody from I-Logix (for review, seeHarel and Gery 1997). After generating and compiling the code,we can run the application with Rhapsody animating the state-charts.
Animation of the visual user interface is done with Flash. Forthis, we have built a collection of Flash movie clips that representthe cells and molecules. On top of this collection, we encode a setof instructions that tells the Flash movie how to respond toevents from the simulation. For example, expressing a receptorwould start, in the Flash movie, a cascade that (1) finds the moviethat represents the thymocytes, (2) finds the movie that repre-sents the receptor, (3) attaches the receptor movie in the rightplace relative to the thymocyte movie, and (4) starts playing thereceptor movie.
The connection between the simulation and the animationis done using TCP/IP channels. The events themselves are XMLobjects. Flash can receive XML messages through an object, avail-able in Flash, called an XML socket. In the simulation, we imple-ment a server that channels communication to the proper TCP/
IP socket and receives XML messages sent back from the anima-tion, by mouse clicks made by the user. Events on both sides arealso written in XML. On the simulation side, we parse the in-coming XML objects with common tools for XML parsing. TheFlash movie parses XML objects with tools available in Flash. AsXML objects are very useful for communicating any data struc-ture, we are practically unlimited in our ability to convey instruc-tions between the two arms of the run-time environment. Intime, we expect to add more power to this communication.
Figure 8 User intervention directly influencing statecharts.
Figure 7 A visual representation of the developmental stages thymocytes go through. The representation also shows, together with conventionalmarkers, the migratory abilities of each developmental stage. During run-time, the user may click on an animated thymocyte to retrieve the represen-tation shown in the figure, with the appropriate stage highlighted. Further, each of the marked receptors and molecules serves as a button. A click onthis button retrieves the scientific paper that is the source for the inclusion of the receptor, molecule, or any scientific detail.
Toward Rigorous Comprehension
Genome Research 2493www.genome.org

DISCUSSION
Future WorkOther than obvious improvements to our simulation, model, ani-mation, and user interface (better, faster implementation; betterarchitecture; improved convenience of the user interface; captur-ing a larger part of the data set; implementing more theories,etc.), we believe future work should go in two directions, thelower scale and the upper scale.
The Lower and Higher ScaleIn the study reported upon here, we artificially decrease com-plexity to enable modeling. We work in two dimensions—wetake thymocytes and macrophages to be of fixed size and shape,and we represent the multiple copies of receptors on a cell’s sur-face (the way immunologists do) as one receptor; we work on a
lattice with some predefined resolution.The assumptions can be treated differ-ently if we switch to a lower scale—themolecular scale. On the molecular scale,cells are represented as actual collectionsof molecules, and we no longer trans-form molecular collections into cells,but simulate molecular collections. Wedo not choose between theories, butsimulate interacting cells as their mol-ecules bind and interact.
However, the molecular scale is cur-rently impractical. Not enough data isavailable about interactions at the mo-lecular level. The complexity at this levelwould result in an effort directed only ata single cell, and would make higher lev-els of perspective—a cell population andan organ—practically impossible toachieve. There have been remarkable ef-forts to simulate single cells at the mo-lecular level (Tomita 2001; Bartol andStiles 2002). For this kind of simulation,the groups must use supercomputingpower. Therefore, for the time being, wecannot even attempt to go from the mo-lecular description level of one cell tothe level of cell populations.
A higher scale does not require achange in specification and implemen-tation, but needs a different perspectiveto look at information generated by thesimulation. While the simulation runs,cells and molecules are generated andchange their properties. A lot of infor-mation is available about these cells,their types, their attributes, their loca-tions, their history, the history of theirinteractions, their relations to othercells, etc.
We believe that new ways to look atdata must be found, and new tools tosupport them must be built as informa-tion visualization itself changes thequestions asked. We are in the process ofbuilding such tools. Population sizetools, unlike molecular level tools, donot need special machinery, as specialalgorithms are made available using cur-
rent computer architecture. Population level analysis is a relevantscale when we look at most functions of the immune system. Theimmune system eradicates pathogens by changing the ratios ofcell numbers in different clones; the immune system maintainshomeostasis by controlling population ratios; pharmaceuticaldrugs usually work on specific populations of cells defined asbearing the same markers. The population view is the naturalview for immunologists.
Ex Vivo ExperimentationThe work described in this study is work in progress, and it re-mains to be applied to direct experimentation and to theoreticalcomparisons. We are in the process of fine-tuning our tools tomake them available for such implementation and to study de-fined immunological phenomena.
Figure 9 The software setup that enables the modeling, simulation, and interactive animation.
Efroni et al.
2494 Genome Researchwww.genome.org
ConclusionsBiological understanding is specific to the problem at hand andto the scale in question. We think we understand a biologicalsystem when we can make predictions about it, when we canutilize it, or when we can rephrase its meaning (I.R. Cohen, inprep). Much of the work done so far in systems biology has beendirected at understanding the genome. This work has generatedits own terminology. In this study, we use the words data, infor-mation, modeling, simulation, hypothesis, and even systemswith meanings that may be different from those used in genomicbioinformatics. However, the problem of understanding is theissue, not terminology.
This study presents a two-tier strategy for comprehendingthe biological complexity of the thymus. The combination ofthese two tiers makes the effort manageable, executable, andcomprehensible.
Tier 1 may be seen as the mathematical modeling of avail-able data to model the thymus with tools invented in computerscience for system analysis and system design. The tools makethe analysis legible and mathematically valid with the help of thevisual language of Statecharts. The mathematical rigor of themodel makes it amenable to execution on a computer as a run-ning simulation. We use this simulation to perform experimen-tation—thought experiments if you will—with an existing dataset. With the proper configuration, we provide the added abilityto switch between different theories proposed to explain the dataset.
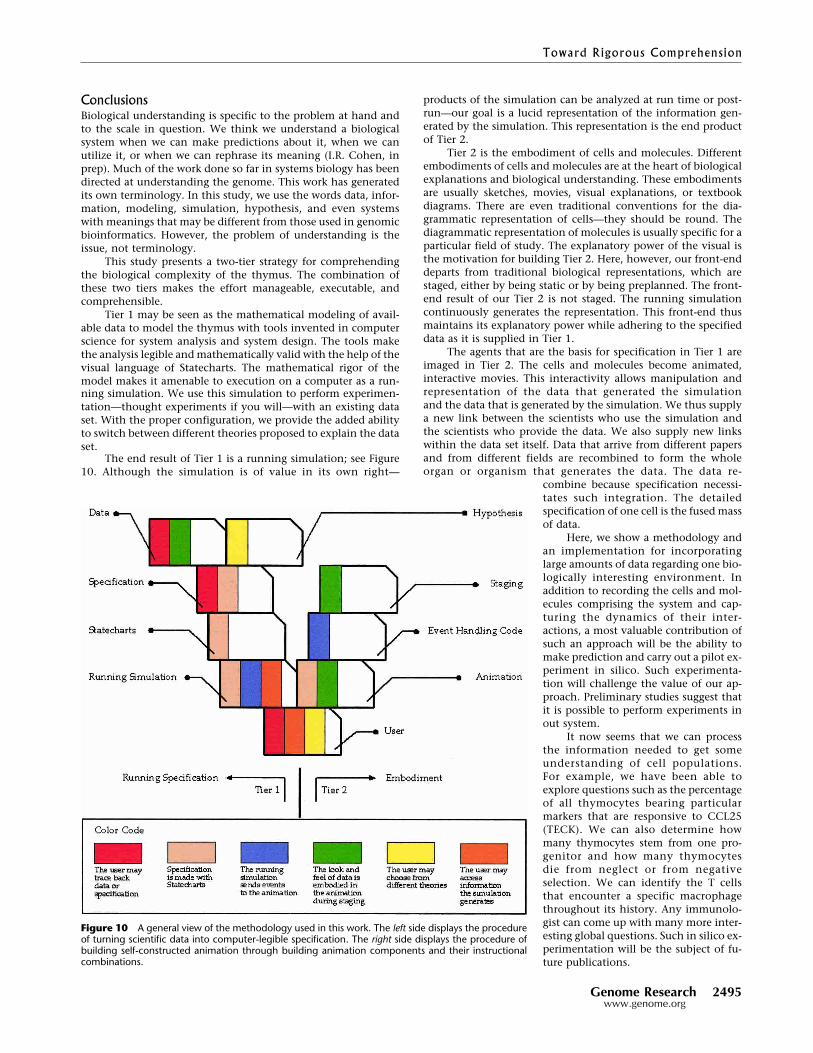
The end result of Tier 1 is a running simulation; see Figure10. Although the simulation is of value in its own right—
products of the simulation can be analyzed at run time or post-run—our goal is a lucid representation of the information gen-erated by the simulation. This representation is the end productof Tier 2.
Tier 2 is the embodiment of cells and molecules. Differentembodiments of cells and molecules are at the heart of biologicalexplanations and biological understanding. These embodimentsare usually sketches, movies, visual explanations, or textbookdiagrams. There are even traditional conventions for the dia-grammatic representation of cells—they should be round. Thediagrammatic representation of molecules is usually specific for aparticular field of study. The explanatory power of the visual isthe motivation for building Tier 2. Here, however, our front-enddeparts from traditional biological representations, which arestaged, either by being static or by being preplanned. The front-end result of our Tier 2 is not staged. The running simulationcontinuously generates the representation. This front-end thusmaintains its explanatory power while adhering to the specifieddata as it is supplied in Tier 1.
The agents that are the basis for specification in Tier 1 areimaged in Tier 2. The cells and molecules become animated,interactive movies. This interactivity allows manipulation andrepresentation of the data that generated the simulationand the data that is generated by the simulation. We thus supplya new link between the scientists who use the simulation andthe scientists who provide the data. We also supply new linkswithin the data set itself. Data that arrive from different papersand from different fields are recombined to form the wholeorgan or organism that generates the data. The data re-
combine because specification necessi-tates such integration. The detailedspecification of one cell is the fused massof data.
Here, we show a methodology andan implementation for incorporatinglarge amounts of data regarding one bio-logically interesting environment. Inaddition to recording the cells and mol-ecules comprising the system and cap-turing the dynamics of their inter-actions, a most valuable contribution ofsuch an approach will be the ability tomake prediction and carry out a pilot ex-periment in silico. Such experimenta-tion will challenge the value of our ap-proach. Preliminary studies suggest thatit is possible to perform experiments inout system.
It now seems that we can processthe information needed to get someunderstanding of cell populations.For example, we have been able toexplore questions such as the percentageof all thymocytes bearing particularmarkers that are responsive to CCL25(TECK). We can also determine howmany thymocytes stem from one pro-genitor and how many thymocytesdie from neglect or from negativeselection. We can identify the T cellsthat encounter a specific macrophagethroughout its history. Any immunolo-gist can come up with many more inter-esting global questions. Such in silico ex-perimentation will be the subject of fu-ture publications.
Figure 10 A general view of the methodology used in this work. The left side displays the procedureof turning scientific data into computer-legible specification. The right side displays the procedure ofbuilding self-constructed animation through building animation components and their instructionalcombinations.
Toward Rigorous Comprehension
Genome Research 2495www.genome.org
ACKNOWLEDGMENTSThis work was supported by grants from the Minerva Foundationand by the Robert-Koch Minerva Center for the Study of Auto-immune Diseases.
The publication costs of this article were defrayed in part bypayment of page charges. This article must therefore be herebymarked “advertisement” in accordance with 18 USC section 1734solely to indicate this fact.
REFERENCESAnderson, G. and Jenkinson, E.J. 2001. Lymphostromal interactions in
thymic development and function. Nat. Rev. Immunol. 1: 31–40.Annunziato, F., Romagnani, P., Cosmi, L., Lazzeri, E., and Romagnani, S.
2001. Chemokines and lymphopoiesis in human thymus. TrendsImmunol. 22: 277–281.
Bergmann, C., van Hemmen, J.L., and Segel, L.A. 2002. How instructionand feedback can select the appropriate T helper response. Bull.Math. Biol. 64: 425–446.
Bleul, C.C. and Boehm, T. 2000. Chemokines define distinctmicroenvironments in the developing thymus. Eur. J. Immunol.30: 3371–3379.
Campbell, J.J., Pan, J., and Butcher, E.C. 1999. Cutting edge:Developmental switches in chemokine responses during T cellmaturation. J. Immunol. 163: 2353–2357.
Carmel, L., Harel, D., and Koren, Y. 2002. Drawing directed graphsusing one-dimensional optimization. In Comp. Sci. 2528: Proc. GraphDrawing 2002, pp. 193–206.
Chantry, D., Romagnani, P., Raport, C.J., Wood, C.L., Epp, A.,Romagnani, S., and Gray, P.W. 1999. Macrophage-derivedchemokine is localized to thymic medullary epithelial cells and is achemoattractant for CD3(+), CD4(+), CD8(low) thymocytes. Blood94: 1890–1898.
Cohen, I.R. 2000. Tending adam’s garden: Evolving the cognitive immuneself. Academic Press, London, UK.
Cohen, I.R. and Wekerle, H. 1973. Regulation of T-lymphocyteautosensitization. Transplant Proc. 5: 83–85.
Coutinho, A., Hori, S., Carvalho, T., Caramalho, I., and Demengeot, J.2001. Regulatory T cells: The physiology of autoreactivity indominant tolerance and “quality control” of immune responses.Immunol. Rev. 182: 89–98.
De Boer, R.J., Mohri, H., Ho, D.D., and Perelson, A.S. 2003. Turnoverrates of B cells, T cells, and NK cells in simian immunodeficiencyvirus-infected and uninfected rhesus macaques. J. Immunol.170: 2479–2487.
Douek, D.C., Betts, M.R., Hill, B.J., Little, S.J., Lempicki, R., Metcalf, J.A.,Casazza, J., Yoder, C., Adelsberger, J.W., Stevens, R.A., et al. 2001.Evidence for increased T cell turnover and decreased thymic outputin HIV infection. J. Immunol. 167: 6663–6668.
Douek, D.C., Brenchley, J.M., Betts, M.R., Ambrozak, D.R., Hill, B.J.,Okamoto, Y., Casazza, J.P., Kuruppu, J., Kunstman, K., Wolinsky, S.,et al. 2002. HIV preferentially infects HIV-specific CD4+ T cells.Nature 417: 95–98.
Dutton, R.W., Bradley, L.M., and Swain, S.L. 1998. T cell memory. Annu.Rev. Immunol. 16: 201–223.
Efroni, S. and Cohen, I.R. 2002. Simplicity belies a complex system: Aresponse to the minimal model of immunity of Langman and Cohn.Cell. Immunol. 216: 23–30.
———. 2003. The heuristics of biologic theory: The case of self-nonselfdiscrimination. Cell. Immunol. 223: 87–89.
Egerton, M., Scollay, R., and Shortman, K. 1990. Kinetics of matureT-cell development in the thymus. Proc. Natl. Acad. Sci. USA87: 2579–2582.
Elias, D., Tikochinski, Y., Frankel, G., and Cohen, I.R. 1999. Regulationof NOD mouse autoimmune diabetes by T-cells that recognize a TCRCDR3 peptide. Int. Immunol. 11: 957–966.
Germain, R.N. 2002. T-cell development and the CD4-CD8 lineagedecision. Nat. Rev. Immunol. 2: 309–322.
Gett, A.V. and Hodgkin, P.D. 2000. A cellular calculus for signalintegration by T-cells. Nat. Immunol. 1: 239–244.
Harel, D. 1987. Statecharts: A visual formalism for complex systems. Sci.Comput. Programm. 8: 231–274.
Harel, D. and Gery, E. 1997. Executable object modeling withstatecharts. IEEE Comput. 30: 31–42.
Harel, D. and Politi, M. 1998. Modeling reactive systems with statecharts:The statemate approach. McGraw-Hill, New York.
Harel, D., Efroni, S., and Cohen, I.R. 2003. Reactive animation. LectureNotes in Computer Science (in press).
Hernandez-Lopez, C., Varas, A., Sacedon, R., Jimenez, E., Munoz, J.J.,
Zapata, A.G., and Vicente, A. 2002. Stromal cell-derived factor1/CXCR4 signaling is critical for early human T-cell development.Blood 99: 546–554.
Hershberg, U., Louzoun, Y., Atlan, H., and Solomon, S. 2001. HIV timehierarchy: Winning the war while losing all the battles. Physica A289: 178–190.
Holoshitz, J., Matitiau, A., and Cohen, I.R. 1985. Role of the thymus ininduction and transfer of vaccination against adjuvant arthritis witha T lymphocyte line in rats. J. Clin. Invest. 75: 472–477.
Hood, J.M., Huang, H.V., and Hood, L. 1980. A computer simulation ofevolutionary forces controlling the size of a multigene family. J. Mol.Evol. 15: 181–196.
Janeway, C. 2001. Immunobiology: The immune system in health anddisease. Garland Pub., New York.
Kesmir, C. and De Boer, R.J. 2003. Clonal exhaustion as a result ofimmune deviation. Bull. Math. Biol. 65: 359–374.
Khaled, A.R. and Durum, S.K. 2002. The role of cytokines in lymphocytehomeostasis. Biotechniques Suppl: 40–45.
Kim, C.H., Pelus, L.M., White, J.R., and Broxmeyer, H.E. 1998.Differential chemotactic behavior of developing T-cells in responseto thymic chemokines. Blood 91: 4434–4443.
Kobryn, C. 1999. UML 2001: A standardization odyssey. Comm. of theACM 42: 29–37.
Lind, E.F., Prockop, S.E., Porritt, H.E., and Petrie, H.T. 2001. Mappingprecursor movement through the postnatal thymus reveals specificmicroenvironments supporting defined stages of early lymphoiddevelopment. J. Exp. Med. 194: 127–134.
Louzoun, Y., Weigert, M., and Bhanot, G. 2003. Dynamical analysis of adegenerate primary and secondary humoral immune response. Bull.Math. Biol. 65: 535–545.
Mehr, R., Perelson, A.S., Fridkis-Hareli, M., and Globerson, A. 1997.Regulatory feedback pathways in the thymus. Immunol. Today18: 581–585.
Mehr, R., Perelson, A.S., Sharp, A., Segel, L., and Globerson, A. 1998.MHC-linked syngeneic developmental preference in thymic lobescolonized with bone marrow cells: A mathematical model. Dev.Immunol. 5: 303–318.
Meier-Schellersheim, M. 1999. “SIMMUNE, a tool for simulating andanalyzing immune system behavior.” Dissertation, University ofHamburg, Hamburg, Germany.
Mor, F., Reizis, B., Cohen, I.R., and Steinman, L. 1996. IL-2 and TNFreceptors as targets of regulatory T-T interactions: Isolation andcharacterization of cytokine receptor-reactive T-cell lines in theLewis rat. J. Immunol. 157: 4855–4861.
Nanda, N.K. and Sercarz, E.E. 1995. The positively selected T-cellrepertoire: Is it exclusively restricted to the selecting MHC? Int.Immunol. 7: 353–358.
Norment, A.M. and Bevan, M.J. 2000. Role of chemokines in thymocytedevelopment. Semin. Immunol. 12: 445–455.
Penit, C., Lucas, B., and Vasseur, F. 1995. Cell expansion and growtharrest phases during the transition from precursor (CD4�8�) toimmature (CD4+8+) thymocytes in normal and genetically modifiedmice. J. Immunol. 154: 5103–5113.
Platt, N., Suzuki, H., Kurihara, Y., Kodama, T., and Gordon, S. 1996.Role for the class A macrophage scavenger receptor in thephagocytosis of apoptotic thymocytes in vitro. Proc. Natl. Acad. Sci.93: 12456–12460.
Ritter, M.A. and Crispe, I.N. 1991. The thymus. IRL Press at OxfordUniversity Press, Oxford, UK.
Ritter, M.A. and Crispe, T.N. 1992. The Thymus. Oxford University Press,New York.
Sant’Angelo, D.B., Lucas, B., Waterbury, P.G., Cohen, B., Brabb, T.,Goverman, J., Germain, R.N., and Janeway, C.A.J. 1998. A molecularmap of T-cell development. Immunity 9: 179–186.
Savino, W., Mendes-da-Cruz, D.A., Silva, J.S., Dardenne, M., andCotta-de-Almeida, V. 2002. Intrathymic T-cell migration: acombinatorial interplay of extracellular matrix and chemokines?Trends Immunol. 23: 305–313.
Shevach, E.M. 2002. CD4+ CD25+ suppressor T-cells: More questionsthan answers. Nat. Rev. Immunol. 2: 389–400.
Taylor, J.R.J., Kimbrell, K.C., Scoggins, R., Delaney, M., Wu, L., andCamerini, D. 2001. Expression and function of chemokine receptorson human thymocytes: Implications for infection by humanimmunodeficiency virus type 1. J. Virol. 75: 8752–8760.
Tomita, M. 2001. Whole-cell simulation: A grand challenge of the 21stcentury. Trends Biotechnol. 19: 205–210.
Tourigny, M.R., Mazel, S., Burtrum, D.B., and Petrie, H.T. 1997. T-cellreceptor (TCR)-� gene recombination: Dissociation from cell cycleregulation and developmental progression during T-cell ontogeny. J.Exp. Med. 185: 1549–1556.
Von Gaudecker, B., Kendall, M.D., and Ritter, M.A. 1997.Immuno-electron microscopy of the thymic epithelial
Efroni et al.
2496 Genome Researchwww.genome.org
microenvironment. Microsc. Res. Tech. 38: 237–249.Wieringa, R. 2003. Design methods for reactive systems: Yourdan, Statemate,
and the UML. Morgan Kaufmann Publishers, Amsterdam, Boston,MA.
Yasutomo, K., Lucas, B., and Germain, R.N. 2000. TCR signaling forinitiation and completion of thymocyte positive selection hasdistinct requirements for ligand quality and presenting cell type. J.Immunol. 165: 3015–3022.
Youn, B.S., Kim, C.H., Smith, F.O., and Broxmeyer, H.E. 1999. TECK, anefficacious chemoattractant for human thymocytes, uses
GPR-9–6/CCR9 as a specific receptor. Blood 94: 2533–2536.Zaitseva, M., Kawamura, T., Loomis, R., Goldstein, H., Blauvelt, A., and
Golding, H. 2002. Stromal-derived factor 1 expression in the humanthymus. J. Immunol. 168: 2609–2617.
Zlotnik, A. and Yoshie, O. 2000. Chemokines: A new classificationsystem and their role in immunity. Immunity 12: 121–127.
Received January 23, 2003; accepted in revised form September 3, 2003.
Toward Rigorous Comprehension
Genome Research 2497www.genome.org