pnas proof - weizmann institute of science
TRANSCRIPT

PNAS proofEmbargoed
Fast live simultaneous multiwavelengthfour-dimensional optical microscopyPeter M. Carltona,1, Jérôme Boulangerb, Charles Kervrannc,d, Jean-Baptiste Sibaritae, Jean Salamerof, Susannah Gordon-Messerg, Debra Bressang, James E. Haberg, Sebastian Haaseh, Lin Shaoa,2, Lukman Winotoa, Atsushi Matsudaa,Peter Knera,3, Satoru UzawaI, Mats Gustafssona,2, Zvi Kamj, David A. Agardk, and John W. Sedata,4
aThe Keck Center for Advanced Microscopy and the Department of Biochemistry and Biophysics, University of California, San Francisco, CA 94158-2517;bInstitut Curie, Centre de Recherche, 12 rue Lhomond, F-75005 Paris, France; cInstitut National de Recherche en Informatique et en Automatique (INRIA)Rennes—Bretagne Atlantique, Campus Universitaire de Beaulieu, F-35042 Rennes Cedex, France; dl'Institut National de la Recherche Agronomique (INRA),UR341 Mathématiques et Informatique Appliquées, F-78352 Jouy-en-Josas, France; eFunctional Genomics, Centre National de la Recherche Scientique(CNRS), UMR 5091, Bordeaux, France; fInstitut Curie, Plate-forme Imagerie Cellulaire et Tissulaire - Infrastructures en Biologie Sante et Agronomie(PICT-IBiSA) UMR 144, 26 rue d’Ulm 75248 Paris cedex 05, France; gRosenstiel Center and Department of Biology, Brandeis University, 415 South St,Waltham, MA 02454-9110; hInstitute for Experimental Physics, WE 1, Department of Physics, Free University, Berlin, Arnimallee 14, D-14195 Berlin,Germany; IHoward Hughes Medical Institute and Department of Molecular and Cellular Biology, Genetics and Development, University of California,Berkeley, CA 94720-3204; jWeizmann Institute of Science, Molecular Cell Biology, Rehovot, Israel 76100; and kThe Keck Center for Advanced Microscopy,Howard Hughes Medical Institute and the Department of Biochemistry and Biophysics, University of California, San Francisco, CA 94158-2517
This article is part of the special series of Inaugural Articles by members of the National Academy of Sciences elected in 2009.
Edited by Joseph G. Gall, Carnegie Institute of Washington, Baltimore, MD, and approved June 1, 2010 (received for review April 5, 2010)
Live fluorescencemicroscopy has the unique capability to probe dy-namic processes, linking molecular components and their localiza-tion with function. A key goal of microscopy is to increase spatialand temporal resolution while simultaneously permitting identifi-cation of multiple specific components. We demonstrate a newmicroscope platform, OMX, that enables subsecond, multicolorfour-dimensional data acquisition and also provides access to sub-diffraction structured illumination imaging. Using this platform toimage chromosomemovement during a complete yeast cell cycle atone 3D image stack per second reveals an unexpected degree ofphotosensitivity of fluorophore-containing cells. To avoid perturba-tion of cell division, excitation levels had to be attenuated between100 and 10,000× below the level normally used for imaging. Weshow that an image denoising algorithm that exploits redundancyin the image sequence over space and time allows recovery ofbiological information from the low light level noisy images whilemaintaining full cell viability with no fading.
OMX ∣ phototoxicity ∣ image processing ∣ denoising ∣ yeast
The ability to collect live biological image information in threedimensions as a function of time, four-dimensional imaging, is
a powerful use of optical microscopy. It has led to the discovery ofnew phenomena, and in combination with analysis of mutationsor other perturbations, can link biological functions to molecularmechanisms. The dynamic information gained from four-dimen-sional data also allows the accurate measurement of quantitativephysical parameters, such as diffusion constants or velocity ofactive movement.
Though a powerful technique, live fluorescence imaging im-poses constraints, which can severely impede its use. Biologicalprocesses within a cell are sensitive to the excitation light usedfor fluorescence imaging (for a review, see ref. 1, chap. 19). Thismay be evidenced by a failure or delay of cell division, morpho-logical changes, or perturbation of other biological processes.The phototoxicity resulting from excitation light is in part causedby the long-lived triplet state present in all fluorescent processesinteracting with molecular oxygen, generating very reactive inter-mediates such as free radicals. High levels of free radicals kill cells(2). In addition, excitation light can damage the fluorochrome,leading to the well-known phenomenon of photobleaching. Bothphototoxicity and bleaching are directly proportional to theexcitation light intensity. In general, one reduces the excitationintensity to minimize the photodamage. However, this has theundesirable consequence of lowering the signal-to-noise ratioof the image, resulting in a dim and therefore noisy image. These
two competing considerations make information retrieval fromlive image sequences a challenging problem.
Using a newly devised fast multidimensional image acquisitionplatform (OMX) (SI Text), we address here the problem ofsample damage due to excitation light and demonstrate that re-duction of excitation light by several orders of magnitude, in com-bination with the appropriate use of image denoising algorithms,can allow informative four-dimensional imaging at previously im-practicable rates without phototoxicity or fading.
ResultsPreservation of Live Cell Viability Requires Reduction of Light Inten-sity. In the course of imaging experiments on yeast chromosomedynamics, we observed that yeast cells that had been imagedunder what is normally considered to be a low-light dose failedto divide when left overnight, whereas their nonimaged neighborsdivided normally. This prompted us to quantitatively measure thephototoxicity of our experiments. A yeast strain containing a Lacrepressor::GFP fusion (YDB271) binding to a specific amplifiedLac operator (3) was used to study phototoxicity during and afterfour-dimensional data collection. Three-dimensional images (25Z sections) were acquired at 23 °C every 15 s over a period of20 min, covering roughly 20% of a yeast cell cycle. This imagingregime is hereafter referred to as “sparse” (Fig. 1). Initially, weperformed imaging under an excitation light intensity that re-sulted in an image intensity sufficient to allow direct automatedtracking of the Lac repressor::GFP spots after deconvolution ofthe data. For these and subsequent experiments, this excitationintensity, 4.8 × 10⁻⁵ W∕μm2, is referred to as I0, as shown in
Author contributions: P.M.C., D.A.A., and J.W.S. designed research; P.M.C., J.E.H., andJ.W.S. performed research; J.B., C.K., J.-B.S., J.S., S.G.-M., D.B., J.E.H., S.H., L.S., L.W., A.M.,P.K., S.U., M.G., and Z.K. contributed new reagents/analytic tools; P.M.C., D.A.A., and J.W.S.analyzed data; and P.M.C., D.A.A., and J.W.S. wrote the paper.
The authors declare no conflict of interest.
This article is a PNAS Direct Submission.4To whom correspondence should be addressed. E-mail: [email protected] address: Institute for Integrated Cell-Material Sciences (iCeMS), Kyoto University,Yoshida, Sokyo-ku, Kyoto 606-8501, Japan.
2Present address: Janelia Farms, Howard Hughes Medical Institute, 4000 Jones BridgeRoad, Chevy Chase, MD 20815-6789.
3Present address: Department of Biological and Agricultural Engineering, University ofGeorgia, Driftmier Engineering Center, Room 101, University of Georgia, Athens,GA 30602.
This article contains supporting information online at www.pnas.org/lookup/suppl/doi:10.1073/pnas.1004037107/-/DCSupplemental.
Q:A
www.pnas.org/cgi/doi/10.1073/pnas.1004037107 PNAS Early Edition ∣ 1 of 7
BIOPH
YSICSAND
COMPU
TATIONALBIOLO
GY
INAUGURA
LART
ICLE
PNAS
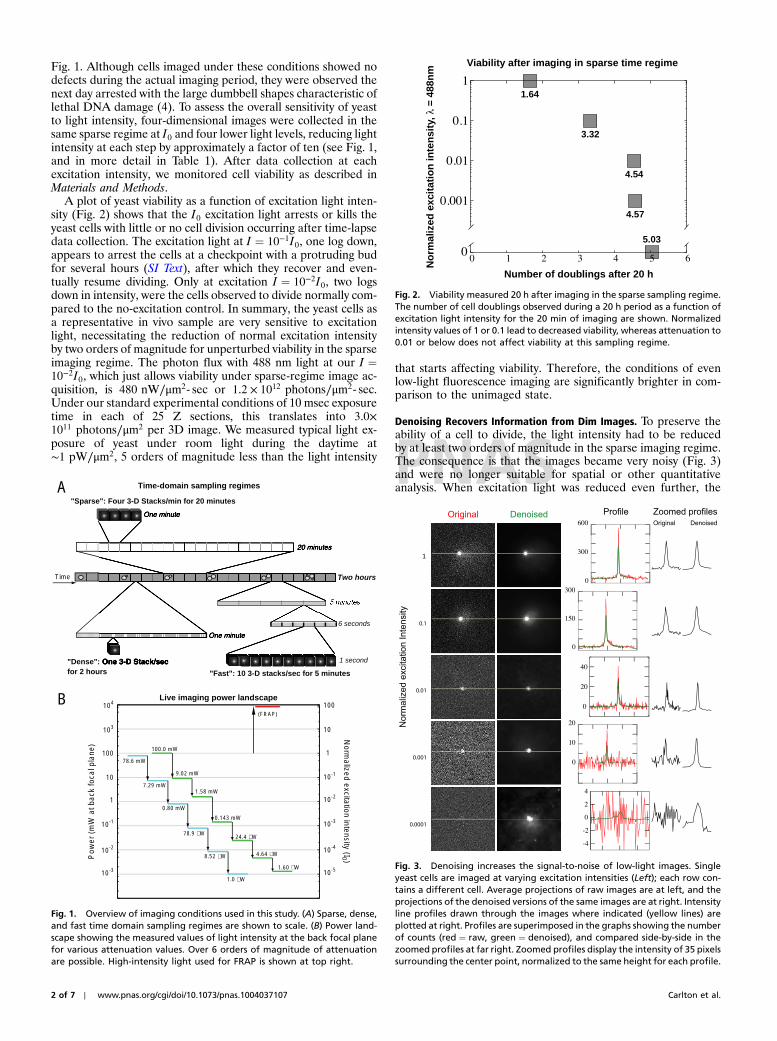
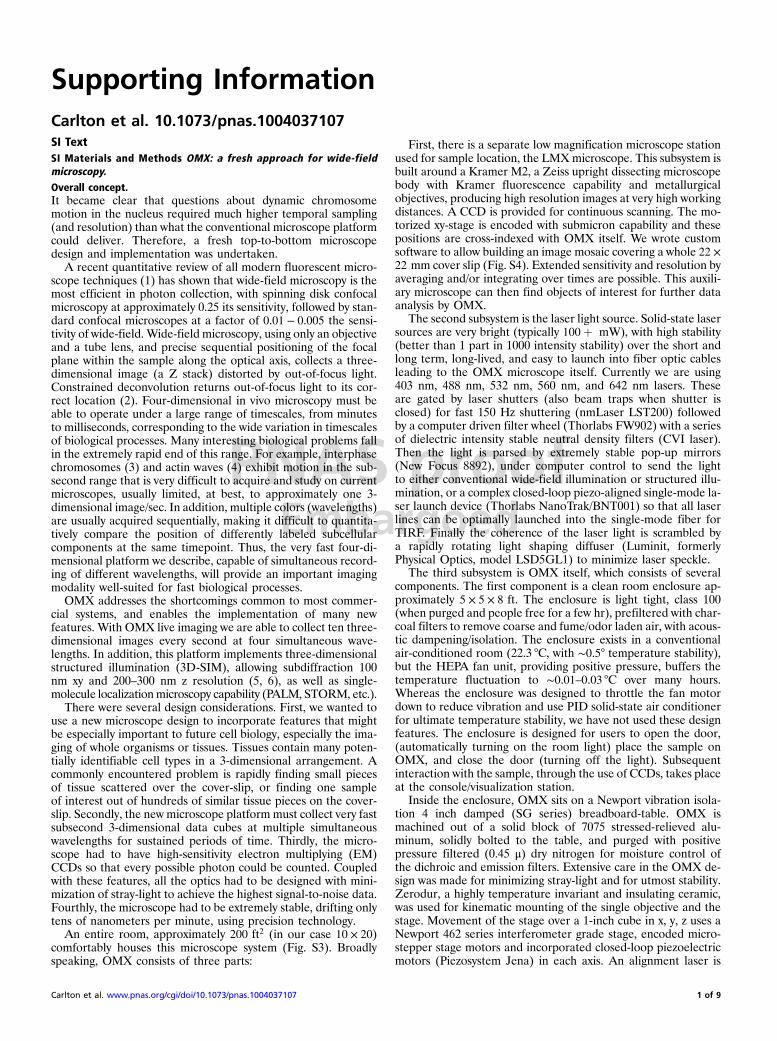
Fig. 1. Although cells imaged under these conditions showed nodefects during the actual imaging period, they were observed thenext day arrested with the large dumbbell shapes characteristic oflethal DNA damage (4). To assess the overall sensitivity of yeastto light intensity, four-dimensional images were collected in thesame sparse regime at I0 and four lower light levels, reducing lightintensity at each step by approximately a factor of ten (see Fig. 1,and in more detail in Table 1). After data collection at eachexcitation intensity, we monitored cell viability as described inMaterials and Methods.
A plot of yeast viability as a function of excitation light inten-sity (Fig. 2) shows that the I0 excitation light arrests or kills theyeast cells with little or no cell division occurring after time-lapsedata collection. The excitation light at I ¼ 10−1I0, one log down,appears to arrest the cells at a checkpoint with a protruding budfor several hours (SI Text), after which they recover and even-tually resume dividing. Only at excitation I ¼ 10−2I0, two logsdown in intensity, were the cells observed to divide normally com-pared to the no-excitation control. In summary, the yeast cells asa representative in vivo sample are very sensitive to excitationlight, necessitating the reduction of normal excitation intensityby two orders of magnitude for unperturbed viability in the sparseimaging regime. The photon flux with 488 nm light at our I ¼10−2I0, which just allows viability under sparse-regime image ac-quisition, is 480 nW∕μm2- sec or 1.2 × 10¹² photons∕μm2- sec.Under our standard experimental conditions of 10 msec exposuretime in each of 25 Z sections, this translates into 3.0×10¹¹ photons∕μm2 per 3D image. We measured typical light ex-posure of yeast under room light during the daytime at∼1 pW∕μm2, 5 orders of magnitude less than the light intensity
that starts affecting viability. Therefore, the conditions of evenlow-light fluorescence imaging are significantly brighter in com-parison to the unimaged state.
Denoising Recovers Information from Dim Images. To preserve theability of a cell to divide, the light intensity had to be reducedby at least two orders of magnitude in the sparse imaging regime.The consequence is that the images became very noisy (Fig. 3)and were no longer suitable for spatial or other quantitativeanalysis. When excitation light was reduced even further, the
Live imaging power landscape
A
B
78.6 mW
100.0 mW
9.02 mW
7.29 mW
0.80 mW
78.9 µW
8.52 µW
1.0 µW
1.58 mW
0.143 mW
24.4 µW
4.64 µW
1.60 µW
(FRAP)
1
10
10
10-2
10-4
10-1
10-510-3
10-1
100
100
10-3
1
10-2
103
104
Pow
er (
mW
at b
ack
foca
l pla
ne)
Norm
alizedexcitation intensity (I0 )
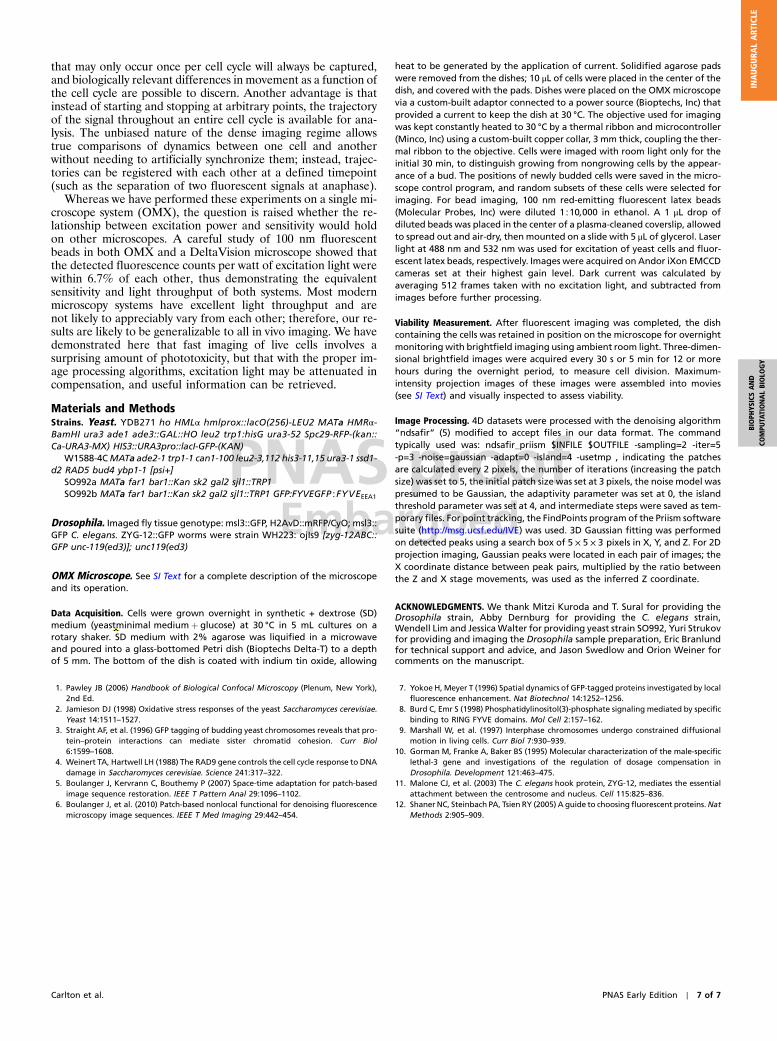
Time-domain sampling regimes
"Sparse": Four 3-D Stacks/min for 20 minutes
Two hours
20 minutes
One minute
"Dense": One 3-D Stack/secfor 2 hours
6 seconds
1 second
"Fast": 10 3-D stacks/sec for 5 minutes
One minute
Time
Fig. 1. Overview of imaging conditions used in this study. (A) Sparse, dense,and fast time domain sampling regimes are shown to scale. (B) Power land-scape showing the measured values of light intensity at the back focal planefor various attenuation values. Over 6 orders of magnitude of attenuationare possible. High-intensity light used for FRAP is shown at top right.
1.64
3.32
Number of doublings after 20 h
Viability after imaging in sparse time regime
No
rmal
ized
exc
itat
ion
inte
nsi
ty,λ
= 4
88n
m
4.57
4.54
5.03
Fig. 2. Viability measured 20 h after imaging in the sparse sampling regime.The number of cell doublings observed during a 20 h period as a function ofexcitation light intensity for the 20 min of imaging are shown. Normalizedintensity values of 1 or 0.1 lead to decreased viability, whereas attenuation to0.01 or below does not affect viability at this sampling regime.
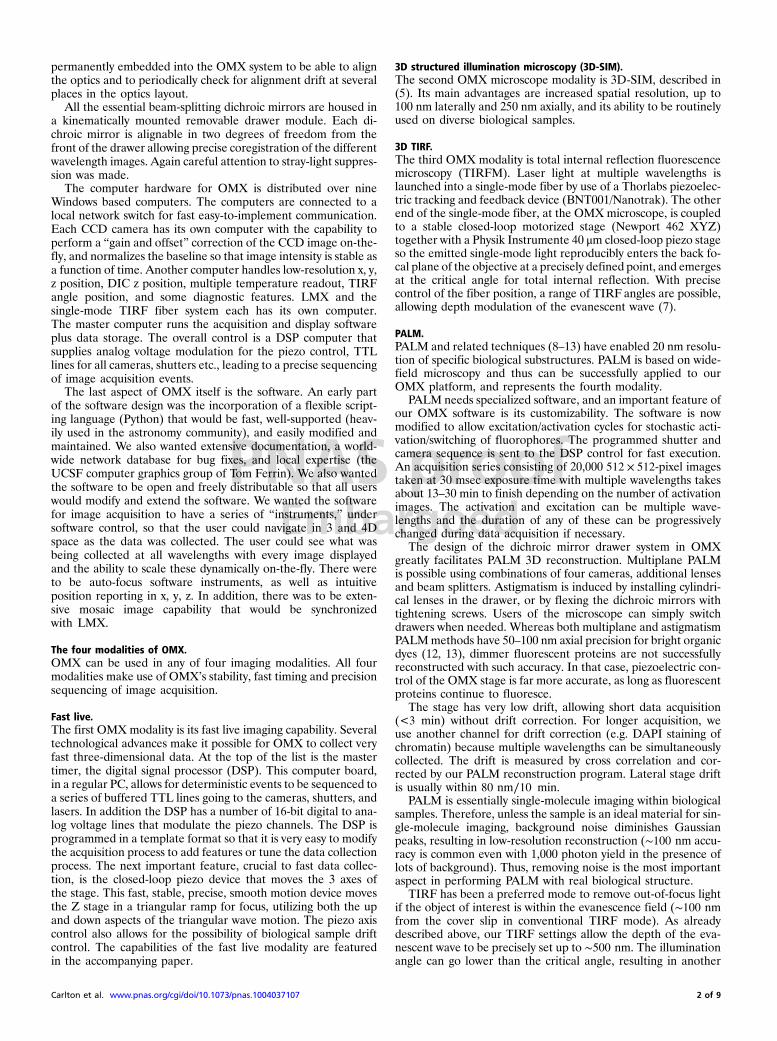
Fig. 3. Denoising increases the signal-to-noise of low-light images. Singleyeast cells are imaged at varying excitation intensities (Left); each row con-tains a different cell. Average projections of raw images are at left, and theprojections of the denoised versions of the same images are at right. Intensityline profiles drawn through the images where indicated (yellow lines) areplotted at right. Profiles are superimposed in the graphs showing the numberof counts (red ¼ raw, green ¼ denoised), and compared side-by-side in thezoomed profiles at far right. Zoomed profiles display the intensity of 35 pixelssurrounding the center point, normalized to the same height for each profile.
2 of 7 ∣ www.pnas.org/cgi/doi/10.1073/pnas.1004037107 Carlton et al.

PNASproof
dominance of noise in the I ¼ 10−4I0 series required time-aver-aging of the four-dimensional data even to be certain that cellimage information was present. Maintaining both viability andsufficient image information is therefore a considerable technicalhurdle in live imaging.
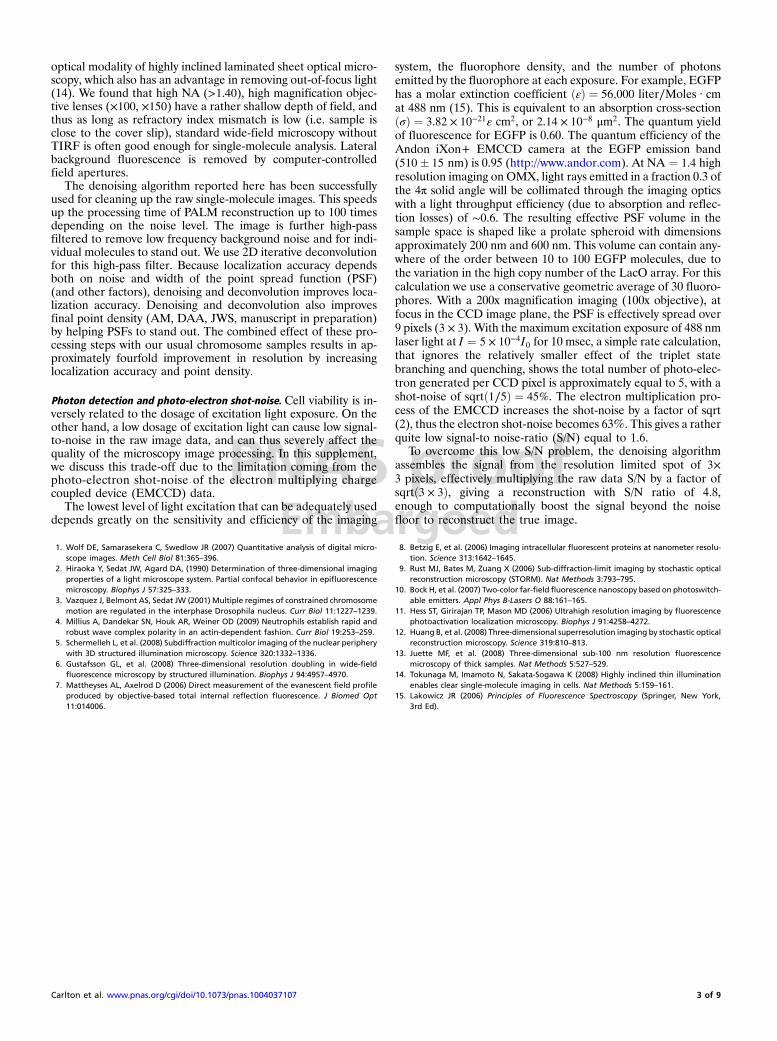
Remarkably, it is possible to computationally recover usefulinformation from the extremely low-dose images without makingany assumptions about sample structure. The approach is to usegeneralized denoising strategies that seek to remove statisticalnoise while preserving relevant sample intensity and spatial infor-mation. A promising denoising algorithm suitable for 2, 3, 4, and5 (space, time, and wavelength) dimensional imaging has beenrecently published (5, 6) and implemented on several computerplatforms. A diagram depicting the functioning of this algorithmis illustrated in Fig. 4. In essence, the denoising proceduretypically first analyzes the image data for statistical signaturesof Poisson and Gaussian noise originating from the limitednumber of photons (Poisson) and the dark current inherent toelectronic imaging detectors (Gaussian). The overall strategy isto find regions of the image, which by virtue of similar statisticalbehavior, are likely to have the same underlying intensity distri-bution and then average them to reduce noise. The challenge is tocorrectly identify appropriate regions to average. More specifi-cally, for each point of the image sequence, a set of pixels, termeda “patch,” of predefined size (e.g., 3 × 3 × 3 or 5 × 5 × 5 pixels) is
considered. A local space and/or time neighborhood (a subset ofthe entire image centered on the current point) is scanned forpatches showing similar intensity statistics. These patches arethen averaged using weights defined as an increasing functionof the similarity with the reference patch. This procedure is iter-ated several times, always averaging the original data but usingthe result of the previous step to perform patch comparisons.At each step, space-time neighborhoods are increased in size al-ternately in space and in time until a statistical control procedure(a “bias-variance” tradeoff) locally stops the growth in space or intime, whereas it may be continued in other locations of the imagesequence. As a result, the shape of space-time neighborhoodsused for denoising is locally adapted to the image content.Finally, the algorithm has been shown to preserve edges andimage intensities over a wide variety of test cases (5, 6).
We applied this denoising strategy to the images in Fig. 3. In-spection of the intensity series of images shows that the yeastfluorescent chromosome site is clearly visible even in the I ¼10−4I0 series. Line plots through the center of the fluorescentchromosome site dramatically demonstrates the rescue of the cellimage data from the noise. In addition, in many cases it is possibleto find the outline of the cell, the boundaries of the nucleus, andpossibly other cellular structures from the faint GFP backgroundfluorescence once the noise has been removed (see Fig. 7). This isimportant as it indicates the ability to recover more generalshapes and not just point-like objects. We conclude that denoisingis a useful tool for studying live 3D structure at light excitationlevels that preserve cell viability.
To test for possible distortion of image information by the de-noising algorithm, 100 nm fluorescent beads were imaged in 3Dat different levels of excitation intensity, and compared with andwithout denoising (Fig. 5). Inspection of the fluorescent signal’sfull width at half maximum (FWHM) from I ¼ 10−3I0 to I ¼10−5I0 shows no significant difference. A slight broadening ofthe FWHM at I ¼ 3 × 10⁻⁶I0 is seen, although the overall bell-shaped profile was unchanged, in contrast to the completelynoise-dominated profile of the raw image. Peak intensity is largelypreserved, but shows a slight reduction after denoising; the mag-nitude of the intensity decrease correlates with the amount ofnoise present. When corrected for excitation intensity, the mea-sured intensity of the fluorescent bead signal after denoising(Fig. 5C) is level within error, but increases in inverse proportionto excitation in the absence of denoising, reflecting the fact thatnoise makes up a larger proportion of the recorded image at lowexcitation intensities. This gives reasonable confidence in quan-titative image features after denoising.
Reduction of Excitation Light Intensity Greatly Reduces Fading. Theuse of low excitation light levels consistent with viability, madepossible by denoising, benefits imaging in other areas as well.A major problem for all live time-lapse microscopy is fluorophorefading. Fluorescent molecules, both small molecule dyes andfluorescent proteins such as GFP, are susceptible to light-inducedchemical alteration. In many cases only a few time points can becollected before the signal approaches the noise floor, or be-comes swamped by autofluorescence. Computational bleach cor-rection can retain the brightness, but this cannot prevent the lossof signal to noise, and eventually extracting quantitative informa-tion becomes impossible. Fading can be eliminated, however, byreducing the excitation light. A time-lapse intensity series (fromFig. 3) displays reduced bleaching curves as the excitation inten-sity is progressively reduced to I ¼ 10−4I0 as seen in Fig. 6A. TheI0 curve fades very quickly into the noise, and even the I ¼ 10−1I0series falls off rapidly. The signal at I ¼ 10−2I0 increases slightly,possibly due to weak photoactivation of EGFP (7), and theemission levels at I ¼ 10−3I0 and I ¼ 10−4I0 are essentiallyunchanging as a function of time, indicating a negligible amountof fading.
Fig. 4. Diagram of the denoising procedure. (A) Illustration two-dimen-sional of N × N pixel patches used for comparisons. The center patch (green)is compared with all other same-sized patches (orange) within a certainneighborhood size (yellow). (B) Extension of this concept into three or fourdimensions: patches at a given timepoint (green cube) are compared to otherpatches of the same size in the same and adjacent timepoints (orange), stillwithin a certain neighborhood size (yellow).
Carlton et al. PNAS Early Edition ∣ 3 of 7
BIOPH
YSICSAND
COMPU
TATIONALBIOLO
GY
INAUGURA
LART
ICLE
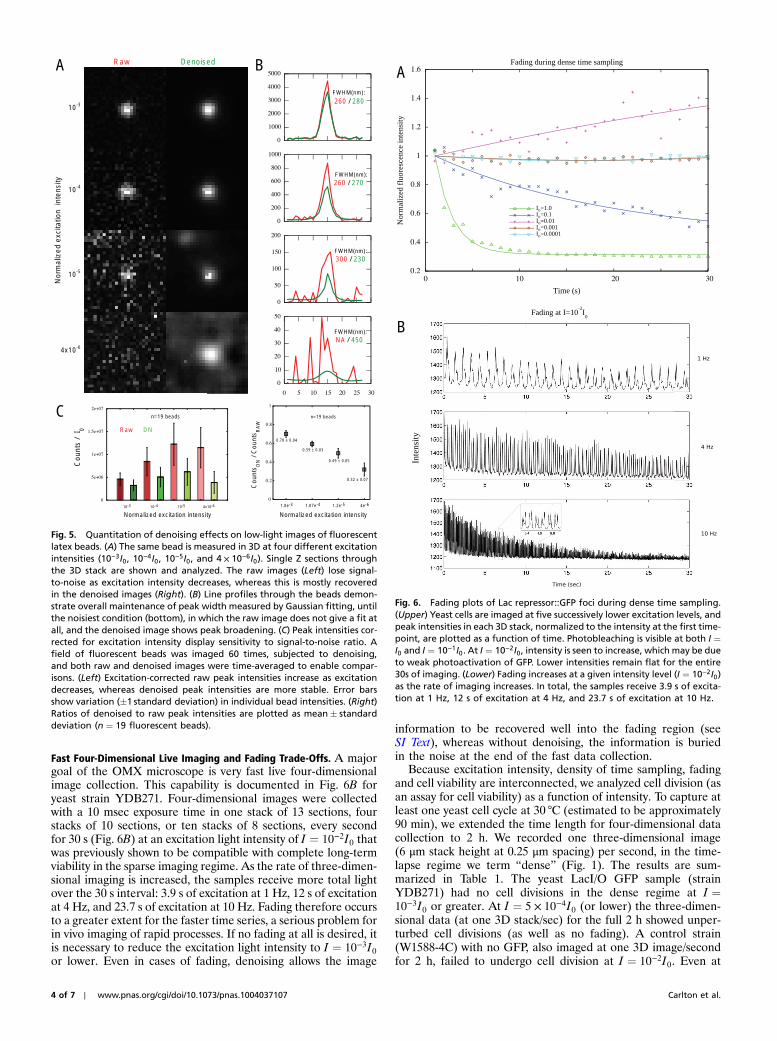
Fast Four-Dimensional Live Imaging and Fading Trade-Offs. A majorgoal of the OMX microscope is very fast live four-dimensionalimage collection. This capability is documented in Fig. 6B foryeast strain YDB271. Four-dimensional images were collectedwith a 10 msec exposure time in one stack of 13 sections, fourstacks of 10 sections, or ten stacks of 8 sections, every secondfor 30 s (Fig. 6B) at an excitation light intensity of I ¼ 10−2I0 thatwas previously shown to be compatible with complete long-termviability in the sparse imaging regime. As the rate of three-dimen-sional imaging is increased, the samples receive more total lightover the 30 s interval: 3.9 s of excitation at 1 Hz, 12 s of excitationat 4 Hz, and 23.7 s of excitation at 10 Hz. Fading therefore occursto a greater extent for the faster time series, a serious problem forin vivo imaging of rapid processes. If no fading at all is desired, itis necessary to reduce the excitation light intensity to I ¼ 10−3I0or lower. Even in cases of fading, denoising allows the image
information to be recovered well into the fading region (seeSI Text), whereas without denoising, the information is buriedin the noise at the end of the fast data collection.
Because excitation intensity, density of time sampling, fadingand cell viability are interconnected, we analyzed cell division (asan assay for cell viability) as a function of intensity. To capture atleast one yeast cell cycle at 30 °C (estimated to be approximately90 min), we extended the time length for four-dimensional datacollection to 2 h. We recorded one three-dimensional image(6 μm stack height at 0.25 μm spacing) per second, in the time-lapse regime we term “dense” (Fig. 1). The results are sum-marized in Table 1. The yeast LacI/O GFP sample (strainYDB271) had no cell divisions in the dense regime at I ¼10−3I0 or greater. At I ¼ 5 × 10⁻⁴I0 (or lower) the three-dimen-sional data (at one 3D stack/sec) for the full 2 h showed unper-turbed cell divisions (as well as no fading). A control strain(W1588-4C) with no GFP, also imaged at one 3D image/secondfor 2 h, failed to undergo cell division at I ¼ 10−2I0. Even at
Raw Denoised
10-3
4x10⁻⁶
10-5
10-4
FWHM(nm):
260 / 280
FWHM(nm):260 / 270
FWHM(nm):300 / 230
FWHM(nm):NA / 450
C
BA
10-3 10-4 10-5 4x10⁻⁶
Raw DN
0.70 ± 0.04
0.59 ± 0.03
0.49 ± 0.05
0.32 ± 0.07
1.0e-3 1.07e-4 1.2e-5 4e-6
n=19 beadsn=19 beads
Cou
nts
/ I 0
Cou
nts D
N /
Cou
nts R
AW
Normalized excitation intensityNormalized excitation intensity
Nor
mal
ized
exc
itatio
n in
tens
ity
Fig. 5. Quantitation of denoising effects on low-light images of fluorescentlatex beads. (A) The same bead is measured in 3D at four different excitationintensities (10−3I0, 10−4I0, 10−5I0, and 4 × 10⁻⁶I0). Single Z sections throughthe 3D stack are shown and analyzed. The raw images (Left) lose signal-to-noise as excitation intensity decreases, whereas this is mostly recoveredin the denoised images (Right). (B) Line profiles through the beads demon-strate overall maintenance of peak width measured by Gaussian fitting, untilthe noisiest condition (bottom), in which the raw image does not give a fit atall, and the denoised image shows peak broadening. (C) Peak intensities cor-rected for excitation intensity display sensitivity to signal-to-noise ratio. Afield of fluorescent beads was imaged 60 times, subjected to denoising,and both raw and denoised images were time-averaged to enable compar-isons. (Left) Excitation-corrected raw peak intensities increase as excitationdecreases, whereas denoised peak intensities are more stable. Error barsshow variation (�1 standard deviation) in individual bead intensities. (Right)Ratios of denoised to raw peak intensities are plotted as mean� standarddeviation (n ¼ 19 fluorescent beads).
Io=1.0Io=0.1Io=0.01Io=0.001Io=0.0001
Time (s)
Fading during dense time sampling
Fading at I=10-2
I
Nor
mal
ized
flu
ores
cenc
e in
tens
ity
A
B
Inte
nsity
0
Fig. 6. Fading plots of Lac repressor::GFP foci during dense time sampling.(Upper) Yeast cells are imaged at five successively lower excitation levels, andpeak intensities in each 3D stack, normalized to the intensity at the first time-point, are plotted as a function of time. Photobleaching is visible at both I ¼I0 and I ¼ 10−1I0. At I ¼ 10−2I0, intensity is seen to increase, which may be dueto weak photoactivation of GFP. Lower intensities remain flat for the entire30s of imaging. (Lower) Fading increases at a given intensity level (I ¼ 10−2I0)as the rate of imaging increases. In total, the samples receive 3.9 s of excita-tion at 1 Hz, 12 s of excitation at 4 Hz, and 23.7 s of excitation at 10 Hz.
4 of 7 ∣ www.pnas.org/cgi/doi/10.1073/pnas.1004037107 Carlton et al.
PNASproof
I ¼ 10−3I0, the control strain took approximately 3 h to resumenormal cell division and growth after the 2 h data collection, pre-sumably reflecting a repair-induced delay.
Another yeast strain (strain SO992), containing a GFP fusionto FYVEEEA1, an endocytic pathway component, (8) was simi-larly imaged (SI Text). At I ¼ 10−3I0, this strain did not divideafter 2 h of dense data collection, indicating phototoxicity. Anisogenic control with no GFP did not divide at I ¼ 10−2I0 butdid divide at I ¼ 10−3I0 intensity, similar to the LacI/O control(strain W1588-4C). Because the strain without GFP can toleratemore excitation light than the strain with GFP, and the strains areotherwise isogenic, the interaction between light and GFP itselfmay be responsible for the increase in phototoxicity. However,even strains without GFP are sensitive to excitation light.
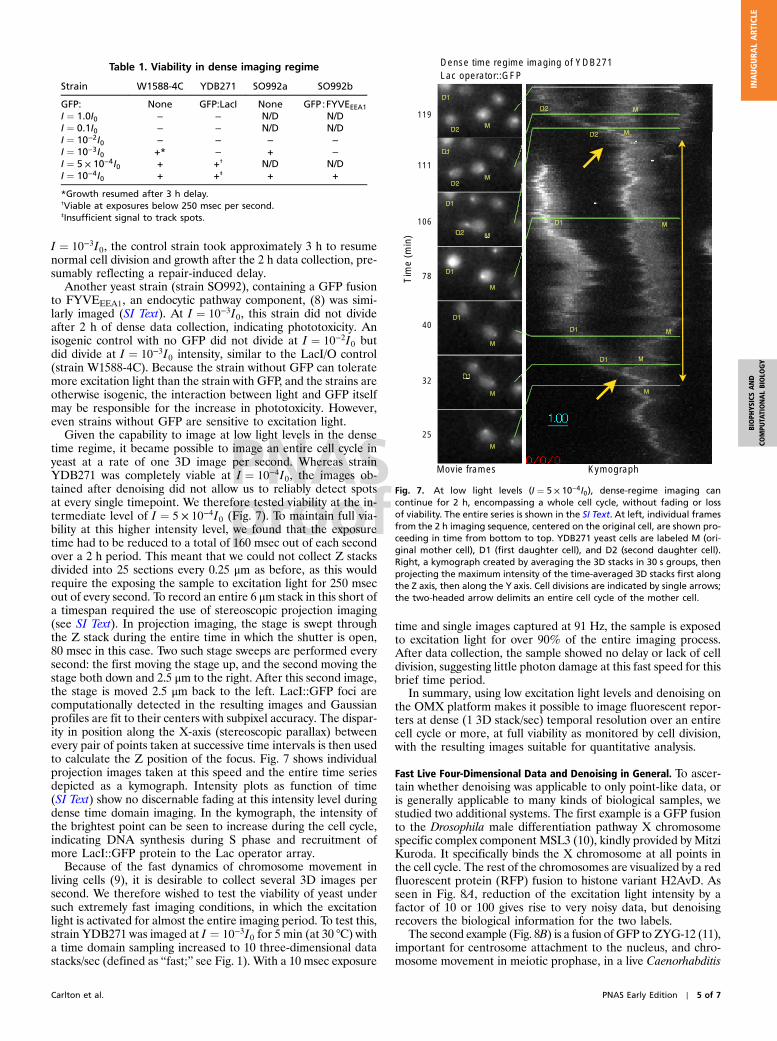
Given the capability to image at low light levels in the densetime regime, it became possible to image an entire cell cycle inyeast at a rate of one 3D image per second. Whereas strainYDB271 was completely viable at I ¼ 10−4I0, the images ob-tained after denoising did not allow us to reliably detect spotsat every single timepoint. We therefore tested viability at the in-termediate level of I ¼ 5 × 10⁻⁴I0 (Fig. 7). To maintain full via-bility at this higher intensity level, we found that the exposuretime had to be reduced to a total of 160 msec out of each secondover a 2 h period. This meant that we could not collect Z stacksdivided into 25 sections every 0.25 μm as before, as this wouldrequire the exposing the sample to excitation light for 250 msecout of every second. To record an entire 6 μm stack in this short ofa timespan required the use of stereoscopic projection imaging(see SI Text). In projection imaging, the stage is swept throughthe Z stack during the entire time in which the shutter is open,80 msec in this case. Two such stage sweeps are performed everysecond: the first moving the stage up, and the second moving thestage both down and 2.5 μm to the right. After this second image,the stage is moved 2.5 μm back to the left. LacI::GFP foci arecomputationally detected in the resulting images and Gaussianprofiles are fit to their centers with subpixel accuracy. The dispar-ity in position along the X-axis (stereoscopic parallax) betweenevery pair of points taken at successive time intervals is then usedto calculate the Z position of the focus. Fig. 7 shows individualprojection images taken at this speed and the entire time seriesdepicted as a kymograph. Intensity plots as function of time(SI Text) show no discernable fading at this intensity level duringdense time domain imaging. In the kymograph, the intensity ofthe brightest point can be seen to increase during the cell cycle,indicating DNA synthesis during S phase and recruitment ofmore LacI::GFP protein to the Lac operator array.
Because of the fast dynamics of chromosome movement inliving cells (9), it is desirable to collect several 3D images persecond. We therefore wished to test the viability of yeast undersuch extremely fast imaging conditions, in which the excitationlight is activated for almost the entire imaging period. To test this,strain YDB271 was imaged at I ¼ 10−3I0 for 5 min (at 30 °C) witha time domain sampling increased to 10 three-dimensional datastacks/sec (defined as “fast;” see Fig. 1). With a 10 msec exposure
time and single images captured at 91 Hz, the sample is exposedto excitation light for over 90% of the entire imaging process.After data collection, the sample showed no delay or lack of celldivision, suggesting little photon damage at this fast speed for thisbrief time period.
In summary, using low excitation light levels and denoising onthe OMX platform makes it possible to image fluorescent repor-ters at dense (1 3D stack/sec) temporal resolution over an entirecell cycle or more, at full viability as monitored by cell division,with the resulting images suitable for quantitative analysis.
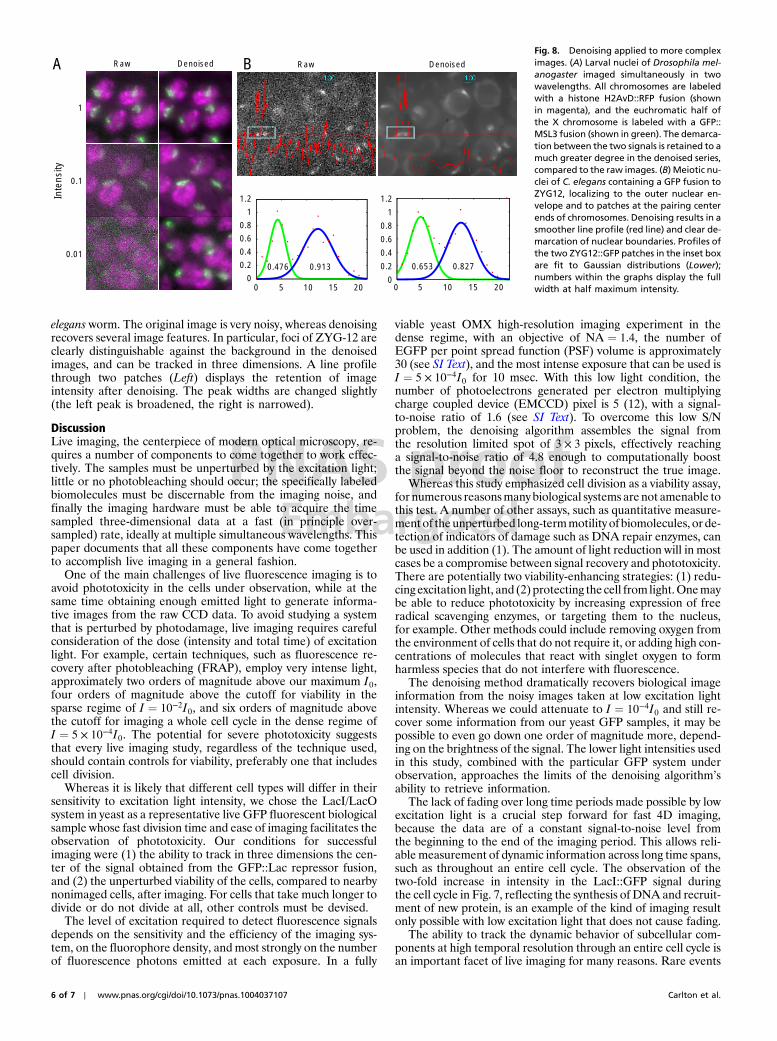
Fast Live Four-Dimensional Data and Denoising in General. To ascer-tain whether denoising was applicable to only point-like data, oris generally applicable to many kinds of biological samples, westudied two additional systems. The first example is a GFP fusionto the Drosophila male differentiation pathway X chromosomespecific complex component MSL3 (10), kindly provided by MitziKuroda. It specifically binds the X chromosome at all points inthe cell cycle. The rest of the chromosomes are visualized by a redfluorescent protein (RFP) fusion to histone variant H2AvD. Asseen in Fig. 8A, reduction of the excitation light intensity by afactor of 10 or 100 gives rise to very noisy data, but denoisingrecovers the biological information for the two labels.
The second example (Fig. 8B) is a fusion of GFP to ZYG-12 (11),important for centrosome attachment to the nucleus, and chro-mosome movement in meiotic prophase, in a live Caenorhabditis
Table 1. Viability in dense imaging regime
Strain W1588-4C YDB271 SO992a SO992b
GFP: None GFP:LacI None GFP∶FYVEEEA1I ¼ 1.0I0 − − N/D N/DI ¼ 0.1I0 − − N/D N/DI ¼ 10−2I0 − − − −
I ¼ 10−3I0 +* − + −
I ¼ 5 × 10⁻⁴I0 + +† N/D N/DI ¼ 10−4I0 + +‡ + +
*Growth resumed after 3 h delay.†Viable at exposures below 250 msec per second.‡Insufficient signal to track spots.
M
119
111
106
78
40
32
25
Dense time regime imaging of YDB271Lac operator::GFP
Movie frames Kymograph
Tim
e (m
in)
Fig. 7. At low light levels (I ¼ 5 × 10⁻⁴I0), dense-regime imaging cancontinue for 2 h, encompassing a whole cell cycle, without fading or lossof viability. The entire series is shown in the SI Text. At left, individual framesfrom the 2 h imaging sequence, centered on the original cell, are shown pro-ceeding in time from bottom to top. YDB271 yeast cells are labeled M (ori-ginal mother cell), D1 (first daughter cell), and D2 (second daughter cell).Right, a kymograph created by averaging the 3D stacks in 30 s groups, thenprojecting the maximum intensity of the time-averaged 3D stacks first alongthe Z axis, then along the Y axis. Cell divisions are indicated by single arrows;the two-headed arrow delimits an entire cell cycle of the mother cell.
Carlton et al. PNAS Early Edition ∣ 5 of 7
BIOPH
YSICSAND
COMPU
TATIONALBIOLO
GY
INAUGURA
LART
ICLE
PNAS proofEmbargoed
elegans worm. The original image is very noisy, whereas denoisingrecovers several image features. In particular, foci of ZYG-12 areclearly distinguishable against the background in the denoisedimages, and can be tracked in three dimensions. A line profilethrough two patches (Left) displays the retention of imageintensity after denoising. The peak widths are changed slightly(the left peak is broadened, the right is narrowed).
DiscussionLive imaging, the centerpiece of modern optical microscopy, re-quires a number of components to come together to work effec-tively. The samples must be unperturbed by the excitation light;little or no photobleaching should occur; the specifically labeledbiomolecules must be discernable from the imaging noise, andfinally the imaging hardware must be able to acquire the timesampled three-dimensional data at a fast (in principle over-sampled) rate, ideally at multiple simultaneous wavelengths. Thispaper documents that all these components have come togetherto accomplish live imaging in a general fashion.
One of the main challenges of live fluorescence imaging is toavoid phototoxicity in the cells under observation, while at thesame time obtaining enough emitted light to generate informa-tive images from the raw CCD data. To avoid studying a systemthat is perturbed by photodamage, live imaging requires carefulconsideration of the dose (intensity and total time) of excitationlight. For example, certain techniques, such as fluorescence re-covery after photobleaching (FRAP), employ very intense light,approximately two orders of magnitude above our maximum I0,four orders of magnitude above the cutoff for viability in thesparse regime of I ¼ 10−2I0, and six orders of magnitude abovethe cutoff for imaging a whole cell cycle in the dense regime ofI ¼ 5 × 10⁻⁴I0. The potential for severe phototoxicity suggeststhat every live imaging study, regardless of the technique used,should contain controls for viability, preferably one that includescell division.
Whereas it is likely that different cell types will differ in theirsensitivity to excitation light intensity, we chose the LacI/LacOsystem in yeast as a representative live GFP fluorescent biologicalsample whose fast division time and ease of imaging facilitates theobservation of phototoxicity. Our conditions for successfulimaging were (1) the ability to track in three dimensions the cen-ter of the signal obtained from the GFP::Lac repressor fusion,and (2) the unperturbed viability of the cells, compared to nearbynonimaged cells, after imaging. For cells that take much longer todivide or do not divide at all, other controls must be devised.
The level of excitation required to detect fluorescence signalsdepends on the sensitivity and the efficiency of the imaging sys-tem, on the fluorophore density, and most strongly on the numberof fluorescence photons emitted at each exposure. In a fully
viable yeast OMX high-resolution imaging experiment in thedense regime, with an objective of NA ¼ 1.4, the number ofEGFP per point spread function (PSF) volume is approximately30 (see SI Text), and the most intense exposure that can be used isI ¼ 5 × 10⁻⁴I0 for 10 msec. With this low light condition, thenumber of photoelectrons generated per electron multiplyingcharge coupled device (EMCCD) pixel is 5 (12), with a signal-to-noise ratio of 1.6 (see SI Text). To overcome this low S/Nproblem, the denoising algorithm assembles the signal fromthe resolution limited spot of 3 × 3 pixels, effectively reachinga signal-to-noise ratio of 4.8 enough to computationally boostthe signal beyond the noise floor to reconstruct the true image.
Whereas this study emphasized cell division as a viability assay,for numerous reasonsmany biological systems are not amenable tothis test. A number of other assays, such as quantitative measure-ment of the unperturbed long-termmotility of biomolecules, or de-tection of indicators of damage such as DNA repair enzymes, canbe used in addition (1). The amount of light reduction will in mostcases be a compromise between signal recovery and phototoxicity.There are potentially two viability-enhancing strategies: (1) redu-cing excitation light, and (2) protecting the cell from light.Onemaybe able to reduce phototoxicity by increasing expression of freeradical scavenging enzymes, or targeting them to the nucleus,for example. Other methods could include removing oxygen fromthe environment of cells that do not require it, or adding high con-centrations of molecules that react with singlet oxygen to formharmless species that do not interfere with fluorescence.
The denoising method dramatically recovers biological imageinformation from the noisy images taken at low excitation lightintensity. Whereas we could attenuate to I ¼ 10−4I0 and still re-cover some information from our yeast GFP samples, it may bepossible to even go down one order of magnitude more, depend-ing on the brightness of the signal. The lower light intensities usedin this study, combined with the particular GFP system underobservation, approaches the limits of the denoising algorithm’sability to retrieve information.
The lack of fading over long time periods made possible by lowexcitation light is a crucial step forward for fast 4D imaging,because the data are of a constant signal-to-noise level fromthe beginning to the end of the imaging period. This allows reli-able measurement of dynamic information across long time spans,such as throughout an entire cell cycle. The observation of thetwo-fold increase in intensity in the LacI::GFP signal duringthe cell cycle in Fig. 7, reflecting the synthesis of DNA and recruit-ment of new protein, is an example of the kind of imaging resultonly possible with low excitation light that does not cause fading.
The ability to track the dynamic behavior of subcellular com-ponents at high temporal resolution through an entire cell cycle isan important facet of live imaging for many reasons. Rare events
0
0.2
0.4
0.6
0.8
1
1.2
0 5 10 15 20
0.653 0.8270
0.2
0.4
0.6
0.8
1
1.2
0 5 10 15 20
0.476 0.913
1
0.1
0.01
Inte
nsity
Raw DenoisedA Raw DenoisedBFig. 8. Denoising applied to more compleximages. (A) Larval nuclei of Drosophila mel-anogaster imaged simultaneously in twowavelengths. All chromosomes are labeledwith a histone H2AvD::RFP fusion (shownin magenta), and the euchromatic half ofthe X chromosome is labeled with a GFP::MSL3 fusion (shown in green). The demarca-tion between the two signals is retained to amuch greater degree in the denoised series,compared to the raw images. (B) Meiotic nu-clei of C. elegans containing a GFP fusion toZYG12, localizing to the outer nuclear en-velope and to patches at the pairing centerends of chromosomes. Denoising results in asmoother line profile (red line) and clear de-marcation of nuclear boundaries. Profiles ofthe two ZYG12::GFP patches in the inset boxare fit to Gaussian distributions (Lower);numbers within the graphs display the fullwidth at half maximum intensity.
6 of 7 ∣ www.pnas.org/cgi/doi/10.1073/pnas.1004037107 Carlton et al.
PNAS proofEmbargoed
that may only occur once per cell cycle will always be captured,and biologically relevant differences in movement as a function ofthe cell cycle are possible to discern. Another advantage is thatinstead of starting and stopping at arbitrary points, the trajectoryof the signal throughout an entire cell cycle is available for ana-lysis. The unbiased nature of the dense imaging regime allowstrue comparisons of dynamics between one cell and anotherwithout needing to artificially synchronize them; instead, trajec-tories can be registered with each other at a defined timepoint(such as the separation of two fluorescent signals at anaphase).
Whereas we have performed these experiments on a single mi-croscope system (OMX), the question is raised whether the re-lationship between excitation power and sensitivity would holdon other microscopes. A careful study of 100 nm fluorescentbeads in both OMX and a DeltaVision microscope showed thatthe detected fluorescence counts per watt of excitation light werewithin 6.7% of each other, thus demonstrating the equivalentsensitivity and light throughput of both systems. Most modernmicroscopy systems have excellent light throughput and arenot likely to appreciably vary from each other; therefore, our re-sults are likely to be generalizable to all in vivo imaging. We havedemonstrated here that fast imaging of live cells involves asurprising amount of phototoxicity, but that with the proper im-age processing algorithms, excitation light may be attenuated incompensation, and useful information can be retrieved.
Materials and MethodsStrains. Yeast. YDB271 ho HMLα hmlprox::lacO(256)-LEU2 MATa HMRα-BamHI ura3 ade1 ade3::GAL::HO leu2 trp1:hisG ura3-52 Spc29-RFP-(kan::Ca-URA3-MX) HIS3::URA3pro::lacI-GFP-(KAN)
W1588-4CMATa ade2-1 trp1-1 can1-100 leu2-3,112 his3-11,15 ura3-1 ssd1-d2 RAD5 bud4 ybp1-1 [psi+]
SO992a MATa far1 bar1::Kan sk2 gal2 sjl1::TRP1SO992b MATa far1 bar1::Kan sk2 gal2 sjl1::TRP1 GFP:FYVEGFP∶FYVEEEA1
Drosophila. Imaged fly tissue genotype: msl3::GFP, H2AvD::mRFP/CyO; msl3::GFP C. elegans. ZYG-12::GFP worms were strain WH223: ojIs9 [zyg-12ABC::GFP unc-119(ed3)]; unc119(ed3)
OMX Microscope. See SI Text for a complete description of the microscopeand its operation.
Data Acquisition. Cells were grown overnight in synthetic + dextrose (SD)medium (yeastminimal mediumþ glucose) at 30 °C in 5 mL cultures on arotary shaker. SD medium with 2% agarose was liquified in a microwaveand poured into a glass-bottomed Petri dish (Bioptechs Delta-T) to a depthof 5 mm. The bottom of the dish is coated with indium tin oxide, allowing
heat to be generated by the application of current. Solidified agarose padswere removed from the dishes; 10 μL of cells were placed in the center of thedish, and covered with the pads. Dishes were placed on the OMX microscopevia a custom-built adaptor connected to a power source (Bioptechs, Inc) thatprovided a current to keep the dish at 30 °C. The objective used for imagingwas kept constantly heated to 30 °C by a thermal ribbon and microcontroller(Minco, Inc) using a custom-built copper collar, 3 mm thick, coupling the ther-mal ribbon to the objective. Cells were imaged with room light only for theinitial 30 min, to distinguish growing from nongrowing cells by the appear-ance of a bud. The positions of newly budded cells were saved in the micro-scope control program, and random subsets of these cells were selected forimaging. For bead imaging, 100 nm red-emitting fluorescent latex beads(Molecular Probes, Inc) were diluted 1∶10;000 in ethanol. A 1 μL drop ofdiluted beads was placed in the center of a plasma-cleaned coverslip, allowedto spread out and air-dry, then mounted on a slide with 5 μL of glycerol. Laserlight at 488 nm and 532 nm was used for excitation of yeast cells and fluor-escent latex beads, respectively. Images were acquired on Andor iXon EMCCDcameras set at their highest gain level. Dark current was calculated byaveraging 512 frames taken with no excitation light, and subtracted fromimages before further processing.
Viability Measurement. After fluorescent imaging was completed, the dishcontaining the cells was retained in position on the microscope for overnightmonitoring with brightfield imaging using ambient room light. Three-dimen-sional brightfield images were acquired every 30 s or 5 min for 12 or morehours during the overnight period, to measure cell division. Maximum-intensity projection images of these images were assembled into movies(see SI Text) and visually inspected to assess viability.
Image Processing. 4D datasets were processed with the denoising algorithm“ndsafir” (5) modified to accept files in our data format. The commandtypically used was: ndsafir_priism $INFILE $OUTFILE -sampling=2 -iter=5-p=3 -noise=gaussian -adapt=0 -island=4 -usetmp , indicating the patchesare calculated every 2 pixels, the number of iterations (increasing the patchsize) was set to 5, the initial patch size was set at 3 pixels, the noise model waspresumed to be Gaussian, the adaptivity parameter was set at 0, the islandthreshold parameter was set at 4, and intermediate steps were saved as tem-porary files. For point tracking, the FindPoints program of the Priism softwaresuite (http://msg.ucsf.edu/IVE) was used. 3D Gaussian fitting was performedon detected peaks using a search box of 5 × 5 × 3 pixels in X, Y, and Z. For 2Dprojection imaging, Gaussian peaks were located in each pair of images; theX coordinate distance between peak pairs, multiplied by the ratio betweenthe Z and X stage movements, was used as the inferred Z coordinate.
ACKNOWLEDGMENTS. We thank Mitzi Kuroda and T. Sural for providing theDrosophila strain, Abby Dernburg for providing the C. elegans strain,Wendell Lim and JessicaWalter for providing yeast strain SO992, Yuri Strukovfor providing and imaging the Drosophila sample preparation, Eric Branlundfor technical support and advice, and Jason Swedlow and Orion Weiner forcomments on the manuscript.
1. Pawley JB (2006) Handbook of Biological Confocal Microscopy (Plenum, New York),2nd Ed.
2. Jamieson DJ (1998) Oxidative stress responses of the yeast Saccharomyces cerevisiae.Yeast 14:1511–1527.
3. Straight AF, et al. (1996) GFP tagging of budding yeast chromosomes reveals that pro-tein–protein interactions can mediate sister chromatid cohesion. Curr Biol6:1599–1608.
4. Weinert TA, Hartwell LH (1988) The RAD9 gene controls the cell cycle response to DNAdamage in Saccharomyces cerevisiae. Science 241:317–322.
5. Boulanger J, Kervrann C, Bouthemy P (2007) Space-time adaptation for patch-basedimage sequence restoration. IEEE T Pattern Anal 29:1096–1102.
6. Boulanger J, et al. (2010) Patch-based nonlocal functional for denoising fluorescencemicroscopy image sequences. IEEE T Med Imaging 29:442–454.
7. Yokoe H, Meyer T (1996) Spatial dynamics of GFP-tagged proteins investigated by localfluorescence enhancement. Nat Biotechnol 14:1252–1256.
8. Burd C, Emr S (1998) Phosphatidylinositol(3)-phosphate signaling mediated by specificbinding to RING FYVE domains. Mol Cell 2:157–162.
9. Marshall W, et al. (1997) Interphase chromosomes undergo constrained diffusionalmotion in living cells. Curr Biol 7:930–939.
10. Gorman M, Franke A, Baker BS (1995) Molecular characterization of the male-specificlethal-3 gene and investigations of the regulation of dosage compensation inDrosophila. Development 121:463–475.
11. Malone CJ, et al. (2003) The C. elegans hook protein, ZYG-12, mediates the essentialattachment between the centrosome and nucleus. Cell 115:825–836.
12. Shaner NC, Steinbach PA, Tsien RY (2005) A guide to choosing fluorescent proteins.NatMethods 2:905–909.
Carlton et al. PNAS Early Edition ∣ 7 of 7
BIOPH
YSICSAND
COMPU
TATIONALBIOLO
GY
INAUGURA
LART
ICLE
PNAS proofEmbargoed
Supporting InformationCarlton et al. 10.1073/pnas.1004037107SI TextSI Materials and Methods OMX: a fresh approach for wide-fieldmicroscopy.Overall concept.It became clear that questions about dynamic chromosomemotion in the nucleus required much higher temporal sampling(and resolution) than what the conventional microscope platformcould deliver. Therefore, a fresh top-to-bottom microscopedesign and implementation was undertaken.
A recent quantitative review of all modern fluorescent micro-scope techniques (1) has shown that wide-field microscopy is themost efficient in photon collection, with spinning disk confocalmicroscopy at approximately 0.25 its sensitivity, followed by stan-dard confocal microscopes at a factor of 0.01 − 0.005 the sensi-tivity of wide-field. Wide-field microscopy, using only an objectiveand a tube lens, and precise sequential positioning of the focalplane within the sample along the optical axis, collects a three-dimensional image (a Z stack) distorted by out-of-focus light.Constrained deconvolution returns out-of-focus light to its cor-rect location (2). Four-dimensional in vivo microscopy must beable to operate under a large range of timescales, from minutesto milliseconds, corresponding to the wide variation in timescalesof biological processes. Many interesting biological problems fallin the extremely rapid end of this range. For example, interphasechromosomes (3) and actin waves (4) exhibit motion in the sub-second range that is very difficult to acquire and study on currentmicroscopes, usually limited, at best, to approximately one 3-dimensional image/sec. In addition, multiple colors (wavelengths)are usually acquired sequentially, making it difficult to quantita-tively compare the position of differently labeled subcellularcomponents at the same timepoint. Thus, the very fast four-di-mensional platform we describe, capable of simultaneous record-ing of different wavelengths, will provide an important imagingmodality well-suited for fast biological processes.
OMX addresses the shortcomings common to most commer-cial systems, and enables the implementation of many newfeatures. With OMX live imaging we are able to collect ten three-dimensional images every second at four simultaneous wave-lengths. In addition, this platform implements three-dimensionalstructured illumination (3D-SIM), allowing subdiffraction 100nm xy and 200–300 nm z resolution (5, 6), as well as single-molecule localizationmicroscopy capability (PALM, STORM, etc.).
There were several design considerations. First, we wanted touse a new microscope design to incorporate features that mightbe especially important to future cell biology, especially the ima-ging of whole organisms or tissues. Tissues contain many poten-tially identifiable cell types in a 3-dimensional arrangement. Acommonly encountered problem is rapidly finding small piecesof tissue scattered over the cover-slip, or finding one sampleof interest out of hundreds of similar tissue pieces on the cover-slip. Secondly, the new microscope platform must collect very fastsubsecond 3-dimensional data cubes at multiple simultaneouswavelengths for sustained periods of time. Thirdly, the micro-scope had to have high-sensitivity electron multiplying (EM)CCDs so that every possible photon could be counted. Coupledwith these features, all the optics had to be designed with mini-mization of stray-light to achieve the highest signal-to-noise data.Fourthly, the microscope had to be extremely stable, drifting onlytens of nanometers per minute, using precision technology.
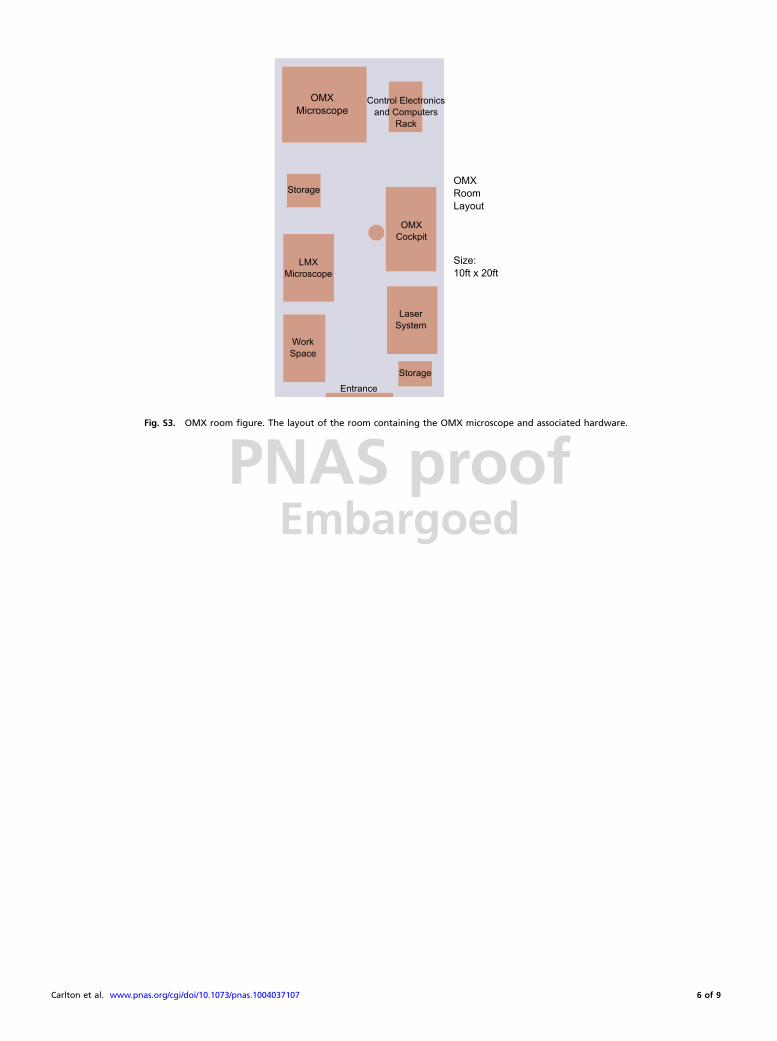
An entire room, approximately 200 ft2 (in our case 10 × 20)comfortably houses this microscope system (Fig. S3). Broadlyspeaking, OMX consists of three parts:
First, there is a separate low magnification microscope stationused for sample location, the LMXmicroscope. This subsystem isbuilt around a Kramer M2, a Zeiss upright dissecting microscopebody with Kramer fluorescence capability and metallurgicalobjectives, producing high resolution images at very high workingdistances. A CCD is provided for continuous scanning. The mo-torized xy-stage is encoded with submicron capability and thesepositions are cross-indexed with OMX itself. We wrote customsoftware to allow building an image mosaic covering a whole 22 ×22 mm cover slip (Fig. S4). Extended sensitivity and resolution byaveraging and/or integrating over times are possible. This auxili-ary microscope can then find objects of interest for further dataanalysis by OMX.
The second subsystem is the laser light source. Solid-state lasersources are very bright (typically 100þ mW), with high stability(better than 1 part in 1000 intensity stability) over the short andlong term, long-lived, and easy to launch into fiber optic cablesleading to the OMX microscope itself. Currently we are using403 nm, 488 nm, 532 nm, 560 nm, and 642 nm lasers. Theseare gated by laser shutters (also beam traps when shutter isclosed) for fast 150 Hz shuttering (nmLaser LST200) followedby a computer driven filter wheel (Thorlabs FW902) with a seriesof dielectric intensity stable neutral density filters (CVI laser).Then the light is parsed by extremely stable pop-up mirrors(New Focus 8892), under computer control to send the lightto either conventional wide-field illumination or structured illu-mination, or a complex closed-loop piezo-aligned single-mode la-ser launch device (Thorlabs NanoTrak/BNT001) so that all laserlines can be optimally launched into the single-mode fiber forTIRF. Finally the coherence of the laser light is scrambled bya rapidly rotating light shaping diffuser (Luminit, formerlyPhysical Optics, model LSD5GL1) to minimize laser speckle.
The third subsystem is OMX itself, which consists of severalcomponents. The first component is a clean room enclosure ap-proximately 5 × 5 × 8 ft. The enclosure is light tight, class 100(when purged and people free for a few hr), prefiltered with char-coal filters to remove coarse and fume/odor laden air, with acous-tic dampening/isolation. The enclosure exists in a conventionalair-conditioned room (22.3 °C, with ∼0.5° temperature stability),but the HEPA fan unit, providing positive pressure, buffers thetemperature fluctuation to ∼0.01–0.03 °C over many hours.Whereas the enclosure was designed to throttle the fan motordown to reduce vibration and use PID solid-state air conditionerfor ultimate temperature stability, we have not used these designfeatures. The enclosure is designed for users to open the door,(automatically turning on the room light) place the sample onOMX, and close the door (turning off the light). Subsequentinteraction with the sample, through the use of CCDs, takes placeat the console/visualization station.
Inside the enclosure, OMX sits on a Newport vibration isola-tion 4 inch damped (SG series) breadboard-table. OMX ismachined out of a solid block of 7075 stressed-relieved alu-minum, solidly bolted to the table, and purged with positivepressure filtered (0.45 μ) dry nitrogen for moisture control ofthe dichroic and emission filters. Extensive care in the OMX de-sign was made for minimizing stray-light and for utmost stability.Zerodur, a highly temperature invariant and insulating ceramic,was used for kinematic mounting of the single objective and thestage. Movement of the stage over a 1-inch cube in x, y, z uses aNewport 462 series interferometer grade stage, encoded micro-stepper stage motors and incorporated closed-loop piezoelectricmotors (Piezosystem Jena) in each axis. An alignment laser is
Carlton et al. www.pnas.org/cgi/doi/10.1073/pnas.1004037107 1 of 9
PNAS proofEmbargoed
permanently embedded into the OMX system to be able to alignthe optics and to periodically check for alignment drift at severalplaces in the optics layout.
All the essential beam-splitting dichroic mirrors are housed ina kinematically mounted removable drawer module. Each di-chroic mirror is alignable in two degrees of freedom from thefront of the drawer allowing precise coregistration of the differentwavelength images. Again careful attention to stray-light suppres-sion was made.
The computer hardware for OMX is distributed over nineWindows based computers. The computers are connected to alocal network switch for fast easy-to-implement communication.Each CCD camera has its own computer with the capability toperform a “gain and offset” correction of the CCD image on-the-fly, and normalizes the baseline so that image intensity is stable asa function of time. Another computer handles low-resolution x, y,z position, DIC z position, multiple temperature readout, TIRFangle position, and some diagnostic features. LMX and thesingle-mode TIRF fiber system each has its own computer.The master computer runs the acquisition and display softwareplus data storage. The overall control is a DSP computer thatsupplies analog voltage modulation for the piezo control, TTLlines for all cameras, shutters etc., leading to a precise sequencingof image acquisition events.
The last aspect of OMX itself is the software. An early partof the software design was the incorporation of a flexible script-ing language (Python) that would be fast, well-supported (heav-ily used in the astronomy community), and easily modified andmaintained. We also wanted extensive documentation, a world-wide network database for bug fixes, and local expertise (theUCSF computer graphics group of Tom Ferrin). We also wantedthe software to be open and freely distributable so that all userswould modify and extend the software. We wanted the softwarefor image acquisition to have a series of “instruments,” undersoftware control, so that the user could navigate in 3 and 4Dspace as the data was collected. The user could see what wasbeing collected at all wavelengths with every image displayedand the ability to scale these dynamically on-the-fly. There wereto be auto-focus software instruments, as well as intuitiveposition reporting in x, y, z. In addition, there was to be exten-sive mosaic image capability that would be synchronizedwith LMX.
The four modalities of OMX.OMX can be used in any of four imaging modalities. All fourmodalities make use of OMX’s stability, fast timing and precisionsequencing of image acquisition.
Fast live.The first OMX modality is its fast live imaging capability. Severaltechnological advances make it possible for OMX to collect veryfast three-dimensional data. At the top of the list is the mastertimer, the digital signal processor (DSP). This computer board,in a regular PC, allows for deterministic events to be sequenced toa series of buffered TTL lines going to the cameras, shutters, andlasers. In addition the DSP has a number of 16-bit digital to ana-log voltage lines that modulate the piezo channels. The DSP isprogrammed in a template format so that it is very easy to modifythe acquisition process to add features or tune the data collectionprocess. The next important feature, crucial to fast data collec-tion, is the closed-loop piezo device that moves the 3 axes ofthe stage. This fast, stable, precise, smooth motion device movesthe Z stage in a triangular ramp for focus, utilizing both the upand down aspects of the triangular wave motion. The piezo axiscontrol also allows for the possibility of biological sample driftcontrol. The capabilities of the fast live modality are featuredin the accompanying paper.
3D structured illumination microscopy (3D-SIM).The second OMX microscope modality is 3D-SIM, described in(5). Its main advantages are increased spatial resolution, up to100 nm laterally and 250 nm axially, and its ability to be routinelyused on diverse biological samples.
3D TIRF.The third OMX modality is total internal reflection fluorescencemicroscopy (TIRFM). Laser light at multiple wavelengths islaunched into a single-mode fiber by use of a Thorlabs piezoelec-tric tracking and feedback device (BNT001/Nanotrak). The otherend of the single-mode fiber, at the OMX microscope, is coupledto a stable closed-loop motorized stage (Newport 462 XYZ)together with a Physik Instrumente 40 μm closed-loop piezo stageso the emitted single-mode light reproducibly enters the back fo-cal plane of the objective at a precisely defined point, and emergesat the critical angle for total internal reflection. With precisecontrol of the fiber position, a range of TIRF angles are possible,allowing depth modulation of the evanescent wave (7).
PALM.PALM and related techniques (8–13) have enabled 20 nm resolu-tion of specific biological substructures. PALM is based on wide-field microscopy and thus can be successfully applied to ourOMX platform, and represents the fourth modality.
PALM needs specialized software, and an important feature ofour OMX software is its customizability. The software is nowmodified to allow excitation/activation cycles for stochastic acti-vation/switching of fluorophores. The programmed shutter andcamera sequence is sent to the DSP control for fast execution.An acquisition series consisting of 20,000 512 × 512-pixel imagestaken at 30 msec exposure time with multiple wavelengths takesabout 13–30 min to finish depending on the number of activationimages. The activation and excitation can be multiple wave-lengths and the duration of any of these can be progressivelychanged during data acquisition if necessary.
The design of the dichroic mirror drawer system in OMXgreatly facilitates PALM 3D reconstruction. Multiplane PALMis possible using combinations of four cameras, additional lensesand beam splitters. Astigmatism is induced by installing cylindri-cal lenses in the drawer, or by flexing the dichroic mirrors withtightening screws. Users of the microscope can simply switchdrawers when needed. Whereas both multiplane and astigmatismPALMmethods have 50–100 nm axial precision for bright organicdyes (12, 13), dimmer fluorescent proteins are not successfullyreconstructed with such accuracy. In that case, piezoelectric con-trol of the OMX stage is far more accurate, as long as fluorescentproteins continue to fluoresce.
The stage has very low drift, allowing short data acquisition(<3 min) without drift correction. For longer acquisition, weuse another channel for drift correction (e.g. DAPI staining ofchromatin) because multiple wavelengths can be simultaneouslycollected. The drift is measured by cross correlation and cor-rected by our PALM reconstruction program. Lateral stage driftis usually within 80 nm∕10 min.
PALM is essentially single-molecule imaging within biologicalsamples. Therefore, unless the sample is an ideal material for sin-gle-molecule imaging, background noise diminishes Gaussianpeaks, resulting in low-resolution reconstruction (∼100 nm accu-racy is common even with 1,000 photon yield in the presence oflots of background). Thus, removing noise is the most importantaspect in performing PALM with real biological structure.
TIRF has been a preferred mode to remove out-of-focus lightif the object of interest is within the evanescence field (∼100 nmfrom the cover slip in conventional TIRF mode). As alreadydescribed above, our TIRF settings allow the depth of the eva-nescent wave to be precisely set up to ∼500 nm. The illuminationangle can go lower than the critical angle, resulting in another
Carlton et al. www.pnas.org/cgi/doi/10.1073/pnas.1004037107 2 of 9
PNAS proofEmbargoed
optical modality of highly inclined laminated sheet optical micro-scopy, which also has an advantage in removing out-of-focus light(14). We found that high NA (>1.40), high magnification objec-tive lenses (×100, ×150) have a rather shallow depth of field, andthus as long as refractory index mismatch is low (i.e. sample isclose to the cover slip), standard wide-field microscopy withoutTIRF is often good enough for single-molecule analysis. Lateralbackground fluorescence is removed by computer-controlledfield apertures.
The denoising algorithm reported here has been successfullyused for cleaning up the raw single-molecule images. This speedsup the processing time of PALM reconstruction up to 100 timesdepending on the noise level. The image is further high-passfiltered to remove low frequency background noise and for indi-vidual molecules to stand out. We use 2D iterative deconvolutionfor this high-pass filter. Because localization accuracy dependsboth on noise and width of the point spread function (PSF)(and other factors), denoising and deconvolution improves loca-lization accuracy. Denoising and deconvolution also improvesfinal point density (AM, DAA, JWS, manuscript in preparation)by helping PSFs to stand out. The combined effect of these pro-cessing steps with our usual chromosome samples results in ap-proximately fourfold improvement in resolution by increasinglocalization accuracy and point density.
Photon detection and photo-electron shot-noise. Cell viability is in-versely related to the dosage of excitation light exposure. On theother hand, a low dosage of excitation light can cause low signal-to-noise in the raw image data, and can thus severely affect thequality of the microscopy image processing. In this supplement,we discuss this trade-off due to the limitation coming from thephoto-electron shot-noise of the electron multiplying chargecoupled device (EMCCD) data.
The lowest level of light excitation that can be adequately useddepends greatly on the sensitivity and efficiency of the imaging
system, the fluorophore density, and the number of photonsemitted by the fluorophore at each exposure. For example, EGFPhas a molar extinction coefficient ðεÞ ¼ 56;000 liter∕Moles · cmat 488 nm (15). This is equivalent to an absorption cross-sectionðσÞ ¼ 3.82 × 10⁻²¹ε cm2, or 2.14 × 10⁻⁸ μm2. The quantum yieldof fluorescence for EGFP is 0.60. The quantum efficiency of theAndon iXon+ EMCCD camera at the EGFP emission band(510� 15 nm) is 0.95 (http://www.andor.com). At NA ¼ 1.4 highresolution imaging on OMX, light rays emitted in a fraction 0.3 ofthe 4π solid angle will be collimated through the imaging opticswith a light throughput efficiency (due to absorption and reflec-tion losses) of ∼0.6. The resulting effective PSF volume in thesample space is shaped like a prolate spheroid with dimensionsapproximately 200 nm and 600 nm. This volume can contain any-where of the order between 10 to 100 EGFP molecules, due tothe variation in the high copy number of the LacO array. For thiscalculation we use a conservative geometric average of 30 fluoro-phores. With a 200x magnification imaging (100x objective), atfocus in the CCD image plane, the PSF is effectively spread over9 pixels (3 × 3). With the maximum excitation exposure of 488 nmlaser light at I ¼ 5 × 10⁻⁴I0 for 10 msec, a simple rate calculation,that ignores the relatively smaller effect of the triplet statebranching and quenching, shows the total number of photo-elec-tron generated per CCD pixel is approximately equal to 5, with ashot-noise of sqrtð1∕5Þ ¼ 45%. The electron multiplication pro-cess of the EMCCD increases the shot-noise by a factor of sqrt(2), thus the electron shot-noise becomes 63%. This gives a ratherquite low signal-to noise-ratio (S/N) equal to 1.6.
To overcome this low S/N problem, the denoising algorithmassembles the signal from the resolution limited spot of 3×3 pixels, effectively multiplying the raw data S/N by a factor ofsqrtð3 × 3Þ, giving a reconstruction with S/N ratio of 4.8,enough to computationally boost the signal beyond the noisefloor to reconstruct the true image.
1. Wolf DE, Samarasekera C, Swedlow JR (2007) Quantitative analysis of digital micro-scope images. Meth Cell Biol 81:365–396.
2. Hiraoka Y, Sedat JW, Agard DA, (1990) Determination of three-dimensional imagingproperties of a light microscope system. Partial confocal behavior in epifluorescencemicroscopy. Biophys J 57:325–333.
3. Vazquez J, Belmont AS, Sedat JW (2001) Multiple regimes of constrained chromosomemotion are regulated in the interphase Drosophila nucleus. Curr Biol 11:1227–1239.
4. Millius A, Dandekar SN, Houk AR, Weiner OD (2009) Neutrophils establish rapid androbust wave complex polarity in an actin-dependent fashion. Curr Biol 19:253–259.
5. Schermelleh L, et al. (2008) Subdiffraction multicolor imaging of the nuclear peripherywith 3D structured illumination microscopy. Science 320:1332–1336.
6. Gustafsson GL, et al. (2008) Three-dimensional resolution doubling in wide-fieldfluorescence microscopy by structured illumination. Biophys J 94:4957–4970.
7. Mattheyses AL, Axelrod D (2006) Direct measurement of the evanescent field profileproduced by objective-based total internal reflection fluorescence. J Biomed Opt11:014006.
8. Betzig E, et al. (2006) Imaging intracellular fluorescent proteins at nanometer resolu-tion. Science 313:1642–1645.
9. Rust MJ, Bates M, Zuang X (2006) Sub-diffraction-limit imaging by stochastic opticalreconstruction microscopy (STORM). Nat Methods 3:793–795.
10. Bock H, et al. (2007) Two-color far-field fluorescence nanoscopy based on photoswitch-able emitters. Appl Phys B-Lasers O 88:161–165.
11. Hess ST, Girirajan TP, Mason MD (2006) Ultrahigh resolution imaging by fluorescencephotoactivation localization microscopy. Biophys J 91:4258–4272.
12. Huang B, et al. (2008) Three-dimensional superresolution imaging by stochastic opticalreconstruction microscopy. Science 319:810–813.
13. Juette MF, et al. (2008) Three-dimensional sub-100 nm resolution fluorescencemicroscopy of thick samples. Nat Methods 5:527–529.
14. Tokunaga M, Imamoto N, Sakata-Sogawa K (2008) Highly inclined thin illuminationenables clear single-molecule imaging in cells. Nat Methods 5:159–161.
15. Lakowicz JR (2006) Principles of Fluorescence Spectroscopy (Springer, New York,3rd Ed).
Carlton et al. www.pnas.org/cgi/doi/10.1073/pnas.1004037107 3 of 9
PNAS proofEmbargoed
Raw Denoised
A
B
C
D
E} }
Z
XY
Raw Denoised
Time (s)
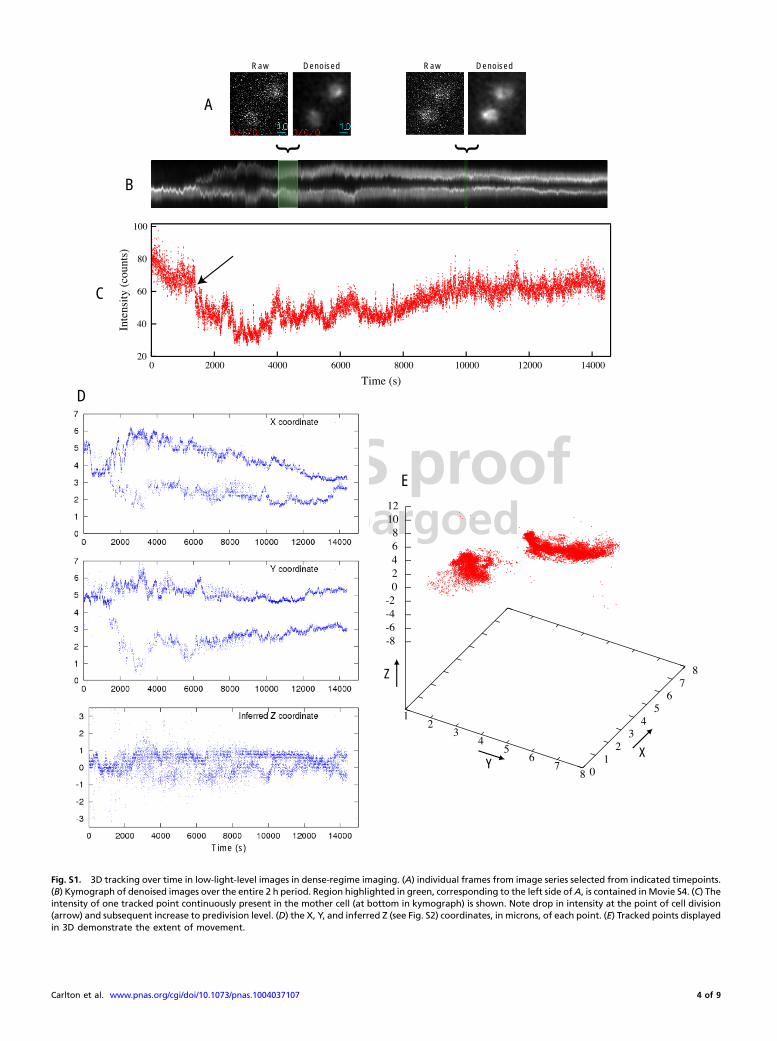
Fig. S1. 3D tracking over time in low-light-level images in dense-regime imaging. (A) individual frames from image series selected from indicated timepoints.(B) Kymograph of denoised images over the entire 2 h period. Region highlighted in green, corresponding to the left side ofA, is contained inMovie S4. (C) Theintensity of one tracked point continuously present in the mother cell (at bottom in kymograph) is shown. Note drop in intensity at the point of cell division(arrow) and subsequent increase to predivision level. (D) the X, Y, and inferred Z (see Fig. S2) coordinates, in microns, of each point. (E) Tracked points displayedin 3D demonstrate the extent of movement.
Carlton et al. www.pnas.org/cgi/doi/10.1073/pnas.1004037107 4 of 9
PNAS proofEmbargoed
0.0 0.0
0.080.538
Time(s) Time(s)
1.0
1.538
0.092
.172
1.0
1.08
1.092
1.172
250 msec 160 msecTotal exposure time:
Time of one "snapshot": 538 msec 172 msec
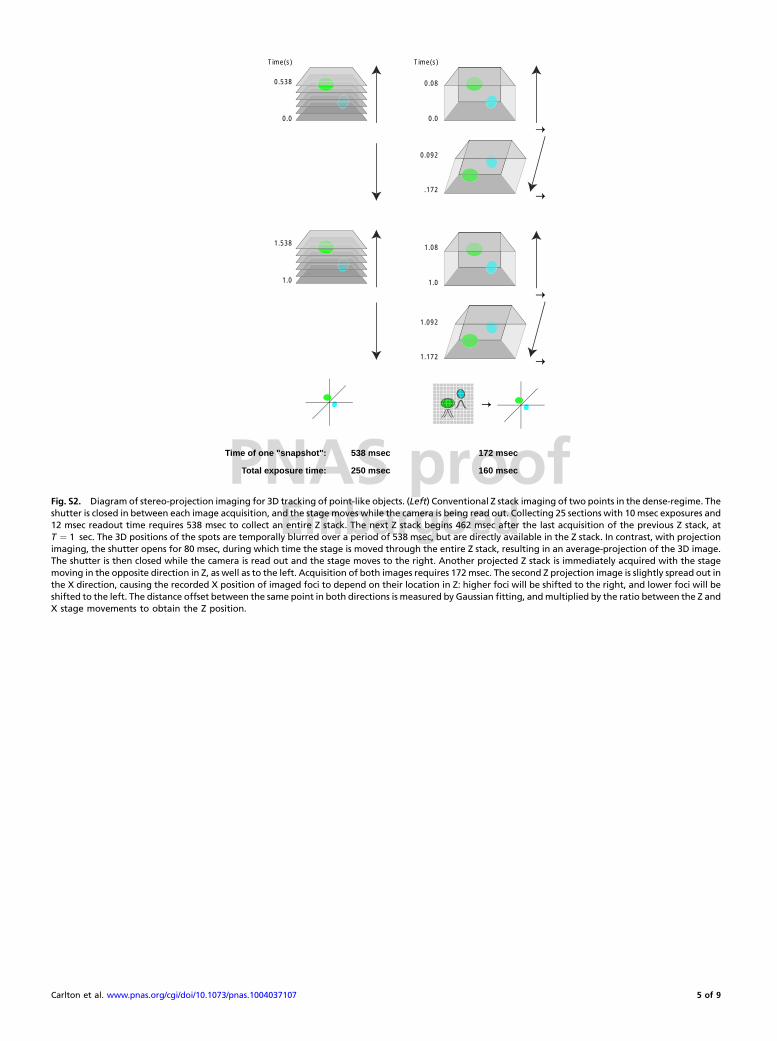
Fig. S2. Diagram of stereo-projection imaging for 3D tracking of point-like objects. (Left) Conventional Z stack imaging of two points in the dense-regime. Theshutter is closed in between each image acquisition, and the stage moves while the camera is being read out. Collecting 25 sections with 10msec exposures and12 msec readout time requires 538 msec to collect an entire Z stack. The next Z stack begins 462 msec after the last acquisition of the previous Z stack, atT ¼ 1 sec. The 3D positions of the spots are temporally blurred over a period of 538 msec, but are directly available in the Z stack. In contrast, with projectionimaging, the shutter opens for 80 msec, during which time the stage is moved through the entire Z stack, resulting in an average-projection of the 3D image.The shutter is then closed while the camera is read out and the stage moves to the right. Another projected Z stack is immediately acquired with the stagemoving in the opposite direction in Z, as well as to the left. Acquisition of both images requires 172msec. The second Z projection image is slightly spread out inthe X direction, causing the recorded X position of imaged foci to depend on their location in Z: higher foci will be shifted to the right, and lower foci will beshifted to the left. The distance offset between the same point in both directions is measured by Gaussian fitting, andmultiplied by the ratio between the Z andX stage movements to obtain the Z position.
Carlton et al. www.pnas.org/cgi/doi/10.1073/pnas.1004037107 5 of 9
PNAS proofEmbargoed
Fig. S3. OMX room figure. The layout of the room containing the OMX microscope and associated hardware.
Carlton et al. www.pnas.org/cgi/doi/10.1073/pnas.1004037107 6 of 9
PNAS proofEmbargoed
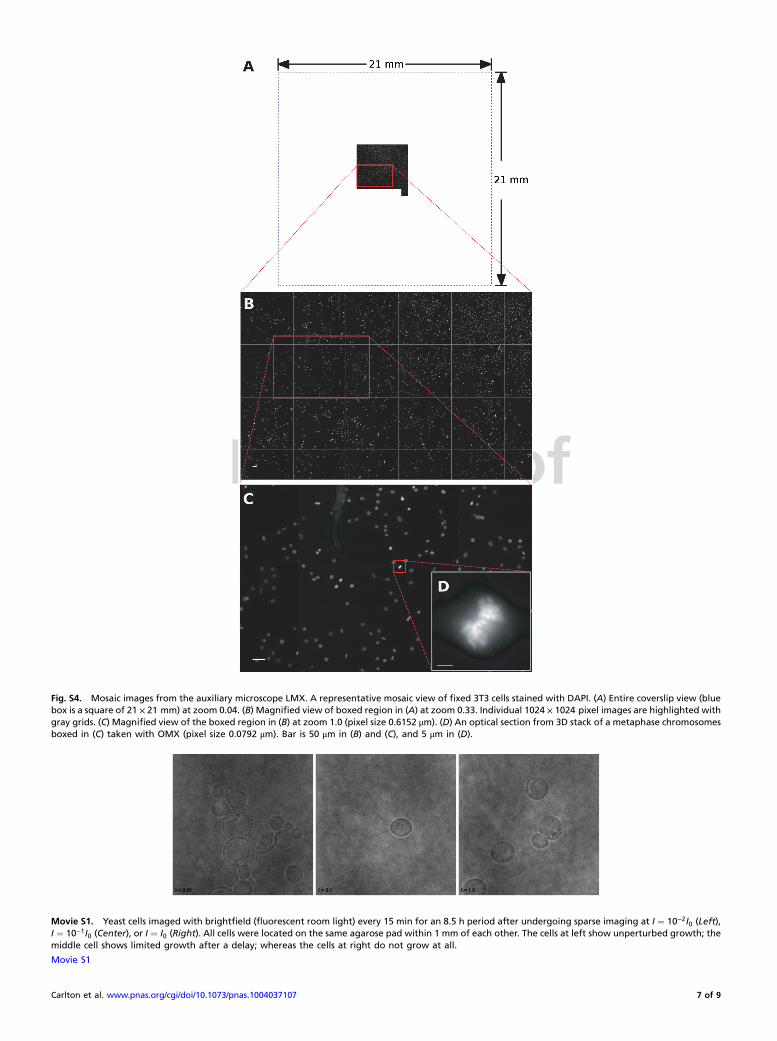
Fig. S4. Mosaic images from the auxiliary microscope LMX. A representative mosaic view of fixed 3T3 cells stained with DAPI. (A) Entire coverslip view (bluebox is a square of 21 × 21 mm) at zoom 0.04. (B) Magnified view of boxed region in (A) at zoom 0.33. Individual 1024 × 1024 pixel images are highlighted withgray grids. (C) Magnified view of the boxed region in (B) at zoom 1.0 (pixel size 0.6152 μm). (D) An optical section from 3D stack of a metaphase chromosomesboxed in (C) taken with OMX (pixel size 0.0792 μm). Bar is 50 μm in (B) and (C), and 5 μm in (D).
Movie S1. Yeast cells imaged with brightfield (fluorescent room light) every 15 min for an 8.5 h period after undergoing sparse imaging at I ¼ 10−2I0 (Left),I ¼ 10−1I0 (Center), or I ¼ I0 (Right). All cells were located on the same agarose pad within 1 mm of each other. The cells at left show unperturbed growth; themiddle cell shows limited growth after a delay; whereas the cells at right do not grow at all.
Movie S1
Carlton et al. www.pnas.org/cgi/doi/10.1073/pnas.1004037107 7 of 9
PNAS proofEmbargoed
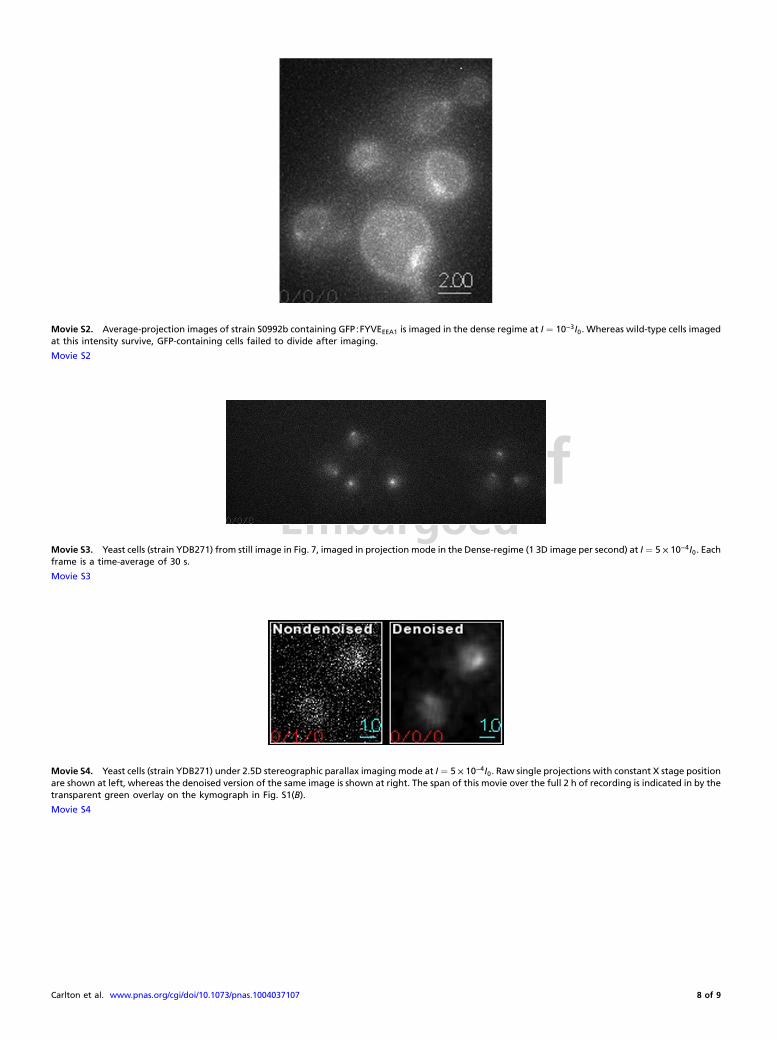
Movie S2. Average-projection images of strain S0992b containing GFP∶FYVEEEA1 is imaged in the dense regime at I ¼ 10−3I0. Whereas wild-type cells imagedat this intensity survive, GFP-containing cells failed to divide after imaging.
Movie S2
Movie S3. Yeast cells (strain YDB271) from still image in Fig. 7, imaged in projection mode in the Dense-regime (1 3D image per second) at I ¼ 5 × 10⁻⁴I0. Eachframe is a time-average of 30 s.
Movie S3
Movie S4. Yeast cells (strain YDB271) under 2.5D stereographic parallax imaging mode at I ¼ 5 × 10⁻⁴I0. Raw single projections with constant X stage positionare shown at left, whereas the denoised version of the same image is shown at right. The span of this movie over the full 2 h of recording is indicated in by thetransparent green overlay on the kymograph in Fig. S1(B).
Movie S4
Carlton et al. www.pnas.org/cgi/doi/10.1073/pnas.1004037107 8 of 9
PNAS proofEmbargoed
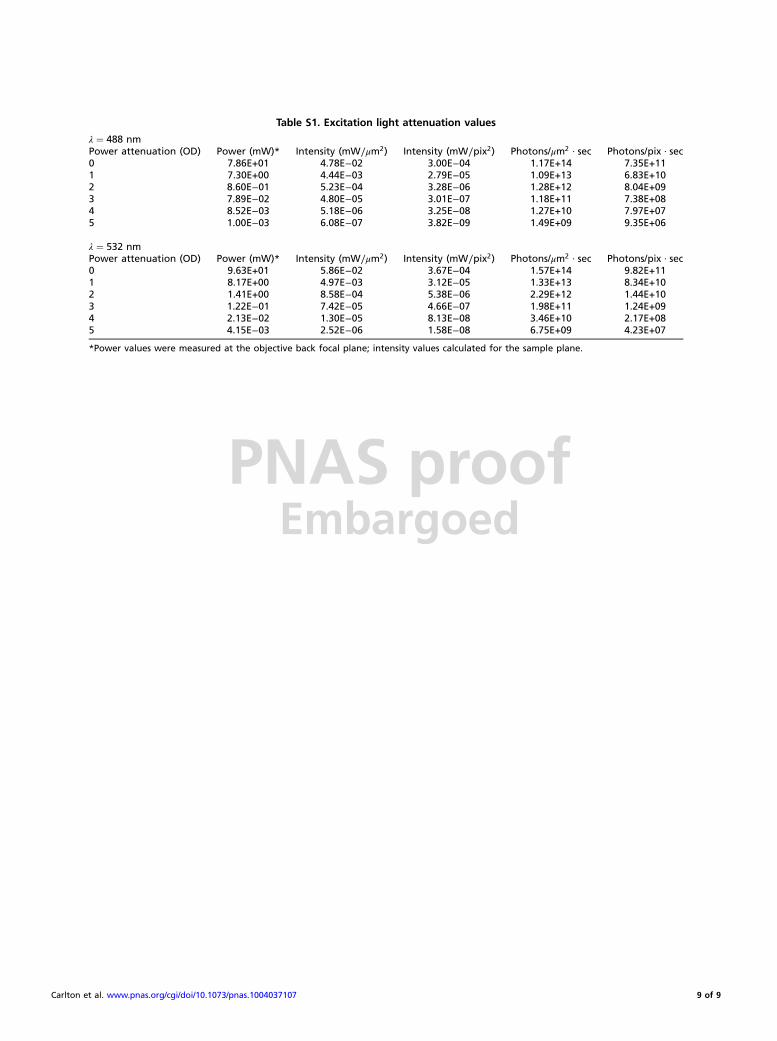
Table S1. Excitation light attenuation values
λ ¼ 488 nmPower attenuation (OD) Power (mW)* Intensity (mW∕μm2) Intensity (mW∕pix2) Photons/μm2 · sec Photons/pix · sec0 7.86E+01 4.78E−02 3.00E−04 1.17E+14 7.35E+111 7.30E+00 4.44E−03 2.79E−05 1.09E+13 6.83E+102 8.60E−01 5.23E−04 3.28E−06 1.28E+12 8.04E+093 7.89E−02 4.80E−05 3.01E−07 1.18E+11 7.38E+084 8.52E−03 5.18E−06 3.25E−08 1.27E+10 7.97E+075 1.00E−03 6.08E−07 3.82E−09 1.49E+09 9.35E+06
λ ¼ 532 nmPower attenuation (OD) Power (mW)* Intensity (mW∕μm2) Intensity (mW∕pix2) Photons/μm2 · sec Photons/pix · sec0 9.63E+01 5.86E−02 3.67E−04 1.57E+14 9.82E+111 8.17E+00 4.97E−03 3.12E−05 1.33E+13 8.34E+102 1.41E+00 8.58E−04 5.38E−06 2.29E+12 1.44E+103 1.22E−01 7.42E−05 4.66E−07 1.98E+11 1.24E+094 2.13E−02 1.30E−05 8.13E−08 3.46E+10 2.17E+085 4.15E−03 2.52E−06 1.58E−08 6.75E+09 4.23E+07
*Power values were measured at the objective back focal plane; intensity values calculated for the sample plane.
Carlton et al. www.pnas.org/cgi/doi/10.1073/pnas.1004037107 9 of 9