resonate - presenting stories that transform your audience
TRANSCRIPT

Copyright © 2010 by Monitor Company Group, L.P.
No part of this publication may be reproduced— without the permission of Monitor Company Group, L.P.
This document provides an outline of a presentation and is incomplete without the accompanying oral commentary and discussion.
COMPANY CONFIDENTIAL
SANTIAGO SAN FRANCISCO SÃO PAULO SEOUL SHENZHEN SINGAPORE SYDNEY TAIPEI TEHRAN TOKYO TORONTO VANCOUVER ZURICHSHANGHAI SHENYANG
ABIDJAN BEIJING BERLIN CAPE TOWN CASABLANCA CHICAGO HONG KONGBOSTON CAIRO DELHI DUBAI HANOI HARBIN JAKARTA JOHANNESBURG KARACHI LAGOS
PARIS RIO DE JANEIRO SAINT PETERSBURGLOS ANGELES MADRID MEXICO CITY MUMBAI NAIROBI NANJING MUNICH NEW YORKMOSCOWLIMA LONDON
ResonatePresenting stories that transform your audienceSingapore Masterclass, May 4th, 2010
John Gregg, Associate Principal China & Head Emerging MarketsThe Monitor Company Group
2Copyright © 2010 Monitor Company Group, L.P. — Confidential — LAX
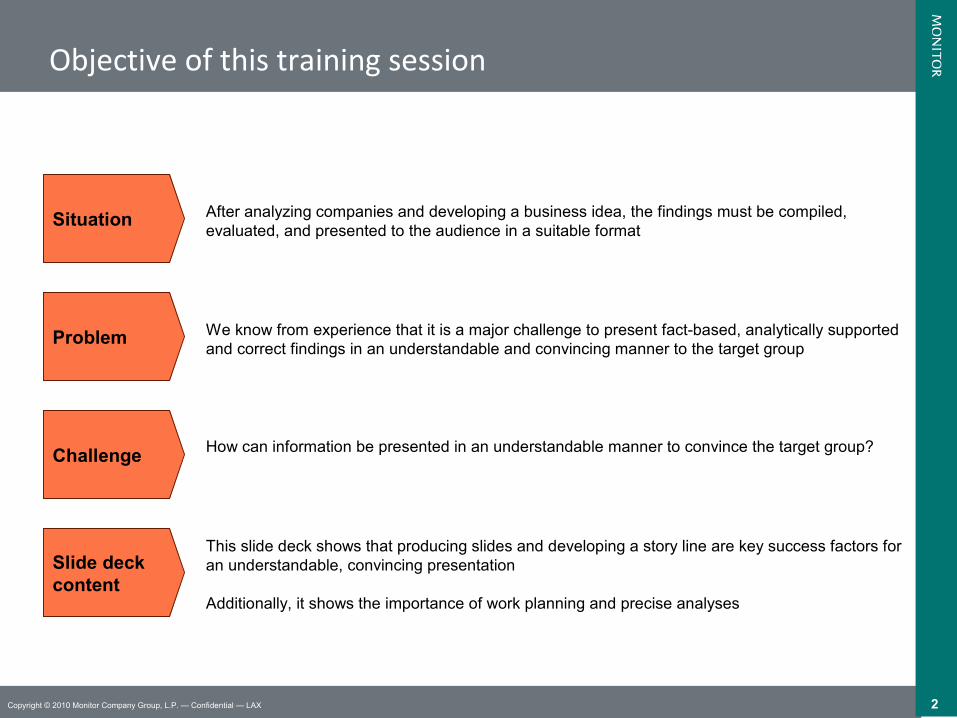
After analyzing companies and developing a business idea, the findings must be compiled, evaluated, and presented to the audience in a suitable format
We know from experience that it is a major challenge to present fact-based, analytically supported and correct findings in an understandable and convincing manner to the target group
How can information be presented in an understandable manner to convince the target group?
Slide deckcontent
This slide deck shows that producing slides and developing a story line are key success factors for an understandable, convincing presentation
Additionally, it shows the importance of work planning and precise analyses
Objective of this training session
Challenge
Problem
Situation
3Copyright © 2010 Monitor Company Group, L.P. — Confidential — LAX
Agenda
Generating incontestable, goal-oriented messages
Writing good slides
Developing a convincing story line
Ensuring timely production
Giving a good presentation
4Copyright © 2010 Monitor Company Group, L.P. — Confidential — LAX
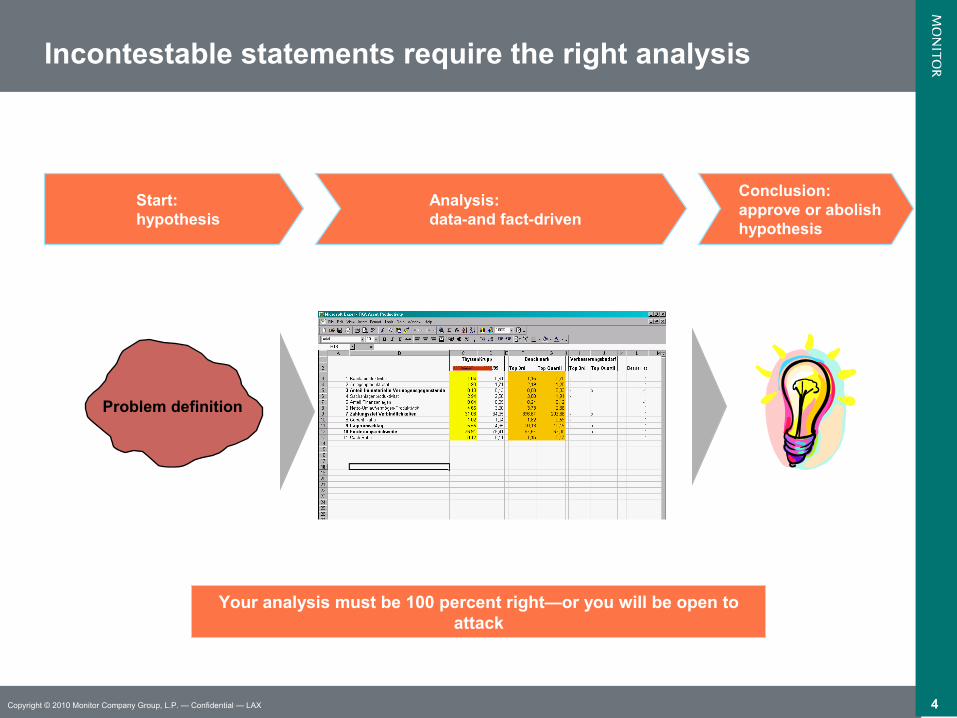
Conclusion: approve or abolish hypothesis
Start:hypothesis
Analysis:data-and fact-driven
Problem definition
Firma A
Incontestable statements require the right analysis
Your analysis must be 100 percent right—or you will be open to attack

5Copyright © 2010 Monitor Company Group, L.P. — Confidential — LAX
Formulate clear statements for all participants
Generate hypotheses
Previous knowledge
Businesssense
Creativity
Request
Teacher
Team member
Fulfillment
Student
Team
Defining the problem is the key prerequisite to performing the right analyses …
6Copyright © 2010 Monitor Company Group, L.P. — Confidential — LAX
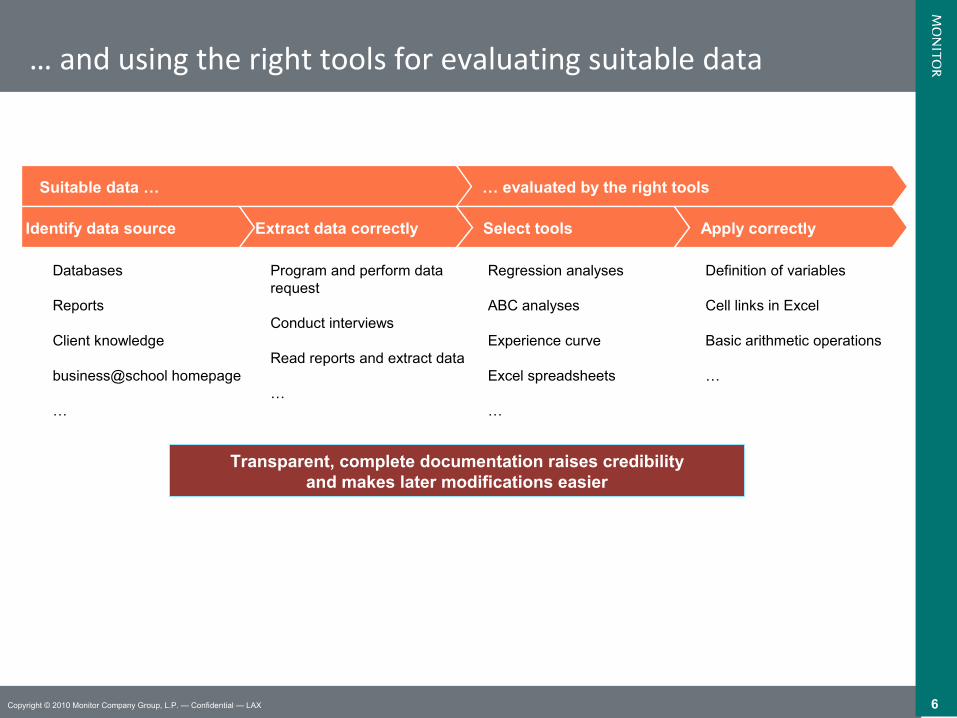
… and using the right tools for evaluating suitable data
Transparent, complete documentation raises credibilityand makes later modifications easier
Databases
Reports
Client knowledge
business@school homepage
…
Program and perform data request
Conduct interviews
Read reports and extract data
…
Regression analyses
ABC analyses
Experience curve
Excel spreadsheets
…
Suitable data … … evaluated by the right tools
Identify data source Extract data correctly Select tools
Definition of variables
Cell links in Excel
Basic arithmetic operations
…
Apply correctly

7Copyright © 2010 Monitor Company Group, L.P. — Confidential — LAX
Analyticalfindings "So what?"
Black boxBlack box
Appropriate conclusions need to be drawn fromthe right analyses
Source: BCG experience
Challenging current beliefs
Reasoning by analogy from other industry
Change in perspective
Learning from outliers
Plausibility check
Creativity
…
8Copyright © 2010 Monitor Company Group, L.P. — Confidential — LAX
Agenda
Generating incontestable, goal-oriented messages
Writing good slides
Developing a convincing story line
Ensuring timely production
Giving a good presentation
9Copyright © 2010 Monitor Company Group, L.P. — Confidential — LAX
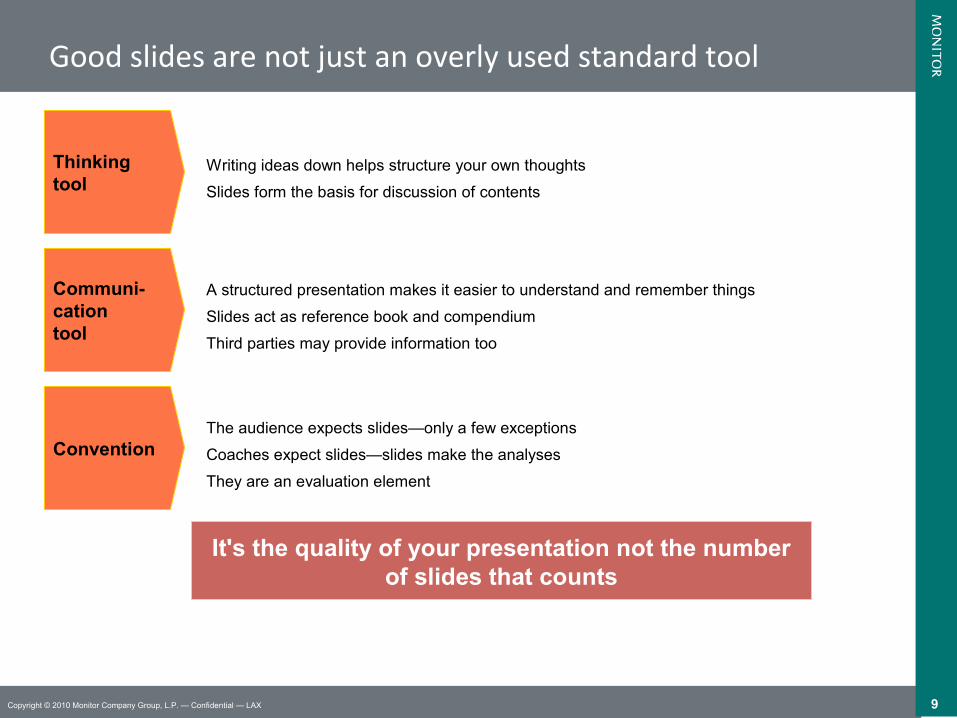
Writing ideas down helps structure your own thoughts
Slides form the basis for discussion of contents
Thinkingtool
Good slides are not just an overly used standard tool
It's the quality of your presentation not the number of slides that counts
A structured presentation makes it easier to understand and remember things
Slides act as reference book and compendium
Third parties may provide information too
Communi-cationtool
The audience expects slides—only a few exceptions
Coaches expect slides—slides make the analyses
They are an evaluation element
Convention
10Copyright © 2010 Monitor Company Group, L.P. — Confidential — LAX
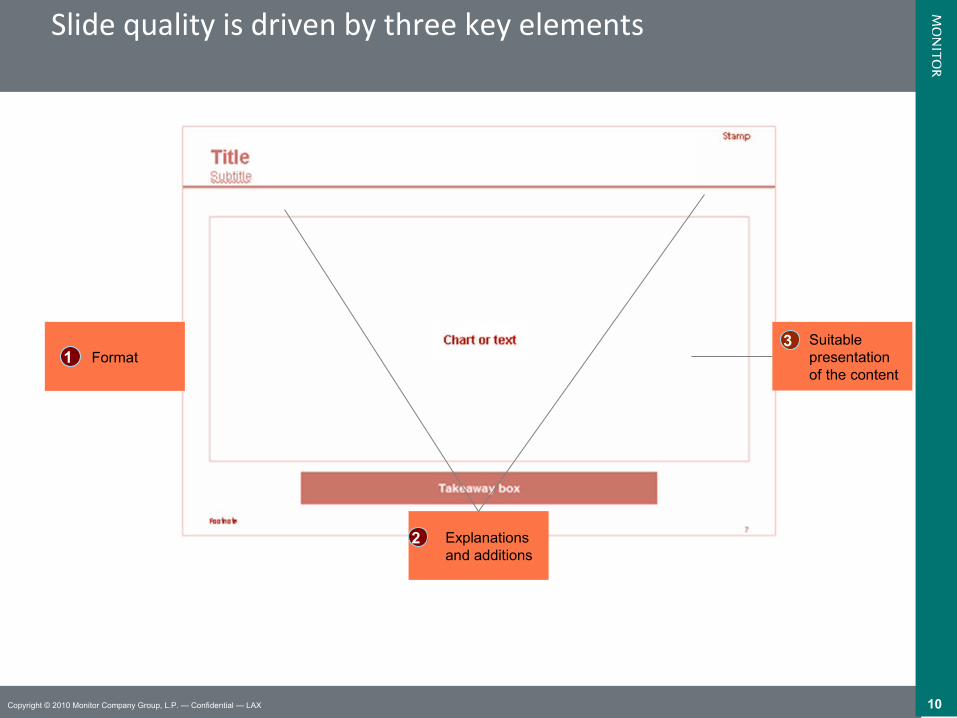
Slide quality is driven by three key elements
FormatSuitablepresentation of the content
Explanationsand additions
1
2
3
11Copyright © 2010 Monitor Company Group, L.P. — Confidential — LAX
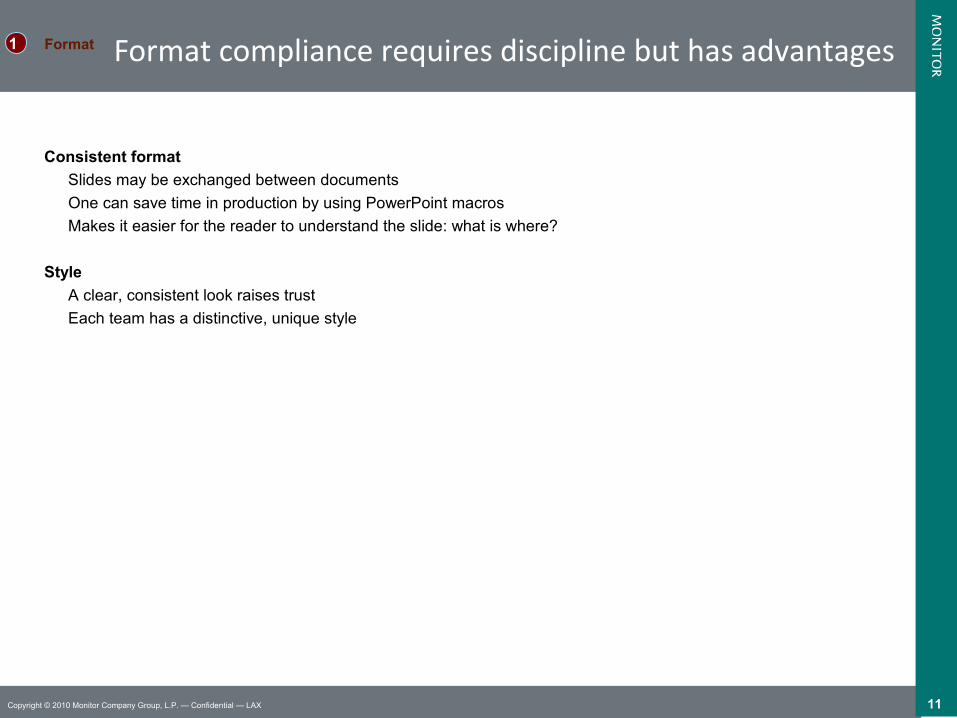
Format compliance requires discipline but has advantages
Consistent format
Slides may be exchanged between documents
One can save time in production by using PowerPoint macros
Makes it easier for the reader to understand the slide: what is where?
Style
A clear, consistent look raises trust
Each team has a distinctive, unique style
Format1
12Copyright © 2010 Monitor Company Group, L.P. — Confidential — LAX
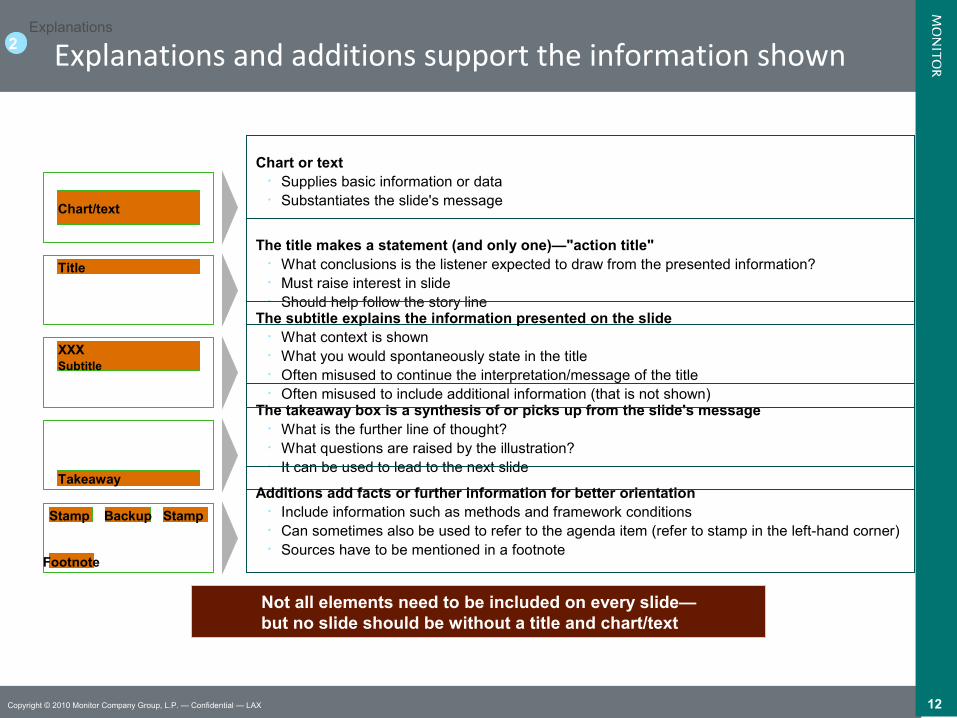
Explanations and additions support the information shownExplanations
2
Not all elements need to be included on every slide—but no slide should be without a title and chart/text
The takeaway box is a synthesis of or picks up from the slide's message • What is the further line of thought?• What questions are raised by the illustration?• It can be used to lead to the next slide
Additions add facts or further information for better orientation• Include information such as methods and framework conditions• Can sometimes also be used to refer to the agenda item (refer to stamp in the left-hand corner)• Sources have to be mentioned in a footnote
Stamp StampBackup
Footnote
Takeaway
Title
Chart/text
XXXSubtitle
Chart or text• Supplies basic information or data• Substantiates the slide's message
The title makes a statement (and only one)—"action title"• What conclusions is the listener expected to draw from the presented information?• Must raise interest in slide• Should help follow the story line
The subtitle explains the information presented on the slide• What context is shown• What you would spontaneously state in the title• Often misused to continue the interpretation/message of the title• Often misused to include additional information (that is not shown)
13Copyright © 2010 Monitor Company Group, L.P. — Confidential — LAX
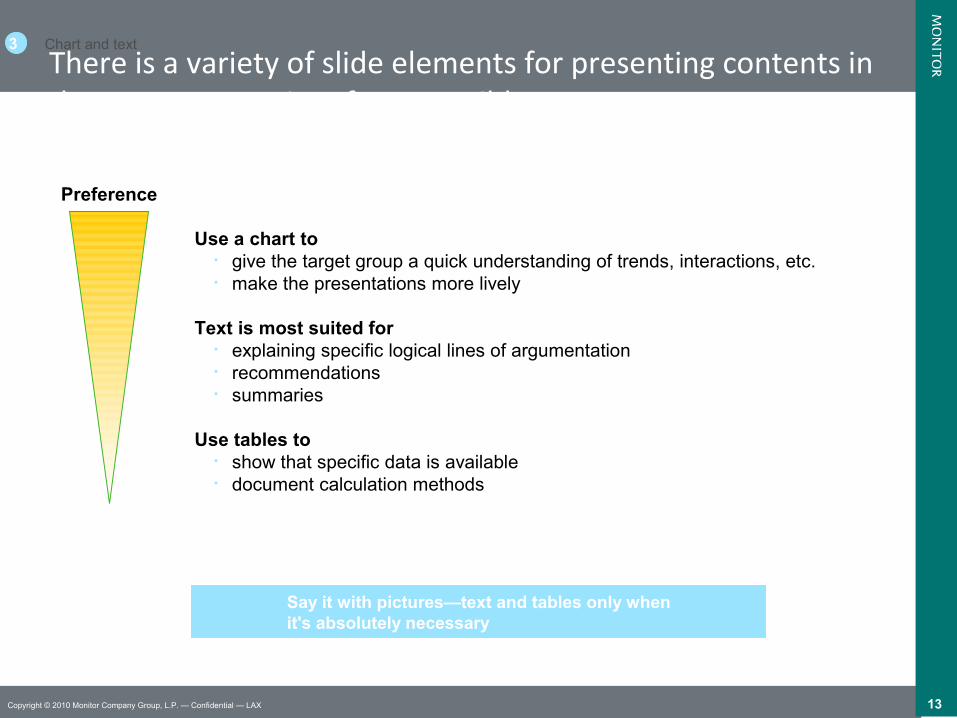
There is a variety of slide elements for presenting contents in the most appropriate form possible
Use a chart to• give the target group a quick understanding of trends, interactions, etc. • make the presentations more lively
Text is most suited for• explaining specific logical lines of argumentation• recommendations• summaries
Use tables to• show that specific data is available• document calculation methods
Chart and text3
Say it with pictures—text and tables only whenit's absolutely necessary
Preference
14Copyright © 2010 Monitor Company Group, L.P. — Confidential — LAX
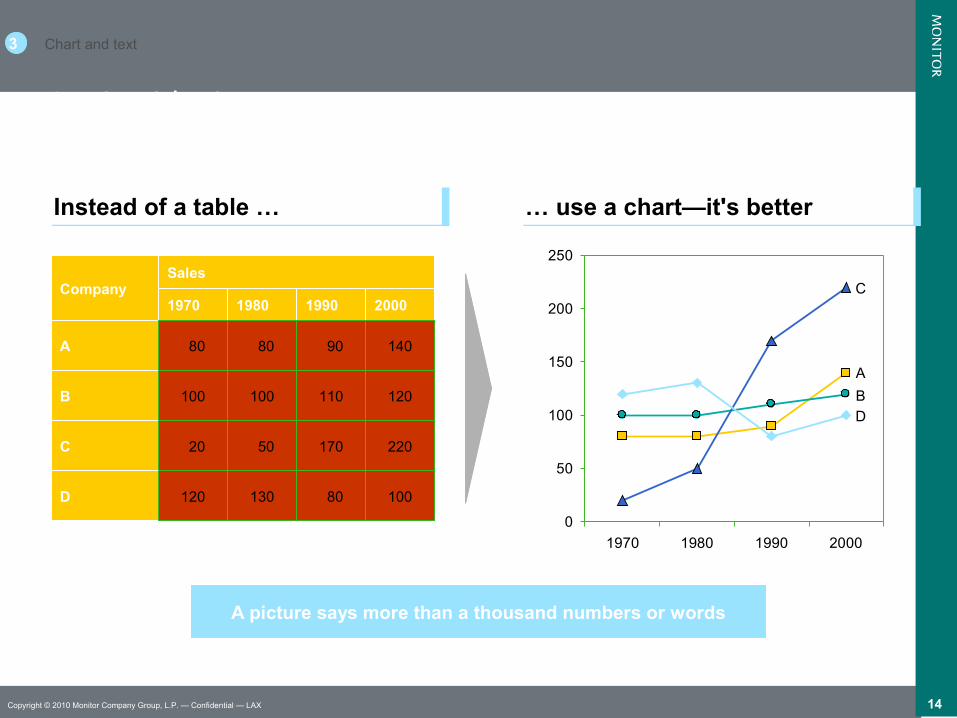
Say it with pictures
A picture says more than a thousand numbers or words
Instead of a table …Instead of a table … … use a chart—it's better… use a chart—it's better
Company1970 1980 1990 2000
Sales
A 80 80 90 140
B 100 100 110 120
C 20 50 170 220
D 120 130 80 100
0
50
100
150
200
250
1970 1980 1990 2000
Chart and text3
A
B
D
C
15Copyright © 2010 Monitor Company Group, L.P. — Confidential — LAX
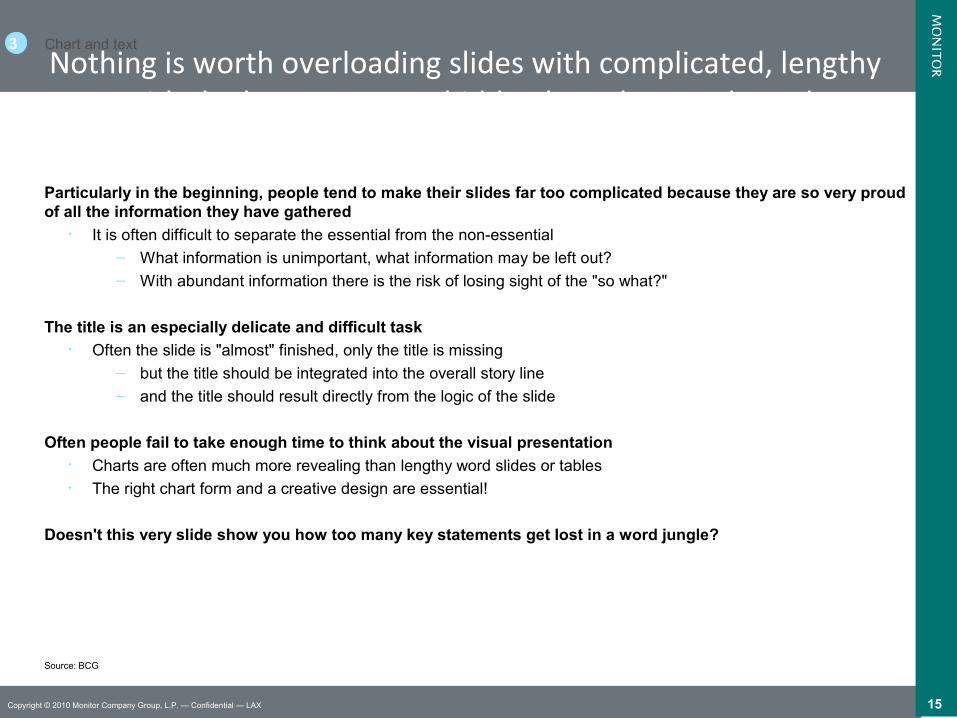
Nothing is worth overloading slides with complicated, lengthy texts with the key statement hidden by a thousand words
Particularly in the beginning, people tend to make their slides far too complicated because they are so very proud of all the information they have gathered
• It is often difficult to separate the essential from the non-essential– What information is unimportant, what information may be left out?– With abundant information there is the risk of losing sight of the "so what?"
The title is an especially delicate and difficult task• Often the slide is "almost" finished, only the title is missing
– but the title should be integrated into the overall story line– and the title should result directly from the logic of the slide
Often people fail to take enough time to think about the visual presentation• Charts are often much more revealing than lengthy word slides or tables• The right chart form and a creative design are essential!
Doesn't this very slide show you how too many key statements get lost in a word jungle?
Chart and text3
Source: BCG
16Copyright © 2010 Monitor Company Group, L.P. — Confidential — LAX
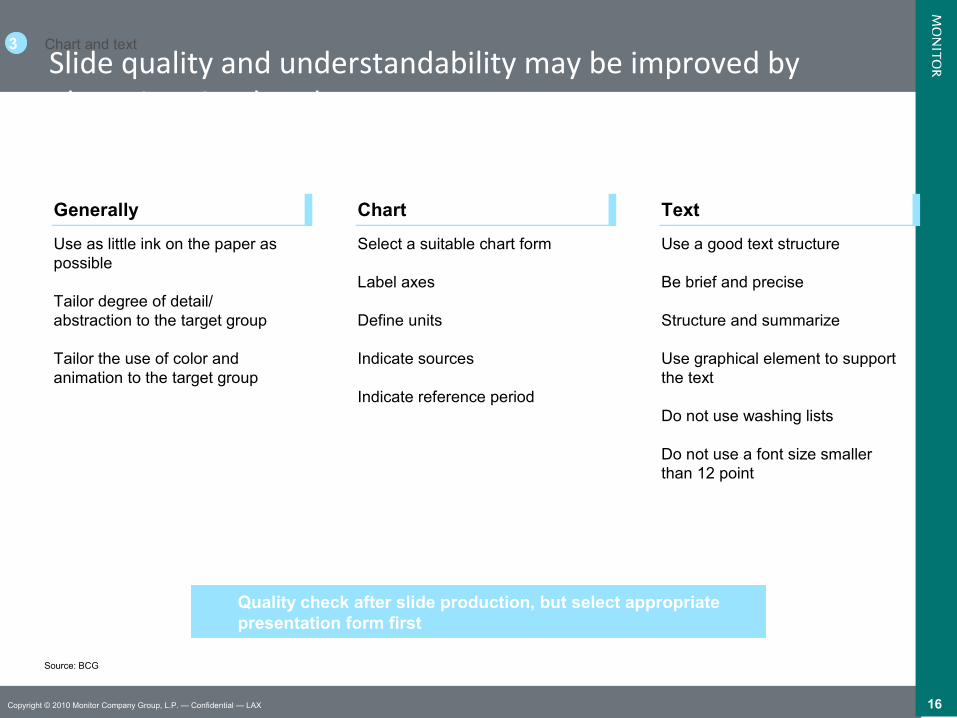
Slide quality and understandability may be improved by observing simple rules
Chart and text3
Quality check after slide production, but select appropriate presentation form first
GenerallyGenerally
Use as little ink on the paper as possible
Tailor degree of detail/abstraction to the target group
Tailor the use of color and animation to the target group
ChartChart
Select a suitable chart form
Label axes
Define units
Indicate sources
Indicate reference period
TextText
Use a good text structure
Be brief and precise
Structure and summarize
Use graphical element to support the text
Do not use washing lists
Do not use a font size smaller than 12 point
Source: BCG

17Copyright © 2010 Monitor Company Group, L.P. — Confidential — LAX
First check content, then formHas the title been clearly formulated—does it fit with chart and story?
Is there only one message—or have additional issues been "covered"?
Have labels been added to all graphical elements—axes, keys?
Are all additional elements in place—especially the source in the footnote?
Is there no further possibility of reducing the printed area?
Is there no further possibility of simplifying the style—e.g., font type, font size, etc.?
Has it been proofread—typing errors and misalignments eliminated?
Chart and text3
Source: BCG
18Copyright © 2010 Monitor Company Group, L.P. — Confidential — LAX
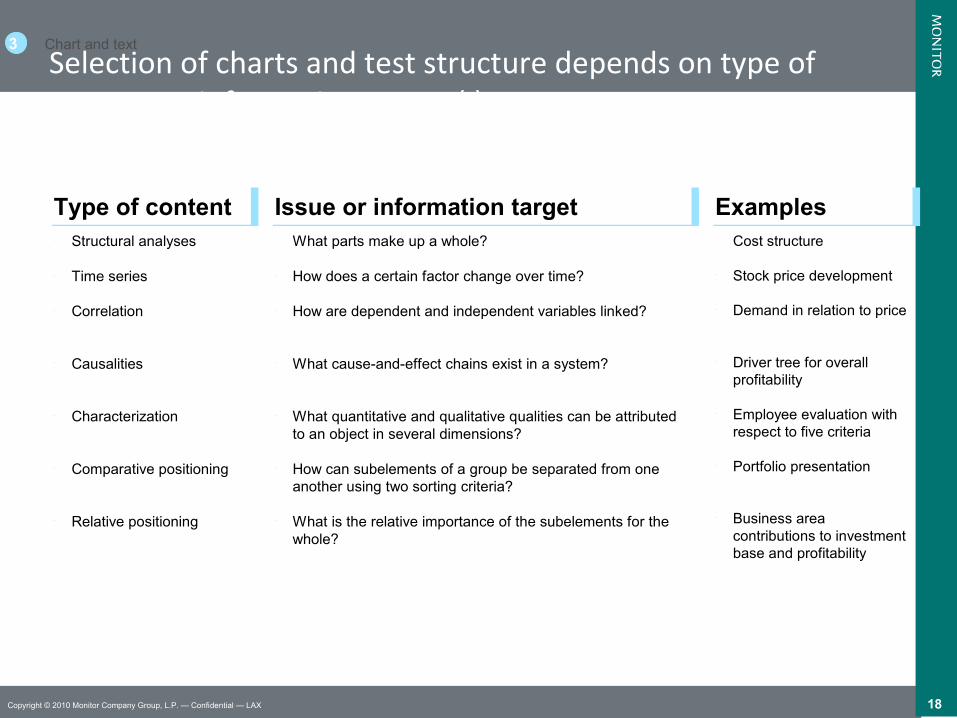
Selection of charts and test structure depends on type of content or information target (I)
Chart and text3
Type of contentType of content• Structural analyses
• Time series
• Correlation
• Causalities
• Characterization
• Comparative positioning
• Relative positioning
Issue or information targetIssue or information target• What parts make up a whole?
• How does a certain factor change over time?
• How are dependent and independent variables linked?
• What cause-and-effect chains exist in a system?
• What quantitative and qualitative qualities can be attributed to an object in several dimensions?
• How can subelements of a group be separated from one another using two sorting criteria?
• What is the relative importance of the subelements for the whole?
ExamplesExamples• Cost structure
• Stock price development
• Demand in relation to price
• Driver tree for overall profitability
• Employee evaluation with respect to five criteria
• Portfolio presentation
• Business area contributions to investment base and profitability
19Copyright © 2010 Monitor Company Group, L.P. — Confidential — LAX
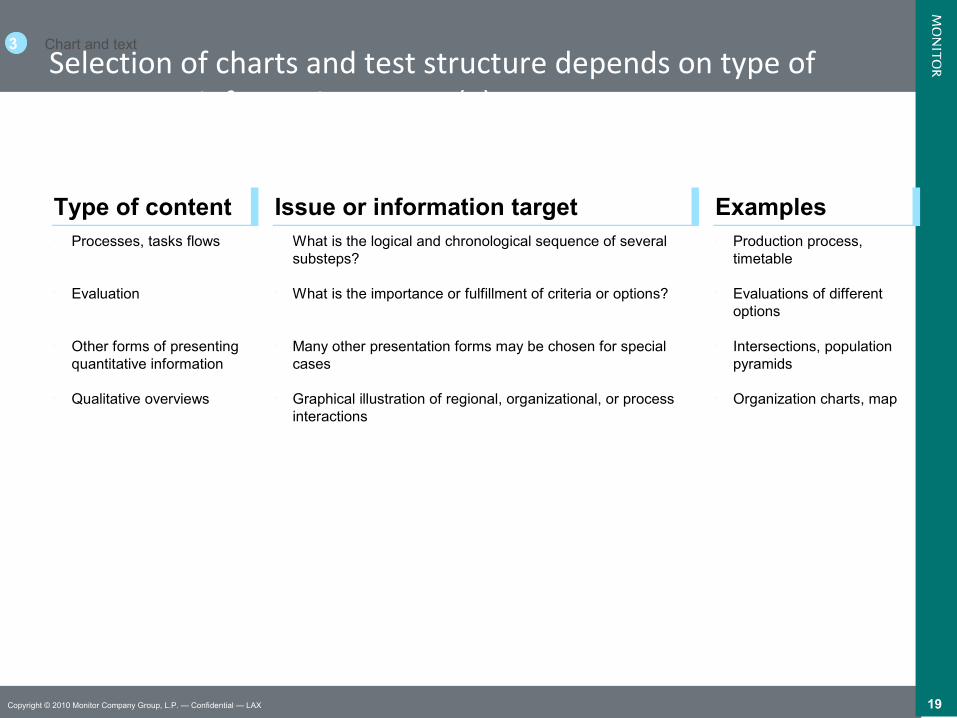
Selection of charts and test structure depends on type of content or information target (II)
Chart and text3
Type of contentType of content• Processes, tasks flows
• Evaluation
• Other forms of presenting quantitative information
• Qualitative overviews
Issue or information targetIssue or information target• What is the logical and chronological sequence of several
substeps?
• What is the importance or fulfillment of criteria or options?
• Many other presentation forms may be chosen for special cases
• Graphical illustration of regional, organizational, or process interactions
ExamplesExamples• Production process,
timetable
• Evaluations of different options
• Intersections, population pyramids
• Organization charts, map
20Copyright © 2010 Monitor Company Group, L.P. — Confidential — LAX
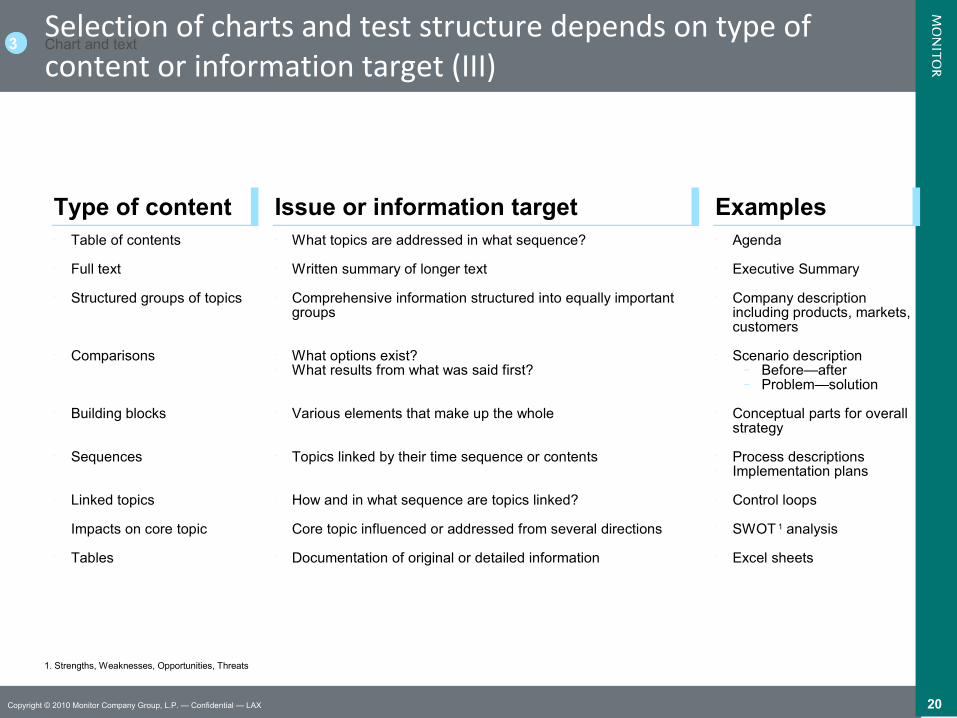
Selection of charts and test structure depends on type of content or information target (III)Chart and text3
• Table of contents
• Full text
• Structured groups of topics
• Comparisons
• Building blocks
• Sequences
• Linked topics
• Impacts on core topic
• Tables
• What topics are addressed in what sequence?
• Written summary of longer text
• Comprehensive information structured into equally important groups
• What options exist?• What results from what was said first?
• Various elements that make up the whole
• Topics linked by their time sequence or contents
• How and in what sequence are topics linked?
• Core topic influenced or addressed from several directions
• Documentation of original or detailed information
• Agenda
• Executive Summary
• Company description including products, markets, customers
• Scenario description– Before—after– Problem—solution
• Conceptual parts for overall strategy
• Process descriptions• Implementation plans
• Control loops
• SWOT 1 analysis
• Excel sheets
1. Strengths, Weaknesses, Opportunities, Threats
Type of contentType of content Issue or information targetIssue or information target ExamplesExamples
21Copyright © 2010 Monitor Company Group, L.P. — Confidential — LAX
Analysis
Variants
Analysis
Variants
Chart and text3
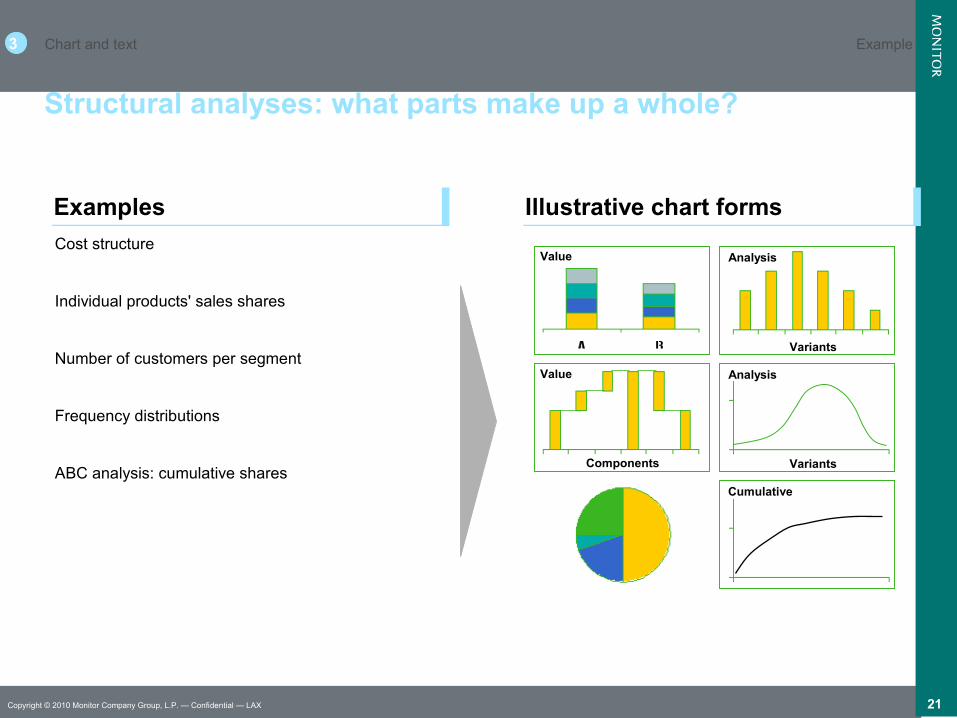
Structural analyses: what parts make up a whole?
Cost structure
Individual products' sales shares
Number of customers per segment
Frequency distributions
ABC analysis: cumulative sharesCumulative
Value
Components
Value
ExamplesExamples Illustrative chart formsIllustrative chart forms
Example
22Copyright © 2010 Monitor Company Group, L.P. — Confidential — LAX
Chart and text3
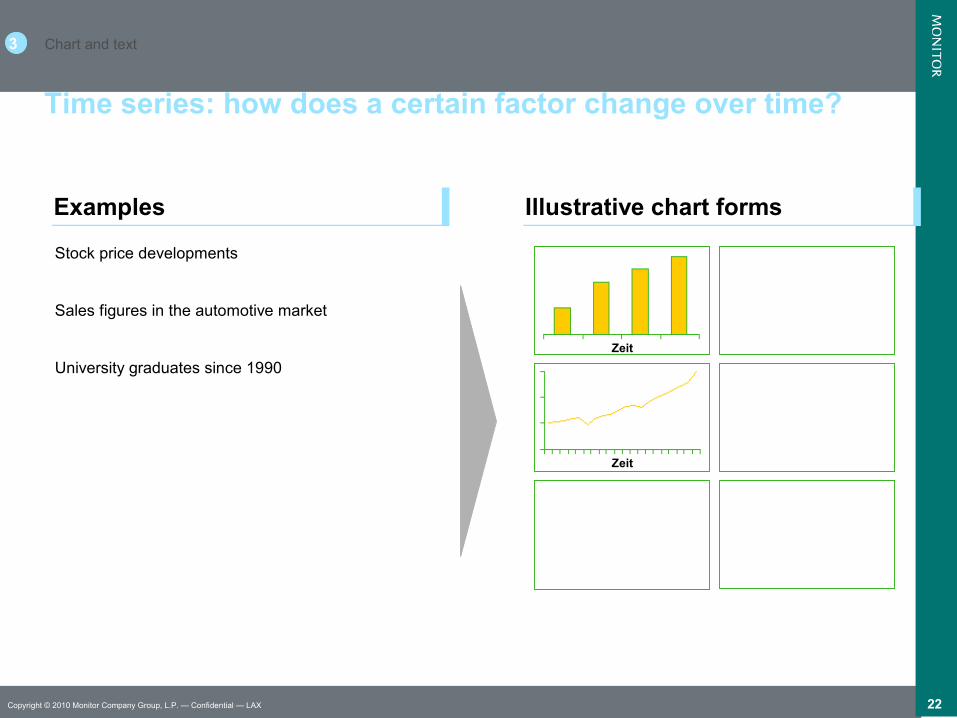
Time series: how does a certain factor change over time?
Stock price developments
Sales figures in the automotive market
University graduates since 1990
Zeit
Zeit
ExamplesExamples Illustrative chart formsIllustrative chart forms

23Copyright © 2010 Monitor Company Group, L.P. — Confidential — LAX
Chart and text3
Correlation: how are dependent and independent variables linked?
Supply and demand
Price and sales
Input and output
Scale effects
Experience curve
Elasticities
Scale effects
Volume(log scale)
Unit cost(log scale)
RegressionY
X
Elasticity Experience curve
C0
S x C0
V0 2 x V0
Slope = S
Accum. Volume(log scale)
Unit cost(log scale) S = 70 – 80%
ComplexityLog(ind. Kosten% vonGesamt-kosten)
Log (# Produkte)
ExamplesExamples Illustrative chart formsIllustrative chart forms
24Copyright © 2010 Monitor Company Group, L.P. — Confidential — LAX
Chart and text3
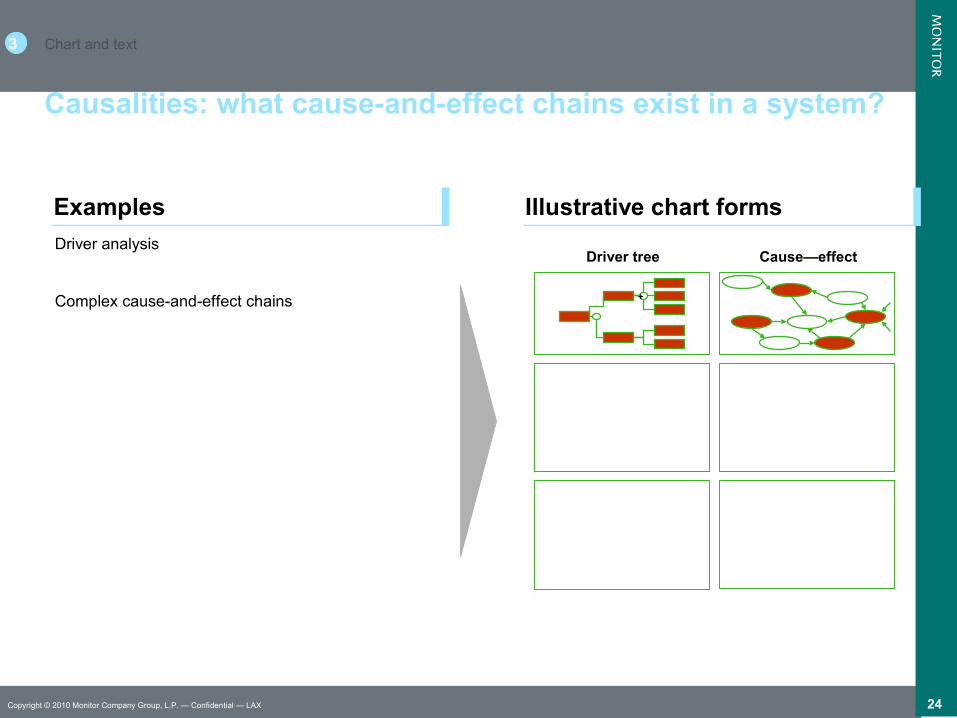
Causalities: what cause-and-effect chains exist in a system?
Driver analysis
Complex cause-and-effect chains +
Driver tree Cause—effect
ExamplesExamples Illustrative chart formsIllustrative chart forms
25Copyright © 2010 Monitor Company Group, L.P. — Confidential — LAX
Chart and text3
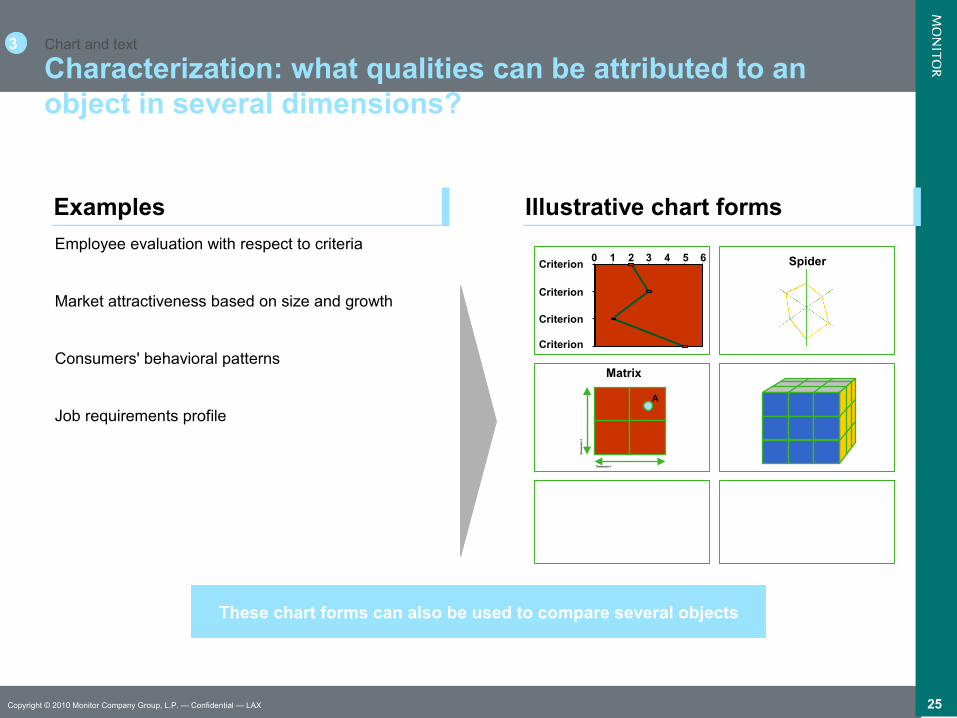
Characterization: what qualities can be attributed to an object in several dimensions?
Employee evaluation with respect to criteria
Market attractiveness based on size and growth
Consumers' behavioral patterns
Job requirements profile
These chart forms can also be used to compare several objects
0 1 2 3 4 5 6Criterion
Criterion
Criterion
Criterion
Spider
Matrix
Dimension 1
Dim
ensi
on
2
A
ExamplesExamples Illustrative chart formsIllustrative chart forms
26Copyright © 2010 Monitor Company Group, L.P. — Confidential — LAX
Chart and text3
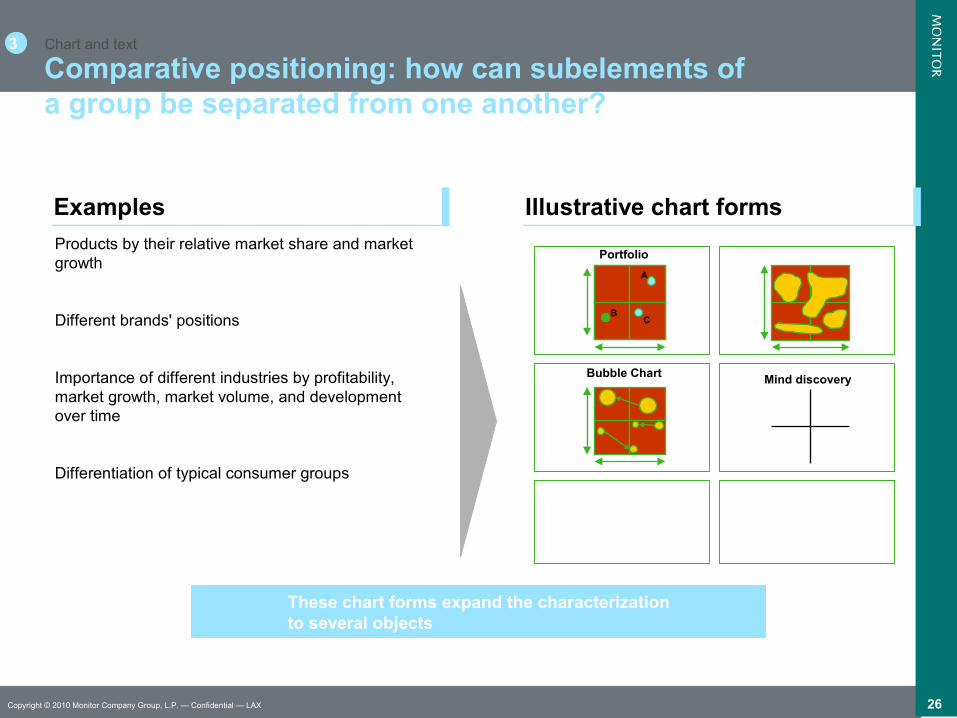
Comparative positioning: how can subelements of a group be separated from one another?
Products by their relative market share and market growth
Different brands' positions
Importance of different industries by profitability, market growth, market volume, and development over time
Differentiation of typical consumer groups
These chart forms expand the characterizationto several objects
Portfolio
A
CB
A
CB
Bubble Chart Mind discovery
ExamplesExamples Illustrative chart formsIllustrative chart forms
27Copyright © 2010 Monitor Company Group, L.P. — Confidential — LAX
Chart and text3
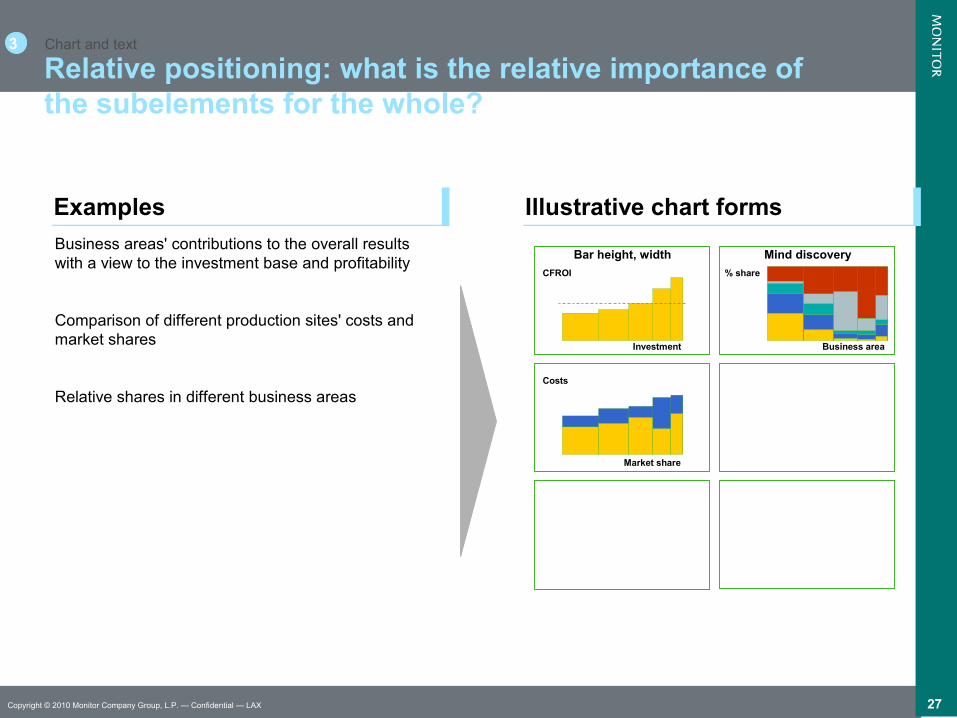
Relative positioning: what is the relative importance of the subelements for the whole?
Business areas' contributions to the overall results with a view to the investment base and profitability
Comparison of different production sites' costs and market shares
Relative shares in different business areas
Mind discovery
% share
Business area
CFROI
Investment
Bar height, width
Costs
ExamplesExamples Illustrative chart formsIllustrative chart forms
Market share
28Copyright © 2010 Monitor Company Group, L.P. — Confidential — LAX
Chart and text3
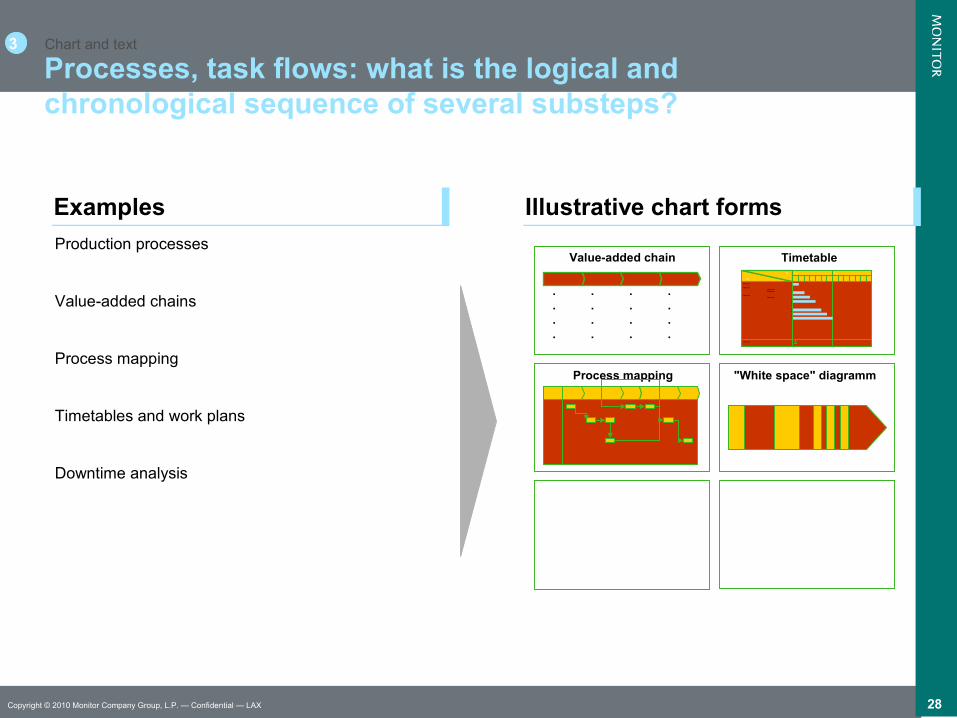
Processes, task flows: what is the logical and chronological sequence of several substeps?
Production processes
Value-added chains
Process mapping
Timetables and work plans
Downtime analysis
.
.
.
.
.
.
.
.
.
.
.
.
.
.
.
.
Title
Title W eek W eek
1 2 3 4 5 6 7 1 2 3 4 5 6 7
Main point
Main point• Bullet point• Bullet point
Main point• Bullet point
- d
a
s
h
p
o
i
n
t
Main point
TimetableValue-added chain
Process mapping "White space" diagramm
ExamplesExamples Illustrative chart formsIllustrative chart forms
29Copyright © 2010 Monitor Company Group, L.P. — Confidential — LAX
Chart and text3
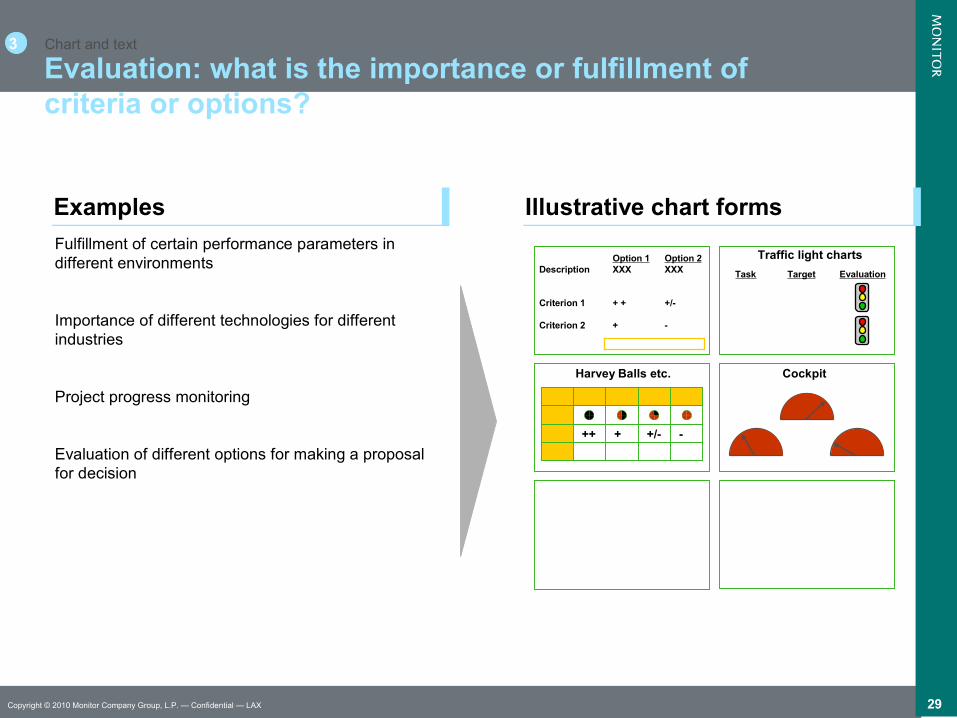
Evaluation: what is the importance or fulfillment of criteria or options?
Fulfillment of certain performance parameters in different environments
Importance of different technologies for different industries
Project progress monitoring
Evaluation of different options for making a proposal for decision
Traffic light charts
Harvey Balls etc. Cockpit
Description
Criterion 1
Criterion 2
Option 1XXX
+ +
+
Option 2XXX
+/-
-
Task Target Evaluation
++ + +/- -
ExamplesExamples Illustrative chart formsIllustrative chart forms
30Copyright © 2010 Monitor Company Group, L.P. — Confidential — LAX
Chart and text3
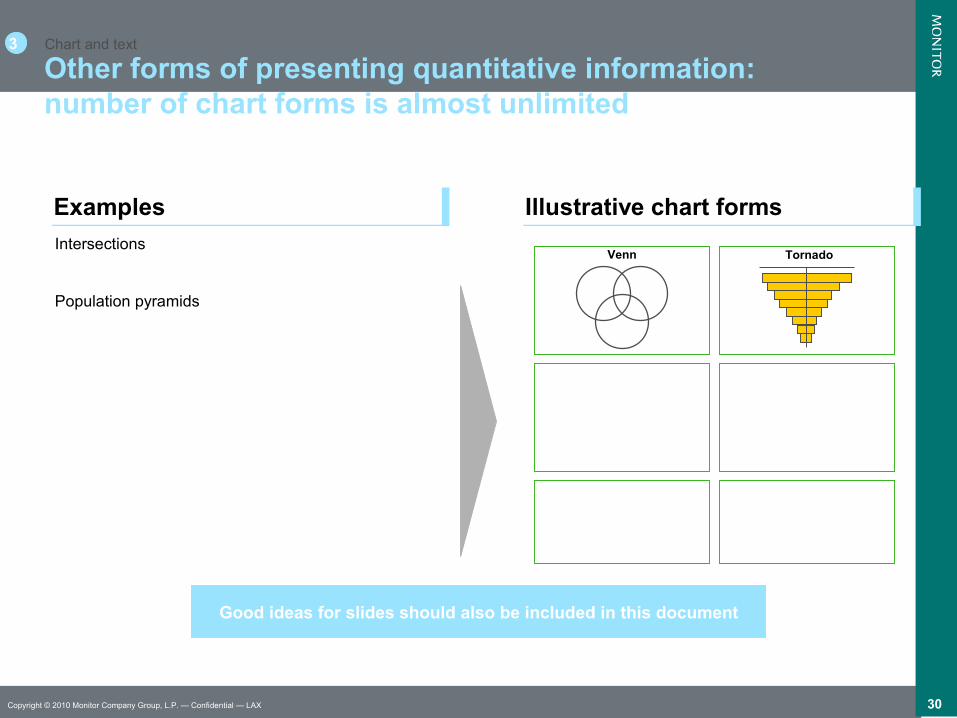
Other forms of presenting quantitative information: number of chart forms is almost unlimited
Intersections
Population pyramids
Good ideas for slides should also be included in this document
TornadoVenn
ExamplesExamples Illustrative chart formsIllustrative chart forms
31Copyright © 2010 Monitor Company Group, L.P. — Confidential — LAX
Chart and text3
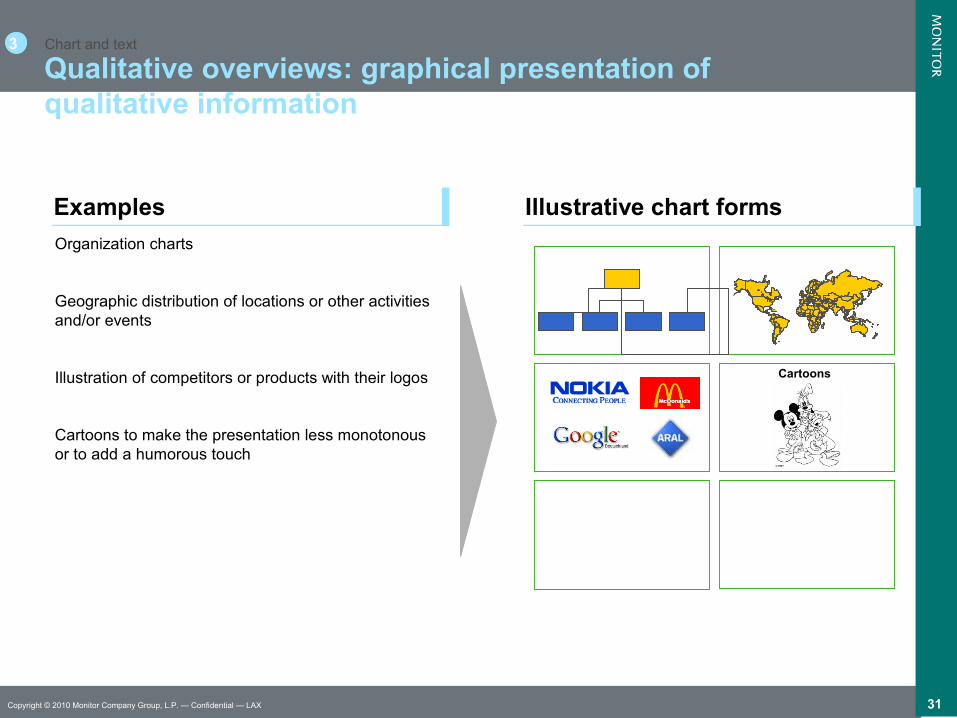
Qualitative overviews: graphical presentation of qualitative information
Organization charts
Geographic distribution of locations or other activities and/or events
Illustration of competitors or products with their logos
Cartoons to make the presentation less monotonous or to add a humorous touch
Cartoons
ExamplesExamples Illustrative chart formsIllustrative chart forms
32Copyright © 2010 Monitor Company Group, L.P. — Confidential — LAX
Slide writing exercises
In the following exercises you will be asked to translate available basic information into meaningful slides
Each exercise is structured as follows A slide stating basic information One (out of several) possible solutions
All in all there are three exercises Interview notes on the value added by biotechnology An Excel sheet stating market volumes and sales reps' sales volumes A table with information about Company X's various business areas
Slide writing Backup Exercises
33Copyright © 2010 Monitor Company Group, L.P. — Confidential — LAX
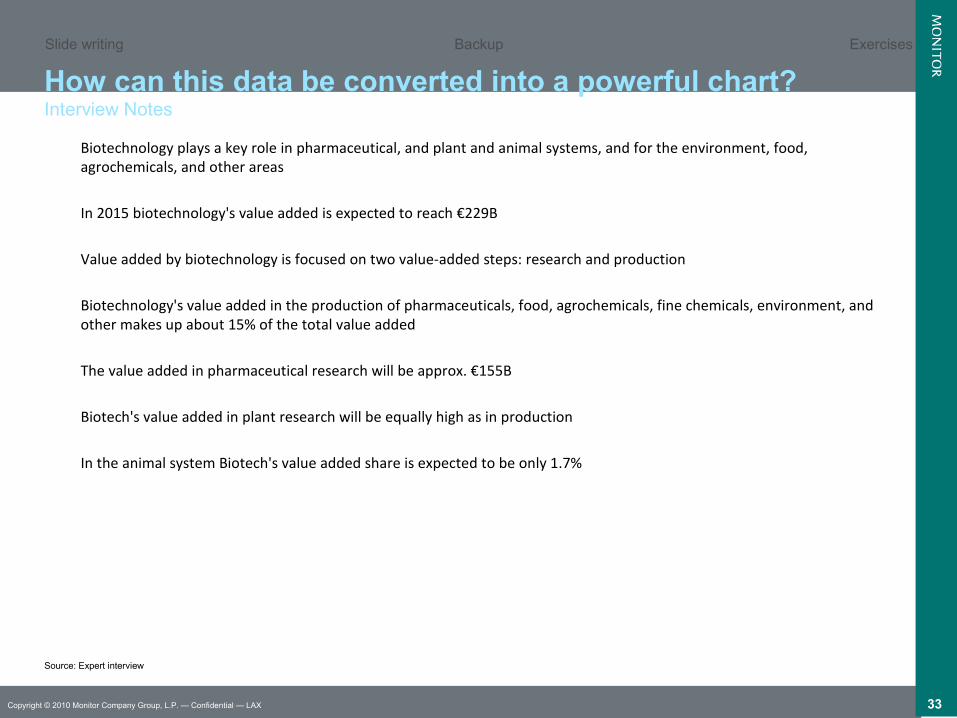
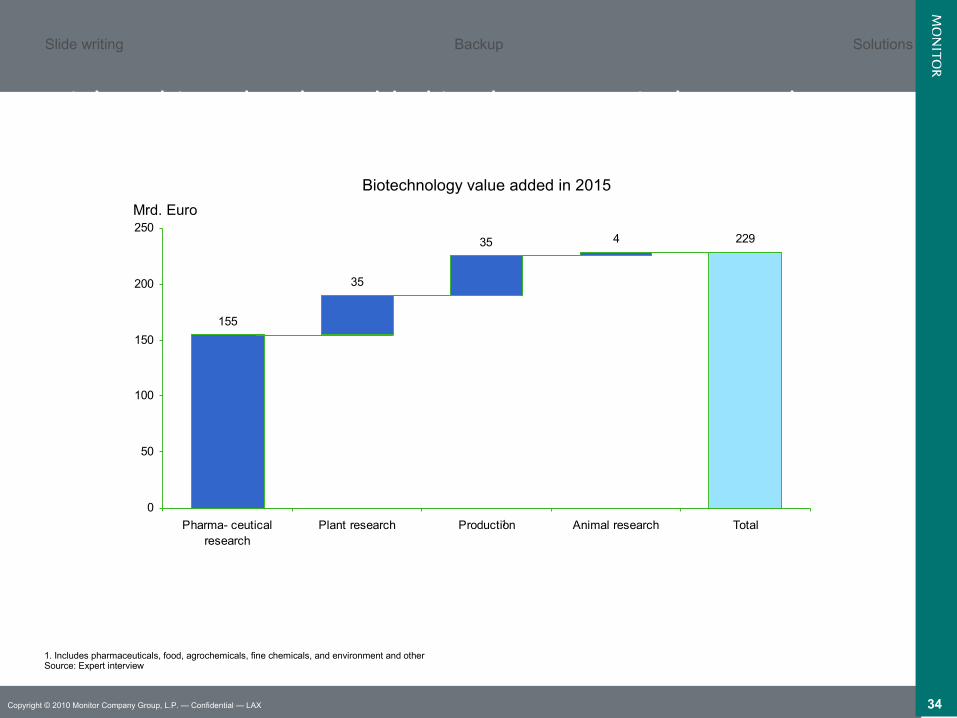
Biotechnology plays a key role in pharmaceutical, and plant and animal systems, and for the environment, food, agrochemicals, and other areas
In 2015 biotechnology's value added is expected to reach €229B
Value added by biotechnology is focused on two value-added steps: research and production
Biotechnology's value added in the production of pharmaceuticals, food, agrochemicals, fine chemicals, environment, and other makes up about 15% of the total value added
The value added in pharmaceutical research will be approx. €155B
Biotech's value added in plant research will be equally high as in production
In the animal system Biotech's value added share is expected to be only 1.7%
How can this data be converted into a powerful chart?Interview Notes
Source: Expert interview
Slide writing Backup Exercises
34Copyright © 2010 Monitor Company Group, L.P. — Confidential — LAX
Highest biotech value added in pharmaceutical research
1. Includes pharmaceuticals, food, agrochemicals, fine chemicals, and environment and otherSource: Expert interview
155
229
35
35 4
0
50
100
150
200
250
Pharma- ceuticalresearch
Plant research Production Animal research Total
Biotechnology value added in 2015
Mrd. Euro
1
Slide writing Backup Solutions

35Copyright © 2010 Monitor Company Group, L.P. — Confidential — LAX
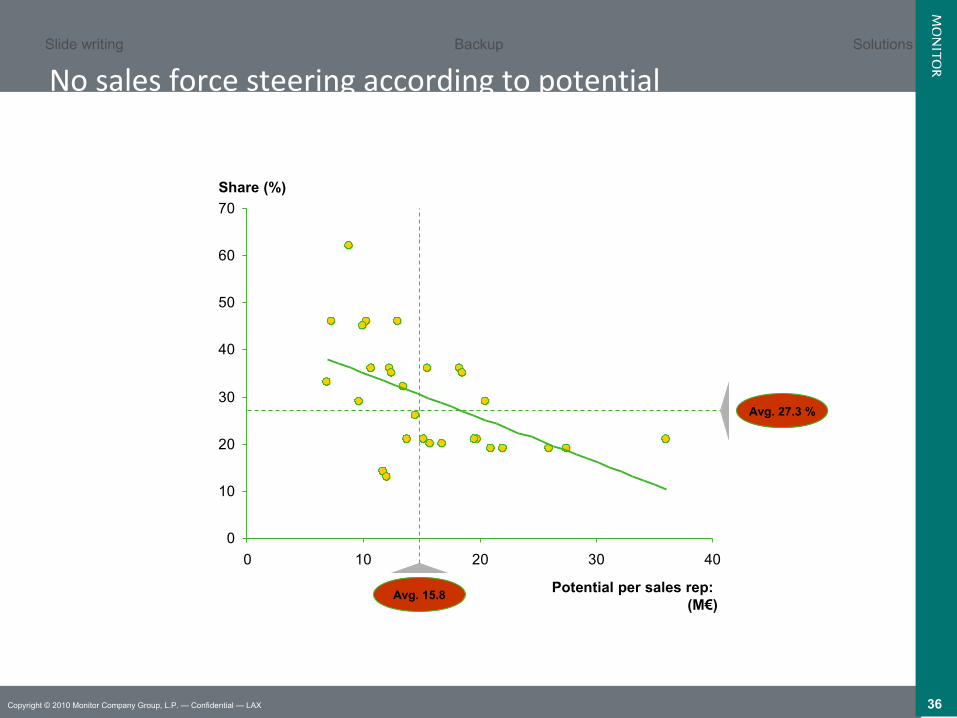
How can this data be converted Into a powerful chart?
Source: Client database
Sales rep. Sales 2001 (M€) Market potential area (M€) Share
A 7,40 36,0 21%
B 6,55 18,3 36%
C 6,39 18,5 35%
D 6,00 13,0 46%
E 5,88 20,5 29%
F 5,60 15,5 36%
G 5,49 8,8 62%
H 5,32 27,5 19%
I 4,86 26,0 19%
J 4,73 10,3 46%
K 4,49 10,0 45%
L 4,38 12,3 36%
M 4,34 13,5 32%
N 4,28 12,4 35%
O 4,28 22,0 19%P 4,20 19,8 21%
Q 4,18 19,6 21%
R 3,96 21,0 19%
S 3,85 10,7 36%
T 3,75 14,5 26%
U 3,40 16,8 20%
V 3,38 7,3 46%
W 3,23 15,2 21%
X 3,20 15,8 20%
Y 2,94 13,8 21%
Z 2,77 9,7 29%AA 2,31 6,9 33%
AB 1,65 11,7 14%
AC 1,57 12,0 13%
Total, 124,37 27%
Slide writing Backup Exercises
36Copyright © 2010 Monitor Company Group, L.P. — Confidential — LAX
No sales force steering according to potentialResult: high shares where potential is low
0
10
20
30
40
50
60
70
0 10 20 30 40
Potential per sales rep: (M€)
Avg. 27.3 %
Avg. 15.8
Share (%)
Slide writing Backup Solutions
37Copyright © 2010 Monitor Company Group, L.P. — Confidential — LAX
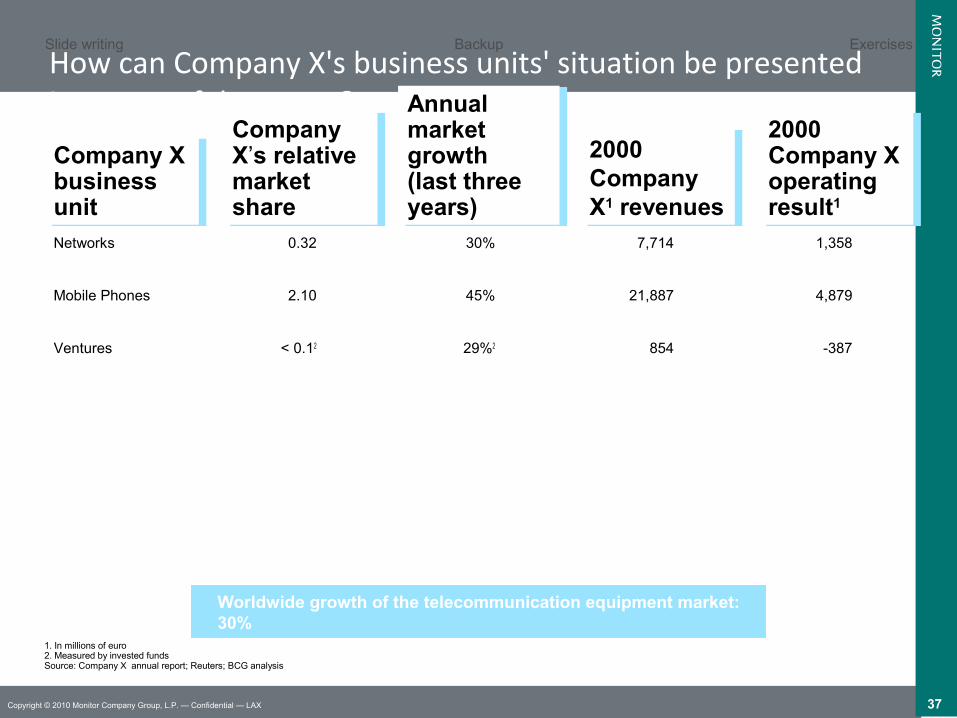
How can Company X's business units' situation be presentedin a powerful manner?
Company X business unit
Company X business unitNetworks
Mobile Phones
Ventures
Company X’s relative market share
Company X’s relative market share
0.32
2.10
< 0.12
Annual market growth(last three years)
Annual market growth(last three years)
30%
45%
29%2
2000 Company X1 revenues
2000 Company X1 revenues
7,714
21,887
854
2000 Company X operating result1
2000 Company X operating result1
1,358
4,879
-387
1. In millions of euro2. Measured by invested fundsSource: Company X annual report; Reuters; BCG analysis
Worldwide growth of the telecommunication equipment market: 30%
Slide writing Backup Exercises
38Copyright © 2010 Monitor Company Group, L.P. — Confidential — LAX
Slide writing Backup Solutions
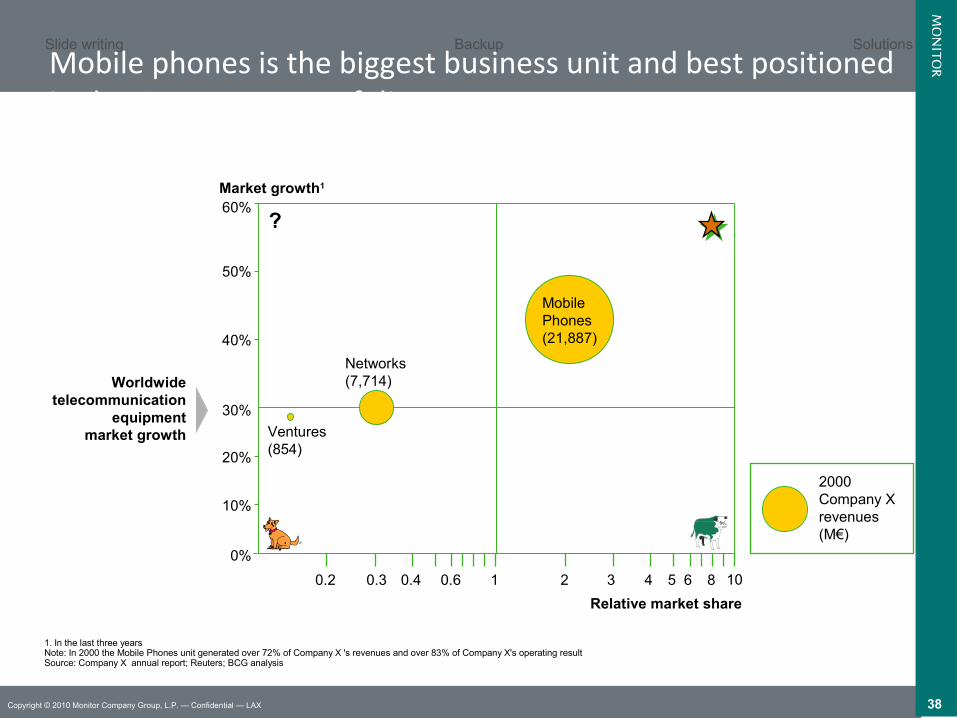
Mobile phones is the biggest business unit and best positioned in the Company X portfolio
1. In the last three yearsNote: In 2000 the Mobile Phones unit generated over 72% of Company X 's revenues and over 83% of Company X's operating resultSource: Company X annual report; Reuters; BCG analysis
0%
60%Market growth1
Relative market share
86543210.60.40.30.2 10
10%
20%
30%
40%
50%
MobilePhones(21,887)
Ventures(854)
Networks(7,714)
2000 Company X revenues(M€)
?
Worldwidetelecommunication
equipmentmarket growth
39Copyright © 2010 Monitor Company Group, L.P. — Confidential — LAX
3
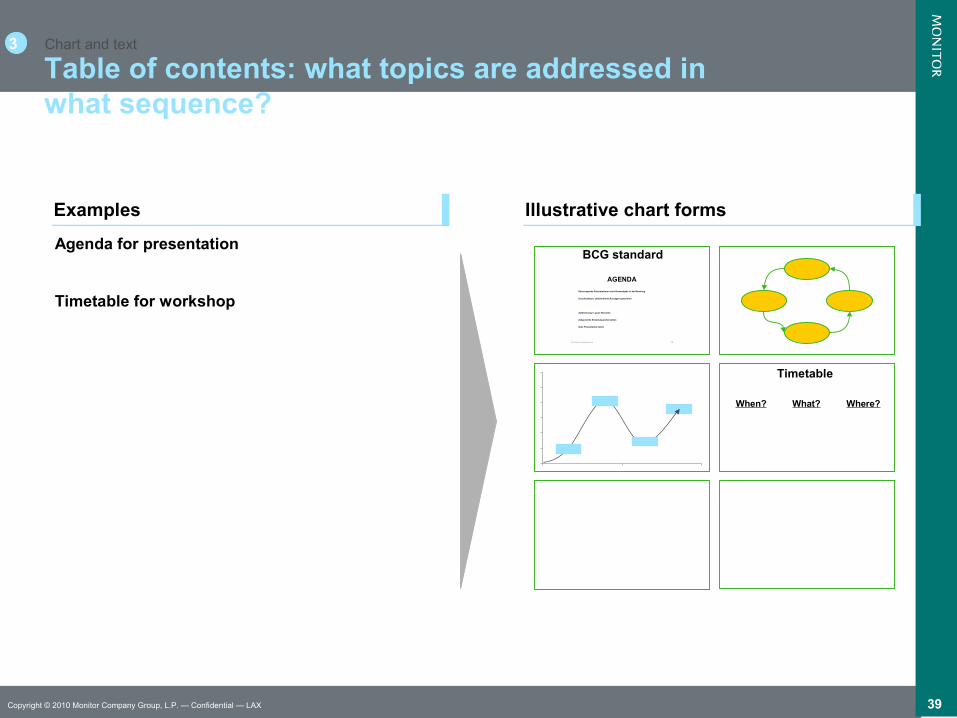
Table of contents: what topics are addressed in what sequence?
Agenda for presentation
Timetable for workshop
BCG standard
81900-01-Slides und Story-10März03-AvB-ph-MUN - 14 -
AGENDA
Überzeugende Präsentationen sind Kernaufgabe in der Beratung
Unanfechtbare, zielorientierte Aussagen generieren
Gute Slides erstellen
Aufbereitung in guter Storyline
Zeitgerechte Erstellung sicherstellen
Gute Präsentation halten
When? What? Where?
Timetable
ExamplesExamples Illustrative chart formsIllustrative chart forms
Chart and text
40Copyright © 2010 Monitor Company Group, L.P. — Confidential — LAX
Chart and text3
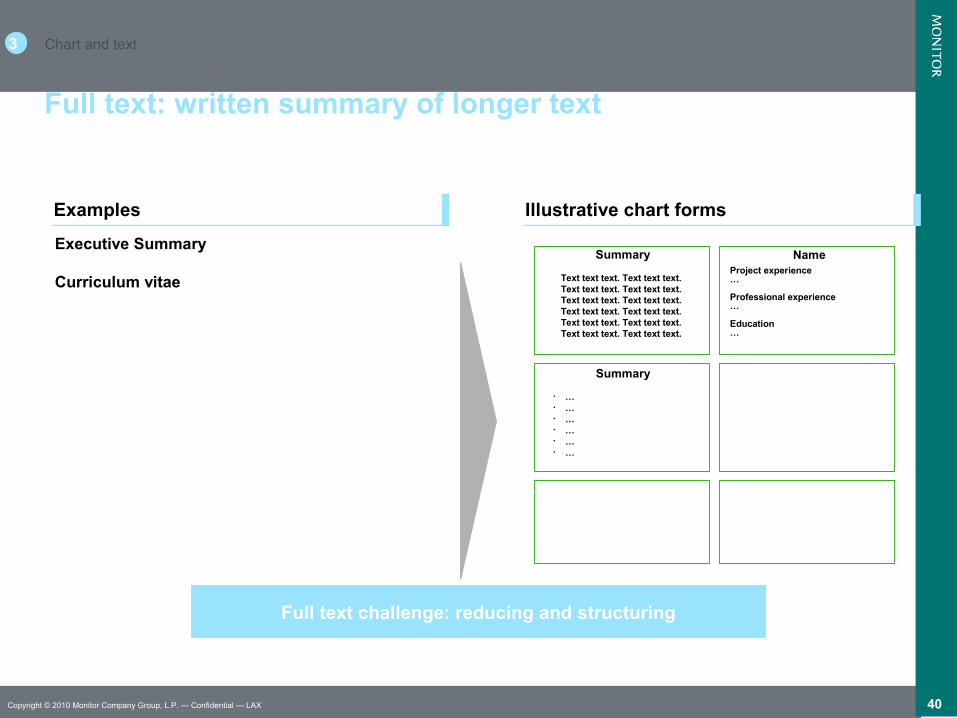
Full text: written summary of longer text
Executive Summary
Curriculum vitae
Full text challenge: reducing and structuring
NameSummary
Summary
Text text text. Text text text. Text text text. Text text text. Text text text. Text text text. Text text text. Text text text. Text text text. Text text text. Text text text. Text text text.
• …• …• …• …• …• …
Project experience…
Professional experience…
Education…
ExamplesExamples Illustrative chart formsIllustrative chart forms
41Copyright © 2010 Monitor Company Group, L.P. — Confidential — LAX
Chart and text3
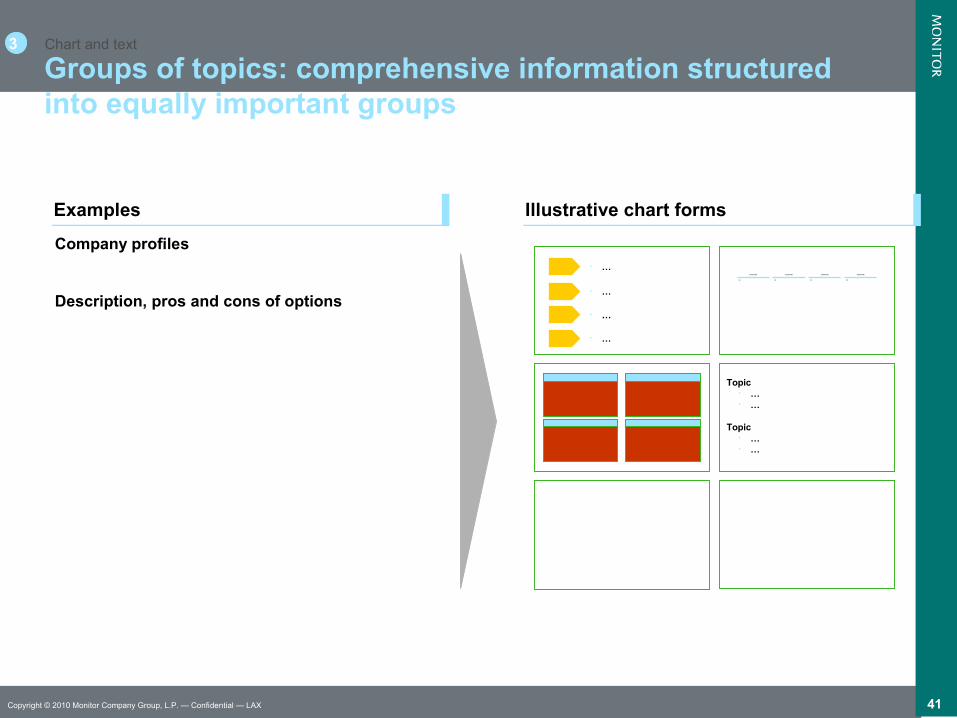
Groups of topics: comprehensive information structured into equally important groups
Company profiles
Description, pros and cons of options
• …
• …
• …
• …
Column title
xxx
Column title
xxx
Column title
xxx
Column title
xxx
Topic• …• …
Topic• …• …
ExamplesExamples Illustrative chart formsIllustrative chart forms
42Copyright © 2010 Monitor Company Group, L.P. — Confidential — LAX
Chart and text3
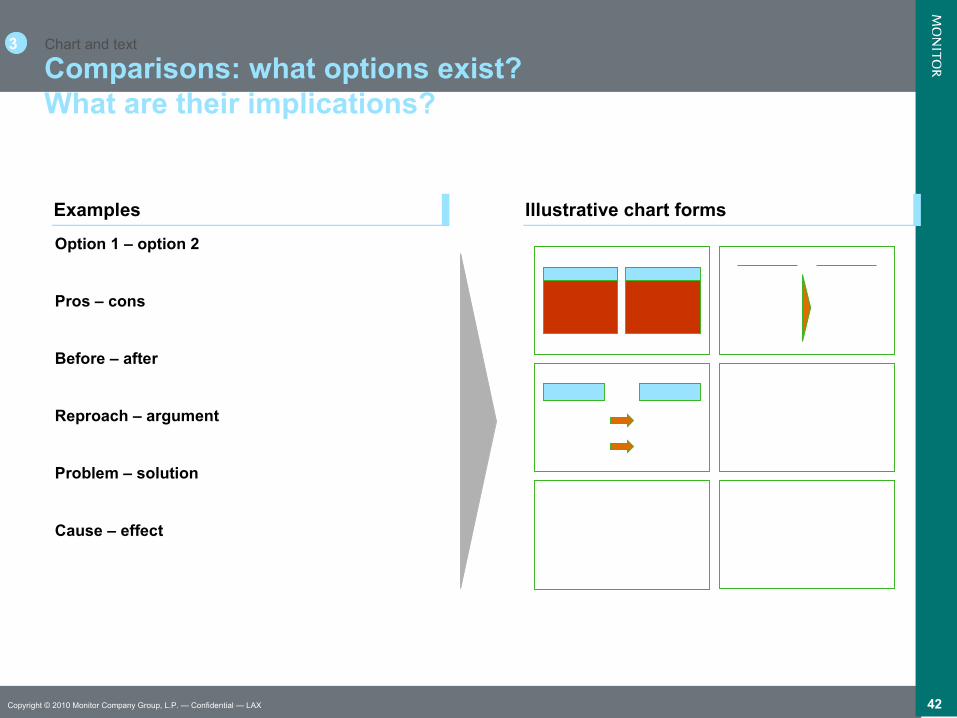
Comparisons: what options exist? What are their implications?
Option 1 – option 2
Pros – cons
Before – after
Reproach – argument
Problem – solution
Cause – effect
ExamplesExamples Illustrative chart formsIllustrative chart forms
43Copyright © 2010 Monitor Company Group, L.P. — Confidential — LAX
Chart and text3
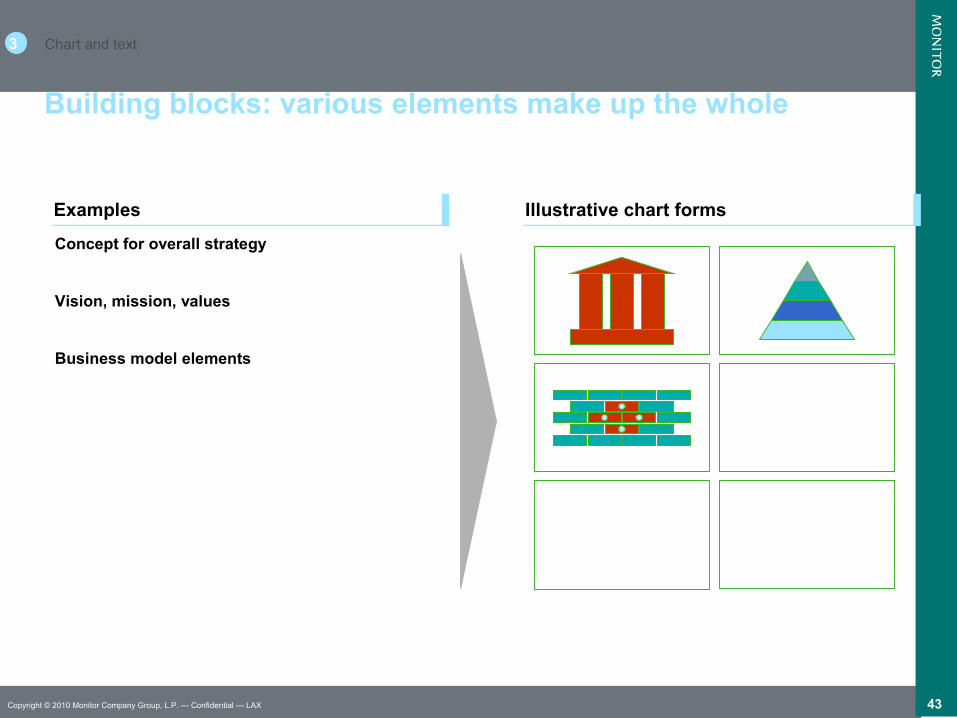
Building blocks: various elements make up the whole
Concept for overall strategy
Vision, mission, values
Business model elements
1
4
2 3
ExamplesExamples Illustrative chart formsIllustrative chart forms
44Copyright © 2010 Monitor Company Group, L.P. — Confidential — LAX
Chart and text3
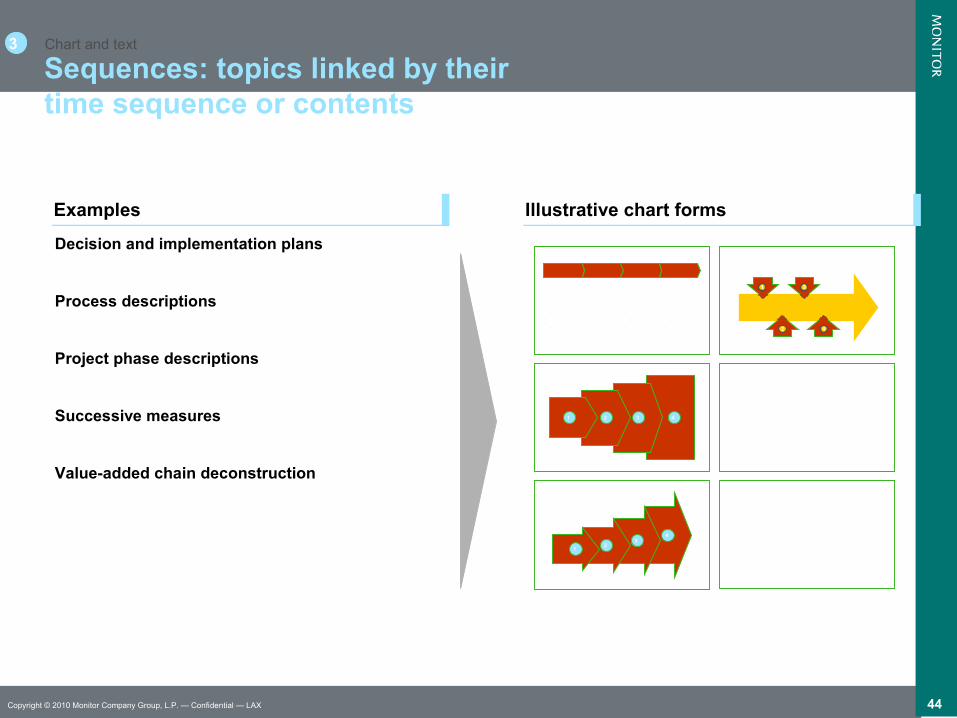
Sequences: topics linked by theirtime sequence or contents
Decision and implementation plans
Process descriptions
Project phase descriptions
Successive measures
Value-added chain deconstruction
•.•.•.•. 2 4
1 3
1 2 3 4
12
34
•.•.•.•.
•.•.•.•.
•.•.•.•.
ExamplesExamples Illustrative chart formsIllustrative chart forms
45Copyright © 2010 Monitor Company Group, L.P. — Confidential — LAX
Chart and text3
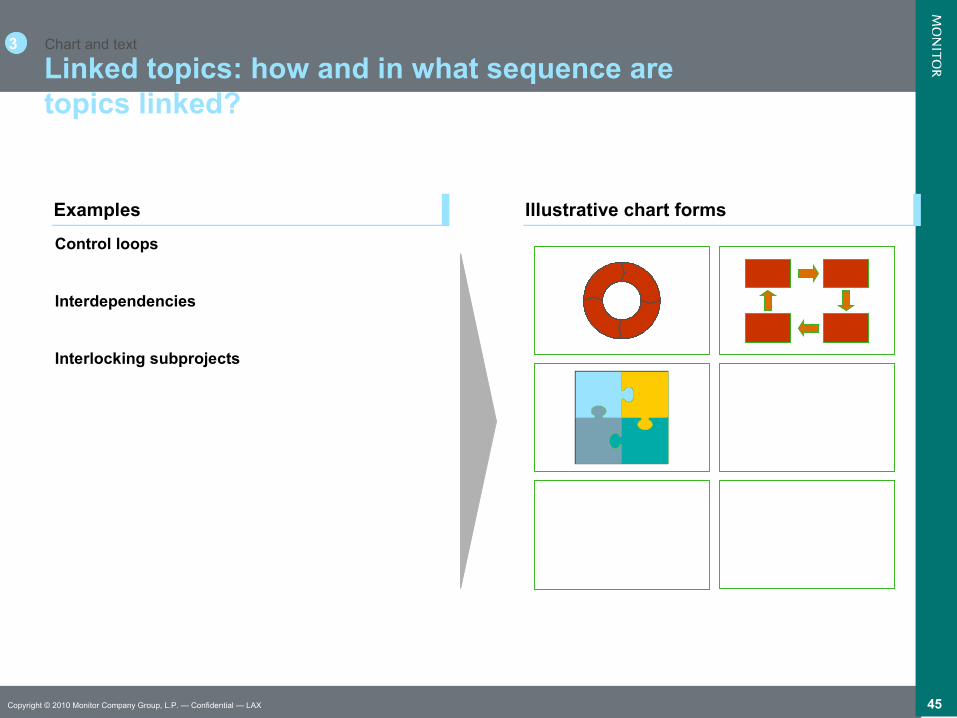
Linked topics: how and in what sequence are topics linked?
Control loops
Interdependencies
Interlocking subprojects
ExamplesExamples Illustrative chart formsIllustrative chart forms
46Copyright © 2010 Monitor Company Group, L.P. — Confidential — LAX
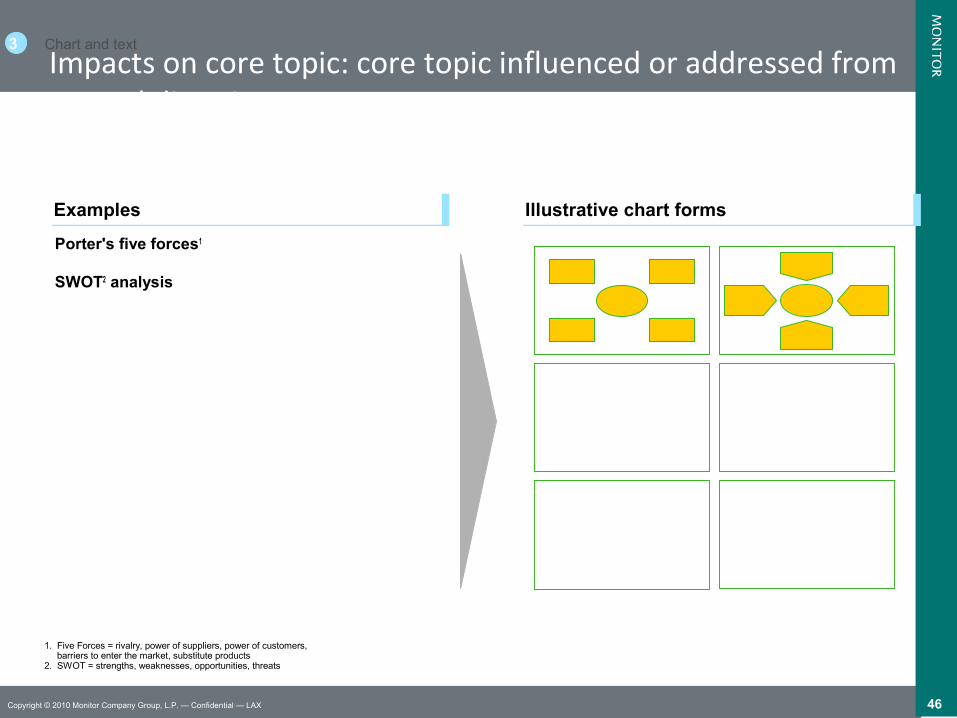
Impacts on core topic: core topic influenced or addressed from several directions
Chart and text3
Porter's five forces1
SWOT2 analysis
1. Five Forces = rivalry, power of suppliers, power of customers, barriers to enter the market, substitute products2. SWOT = strengths, weaknesses, opportunities, threats
ExamplesExamples Illustrative chart formsIllustrative chart forms
47Copyright © 2010 Monitor Company Group, L.P. — Confidential — LAX
Text structuring exercisesThe following examples show how to write concise, well-structured, and precise text
Each exercise includes the following elements A text that needs editing Space for a better solution One (out of many) possible solutions
All in all there are three exercises Meeting optimization Jogging Recommendation for animation
Text structure ExercisesBackup
48Copyright © 2010 Monitor Company Group, L.P. — Confidential — LAX
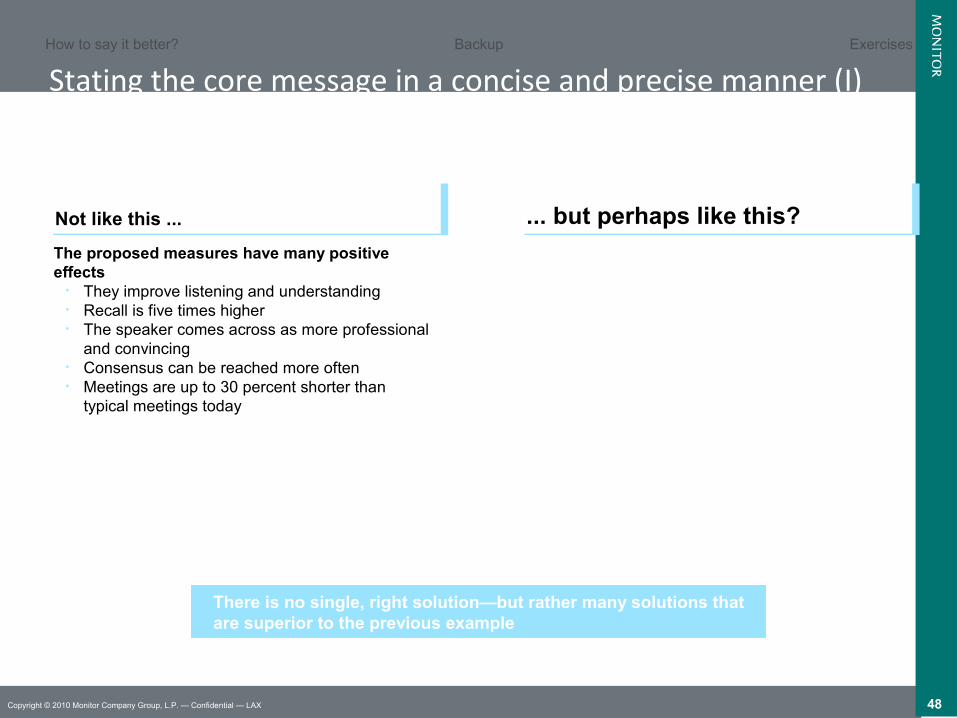
Stating the core message in a concise and precise manner (I)Illustrative exercise: meeting optimization
Not like this ... Not like this ... ... but perhaps like this?... but perhaps like this?
The proposed measures have many positive effects
• They improve listening and understanding• Recall is five times higher• The speaker comes across as more professional
and convincing• Consensus can be reached more often• Meetings are up to 30 percent shorter than
typical meetings today
Backup
There is no single, right solution—but rather many solutions that are superior to the previous example
ExercisesHow to say it better?
49Copyright © 2010 Monitor Company Group, L.P. — Confidential — LAX
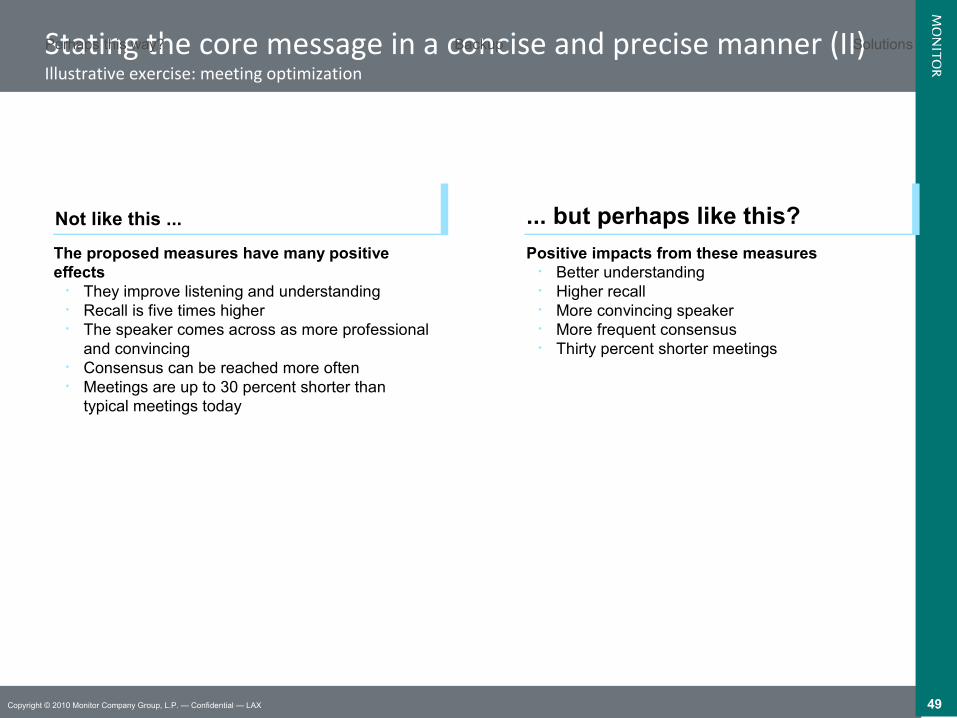
Stating the core message in a concise and precise manner (II)Illustrative exercise: meeting optimization
Positive impacts from these measures• Better understanding• Higher recall• More convincing speaker• More frequent consensus• Thirty percent shorter meetings
Backup SolutionsPerhaps this way?
The proposed measures have many positive effects
• They improve listening and understanding• Recall is five times higher• The speaker comes across as more professional
and convincing• Consensus can be reached more often• Meetings are up to 30 percent shorter than
typical meetings today
Not like this ... Not like this ... ... but perhaps like this?... but perhaps like this?
50Copyright © 2010 Monitor Company Group, L.P. — Confidential — LAX
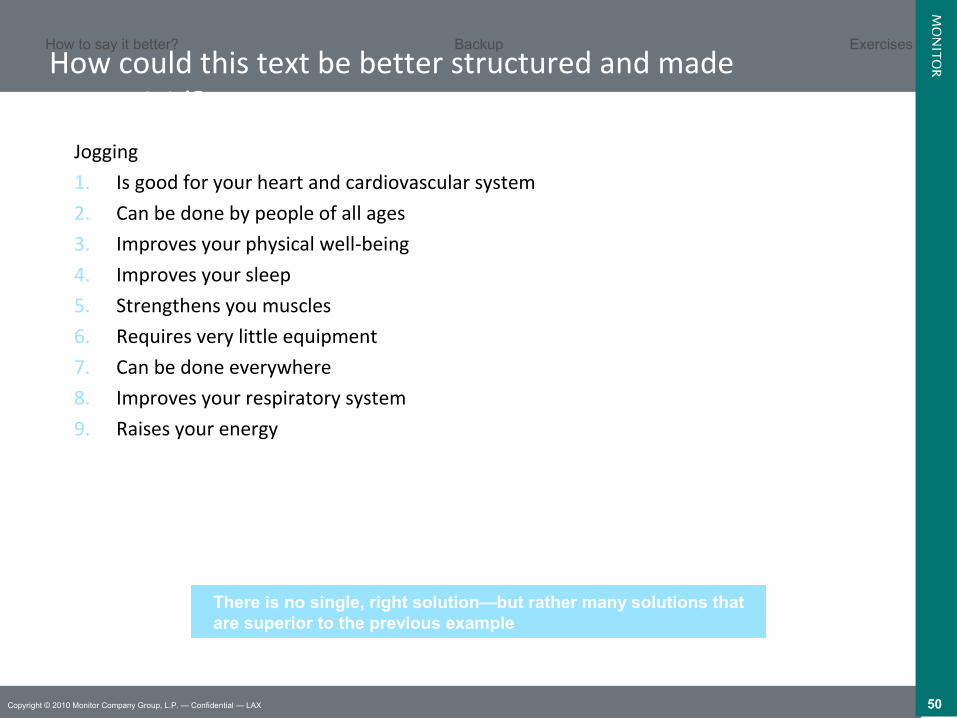
How could this text be better structured and made more vivid?
Jogging
1. Is good for your heart and cardiovascular system
2. Can be done by people of all ages
3. Improves your physical well-being
4. Improves your sleep
5. Strengthens you muscles
6. Requires very little equipment
7. Can be done everywhere
8. Improves your respiratory system
9. Raises your energy
There is no single, right solution—but rather many solutions that are superior to the previous example
Backup ExercisesHow to say it better?

51Copyright © 2010 Monitor Company Group, L.P. — Confidential — LAX
For example by grouping advantages into three categoriesIllustrative exercise: jogging
Jogging offers many advantages
1. Is a simple sport Requires very little equipment Can be done by people of all ages
2. Improves your fitness Improves your respiratory system Is good for your heart and cardiovascular system
3. Improves your well-being Raises your energy Improves your sleep
Perhaps this way? Backup Solutions

52Copyright © 2010 Monitor Company Group, L.P. — Confidential — LAX
Here is room for your own solutionIllustrative exercise: jogging
There is no single, right solution—but rather many solutions that are superior to the previous example
SolutionsBackupHow to say it better?
53Copyright © 2010 Monitor Company Group, L.P. — Confidential — LAX
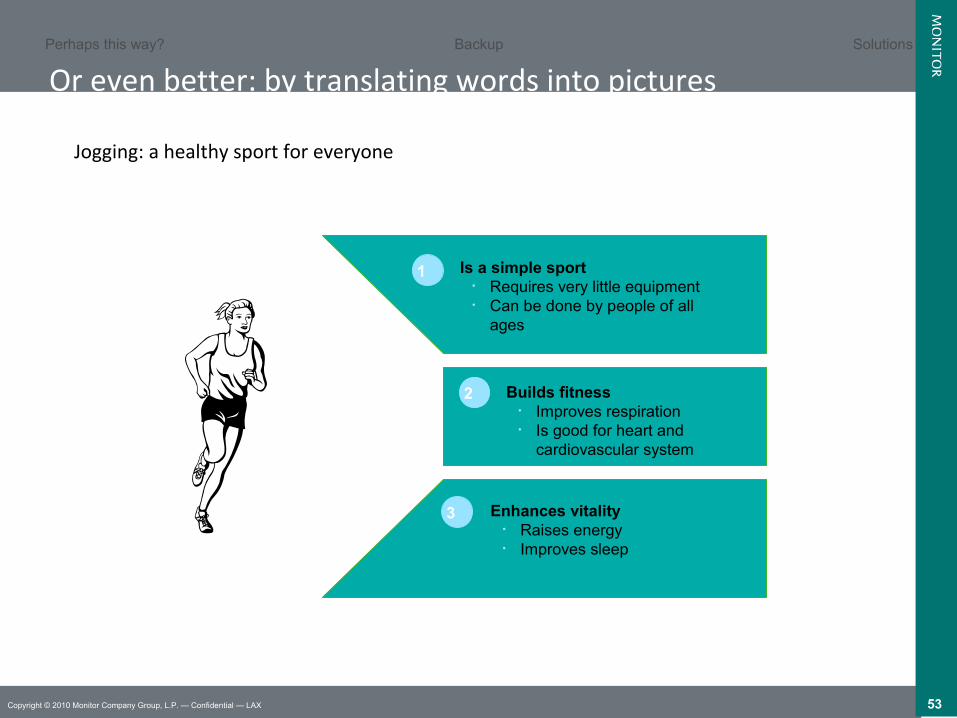
Or even better: by translating words into picturesIllustrative exercise: jogging
Jogging: a healthy sport for everyone
Is a simple sport• Requires very little equipment• Can be done by people of all
ages
Builds fitness• Improves respiration• Is good for heart and
cardiovascular system
Enhances vitality• Raises energy• Improves sleep
1
2
3
Perhaps this way? Backup Solutions
54Copyright © 2010 Monitor Company Group, L.P. — Confidential — LAX
For animations there is a basic rule that is very similar to that for colors: less is often more! If you use more than five different types of animation effects in a slide deck, it may look like cheap showmanship. Animations, just like colors, should underline, not shroud what the speaker says
Transition has already been mentioned. The next few pages describe individual effect types and how to use them in certain PowerPoint elements
In general, it is very helpful if the speaker takes the time to supervise the animationprocess him-/herself or gives very precise instructions
Above and beyond that the animation should always be the last step in slide deck production because often several elements need to be grouped for the animation.When corrections are made, the groups are often ungrouped—and the animationdestroyed
Backup
General recommendations for slide animation Illustrative exercise: recommended animation
How to say it better? Exercises

55Copyright © 2010 Monitor Company Group, L.P. — Confidential — LAX
Here is room for your own solutionIllustrative exercise: recommended animation
There is no single, right solution—but rather many solutions that are superior to the previous example
Backup SolutionsHow to say it better?
56Copyright © 2010 Monitor Company Group, L.P. — Confidential — LAX
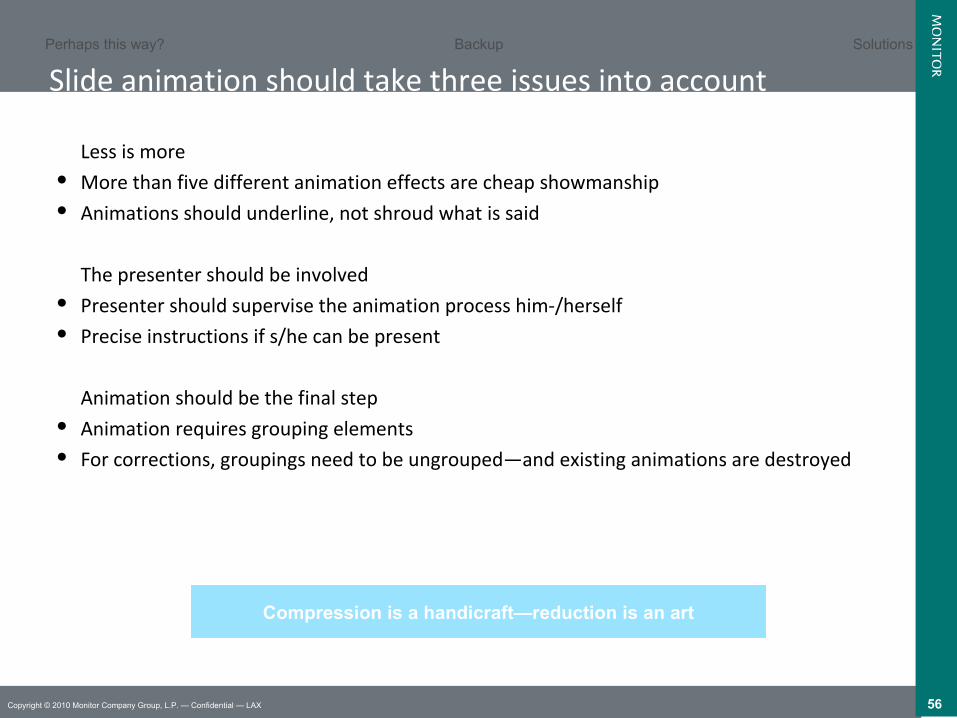
Slide animation should take three issues into account Illustrative exercise: recommended animation
Less is more More than five different animation effects are cheap showmanship Animations should underline, not shroud what is said
The presenter should be involved Presenter should supervise the animation process him-/herself Precise instructions if s/he can be present
Animation should be the final step Animation requires grouping elements For corrections, groupings need to be ungrouped—and existing animations are destroyed
Compression is a handicraft—reduction is an art
Perhaps this way? Backup Solutions
57Copyright © 2010 Monitor Company Group, L.P. — Confidential — LAX
Agenda
Generating incontestable, goal-oriented messages
Writing good slides
Developing a convincing story line
Ensuring timely production
Giving a good presentation
58Copyright © 2010 Monitor Company Group, L.P. — Confidential — LAX
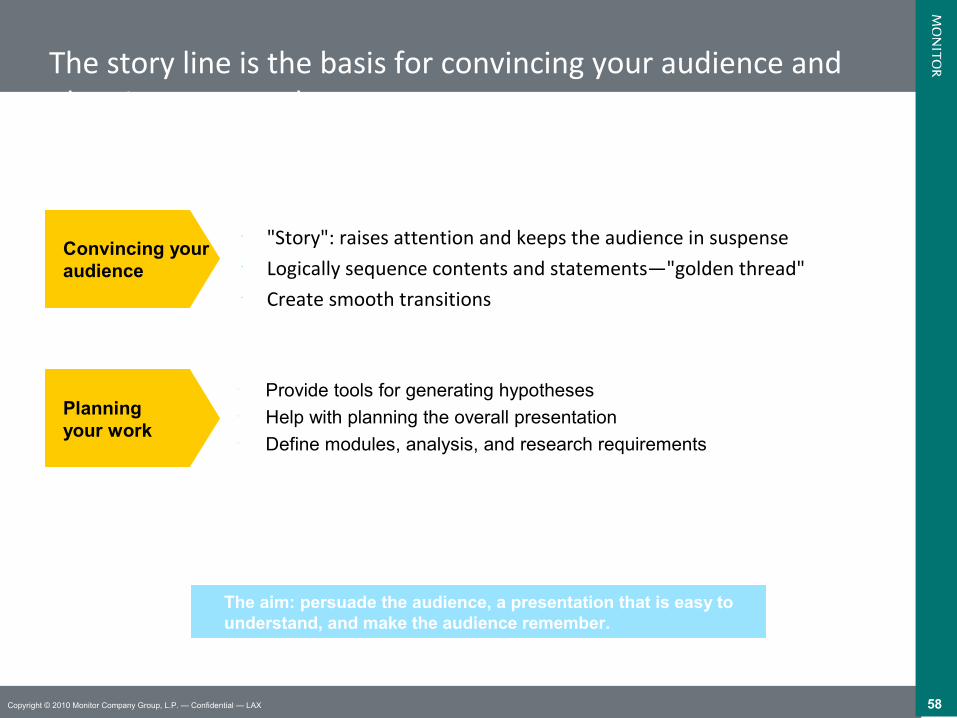
The story line is the basis for convincing your audience and planning your work
• "Story": raises attention and keeps the audience in suspense • Logically sequence contents and statements—"golden thread"• Create smooth transitions
Convincing your audience
Planningyour work
• Provide tools for generating hypotheses• Help with planning the overall presentation• Define modules, analysis, and research requirements
The aim: persuade the audience, a presentation that is easy to understand, and make the audience remember.
59Copyright © 2010 Monitor Company Group, L.P. — Confidential — LAX
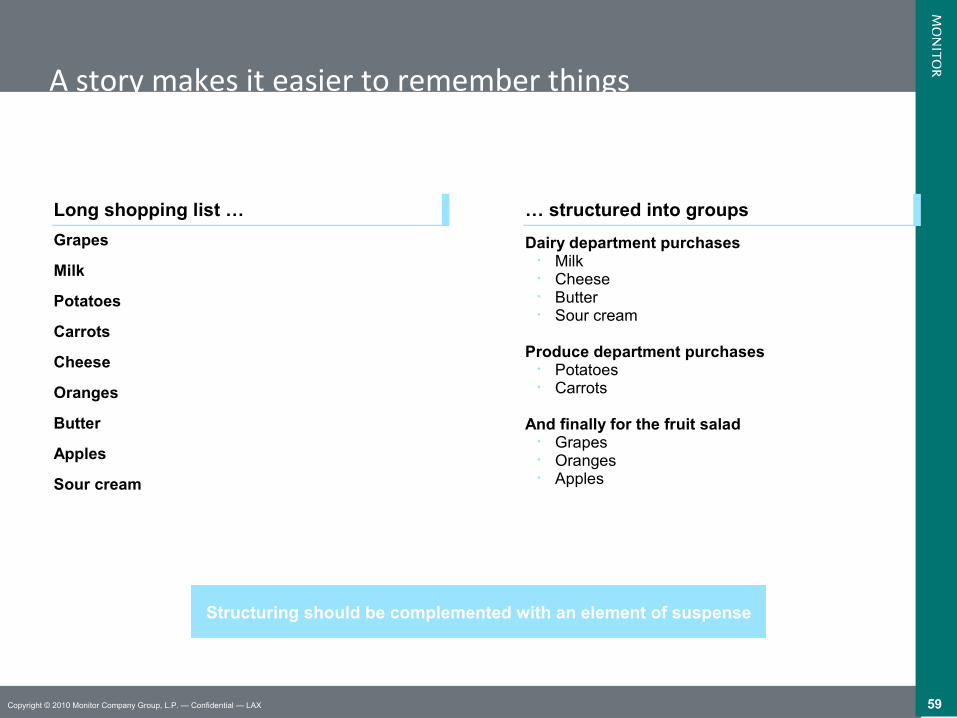
A story makes it easier to remember thingsPurchases for a vegetable pie and a fruit salad
Long shopping list …Long shopping list …
Grapes
Milk
Potatoes
Carrots
Cheese
Oranges
Butter
Apples
Sour cream
… structured into groups… structured into groups
Dairy department purchases• Milk• Cheese• Butter• Sour cream
Produce department purchases• Potatoes• Carrots
And finally for the fruit salad• Grapes• Oranges• Apples
Structuring should be complemented with an element of suspense

60Copyright © 2010 Monitor Company Group, L.P. — Confidential — LAX
The more exciting the story, the greater people's attention
What is true for fairytales …What is true for fairytales …
Little Red Riding Hood is walking through the forest …
… but then all of a sudden …
… and the wolf eats …
… fortunately they are all rescued …
… and they lived happily ever after
… can also help with presentations… can also help with presentations
The company offers excellent quality …
… nevertheless market share has been declining …
… our analyses show: customers define quality in a different way than the company …
… measure X improves the company's performance in the short term …
… the company will be positioned extremely well in the market in the future
61Copyright © 2010 Monitor Company Group, L.P. — Confidential — LAX
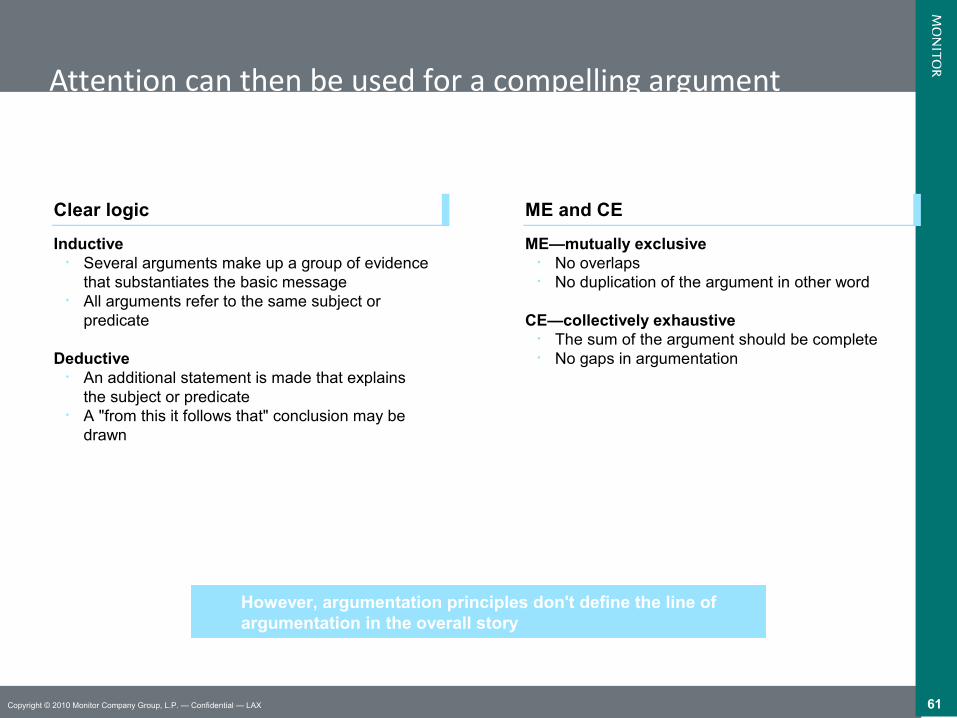
Attention can then be used for a compelling argumentKey argumentation principles
Clear logicClear logic
Inductive• Several arguments make up a group of evidence
that substantiates the basic message• All arguments refer to the same subject or
predicate
Deductive• An additional statement is made that explains
the subject or predicate• A "from this it follows that" conclusion may be
drawn
ME and CEME and CE
ME—mutually exclusive• No overlaps• No duplication of the argument in other word
CE—collectively exhaustive• The sum of the argument should be complete• No gaps in argumentation
However, argumentation principles don't define the line of argumentation in the overall story
62Copyright © 2010 Monitor Company Group, L.P. — Confidential — LAX
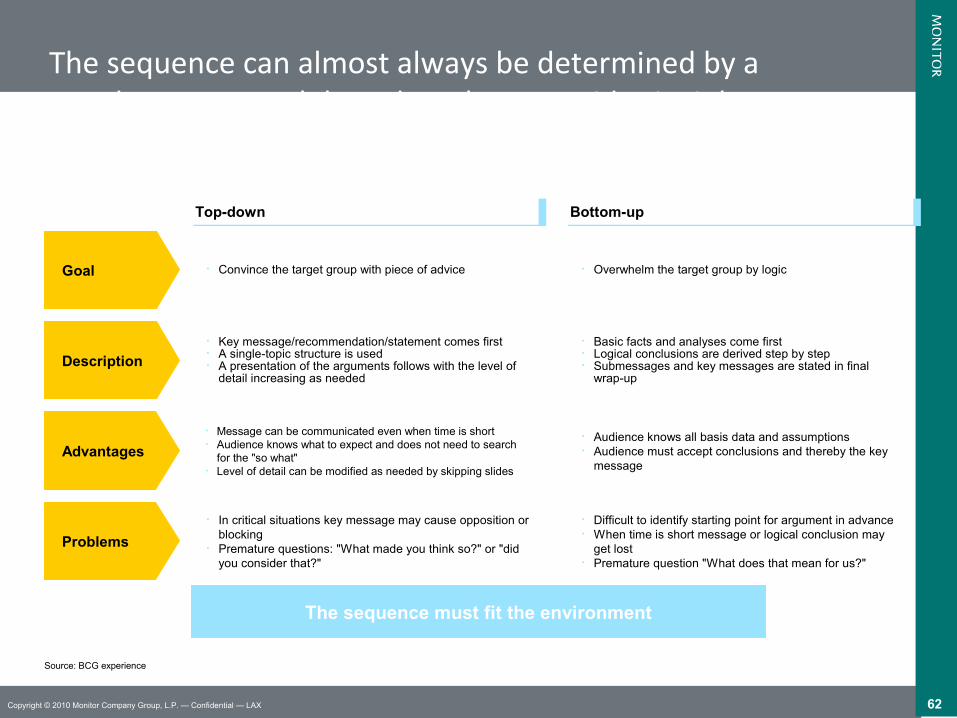
The sequence can almost always be determined by a top-down approach based on the pyramid principle
Source: BCG experience
The sequence must fit the environment
Top-downTop-down Bottom-upBottom-up
Goal
Description
Advantages
Problems
• Convince the target group with piece of advice
• Key message/recommendation/statement comes first• A single-topic structure is used• A presentation of the arguments follows with the level of
detail increasing as needed
• Message can be communicated even when time is short• Audience knows what to expect and does not need to search
for the "so what"• Level of detail can be modified as needed by skipping slides
• In critical situations key message may cause opposition or blocking
• Premature questions: "What made you think so?" or "did you consider that?"
• Overwhelm the target group by logic
• Basic facts and analyses come first• Logical conclusions are derived step by step• Submessages and key messages are stated in final
wrap-up
• Audience knows all basis data and assumptions• Audience must accept conclusions and thereby the key
message
• Difficult to identify starting point for argument in advance• When time is short message or logical conclusion may
get lost• Premature question "What does that mean for us?"
63Copyright © 2010 Monitor Company Group, L.P. — Confidential — LAX
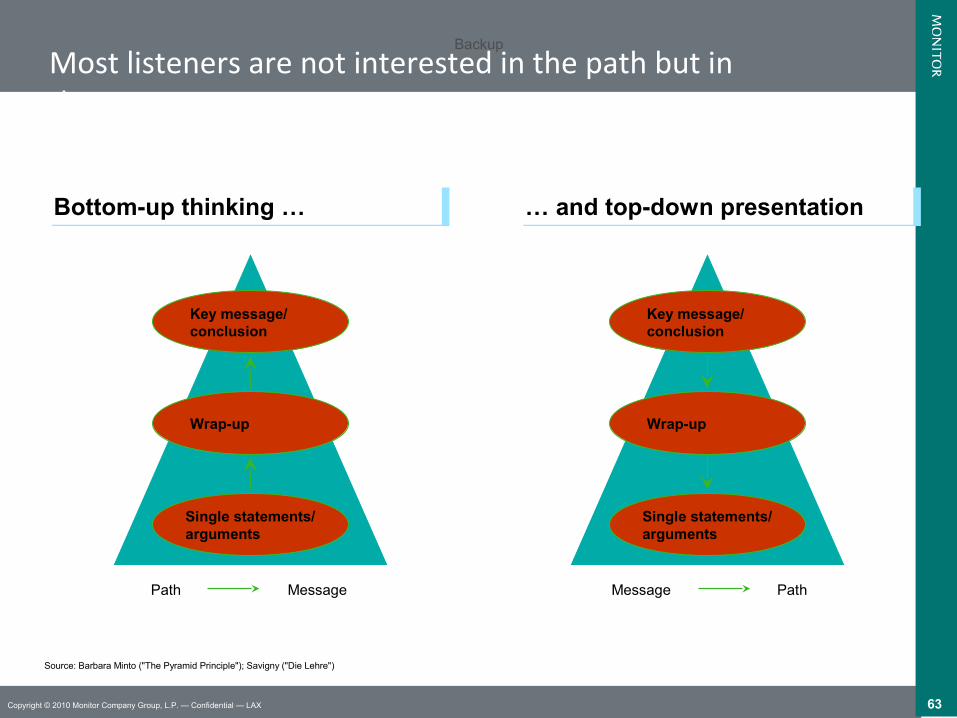
Most listeners are not interested in the path but inthe message
Bottom-up thinking …Bottom-up thinking … … and top-down presentation… and top-down presentation
Source: Barbara Minto ("The Pyramid Principle"); Savigny ("Die Lehre")
Path Message
Key message/conclusion
Wrap-up
Single statements/arguments
Message Path
Backup
Key message/conclusion
Wrap-up
Single statements/arguments
64Copyright © 2010 Monitor Company Group, L.P. — Confidential — LAX
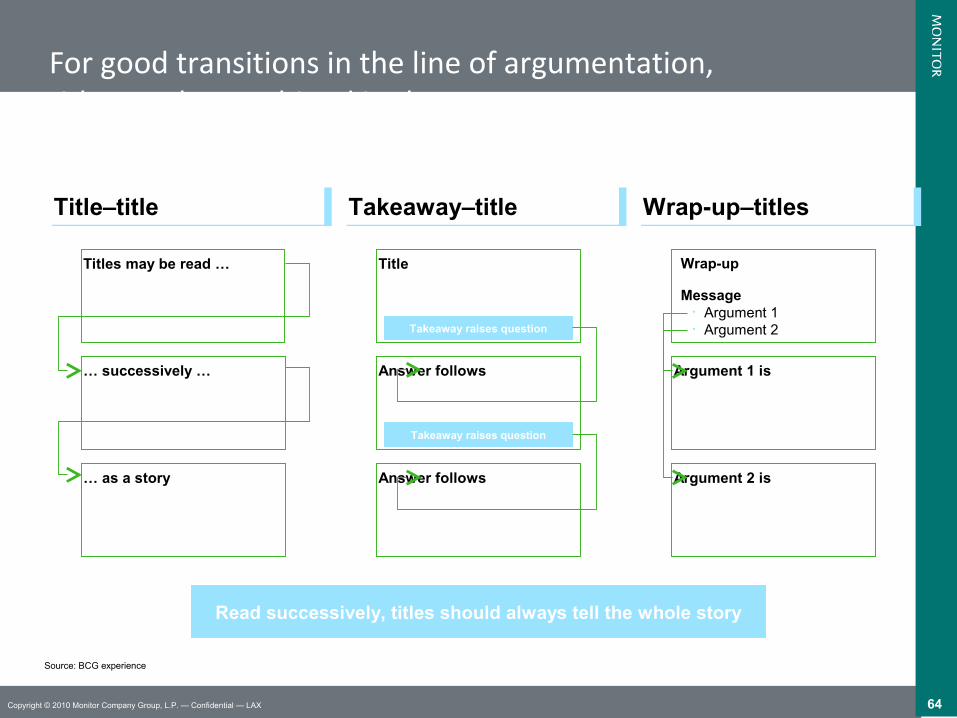
For good transitions in the line of argumentation, titles can be combined in three ways
Source: BCG experience
Title–titleTitle–title Takeaway–titleTakeaway–title Wrap-up–titlesWrap-up–titles
Titles may be read …
… successively …
… as a story
Title
Answer follows
Answer follows
Takeaway raises question
Takeaway raises question
Wrap-up
Message• Argument 1• Argument 2
Argument 1 is
Argument 2 is
Read successively, titles should always tell the whole story
65Copyright © 2010 Monitor Company Group, L.P. — Confidential — LAX
Title 1 Main Point
Title 3 Quotes
Title 5 Quotes
Title 2
Title 4 Title 6
Title 7 SupportingPoint
Title 8Data Table
Title 9 SupportingPoint
?Hypothese
I
II
Analyse
I 1
I 2
I 3
II 1
II 2
II 3
Output Daten-quellen Wer? Wann?
Quotes
!
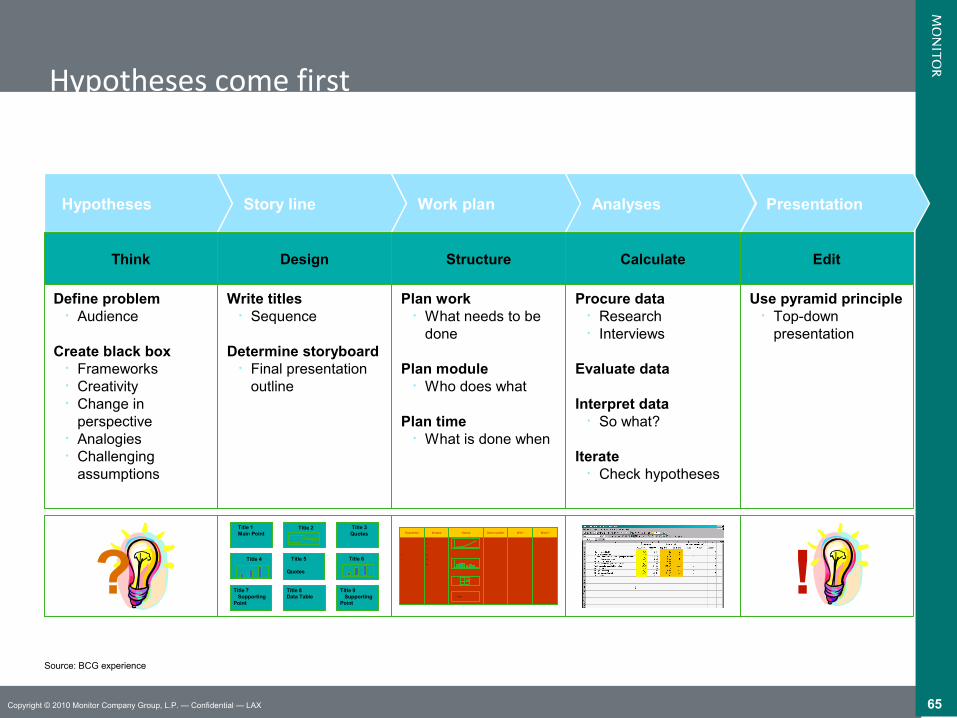
Hypotheses come first Typical BCG project procedure
Source: BCG experience
Hypotheses Story line Work plan Analyses Presentation
Think
Define problem• Audience
Create black box • Frameworks• Creativity• Change in
perspective• Analogies• Challenging
assumptions
Design
Write titles• Sequence
Determine storyboard• Final presentation
outline
Structure
Plan work• What needs to be
done
Plan module• Who does what
Plan time• What is done when
Calculate
Procure data• Research• Interviews
Evaluate data
Interpret data• So what?
Iterate• Check hypotheses
Edit
Use pyramid principle• Top-down
presentation
66Copyright © 2010 Monitor Company Group, L.P. — Confidential — LAX
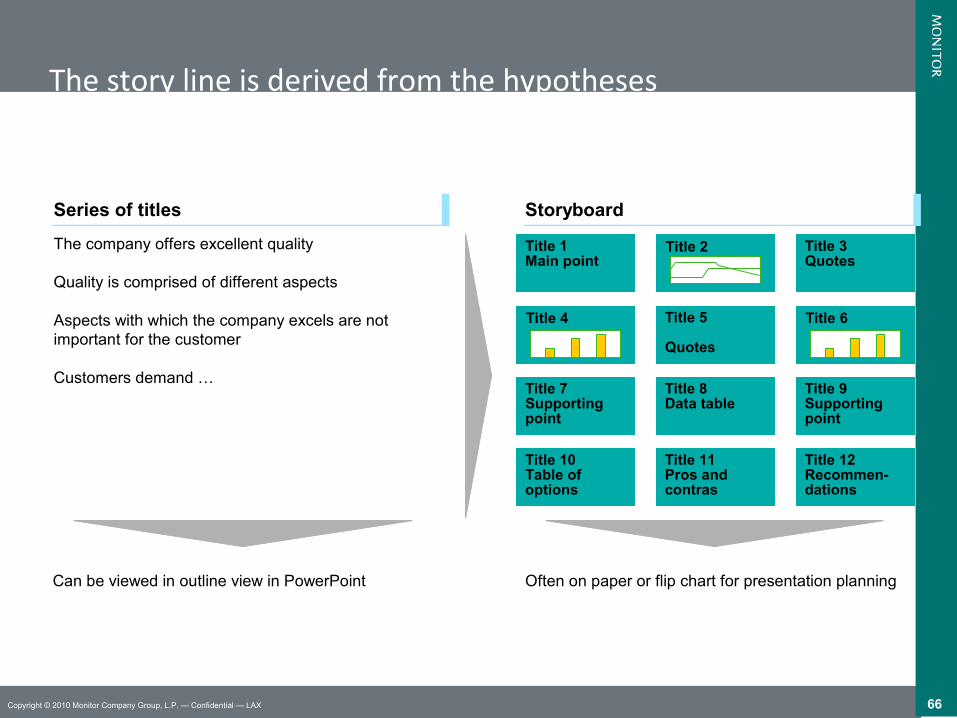
The story line is derived from the hypothesesTools for story line development
Series of titlesSeries of titles
The company offers excellent quality
Quality is comprised of different aspects
Aspects with which the company excels are not important for the customer
Customers demand …
StoryboardStoryboard
Can be viewed in outline view in PowerPoint Often on paper or flip chart for presentation planning
Title 1Main point
Title 3Quotes
Title 5 Quotes
Title 4
Title 7Supportingpoint
Title 8Data table
Title 9Supportingpoint
Title 10Table ofoptions
Title 11Pros andcontras
Title 12Recommen-dations
Title 2
Title 6
67Copyright © 2010 Monitor Company Group, L.P. — Confidential — LAX
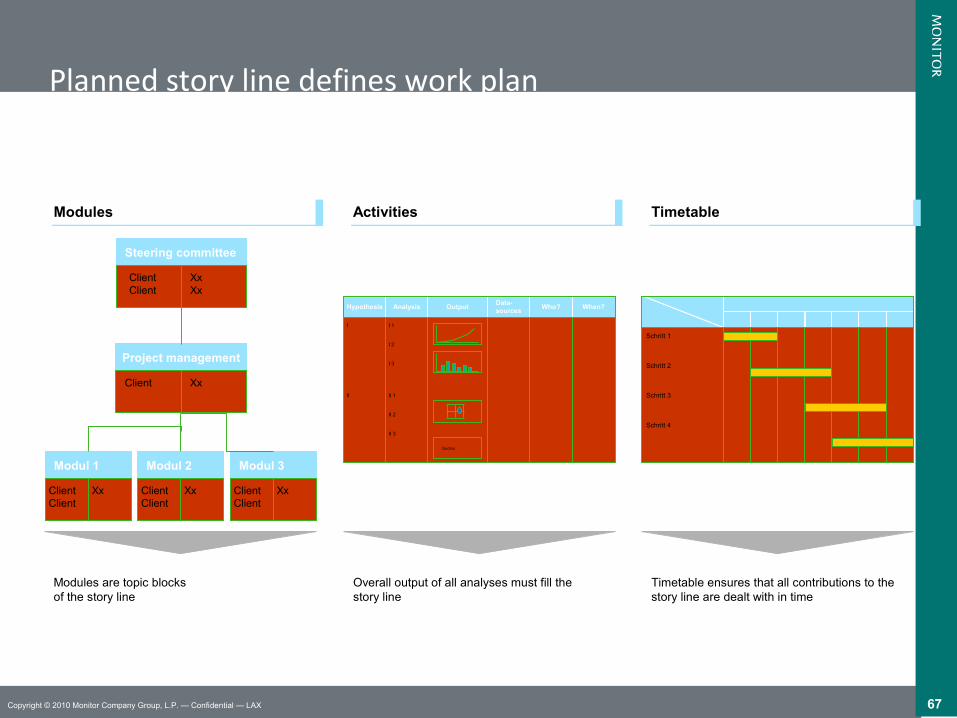
Planned story line defines work planThe work plan elements
ModulesModules ActivitiesActivities TimetableTimetable
Hypothesis
I
II
Analysis
I 1
I 2
I 3
II 1
II 2
II 3
OutputData-sources
Who? When?
Quotes
Schritt 1
Schritt 2
Schritt 3
Schritt 4
Steering committee
ClientClient
XxXx
Project management
Client Xx
Modul 1
ClientClient
Xx
Modul 2
ClientClient
Xx
Modul 3
ClientClient
Xx
Modules are topic blocksof the story line
Overall output of all analyses must fill thestory line
Timetable ensures that all contributions to the story line are dealt with in time
68Copyright © 2010 Monitor Company Group, L.P. — Confidential — LAX
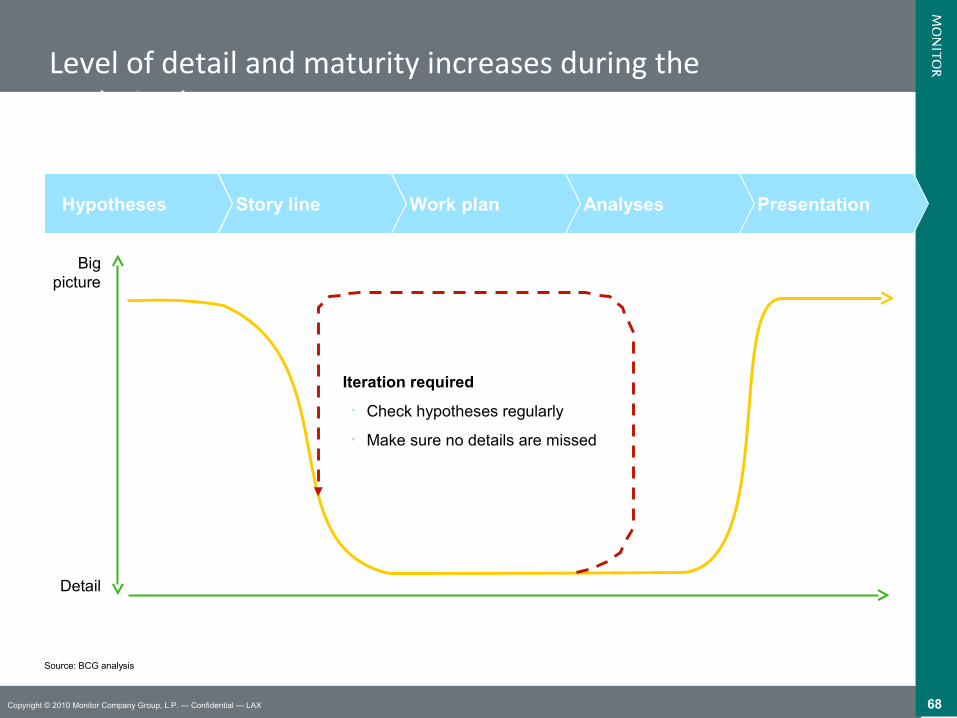
Level of detail and maturity increases during the analysis phase
Hypotheses Story line Work plan Analyses Presentation
Source: BCG analysis
Bigpicture
Detail
Iteration required
• Check hypotheses regularly
• Make sure no details are missed
69Copyright © 2010 Monitor Company Group, L.P. — Confidential — LAX
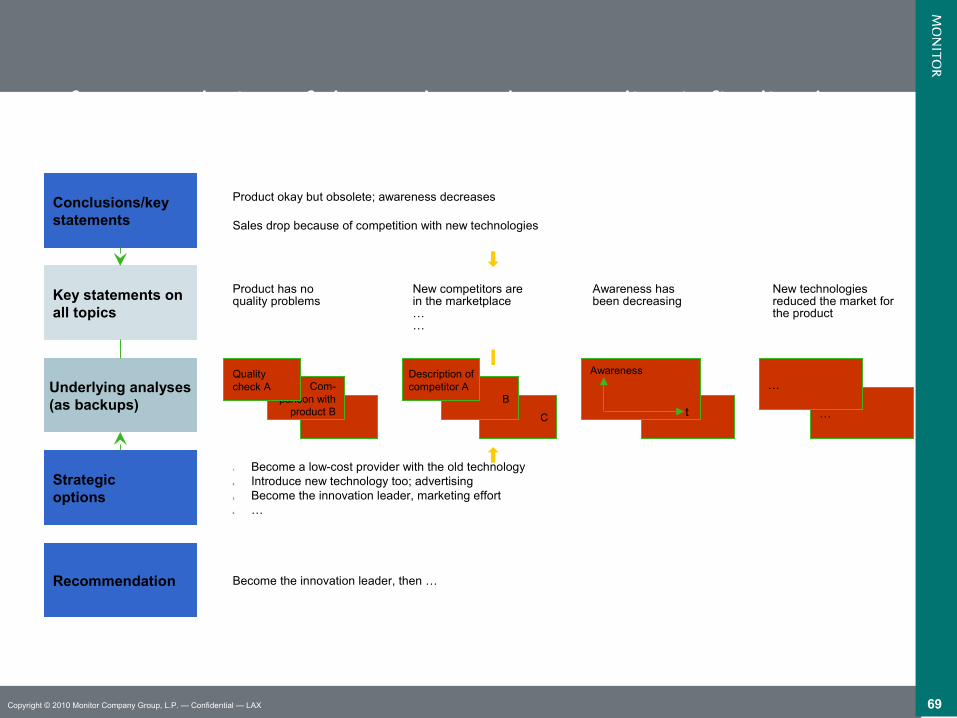
After completion of the analyses the story line is finalized
Conclusions/key statements
Key statements onall topics
Underlying analyses(as backups)
Strategicoptions
Recommendation
Product has no quality problems
New competitors are in the marketplace……
Awareness has been decreasing
New technologiesreduced the market forthe product
1. Become a low-cost provider with the old technology2. Introduce new technology too; advertising3. Become the innovation leader, marketing effort4. …
Become the innovation leader, then …
Com-parison with
product B
Qualitycheck A
C
B
Description ofcompetitor A
…
…Awareness
t
Product okay but obsolete; awareness decreases
Sales drop because of competition with new technologies

70Copyright © 2010 Monitor Company Group, L.P. — Confidential — LAX
In what sequence should the slides with the following titles be sorted? (I)
A. Innovations are researched worldwide in 13 different application areas
B. Target attainment requires execution of a five-point program
C. After its breakthrough, nanobiotechnology will generate a global value added of €XX billion
D. Ambitious goal for region A: ten percent share of the global value added
E. In Germany also science and industry activities in all application areas
F. Region A has the best starting position of the German locations
G. Worldwide research into the miniaturization of classical biotechnology has brought about a breakthrough
technology
H. Region A could generate €X billion in value added from nanobiotechnology
Story line Backup Exercise 1
71Copyright © 2010 Monitor Company Group, L.P. — Confidential — LAX
In what sequence should the slides with the following titles be sorted (II)
1. Xxx
2. Xxx
3. Xxx
4. Xxx
5. Xxx
6. Xxx
7. Xxx
8. Xxx
Storyline Backup Exercise 1
72Copyright © 2010 Monitor Company Group, L.P. — Confidential — LAX
Exercise 1
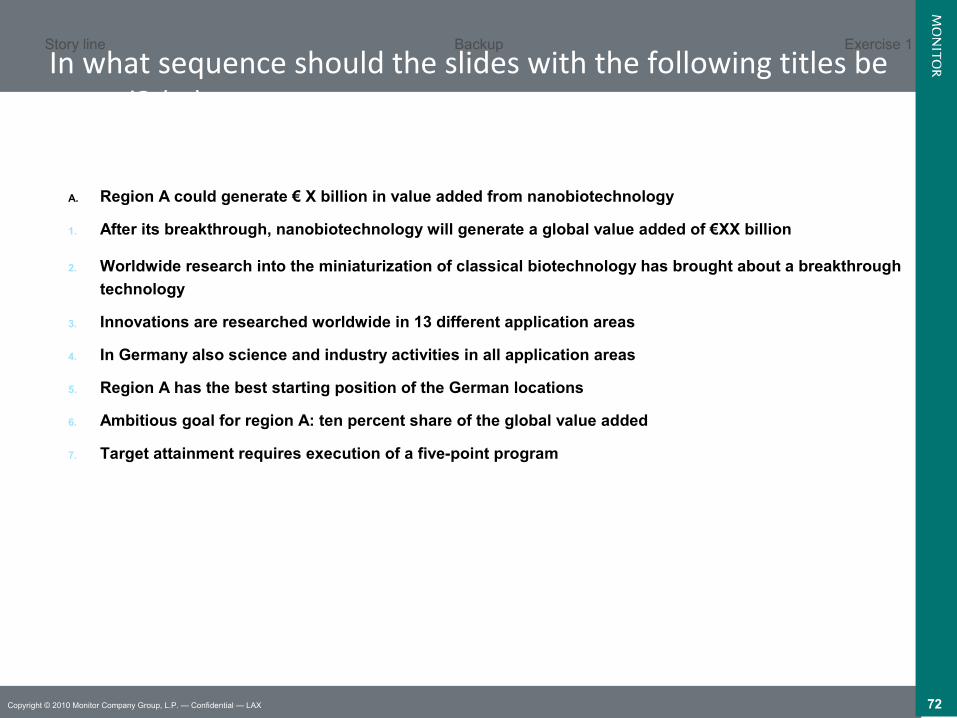
In what sequence should the slides with the following titles be sorted? (III)
A. Region A could generate € X billion in value added from nanobiotechnology
1. After its breakthrough, nanobiotechnology will generate a global value added of €XX billion
2. Worldwide research into the miniaturization of classical biotechnology has brought about a breakthrough
technology
3. Innovations are researched worldwide in 13 different application areas
4. In Germany also science and industry activities in all application areas
5. Region A has the best starting position of the German locations
6. Ambitious goal for region A: ten percent share of the global value added
7. Target attainment requires execution of a five-point program
Story line Backup
73Copyright © 2010 Monitor Company Group, L.P. — Confidential — LAX
Agenda
Generating incontestable, goal-oriented messages
Writing good slides
Developing a convincing story line
Ensuring timely production
Giving a good presentation
74Copyright © 2010 Monitor Company Group, L.P. — Confidential — LAX
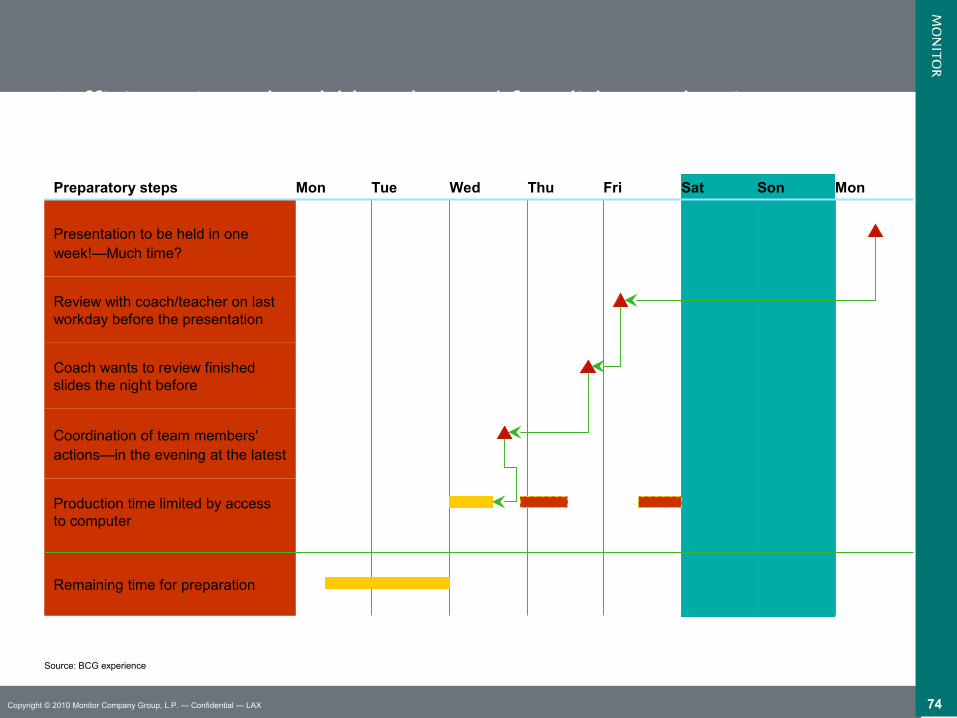
Sufficient time should be planned for slide production
Mon Tue Wed Thu Fri Sat Son Mon
Review with coach/teacher on last workday before the presentation
Presentation to be held in oneweek!—Much time?
Preparatory steps
Remaining time for preparation
Production time limited by accessto computer
Coordination of team members'actions—in the evening at the latest
Coach wants to review finishedslides the night before
Source: BCG experience
75Copyright © 2010 Monitor Company Group, L.P. — Confidential — LAX
Agenda
Generating incontestable, goal-oriented messages
Writing good slides
Developing a convincing story line
Ensuring timely production
Giving a good presentation
76Copyright © 2010 Monitor Company Group, L.P. — Confidential — LAX
Presenting cannot be learned in theorySome basic rules
Try it!
Present the team and the agenda
Tell a story Don't tell what's on the slide but what it means Link slides verbally
Don't overwhelm the audience Briefly explain complex slides
Don't talk to the wall but to the group Keeping eye contact is important
Watch the audience's response Have they understood you? Are they interested? Should you move faster? slower? Be prepared to skip slides ("compression is a handicraft ...")

77Copyright © 2010 Monitor Company Group, L.P. — Confidential — LAX

78Copyright © 2010 Monitor Company Group, L.P. — Confidential — LAX

79Copyright © 2010 Monitor Company Group, L.P. — Confidential — LAX