report on the socio-economic state of the rosia …
TRANSCRIPT

SOCIO-ECONOMIC RESEARCH AND DEVELOPMENT CENTRE
“MUNTII APUSENI” ASSOCIATION
REPORT
ON THE SOCIO-ECONOMIC STATE
OF THE ROSIA MONTANA VILLAGE
Version 21. 12.2009
Coordinators: PhD Dalia Petcu
PhD Vasile Gherheş Authors: PhD Adrian Dinu Rachieru
PhD Mihai Pascaru
PhD Vasile Burja PhD Dalia Petcu
PhD Vasile Gherheş PhD Ionela Gavrilă-Paven PhD Ciprian Obrad PhD Sorin Suciu PhD Lucia Ispas-Pascaru
Soc. Simina Moldovan
Soc. Delia Covrig Scientific consultant: PhD Lucian Marina

2
REPORT ON THE SOCIO-ECONOMIC STATE
OF THE ROSIA MONTANA VILLAGE
SUMMARY
This Report is part of the Longitudinal Research Project titled “Monitoring of the Socio-
Economic Aspects in the Rosia Montana area from the sustainable development perspective”.
The purpose of the project is to do a quantitative and qualitative review of the evolution of the
socio-economic aspects in the Rosia Montana village over a period of 20 years. The project aims
to delineate the factors with positive and negative influence and highlight the development trend
of the village. The economic-social diagnosis is a tool for monitoring the socio-economic
development, substantiating the support measures for medium and long term development of the
village. The project aims to provide the theoretical and practical principles for the
implementation of viable development strategies and a set of indicators to allow the assessment
of the efficiency of these strategies.
The Report on the Socio-Economic State of the Rosia Montana Village – 2009 aims to
provide a clear image of the socio-economic conditions identified in 2009 within the Rosia
Montana village and thus set a baseline from which to monitor the evolution of the investigated
aspects.
The aims include:
• Identify and develop a set of indicators specific for sustainable development.
• Develop a set of tools for the assessment of the socio-economic situation in the Rosia
Montana village.
• Establish a database that will include information regarding the above mentioned aspects.
• Create new information sources and/or improve existing sources in order to assess the
situation and the socio-economic evolution.
Context:

3
• Lack of rigorous and credible information on the state and evolution of the socio-
economic aspects in the Rosia Montana area.
• The databases on file with the local and regional public authorities and institutions
include information that does not reflect the actual situation of the community given that changes
of the socio-economic conditions of the community had occurred in conjunction with migration,
relocation and resettlement.
Activities:
1. Review the existing socio-economic data and the potential for community action and
mobilization (collect and review available socio-economic data from the public local and
regional institutions).
2. Develop a matrix of indicators related to the monitoring of the economic-social aspects
in the area (develop a matrix of indicators specific to the investigated area, i.e. demography,
household, income, income sources and household consumption, poverty and extreme poverty,
education, health, culture, associative life and community participation, access to services and
infrastructure, economy, etc).
3. Prepare the work tool (draft up the questionnaire).
4. Pretest the methodological tools.
5. Recruit and train the field operators (there were about 20 field operators recruited,
members of the local community who were trained to implement the questionnaires). The
questionnaire was reviewed together with the selected operators and the aspects regarding how to
fill it out were clarified.
6. Coordinate the data collection at household level (963 units). After starting the data
collection activity, the investigation team took regular trips to Rosia Montana to coordinate the
collection of data by the operators, clarify any issues occurred during data collection, gather the
implemented questionnaires and have them included in the database.
7. Coordinate the data collection at institutions, organizations and businesses level.
8. Develop a database regarding the quality of life in households.
9. Process collected data and draft up the investigation report.
10. Disseminate the results.

4
Results:
• X-raying the socio-economic state of the Rosia Montana village in order to identify
optimal solutions for working out the problems and implementing the best development
strategies.
• Enhance and improve the administrative capacity of the local and regional public
authorities through access to updated information on the investigated area and estimated analysis
on its evolution.
• Inform the stakeholders about the investigated aspects, providing studies and solutions
that reflect accurately the socio-economic state of the community.
Sources:
• Sociologic survey by households conducted during September - October 2009 in the
Rosia Montana village.
• Available statistical data on record with the Rosia Montana Town Hall, Alba County
Statistics Department, Department for Persons Records, statistical directories, censuses, etc.
The methodology of the sociologic survey by households:
The diagnosis study that was completed is exhaustive as all the households identified in
the Rosia Montana commune were included in the investigation. The field operators were
trained to interview all identified households and gather information on the status of the
uninhabited houses which resulted in a field identification of the population according to a
methodology similar to that employed by censuses. Given that this action did not benefit by the
legal framework specific to this type of official investigation, refusals or situations whereby the
household members were not available during the stage dedicated to field work could not be
avoided. Thus, there were 43 households that refused to fill out the questionnaire and 89
households that were not available during the completion of the study. However, alternative
sources for the development of the database (i.e. the Agriculture Register) were used in order to
have an accurate image on the population structure, listed in Part I, for the 132 households that
were not available for interview. Thus, the investigation included 963 households identified in
the field (831 households were interviewed directly and for 132 households the information was

5
taken from the Agriculture Register), with a total of 2589 subjects from the Rosia Montana
commune.
For clarity purpose we will hereafter refer to the population included in this research as
investigated population or investigated households and where the reference population is that
recorded in official statistics we will use the term legal population or population recorded in
official statistics.
The basic research unit was the household defined as “a group of two or several persons
who usually live together, typically have kinship relationships, share the housework, sometime
work together in the household, use the obtained products jointly, participate fully or partially in
the creation and use of the income and expenditure budget of the household. The household may
also consist of a group of two or several persons, with or without children that do not have
kinship relations but who declare that they live together by agreement and have a joint budget.
The persons who live alone and who do not belong to another household shall be considered
households consisting of one person only.”1
The data collection tool was structured by 3 sections:
• The first section included 32 questions regarding the socio-demographic data of all
household members who accepted to participate in the survey (sex, age, religion, ethnic
background, education, marital status, occupation, etc). The section also included questions
regarding the health state perception, addressed to household members of over 16 years of age.
• The second section - Quality of Life – included 11 questions regarding the quality of life,
which were answered to by the heads of household (incomes, expenditures, the total and
structure thereof, access to institutions and services, etc). The heads of household were
identified based on self-definition (person who defines herself / himself as “head of household").
Where it was not possible otherwise, the person registered as house tax payer was considered
"head of household". Use of other information sources apart from direct interview was no longer
possible for this part of the investigation. The population investigated in this section is that of
the “heads of household" who were interviewed directly and who comes up to a total of 831
persons (86% of the total households identified following the fieldwork). The last section of the
questionnaire – Dwelling and homestead – included a set of 19 questions put to the head of
1 www.insse.ro

6
household (type of dwelling, ownership, amenities, construction materials, lands and animals,
home appliances, etc).
The data collection interval was September – October 2009. Data was collected by 20
operators, selected from the community on the consideration that the fact that they belong to the
community facilitates the information collection process and ensures higher accuracy. In
addition, given that the Rosia Montana commune includes 16 villages scattered over a large area
with hard to access or isolated households, a good knowledge by the operations of the field
situation was considered a necessary condition for this stage of the investigation.
SECTION I. SOCIO-DEMOGRAPHIC ASPECTS
Having summarized a few conclusive aspects of the sociologic survey by households, we
point out:
From an administrative standpoint, the Rosia Montana commune comprises 16 villages
that have an uneven distribution of the population with villages that have a small number of
people, i.e. less than 50 people, such as Bunta, Balmosesti, Blidesti, Iacobesti, or less than 100
people such as Coasta Hentii, Ignatesti, Soal, Tarina. Conversely, there are villages that have
over 500 people such as Rosia Montana and Daroaia.
Following the sociologic survey by households completed in the Rosia Montana
commune, there were 963 households identified that comprise as follows: 29.3% households
formed of one single person, 23.3% households formed of two persons, 20.5% and 13.4%
households formed of 3 and 4 persons respectively.
According to the age of the reference person, i.e. the head of household, more than 40%
of the people belong to the age group of 60+ years old and 39.5% of the households have as head
of household a person in the age range of 40-59. The households run by people of age ranging
between 25 – 39 years old represent 16.6% and the households run by very young people, of age
ranging between 16 – 24 years represent 3.4%.
Of the total of 282 households run by a single person, 134 are formed of a person over
65 years old, which represents 47.5% of the total households of this type.

7
The households with Rroma people (149 households identified following the sociologic
survey by household) comprise 435 people of which 429 people have stated themselves to be
Rroma. The number of people of ages ranging between 0 – 17 years old is 151 which represents
35.19% of the total Rroma people. Please note that more than half of the Rroma people are less
than 25 years old.
The structure by gender of the population in the surveyed households indicates a higher
proportion of women (51.1%) than that of men (48.9%) while in terms of religion, the majority
of the population is Orthodox (89.8%).
In terms of ethnic background, 82.6% state they are Romanians and 16.5% Rroma. The
Rroma population is concentrated in Daroaia village where they represent 80% of the population
of this village.
The distribution of the population according to the marital status indicates that the
highest percentage includes married people, i.e. 44.9% followed by 18.3% single people. There
is also a 10.4% of the total population who are widowed as well as 3.9% who are in a de facto
relationship. The percentage of divorced people is 3.4%.
In 2009 in the Rosia Montana commune there were 15 marriages registered and no divorces.
The distribution of the population by age groups indicates that 15.1% of the subjects
investigated in the Rosia Montana commune belong to the 0 – 14 years old range, 69.1% to 15 –
64 years old and 15.6% to above 65 years old.
The structure of the investigated population subject to the professional status is as
follows: employees 15.9%, private business owners 0.8%, self-employed 0.7%, family workers
in own homestead 7.2% Regarding the professional status, there is an imbalance in terms of the
distribution by genders, i.e. the categories private business owner and self-employed person
include predominantly men, namely 71.4% and 78.9%, respectively, while the category family
worker in own homestead includes mainly women, i.e. 62.6%. Please note that the occupied
population is concentrated in the villages of Rosia Montana and Carpinis.
The population of work age (15 – 65 years old) of the Rosia Montana commune
represents 69.1% of the total investigated population. Please note that the peak of the
occupational potential is concentrated in the range 45 – 49 years old, i.e. 12.1%; similar
percentages are found in the range 35 – 39 years old and 20 – 24 years old, respectively, i.e.
11.4% each. Regarding the last age range please note that the Daroaia village is a special

8
situation where the young workforce potential (15 – 24 years) covers a quarter of the population
of the village (24.5%).
If we look at the adult population in Rosia Montana commune, namely above 17 years
old, we see that from an educational standpoint the highest percentage includes 10 grades /
occupational school graduates. This category represents 25% of the population defined
hereinabove. In terms of proportion, the following categories include, in decreasing order, the 5-
8 grade graduates, namely 23.2%, high-school graduates 20.4%, university graduates 10.6%.
We note that a significant percentage of the investigated population (i.e. 9.3%) has a low
education level (1 - 4 grades) and that there is also the category of people who never attended
any type of formal schooling.
In terms of the distribution by the 16 villages belonging to the Rosia Montana commune,
we make the following notes regarding the education level:
- of the total people who, at the time of the sociologic survey by households, state that
they never attended school, the highest percentage is recorded in Daroaia village -
46.9%, followed by Garda Barbulesti – 12.5% and Carpinis - 9.4%;
- a low level of schooling is recorded in Daroaia where of the total people who stated
they attended primary school, there was a percentage of 30.8% identified, followed
by Rosia Montana with 11.6% and Vartop with 10.6%;
- 30.8% people finished secondary school in Daroaia, 17% in Rosia Montana and
12.2% in Carpinis.
The villages with people who stated they had a higher education level, i.e. university
graduates are: Rosia Montana 43.8%, Carpinis 15.9% and Corna 8.8%.
The review of the data indicates that of the total adult Rroma population, 20.3% finished
primary school and 45.6% secondary school. A smaller percentage, i.e. 5%, finished high-school
and only 2.1% graduated university. We also note that 4.6% of the adult Rroma population
never attended school at all.
The health status of the interviewed subjects, according to self-assessment, is
considered to be good by 37.7% of the respondents and satisfactory by 21% while at the opposite
pole, the bad and very bad state total 14.8% of the responses, namely 11.6% bad and 3% very
bad health state, respectively. Compared to 2008, the health status got worse for 16.3% of the
respondents while for 63.5% it is stationary. We note that 61.2% of the interviewed subjects
believe they suffer from no illness.

9
In terms of the pathological situation, according to the medical records and data provided,
the first place in this possible ranking by disease groups is occupied by high pressure blood cases
(234 subjects), followed by valvular and ischemic heart diseases (113 subjects), psychiatric
conditions (86 cases, the majority anxiety-depression syndromes), obstructive pulmonary
bronchitis (65 cases) associated with tuberculosis (10 subjects, treated cases).
From the sociologic survey standpoint, the pathological situation indicates as peak the
rheumatic conditions with 16.3% followed by high blood pressure cases (11.1%) associated with
the heart conditions (another 11%), pulmonary conditions (4.5%), gastro-duodenal conditions
(4.3%), kidney conditions (3.7%), diabetes (2.1%), mental conditions (1.5%). We note that there
are obvious differences between the situation reflected in the official medical statistics and that
resulting from self-assessment. In terms of the latter, the rheumatic conditions prevail. Access
to healthcare and healthcare units is difficult, mainly because of the distances.
SECTION II. URBAN INFRASTRUCTURE AND ECONOMY
In terms of the URBAN INFRASTRUCTURE in the Rosia Montana commune, please
note that the HOUSING FUND has a decreasing trend during 2000 – 2008 as it was reduced by
63 dwellings in the investigated period, which represents about 4%. With the exception of 11
dwellings, the vast majority (i.e. 1518) of the dwellings are privately owned. The reduction of
the number of dwellings may be explained by the fact that some of these dwellings got badly
damaged because they are no longer inhabited or because their destination was changed. (Table
II.1.1). The inhabitable area has also decreased after 2001, mainly because of the private sector
where a significant reduction in the housing fund occurred. However, the living area / person is
increasing continuously due to the reduction of the number of people that live in the area.
Over the last three years there was only one dwelling built in the commune, which shows
the reduced prospects of the commune in terms of habitation and the lack of income required to
invest in housing, the existence of the inhabitants depending on the economic development of the
area. The last permit was issued in 2005.
We note that the LENGTH OF THE DRINKING WATER SUPPLY SYSTEMS within
the commune has increased in 2005 by 6.7 km however the amount of drinking water supplied to
the population went down in the same year by about 6 times, subsequently staying at about

10
83,000 m3, which represents 21% of the amount supplied in 2004. This is explained by the
massive de-population of the locality and closure of the mining activity. (Table II.1.3).
In terms of the ECONOMY of the Rosia Montana commune, please first note that the
structure of the businesses by activity sectors and their dynamics in 2009 compared to 2008
indicates that the majority of the businesses are involved in services, namely in trading, repairs
and transportation. The number of tax-paying businesses involved in constructions has gone
down. There are only two companies involved in agriculture.
Also noted is the REDUCTION OF THE NUMBER OF EMPLOYEES in the Rosia
Montana commune in 2009 compared to 2008 by 82 employees (18%) with the most significant
laying off of personnel occurring in the mining industry and constructions. The activity sector
with the highest number of employees remains the industry with 189 employees (50%) followed
by trading, constructions and the other sectors. (Table II.2.2.).
In the context of the current crisis, over half of the businesses have LOSSES, the
profitability situation having deteriorated significantly in 2009 when 47 businesses record losses
at the end of the first semester compared to 26 businesses that still generate profit.
When talking about PROFIT we point out that the majority of the profit is generated by
professional activities (76.2%) followed by constructions (9.5%), transportation (5.2%), trading
(4.6%), etc. The companies involved in agriculture generate a small profit while the mining
industry generates losses because mining activities fail to start. (Table II.2.5.).
In terms of INDUSTRY within the territory of the commune there are 2 companies
involved in the extractive industry while in the processing industry the number of companies
went down to 5. The turnover in the extractive industry is extremely low due to the lack of
activity. Five companies laid off personnel in 2009 because the RMGC project failed to start and
due to the economic crisis. (Table II.6.1).
In AGRICULTURE, the structure by farm land use category shows a small percentage of
arable land (about 12%) with the majority of the land being used as pasture (47%) and hayfields.
The situation is typical for a mountain area and shows that the only farming activity that may be
carried out would be animal breeding which would make use of the pasture and hayfields.
(Table II.3.1).

11
In the Rosia Montana commune a very low efficiency of the area cultivated with corn
was recorded in 2009 which basically led to abandoning the respective culture. The potato
harvest also dropped to about 42% in 2009 compared to 2003 while the vegetable harvest
dropped by over a third (35%). The area cultivated with fodder crops was however extended to
240 hectares.
In the last years in the Rosia Montana commune the STOCK OF ANIMALS dropped for
all species. The stock of cattle dropped by 335 heads, of pigs by 110 heads and of sheep by 80
heads. The stock of poultry stock also dropped by 1500 heads. Compared to the number of
households in the impact area, the number of animals is modest. The people of the commune
generally raise one cow, 1-2 pigs and about 10 poultry. This stock is generally characteristic to
subsistence farming and can only be considered an additional source of income. (Table II.4.1).
In the forestry sector, the developed forest area under administration by the forest district
covers about 480 ha which represents about 31% of the total forest area. Over 60% of the forest
area is state owned, 22% belongs to communal forest, 11% is privately owned by natural persons
and 101 ha by legal persons. The small size of the forest area compared to the number of
households indicates that the forest cannot be a source of income for the people of Rosia
Montana.
In the Rosia Montana commune, the TOURISM is poorly represented in terms of
infrastructure. Although the natural and man-made tourist attractions are relatively numerous,
there are only 2 pensions and 9 other types of tourist accommodation that can offer about 72
places.
We see in table II.8.1 that the SERVICES in the Rosia Montana commune are represented
by the majority of the sectors with the highest turnover in 2008 having been generated by
professional activities (51.1%) followed by trading and transportation.
An important finding is related to the fact that the NUMBER OF NATURAL PERSONS
from the Rosia Montana commune certified to conduct trading activities is in fact 5 times higher
than that of the natural persons certified for liberal activities, which is normal given the current
development of the commune.

12
In relation to the general socio-economic context in the rural area2, the Rosia Montana
commune belongs to the trend specific to the Romanian village of today in terms of the
following dimensions:
• reduction of farming activities ( the produce is way below the potential for the main
crops) and industry and orientation towards services;
• drop in the animal stock;
• tourist activities poorly represented in terms of infrastructure;
• high proportion of pasture and hayfields in relation to the agricultural area;
• contribution to GDP for the various activity sectors remains low because of the unused
resources;
• the urban infrastructure is represented by the drinking water supply system.
2 The Diagnosis of the rural area - year 2000, document prepared for the Payment Agency for Rural Development and Fishing and the National Program for Rural Development 2007 – 2013, version consolidated December 2009, working document of the Ministry of Agriculture and Rural Development were taken into consideration.

13
SECTION III. QUALITY OF LIFE
THE MAIN SOURCE OF INCOME for the population investigated in Rosia Montana
commune is the pension, with an average value of lei 499.1 and representing 54.3% of the total
(average) incomes obtained / household. The second source of income, as average value, are the
salaries with 33.9% of the total incomes from salaries, with average value of lei 312.5. The next
sources of income, in order of importance, are the unemployment benefit - 5.8% of the total
incomes and average value of lei 53.8 and welfare benefits – 3% of the total incomes and
average value of lei 28.4. In terms of agricultural activities, they have a very low percentage in
the total incomes, i.e. only 9%. The low percentage is also due to the fact that this category of
incomes is much more difficult to estimate by the people interviewed as for the majority of them
it does not constitute direct income convertible in money. (Table III.1.1.).
THE RELATION BETWEEN INCOMES AND NEEDS involves a subjective estimation
of the incomes subject to needs. The highest percentage of the investigated population (40.6%)
believes that the incomes only cover the very basic needs. 32.5% believe that the incomes don’t
even cover the very basic needs while 18.1% believe their income to be enough for a decent life
without affording more expensive things.
In terms of the expenses incurred in the investigated households, the highest proportion in
the total expenses are the food expenses - 51.4%, with an average value of lei 468.2. Next in
terms of importance are the non-food goods with a percentage of 15.1% and average value of lei
138.2. (Table III.1.3).
Along the SUBJECTIVE POVERTY AXIS, we find the majority of the investigated
population, i.e. 90%, in the first half of the interval. As expected, both for methodological as
well as theoretical reasons, the modal value which comes up to 26.2% is the central point of the
axis followed by a sudden drop which continues to the end of the axis. I the first half of the
interval, the population is distributed almost equally noting a slight decreasing trend down to
15.2% at the left end of the interval.
In terms of HOUSEHOLD APPLIANCES, we note that 81.5% of the total population
investigated owns a TV set, 68.8% refrigerator, 57.3 % telephone and 48.7% washing machine.

14
35.0% own a radio set and 30% a car. A slightly lower percentage is noted where computers are
concerned with 24.8% of the investigated households owning a computer.
In terms of the ESTIMATED INCOME / HOUSEHOLD, the categories that concentrate
the highest percentage of the investigated population belong to the lei 300 - 1200 range, noting a
smaller distribution, however relatively equal, towards the ends of the axis. The modal range is
lei 300 – 600 concentrating 20%, followed by the lei 600 – 900 range which includes 14.2% of
the total population investigated and lei 900 – 1200 range which includes 11.8%. The
percentages drop moderately towards the ends of the axis where we find 4.2% of the population
in the lei 0 – 100 range and 4.3% in the above lei 2400 range.
Within the investigated population, THE NUMBER OF HOUSEHOLDS THAT LIVE
ON AN INCOME SMALLER THAN 1 USD/DAY per total household members is 35, related to
the total number of households included in the investigation, amounting to 4.2%. The number of
families that live on an income smaller than 2 USD/day of the total members is 98, that is 11.8%
of the total households included in the investigation.
THE SOCIAL ISOLATION is analyzed taking into consideration the average distances
to the main institutions, the investigated population evaluating the distance to the main
institutions. The longest distances, i.e. 6 and 5.7 km, respectively relate to the institutions
located in the center of the commune, namely the Town Hall and Police Department. In terms of
the medical clinic, school, police, post office, church or grocery store we note fairly similar
average distances and relatively small too, which indicates a relatively easy access of the
population to the main institutions in terms of distance.
In terms of the concerns specific to the population investigated in Rosia Montana, we
found that they mainly focus on economic matters, with 54% of the people being concerned
about tax increases, 59% about poverty and 68% about price increases.
Although the concern about pollution is not as high as that about economic issues, the
pollution issue still raises the interest of the investigated population, noting a distribution
towards the poles of the axis, i.e. 31.3% state that they fear it "little” or “very little” while 44%
state they fear it “a lot" or “extremely much”. We find a similar distribution in the case of the
unemployment concern with 33.7% fearing unemployment “very much” while 32.9% state they
fear it “very little”. The explanation in this case is given by the age structure of the investigated
population.

15
In terms of the quality of housing, we have to first point out that 91.9% of the investigated
population live in a family-owned house while 5.1% live in rented accommodation. The
category “others” which covers 2.6% of the total investigated population includes the people
who live in houses owned by RMGC without paying rent.
The majority of the dwellings owned by the investigated households, i.e. 59.6%, are built
of materials such as wood / timber while 29% are built of stonework and bricks and only 13% of
reinforced concrete and concrete prefabs. In terms of the location of the toilet, 34.2% of the
investigated households have it inside the house, 35.6 outside the house while 29.8% don’t have
a toilet. The kitchen is located inside the house for 65% of the households, outside the
household for 16.5% while 17.8% state they don’t have a kitchen.

16
SECTION IV. CULTURE AND ART, ASSOCIATIVE LIFE
AND COMMUNITY PARTICIPATION
In terms of CULTURE we note an increase in the museum activity in the commune and a
predominance of traditional activities, especially of religious nature within the community life.
The civic spirit, manifested through the reaction to the activity of the local institutions (claims
and grievances) has a high level compared to that in the Romanian rural communities. A large
number of non-lucrative organizations, requiring a separate analysis, is also present in the
commune.
SECTION V. ROSIA MONTANA – THE REFLECTION OF SUSTAI NABLE
DEVELOPMENT IN THE WRITTEN PRESS
The section dedicated to the REFLECTION OF SUSTAINABLE DEVELOPMENT IN
THE WRITTEN PRESS is in fact a proposal to monitor this phenomenon, identified as so far
having two fundamental dimensions focused on the reactions to the RMGC Project. 1) attitudes
favorable to the RMGC project and 2) attitudes of the opponents. (Please see the Semantic
Network V.1 and V.2)

17
TABLE OF CONTENTS
I.1 POPULATION ..................................................................................................................................................... 20 Table I.1.1. Distribution of investigated population by villages* ........................................................................... 20 GRAPH I.1.1. Distribution of households subject to the number of persons* ........................................................ 21 Graph I.1.2. Distribution of households subject to the age of the head of family* ................................................. 22 Graph I.1.3. Structure by age of the households formed of one single person* ...................................................... 23 Graph I.1.4. Structure by age of the households formed of Rroma people* ........................................................... 24 Graph I.1.5 Structure by gender of the population investigated in Rosia Montana commune* .............................. 25 Graph I.1.6 Age Pyramid* ...................................................................................................................................... 25 Table I.1.2 Distribution of population subject to religious affiliation* ................................................................... 26 Table I.1.3 Distribution of population subject to ethnic background* .................................................................... 26
I.2. WORKFORCE, OCCUPATION AND UNEMPLOYMENT ....... .................................................................. 28 Graph I.2.1 Percentage of occupied population within the investigated population* ............................................. 28 Table I.2.1. Distribution of occupied population by villages* ................................................................................ 29 Table I.2.2. Distribution of occupied population by gender* .................................................................................. 30
I.3. EDUCATION ...................................................................................................................................................... 33 Graph I.3.1 Education level of investigated population* ........................................................................................ 33 Graph I.3.2 Education level of investigated population subject to gender* ............................................................ 34 Graph I.3.3 Education level of investigated Rroma population* ............................................................................ 35
I.4. HEALTH STATUS ........................................................................................................... 37 Graph I.4.1. Subjective perception on health status* .............................................................................................. 37
SECTION II. URBAN INFRASTRUCTURE AND ECONOMY ...... ................................... 41
II.1. HOUSING, PUBLIC UTILITIES ................... ................................................................................................. 41 Table II.1.1. Evolution of the Housing Fund 2000 -2008 – Rosia Montana Commune .......................................... 41 Graph II.1.1. Evolution of the Housing Fund 2000 -2008 – Rosia Montana Commune ......................................... 41 Table II.1.2 Living area by ownership type – Rosia Montana commune ............................................................... 42 Graph II.1.2 Living area by ownership type – Rosia Montana commune ............................................................... 42 Table II.1.3. Drinking water system – Rosia Montana............................................................................................ 43 Graph II.1.3. Drinking water system – Rosia Montana commune .......................................................................... 44 Table II.1.4. Housing Construction – Rosia Montana Commune ........................................................................... 44 Table II.1.5. Construction Permit – Rosia Montana Commune .............................................................................. 45
II.2. ECONOMY – GENERAL ................................................................................................................................ 45 Table II.2.1. Structure of businesses by non-industrial sectors ............................................................................... 45 Rosia Montana Commune ....................................................................................................................................... 45 Graph II.2.1. Structure of businesses by non-industrial sectors – Rosia Montana Commune ................................ 46 Graph II.2.2. Number of employees - Rosia Montana Commune ........................................................................... 47 Table II.2.3. Company’s personnel expenses – Rosia Montana Commune ............................................................ 47 Graph II.2.3. Company’s personnel expenses – Rosia Montana Commune ........................................................... 48 Table II.2.4. Businesses Profit şi pierderi – Comuna Roşia Montana .................................................................... 49 Graph II.2.4. Businesses Profit and loss - Rosia Montana Commune .................................................................... 49 Table II.2.5. Profit by activity sector (lei) – Rosia Montana Commune ................................................................. 49 Graph II.2.5. Profit by activity sector (lei) – Rosia Montana Commune ................................................................ 50

Table II.2.6. Local GDP by activity sector – Rosia Montana Commune ................................................................ 51 Graph II.2.6. Local GDP by activity sector – Rosia Montana Commune ............................................................... 51 Table II.2.7. Businesses by ownership type – Rosia Montana Commune .............................................................. 52 Table II.2.7. Businesses by ownership type – Rosia Montana Commune .............................................................. 52
II.3. ECONOMY - AGRICULTURE ...................................................................................................................... 53 Table II.2.7. Agricultural area by use – Rosia Montana Commune ........................................................................ 53 Graph II.3.1. Agricultural area by use – Rosia Montana Commune ....................................................................... 53 Table II.3.2. – Agricultural production - Rosia Montana Commune ..................................................................... 54
II.4. ECONOMY – ANIMAL BREEDING ................... .......................................................................................... 55 Table II.4.1. Stock of animals – Rosia Montana Commune ................................................................................... 55 Graph II.4.1. Stock of animals – Rosia Montana Commune ................................................................................... 55 Table II.4.2. – Animal production - Rosia Montana Commune ............................................................................. 56 Graph II.4.2. – Animal production - Rosia Montana Commune ............................................................................ 56
II.5. ECONOMY - FORESTRY ............................................................................................................................... 57 Table II.5.1. – Development units - Rosia Montana Commune ............................................................................. 57 Table II.5.2. Structure of forest area by ownership type – Rosia Montana commune ........................................... 57 Graph II.5.2. Structure of forest area by ownership type – Rosia Montana commune .......................................... 58 Table II.6.1 – Industry - General Comuna Roşia Montana ..................................................................................... 59 Graph II.6.1. Turnover of industrial businesses – Rosia Montana Commune ........................................................ 59
II.7. ECONOMY - INDUSTRY............................................................................................................................... 60 Table II.7.1. Tourism – Main Indicators - Rosia Montana Commune .................................................................... 60
II.8. ECONOMY - SERVICES ................................................................................................................................ 61 Table II.8.1 – Services - General Rosia Montana Commune .................................................................................. 61 Graph II.8.1. Structure of services - Rosia Montana Commune ............................................................................. 61
II.9. ECONOMY – OTHER TYPE OF ACTIVITIES .......... ................................................................................. 62 Table II.9.1. Other type of activities – Rosia Montana Commune .......................................................................... 62 Graph II.9.1. Other type of activities 2009 – Rosia Montana Commune ................................................................ 62
AUTHORS: PHD MIHAI PASCARU LUCIA ISPAS-PASCARU, SO C. SIMINA MOLDOVAN, PHD TEODORA CAPOT Ă .......................................................................... 63
Table III.1.1. Structure of incomes – Investigated population ................................................................................ 63 Graph III.1.1. Structure of incomes – Investigated population ............................................................................... 64 Table III.1.2. Subjective Standard of Living (SSL) – Investigated population ....................................................... 64 Table III.1.3. Level and structure of cash expenses (average) – Investigated population ....................................... 65 Graph III.1.3. Level and structure of cash expenses (average) – Investigated population ...................................... 66 Graph III.2.1 Self-labeling as poor or rich .............................................................................................................. 67
III.3. HOME APPLIANCES IN HOUSEHOLDS .............. .................................................................................... 68 Table III.3.1. Home appliances in households – Investigated population ............................................................... 68 Graph III.3.1. Home appliances in households – Investigated population .............................................................. 68
III.4. ESTIMATION OF INCOMES, POVERTY AND EXTREME POVERTY SOCIALLY ASSISTED FAMILIES ................................................................................................................................................................. 69
Table III.4.1. Estimated incomes– Investigated population .................................................................................... 69 Graph III.4.1. Estimated incomes– Investigated population ................................................................................... 69

Table III.4.2. Poverty and extreme poverty within the investigated households Number of socially assisted families in Rosia Montana commune ...................................................................................................................... 70
III.5. ACCESS TO INSTITUTIONS AND BASIC SERVICES . .......................................................................... 71 Table III.5.1. Average distances – Investigated population .................................................................................... 71
III.6. CONCERNS ..................................................................................................................................................... 72 Table III.6.1. Concerns of the investigated population ........................................................................................... 72 Graph III.6.1. Concerns of the investigated population .......................................................................................... 73
III. 7. QUALITY OF HOUSING ............................................................................................................................. 74 Table III.7.1. Status of housing of investigated population .................................................................................... 74 Graph III.7.1. Status of housing of investigated population .................................................................................... 74 Table III.7.2. Construction material of the building – Investigated population ...................................................... 75 Graph III.7.2. Construction material of the building – Investigated population ..................................................... 75 Table III.7.3. Location of water closet (WC) – Investigated population ................................................................. 76 Graph III.7.3. Location of water closet (WC) – Investigated population ................................................................ 76 Table III.7.4. Location of kitchen – Investigated population .................................................................................. 78 Graph III.7.4. Location of kitchen – Investigated population ................................................................................. 78
AND COMMUNITY PARTICIPATION IN ROSIA MONTANA COMMUN E. ................ 82 Table IV.1. Culture and art - Rosia Montana Commune ........................................................................................ 82 Graph IV.1. Culture and art - Rosia Montana Commune........................................................................................ 82 Table IV.2. Associative life and community participation in Rosia Montana commune. ....................................... 83
GLOSSARY ............................................................................................................................ 84
SECTION V. ROSIA MONTANA – THE REFLECTION OF SUSTAI NABLE DEVELOPMENT IN THE WRITTEN PRESS .................................................................... 86
Semantic network V.1. ““ RReessppoonnssiibbllee mmiinniinngg aanndd ssuussttaaiinnaabbllee ddeevveellooppmmeenntt”” –– aarr gguummeennttss ooff tthhee ssuuppppoorr tteerr ss ooff RRMM GGCC PPrr oojj eecctt ........................................................................................................................................................... 86
Semantic network V.2. AArr gguummeennttss aaggaaiinnsstt RRMM GGCC PPrr oojj eecctt .................................................................................. 87

20
SECTION I. SOCIO-DEMOGRAPHIC ASPECTS
Authors: PhD Adrian Dinu Rachieru, PhD Dalia Petcu, PhD Vasile Gherheş
PhD Ciprian Obrad, PhD
Sorin Suciu
I.1 POPULATION Processing of the data of the sociologic survey by households produced a series of
information that was included in the database set up on this occasion. From an
administrative standpoint, Rosia Montana commune includes 16 villages, the investigated
population amounting to 2589 persons. The distribution of population by villages is shown
in the table below:
Table I.1.1. Distribution of investigated population by villages*
DISTRIBUTION OF POPULATION BY VILLAGES Frequency % Bălmoşeşti 45 1.7 Blideşti 26 1.0 Cărpini ş 410 15.8 Coasta Henţii 99 3.8 Corna** 150 5.8 Curături 156 6.0 Dăroaia 518 20.0 Garda Bărbuleşti 86 3.3 Gura Roşiei 102 3.9 Iacobeşti 45 1.7 Ignăteşti 75 2.9 Roşia Montana 582 22.5 Şoal 79 3.1 Ţarina 90 3.5 Vârtop 126 4.9 Total 2589 100.0 *Data Source: 2009 Diagnosis Study (investigated population: 2589 persons) ** The people of Bunta were included in Corna
•••• DISTRIBUTION OF INVESTIGATED POPULATION BY VILLAGES
As indicated by Table I.1.1. the distribution of the population by villages is uneven, with
villages that have a small number of people, i.e. less than 50 people, such as Bunta, Balmosesti,
Blidesti, Iacobesti, or less than 100 people such as Coasta Hentii, Ignatesti, Soal, Tarina.
21
Conversely, there are villages that have over 500 people such as Rosia Montana and Daroaia.
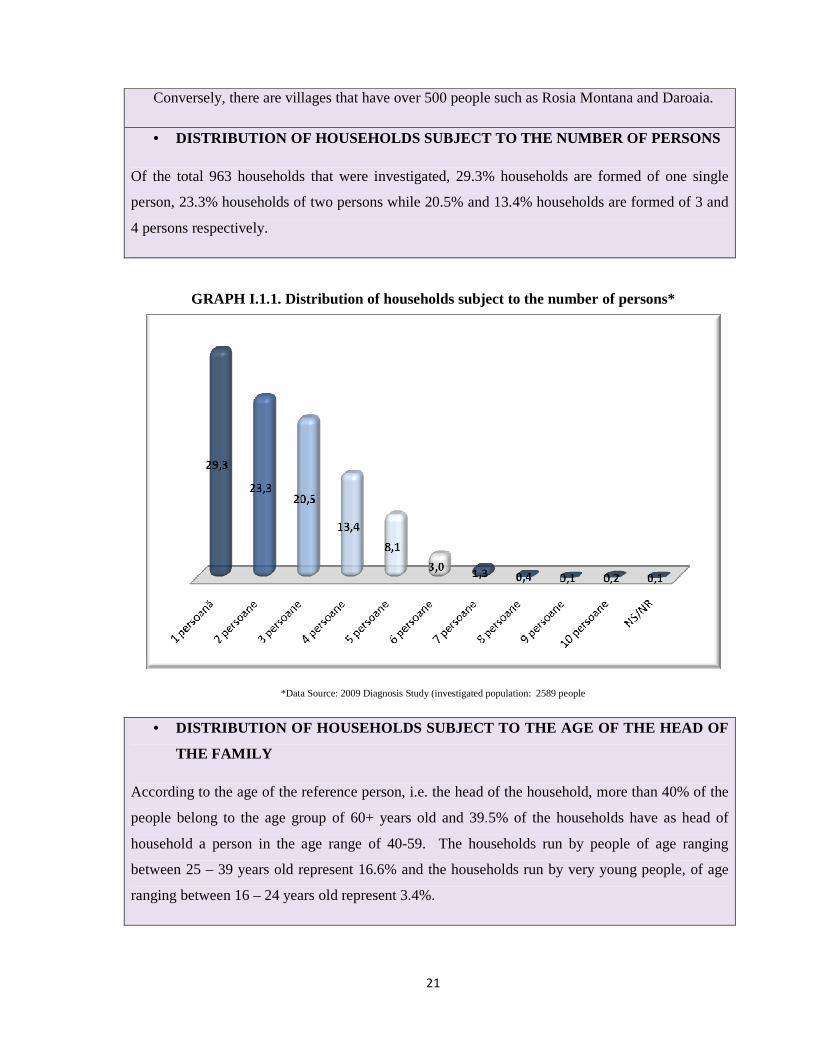
• DISTRIBUTION OF HOUSEHOLDS SUBJECT TO THE NUMBER OF PERSONS
Of the total 963 households that were investigated, 29.3% households are formed of one single
person, 23.3% households of two persons while 20.5% and 13.4% households are formed of 3 and
4 persons respectively.
GRAPH I.1.1. Distribution of households subject to the number of persons*
*Data Source: 2009 Diagnosis Study (investigated population: 2589 people
• DISTRIBUTION OF HOUSEHOLDS SUBJECT TO THE AGE OF TH E HEAD OF
THE FAMILY
According to the age of the reference person, i.e. the head of the household, more than 40% of the
people belong to the age group of 60+ years old and 39.5% of the households have as head of
household a person in the age range of 40-59. The households run by people of age ranging
between 25 – 39 years old represent 16.6% and the households run by very young people, of age
ranging between 16 – 24 years old represent 3.4%.

22
Graph I.1.2. Distribution of households subject to the age of the head of family*
*Data Source: 2009 Diagnosis Study (investigated population: 2589 people)
• HOUSEHOLDS RUN BY A SINGLE SENIOR PERSON
Of the total of 282 households run by a single person, 134 are formed of one person over 65
years old, which represents 47.5% of the total households of this type.

23
Graph I.1.3. Structure by age of the households formed of one single person*
*Data Source: 2009 Diagnosis Study (investigated population: 2589 people)
• HOUSEHOLDS WITH RROMA PEOPLE
There are 149 households in Rosia Montana commune of whose head has declared himself
/ herself to be Rroma. These households include 435 people of which 429 declared
themselves to be Rroma. The number of people of ages ranging between 0 – 17 years old is
151 which represents 35.19% of the total Rroma people.
Please note that more than half of the Rroma people are less than 25 years old. By age
category, the Rroma minors are distributed as follows: 31.87% are between 0 – 6 years old,
30.46% between 7 – 11 years old, 31.19% between 12 – 15 years old and 16.55% between
16 - 18 years old.

24
Graph I.1.4. Structure by age of the households formed of Rroma people*
*Data Source: 2009 Diagnosis Study (investigated population: 2589 people)
• NATURAL MOVEMENT OF POPULATION:
o Live births: 31 o Demises 32
31 children were born during 1 January - 1 November 2009 while 32 people passed away during the same period of time, which gives a natural growth of -1.
• MARITAL STATUS
The distribution of the population according to the marital status indicates that the highest
percentage includes married people, i.e. 44.9% followed by 18.3% single people. There is also a
10.4% of the total population who are widowed as well as 3.9% who are in a de facto relationship.
The percentage of divorced people is 3.4%.
In 2009 in the Rosia Montana commune there were 15 marriages registered and no divorces.
• GENDER STRUCTURE OF POPULATION
The gender structure of the population in the households indicates a larger percentage of women
(51.1%) than men (48.9%)

25
Graph I.1.5 Structure by gender of the population investigated in Rosia Montana
commune*
men 48.9women 51.1
*Data Source: 2009 Diagnosis Study (investigated population: 2589 people)
• DISTRIBUTION OF INVESTIGATED POPULATION BY AGE GROU P
The distribution of population by age group indicates that the population aging is present in
Rosia Montana commune as well. Thus, the 0 -14 years age group includes 15.1% of the
members of Rosia Montana. People who are between 15 – 64 years old represent 69.1% while
the senior people of above 65 years old represent 15.6%.
Graph I.1.6 Age Pyramid*
-120 0 120
75 ani si peste
70-74 ani
65-69 ani
60-64 ani
55-59 ani
50-54 ani
45-49 ani
40-44 ani
35-39 ani
30-34 ani
25-29 ani
20-24 ani
15-19 ani
10-14 ani
5-9 ani
0-4 aniGRUPA DE VÂRSTA
FEMININ
MASCULIN

26
*Data Source: 2009 Diagnosis Study (investigated population: 2589 people)
• RELIGION
In terms of religious affiliation, the majority of the population of Rosia Montana commune is
Orthodox (89.8% ).
Table I.1.2 Distribution of population subject to religious affiliation*
DISTRIBUTION OF INVESTIGATED POPULATION SUBJECT TO RELIGIOUS AFFILIATION
Frequency %
Orthodox 2325 89.8 Roman - Catholic 36 1.4 Greek - Catholic 23 .9 Protestant 10 .4 Others 134 5.2
DK/NR (Don’t know/No response) 61 2.4 Total 2589 100.0
*Data Source: 2009 Diagnosis Study (investigated population: 2589 people)
• ETHNIC BACKGROUND
In terms of ethnic background, 82.6% state they are Romanians and 16.5% Rroma. The Rroma
population is concentrated in Daroaia village where they represent 80% of the population of this
village.
Table I.1.3 Distribution of population subject to ethnic background*
DISTRIBUTION OF POPULATION SUBJECT TO ETHNIC BACKGROUND
Frequency %
Romanian 2139 82.6 Rroma 429 16.5 Hungarian 5 0.2 Undeclared 16 0.7
Total 2589 100.0
*Data Source: 2009 Diagnosis Study (investigated population: 2589 people)

27
Of the total population of Rosia Montana commune, less than 3% is either out of country or
somewhere else within the country. The main reasons for being out of town are looking for /
finding a job or completing education.

28
I.2. WORKFORCE, OCCUPATION AND UNEMPLOYMENT
• ACTIVE POPULATION
According to INSSE’s definition, the active population characterizes the “available
potential workforce and the occupation rate of the population that includes the civil employed and
registered unemployed persons". According to the data gathered, in Rosia Montana commune the
active population amounts to 30.4% consisting of 24.6% employed population and 5.8% registered
unemployed population.
• PROFESSIONAL STATUS
In Rosia Montana commune the population structure by professional status defined as
status held by a person subject to how they earn their income through the activity carried out, is as
follows: employees 15.9%, private business owners 0.8%, self-employed 0.7%, family workers in
own homestead 7.2%
Graph I.2.1 Percentage of occupied population within the investigated population*
*Data Source: 2009 Diagnosis Study (investigated population: 2589 people)

29
Table I.2.1. Distribution of occupied population by villages*
*Data Source: 2009 Diagnosis Study (investigated population: 2589 people)
• DISTRIBUTION OF OCCUPIED POPULATION BY VILLAGES
In terms of professional status, the occupied population in Rosia Montana commune is concentrated as follows:
o Employee category: Rosia Montana village with 36.5% followed by Carpinis with 16.3%
and Daroaia with 9%. Conversely are the villages of Blidesti with 1.2%, Vartop and
Iacobesti with 1.9% each.
o Private business owner category: Rosia Montana village with 42.9% followed by Carpinis
with 14.3% and Coasta Hentuu with 14.3%. Conversely are the villages of Balmosesti,
Blidesti, Curaturi, Daroaia, Iacobesti, Ignatesti, Soal, Tarina, where there are no persons
recorded under this category.
o Self-employed category: Carpinis with 47.4% followed by Daroaia and Gura Rosiei with
15.8% each. Conversely are the villages of Balmosesti, Blidesti, Coasta Hentii, Corna,
Garda Barbulesti, Iacobesti, Ignatesti, Soal, Tarina, Vartop where there are no persons
recorded under this category.
o Family worker in own homestead category is represented as follows: Carpinis with 15%
followed by Vartop with 13.9% and Curaturi with 13.4%. Conversely are the villages of
Blidesti, Corna, Daroaia and Gura Rosiei with less than 2% each.
Please note that the occupied population is concentrated in the villages of Rosia Montana
STRUCTURE OF OCCUPIED POPULATION BY VILLAGES Professional status Village Employee Business owner,
private enterpriser Self-employed Family worker in
own household Others Total
Balmosesti 2.2% 2.7% 2.1% Blidesti 1.2% 1.1% 1.0% Carpinis 16.3% 14.3% 47.4% 15.0% 8.8% 16.4% Coasta Hentii 3.9% 14.3% 4.3% 2.9% 4.2% Corna 4.9% 9.5% 1.6% 23.5% 4.9% Curaturi 4.1% 10.5% 13.4% 2.9% 6.7% Daroaia 9.0% 15.8% 1.1% 6.2% Garda Barbulesti 3.4% 4.8% 10.7% 5.2% Gura Rosiei 5.4% 9.5% 15.8% 1.6% 2.9% 4.6% Iacobesti 1.9% 3.7% 2.2% Ignatesti 2.7% 5.9% 3.3% Rosia Montana 36.5% 42.9% 10.5% 9.1% 26.5% 27.8% Soal 2.7% 8.0% 3.9% Tarina 3.9% 8.0% 20.6% 5.7% Vartop 1.9% 4.8% 13.9% 11.8% 5.8% Total 100.0% 100.0% 100.0% 100.0% 100.0% 100.0%

30
and Carpinis.
• DISTRIBUTION OF OCCUPIED POPULATION BY GENDER
In terms of the distribution by gender, we find a relatively even distribution, i.e. 52.1% are
men and 47.9% women. There is an imbalance in terms of professional status, namely: the
categories private business owner and self-employed person include predominantly men, namely
71.4% and 78.9%, respectively, while the category family worker in own homestead includes
mainly women, i.e. 62.6%.
Table I.2.2. Distribution of occupied population by gender*
DISTRIBUTION OF OCCUPIED POPULATION BY GENDER
Professional Status Type
Employee
Private business
owner
Self-employed
person
Family worker in
own homestead
Others Total
Men 57.2% 71.4% 78.9% 37.4% 44.1% 52.1%
Women 42.8% 28.6% 21.1% 62.6% 55.9% 47.9%
Total 100.0% 100.0% 100.0% 100.0% 100.0% 100.0%
*Data Source: 2009 Diagnosis Study (investigated population: 2589 people)
POPULATION OF WORK AGE
• PROPORTION OF POPULATION OF WORK AGE
The population of work age (15 – 65 years old) of the Rosia Montana commune represents
69.1% of the total investigated population.
• STRUCTURE OF POPULATION OF WORK AGE
Please note that the peak of the occupational potential is concentrated in the range 45 – 49
years old, i.e. 12.1%; similar percentages are found in the range 35 – 39 years old and 20 – 24
years old, respectively, i.e. 11.4% each. Regarding the last age range please note that the Daroaia
village is a special situation where the young workforce potential (15 – 24 years) covers a quarter
of the population of the village (24.5%).
At the time when the data was gathered, the population that was carrying out remunerated

31
economic activity was 23.9% of the total population of work age with the highest percentages
encountered in Rosia Montana, i.e. 22.4% and Daroaia, i.e. 20.3%.
The distribution by gender indicates a male population proportion of 51.3% while in
terms of professional sectors we point out in decreasing order the following categories:
agriculture 8.1%, mining 3.9%, public administration 3.1%, constructions 2.8%, education 2.1%
and trading 2%.
The population of work age also includes 17.7% retired people as well as 11.7% students,
9.4% farmers, 7.3% unemployed people in search of a job and 7.2% housewives.
From the category of people of age between 15 – 65 years old, the employees amount to
22.9% and family workers in own homestead to 9.8%. Other categories were also identified: 1.1%
private business owners and 1.1% self-employed. In terms of the locality in which they carry out
activity, 18.7% work in the village in which they reside and 9.2% in another locality of the county.
Only 2.9% commute to another locality of the commune.
As additional comment, we note that 193 people declared they are financially supported by
another person, government or private organizations, which represents a cumulated 10.8% of the
total population of work age. Accordingly, an important category is the housewives which amount
to 7.2% of the total population of work age.
• CATEGORY OF UNEMPLOYED WITHIN THE POPULATION OF WOR K AGE (OF THE TOTAL INVESTIGATED POPULATION)
The unregistered unemployed category is 8.5% while there are only 21 graduates in search
for the first job, which amounts to 1.2% of the total population of work age. The proportion of
unemployed people in search of another job amounts to 7.3%. Within this sub-category, the
percentage of female population is 43.07% and of male population 56.93%. In the category of
unemployed in search of the first job, the distribution by genders indicates that men have the
highest percentage, i.e. 76.19%.
If we relate to the definition of the International Bureau of Labour according to which “the
lack of income generating activity and availability to start work are the main criteria to define the
unemployed person" and given that the population with work potential also includes the 15 – 16
years old youths who dropped out of school definitively, we may say that the unemployment rate

32
in Rosia Montana commune is much higher than the registered unemployment rate (unemployed
people listed in official records).
The age groups most exposed in terms of unemployment, for people who are in search for
another job have a balanced distribution of 19.2% for the age categories 35 – 39, 40 – 44 and 45 –
49 years old and 15.4%, respectively for people between 30 – 34 years old. What’s surprising is
that only 10% of the people in search for the first job belong to the age category 20 – 24 years old.
In terms of distribution by villages, Rosia Montana is leading with 17.7%, followed by
Carpinis with 16.9%, noting that we consider the respondents who are in search of another job. If
we analyze the situation of the people in search for their first job, we see that in Daroaia the
percentage is 42.9% and in Rosia Montana 33%.

33
I.3. EDUCATION
• DISTRIBUTION OF INVESTIGATED POPULATION SUBJECT TO EDUCATION
LEVEL
Education is one of the conditions required to ensure a higher standard of living. If we look
at the adult population in Rosia Montana commune, namely above 17 years old, we see that from
an educational standpoint the highest percentage includes 10 grades / occupational school
graduates. This category represents 25% of the population defined hereinabove. In terms of
proportion, the following categories include, in decreasing order, the 5-8 grade graduates, namely
23.2%, high-school graduates 20.4%, university graduates 10.6%. We note that a significant
percentage of the investigated population (i.e. 9.3%) has a low education level (1 - 4 grades) and
that there is also the category of people who never attended any type of formal schooling.
Graph I.3.1 Education level of investigated population*
*Data Source: 2009 Diagnosis Study (investigated population: 2589 people)
The review of this data indicates that there are differences subject to gender, as follows:
women are the majority in terms of primary and secondary education level. Thus, 65.2% for
category 1 - 4 grades and 62.5% for category 5 - 8 grades. The ratio changes for 10 grades or
occupational school level where 70.5% are men. The high school and post-graduate levels reflect a

34
balance between the two categories, as follows: high-school level - 46% men and 54% women and
post-graduate level - 53.6% men and 46.4% women. 60.6% of the persons who go for university
education are women.
The most significant difference between the two genders is noted at people who have no education
whatsoever, of whom 68.8% are women.
Graph I.3.2 Education level of investigated population subject to gender*
*Data Source: 2009 Diagnosis Study (investigated population: 2589 people)
• DISTRIBUTION OF INVESTIGATED POPULATION BY VILLAGES SUBJECT TO EDUCATION LEVEL
In terms of the distribution by the 16 villages belonging to the Rosia Montana commune, we make
the following notes regarding the education level:
- of the total people who, at the time of the sociologic survey by households, state
that they never attended school, the highest percentage is recorded in Daroaia
village - 46.9%, followed by Garda Barbulesti – 12.5% and Carpinis - 9.4%
- a low level of schooling is recorded in Daroaia where of the total people who stated
they attended primary school, there was a percentage of 30.8% identified, followed by
Rosia Montana with 11.6% and Vartop with 10.6%;

35
- 30.8% people finished secondary school in Daroaia, 17% in Rosia Montana and 12.2%
in Carpinis.
The villages with people who stated they had a higher education level, i.e. university
graduates are: Rosia Montana 43.8%, Carpinis 15.9% and Corna 8.8%.
• EDUCATION LEVEL OF INVESTIGATED RROMA POPULATION
The review of the data indicates that of the total Rroma adult population, 20.3% finished
primary school and 45.6% secondary school. A smaller percentage, i.e. 5%, finished high-
school and only 2.1% graduated university. We also note that 4.6% of the adult Rroma
population never attended school at all.
Graph I.3.3 Education level of investigated Rroma population*
*Data Source: 2009 Diagnosis Study (investigated population: 2589 people)
• PRIMARY AND SECONDARY EDUCATION UNITS: 1 school
• QUALIFIED TEACHERS: 29 people
• CLASSROOMS AND SCHOOL WORKSHOPS 26
• SCHOOL LABORATORIES: 1

36
• SPORTS GROUNDS: 1

37
I.4. HEALTH STATUS
• HEALTH STATUS OF POPULATION SUBJECTIVE DIMENSION
According to self-assessment, the health status of the interviewed subjects is considered to
be good by 37.7% of the respondents and satisfactory by 21% while at the opposite pole, the bad
and very bad state total 14.8% of the responses, namely 11.6% bad and 3% very bad health state,
respectively.
Graph I.4.1. Subjective perception on health status*
HEALTH STATUS OF INVESTIGATED POPULATION
We note that 61.2% of the interviewed subjects believe they don’t suffer from any
illnesses. Compared to 2008, the health status got worse for 16.3% of the respondents while for
63.5% it is stationary.
From the overall lot investigated in 2009, 17.2% of the respondents were unable to work for
health reasons, with the inactivity time being less than one year for 10.5% and covering one year
for 6.9% of the respondents. The number of days of medical leave of absence amount to 10 days

38
for 1.3% of the respondents, 30 days for 2.4% and 365 days for 6.4% of the respondents.
• HEALTH STATUS OF POPULATION. MEDICAL RECORDS
In terms of the pathological situation, according to the medical records and data provided,
the first place in this possible ranking by disease groups is occupied by high pressure blood cases
(234 subjects), followed by valvular and ischemic heart diseases (113 subjects), psychiatric
conditions (86 cases, the majority anxiety-depression syndromes), obstructive pulmonary
bronchitis (65 cases) associated with tuberculosis (10 subjects, treated cases).
Diseases for chronic patients above 40 years old include cases of high blood pressure, heart
diseases, silicosis, rheumatic polyarthritis. In terms of children, dental problems are prevailing.
The specialists incline to believe that there would be “a source” that facilitates the frequent
occurrence of gastritis and ulcer cases.
• PATHOLOGIC SITUATION
From the sociologic survey standpoint, the pathological situation indicates as peak the
rheumatic conditions with 16.3% followed by high blood pressure cases (11.1%) associated with
the heart conditions (another 11%), pulmonary conditions (4.5%), gastro-duodenal conditions
(4.3%), kidney conditions (3.7%), diabetes (2.1%), mental conditions (1.5%). We note that there
are obvious differences between the situation reflected in the official medical statistics and that
resulting from self-assessment. In terms of the latter, the rheumatic conditions prevail.
• DEMISES BY CAUSE OF DEATH MEDICAL RECORDS
During 2009 there were 32 demises recorded in Rosia Montana commune that had the following causes:
o 5 –ischemic heart disease and heart failure o 3 -severe high blood pressure o 10 – chronic obstructive lung disease o 2 – multiple traumas following an accident o 2 – cerebral – vascular ischemic disease. Type II diabetes o 1 – upper respiratory obstruction with fixed dental prosthesis that came loose o 3 – hanging o 1 – nutritional atresia o 1 - Stroke o 1 – heart attack o 1 – generalized metastasis o 1 – operated gastric neoplasm

39
o 1 – operated colon neoplasm
• Infant mortality rate: 1.1%
• Number of people with assisted disabilities: 35
• ACCESS TO HEALTHCARE
In terms of access to healthcare, 68.1% of the respondents will see the family doctor while
2.1% treat themselves at home (with medicines, herbal tea, quack remedies) and 1.7% ask for help
from friends, relatives, neighbors. Please note that for a health specialist examination the locals
have to travel to Abrud or Campeni and some specialties (diabetes, nutritional diseases,
dermatologic diseases or surgeries) can only be dealt with in Alba Iulia or Cluj.
We also point out that the health emergency phone call was made by 6% of the respondents
while 1% resort to private health practices and only 0.9% go to the pharmacy. Regrettably, there
are periods of time when there are no doctors in the commune, prevention is not common practice,
the respondents resorting to health services only when they are “bothered”. Moreover
transportation to ensure access, especially that distances are long within the community, is lacking.
There is no pharmacy in the commune so the sick people have to travel to Campeni or Abrud.
There are only two specialist doctors (a general practitioner and a dentist) and the total healthcare
personnel comprises of 3 people (a nurse in addition to the two doctors) such that in relation to the
total investigated population we may say that there is a ratio of 1 doctor to 1294 people. There are
two health clinics in operation, one at Rosia Montana with 15-20 patients per day and one at
Carpinis with 30 patients per day (mostly Rroma people). The opening hours of these clinics cover
5 days with 5 examination hours and 2 house call hours / day. The number of patients registered
with the clinic in Rosia Montana amounts to 1697 people of which 142 don’t have health
insurance.

40
• SPECIFICS OF PERFORMANCE OF MEDICAL SERVICES
There is a strong resistance to vaccination, especially from Rroma people (of approximately 30
cases/month on the average only 4 are resolved) and despite the addressability and actual diseases
the people in question do not follow the prescribed treatment. There are cases of contagious
diseases (syphilis, tuberculosis) that are ignored, very often people resort to traditional remedies
(especially for dermatologic conditions) and generally request cheaper medication. In conclusion,
the difficulties in performing medical services in rural areas are also found in the investigated
(poor) community, such that in lack of transportation the access to medical services is difficult.
Consequently, the average medical leaves of absence/year do not reach record numbers; they are
short, normally for acute diseases and do not exceed 50 cases.

41
SECTION II. URBAN INFRASTRUCTURE AND ECONOMY
Authors: PhD Vasile Burja, PhD Mihai Pascaru Ionela Gavrilă-Paven Simina Moldovan
II.1. HOUSING, PUBLIC UTILITIES
Table II.1.1. Evolution of the Housing Fund 2000 -2008 – Rosia Montana Commune Source: Alba Regional Statistics Department - Rosia Montana Commune Sheet 2000 - 2008
We see from the data in Table II.1.1. that the housing fund has a decreasing trend during 2000 – 2008 as it was reduced by 63 dwellings in the investigated period, which represents about 4%. With the exception of 11 dwellings, the vast majority (i.e. 1518) of the dwellings are privately owned. The reduction of the number of dwellings may be explained by the fact that some of these dwellings got badly damaged because they are no longer inhabited or because their destination was changed.
Graph II.1.1. Evolution of the Housing Fund 2000 -2008 – Rosia Montana
Commune

42
Table II.1.2 Living area by ownership type – Rosia Montana commune Source: Alba Regional Statistics Department - Rosia Montana Commune Sheet 2000 - 2008
Having reviewed the data in Table II.1.2 we see that the inhabitable area has decreased in Rosia Montana commune after 2001, mainly because of the private sector, where a significant reduction in the housing fund occurred, as described above. However, the living area / person is increasing continuously due to the reduction of the number of people that live in the area.
Graph II.1.2 Living area by ownership type – Rosia Montana commune
LIVING AREA 2000 2001 2002 2003 2004 2005 2006 2007 2008 Livable area – majority state owned - sqm
4439 373 373 373 373 373 373 373 373
Livable area – majority privately owned - sqm
45400 59015 59053 58940 57976 57233 57233 56365 56409
Living area / person 12.04 14.41 15.2 15.4 16.03 16.22 16.44 16.69 17.59 Living area - total sqm 49839 59388 59426 59313 58349 57606 57606 56738 56782

43
Table II.1.3. Drinking water system – Rosia Montana
Source: Alba Regional Statistics Department - Rosia Montana Commune Sheet 2000 - 2008
The data in Table II.1.3 indicates that the length of the drinking water supply pipelines within the commune has increased in 2005 by 6.7 km however the amount of drinking water supplied to the population went down in the same year by about 6 times, subsequently staying at about 83,000 m3, which represents 21% of the amount supplied in 2004. This is explained by the massive de-population of the locality and closure of the mining activity.
WATER 2000 2001 2002 2003 2004 2005 2006 2007 2008 Simple length of drinking water supply pipeline – km
21.1 21.1 21.1 21.1 21.1 27.8 27.8 27.8 27.8
Capacity of drinking water production facilities – m3/day
1036 518 1036 1036 1036 1036 1036 1036 1036
Drinking water amount supplied to users – total – thousand m3
378 189 378 378 378 63 83 83 83
Drinking water amount supplied to domestic users – – thousand m3
295 95 294 294 300 61 81 81 81

44
Graph II.1.3. Drinking water system – Rosia Montana commune
Table II.1.4. Housing Construction – Rosia Montana Commune
Source: Alba Regional Statistics Department - Rosia Montana Commune Sheet 2000 - 2008
HOUSING/CONSTRUCTIONS 2005 2006 2007 2008
Fully completed housing – No. 3 0 0 1
Dwelling completed on people’s financial resources – No. 3 0 0 1
Over the last three years there was only one dwelling built in the Rosia Montana commune, which shows the reduced prospects of the commune in terms of habitation and the lack of income required to invest in housing, the existence of the inhabitants depending on the economic development of the area.

45
Table II.1.5. Construction Permit – Rosia Montana Commune
Source: Alba Regional Statistics Department - Rosia Montana Commune Sheet 2000 - 2008
The conclusions from the previous table are also reflected by the construction permits issued for the Rosia Monana commune, the last permit having been issued in 2005.
II.2. ECONOMY – GENERAL Table II.2.1. Structure of businesses by non-industrial sectors
Rosia Montana Commune
ACTIVITY SECTOR 2008 2008* 2009 2009*
Agriculture, forestry, fishing 2 2 2 2 Constructions 9 7 10 4 Trading, car and motorbike repairs 2 19 26 17 Transportation and storage 19 13 18 13 Hotels and restaurants 3 2 5 4 Professional activities 5 4 5 3 Source: Alba Regional Statistics Department - Rosia Montana Commune Sheet 2000 – 2008, fiscally active
companies
CONSTRUCTION PERMITS 2005 2008 Construction permits issued for residential buildings (excl. for community)
0 0
Construction permits issued for other buildings – No. 1 0
Construction permits issued for residential buildings (excl. for community) - sqm
0 0
Construction permits issued for other buildings – sqm. 132 0

46
Graph II.2.1. Structure of businesses by non-industrial sectors – Rosia Montana Commune
Table II.2.2.
Number of employees - Rosia Montana Commune
NUMBER OF EMPLOYEES 2008 2009* Industry employees 237 189 Agriculture, forestry, fishing employees 5 4 Constructions employees 65 44 Whole and retail sale trade, car and motorbike repair employees 55 56 Transportation and storage employees 30 27 Hotel and restaurant employees 8 15 Professional activities 57 40 TOTAL 457 375 Source: Alba General Public Finance Divisions*, data valid as at 30 July 2009
The structure of the businesses by activity sectors (excluding industry) and their dynamics in 2009 compared to 2008 indicates that the majority of the businesses are involved in services, namely in trading, repairs and transport. The number of tax-paying businesses involved in constructions has gone down. În agricultură există doar doi agenţi economici.

47
We see from Table II.2.2. the reduction of the number of employees in the Rosia Montana commune in 2009 compared to 2008 by 82 employees (18%) with the most significant laying off of personnel occurring in the mining industry and constructions. The activity sector with the highest number of employees remains the industry with 189 employees (50%) followed by trading, constructions and the other sectors.
Graph II.2.2. Number of employees - Rosia Montana Commune
Table II.2.3. Company’s personnel expenses – Rosia Montana Commune

48
Source: Alba General Public Finance Divisions*, data valid as at 30 July 2009
Graph II.2.3. Company’s personnel expenses – Rosia Montana Commune
ACTIVITY SECTORS PERSONNEL EXPENSES 2008 2009*
Extractive industry 8794256 6257021
Processing industry 248875 190989
Agriculture, forestry, fishing 35420 23943
Constructions 757385 321134
Trading, car and motorbike repairs 464861 299361
Transportation and storage 170963 139946
Hoteluri şi restaurante 78508 76439
Activit ăţi profesionale 2858692 1193438 Total 13408960 2245250

49
Table II.2.4. Businesses Profit şi pierderi – Comuna Roşia Montana
Source: Alba General Public Finance Divisions*, data valid as at 30 July 2009
We see from Table II.2.4 that over half of the businesses have losses, the profitability situation having deteriorated significantly in 2009 when 47 businesses record losses at the end of the first semester compared to 26 businesses that still generate profit.
Graph II.2.4. Businesses Profit and loss - Rosia Montana Commune
Table II.2.5. Profit by activity sector (lei) – Rosia Montana Commune
BUSINESSES, PROFIT AND LOSS 2008 2009*
Profit 35 26
Loss 39 47

50
ACTIVITY SECTORS PROFIT/2008
TOTAL % Agriculture, forestry, fishing 12589 0,5 Extractive industry 0 0 Processing industry 92719 3,6 Constructions 246985 9,5 Trading, car and motorbike repairs 119944 4,6 Transportation and storage 135780 5,2 Hotels and restaurants 10417 0,4 Professional activities 1978942 76,2 Total 2597376 100 Source: Alba General Public Finance Divisions
Table II.2.5 indicates that the majority of the profit is generated by professional activities (76.2%) followed by constructions (9.5%), transportation (5.2%), trading (4.6%), etc. The companies involved in agriculture generate a small profit while the mining industry have losses because mining activities fail to start.
Graph II.2.5. Profit by activity sector (lei) – Rosia Montana Commune

51
Table II.2.6. Local GDP by activity sector – Rosia Montana Commune
ACTIVITY SECTORS GDP/2008 TOTAL %
Agriculture, forestry, fishing 48009 0.3 Extractive industry 8794256 54.9 Processing industry 341594 2.1 Constructions 1004370 6.2 Trading, car and motorbike repairs 584805 3.7 Transportation and storage 306743 1.9 Hotels and restaurants 88925 0.6 Professional activities 4837634 30.2 Total 16006336 100 Source: Alba General Public Finance Divisions
Table II.2.6 indicates that although the extractive industry does not mine the gold deposit it still has the most significant contribution to the local GDP (54.9%) due to salary expenses. The independent professional activities also have an important contribution to local GDP (30.2%).
Graph II.2.6. Local GDP by activity sector – Rosia Montana Commune

52
Table II.2.7. Businesses by ownership type – Rosia Montana Commune
BUSINESSES BY OWNERSHIP TYPE 2008 2009 State 1 1 Mixed 1 1 Private 72 71 Cooperative 0 0 Source: Alba General Public Finance Divisions
The majority of the businesses (i.e. 72) are private, 1 business (RMGC) is with mixed capital and 1 business is state-owned.
Table II.2.7. Businesses by ownership type – Rosia Montana Commune

53
II.3. ECONOMY - AGRICULTURE
Table II.2.7. Agricultural area by use – Rosia Montana Commune Source: Alba Regional Statistics Department - Rosia Montana Commune Sheet 2000 - 2008
The structure by farm land use category shows a small percentage of arable land (about
12%) with the majority of the land being used as pasture (47%) and hayfields. The situation is
typical for a mountain area and shows that the only farming activity that may be carried out
would be animal breeding which would make use of the pasture and hayfields.
Graph II.3.1. Agricultural area by use – Rosia Montana Commune
AGRICULTURE 2000 2001 2002 2003 2004 2005 2006 2007 2008 Arable area - ha 280 280 280 280 280 280 280 280 280 Pasture area - ha 1088 1088 1088 1088 1088 1088 1088 1088 1088 Hayfield area - ha 938 938 938 937 937 937 937 937 937 Total agricultural area - ha
2306 2306 2306 2305 2305 2305 2305 2305 2305

54
Table II.3.2. – Agricultural production - Rosia Montana Commune
Source: *Alba Regional Statistics Department - Rosia Montana Commune Sheet 2000 - 2008 **Rosia Montana Town Hall, as at 1 Nov 2009
Table II.3.2. indicates that the efficiency of the area cultivated with corn was very low in 2003, which basically led to abandoning this crop. The potato harvest also dropped to about 42% in 2009 compared to 2003 while the vegetable harvest dropped by over a third (35%). The area cultivated with fodder crops was however extended to 240 hectares.
PRODUCÞIA AGRICOLÃ 2003* 2009**
Area cultivated with corn - ha 5 -
Total corn production - tons 7 -
Area cultivated with potatoes - ha 185 -
Total potato production - tons 2600 1100
Area cultivated with vegetables - ha 20 -
Total vegetable production - tons 93 60
Total fruit production - tons 132 -
Fodder plant production - tons - 240

55
II.4. ECONOMY – ANIMAL BREEDING
Table II.4.1. Stock of animals – Rosia Montana Commune
STOCK OF ANIMALS 2003 2009
Cattle – total – at the end of year - heads 1249 914
Pigs – total – at the end of year - heads 281 171
Sheep – total – at the end of year - heads 250 170
Poultry – total – at the end of year - heads 6700 5200
Source: *Alba Regional Statistics Department - Rosia Montana Commune Sheet 2000 – 2008 (at the end of 2003) **Rosia Montana Town Hall, as at 1 Nov 2009
The stock of animals, according to Table II.4.1. dropped for all species. The stock of cattle dropped by 335 heads, of pigs by 110 heads and of sheep by 80 heads. The stock of poultry also dropped by 1500 heads. Compared to the number of households in the impact area, the number of animals is modest. The people of the commune generally raise one cow, 1-2 pigs and about 10 poultry. This stock is generally characteristic to subsistence farming and can only be considered an additional source of income.
Graph II.4.1. Stock of animals – Rosia Montana Commune

56
Table II.4.2. – Animal production - Rosia Montana Commune
Source: *Alba Regional Statistics Department - Rosia Montana Commune Sheet 2000 – 2008 (at the end of 2003) **Rosia Montana Town Hall, as at 1 Nov 2009
As a result of the drop in the stock of animals and poultry it is normal to have a corresponding drop of the animal production. We note that the drop in the milk production is far smaller than the drop in the cattle stock which indicates changes in its structure and increase of the milk production per cow.
Graph II.4.2. – Animal production - Rosia Montana Commune
ANIMAL PRODUCTION 2003* 2009**
Meat production – total - tons 180 84
Cow milk production – total hl 16799 16000
Wool production - kg 600 400
Egg production – thousand pcs 525 495

57
II.5. ECONOMY - FORESTRY
Table II.5.1. – Development units - Rosia Montana Commune
FORESTRY 2009
Development units (area of developed forest according to the relevant Romanian laws) under administration by a Forest District
61 development units
480 ha
Source: Rosia Montana Town Hall, as at 1 Nov 2009
In the forestry sector, the developed forest area under administration by the forest district covers about 480 ha which represents about 31% of the total forest area.
Table II.5.2. Structure of forest area by ownership type – Rosia Montana
commune
FOREST AREA 2009 State-owned (ha) 930
Owned by commune (ha) 338
Owned by legal persons (ha) 101
Owned by natural persons (ha) 174
TOTAL 1543 Source: Rosia Montana Town Hall, as at 1 Nov 2009
From II.5.2 and graph we see that over 60% of the forest area is state owned, 22% belongs to communal forest, 11% is privately owned by natural persons and 101 ha by legal persons. The small size of the forest area compared to the number of households indicates that the forest cannot be a source of income for the people of Rosia Montana.

58
Graph II.5.2. Structure of forest area by ownership type – Rosia Montana
commune

59
II.6. ECONOMY - INDUSTRY
Table II.6.1 – Industry - General Comuna Roşia Montana
Source: *Alba Regional Statistics Department - Rosia Montana Commune Sheet 2000 – 2008; **Source: DGFP Alba, as at 30 July 2009.
Table II.6.1 indicates that in terms of INDUSTRY within the territory of the Rosia Montana commune there are 2 companies involved in the extractive industry while in the processing industry the number of companies went down to 5. The turnover in the extractive industry is extremely low due to the lack of activity. Five companies laid off personnel in 2009 because the RMGC project failed to start and due to the economic crisis.
Graph II.6.1. Turnover of industrial businesses – Rosia Montana Commune
INDUSTRY 2008* 2009**
Total business by industrial sectors & sub-sectors
Extractive industry 2 2 Processing industry 7 5
Turnover of industrial businesses Extractive industry 315328 67004 Processing industry 1501419 516445
Number of industrial business which declared profit / losses / bankruptcy in first part of 2009
Profit 4 4 Loss 5 3 Bankruptcy 0 0
Number of industrial business that laid off personnel - 5

60
II.7. ECONOMY - INDUSTRY
Table II.7.1. Tourism – Main Indicators - Rosia Montana Commune
TOURISM
2009
Accommodation units - (total) number 11 Number of hotels 0 Number of pensions 2* Number of certified guesthouses - Number of other accommodation units 9* Number of accommodation places 72* Annual average occupation rate - Number of restaurants, coffee shops, bars 6 Number of tourist attractions - total 10 Number of tourist attractions and routes logged into tourist circuit 1 Number of natural tourist attractions - total 2 Number of man-made tourist attractions - total 7 *http://www.drumulaurului.ro/RO/rosia_montana_cazare.htm, accessed on 1.11.2009. http://www.sate-comune.ro/comuna_Rosia-Montana.htm#16, accessed on 1.11.2009.
In the Rosia Montana commune, tourism is poorly represented from the infrastructure standpoint. Although the natural and man-made tourist attractions are relatively numerous, there are only 2 pensions and 9 other types of tourist accommodation that can offer about 72 places.

61
II.8. ECONOMY - SERVICES
Table II.8.1 – Services - General Rosia Montana Commune Source: Alba General Public Finance Divisions*, data valid as at 30 July 2009
We see in table II.8.1 that services in the Rosia Montana commune are represented by the majority of the sectors with the highest turnover in 2008 having been generated by professional activities (51.1%) followed by trading and transportation.
Graph II.8.1. Structure of services - Rosia Montana Commune
2008 2009* No. of businesses involved in services 54 54 Turnover of service rendering businesses 17698302 6552951
STRUCTURE OF SERVICES (according to turnover) %
Trading, car and motorbike repairs 23,8 32,2 Transport and storage 22,5 24,9 Hotels and restaurants 2,6 4,9 Professional activities 51,1 38,0

62
II.9. ECONOMY – OTHER TYPE OF ACTIVITIES
Table II.9.1. Other type of activities – Rosia Montana Commune
OTHER ACTIVITIES 2008 2009* Certified natural persons Trading activities 36 34
Freelance activities 6 6
Source: Alba General Public Finance Divisions*, data valid as at 30 July 2009
As indicated by the Table, the number of natural persons certified to conduct trading activities is in fact 5 times higher than that of the natural persons certified for freelance activities, which is normal given the current development of the Rosia Montana commune.
Graph II.9.1. Other type of activities 2009 – Rosia Montana Commune

63
SECTION III. QUALITY OF LIFE
Authors: PhD Mihai Pascaru Lucia Ispas-Pascaru, Soc. Simina Moldovan, PhD Teodora Capotă
III.1. HOUSEHOLD INCOMES, EXPENSES AND CONSUMPTION
Table III.1.1. Structure of incomes – Investigated population
CATEGORY OF INCOME / AVERAGE LEI % of total income average
Salaries 312.5 33.9 Agricultural activities 8.5 0.9 Independent non-agricultural activities 15.0 1.6 Pensions 499.1 54.3 Unemployment 53.8 5.8 Welfare benefits 28.4 3 Properties 0.1 0 Sale of household assets 1.4 0
Total average income 919.1 100 Data Source: 2009 Diagnosis Study (Quality of life, investigated population: 831 persons, heads of households)
Table III.1.1 shows the average values of the incomes generated per household subject to the income source and the proportion of each category in the total incomes (average / household). The main source of income for the population investigated in Rosia Montana commune is the pension, with an average value of lei 499.1 and representing 54.3% of the total (average) incomes obtained / household. The second source of income, as average value, are the salaries with 33.9% of the total incomes from salaries, with average value of lei 312.5. The next sources of income, in order of importance, are the unemployment benefit - 5.8% of the total incomes and average value of lei 53.8 and welfare benefits – 3% of the total incomes and average value of lei 28.4. In terms of agricultural activities, they have a very low percentage in the total incomes, i.e. only 9%. The low percentage is also due to the fact that this category of incomes is much more difficult to estimate by the people interviewed as for the majority of them it does not constitute direct income convertible in money.

64
Graph III.1.1. Structure of incomes – Investigated population
Table III.1.2. Subjective Standard of Living (SSL) – Investigated
population
TOTAL INCOMES IN RELATION TO NEEDS Frequency %
We manage to have all that we need without significant efforts 27 3,2 We manage to also buy expensive things however with effort 21 2,5 Enough for decent living, without buying expensive things 150 18,1 Enough only to make ends meet 337 40,6 Not enough to make ends meet 270 32,5
DK/NR (Don’t know/No response) 26 3,1
TOTAL 831 100 Source: 2009 Diagnosis Study (Quality of life, investigated population: 831 persons, heads of households)
The relation between incomes and needS involves a subjective estimation of the incomes subject to needs. The highest percentage of the investigated population (40.6%) believes that the incomes only cover the very basic needs. 32.5% believe that the incomes don’t even cover the very basic needs while 18.1% believe their income to be enough for a decent life without affording more expensive things.

65
Graph III.1.2. Subjective Standard of Living (How do you appreciate the total income of your household in relation to your needs?) Investigated population
Table III.1.3. Level and structure of cash expenses (average) – Investigated population
CATEGORY OF EXPENSES LEI
% of total expenses average
Food 468,2 51,4 Non-food goods 138,2 15,1 Services 118,7 13 Taxes, duties, contributions 7,3 0,8 Value of the products from own resources consumed 10,9 1,1
Repaid loans and credits 20,9 2,2
Other expenses (medication, clothes) 145,3 15,9
Total expense average 909 100 *Data Source: 2009 Diagnosis Study (Quality of life, investigated population: 831 persons, heads of households)
Table III.1.3. shows the average distribution of the expenses by categories, incurred within the investigated households. The highest proportion in the total expenses are the food expenses - 51.4%, with an average value of lei 468.2. Next in terms of importance are the non-food goods with a percentage of 15.1% and average value of lei 138.2.

66
Graph III.1.3. Level and structure of cash expenses (average) – Investigated
population

67
III.2. REPRESENTATION ON POOR-RICH SCALE
Graph III.2.1 Self-labeling as poor or rich
- Investigated population
Data Source: 2009 Diagnosis Study (Quality of life, investigated population: 831 persons, heads of households)
Along the subjective poverty axis we find the majority of the investigated population, i.e. 90% in the first half of the interval. As expected, both for methodological as well as theoretical reasons, the modal value which comes up to 26.2% is the central point of the axis followed by a sudden drop which continues to the end of the axis. In the first half of the interval, the population is distributed almost equally noting a slight decreasing trend down to 15.2% at the left end of the interval. Research work done in this area (Voicu, 2006) finds that points 4 and 5 of the scale are a psychological poverty threshold. “The individuals who are placed on this position are defined through a median position in terms of economic strength, related to the entire society (Voicu, 2006, p.11).

68
III.3. HOME APPLIANCES IN HOUSEHOLDS
Table III.3.1. Home appliances in households – Investigated population
HOME APPLIANCE FREQUENCY %
TV set 677 81.5 Refrigerator 572 68.8 Telephone 476 57.3 Radio set 291 35.0 Car 249 30.0 Computer 206 24.8 Washing machine 405 48.7 Data Source: 2009 Diagnosis Study (Quality of life, investigated population: 831 persons, heads of households)
In terms of home appliances in the households, we note that 5% of the total population investigated owns a TV set, 68.8% refrigerator, 57.3 % telephone and 48.7% washing machine. 35.0% own a radio set and 30% a car. A slightly lower percentage is noted where computers are concerned with 24.8% of the investigated households owning a computer.
Graph III.3.1. Home appliances in households – Investigated population

69
III.4. ESTIMATION OF INCOMES, POVERTY AND EXTREME POVERTY SOCIALLY ASSISTED FAMILIES
Table III.4.1. Estimated incomes– Investigated population
HOUSEHOLD INCOMES FREQUENCY
%
0-100 lei 35 4.2 101-200 lei 63 7.6 201-300 lei 57 6.9 301-600 lei 166 20.0 601-900 lei 118 14.2 901-1200 lei 98 11.8 1201-1500 lei 63 7.6 1501-1800 lei 55 6.6 1801-2100 lei 45 5.4 2101-2400 lei 25 3.0 above 2401 lei 36 4.3 DK/NR (Don’t know/No response) 70 8.4 TOTAL 831 100.0 Data Source: 2009 Diagnosis Study (Quality of life, investigated population: 831 persons, heads of households)
In terms of the estimated income / household, the categories that concentrate the highest percentage of the investigated population belong to the lei 300 - 1200 range, noting a smaller distribution, however relatively equal, towards the ends of the axis. The modal range is lei 300 – 600 concentrating 20%, followed by the lei 600 – 900 range which includes 14.2% of the total population investigated and lei 900 – 1200 range which includes 11.8%. The percentages drop moderately towards the ends of the axis where we find 4.2% of the population in the lei 0 – 100 range and 4.3% in the above lei 2400 range.
Graph III.4.1. Estimated incomes– Investigated population

70
Table III.4.2. Poverty and extreme poverty within the investigated households Number of socially assisted families in Rosia Montana commune
SOCIALLY ASSISTED FAMILIES FREQUENC
Y
% of total households
Number of households living on income smaller than 1 USD/day
35 4.2
Number of households living on income smaller than 2 USD/day
98 11.8
Number of socially assisted families 93 7.7*
Data Source: 2009 Diagnosis Study (Quality of life, investigated population: 831 persons, heads of households), *% calculated from total legal population, households recorded in official statistics.
Within the investigated population, the number of households that live on an income smaller than 1 USD/day per total household members is 35, related to the total number of households included in the investigation, amounting to 4.2% (investigated population: 831, heads of households). The number of families that live on an income smaller than 2 USD/day of the total members is 98, that is 11.8% of the total households included in the investigation.

71
III.5. ACCESS TO INSTITUTIONS AND BASIC SERVICES
Table III.5.1. Average distances – Investigated population
INSTITUTIONS Km* Town Hall 6 Medical clinic 2.6 School | 2 Police Dept 5.7 Post Office 2.2 Church 2.2 Grocery shop 1.7 Data Source: 2009 Diagnosis Study (Quality of life, investigated population: 831 persons, heads of households)
Table III.5.1 shows an assessment of the social isolation taking into consideration the average distances to the main institutions. The longest distances, i.e. 6 and 5.7 km, respectively relate to the institutions located in the center of the commune, namely the Town Hall and Police Department. In terms of the medical clinic, school, police, post office, church or grocery store we note fairly similar average distances and relatively small too, which indicates a relatively easy access of the population to the main institutions in terms of distance.

72
III.6. CONCERNS
Table III.6.1. Concerns of the investigated population
WHAT ARE YOU AND YOUR FAMILY CONCERNED ABOUT FOR TH E NEXT
PERIOD OF TIME?
Very much
Much Moderate Little Very little DK/NR
No. % No. % No. % No. % No. % No % Unemployment
280 33.7 105 12.6 63 7.6 65 7.8 273 32.9 45 5.4
Social conflicts
96 11.6 95 11.4 137 16.5 191 23.0 250 30.1 62 7.5
Criminal rate
152 18.3 124 14.9 167 20.1 108 13.0 221 26.6 59 7.1
Price increases
571 68.7 157 18.9 35 4.2 27 3.2 15 1.8 26 3.1
Tax increases
456 54.9 195 23.5 81 9.7 35 4.2 31 3.7 33 4.0
Pollution 244 29.4 130 15.6 152 18.3 87 10.5 173 20.8 45 5.4
Poverty 495 59.6 146 17.6 64 7.7 39 4.7 53 6.4 34 4.1 Data Source: 2009 Diagnosis Study (Quality of life, investigated population: 831 persons, heads of households)
In terms of the concerns specific to the population investigated in Rosia Montana, we found that they mainly focus on economic matters, with 54% of the people being concerned about tax increases, 59% about poverty and 68% about price increases. Although the concern about pollution is not as high as that about economic issues, the pollution issue still raises the interest of the investigated population, noting a distribution towards the poles of the axis, i.e. 31.3% state that they fear it "little” or “very little” while 44% state they fear it “a lot" or “extremely much”. We find a similar distribution in the case of the unemployment concern with 33.7% fearing unemployment “very much” while 32.9% state they fear it “very little”. The explanation in this case is given by the age structure of the population.

73
Graph III.6.1. Concerns of the investigated population

74
III. 7. QUALITY OF HOUSING
Table III.7.1. Status of housing of investigated population
HOUSING STATUS FREQUENCY %
Family owned housing 764 91.9
Rented housing 42 5.1 Others 22 2.6 DK/NR 3 0.4
Total 831 100.0 Data Source: 2009 Diagnosis Study (Quality of life, investigated population: 831 persons, heads of households)
91.9% of the population investigated in the diagnosis study on quality of life (Quality of life,
investigated population: 831 heads of households) live in a family-owned house while 5.1% live in rented
accommodation. The category “others” which covers 2.6% of the total investigated population
includes the people who live in houses owned by RMGC without paying rent.
Graph III.7.1. Status of housing of investigated population

75
Table III.7.2. Construction material of the building – Investigated population
CONSTRUCTION MATERIAL OF BUILDING FREQUENCY %
Reinforced concrete, concrete prefabs 180 13
Brickwork, stonework 241 29
Wood, timber 473 56.9
Loam brick, other materials 1 0
DK/NR 8 1.1
Total 831 100
Data Source: 2009 Diagnosis Study (Quality of life, investigated population: 831 persons, heads of households)
Graph III.7.2. Construction material of the building – Investigated population

76
Table III.7.3. Location of water closet (WC) – Investigated population
WC FREQUENCY %
Inside the house 284 34.2
Outside the house 296 35.6
Doesn’t have 248 29.8
DK/NR 3 0.4
Total 831 100.0
Data Source: 2009 Diagnosis Study (Quality of life, investigated population: 831 persons, heads of households)
Graph III.7.3. Location of water closet (WC) – Investigated population

77

78
Table III.7.4. Location of kitchen – Investigated population
KITCHEN LOCATION FREQUENCY %
Inside the house 540 65.0 Outside the house 137 16.5 Doesn’t have 148 17.8 DK/NR 6 0.7 Total 831 100.0 Data Source: 2009 Diagnosis Study (Quality of life, investigated population: 831 persons, heads of households)
Graph III.7.4. Location of kitchen – Investigated population
The majority of the dwellings owned by the investigated households, i.e. 59.6%, are built of materials such as wood / timber while 29% are built of stonework and bricks and only 13% of reinforced concrete and concrete prefabs. In terms of the location of the water closet (WC), 34.2% of the investigated households have it inside the house, 35.6 outside the house while 29.8% don’t have a toilet. The kitchen is located inside the house for 65% of the households, outside the household for 16.5% while 17.8% state they don’t have a kitchen.

79
GLOSSARY
1. THE INCOME CATEGORY / AVERAGE – What were the main sources of income last month? (please put in the value in lei for each category: SALARIES, AGRICULTURAL ACTIVITIES, INDEPENDENT NON-AGRICULTURAL ACTIVITIES, PENSIONS, UNEMPLOYMENT BENEFITS, WELFARE BENEFITS, PROPERTIES, SALE OF HOUSEHOLD ASSETS).
The indicator enables the comparative analysis of the income sources / household and determination of the main sources of income within the households in the commune. The average value in lei from each source shall be calculated and compared to the total average income.
Value in lei – average value of incomes from each source.
Percentage from total incomes – percentage of each income source in total average income.
2. SUBJECTIVE POVERTY is a “method to conceptualize poverty starting from representations on the poverty and wealth of the individuals that form up a society” (Voicu, B, 2006, p.2). The concept takes into consideration the sociological and socio-psychological dimension of the poverty underlying the fact that major for the life strategies of the social actors, for the way in which they relate to the social reality, for the satisfaction to life, are not so much the objective living conditions but rather the subjective evaluation of the same, the subjective representations on the social system and position perceived within the social system, the way in which they evaluate the standard of living, relating to expectations and needs constructed in the social context.
In assessing poverty, two indicators were taken into consideration, namely:
2.1. SUBJECTIVE STANDARD OF LIVING (SSL): One of the indicators used in assessing the subjective poverty is the subjective standard of living, a subjective assessment of the incomes generated in the household in relation to the needs. The heads of households responded to the question: “How do you estimate the total incomes of your household in relation to the needs?”, using a 5 levels scale from 1. Not enough to make ends meet up to 5. We manage to have all that we need without significant efforts.
The way in which the investigated population is distributed on this scale is analyzed.
2.2. The POOR – RICH SCALE involves self-labeling as poor or rich on a 1 to 10 scale with 1 meaning “very poor” and 10 “very rich”. The indicator is “a method for subjective assessment of the material and financial status, of the material resources to which the individuals have access (Voicu, 2006, p.8).
The way in which the investigated population is distributed on this scale is analyzed.
3. LEVEL AND STRUCTURE OF CASH EXPENSES – What were the main expenses last month? (the value in lei for each category shall be put in: FOOD EXPENSES; NON-FOOD GOODS; PAYMENT OF SERVICES; TAXIES, DUTIES, CONTRIBUTIONS, VALUE OF THE CONSUMPTION OF PRODUCTS FROM OWN RESOURCES, REPAID LOANS AND CREDITS, OTHER EXPENSES.
Another indicator of the living conditions is the structure of expenses and consumption. The indicator enables the comparative analysis of the main categories of consumption and

80
determination of the most important ones in terms of percentage in household budget. A high percentage of food expenses is an indicator of poverty, the specialist research confirming that where the people who are below the poverty threshold are concerned, the food expenses are 60% of the total expenses, while where the people included in the "rich" category are concerned the food expenses drop below 40%.
There shall be calculated:
Average value in lei: average value in RON of the expenses by each category.
Percentage in total expenses: The percentage of each category in the total average expenses / household will be calculated.
4. HOME APPLIANCES:
Another indicator of the quality of the living conditions in terms of welfare, which as shown by the relevant literature tends to be consistent with other poverty dimensions, is owning long term use goods. Thus, is analyzed the proportion of households that own or not long-term use goods such as TV set, refrigerator, telephone, radio set, car, computer, washing machine as well as the proportion of households that have the following facilities: water closet, kitchen inside the house.
5. POVERTY: lack of basic subsistence resources (food, water, clothing, shelter, etc), lack of or insufficient incomes / consumption (Stanculescu) evaluated in relation to a poverty threshold which represents a minimum subsistence level. The poverty threshold used in monitoring the Millennium Development Objectives is 2 USD/capita/day.
The POVERTY RATE, percentage of households living on less than 2 USD/day will be calculated.
6. EXTREME / SEVERE POVERTY: an extreme poverty threshold, which refers to the minimal resources to ensure subsistence shall be established.
The EXTREME POVERTY RATE, percentage of households living on less than 1 USD/day will be calculated.
7. SOCIAL ISOLATION: The average distances to the main institutions will be calculated. An
indicator mainly used in scattered rural areas. High distance indicates high social isolation, lack of access to institutions. Average distances, as declared by the investigated subjects, to the following institutions are analyzed: TOWN HALL, MEDICAL CLINIC, POLICE DEPT, POST OFFICE, CHURCH, GROCERY STORE.
8. POPULATION’S CONCERNS
The population’s reasons for concern expressed in the responses to the question: “What are you and your family concerned about for the next period of time?” is a dimension based on which the state of mind of the population is assessed. The frequency with which a certain concern occurs and also the intensity of the concerns is analyzed and measured on a five level scale, i.e. very much, much, moderate, little, very little.
9. HOUSING STATUS: Percentage of households that own the dwelling.

81
10. CONSTRUCTION MATERIAL: construction material of the building in which the household resides. The frequency with which materials such as reinforced concrete, concrete pefabs; brickwork, stonework; wood, timber; loam brick and other materials is encountered.

82
SECTION IV. CULTURE AND ART, ASSOCIATIVE LIFE
AND COMMUNITY PARTICIPATION IN ROSIA MONTANA COMMUNE.
Authors: PhD Mihai Pascaru, Phd Lucia Ispas-Pascaru, Soc. Simina Moldovan, PhD Teodora Capotă
Table IV.1. Culture and art - Rosia Montana Commune
Source: Alba Regional Statistics Department - Rosia Montana Commune Sheet 2000 - 2008
Graph IV.1. Culture and art - Rosia Montana Commune
2000 2001 2002 2003 2004 2005 2006 2007 2008
Libraries – total – no. 2 3 2 2 4 4 4 3 3
Public libraries – total – no.
1 1 1 1 1 1 1 1 1
Museums - no. 0 0 0 0 0 1 1 1 1
Museum visitors – no. 0 0 0 0 0 1000 1500 1000 2000

83
Table IV.2. Associative life and community participation in Rosia Montana commune.
2009
Events with community participation / year (including church services, activities organized by churches and denominations)
135
Cultural events / year 3 Structures involving the community in decision-making 15 Claims, list of signatures, grievances to community initiative
206
Participation to voting 30% (European Parliament)
Non-governmental organizations, clubs, associations 32* NGO’s involved in “sustainable development”, community development, culture
4
Source: Rosia Montana Town Hall, Oct 2009; * According to data supplied by DGFP Alba.
Although the trend specific to the contemporary village in terms of the cultural heritage is a
degradation of the cultural environment, in Rosia Montana commune we see a development of the
cultural and artistic activities (i.e. in 2008 the number of museum visitors was doubled compared
to 2007.

84
GLOSSARY
1. CULTURE AND ART
1.1. LIBRARIES – evolution is monitored in terms of the number of libraries existing in Rosia Montana commune during 2000 – 2009.
1.2. PUBLIC LIBRARIES – evolution is monitored in terms of the number of public libraries existing in Rosia Montana commune during 2000 – 2009.
1.3. MUSEUMS – evolution is monitored in terms of the number of museums existing in Rosia Montana commune during 2000 – 2009.
1.4. MUSEUM VISITORS – looks at the evolution in terms of the number of museum visitors during 2000 - 2009.
2. ASSOCIATIVE LIFE AND COMMUNITY PARTICIPATION:
The associative life, meaning the network of non-governmental organizations operating in a community and the community participation, meaning the active involvement of the citizens in the life of the community, are dimensions of the social capital, indicators of the development and modernization degree of a community as well as explanatory factors of the development. The following indicators are taken into consideration in the analysis of the associative life and community participation:
2.1. EVENTS WITH COMMUNITY PARTICIPATION / YEAR (including church services, activities organized by churches and denominations) look at the number of events which involve a large part of the community in joint activities irrespective of their theme carried out during one year in Rosia Montana commune.
2.2. 2.2. CULTURAL EVENTS / YEAR look at the number of events which involve a large part of the community in joint activities, with a cultural theme, carried out during one year in Rosia Montana commune.
2.4. CLAIMS, LIST OF SIGNATURES, GRIEVANCES TO COMMUNITY INITIATIVE Indicators of community participation, in the form of active involvement, in the public life. The number of civic intervention during one year in Rosia Montana commune is analyzed. A large number, correlated with other dimensions of participations indicates interest in community life, involvement availability for public interest, facilitating an economic and democratic development.
2.5. PARTICIPATION OF CITIZENS TO VOTING: Indicators of community participation, in the form of passive involvement, in the public life. The rate of turnout at European Parliament elections of 2009 in Rosia Montana commune is analyzed. A large percentage, correlated with other dimensions of participations indicates interest in community life,

85
involvement availability for public interest, facilitating an economic and democratic development.
2.6. NON-GOVERNMENTAL ORGANIZATIONS, CLUBS, ASSOCIATIONS: The number of non-governmental organizations existing in the commune, irrespective of their profile. An intense associative life is an indicator of the social capital level existing in the community, of the “civism” degree, correlating with an economic and democratic development of the community. An intense associative life (large number of NGO’s, large number of participants) leads to the formation of a social network that may be used as involvement leverage in decision-making and also in formation of civic participation skills.
2.7. NGO’S INVOLVED IN “SUSTAINABLE DEVELOPMENT”, COMMUNITY DEVELOPMENT, CULTURE: The number of non-governmental organizations existing in the commune involved in “sustainable development”, community development or culture.

86
SECTION V. ROSIA MONTANA – THE REFLECTION OF SUSTAINABLE
DEVELOPMENT IN THE WRITTEN PRESS3
Authors: Soc. Delia Covrig
Semantic network V.1. ““RReessppoonnssiibbllee mmiinniinngg aanndd ssuussttaaiinnaabbllee ddeevveellooppmmeenntt”” –– aarrgguummeennttss ooff
tthhee ssuuppppoorrtteerrss ooff RRMMGGCC PPrroojjeecctt
3 The newspapers from which articles were taken are Jurnalul National – 9, Cotidianul – 11 and Ziua – 4 (during Feb – Nov 2009).

87
Semantic network V.2. AArr gguummeennttss aaggaaiinnsstt RRMM GGCC PPrr oojj eecctt