replacing soil testing
DESCRIPTION
Replacing SOIL TESTING. In-Season Soil Testing. Use of an in-season soil test for N availability in corn PSNT (0-30cm), Magdoff et al. (1984). - PowerPoint PPT PresentationTRANSCRIPT

Replacing SOIL TESTINGReplacing SOIL TESTING

In-Season Soil TestingIn-Season Soil Testing Use of an in-season soil test for N availability in corn
PSNT (0-30cm), Magdoff et al. (1984). Separating nitrate test calibration data based on yield
potential of soils may improve PSNT and PPNT for making N recommendations in corn, when NO3 test values are in the N responsive region (Bundy and Andraski, 1995)
No soil test accurately predicted either relative grain yield or N-supplying capacity (Fox et al., 1993).
Relative grain yield vs PSNT relationship was better with NO3 and NH4 than with NO3 alone (Meisinger et al., 1992)
Use of an in-season soil test for N availability in corn PSNT (0-30cm), Magdoff et al. (1984).
Separating nitrate test calibration data based on yield potential of soils may improve PSNT and PPNT for making N recommendations in corn, when NO3 test values are in the N responsive region (Bundy and Andraski, 1995)
No soil test accurately predicted either relative grain yield or N-supplying capacity (Fox et al., 1993).
Relative grain yield vs PSNT relationship was better with NO3 and NH4 than with NO3 alone (Meisinger et al., 1992)
Sufficiency
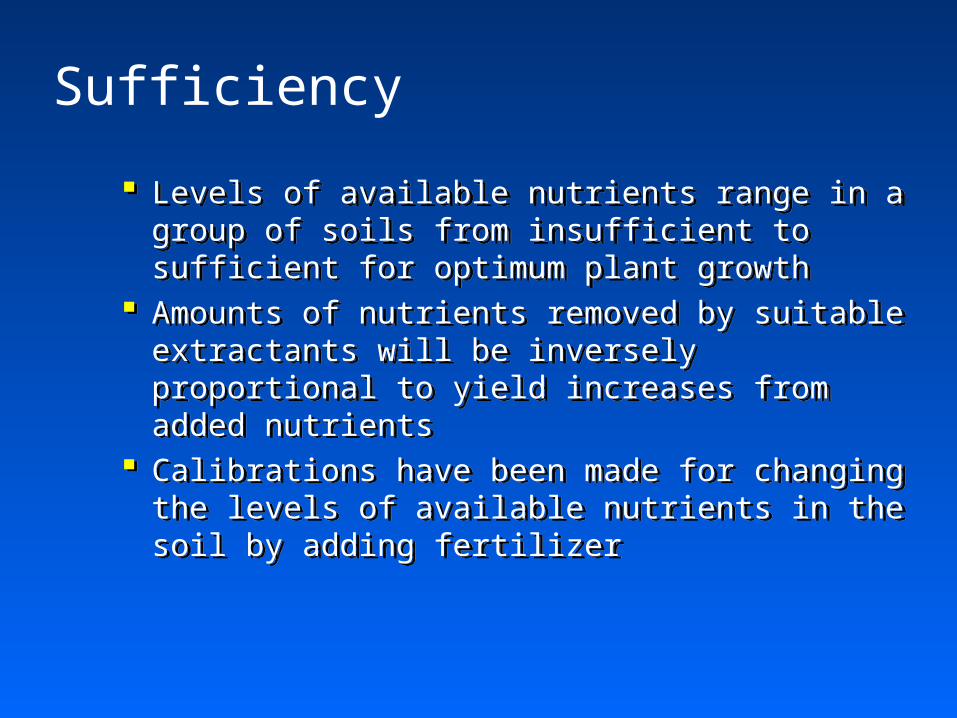
Levels of available nutrients range in a group of soils from insufficient to sufficient for optimum plant growth
Amounts of nutrients removed by suitable extractants will be inversely proportional to yield increases from added nutrients
Calibrations have been made for changing the levels of available nutrients in the soil by adding fertilizer

Mobile Nutrient Yield Goal (Risk assessment of
the environment)
Immobile Nutrient Sufficiency Level (Independent
of Environment, % of Maximum yield)
Mobile Nutrient Yield Goal (Risk assessment of
the environment)
Immobile Nutrient Sufficiency Level (Independent
of Environment, % of Maximum yield)

Root Surface Sorption ZoneRoot Surface Sorption Zone
• Response does not depend on reservoir Response does not depend on reservoir • Indicator of availabilityIndicator of availability• Independent of environmentIndependent of environment
• Response does not depend on reservoir Response does not depend on reservoir • Indicator of availabilityIndicator of availability• Independent of environmentIndependent of environment
• Response depends on reservoirResponse depends on reservoir• Indicator of total availableIndicator of total available• Dependent on environmentDependent on environment
• Response depends on reservoirResponse depends on reservoir• Indicator of total availableIndicator of total available• Dependent on environmentDependent on environment
Root System Sorption ZoneRoot System Sorption Zone
•Depends on Growth StageDepends on Growth Stage •IndicatorsIndicators
•BiomassBiomass•ColorColor•ConcentrationConcentration
•Depends on Growth StageDepends on Growth Stage •IndicatorsIndicators
•BiomassBiomass•ColorColor•ConcentrationConcentration
•Independent of Growth Independent of Growth StageStage
•IndicatorsIndicators•BiomassBiomass•ColorColor
•Independent of Growth Independent of Growth StageStage
•IndicatorsIndicators•BiomassBiomass•ColorColor
NONO33-- HH22POPO44
--
Bray’s Mobility ConceptBray’s Mobility Concept
HPOHPO44==
Sensor ViewSensor ViewSensor ViewSensor View
Soil TestSoil Test
Mobile NutrientsMobile NutrientsMobile NutrientsMobile Nutrients Immobile NutrientsImmobile NutrientsImmobile NutrientsImmobile Nutrients
SensorSensor

Present N Recommendation Fertilizer N = yield goal (bu/ac)*2 - soil
test NO3-N
Future N Recommendation Estimated topdress N = f (yield
potential and total N uptake, estimated using indirect measures)
Present N Recommendation Fertilizer N = yield goal (bu/ac)*2 - soil
test NO3-N
Future N Recommendation Estimated topdress N = f (yield
potential and total N uptake, estimated using indirect measures)

Could we establish a sufficiency level (by growth stage, variety, etc) at
Feekes 5?
NDVI N UptakeSuff. N Rec 0.3 35 40 Yld goal*1.5 0.5 45 60 Yld goal*1.0 0.7 55 80 Yld goal*0.7 0.9 65 100 Yld goal*0.2
Could we establish a sufficiency level (by growth stage, variety, etc) at
Feekes 5?
NDVI N UptakeSuff. N Rec 0.3 35 40 Yld goal*1.5 0.5 45 60 Yld goal*1.0 0.7 55 80 Yld goal*0.7 0.9 65 100 Yld goal*0.2

Sunlight reachingearthSunlight reachingearth
Chlorophyll bChlorophyll b
B-CaroteneB-Carotene
PhycoerythrinPhycoerythrin
PhycocyaninPhycocyanin
Chlorophyll aChlorophyll a
300 400 500 600 700 800300 400 500 600 700 800
Wavelength, nmWavelength, nm
Ab
sorp
tio
nA
bso
rpti
on
SPAD 501, 502(430, 750)SPAD 501, 502(430, 750)
Absorption of Visible Lightby Photopigments
Absorption of Visible Lightby Photopigments
CAUSE/EFFECTCAUSE/EFFECT

Contribution to wheat yield from soil-N and fertilizer-N over time, Lahoma, OK (502)
0
10
20
30
40
50
60
70
1971
1972
1973
1974
1975
1976
1977
1978
1979
1980
1981
1982
1983
1984
1985
1986
1987
1988
1989
1990
1991
1992
1993
1994
1995
1996
1997
1998
1999
2000
2001
Ave.
Year
Yie
ld (
bu
/acr
e)
Soil-N Yld Fert-N Yld
98 100 51 52 50 58 47 84 34 50 76 75 75 59 88 71 42 43 54 77 43 39 25 64 47 35 51 36 87 99 60
Bar value is % of yield supported by soil-N

Contribution to wheat yield from soil-N and fertilizer-N over time, Stillwater, OK (222)
0
10
20
30
40
50
60
70
1969
1970
1971
1972
1973
1976
1977
1978
1979
1980
1981
1982
1983
1984
1985
1986
1987
1988
1989
1990
1991
1992
1993
1994
1996
1997
1998
1999
2000
2001
Ave
Year
Yie
ld (
bu
/acr
e)
Soil-N Yld Fert-N Yld
80 77 99 90 65 83 76 83 66 43 70 37 45 44 80 100 60 54 52 59 44 57 28 72 48 50 52 36 64Bar value is % of yield supported by soil-N
100 60

Relationship of % maximum yield supported by mineralized N for 502 and 222 trials over 27 paired years.
y = 4.92E-01x + 3.03E+01
R2 = 2.07E-01
0
20
40
60
80
100
120
0 20 40 60 80 100 120
Control yield as % of max, 222
Co
ntr
ol y
ield
as
% o
f m
ax,
502

Percentage of maximum yield supported by mineralized soil-N over time
0
20
40
60
80
100
120
1971
1972
1976
1977
1978
1979
1980
1981
1982
1983
1984
1985
1986
1987
1988
1989
1990
1991
1992
1993
1994
1996
1997
1998
1999
2000
2001
Years
Per
cen
tag
e o
f m
ax y
ld
222 502
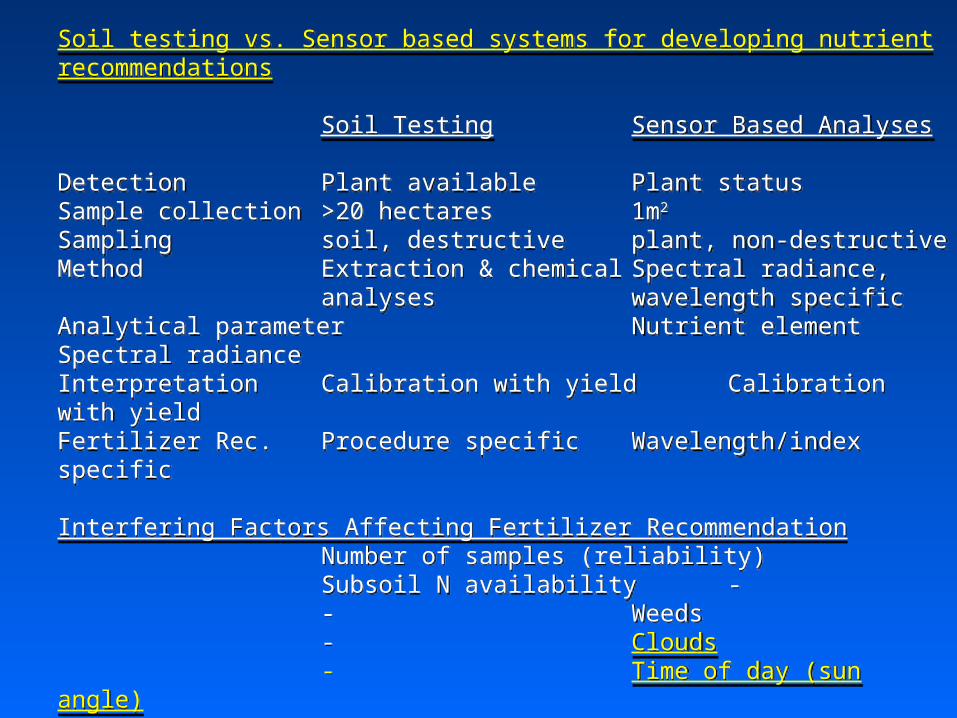
Soil testing vs. Sensor based systems for developing nutrient recommendations
Soil Testing Sensor Based Analyses Detection Plant available Plant statusSample collection >20 hectares 1m2
Sampling soil, destructive plant, non-destructiveMethod Extraction & chemical Spectral radiance,
analyses wavelength specificAnalytical parameter Nutrient element Spectral radianceInterpretation Calibration with yield Calibration with yieldFertilizer Rec. Procedure specific Wavelength/index specific
Interfering Factors Affecting Fertilizer RecommendationNumber of samples (reliability)Subsoil N availability -- Weeds- Clouds- Time of day (sun angle)- Variety- Stage of growth (% cover)- Living vs. dead plant tissueField element size Field element sizeCalibration curve Calibration curve

Evolution of a soil testEvolution of a soil test
Evolution of a spectral testEvolution of a spectral test
Extraction Correlation Calibration On-farm Suff.Procedure with field of rates at validation Index
response a given soiltest level
Wavelength Correlation Calibration On-farm Suff./Index/band with field of rates at validation Index
response a given ___ env. spec.
Extraction Correlation Calibration On-farm Suff.Procedure with field of rates at validation Index
response a given soiltest level
Wavelength Correlation Calibration On-farm Suff./Index/band with field of rates at validation Index
response a given ___ env. spec.

430 Chl A
430 Chl A
0.010.01 1010 380 450 495 570 590 620 750 1x10380 450 495 570 590 620 750 1x10 66 1x101x101111
0.010.01 1010 380 450 495 570 590 620 750 1x10380 450 495 570 590 620 750 1x10 66 1x101x101111
Gam
ma
Gam
ma
Gam
ma
Gam
ma
X-R
ays
X-R
ays
X-R
ays
X-R
ays
UV
UV
UV
UV
NIR
NIR
NIR
NIR
Mic
row
ave
Mic
row
ave
Mic
row
ave
Mic
row
ave
Rad
io, F
M, T
VR
adio
, FM
, TV
Rad
io, F
M, T
VR
adio
, FM
, TV
470 Chl B
470 Chl B
680 photo
system
II
680 photo
system
II
700 photo
system
I
700 photo
system
I
WBI=950/900WBI=950/900WBI=950/900WBI=950/900
NDVI (normalized difference vegetation index) chlorophyll absorption, NDVI (normalized difference vegetation index) chlorophyll absorption, LAILAISR (simple ratio)SR (simple ratio)NPCI (normalized total pigement to chlorophyll-a ratio index)NPCI (normalized total pigement to chlorophyll-a ratio index)WBI (water band index)WBI (water band index)red edge (morphological differences in field crops)red edge (morphological differences in field crops)MPDI (microwave polarization difference index) water content of plantsMPDI (microwave polarization difference index) water content of plantsPRI (physiological reflectance index) ref is 550 for sunflowersPRI (physiological reflectance index) ref is 550 for sunflowers
NDVI (normalized difference vegetation index) chlorophyll absorption, NDVI (normalized difference vegetation index) chlorophyll absorption, LAILAISR (simple ratio)SR (simple ratio)NPCI (normalized total pigement to chlorophyll-a ratio index)NPCI (normalized total pigement to chlorophyll-a ratio index)WBI (water band index)WBI (water band index)red edge (morphological differences in field crops)red edge (morphological differences in field crops)MPDI (microwave polarization difference index) water content of plantsMPDI (microwave polarization difference index) water content of plantsPRI (physiological reflectance index) ref is 550 for sunflowersPRI (physiological reflectance index) ref is 550 for sunflowers
NPCI=(680-430)/NPCI=(680-430)/(680+430)(680+430)
PRI = (ref-531)/(ref+531) PRI = (ref-531)/(ref+531) PRI = (ref-531)/(ref+531) PRI = (ref-531)/(ref+531)
red edge (680-760)red edge (680-760)red edge (680-760)red edge (680-760)
NDVI=780-671/780+671NDVI=780-671/780+671NDVI=780-671/780+671NDVI=780-671/780+671
SR=780/671SR=780/671SR=780/671SR=780/671
660 Chl B
660 Chl B
680 Chl A
680 Chl A
Under Stress (WATER)Under Stress (WATER)
China570

Short wavelengthShort wavelengthHigh energyHigh energy
Long wavelengthLong wavelengthLow energyLow energy
0.010.01 1010 380380 450450 495495 570570 590590 620620 750750 wavelength, nmwavelength, nm
0.010.01 1010 380380 450450 495495 570570 590590 620620 750750 wavelength, nmwavelength, nm
X-R
ays
X-R
ays
X-R
ays
X-R
ays
Ult
ravi
ole
tU
ltra
vio
let
Ult
ravi
ole
tU
ltra
vio
let
Infr
ared
Infr
ared
Infr
ared
Infr
ared
Chlorophyll bChlorophyll b
B-CaroteneB-Carotene
PhycoerythrinPhycoerythrin
PhycocyaninPhycocyanin
Chlorophyll aChlorophyll a

0.25
0.5
Wavelength (nm)
Ref
lect
ance
(%
)R
efle
ctan
ce
(%)
VisibleVisible Near InfraredNear Infrared
450 550 650 750 850 950 1050 1150500 600 700 1000900800 1100
0.00
Plant Reflectance

Soil and crop reflectanceSoil and crop reflectance
0
0.1
0.2
0.3
0.4
0.5
0.6
300 400 500 600 700 800 900 1000 1100
Wavelength (nm)
Fra
cti
on
al
Re
fle
cta
nc
e
43 Soils
27 Soybeans
25 Potatoes
9 Sunflower
73 Cotton17 Corn
P. S. ThenkabailR. B. SmithE. De PauwYale Center for Earth Observation
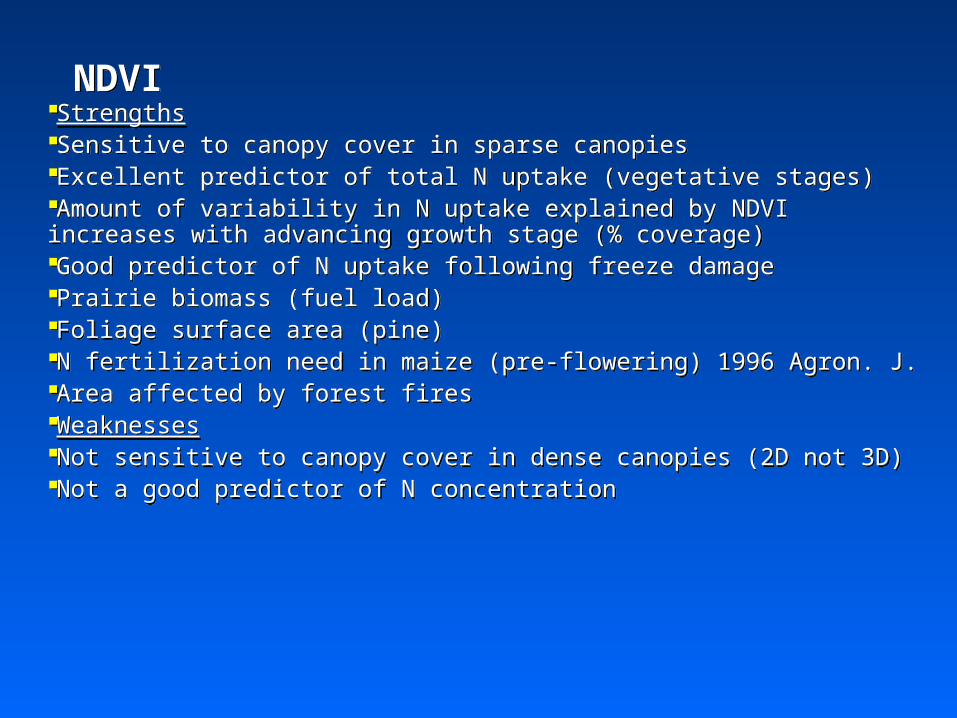
NDVINDVIStrengthsSensitive to canopy cover in sparse canopiesExcellent predictor of total N uptake (vegetative stages)Amount of variability in N uptake explained by NDVI increases with advancing growth stage (% coverage)Good predictor of N uptake following freeze damagePrairie biomass (fuel load)Foliage surface area (pine)N fertilization need in maize (pre-flowering) 1996 Agron. J.Area affected by forest firesWeaknessesNot sensitive to canopy cover in dense canopies (2D not 3D)Not a good predictor of N concentration
StrengthsSensitive to canopy cover in sparse canopiesExcellent predictor of total N uptake (vegetative stages)Amount of variability in N uptake explained by NDVI increases with advancing growth stage (% coverage)Good predictor of N uptake following freeze damagePrairie biomass (fuel load)Foliage surface area (pine)N fertilization need in maize (pre-flowering) 1996 Agron. J.Area affected by forest firesWeaknessesNot sensitive to canopy cover in dense canopies (2D not 3D)Not a good predictor of N concentration

IndicesIndices Landsat Satellite Thermic Mapper (TM) mid and near
infrared indices plant density, drought, tillage
SR (simple ratio)=NIR/red NDVI (normalized difference vegetation index) = (NIR-
red)/(NIR+red) biomass, forage N uptake, water stress, leaf area
index G-NDVI = (NIR-green)/(NIR+green) STVI (stress related vegetation index) MPDI (microwave polarization difference index) NPCI (normalized pigment chlorophyll ratio index)
=(R680-R430)/(R680+R430)
Landsat Satellite Thermic Mapper (TM) mid and near infrared indices plant density, drought, tillage
SR (simple ratio)=NIR/red NDVI (normalized difference vegetation index) = (NIR-
red)/(NIR+red) biomass, forage N uptake, water stress, leaf area
index G-NDVI = (NIR-green)/(NIR+green) STVI (stress related vegetation index) MPDI (microwave polarization difference index) NPCI (normalized pigment chlorophyll ratio index)
=(R680-R430)/(R680+R430)

IndicesIndices
§WBI (water band index) = R970-R900§PRI (physiological reflectance index) §= (R550-R530)/(R550+R530) ‘narrow waveband spectral measurements’ (sunflower)§chlorophyll, net CO2 uptake, water potential, light use efficiency
§WBI (water band index) = R970-R900§PRI (physiological reflectance index) §= (R550-R530)/(R550+R530) ‘narrow waveband spectral measurements’ (sunflower)§chlorophyll, net CO2 uptake, water potential, light use efficiency

What should we learn from soil testing?What should we learn from soil testing?
Process of elimination Justus von Leibig (1803-1873) Leibig’s Law of the Minimum; nutrient
present in the least relative amount is the limiting nutrient for plant growth
all other nutrients present in excess until the deficient or limiting nutrient was in adequate supply
Father of ‘soil testing’
Process of elimination Justus von Leibig (1803-1873) Leibig’s Law of the Minimum; nutrient
present in the least relative amount is the limiting nutrient for plant growth
all other nutrients present in excess until the deficient or limiting nutrient was in adequate supply
Father of ‘soil testing’
Liebig HyperlinkLiebig Hyperlink

Fact Sheet 2225 (on-line)Fact Sheet 2225 (on-line) Crop
small grains, sorghum, corn, cotton, cool season grasses, weeping lovegrass, bluestem, bermudagrass, forage sorghum or corn silage, small grains for grazing, legumes in pasture, native meadows, alfalfa, peanuts, soybeans, mungbeans, cowpeas
N, P, K, S, Ca, Mg, Zn, Fe, Mn, Cu, B pH/buffer index (lime)
SENSOR BASED NITROGEN RATE CALCULATOR Similarities?
Crop small grains, sorghum, corn, cotton, cool season
grasses, weeping lovegrass, bluestem, bermudagrass, forage sorghum or corn silage, small grains for grazing, legumes in pasture, native meadows, alfalfa, peanuts, soybeans, mungbeans, cowpeas
N, P, K, S, Ca, Mg, Zn, Fe, Mn, Cu, B pH/buffer index (lime)
SENSOR BASED NITROGEN RATE CALCULATOR Similarities?

Could N uptake be used as an indicatorof yield potential when other variables are controlling response?
Should we develop technologies that treat variable ‘yield potential’
What influences NDVI?How can I use the NDVI measurement from last year, this year? CALIBRATION
Soil Testing: Method of Extraction would it be ok if I changed methods each year?

PhosphorusPhosphorus Fluoresce= reemit light energy absorbed as light but of a
longer wavelength and of lower energy Fluorescence spectrum is characteristic of the pigment,
so it is possible to tell which pigment is fluorescing (which one was activated)
Low P nutrition results in increased chlorophyll fluorescence, reduced photosynthetic rate, increased starch and sucrose in leaves
If the reactions of photosynthesis are blocked (chemical, cold, etc.) fluorescence will occur in-vivo because the energy absorbed cannot be used.
x-ray fluorescence (total P in plants) Time required to induce/measure fluorescence (1-2 min)
Xanthophyll
Fluoresce= reemit light energy absorbed as light but of a longer wavelength and of lower energy
Fluorescence spectrum is characteristic of the pigment, so it is possible to tell which pigment is fluorescing (which one was activated)
Low P nutrition results in increased chlorophyll fluorescence, reduced photosynthetic rate, increased starch and sucrose in leaves
If the reactions of photosynthesis are blocked (chemical, cold, etc.) fluorescence will occur in-vivo because the energy absorbed cannot be used.
x-ray fluorescence (total P in plants) Time required to induce/measure fluorescence (1-2 min)
Xanthophyll

Subsoil nutrient availabilitySubsoil nutrient availability
Can sensor based technologies assess subsurface nutrient availability? Sensing with time (Stage of growth)
could provide an indicator of subsurface nutrient availability
Can sensor based technologies assess subsurface nutrient availability? Sensing with time (Stage of growth)
could provide an indicator of subsurface nutrient availability
T1 T2 T3 T4T1 T2 T3 T4

VISIBLE Color AbsorbedVISIBLE Color Absorbed
VISIBLE Color TransmittedVISIBLE Color TransmittedVISIBLE Color TransmittedVISIBLE Color Transmitted
VioletViolet BlueBlue GreenGreen YellowYellow Orange Orange RedRedVioletViolet BlueBlue GreenGreen YellowYellow Orange Orange RedRed
Short wavelengthShort wavelengthHigh frequencyHigh frequencyHigh energyHigh energy
Long wavelengthLong wavelengthLow frequencyLow frequencyLow energyLow energy
0.010.01 1010 380380 450450 495495 570570 590590 620620 750750 1x101x1066 1x101x101111
wavelength, nmwavelength, nm0.010.01 1010 380380 450450 495495 570570 590590 620620 750750 1x101x1066 1x101x101111
wavelength, nmwavelength, nm
Gam
ma
Ray
sG
amm
a R
ays
Gam
ma
Ray
sG
amm
a R
ays
X-R
ays
X-R
ays
X-R
ays
X-R
ays
Ult
ravi
ole
tU
ltra
vio
let
Ult
ravi
ole
tU
ltra
vio
let
Infr
ared
Infr
ared
Infr
ared
Infr
ared
Mic
row
aves
an
d s
ho
rt r
adio
Mic
row
aves
an
d s
ho
rt r
adio
Mic
row
aves
an
d s
ho
rt r
adio
Mic
row
aves
an
d s
ho
rt r
adio
Rad
io, F
M, T
VR
adio
, FM
, TV
Rad
io, F
M, T
VR
adio
, FM
, TV
ElectronicElectronic VibrationalVibrational RotationalRotationaltransitionstransitions transitionstransitions transitionstransitionsElectronicElectronic VibrationalVibrational RotationalRotationaltransitionstransitions transitionstransitions transitionstransitions
Yellow-greenYellow-green YellowYellow VioletViolet BlueBlue Green-blueGreen-blue Blue-greenBlue-green

Models for Interpretation of ResponseModels for Interpretation of Response
Linear Linear-plateau Quadratic Square root Quadratic-plateau Cate-Nelson
Linear Linear-plateau Quadratic Square root Quadratic-plateau Cate-Nelson
20 mpg20 mpg 400 miles400 miles
Gallons
20
35
Gallons
20
3510 mpg10 mpg 350 miles350 miles
40 30 60 20
40 30 60 20
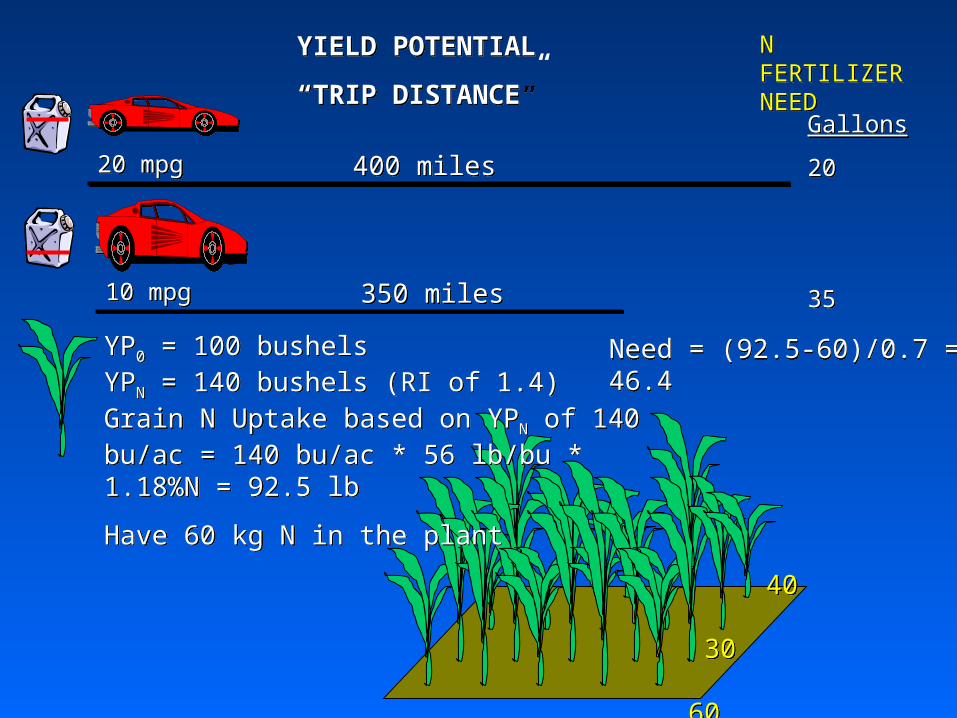
YIELD POTENTIAL
“TRIP DISTANCE”
YIELD POTENTIAL
“TRIP DISTANCE”
N FERTILIZER NEEDN FERTILIZER NEED
YP0 = 100 bushelsYPN = 140 bushels (RI of 1.4)Grain N Uptake based on YPN of 140 bu/ac = 140 bu/ac * 56 lb/bu * 1.18%N = 92.5 lb
Have 60 kg N in the plant
YP0 = 100 bushelsYPN = 140 bushels (RI of 1.4)Grain N Uptake based on YPN of 140 bu/ac = 140 bu/ac * 56 lb/bu * 1.18%N = 92.5 lb
Have 60 kg N in the plant
Need = (92.5-60)/0.7 = 46.4Need = (92.5-60)/0.7 = 46.4
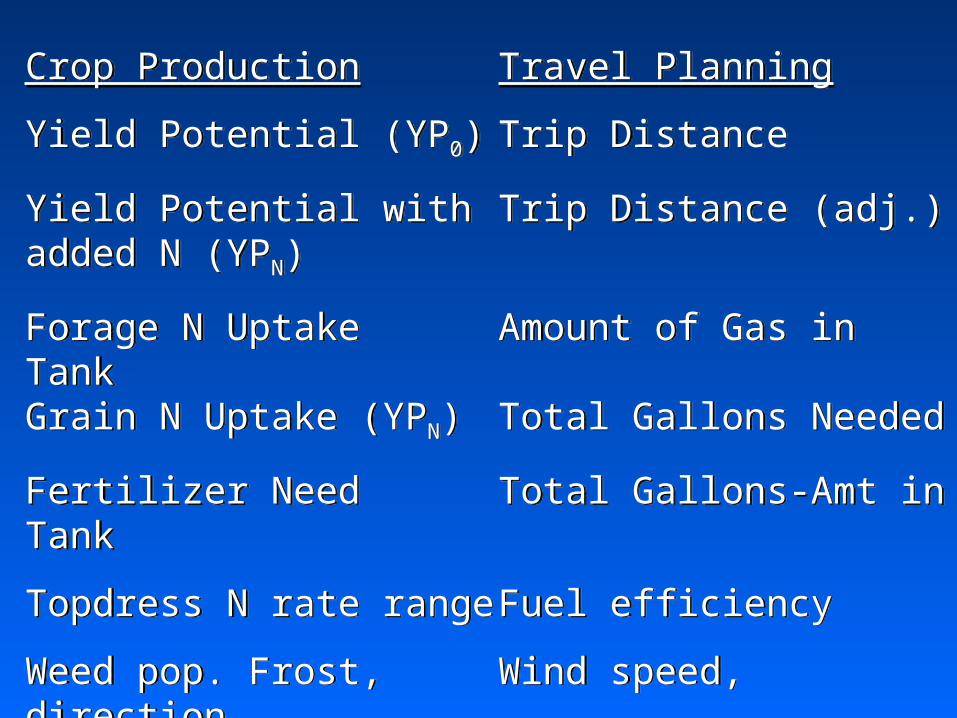
Crop Production Travel Planning
Yield Potential (YP0) Trip Distance
Yield Potential with Trip Distance (adj.)added N (YPN)
Forage N Uptake Amount of Gas in TankGrain N Uptake (YPN) Total Gallons Needed
Fertilizer Need Total Gallons-Amt in Tank
Topdress N rate range Fuel efficiency
Weed pop. Frost, Wind speed, direction
Plant population uphill, gradient

Interfering agronomic factorsInterfering agronomic factors Moisture availability (texture, water holding
capacity) Nutrient(s) deficiency(ies) and/or toxicity(ies)
interactions Crop Variety within crop Preplant N rate Production system (forage vs. grain) Tillage (background) Weed interference Row spacing (coverage, plant density) Resolution to be treated (field element size)
cost of misapplication (economic vs. environment)
Moisture availability (texture, water holding capacity)
Nutrient(s) deficiency(ies) and/or toxicity(ies) interactions
Crop Variety within crop Preplant N rate Production system (forage vs. grain) Tillage (background) Weed interference Row spacing (coverage, plant density) Resolution to be treated (field element size)
cost of misapplication (economic vs. environment)

Hennessey, Feekes 4, 5 and 7Hennessey, Feekes 4, 5 and 7Hennessey, Feekes 4, 5 and 7Hennessey, Feekes 4, 5 and 7
Feekes Growth Stage 7Feekes Growth Stage 7Feekes Growth Stage 7Feekes Growth Stage 7y = 234.78x - 9.4074y = 234.78x - 9.4074y = 234.78x - 9.4074y = 234.78x - 9.4074
RRRR2222 = 0.7286= 0.7286 = 0.7286= 0.7286
0000
50505050
100100100100
150150150150
200200200200
250250250250
0000 0.20.20.20.2 0.40.40.40.4 0.60.60.60.6 0.80.80.80.8
NDVINDVINDVINDVI
To
tal
N U
pta
ke,
kg/h
aT
ota
l N
Up
take
, kg
/ha
To
tal
N U
pta
ke,
kg/h
aT
ota
l N
Up
take
, kg
/ha
Feekes Growth Stage 5Feekes Growth Stage 5Feekes Growth Stage 5Feekes Growth Stage 5y = 97.953x - 12.413y = 97.953x - 12.413y = 97.953x - 12.413y = 97.953x - 12.413
RRRR2222
= 0.6687= 0.6687 = 0.6687= 0.6687
Feekes Growth Stage 4Feekes Growth Stage 4Feekes Growth Stage 4Feekes Growth Stage 4y = 286.62x - 20.226y = 286.62x - 20.226y = 286.62x - 20.226y = 286.62x - 20.226
RRRR2222 = 0.3588= 0.3588 = 0.3588= 0.3588

00
1010
2020
3030
4040
5050
6060
7070
0-10
0-10
10-2
010
-20
20-3
020
-30
30-4
030
-40
40-5
040
-50
50-6
050
-60
60-7
060
-70
70-8
070
-80
8080
N rate, kg/haN rate, kg/ha
Fre
qu
en
cyF
req
ue
ncy
Frequency Distribution of VariableNitrogen Rates (4, 1x42m transects)Frequency Distribution of Variable
Nitrogen Rates (4, 1x42m transects)
8080
00
NDVINDVI
0.3 0.4 0.5 0.6 0.7 0.8 0.3 0.4 0.5 0.6 0.7 0.8 0.90.9
Max. N Rate Max. N Rate determined determined by farmerby farmer

Treatment Treatment Number of Resolution Subplots
1 0.84 m2 642 3.34 m2 163 13.38 m2 44 53.51 m2 1
Treatment Treatment Number of Resolution Subplots
1 0.84 m2 642 3.34 m2 163 13.38 m2 44 53.51 m2 1
RESOLUTION STUDYTreatment StructureRESOLUTION STUDYTreatment Structure

Contour map of NDVI values at Tipton, OK
01 02 03 04
08 07 06 05
09 10 11 12
16 15 14 13
01 02
04 03
01 01 02 03 04
08 07 06 05
09 10 11 12
16 15 14 13
01 02 03 04
08 07 06 05
09 10 11 12
16 15 14 13
01 02 03 04 05 06 07 08
16 15 14 13 12 11 10 09
17 18 19 20 21 22 23 24
32 31 30 29 28 27 26 25
33 34 35 36 37 38 39 40
48 47 46 45 44 43 42 41
49 50 51 52 53 54 55 56
64 63 62 61 60 59 58 57
01
01 02 03 04 05 06 07 08
16 15 14 13 12 11 10 09
17 18 19 20 21 22 23 24
32 31 30 29 28 27 26 25
33 34 35 36 37 38 39 40
48 47 46 45 44 43 42 41
49 50 51 52 53 54 55 56
64 63 62 61 60 59 58 57
01 01 02 03 04 05 06 07 08
16 15 14 13 12 11 10 09
17 18 19 20 21 22 23 24
32 31 30 29 28 27 26 25
33 34 35 36 37 38 39 40
48 47 46 45 44 43 42 41
49 50 51 52 53 54 55 56
64 63 62 61 60 59 58 57
01 04
02 03
01 04
02 03
NDVI
0.48
0.450.420.39
0.360.330.30
0.27
0.240.210.18

00
55
1010
1515
2020
2525
3030
0.260.26 0.
30.3
0.340.34
0.380.38
0.420.42
0.460.46 0.
50.5
0.540.54
0.580.58
0.620.62
0.660.66 0.
70.7
0.740.74
0.780.78
NDVINDVI
Fre
qu
ency
Fre
qu
ency
Distribution of NDVI values, Tipton, OKDistribution of NDVI values, Tipton, OK

Percent Coverage35 55 85
NDVI0.3 0.5 0.7
Percent Coverage35 55 85
NDVI0.3 0.5 0.7
Tipton, January 15, 1998, Feekes 5Tipton, January 15, 1998, Feekes 5
Fertilizer N RateFertilizer N Rate

Percent Coverage35 55 85
NDVI0.3 0.5 0.7
Percent Coverage35 55 85
NDVI0.3 0.5 0.7
Tipton, January 15, 1998, Feekes 5Tipton, January 15, 1998, Feekes 5

Res. N Rate SD Yield SD Efficiency SD N Uptake SDm2 kg/ha kg/ha of Use** kg/ha____ ___________ _________ ____________ ___________0.84 56.95 19.04 2323 162 44.25 15.65 51.53 1.883.34 74.17 18.43 2329 382 33.47 12.52 52.30 5.8113.38 69.28 23.13 2473 233 38.77 13.79 54.21 4.6753.51 73.93 25.26 2555 266 37.58 13.95 60.27 6.63SED 13.97 127 7.28 3.22
** Moll et al., 1982
Location: Perkins, 1997-98Location: Perkins, 1997-98

Spectral radiance (250-830 nm) collected from individual plots, Spectral radiance (250-830 nm) collected from individual plots,
NxP bermudagrass experiment, Burneyville, OKNxP bermudagrass experiment, Burneyville, OK
00
0.050.05
0.10.1
0.150.15
0.20.2
0.250.25
250250 350350 450450 550550 650650 750750 850850
Wavelength, nmWavelength, nm
Sp
ectr
al r
adia
nce
, %
Sp
ectr
al r
adia
nce
, %
N0 P0N0 P0N0 P60N0 P60N0 P120N0 P120N100 P0N100 P0N100 P60N100 P60N100 P120N100 P120N200 P0N200 P0N200 P60N200 P60N200 P120N200 P120N300 P0N300 P0N300 P60N300 P60N300 P120N300 P120
RedRedRedRed
NIRNIRNIRNIR
GreenGreenGreenGreen
Hasil SembiringOSU Soil FertilityHasil SembiringOSU Soil Fertility

11 55 88 66 1111 44 22 33 99 77 1212 1010
33 44 1212 1010 88 77 55 11 99 22 1111 66
88 33 77 55 11 1212 1111 44 66 22 99 1010
Trt N rate P rate1 0 02 40 03 80 04 120 05 0 106 40 107 80 108 120 109 0 2010 40 2011 80 2012 120 20
Trt N rate P rate1 0 02 40 03 80 04 120 05 0 106 40 107 80 108 120 109 0 2010 40 2011 80 2012 120 20
10 ft10 ft
30 ft30 ft

Source of variation df P Nw919 w791
Total (r*N*P)-1 35 - -Rep 2 ns nsN Rate 3 ns **P Rate 2 ** nsN Rate * P Rate 6 ns nsError 22 - -
Source of variation df P Nw919 w791
Total (r*N*P)-1 35 - -Rep 2 ns nsN Rate 3 ns **P Rate 2 ** nsN Rate * P Rate 6 ns nsError 22 - -
0 40 80 1200 40 80 120
50403020100
50403020100

00
0.050.05
0.10.1
0.150.15
0.20.2
0.250.25
0.30.3
276
276
335
335
395
395
455
455
515
515
575
575
635
635
695
695
755
755
815
815
N0 P0N0 P0
N0 P60N0 P60N0 P120N0 P120
00
0.050.05
0.10.1
0.150.15
0.20.2
0.250.25
0.30.3
276
276
335
335
395
395
455
455
515
515
575
575
635
635
695
695
755
755
815
815
N300 P0N300 P0
N300 P60N300 P60
N300 P120N300 P120
Wavelength, nmWavelength, nm
Sp
ectr
al r
adia
nc
e, %
Sp
ectr
al r
adia
nc
e, %
Hasil SembiringOSU Soil FertilityHasil SembiringOSU Soil Fertility
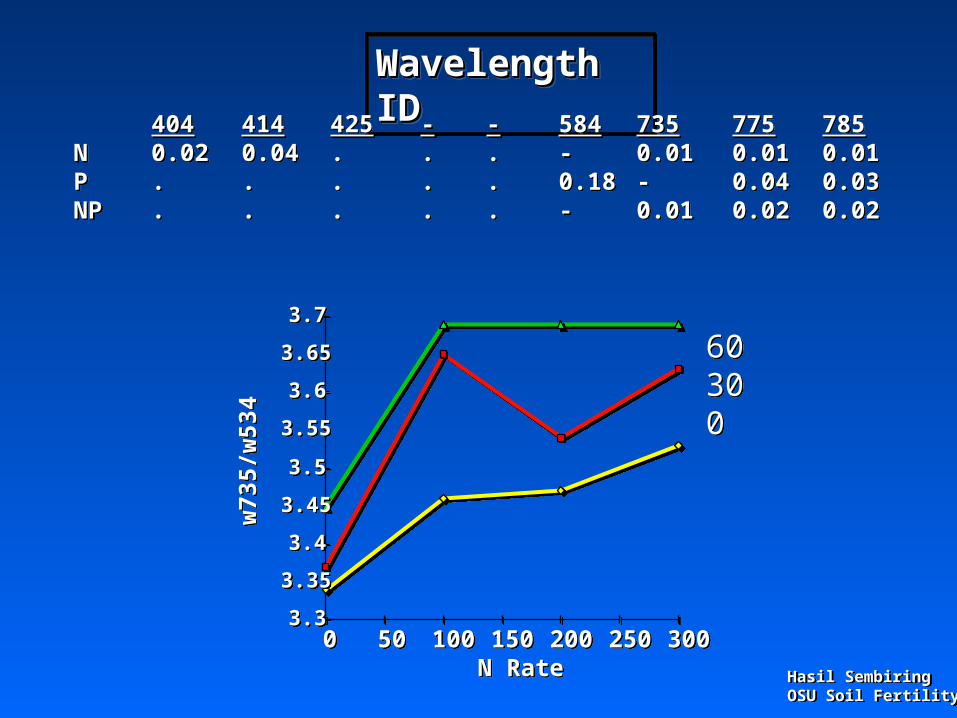
Wavelength IDWavelength IDWavelength IDWavelength ID
Hasil SembiringOSU Soil FertilityHasil SembiringOSU Soil Fertility
404 414 425 - - 584 735 775 785N 0.02 0.04 . . . - 0.01 0.01 0.01P . . . . . 0.18 - 0.04 0.03NP . . . . . - 0.01 0.02 0.02
404 414 425 - - 584 735 775 785N 0.02 0.04 . . . - 0.01 0.01 0.01P . . . . . 0.18 - 0.04 0.03NP . . . . . - 0.01 0.02 0.02
3.33.3
3.353.35
3.43.4
3.453.45
3.53.5
3.553.55
3.63.6
3.653.65
3.73.7
00 5050 100100 150150 200200 250250 300300N RateN Rate
w73
5/w
534
w73
5/w
534
60300
60300

Can I trust this applicator to replace my soil test?Can I trust this applicator to replace my soil test?