regional three-dimensional modelling of iron ore ... · regional three-dimensional modelling of...
TRANSCRIPT

Regional Three-Dimensional Modelling of Iron Ore ExplorationTargets
V Osterholt1, O Herod2 and H Arvidson3
ABSTRACTThe Australasian Code for Reporting of Mineral Resources and OreReserves, December 2004 (the JORC Code) deals with reportingexploration target size and type, which are expressed as ranges in order toproperly convey the high level of uncertainty that exists early in theproject evaluation process. To inform investors of the significant potentialmineralisation in BHP Billiton’s Pilbara tenements and to enable strategicplanning, a rigorous modelling approach has been devised for such earlystage projects.
An innovative approach to modelling scenarios that capture theuncertainty range has been developed. The approach integrates drill holes,mapping, geophysical surveys and the geologist’s interpretation. Themodelling workflow consists of two parts: geology modelling, and grademodelling.
An implicit 3D modelling approach is utilised to rapidly generatemultiple regional models of stratigraphy. Mineralisation envelopes andweathering horizons, providing further controls on the target range, are alsomodelled using fit-for-purpose tools and data structures. Grades areestimated with a recoverable resource estimation approach. The estimationaccounts for uncertainty of local grade distributions and providesmulti-variate grade models that honour correlations between variables. Thefinal product delivers a rigorous approach to the estimation of tonnage andgrade ranges for reporting the exploration target that captures theuncertainty of the estimate.
INTRODUCTION
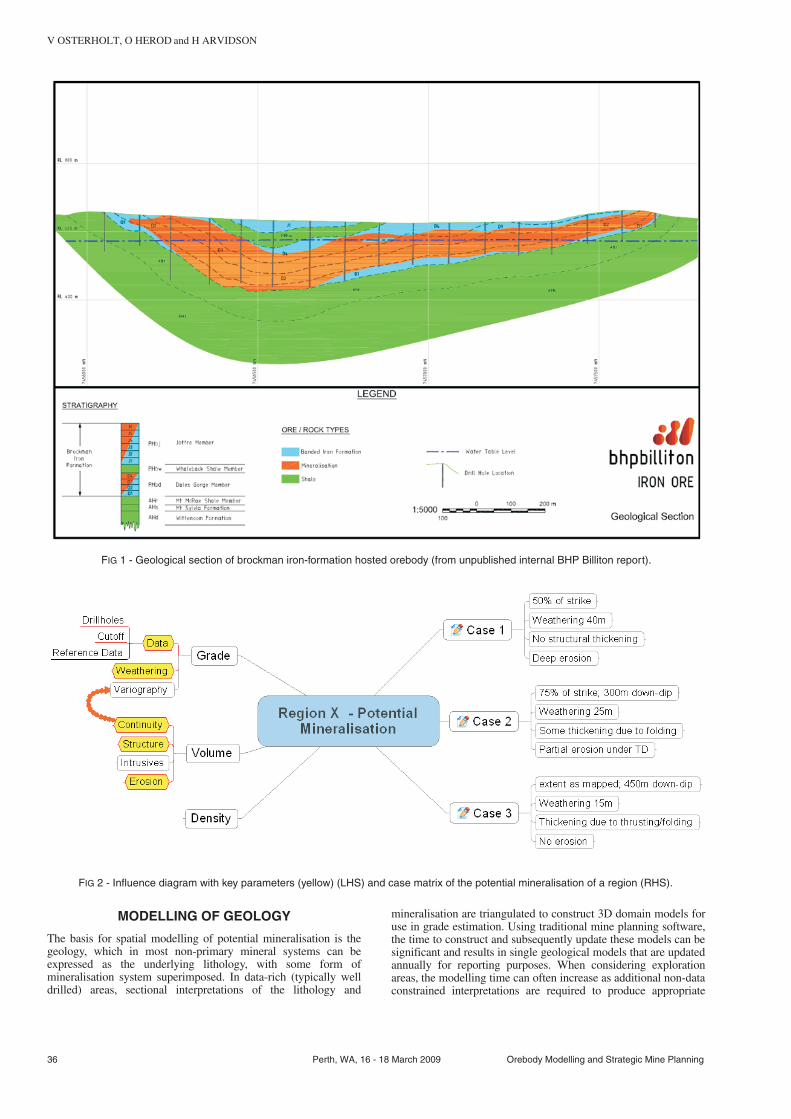
In the Hamersley Ranges, bedded iron ores comprise the bulk ofthe area’s iron enrichment, varying between low phosphorous (P)martite-microplaty haematite and medium-high P martite-goethite or martite-ochreus goethite ores, originating fromenriched banded iron-formation (BIF) sequences of theBrockman and Marra Mamba Formations. Stratigraphy is folded,thrusted and faulted to various degrees across the HamersleyRanges as a result of multiple deformation phases. Structuralfeatures often control the quantity and quality of mineralisationby influencing the available volumes of BIF as well as theenrichment processes. Figure 1 shows an example geologicalsection through an openly folded orebody, with mineralisationboundaries subparallel to stratigraphy and high continuitythroughout the syncline. Weathering effects often truncatepotentially economic mineralisation near the surface. Dataavailable during early evaluation work is usually sparse, withonly some drill holes per kilometre along strike, geologicalsurface mapping and geophysical data. Often data is historic andassociated with data entry errors, low precision, old drillingtechniques and can be incomplete. Such data sets are notconsidered sufficient to support public reporting of mineralresources, which is an expression of the inherent uncertainty. Inorder to advance exploration and strategic planning, this
uncertainty around exploration targets needs to be addressed in ameaningful and practical way. Estimates of such potentialmineralisation can be developed in a variety of ways.Historically, BHP Billiton has generated these as a deterministicnon-spatial grade and tonnage estimate. In the presence ofuncertainty, deterministic estimates do not deliver the requiredexploration target ranges. They also have limited use in strategicplanning, particularly in bulk commodities like iron ore, wheremulti-pit blending options are a key strategic driver.
MODELLING APPROACH
A holistic view of geological uncertainty requires capturing theuncertainty about the key factors controlling the grade-tonnagedistribution of a prospective area. A target evaluation projectconsists of three stages:
1. development of geology and grade scenarios;
2. geology modelling to build 3D representations of stationarydomains, that is volume models; and
3. grade modelling to populate volumes with the relevantgrade estimates.
The initial conceptual analysis is based on understanding thestates of knowledge (facts, assumptions, interpretations andunknowns), followed by describing the linkage between keyinfluences on mineralisation. Concepts are then distilled into arange of possible scenarios, a best-guess scenario (most likely)and alternative pessimistic and optimistic scenarios (less likelybut still reasonably likely as an outcome). These scenarios aredocumented in a case matrix. This case matrix is the driving toolof the modelling process – it links data analysis, interpretationand scenarios developed during the conceptual analysis. Allrelevant details for all key drivers for the model cases are listedin a transparent and auditable way. A simple example illustratingthe principle is given in Figure 2.
Developing scenarios and assigning probabilities is an expert-driven process including team workshops to utilise all availablesources of knowledge. Detailed data analysis and a review ofprevious work and reports is combined with regional geologicalknowledge and experience from existing mining operations, whichare then used to develop a range around the key influences.Examples include mineralisation in particular units of thestratigraphic sequence, occurrence of (un-) favourable structures,continuity of the mineralisation along strike and down-dip andweathering intensity. The necessity and challenge of such expertjudgements for early stage resource uncertainty assessment wasraised previously (eg Caumon and Caers, 2004). An innovativeapproach to modelling these scenarios in three dimensions, withthe uncertainty, has been developed – it integrates drill holes,mapping, geophysical surveys and the geologist’s interpretation.This paper describes the modelling approach in a generic way.Results presented in figures provide an illustration of typical studyoutcomes. The workflow consists of two parts, geology modellingand grade modelling.
These are presented in the next two sections, then the resultingmodelling capabilities are summarised, and finally, the strengthsof the approach and challenges are discussed.
Orebody Modelling and Strategic Mine Planning Perth, WA, 16 - 18 March 2009 35
1. MAusIMM, Senior Resource Geologist, BHP Billiton Iron Ore,PO Box 7122, Cloisters Square, Perth WA 6850.Email: [email protected]
2. MAusIMM, Senior Consultant, SRK Consulting, PO Box 943,West Perth WA 6872. Email: [email protected]
3. MAusIMM, Principal Resource Geologist, Resource ModellingGroup, BHP Billiton Iron Ore, PO Box 7122, Cloisters Square,Perth WA 6850. Email: [email protected]
MODELLING OF GEOLOGY
The basis for spatial modelling of potential mineralisation is thegeology, which in most non-primary mineral systems can beexpressed as the underlying lithology, with some form ofmineralisation system superimposed. In data-rich (typically welldrilled) areas, sectional interpretations of the lithology and
mineralisation are triangulated to construct 3D domain models foruse in grade estimation. Using traditional mine planning software,the time to construct and subsequently update these models can besignificant and results in single geological models that are updatedannually for reporting purposes. When considering explorationareas, the modelling time can often increase as additional non-dataconstrained interpretations are required to produce appropriate
36 Perth, WA, 16 - 18 March 2009 Orebody Modelling and Strategic Mine Planning
V OSTERHOLT, O HEROD and H ARVIDSON
FIG 1 - Geological section of brockman iron-formation hosted orebody (from unpublished internal BHP Billiton report).
FIG 2 - Influence diagram with key parameters (yellow) (LHS) and case matrix of the potential mineralisation of a region (RHS).
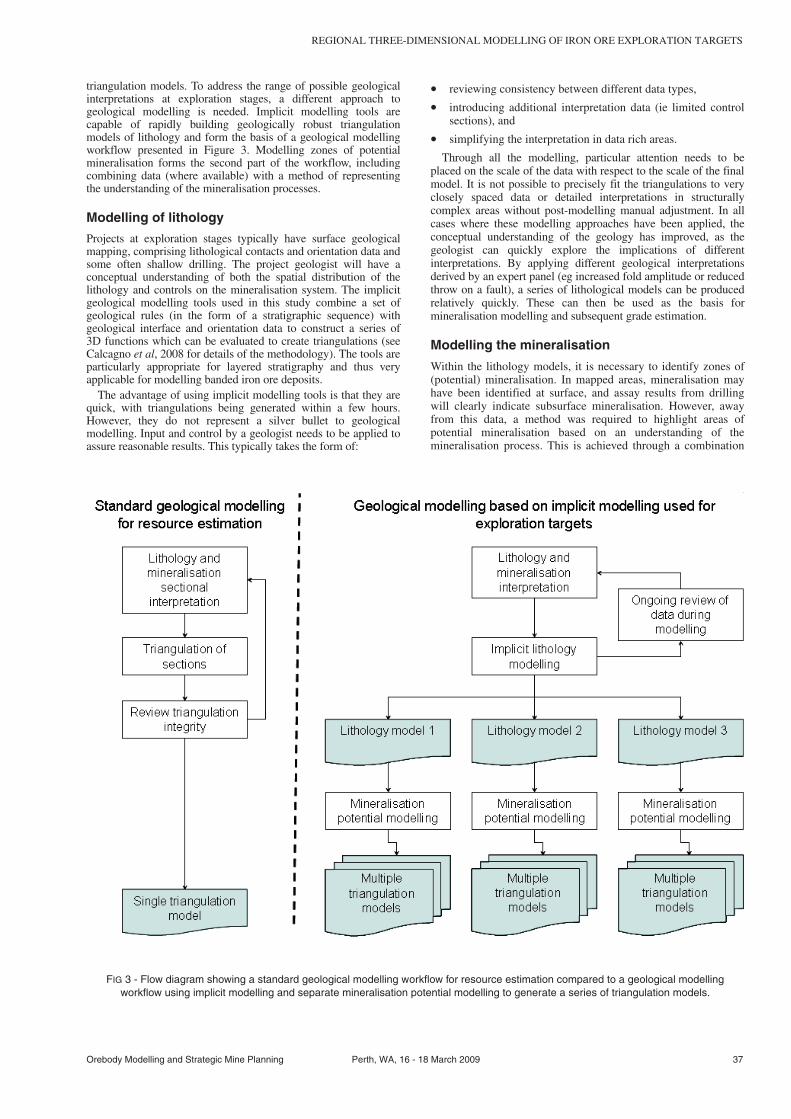
triangulation models. To address the range of possible geologicalinterpretations at exploration stages, a different approach togeological modelling is needed. Implicit modelling tools arecapable of rapidly building geologically robust triangulationmodels of lithology and form the basis of a geological modellingworkflow presented in Figure 3. Modelling zones of potentialmineralisation forms the second part of the workflow, includingcombining data (where available) with a method of representingthe understanding of the mineralisation processes.
Modelling of lithology
Projects at exploration stages typically have surface geologicalmapping, comprising lithological contacts and orientation data andsome often shallow drilling. The project geologist will have aconceptual understanding of both the spatial distribution of thelithology and controls on the mineralisation system. The implicitgeological modelling tools used in this study combine a set ofgeological rules (in the form of a stratigraphic sequence) withgeological interface and orientation data to construct a series of3D functions which can be evaluated to create triangulations (seeCalcagno et al, 2008 for details of the methodology). The tools areparticularly appropriate for layered stratigraphy and thus veryapplicable for modelling banded iron ore deposits.
The advantage of using implicit modelling tools is that they arequick, with triangulations being generated within a few hours.However, they do not represent a silver bullet to geologicalmodelling. Input and control by a geologist needs to be applied toassure reasonable results. This typically takes the form of:
• reviewing consistency between different data types,
• introducing additional interpretation data (ie limited controlsections), and
• simplifying the interpretation in data rich areas.
Through all the modelling, particular attention needs to beplaced on the scale of the data with respect to the scale of the finalmodel. It is not possible to precisely fit the triangulations to veryclosely spaced data or detailed interpretations in structurallycomplex areas without post-modelling manual adjustment. In allcases where these modelling approaches have been applied, theconceptual understanding of the geology has improved, as thegeologist can quickly explore the implications of differentinterpretations. By applying different geological interpretationsderived by an expert panel (eg increased fold amplitude or reducedthrow on a fault), a series of lithological models can be producedrelatively quickly. These can then be used as the basis formineralisation modelling and subsequent grade estimation.
Modelling the mineralisation
Within the lithology models, it is necessary to identify zones of(potential) mineralisation. In mapped areas, mineralisation mayhave been identified at surface, and assay results from drillingwill clearly indicate subsurface mineralisation. However, awayfrom this data, a method was required to highlight areas ofpotential mineralisation based on an understanding of themineralisation process. This is achieved through a combination
Orebody Modelling and Strategic Mine Planning Perth, WA, 16 - 18 March 2009 37
REGIONAL THREE-DIMENSIONAL MODELLING OF IRON ORE EXPLORATION TARGETS
FIG 3 - Flow diagram showing a standard geological modelling workflow for resource estimation compared to a geological modellingworkflow using implicit modelling and separate mineralisation potential modelling to generate a series of triangulation models.

of suitable estimation of data in a 3D grid model and selectingzones of the model based on modelled geological features. Amineralisation indicator was applied to the drilling data(continuous values) to combine it with mapping (mineralised,un-mineralised or unknown, ie binary or null). The parameters ofthe estimation of the combined data (distance, direction, numberof data required and method of estimation) was determined by anexpert panel and varied depending on the scenario. By usingdeformable 3D grids controlled by the lithology model, theestimation was able to honour the structural complexity of thestratigraphy. Away from the data, potentially mineralised areas ofthe grid model were selected by application of a conceptualmineralisation model. A series of 3D geographical informationsystem (GIS) tools were used which could query regions of themodel, eg those regions within 100 m of faults or occurring insynformal fold hinges. The specific mineralisation rules werepart of the expert panel scenario. The initial spatial visualisationof these ‘rules’ often identified unrealistic assumptions, whichcould then be re-evaluated by the geologists involved.
Combining the two approaches gives a grid model with aseries of mineralised zones – the zones can be triangulated forvisualisation purposes. The application of indicator estimationand a series of mineralisation ‘rules’ provides a repeatable andquick method of generating zones of potential mineralisationwhich are controlled by the underlying lithology model. For eachlithology model, a series of mineralisation models could be builtrepresenting a true range in possible geological scenarios.
GRADE MODELLING
Mineralisation grades add another level of uncertainty of potentialmineralisation and have material impact on strategic schedulingand blending studies. Statistics such as grade histograms andvariograms are difficult to infer from sparse data and are thereforeuncertain. Grade uncertainty ranges are addressed using abootstrapping technique for resampling histograms. Variogramuncertainty was investigated, but was found to have only a minorimpact on the global grade tonnage distribution. Previous work onthe topic includes Berckmans and Armstrong (1999). They reporton a related but global approach for grade-tonnage estimationaccounting for grade uncertainty. The approach presented hereaims at local grade modelling, so grade estimation will bereviewed in the next few paragraphs before presenting theapproach in the following section.
Fit-for-purpose grade estimation has to consider the fact that oreis mined out as selective mining units (SMUs). The SMUdescribes a defined volume that can be selected during mining andis primarily linked to mining equipment. Typically, SMUs arevastly larger than drill hole samples (eg Journel and Kyriakidis,2004), but in relation to exploration drill hole spacing, they aresmall. When data is sparse, linear in situ resource estimation likelyresults in over-smoothed grade-tonnage curves. Such modelsrepresent a too-low selectivity equivalent to excessively largeSMU size. A non-linear recoverable resource estimation approach(or alternatively, a simulation approach) is required to enableunbiased grade-tonnage curve estimation. The recoverableresource models that are generated form the basis of a realisticprediction of minable reserves that take dilution/ore loss,economic factors, mining policies, etc into account.
Two approaches for recoverable resource estimation aretraditionally considered in the literature:
1. Derivation of the sample support distribution (pdf) for apanel and application of a change of support correction, ieconversion of sample support histogram to SMU supporthistogram. Methods include uniform conditioning (UC) andmultiple-indicator kriging (MIK) combined with supportcorrection (eg Rivoirard, 1994; De-Vitry, Vann andArvidson, 2007).
2. Conditional Simulation (CS) of geological and chemicalcomponents of an orebody on a fine grid of sample supportvalues that are reblocked (averaged) to achieve SMUsupport (Journel and Kyriakidis, 2004; Journel andHuijbregts, 1977).
UC is based on the assumptions of the underlying DiscreteGaussian Model (DGM). The DGM is a method in which theoriginal distribution is transformed to a standard normaldistribution using Hermite polynomials. This type of polynomialhas the remarkable property of being ‘orthogonal’ for Gaussianvalues. This means that the transformation of the distribution fora variance correction can be simply made by applying acorrection factor to the Hermite coefficients. Thus, there is noassumption of normality or log-normality in the original data.There is a reliance on the bi-normality of the transformed dataand expected SMU values. In UC, the local panel’s mean andvariance are estimated using kriging, while all other distributionmoments are based on the global data distribution and honourCartier’s relationship. Hence the proportional effect is poorlycaptured by traditional UC. The method is fast and practical – amultivariate implementation was recently provided (Deraisme,Rivoirard and Carrasco, 2008). This approach enables a changeof support for a primary variable and a set of secondaryvariables. The full pdf, F(X), of a primary variable, X, isavailable for reporting at various cut-offs. Secondary variables,Yi, can be reported as the expectation value of the conditionalpdf, E[F(Yi|X)].
Additional to the assumptions of the univariate DGM, themultivariate DGM assumes multi-Gaussian behaviour of thevariables considered. MIK is a method with little assumptionsregarding the shape of the grade distributions. The estimation ofthe point-support pdf is local, with variance and higher momentsderived by kriging from the search neighbourhood. Theapplication requires extensive variography even for the univariatecase. Various support correction methods are available to inferlocal SMU support pdfs. Neither MIK nor UC incorporate globalor local uncertainty.
The common and commercially available CS techniques arebased on second order moments and also make assumptionsregarding the higher moments of the distributions. Themulti-Gaussian model is most widely used in the industry and isfully defined by the Gaussian transformation of the samplehistogram and the related variogram model. An acceptable set ofCS realisations should reproduce those two statistics withinergodic fluctuations (eg Goovaerts, 1997). Some multivariate CSalgorithms suffer from some problems, for example variancereproduction (Babak and Deutsch, 2008). CS models capturegrade variability and local uncertainty, enabling their quantitativeevaluation within the CS model framework. These qualities cannotbe delivered by estimation techniques. In general, CS hasadditional computation, storage and people requirements that raisethe question of cost/benefit balance. New efficient algorithmsretain SMU grades only and enable some CPU and storage savings(eg Boucher and Dimitrakopoulos, 2009; Deraisme, Rivoirard andCarrasco, 2008). However in this regional context model sizeremains challenging even in terms of SMUs (eg for a 1 B tonnestarget – 5 M SMUs × 5 variables × 4 bytes × 50 realisations =5 GB).
LOCAL CHANGE OF SUPPORT
The proposed approach local change of support, or LoCoS,stands in between UC, MIK and CS and combines the strengthsof the three methods while avoiding some of their practicallimitations in this large scale context. Given a panel within adomain, three steps are performed:
1. kriging – to derive a local weighted histogram,
2. spatial bootstrap of the local histogram, and
38 Perth, WA, 16 - 18 March 2009 Orebody Modelling and Strategic Mine Planning
V OSTERHOLT, O HEROD and H ARVIDSON
3. change of support for each histogram realisation from thesecond step.
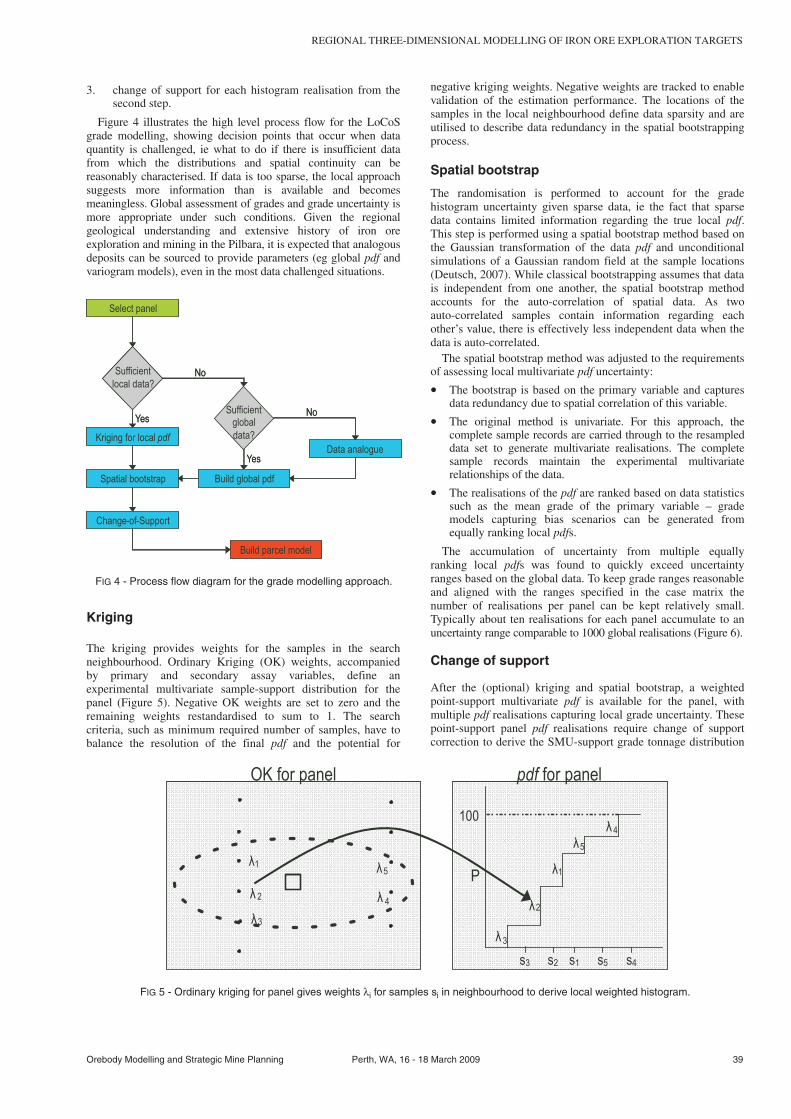
Figure 4 illustrates the high level process flow for the LoCoSgrade modelling, showing decision points that occur when dataquantity is challenged, ie what to do if there is insufficient datafrom which the distributions and spatial continuity can bereasonably characterised. If data is too sparse, the local approachsuggests more information than is available and becomesmeaningless. Global assessment of grades and grade uncertainty ismore appropriate under such conditions. Given the regionalgeological understanding and extensive history of iron oreexploration and mining in the Pilbara, it is expected that analogousdeposits can be sourced to provide parameters (eg global pdf andvariogram models), even in the most data challenged situations.
Kriging
The kriging provides weights for the samples in the searchneighbourhood. Ordinary Kriging (OK) weights, accompaniedby primary and secondary assay variables, define anexperimental multivariate sample-support distribution for thepanel (Figure 5). Negative OK weights are set to zero and theremaining weights restandardised to sum to 1. The searchcriteria, such as minimum required number of samples, have tobalance the resolution of the final pdf and the potential for
negative kriging weights. Negative weights are tracked to enablevalidation of the estimation performance. The locations of thesamples in the local neighbourhood define data sparsity and areutilised to describe data redundancy in the spatial bootstrappingprocess.
Spatial bootstrap
The randomisation is performed to account for the gradehistogram uncertainty given sparse data, ie the fact that sparsedata contains limited information regarding the true local pdf.This step is performed using a spatial bootstrap method based onthe Gaussian transformation of the data pdf and unconditionalsimulations of a Gaussian random field at the sample locations(Deutsch, 2007). While classical bootstrapping assumes that datais independent from one another, the spatial bootstrap methodaccounts for the auto-correlation of spatial data. As twoauto-correlated samples contain information regarding eachother’s value, there is effectively less independent data when thedata is auto-correlated.
The spatial bootstrap method was adjusted to the requirementsof assessing local multivariate pdf uncertainty:
• The bootstrap is based on the primary variable and capturesdata redundancy due to spatial correlation of this variable.
• The original method is univariate. For this approach, thecomplete sample records are carried through to the resampleddata set to generate multivariate realisations. The completesample records maintain the experimental multivariaterelationships of the data.
• The realisations of the pdf are ranked based on data statisticssuch as the mean grade of the primary variable – grademodels capturing bias scenarios can be generated fromequally ranking local pdfs.
The accumulation of uncertainty from multiple equallyranking local pdfs was found to quickly exceed uncertaintyranges based on the global data. To keep grade ranges reasonableand aligned with the ranges specified in the case matrix thenumber of realisations per panel can be kept relatively small.Typically about ten realisations for each panel accumulate to anuncertainty range comparable to 1000 global realisations (Figure 6).
Change of support
After the (optional) kriging and spatial bootstrap, a weightedpoint-support multivariate pdf is available for the panel, withmultiple pdf realisations capturing local grade uncertainty. Thesepoint-support panel pdf realisations require change of supportcorrection to derive the SMU-support grade tonnage distribution
Orebody Modelling and Strategic Mine Planning Perth, WA, 16 - 18 March 2009 39
REGIONAL THREE-DIMENSIONAL MODELLING OF IRON ORE EXPLORATION TARGETS
Sufficientglobal
data?
Select panel
Sufficient
local data?
Kriging for local pdf
Spatial bootstrap
Change-of-Support
Build global pdf
Data analogue
Build parcel model
No
No
Yes
YesSufficient
global
data?
Select panel
Sufficient
local data?
Sufficient
local data?
Kriging for local pdf
Spatial bootstrap
Change-of-Support
Build global pdf
Data analogue
Build parcel model
No
No
Yes
Yes
FIG 4 - Process flow diagram for the grade modelling approach.
ë1
2
3
4
5 P
100
ë1
2
5
4
3
s3 s2 s1 s5 s4
OK for panel pdf for panel
ë
ë
ë
ë
ë
ë
ë
ë
FIG 5 - Ordinary kriging for panel gives weights λi for samples si in neighbourhood to derive local weighted histogram.
for the panel. The change of support is based on the multivariatediscrete Gaussian model (reviewed above – Deraisme, Rivoirardand Carrasco, 2008). In the LoCoS algorithm, a Gaussiananamorphosis is performed on each of the pdf realisations thatwere obtained by the spatial bootstrap process, hence reducingthe strict assumption about the global distribution required intraditional UC. This results in better representation ofproportional effect by LoCoS. Then the change of support isperformed with variance correction factors derived from theLMC.
RESULTS
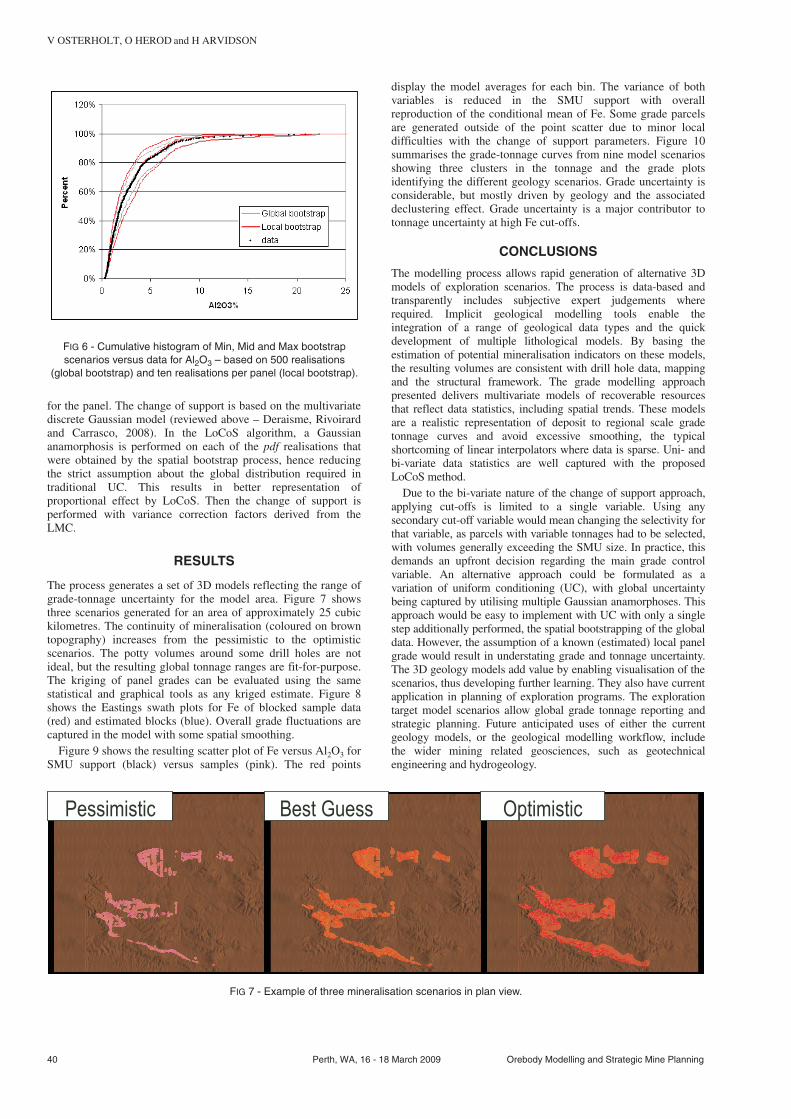
The process generates a set of 3D models reflecting the range ofgrade-tonnage uncertainty for the model area. Figure 7 showsthree scenarios generated for an area of approximately 25 cubickilometres. The continuity of mineralisation (coloured on browntopography) increases from the pessimistic to the optimisticscenarios. The potty volumes around some drill holes are notideal, but the resulting global tonnage ranges are fit-for-purpose.The kriging of panel grades can be evaluated using the samestatistical and graphical tools as any kriged estimate. Figure 8shows the Eastings swath plots for Fe of blocked sample data(red) and estimated blocks (blue). Overall grade fluctuations arecaptured in the model with some spatial smoothing.
Figure 9 shows the resulting scatter plot of Fe versus Al2O3 forSMU support (black) versus samples (pink). The red points
display the model averages for each bin. The variance of bothvariables is reduced in the SMU support with overallreproduction of the conditional mean of Fe. Some grade parcelsare generated outside of the point scatter due to minor localdifficulties with the change of support parameters. Figure 10summarises the grade-tonnage curves from nine model scenariosshowing three clusters in the tonnage and the grade plotsidentifying the different geology scenarios. Grade uncertainty isconsiderable, but mostly driven by geology and the associateddeclustering effect. Grade uncertainty is a major contributor totonnage uncertainty at high Fe cut-offs.
CONCLUSIONS
The modelling process allows rapid generation of alternative 3Dmodels of exploration scenarios. The process is data-based andtransparently includes subjective expert judgements whererequired. Implicit geological modelling tools enable theintegration of a range of geological data types and the quickdevelopment of multiple lithological models. By basing theestimation of potential mineralisation indicators on these models,the resulting volumes are consistent with drill hole data, mappingand the structural framework. The grade modelling approachpresented delivers multivariate models of recoverable resourcesthat reflect data statistics, including spatial trends. These modelsare a realistic representation of deposit to regional scale gradetonnage curves and avoid excessive smoothing, the typicalshortcoming of linear interpolators where data is sparse. Uni- andbi-variate data statistics are well captured with the proposedLoCoS method.
Due to the bi-variate nature of the change of support approach,applying cut-offs is limited to a single variable. Using anysecondary cut-off variable would mean changing the selectivity forthat variable, as parcels with variable tonnages had to be selected,with volumes generally exceeding the SMU size. In practice, thisdemands an upfront decision regarding the main grade controlvariable. An alternative approach could be formulated as avariation of uniform conditioning (UC), with global uncertaintybeing captured by utilising multiple Gaussian anamorphoses. Thisapproach would be easy to implement with UC with only a singlestep additionally performed, the spatial bootstrapping of the globaldata. However, the assumption of a known (estimated) local panelgrade would result in understating grade and tonnage uncertainty.The 3D geology models add value by enabling visualisation of thescenarios, thus developing further learning. They also have currentapplication in planning of exploration programs. The explorationtarget model scenarios allow global grade tonnage reporting andstrategic planning. Future anticipated uses of either the currentgeology models, or the geological modelling workflow, includethe wider mining related geosciences, such as geotechnicalengineering and hydrogeology.
40 Perth, WA, 16 - 18 March 2009 Orebody Modelling and Strategic Mine Planning
V OSTERHOLT, O HEROD and H ARVIDSON
Pessimistic Best Guess Optimistic
FIG 7 - Example of three mineralisation scenarios in plan view.
FIG 6 - Cumulative histogram of Min, Mid and Max bootstrapscenarios versus data for Al2O3 – based on 500 realisations
(global bootstrap) and ten realisations per panel (local bootstrap).

ACKNOWLEDGEMENTS
The authors wish to thank an anonymous peer reviewer forconstructive review of this paper, Sia Khosrowshahi (GolderAssociates) for his help in developing ideas for the grademodelling approach and Richard Mattsson (BHP Billiton) forpractical guidance and motivation. Also thanks to BHP BillitonIron Ore for permission to publish this work.
REFERENCESBabak, O and Deutsch, C V, 2008. Collocated cokriging based on merged
secondary attributes [online], Mathematical Geosciences, DOI10.1007/s11004-008-9192-2. Available from:<http://www.springerlink.com/content/d608565n14813024>.
Berckmans, A and Armstrong, M, 1999. Bootstrapping: A fast way tosimulate QTz curves, Mathematical Geology, 31(4):471-485.
Boucher, A and Dimitrakopoulos, R, 2009. Block simulation of multiplecorrelated variables. Mathematical Geosciences, 41(2), DOI10.1007/s11004-008-9178-0.
Calcagno, P, Chiles, J P, Courrioux, G and Guillen, A, 2008. Geologicalmodelling from field data and geological knowledge: Part I,Modelling method coupling 3D potential-field interpolation andgeological rules, Physics of the Earth and Planetary Interiors,171(1-4):147-157.
Caumon, G and Caers, J K, 2004. Assessment of global uncertainty forearly appraisal of hydrocarbon fields, Society of PetroleumEngineers, paper 89943.
Deraisme, J, Rivoirard, J and Carrasco, P, 2008. Multivariate uniformconditioning and block simulations with discrete gaussian model:Application to Chuquicamata deposit, in Proceedings of the EighthInternational Geostatistics Congress (eds: J M Ortiz and X Emery),pp 69-78.
Deutsch, C V, 2007. A statistical resampling program for correlated data:Spatial_boostrap, paper 401, in Annual Report Centre forComputational Geostatistics, Report 6.
De-Vitry, C, Vann, J and Arvidson, H, 2007. A guide to selecting theoptimal method of resource estimation for multivariate iron oredeposits, in Proceedings Iron Ore 2007, pp 67-78 (The AustralasianInstitute of Mining and Metallurgy: Melbourne).
Goovaerts, P, 1997. Geostatistics for Natural Resources Evaluation,Applied Geostatistics Series, 483 p (Oxford University Press:New York).
Journel, A G and Huijbregts, C J, 1977. Mining Geostatistics, 600 p(Blackburn Press: Caldwell).
Journel, A G and Kyriakidis, P C, 2004. Evaluation of Mineral Reserves:A Simulation Approach, 216 p (Oxford University Press: New York).
Levy, B and Mallet, J L, 1999. Discrete smooth interpolation: Constraineddiscrete fairing for arbitrary meshes [online], GoCAD whitepaper.Available from:<http://alice.loria.fr/publications/papers/1999/smoothing/smoothing.pdf>
Mallet, J L, 1992. Discrete smooth interpolation, Computer Aided DesignJournal, 24(4):263-270.
Nowak, M and Verly G, 2007. A practical process for simulation, withemphasis on gaussian simulation, in Orebody Modelling andStrategic Mine Planning, second edition (ed: R Dimitrakopoulos),pp 129-136 (The Australasian Institute of Mining and Metallurgy:Melbourne).
Rivoirard, J, 1994. Introduction to Disjunctive Kriging and Non-LinearGeostatistics, 180 p (Clarendon Press: Oxford).
Orebody Modelling and Strategic Mine Planning Perth, WA, 16 - 18 March 2009 41
REGIONAL THREE-DIMENSIONAL MODELLING OF IRON ORE EXPLORATION TARGETS
FIG 8 - Eastings swath plot validation for mean panel Fe grades.
FIG 9 - Bivariate validation of Fe versus Al2O3; pink – data, black –SMU, red – average SMU.
FIG 10 - Grade tonnage curves for nine model scenarios.