regal petroleum plc - annualreports.com · regal petroleum plc ... chairman’s review 02...
TRANSCRIPT

23149-02 15-04-2014 Proof 5
Annual Report and Accounts for the year ended 31 December 2013
Regal Petroleum plc
Reg
al Petro
leum p
lc Annual R
eport and
Accounts 2013

23149-02 15-04-2014 Proof 5
Regal Petroleum plc is an independent oil and gas company, quoted on the AIM market of the London Stock Exchange and focused on gas and condensate field development in Ukraine.
Inside this ReportstRategic RePoRt
Principal Development 01
Chairman’s Review 02
Operations Review 04
Finance Review 06
Operational Environment, Principal Risks and Uncertainties
08
goveRnance
Board of Directors 12
Corporate Governance Statement 13
Directors’ Report 14
Independent Auditor’s Report 16
Financials
Consolidated Income Statement 18
Consolidated Statement of Comprehensive Income
19
Company Statement of Comprehensive Income
19
Consolidated Balance Sheet 20
Consolidated Statement of Changes in Equity
21
Consolidated Cash Flow Statement 22
Company Balance Sheet 23
Company Statement of Changes in Equity
24
Company Cash Flow Statement 25
Notes forming part of the financial statements
26
Regal PetRoleum Plc Annual Report and Accounts 2013

23149-02 15-04-2014 Proof 5
ukRaine oPeRations
Despite current events in Ukraine, the Group has been able to operate normally, although the change of Government has resulted in volatility in the Ukrainian Hryvnia exchange rates and uncertainty in the gas sales price
Average production over the year to 31 December 2013 of 185,677 m3/d of gas and 42 m3/d of condensate (1,422 boepd in aggregate) compared to 2012: 201,002 m3/d of gas and 45 m3/d of condensate (1,539 boepd in aggregate)
Well SV-59 on production testing since January 2014, but wells MEX-105 and SV-53 unsuccessful
Upgrade of gas processing facility to improve efficiency and quality of gas produced and provide for recovery of LPG completed
Average LPG production of 20 m3/d from 1 January 2014 to 30 March 2014, providing new revenue stream
Independent report commissioned to assess the Group’s Reserves and Resources as at 31 December 2013 resulting in a reduction in Proved + Probable (2P) remaining Reserves from 31.6 MMboe to 11.7 MMboe
Finance
Revenue for the year from continuing operations of $36.7 million (2012: $41.1 million)
Loss for the year from continuing operations of $127.2 million (2012: $13.0 million profit), principally due to impairment loss of $159.2 million (2012: $nil) on the Group’s oil and gas development and producing asset in Ukraine
Cash generated from operations of $26.5 million (2012: $33.1 million)
Average realised 2013 gas and condensate prices in Ukraine of $415/Mm3 and $91/bbl respectively (2012: $420/Mm3 and $99/bbl respectively)
Cash and cash equivalents at 31 December 2013 of $25.1 million (31 December 2012: $28.5 million), with cash balance at 30 March 2014 of $24.0 million
outlook
Focus on continued geophysical studies to improve understanding of the sub-surface at MEX-GOL and SV fields
Plan to commence drilling of MEX-109 well, workover of SV-61 well and undertake hydraulic fracturing of MEX-120 and MEX-105 wells
Funding of planned 2014 development programme anticipated to be from existing cash and cash equivalents and operational revenues
www.regalpetroleum.com
01
st
ra
te
gic
re
po
rt
go
ve
rn
an
ce
Fin
an
cia
ls
PRinciPal DeveloPmentsstRategic RePoRt

23149-02 15-04-2014 Proof 5
The Group is continuing with the development of our 100% owned and operated Mekhediviska-Golotvshinska (“MEX-GOL”) and Svyrydivske (“SV”) gas and condensate fields in Ukraine. I am pleased to be able to report we continued to operate safely during the period, with no Lost Time Incidents or Restricted Work Cases.
The major events that have taken place in Ukraine during recent months, including the change of Government, have meant that there has been a great deal of uncertainty about the political and economic outlook in Ukraine.
Despite the upheaval, the Group has been able to operate normally, although the change of Government has resulted in volatility in the Ukrainian Hryvnia exchange rates and uncertainty in our realised gas sales price in Ukraine. The internal gas price is generally related to the imported price of gas from Russia, but the previous Government had negotiated a significant discount to the imported gas price. This resulted in a reduction in the internal gas price during the first quarter of 2014, but the Ukrainian authorities have announced that the internal gas price will be increased with effect from 1 April 2014.
As regards the Group’s financial performance, a substantial loss was recorded in 2013, primarily as a result of the reduction in the value in use, and consequent impairment loss relating to the Group’s oil and gas development and producing asset in Ukraine. However cash generated from operations was positive at $26.5 million (2012: $33.1 million).
An updated assessment of our remaining Reserves and Contingent Resources attributable to the Group’s MEX-GOL and SV fields, as at 31 December 2013, was announced on 25 March 2014. In summary, the Proved (1P) Reserves reduced from 7.7 MMboe to 1.9 MMboe and the Proved and Probable (2P) Reserves reduced from 31.6 MMboe to 11.7 MMboe. This reduction in Reserves resulted in the recognition of the impairment loss, and is explained in more detail in the Operations Review below.
Operationally during 2013, we undertook a capital investment programme at our Ukrainian fields, which involved completing the drilling and/or testing of three new wells, undertaking well
workover and hydraulic fracturing operations, upgrading the gas processing facility, installing LPG recovery equipment, upgrading methanol facilities and installing compression equipment.
We completed the hook-up and testing of the SV-53 and MEX-105 wells during the first half of 2013, but unfortunately neither well delivered the anticipated levels of production. The SV-53 well did produce at modest rates, using compression, and underwent a hydraulic fracturing programme but this programme did not improve flow rates, and the well has now ceased producing. The MEX-105 well did not produce hydrocarbons on test and has undergone a well stimulation programme, which included hydraulic jet perforation, but this programme was unsuccessful, and accordingly a hydraulic fracturing programme is being developed to be carried out during 2014.
In the second half of the year, drilling of the SV-59 well was completed and after initial testing, the well was hooked up to the gas processing facility and its performance was monitored during a production testing programme. Flow rates averaged approximately 10,700 m3/d of gas and 15 m3/d of condensate (158 boepd in aggregate) during the production testing period, and the well continues to produce at similar flow rates.
The upgrades to the Group’s gas processing facility, designed to improve the facility’s overall efficiency, incorporate compression equipment, provide for LPG recovery and stabilise condensate production, have been completed, as has the upgrade of methanol equipment at two existing wells and the installation of compression equipment in the field.
With the installation of the LPG recovery equipment, production of LPG commenced at the very end of 2013, and for the period from 1 January 2014 to 30 March 2014, LPG production rates have averaged 20 m3/d (87 boepd).
The Group continues to be supported by Energees Management Limited (“Energees”; part of the Smart Holding Group “Smart”), which has maintained its 54% shareholding in the Company’s issued share capital and continues its support of the Group and its operations in Ukraine.
regal petroleum plc Annual Report and Accounts 2013
02
cHaiRman’s RevieWstRategic RePoRt

23149-02 15-04-2014 Proof 5
Business Review and outlookIn light of the mixed results from the new wells, the Group is undertaking further geophysical studies and has revised its field development plan to reduce the number of new wells and to slow the phasing of its drilling programme. The revision of the field development plan has resulted in a reduction of both the Reserves and the carrying value of the Group’s oil and gas development and producing asset in Ukraine, and a consequent impairment charge in the accounts for the year ended 31 December 2013.
Our focus during 2014 will be to continue the geophysical studies to improve our understanding of the sub-surface within our licences, as well as commencing the drilling of the MEX-109 well, working over the SV-61 well and undertaking hydraulic fracturing of the MEX-120 and MEX-105 wells. Successful completion of these activities, together with continuing analysis of our geological and geophysical data to provide a better understanding of the MEX-GOL and SV reservoirs and their performance, is expected to ultimately help enable us to improve our daily production.
The upgrades to our gas processing facility have improved the efficiency of our gas processing and production, improved the quality of the gas produced and enabled us to recover and sell LPG. Based on our current production, and the resultant revenue we receive for our gas, condensate and LPG sales, we anticipate that our planned 2014 development programme will be funded from existing cash and cash equivalents and operational revenues.
In conclusion, on behalf of the Board, I would like to thank our staff for the continued dedication and support they have shown, particularly during the difficult events in Ukraine over recent months.
keith Henry Executive Chairman
www.regalpetroleum.com
03
st
ra
te
gic
re
po
rt
go
ve
rn
an
ce
Fin
an
cia
ls

23149-02 15-04-2014 Proof 5
Health, safety, environment and security (“Hses”)The Group is committed to maintaining the highest standards of HSES and the effective management of these areas is an intrinsic element of the overall business ethos. Through strict enforcement of the Group’s HSES Management System, together with regular management meetings, training and the appointment of dedicated safety professionals, the Group strives to ensure that the impact of its business activities on its staff, contractors and the environment is as low as is reasonably practicable. The Group reports safety and environmental performance in accordance with industry practice and guidelines.
During 2013, the Group continued to operate safely and did not experience any Lost Time Incidents or Restricted Work Cases.
ukraine operationsasset overviewRegal Petroleum Corporation Limited (a wholly owned subsidiary in the Group) holds a 100% working interest and is the operator of the MEX-GOL and SV fields. The licences are the Group’s sole assets and extend over a combined area of 269 km², approximately 200 km east of Kiev. The two licences are adjacent and the interests are operated and managed as one field.
The fields are located, geologically, towards the middle of the Dnieper-Donets sedimentary basin which extends across the majority of north-east Ukraine. The vast majority of Ukrainian gas and condensate production comes from this basin. The reservoir comprises a series of gently dipping Carboniferous sandstones of Visean age (“B-Sands”) inter-bedded with shales that form stratigraphic traps at around 4,700 metres below the surface, with a gross thickness between 800 metres and 1,000 metres. Analysis suggests that these deposits range from fluvial to deltaic in origin. Below these reservoirs is a thick sequence of shale above deeper, similar, sandstones which are encountered at a depth of around 5,800 metres. These sands are of Tournasian age (“T-Sands”). Deeper sandstones of Devonian age (“D-Sands”) have also been penetrated in the fields.
ProductionThe Group’s average production over the year ended 31 December 2013 was 185,677 m³/d of gas and 42 m³/d of condensate, which equates to a combined total oil equivalent of 1,422 boepd.
The Group’s average production for the period from 1 January 2014 to 30 March 2014 was 156,335 m³/d of gas and 55 m³/d of condensate, which equates to a combined total oil equivalent of 1,321 boepd.
With the installation of the LPG recovery equipment, production of LPG commenced at the very end of 2013, and for the period from 1 January 2014 to 30 March 2014, LPG production rates have averaged 20 m3/d (87 boepd).
operationsThe SV-53 and MEX-105 wells, which were spudded in February 2012 and April 2012 respectively, were completed and tested during the first half of 2013, and another new well, SV-59, was spudded in February 2013. The objective of all three wells was the B-Sands. The new wells were drilled by local Ukrainian drilling contractors, with the Ukrainian drilling rigs being supplemented by the use of selected western technology and equipment designed to improve the efficiency of drilling operations.
Well SV-53 reached its target depth of 5,450 metres in October 2012. The well was hooked up to the gas processing facility in mid-January 2013, and production testing was undertaken using a variety of choke sizes and operating modes. Although initial flow rates were encouraging, they declined very significantly over the testing period. Compression equipment was utilised for a period, before a hydraulic fracturing programme was undertaken on the well in the fourth quarter of 2013 but unfortunately this did not increase flow rates and the well has ceased producing. It is believed that these results reflect the penetration of good quality reservoir sands but of limited lateral extent and volume.
Well MEX-105 reached a depth of 5,228 metres in February 2013. Drilling was terminated 22 metres short of its original target depth as all targeted B-Sands formations had been encountered. The well underwent a production testing programme during the first half of 2013 but did not produce hydrocarbons on test and has undergone a well stimulation programme, which included hydraulic jet perforation, but this programme was unsuccessful. As a result, a hydraulic fracturing programme is being developed to be carried out during 2014.
Well SV-59 was drilled to a depth of 5,470 metres, completed and, after initial testing, hooked up to the gas processing facility in early 2014. Its performance was monitored during a production testing programme, during which flow rates averaged approximately 10,700 m3/d of gas and 15 m3/d of condensate (158 boepd in aggregate), and the well continues to produce at similar flow rates.
A two-phased workover on the GOL-1 well, designed to eliminate the ingress of water was undertaken, but unfortunately, these operations proved unsuccessful and as a result, it has not been possible to bring this well back on production. No further intervention operations are currently planned at this well.
regal petroleum plc Annual Report and Accounts 2013
04
oPeRations RevieWstRategic RePoRt

23149-02 15-04-2014 Proof 5
The MEX-120 well, which was intermittently producing small volumes of hydrocarbons, underwent a hydraulic fracturing programme in February 2014, but unfortunately this programme was suspended after equipment failure. It is intended to conclude the programme later in 2014.
The upgrades to the Group’s gas processing facility, designed to improve the facility’s overall efficiency, incorporate compression equipment, provide for LPG recovery and stabilise condensate production, have been completed, as has the upgrade of methanol equipment at two existing wells and the installation of compression equipment in the field.
2014 Reserves ReportAs a result of the mixed results from the new wells on the MEX-GOL and SV licence areas, the Group decided to undertake further geophysical studies in order to improve the understanding of the sub-surface at such licence areas, and to reduce the number and slow the phasing of its new well drilling programme.
In light of the revision of the current field development plan to reduce and slow the well drilling programme, the Group considered it appropriate to undertake a re-assessment of the Reserves and Resources at the MEX-GOL and SV licence areas.
Accordingly, the Group engaged independent petroleum consultants, ERC Equipoise Limited (“ERCE”), to prepare an updated assessment of the remaining Reserves and Contingent Resources attributable to the Group’s MEX-GOL and SV fields as at 31 December 2013 (the “ERCE Report”).
The ERCE Report, announced on 25 March 2014, is consistent with the Group’s revised field development plans, which comprise the drilling of a further 10 wells, and accords with the March 2007 SPE/WPC/AAPG/SPEE Petroleum Resources Management System standard for classification and reporting.
The ERCE Report estimated the remaining Reserves as at 31 December 2013 in the Visean B-Sands reservoirs of the MEX-GOL and SV fields as follows:
The ERCE Report provides an update on the Group’s Reserves and Resources since the previous Reserves estimation undertaken by ERCE as at 31 December 2012 and takes into account information gathered during the drilling of additional wells in the fields since then. The Gas Initially In Place (“GIIP”) assessment in the ERCE Report remains the same as previously, demonstrating discovered GIIP in the B-Sands reservoirs of 5816 Bscf, but there has been a material reduction in the Proved (1P) and Proved + Probable (2P) categories of remaining Reserves from the previous ERCE estimates which were 7.7 MMboe and 31.6 MMboe respectively. These reductions reflect a reduction in the number (from 27 to 10) and slowing of the phasing of new wells, production since 1 January 2013 of approximately 0.52 MMboe and the down-grading of a portion of volumes
previously booked as Reserves into the Contingent Resources category, reflecting their current immaturity for commercial development. Further evaluation and development of the fields may result in future movement between Contingent Resources and Reserves.
In its Report, ERCE has estimated volumes of discovered gas totalling 1944 Bscf in the deeper T-Sands and D-Sands intervals, but has concluded that there is insufficient information at this time to determine whether the discovered gas is recoverable or not, and hence no Reserves or Contingent Resources have been assigned to these formations. Accordingly, all Reserves and Contingent Resources assessed in the ERCE Report are within the B-Sands reservoirs.
Proved (1P)
Proved + Probable (2P)
Proved + Probable + Possible (3P)
Gas 8.3 Bscf 50.1 Bscf 71.2 BscfCondensate 0.4 MMbbl 2.5 MMbbl 4.1 MMbblLPG 17.4 Mtonnes 105.6 Mtonnes 149.8 Mtonnestotal 1.9 mmboe 11.7 mmboe 17.2 mmboe
The ERCE Report estimated the Contingent Resources in the Visean B-Sands reservoirs of the MEX-GOL and SV fields as follows, based on the potential drilling of up to 113 future wells (not currently budgeted):
Contingent Resources (1C)
Contingent Resources (2C)
Contingent Resources (3C)
Gas 198 Bscf 334 Bscf 519 BscfCondensate 8.5 MMbbl 17.4 MMbbl 32.7 MMbbltotal 41.5 mmboe 73.1 mmboe 119.1 mmboe
www.regalpetroleum.com
05
st
ra
te
gic
re
po
rt
go
ve
rn
an
ce
Fin
an
cia
ls

23149-02 15-04-2014 Proof 5
The Group’s loss from continuing operations for the year ended 31 December 2013 was $127.2 million (2012: $13.0 million profit). This is principally due to the impairment loss of $159.2 million (2012: $nil) on the Group’s oil and gas development and producing asset in Ukraine resulting from the revision of the Group’s field development plan and the reduction in Reserves and Resources referred to earlier in this Report. The Group’s oil and gas development and producing asset in Ukraine was tested for impairment, and in determining the value in use of such asset, a number of assumptions were made. This testing has demonstrated that the residual carrying value of $72.9 million is particularly sensitive to future changes in the gas price and assumptions on discount rate, production levels and successful extension of the production licences until the end of the economic life of the fields, all of which are discussed in more detail in Note 15 to the Accounts.
Revenue from continuing operations, derived from the sale of the Group’s Ukrainian gas and condensate production, was $36.7 million (2012: $41.1 million) due to a combination of lower volumes and lower average prices.
Cash generated from operations was positive at $26.5 million (2012: $33.1 million).
For the year ended 31 December 2013, the average realised gas and condensate prices were $415/Mm3 (UAH3,380 Mm3) and $91/bbl respectively (2012: $420/Mm3 and $99/bbl respectively).
From 1 January 2014, our average realised gas price reduced to $339Mm3 (UAH3,051/Mm3) resulting from negotiations between Russia and Ukraine over the imported gas price. The maximum internal gas prices within Ukraine are set quarterly by the National Electricity Regulatory Commission (“NERC”) and are generally related to the imported price of gas from Russia. The Group’s realised gas price is close to the maximum internal gas price set by NERC. In December 2013, the previous Government of Ukraine negotiated a significant discount to the imported gas price calculated under the longstanding agreement between Russia and Ukraine. However, following the recent change of Government, Russian officials have stated that the discount of the imported gas price is to be reconsidered, and as a consequence, it seems probable that the imported gas price will revert to the price calculated under the longstanding agreement between Russia and Ukraine.
It have been announced by NERC that, with effect from 1 April 2014, the internal gas price will increase to $363/Mm3 (UAH4,020/Mm3 using the exchange rate at 31 March 2014 of UAH11.09/$1.00) for the second quarter of 2014.
The completion of the upgrade to the gas processing facility in late December 2013 to enable recovery of LPG has provided a new revenue stream, and our average realised price for LPG from 1 January 2014 was $440/m3.
Cost of sales for the year ended 31 December 2013 was $33.7 million (2012: $21.4 million). This increase was due to a combination of higher depreciation charges of $17.3 million (2012: $11.0 million) due to the revised Reserves base as at 31 December 2013, the new single subsoil tax charge of $7.2 million (2012: $6.1 million), which came into effect from 1 January 2013 and replaced the previous royalty and subsoil tax regime, and a write down of inventory of $3.0 million (2012: $0.7 million). The Ukrainian authorities have announced that the rates for the single subsoil tax are to be increased in the near future.
Included within finance costs, is a charge for the discounting of long-term purchase tax recoverable from the Ukrainian Government of $0.1 million (2012: finance income from the unwinding of the discount of $2.5 million) due to an increase in the forecast recovery period related to the revised well drilling programme.
The tax credit for the period of $35.8 million (2012: charge of $0.1 million) comprises a current tax charge of $1.5 million (2012: charge of $1.7 million) and a deferred tax credit of $37.3 million (2012: credit of $1.6 million). $32.7 million of the deferred tax credit is due to the impairment loss relating to the Group’s oil and gas development and producing asset, which has resulted in the carrying value of the asset being significantly lower than its tax base. This has resulted in a reversal of the prior year deferred tax liability and the recognition of a deferred tax asset of $28.6 million deemed recoverable against future taxable profits in Ukraine. However, should future field development not result in additional production, only approximately $3 million of the deferred tax asset would be recovered, as discussed in more detail in Note 23 to the Accounts. The remaining $4.6 million credit is a result of the recognition of previously unrecognised tax losses in the Company, which are projected to be utilised against forecast future profits derived from interest on intra-group loans.
regal petroleum plc Annual Report and Accounts 2013
06
Finance RevieWstRategic RePoRt

23149-02 15-04-2014 Proof 5
Capital investment in the Group’s oil and gas development and producing asset for the period was $23.5 million (2012: $19.2 million) which principally reflects the 2013 drilling programme and upgrades to the gas processing facilities in Ukraine.
Cash and cash equivalents held at 31 December 2013 were $25.1 million (31 December 2012: $28.5 million). The Group’s cash and cash equivalents balance at 30 March 2014 was $24.0 million. The movement since 31 December 2013 reflects operational cash generated since that date less capital investment in the asset.
Cash from operations has funded the capital investment during the 2013 year, and the Group’s current cash position and positive operating cash flow are the sources from which the Group expects the 2014 capital investment programme will be funded.
With effect from 1 January 2013, the functional currency of two of the Group’s Ukrainian subsidiaries has changed from US Dollars to Ukrainian Hryvnia. The change was triggered by the increasing influence of the Ukrainian Hryvnia on the subsidiaries’ operations, compared to the prior year. Whilst historically, the majority of the development costs were influenced by US Dollars and Euros, more recently these costs have been predominantly in Ukrainian Hryvnia. In addition, the maximum internal gas price in Ukraine set by NERC, and hence the Group’s revenues, have been less influenced by the US Dollar.
The Interim Report announced on 24 September 2013 used US Dollars as the functional currency of these two Ukrainian subsidiaries. As a result, the carrying value of the Group’s oil and gas development and producing asset in Ukraine, and also the foreign exchange reserve in equity, were overstated by $4.2 million.
The reporting currency of the Group will remain US Dollars.
The recent events in Ukraine have resulted in a significant devaluation of the Ukrainian Hryvnia against the US Dollar, which is likely to affect the carrying value of the Group’s assets in the future.
www.regalpetroleum.com
07
st
ra
te
gic
re
po
rt
go
ve
rn
an
ce
Fin
an
cia
ls
23149-02 15-04-2014 Proof 5
The Group has a risk evaluation methodology in place to assist in the review of the risks across all material aspects of its business. This methodology highlights technical, operational, external and fiduciary risks and assesses the level of risk and potential consequences. It is periodically presented to the Audit Committee and the Board for review, to bring to their attention potential concerns and, where possible, propose mitigating actions. Key risks recognised are detailed below:
Risks relating to ukraineSince November 2013, Ukraine has been subject to political unrest. On 22 February 2014, the Parliament of Ukraine voted for a reinstatement of the 2004 Constitution and dismissal of the incumbent President. New presidential elections are scheduled for May 2014 and a transitional Government has been formed. On 27 February 2014, pro-Russian factions took control of the parliament of Crimea, an autonomous region of Ukraine, which then voted to hold a referendum on the status of Crimea in March 2014. Following this referendum, Crimea was effectively annexed by the Russian Federation. The Group has no assets in Crimea, nor do its operations rely on sales or costs incurred there.
During 2014, the Ukrainian Hryvnia has devalued against major world currencies and significant external financing is required to maintain the country’s economic stability. The National Bank of Ukraine, among other measures, has imposed temporary restrictions on the processing of client payments by banks and on the purchase of foreign currency on the inter-bank market. In February 2014, Ukraine’s sovereign rating was downgraded to CCC with a negative outlook. The impact of the escalation of the crisis in Ukraine-Russia relations and its final resolution are unpredictable and are likely to adversely affect the Ukrainian economy.
These events have not affected the Group’s operations to date, but further escalations of the political crisis may impact the Group’s normal business activities, and increase the risks relating to its business operations, financial status and maintenance of its Ukrainian production licences.
The Ukrainian Government is keen to develop the country’s domestic production of hydrocarbons since Ukraine imports the majority of its gas needs from Russia. Whilst this should put the Group in a well-placed position, as experienced previously, there are significant risks to carrying out business in the country. It is considered that the involvement of Energees, as a major shareholder with extensive experience in Ukraine, has helped to mitigate such risks.
Production risksProducing gas and condensate reservoirs are generally characterised by declining production rates which vary depending upon reservoir characteristics and other factors. Future production of the Group’s gas and condensate reserves, and therefore the Group’s cash flow and income, are highly dependent on the Group’s success in operating existing producing wells, drilling new production wells and efficiently developing and exploiting any reserves, and finding or acquiring additional reserves. The Group may not be able to develop, find or acquire reserves at acceptable costs. The experience gained from drilling undertaken to date highlights such risks as the Group targets the appraisal and production of these hydrocarbons.
Risks relating to further development and operation of the group’s gas and condensate fields in ukraineThe planned development and operation of the Group’s gas and condensate fields in Ukraine is susceptible to appraisal, development and operational risk. This could include, but is not restricted to, delays in delivery of equipment in Ukraine, failure of key equipment, lower than expected production from wells that are currently producing, or new wells that are brought on-stream, problematic wells and complex geology which is difficult to drill or interpret. The generation of significant operational cash is dependent on the successful delivery and completion of the development and operation of the fields. These risks have been demonstrated by the downgrade in the Group’s remaining reserves which has resulted in the reduction in the value in use, and consequent impairment loss relating to the Group’s oil and gas development and producing asset in Ukraine. Furthermore, the optimisation of all of the Group’s assets is dependent on maintaining constructive relationships between all business stakeholders.
exposure to credit, liquidity and cash flow riskThe Group does not currently have any loans outstanding. Local customers are managed in Ukraine and their financial position, past experience and other factors are evaluated. Internal financial projections are regularly made based on the latest estimates available, and various scenarios are run to assess the robustness of the liquidity of the Group. The Group currently holds sufficient cash and cash equivalents for the anticipated short to medium term needs of the business. Whilst much of the future capital requirement is expected to be derived from operational cash generated from production, including from wells yet to be drilled, there is a risk that in the longer term insufficient operational cash is generated, or that additional funding, should the need arise, cannot be secured.
regal petroleum plc Annual Report and Accounts 2013
08
oPeRational enviRonment, PRinciPal Risks anD unceRtaintiesstRategic RePoRt

23149-02 15-04-2014 Proof 5
currency riskThe Group’s main activities are (i) investment into the development of the Group’s Ukrainian gas and condensate asset; (ii) the production and sale of gas, condensate and LPG; and (iii) the continued exploration for further hydrocarbon reserves.
The Group receives sales proceeds in Ukrainian Hryvnia, and the majority of the capital expenditure costs for the 2014 investment programme will be incurred in Hryvnia, thus revenue and costs are largely matched. As with all currencies, the value of the Hryvnia is subject to foreign exchange fluctuations. Currently the Hryvnia does not benefit from the range of currency hedging instruments which are available in more developed economies and, as a result, the Group has adopted a policy that funds not required for use in Ukraine be retained on deposit in the United Kingdom, principally in US Dollars.
During 2014, the Ukrainian Hryvnia has devalued against major world currencies and significant external financing is required to maintain the country’s economic stability. The National Bank of Ukraine, among other measures, has imposed temporary restrictions on the processing of client payments by banks and on the purchase of foreign currency on the inter-bank market. In February 2014, Ukraine’s sovereign rating was downgraded to CCC with a negative outlook. In addition, the recent events in Ukraine, as outlined above in “Risks relating to Ukraine”, are likely to continue to impact the valuation of the Ukrainian Hryvnia against major world currencies. In addition, further devaluation of the Ukrainian Hryvnia against the US Dollar will affect the carrying value of the Group’s assets.
ukraine Production licencesThe Group operates in a region where the right to production can be challenged by State and non-State parties. During 2010, this manifested itself in the form of a Ministry Order instructing the Group to suspend all operations and production from its Ukrainian production licences. Whilst the Ministry Order has now been resolved, the environment is such that a challenge may arise at any time in the future in relation to the Group’s operations, licence history, compliance with licence commitments and/or local regulations. The Group endeavours to ensure compliance with commitments and regulations via Group procedures and controls or, where this is not immediately feasible for practical or logistical considerations, seeks to enter into dialogue with the relevant Government bodies with a view to agreeing a reasonable timeframe for achieving compliance or an alternative, mutually agreeable course of action.
The Group’s production licences for the MEX-GOL and SV field currently expire in 2024. However, in the estimation of its reserves, it is assumed that the field development will continue until the end of the field’s economic life in 2036, and a consequent assumption is made that licence extensions will be granted in accordance with current Ukrainian legislation. Despite such legislation, it is possible that licence extensions will not be granted which would affect the achievement of full economic field development and consequently the carrying value of the Group’s oil and gas development and producing asset in the future.
www.regalpetroleum.com
09
st
ra
te
gic
re
po
rt
go
ve
rn
an
ce
Fin
an
cia
ls

23149-02 15-04-2014 Proof 5
Hydrocarbon price riskThe Group derives its revenue principally from the sale of its Ukrainian gas, condensate and LPG production. These revenues are subject to commodity price volatility and political influence. A prolonged period of low gas, condensate and LPG prices may impact the Group’s ability to maintain its long-term investment programme with a consequent effect on growth rate which in turn may impact the share price or any shareholder returns. Lower gas, condensate and LPG prices may not only decrease the Group’s revenues per unit, but may also reduce the amount of gas, condensate and LPG which the Group can produce economically, as would increases in costs associated with hydrocarbon production, such as subsoil taxes and royalties.
Recently, there has been significant uncertainty about the future gas price in Ukraine, which has been exacerbated by the major political events that have taken place in Ukraine during recent months. The internal gas price has been generally related to the imported price of gas from Russia, but in December 2013, the previous Government of Ukraine negotiated a significant discount to the imported gas price calculated under the longstanding agreement between Russia and Ukraine, which was expected to result in a reduction in the internal gas price during 2014. However, following the recent change of Government, Russian officials have stated that the discount of the imported gas price is to be reconsidered, in which case it seems likely that the imported gas price will revert to the price calculated under the longstanding agreement between Russia and Ukraine, which is likely to be higher over the immediate future. As a result of the continuing uncertainty regarding the internal gas price, it should be recognised that the internal gas price may increase or decline significantly.
The overall economics of the Group’s key asset (being the net present value of the future cash flows from the Ukrainian project) are far more sensitive to long term gas, condensate and LPG prices than short term price volatility. However, short term volatility does affect liquidity risk, as, in the early stage of the project, income from production revenues is offset by capital investment.
industry risksThe Group’s ability to execute its strategy is subject to risks which are generally associated with the oil and gas industry. For example, the Group’s ability to pursue and develop its projects and development programmes depends on a number of uncertainties, including the availability of capital, seasonal conditions, regulatory approvals, gas, oil, condensate and LPG prices, development costs and drilling success. As a result of these uncertainties, it is unknown whether potential drilling locations identified on proposed projects will ever be drilled or whether these or any other potential drilling locations will be able to produce gas, oil or condensate. In addition, drilling activities are subject to many risks, including the risk that commercially productive reservoirs will not be discovered. Drilling for hydrocarbons can be unprofitable, not only due to dry holes, but also as a result of productive wells that do not produce sufficiently to be economic. In addition, drilling and production operations are highly technical and complex activities and may be curtailed, delayed or cancelled as a result of a variety of factors. Furthermore, whilst the Group is committed to maintaining the highest standards of health, safety, environmental and security in its operational activities, hydrocarbon drilling and production operations carry inherent risks, which in the event of an incident may significantly affect the operational, production, financial and/or business activities of the Group.
Financial markets and economic outlook The performance of the Group will be influenced by global economic conditions and, in particular, the conditions prevailing in the United Kingdom and Ukraine. The economies in these regions have been subject to volatile pressures during the period, with the global economy having experienced a long period of difficulties, and more particularly the recent events that have occurred in Ukraine. If these events continue, worsen or recur, the Group may be exposed to increased counterparty risk as a result of business failures in Ukraine or elsewhere and will continue to be exposed if counter-parties fail or are unable to meet their obligations to the Group. The precise nature of all the risks and uncertainties the Group faces as a result of these risks cannot be predicted and many of these are outside of the Group’s control.
regal petroleum plc Annual Report and Accounts 2013
10
oPeRational enviRonment, PRinciPal Risks anD unceRtainties continued
stRategic RePoRt

23149-02 15-04-2014 Proof 5
Risks relating to key personnelThe Group has a relatively small team of executives and senior management. Whilst this is sufficient for a company of this nature, there is a dependency risk relating to the loss of key individuals.
going concern riskThe Group’s business activities, together with the factors likely to affect its future development, performance and position are set out in the Business Review and Outlook section of the Chairman’s Review. The financial position of the Group, its cash flows and liquidity position are described in the Finance Review. In addition, Note 28 to the Accounts includes the Group’s objectives, policies and processes for managing its capital, its financial risk management objectives, and its exposures to credit risk and liquidity risk.
The Group is exposed to risks relating to Ukraine as well as production, hydrocarbon price and the other risks, as detailed in the paragraphs above. In view of this, the Group prepares monthly cash flow forecasts which take into account the risks facing the business, to assess its ability to meet its obligations as they fall due, taking into account the risks of variances in revenues.
Having reviewed the accounts, budgets and forward plans (including sensitivity analysis), the latest operational results, the risks outlined above, and having taken into account the current and recent practice of contracting for drilling services on a fixed-price basis, the absence of long term contractual arrangements relating to drilling, the assessment of well results prior to the entering into firm commitments for future drilling operations and the lower committed expenditure in Ukraine, the Directors continue to believe that the Group is well placed to manage its business risks successfully despite the current uncertain political and economic outlook. The Directors have a reasonable expectation that the Group has adequate resources to continue in operational existence for the foreseeable future. Therefore they continue to adopt the going concern basis of accounting in preparing the annual financial statements.
strategic Report approval The Strategic Report incorporates the Principal Developments, the Chairman’s Review, the Operations Review, the Finance Review and Operational Environment, Principal Risks and Uncertainties.
By Order of the Board
keith Henry Executive Chairman 31 March 2014
www.regalpetroleum.com
11
st
ra
te
gic
re
po
rt
go
ve
rn
an
ce
Fin
an
cia
ls

23149-02 15-04-2014 Proof 5
keith Henryexecutive chairman Keith Henry was appointed as Non-Executive Chairman in April 2008, and took on the role of Executive Chairman in September 2010. Mr Henry has 40 years’ experience in the development, financing, design, construction and management of projects in the oil and gas, process and energy industries, during which time he was Chief Executive of National Power plc, a FTSE100 company, Kvaerner Engineering and Construction Limited, and Brown & Root Limited. Mr Henry is currently Chairman of Mediterranean Oil & Gas plc, Chairman of Greenko Group plc, the senior independent Director of Sterling Energy plc, and non-executive Director of KSK Power Ventur plc and HPR Holdings Limited. As a non-executive director within the energy sector, Mr Henry previously served as Chairman of Burren Energy plc, Chairman of Helius Energy plc, Chairman of Petrojarl ASA, Deputy Chairman of Petroleum Geo-Services ASA, senior independent Director of Emerald Energy plc, and Director of First Calgary Petroleums Limited and Enterprise Oil plc. Mr Henry is a Fellow of the Royal Academy of Engineering and a chartered civil engineer with a BSc degree from London University and a MSc from the University of Birmingham.
Dr alastair grahamnon-executive DirectorAlastair Graham was appointed as Non-Executive Director in January 2010. Dr Graham has over 30 years experience in the oil and gas industry having held a number of senior management roles with BP plc (“BP”), including UK Business Development Manager, Upstream Mergers and Acquisitions Manager, V-P of OAO Sidanco in Russia, leader of BP’s Southern North Sea gas production business, V-P of BP Exploration Alaska and, most recently, leader of BP’s Russia business unit and its shareholder representative for the TNK-BP joint venture. Since retirement from BP in 2009, Dr Graham has provided consultant advisory services in the oil and gas sector. He holds a PhD in Geology from the University of Edinburgh, a MBA from the University of Strathclyde and a MA in Natural Sciences from the University of Cambridge.
adrian coatesnon-executive DirectorAdrian Coates was appointed as Non-Executive Director in July 2008. Mr Coates has many years experience in the investment banking industry, having held senior positions with HSBC Bank plc for 10 years, latterly as Global Sector Head, Resources and Energy Group, Global Banking and Markets Division. He has also held senior roles at UBS, Warrior International and Credit Suisse First Boston, with a specialisation in the natural resources sector. His City
experience is extensive and he has advised on many substantial corporate transactions. Mr Coates is currently the senior independent Director of Polyus Gold International Limited. Mr Coates holds a MA (Econ) from Cambridge University and a MSc (MBA) from London Business School.
alexey Pertinnon-executive DirectorAlexey Pertin was appointed as a Non-Executive Director in April 2011 and is a nominee of Regal Petroleum plc’s majority shareholder, Energees Management Limited. He is currently a Director of Energees Investments Limited and Energees Management Limited and is the Chief Executive Officer of JSC Smart Holding as well as holding Director positions with Adeona Holdings, Smart Holding, Legolas, Metinvest Holding UA and JSC Moldova Steel Works. Previous positions held include CEO of Severstal Emal, and Deputy CEO for Business Development for the Severstal Group. Mr Pertin holds a MBA from Newcastle Business School, England.
alexey timofeyevnon-executive Director Alexey Timofeyev was appointed as a Non-Executive Director in March 2011 and is a nominee of Regal Petroleum plc’s majority shareholder, Energees Management Limited. Mr Timofeyev is currently the Chief Operating Officer of JSC Smart Holding. Prior to joining the Smart Holding Group, Mr Timofeyev held positions at SJSC Naftogaz Ukrainy (the Ukrainian state oil and gas company), Concern Geo-Alliance UA and SC Ukrgazvydobuvannya, a subsidiary of SJSC Naftogaz Ukrainy. Mr Timofeyev holds a degree in International Economic Relations.
sergei glazunovnon-executive DirectorSergei Glazunov was appointed as a Non-Executive Director in February 2012 and is a nominee of Regal Petroleum plc’s majority shareholder, Energees Management Limited. He is currently the Interim Chief Executive Officer and Chief Financial Officer of Smart Energy LLC. Previous positions held include Director of Corporate Development at JSC Smart Holding, Deputy CEO at JSC Concern AVEC & Co and Vice President at JP Morgan Chase and Bank One Investment Management Group. He also has extensive teaching and academic research experience working at Wayne State and Michigan State Universities. Mr Glazunov is a Chartered Financial Analyst and holds an MSc in Mathematics from Kiev State University, a MSc in Statistics from Michigan State University and a MBA from Wayne State University.
12
regal petroleum plc Annual Report and Accounts 2013
BoaRD oF DiRectoRs

23149-02 15-04-2014 Proof 5
Companies on the AIM Market of the London Stock Exchange plc are not required to comply with the UK Corporate Governance Code 2012 and due to its size the Company is not in full compliance. The Directors however, support high standards of corporate governance and will progressively adopt best practices in line with the UK Corporate Governance Code, so far as is practicable.
the BoardThe Board of the Company consists of an Executive Chairman and five Non-Executive Directors. Three of the Non-Executive Directors are nominees of Energees Management Limited, the majority shareholder of the Company. The composition of the Board ensures that no one individual or group dominates the decision making process.
The Board is responsible to the shareholders for setting the direction of the Company through the establishment of strategic objectives and key policies. The Board meets regularly and considers issues of strategic direction, approves major capital expenditure, appoints and monitors senior management and any other matters having a material effect on the Company.
All Directors have access to management, including the Company Secretary, and to such information as is needed to carry out their duties and responsibilities fully and effectively.
Furthermore, all Directors are entitled to seek independent professional advice concerning the affairs of the Company, at its expense. All Directors are subject to election by shareholders at the first opportunity following their appointment. In addition, Directors will retire by rotation and stand for re-election by shareholders at least once every three years in accordance with the Company’s articles of association.
At the date of this report, no Directors have interests in the ordinary shares of the Company.
Remuneration committeeThe Remuneration Committee, comprising solely of independent Non-Executive Directors and the Executive Chairman who is considered to be independent for this role, is responsible for establishing and developing the Company’s general policy on executive and senior management remuneration and determining specific remuneration packages for Executive Directors.
The Remuneration Committee presently comprises Alastair Graham (Chairman), Keith Henry and Adrian Coates.
audit committeeThe Audit Committee, comprising solely of independent Non-Executive Directors and the Executive Chairman who is considered to be independent for this role, meets not less than twice a year and considers the Company’s financial reporting (including accounting policies) and internal financial controls.
Meetings are normally attended, by invitation, by the Chief Financial Officer (who is not on the Board of Directors) and a representative of the Auditors.
The Audit Committee presently comprises Adrian Coates (Chairman), Keith Henry and Alastair Graham.
During the year the Audit Committee commissioned an audit tender process, which resulted in the re-appointment of Deloitte LLP as the Company’s Auditors.
nomination committeeThe Directors do not consider that, given the size of the Board, it is appropriate to have a Nomination Committee. The appropriateness of such a committee, will however be kept under regular review by the Company.
internal controlThe Directors are responsible for the Group’s system of internal control and reviewing its effectiveness. Any such system is designed to manage rather than eliminate the risk of failure to achieve business objectives and can only provide reasonable and not absolute assurance against material misstatement or loss.
Internal controls and business risks were monitored in the course of 2013 through regular Board meetings.
code of conductThe Group complies with the Bribery Act 2010, and maintains high ethical standards in carrying out its business activities regarding dealing with gifts, hospitality, corruption, fraud, the use of inside information and whistle-blowing.
communication with shareholdersThe Board recognises that it is accountable to shareholders for the performance and activities of the Company and the Group.
The twelfth annual meeting of the Company will provide an opportunity for the Directors to present to the shareholders a report on current operations and developments and enable the shareholders to express their views about the Company’s business.
The annual report together with other information about the Group is available on the Group’s website at www.regalpetroleum.com.
13
www.regalpetroleum.com
st
Ra
te
gic
Re
Po
Rt
Fin
an
cia
lsg
ov
eR
na
nc
e
coRPoRate goveRnance statement

23149-02 15-04-2014 Proof 5
The Directors present their annual report and the audited financial statements for the year ended 31 December 2013.
Proposed DividendThe Directors do not recommend the payment of a dividend (2012: $nil).
capital structureDetails of the issued share capital, together with details of the movements in the Company’s issued share capital during the year are shown in Note 24. The Company has one class of ordinary shares which carry no right to fixed income. Each share carries the right to one vote at general meetings of the Company.
There are no specific restrictions on the size of a holding nor on the transfer of shares, which are both governed by the general provisions of the Articles of Association and prevailing legislation. The Directors are not aware of any agreements between holders of the Company’s shares that may result in restrictions on the transfer of securities or on voting rights.
No person has any special rights of control over the Company’s share capital and all issued shares are fully paid.
With regard to the appointment and replacement of Directors, the Company is governed by its Articles of Association (the “Articles”), the Companies Act 2006 and related legislation. The Articles themselves may be amended by special resolution of the shareholders. The powers of Directors are described in the Main Board Terms of Reference, copies of which are available on request, and the Corporate Governance Statement.
Directors and Directors’ interestsThe Directors who held office during the year and subsequently were as follows:
Keith HenryAdrian CoatesAlastair Graham Alexey TimofeyevAlexey PertinSergei Glazunov
None of the Directors who held office at the end of the financial year had any disclosable interest in the shares of the Company or any other Group companies.
According to the register of Directors’ interests, no rights to subscribe for shares in or debentures of Group companies were granted to any of the Directors or their immediate families, or exercised by them, during the financial year.
Directors’ indemnitiesThe Company has made qualifying third party indemnity provisions for the benefit of its Directors which were made during the year and remain in force at the date of this report.
Political contributionsDuring the year the Group did not make any political contributions (2012: $nil).
Post Balance sheet eventsDetails of significant events since the balance sheet date are contained in Note 31.
substantial shareholdersAt 31 March 2014, the Company had been notified of the following interests of 3% or more in its issued share capital:
substantial shareholderNumber of
shares
% of issued ordinary share
capital
Energees Management Limited * 173,128,587 54.00%CTF Holdings Limited 78,337,879 24.43%Pope Asset Management 25,658,991 8.00%
* Energees Management Limited is 100% owned by Pelidona Services Limited, which is 100% owned by Lovitia Investments Ltd, which is 100% owned by Mr V Novinskiy.
14
regal petroleum plc Annual Report and Accounts 2013
DiRectoRs’ RePoRt

23149-02 15-04-2014 Proof 5
Directors’ Responsibilities statementThe Directors are responsible for preparing the annual report and the audited financial statements in accordance with applicable law and regulations.
Company law requires the Directors to prepare financial statements for each financial year. Under that law the Directors are required to prepare the Group financial statements in accordance with International Financial Reporting Standards (“IFRS”s) as adopted by the European Union and have also chosen to prepare the parent company financial statements under IFRSs as adopted by the EU. Under company law the Directors must not approve the accounts unless they are satisfied that they give a true and fair view of the state of affairs of the Company and of the profit or loss of the Company for that period. In preparing these financial statements, International Accounting Standard 1 requires that Directors:
� properly select and apply accounting policies;
� present information, including accounting policies, in a manner that provides relevant, reliable, comparable and understandable information;
� provide additional disclosures when compliance with the specific requirements in IFRSs are insufficient to enable users to understand the impact of particular transactions, other events and conditions on the entity’s financial position and financial performance; and
� make an assessment of the Company’s ability to continue as a going concern.
The Directors are responsible for keeping adequate accounting records which are sufficient to show and explain the Company’s transactions and disclose with reasonable accuracy at any time the financial position of the Company and enable them to ensure that the financial statements comply with the Companies Act 2006. They are also responsible for safeguarding the assets of the Company and hence for taking reasonable steps for the prevention and detection of fraud and other irregularities.
The Directors are responsible for the maintenance and integrity of the corporate and financial information included on the Company’s website. Legislation in the United Kingdom governing the preparation and dissemination of financial statements may differ from legislation in other jurisdictions.
Each of the persons who is a Director at the date of approval of this report confirms that, to the best of their knowledge:
� the financial statements, prepared in accordance with IFRSs, give a true and fair view of the assets, liabilities, financial position and profit or loss of the Company and the undertakings included in the consolidation taken as a whole;
� the Strategic Report includes a fair review of the development and performance of the business and the position of the Company and the undertakings included in the consolidation taken as a whole, together with a description of the principal risks and uncertainties that they face; and
� the annual report and financial statements, taken as a whole, are fair, balanced and understandable and provide the information necessary for shareholders to assess the Company’s performance, business model and strategy.
statement of Disclosure to auditorEach of the persons who is a Director at the date of approval of this annual report confirms that:
� so far as the Director is aware, there is no relevant audit information of which the Company’s Auditor is unaware; and
� the Director has taken all steps required to make himself aware of any relevant audit information and to establish that the Company’s Auditor is aware of that information.
This confirmation is given and should be interpreted in accordance with the provisions of section 418 of the Companies Act 2006.
auditorsA resolution to re-appoint Deloitte LLP as Auditor will be proposed at the next annual general meeting.
By Order of the Board
keith Henry Director 31 March 2014
15
www.regalpetroleum.com
st
ra
te
gic
re
po
rt
Fin
an
cia
lsg
ov
er
na
nc
e

23149-02 15-04-2014 Proof 5
We have audited the financial statements of Regal Petroleum plc for the year ended 31 December 2013 which comprise the Group Income Statement, the Group and Parent Company Statement of Comprehensive Income, the Group and Parent Company Balance Sheets, the Group and Parent Company Cash Flow Statements, the Group and Parent Company Statements of Changes in Equity and the related Notes 1 to 31. The financial reporting framework that has been applied in their preparation is applicable law and International Financial Reporting Standards (“IFRS”s) as adopted by the European Union and, as regards the parent company financial statements, as applied in accordance with the provisions of the Companies Act 2006.
This report is made solely to the Company’s members, as a body, in accordance with Chapter 3 of Part 16 of the Companies Act 2006. Our audit work has been undertaken so that we might state to the Company’s members those matters we are required to state to them in an auditor’s report and for no other purpose. To the fullest extent permitted by law, we do not accept or assume responsibility to anyone other than the Company and the Company’s members as a body, for our audit work, for this report, or for the opinions we have formed.
Respective responsibilities of Directors and auditorAs explained more fully in the Directors’ Responsibilities Statement, the Directors are responsible for the preparation of the financial statements and for being satisfied that they give a true and fair view. Our responsibility is to audit and express an opinion on the financial statements in accordance with applicable law and International Standards on Auditing (UK and Ireland). Those standards require us to comply with the Auditing Practices Board’s Ethical Standards for Auditors.
scope of the audit of the financial statementsAn audit involves obtaining evidence about the amounts and disclosures in the financial statements sufficient to give reasonable assurance that the financial statements are free from material misstatement, whether caused by fraud or error. This includes an assessment of: whether the accounting policies are appropriate to the Group’s and the Parent Company’s circumstances and have been consistently applied and adequately disclosed; the reasonableness of significant accounting estimates made by the Directors; and the overall presentation of the financial statements. In addition, we read all the financial and non-financial information in the annual report to identify material inconsistencies with the audited financial statements and to identify any information that is apparently materially incorrect based on, or materially inconsistent with, the knowledge acquired by us in the course of performing the audit. If we become aware of any apparent material misstatements or inconsistencies we consider the implications for our report.
opinion on financial statementsIn our opinion:
� the financial statements give a true and fair view of the state of the Group’s and of the Parent Company’s affairs at 31 December 2013 and of the Group’s loss for the year then ended;
� the Group financial statements have been properly prepared in accordance with IFRSs as adopted by the European Union;
� the Parent Company financial statements have been properly prepared in accordance with IFRSs as adopted by the European Union and as applied in accordance with the provisions of the Companies Act 2006; and
� the financial statements have been prepared in accordance with the requirements of the Companies Act 2006.
16
regal petroleum plc Annual Report and Accounts 2013
inDePenDent auDitoR’s RePoRt to tHe memBeRs oF Regal PetRoleum Plc

23149-02 15-04-2014 Proof 5
opinion on other matter prescribed by the companies act 2006In our opinion the information given in the Strategic Report and the Directors’ Report for the financial year for which the financial statements are prepared is consistent with the financial statements.
emphasis of matterIn forming our opinion on the financial statements, which is not modified, we have considered the adequacy of the disclosures made: in the Principal Risks and Uncertainties section of the Strategic Report; and in Note 2 Critical Accounting Estimates and Assumptions to the financial statements.
The impact of the continuing economic crisis and political turmoil in Ukraine and their final resolution are unpredictable, and represent material uncertainties, and may adversely affect the Ukrainian economy and the operations of the Group. Our opinion is not qualified in respect of this matter.
matters on which we are required to report by exceptionWe have nothing to report in respect of the following matters where the Companies Act 2006 requires us to report to you if, in our opinion:
� adequate accounting records have not been kept by the Parent Company, or returns adequate for our audit have not been received from branches not visited by us; or
� the Parent Company financial statements are not in agreement with the accounting records and returns; or
� certain disclosures of Directors’ remuneration specified by law are not made; or
� we have not received all the information and explanations we require for our audit.
graham Hollis aca (senior statutory auditor) for and on behalf of Deloitte LLP Chartered Accountants and Statutory Auditor London, United Kingdom 31 March 2014
17
Go
ve
rn
an
ce
www.regalpetroleum.com
st
ra
te
Gic
re
po
rt
Fin
an
cia
ls

23149-02 15-04-2014 Proof 5
Note2013$000
2012$000
continuing operationsRevenue 3 36,737 41,103Cost of sales 4 (33,664) (21,407)gross profit 3,073 19,696Administrative expenses 4 (7,291) (9,490)Other operating expenses: impairment of property, plant and equipment 15 (159,199) —operating (loss)/profit (163,417) 10,206Interest income 8 861 1,056Other finance income 8 — 2,485Finance costs 9 (633) (397)Other gains and losses 5 269 (231)(loss)/profit on ordinary activities before taxation 4 (162,920) 13,119Income tax credit/(charge) 10 35,757 (78)(loss)/profit for the year from continuing operations (127,163) 13,041
Discontinued operationsLoss for the year from discontinued operations 11 — (1,400)
(loss)/profit for the year (127,163) 11,641
(loss)/earnings per ordinary share (cents) from continuing operationsBasic and diluted 13 (39.7)c 4.1c(loss)/earnings per ordinary share (cents) from total operationsBasic and diluted 13 (39.7)c 3.6c
18
regal petroleum plc Annual Report and Accounts 2013
consoliDateD income statementfor the year ended 31 December 2013
23149-02 15-04-2014 Proof 5
2013$000
*Restated2012$000
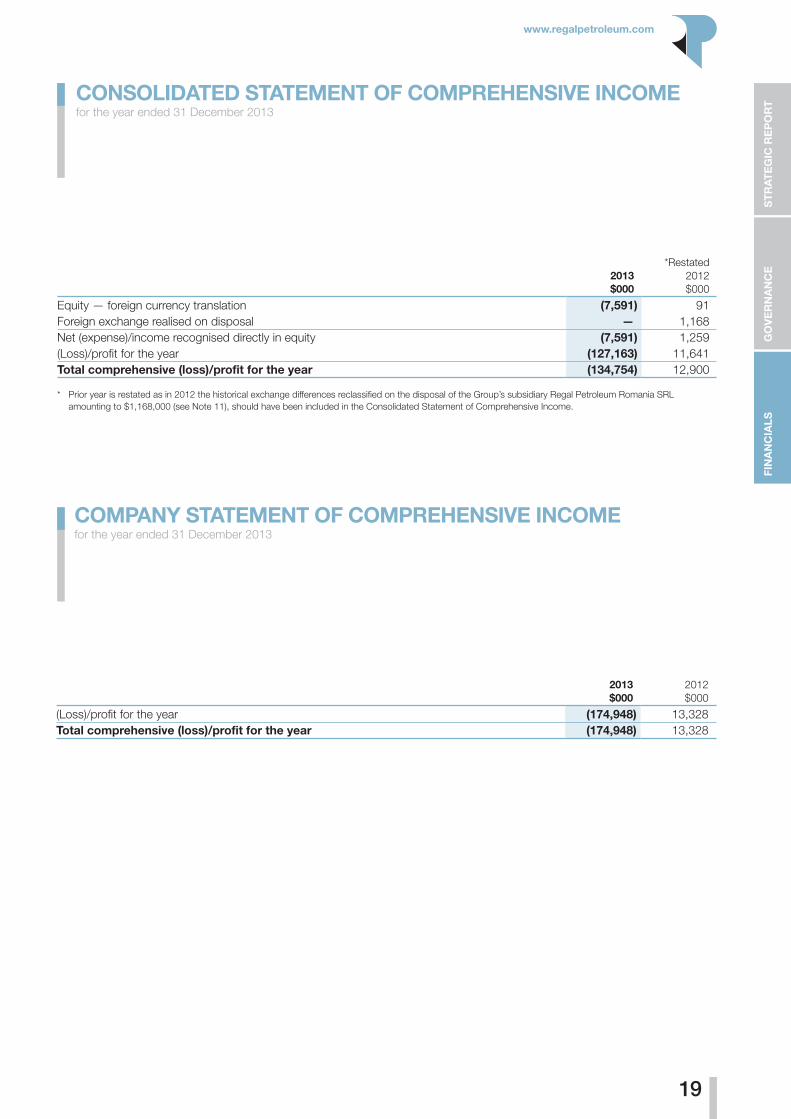
Equity — foreign currency translation (7,591) 91Foreign exchange realised on disposal — 1,168Net (expense)/income recognised directly in equity (7,591) 1,259(Loss)/profit for the year (127,163) 11,641total comprehensive (loss)/profit for the year (134,754) 12,900
* Prior year is restated as in 2012 the historical exchange differences reclassified on the disposal of the Group’s subsidiary Regal Petroleum Romania SRL amounting to $1,168,000 (see Note 11), should have been included in the Consolidated Statement of Comprehensive Income.
2013$000
2012$000
(Loss)/profit for the year (174,948) 13,328total comprehensive (loss)/profit for the year (174,948) 13,328
19
go
ve
Rn
an
ce
www.regalpetroleum.com
st
Ra
te
gic
Re
Po
Rt
Fin
an
cia
ls
consoliDateD statement oF comPReHensive incomefor the year ended 31 December 2013
comPany statement oF comPReHensive incomefor the year ended 31 December 2013

23149-02 15-04-2014 Proof 5
Note2013$000
2012$000
assetsnon-current assetsIntangible assets 14 144 65Property, plant and equipment 15 73,405 233,508Trade and other receivables 18 5,953 7,014Inventory 17 1,115 2,390Deferred tax 23 36,353 3,169
116,970 246,146current assetsInventory 17 3,872 7,620Trade and other receivables 18 9,553 17,535Cash and cash equivalents 19 25,084 28,453
38,509 53,608total assets 155,479 299,754liabilitiescurrent liabilitiesTrade and other payables 20 (3,222) (3,044)Provisions 22 (262) (761)
(3,484) (3,805)net current assets 35,025 49,803non-current liabilitiesProvisions 22 (1,631) (6,776)Deferred tax 23 — (4,055)
(1,631) (10,831)total liabilities (5,115) (14,636)net assets 150,364 285,118equityCalled up share capital 24 28,115 28,115Share premium account 555,090 555,090Other reserves 25 (1,899) 5,692Retained deficit (430,942) (303,779)total equity 150,364 285,118
The financial statements of Regal Petroleum plc, company number 4462555, were approved by the Board of Directors and authorised for issue on 31 March 2014. They were signed on its behalf by:
keith Henry Director
20
regal petroleum plc Annual Report and Accounts 2013
consoliDateD Balance sHeetat 31 December 2013

23149-02 15-04-2014 Proof 5
Sharecapital
$000
Sharepremiumaccount
$000
Mergerreserve
$000
Capital contributions
$000
RestatedForeign
exchangereserve*
$000
RestatedRetained
deficit*$000
Total$000
At 1 January 2012 28,115 555,090 (3,204) 7,477 160 (315,420) 272,218Retained profit for the year — — — — — 11,641 11,641Other comprehensive income — — — — 1,259 — 1,259At 31 December 2012 28,115 555,090 (3,204) 7,477 1,419 (303,779) 285,118
* Prior year is restated as in 2012 the historical exchange differences reclassified on the disposal of the Group’s subsidiary Regal Petroleum Romania SRL amounting to $1,168,000 (see Note 11), should have been included in the Consolidated Statement of Comprehensive Income.
sharecapital
$000
sharepremiumaccount
$000
mergerreserve
$000
capital contributions
$000
Foreign exchange
reserve$000
Retaineddeficit
$000total$000
At 1 January 2013 28,115 555,090 (3,204) 7,477 1,419 (303,779) 285,118Retained loss for the year — — — — — (127,163) (127,163)Exchange differences — — — — (7,591) — (7,591)at 31 December 2013 28,115 555,090 (3,204) 7,477 (6,172)† (430,942) 150,364
† Predominantly as a result of exchange differences on intra group loans and other retranslation, where the subsidiaries’ functional currency is not US Dollar.
21
Go
ve
rn
an
ce
www.regalpetroleum.com
st
ra
te
Gic
re
po
rt
Fin
an
cia
ls
consoliDateD statement oF cHanges in equityat 31 December 2013

23149-02 15-04-2014 Proof 5
Note2013$000
2012$000
operating activitiesCash from operations 27 26,490 33,119Interest paid — (7)Taxation paid (1,921) (2,042)Interest received 861 1,003net cash from operating activities 25,430 32,073investing activitiesProceeds from sale of discontinued operations — 764Purchase tax recovery relating to sale of discontinued operation — 2,522Purchase of property, plant and equipment (18,999) (19,274)Increase in related purchase tax receivable (4,765) (4,511)Purchase of intangible assets (103) (197)Purchase of materials inventory relating to development and producing asset (5,701) (3,115)Proceeds from sale of materials inventory 706 664Equipment rental income 209 282Proceeds from sale of property, plant and equipment 185 37net cash used in investing activities (28,468) (22,828)net (decrease)/increase in cash and cash equivalents (3,038) 9,245cash and cash equivalents at beginning of year 28,453 19,705Effect of foreign exchange rate changes (331) (497)cash and cash equivalents at end of year 19 25,084 28,453
22
regal petroleum plc Annual Report and Accounts 2013
consoliDateD casH FloW statementfor the year ended 31 December 2013

23149-02 15-04-2014 Proof 5
Note2013$000
2012$000
assetsnon-current assetsIntangible assets 14 — 5Property, plant and equipment 15 15 45Investments 16 17,279 17,279Loans to subsidiary undertakings 16 70,707 244,756Deferred tax 23 7,807 3,169
95,808 265,254current assetsTrade and other receivables 18 257 2,583Cash and cash equivalents 19 16,892 20,999
17,149 23,582total assets 112,957 288,836liabilitiescurrent liabilitiesTrade and other payables 20 (238) (647)Provisions 22 — (522)
(238) (1,169)net current assets 16,911 22,413total liabilities (238) (1,169)net assets 112,719 287,667equityCalled up share capital 24 28,115 28,115Share premium account 555,090 555,090Retained deficit (470,486) (295,538)shareholders’ funds 112,719 287,667
These financial statements of Regal Petroleum plc, company number 4462555, were approved by the Board of Directors and authorised for issue on 31 March 2014. They were signed on its behalf by:
keith Henry Director
23
Go
ve
rn
an
ce
www.regalpetroleum.com
st
ra
te
Gic
re
po
rt
Fin
an
cia
ls
comPany Balance sHeetat 31 December 2013

23149-02 15-04-2014 Proof 5
Sharecapital
$000
Sharepremiumaccount
$000
Retaineddeficit$000
Total$000
At 1 January 2012 28,115 555,090 (308,866) 274,339Retained profit for the year — — 13,328 13,328At 31 December 2012 28,115 555,090 (295,538) 287,667
sharecapital
$000
sharepremiumaccount
$000
Retaineddeficit
$000total$000
At 1 January 2013 28,115 555,090 (295,538) 287,667Retained loss for the year — — (174,948)* (174,948)at 31 December 2013 28,115 555,090 (470,486) 112,719
* See Note 16, which shows the results for the year were affected by the provision against subsidiary loans.
24
regal petroleum plc Annual Report and Accounts 2013
comPany statement oF cHanges in equityat 31 December 2013

23149-02 15-04-2014 Proof 5
Note2013$000
2012$000
operating activitiesCash used in operations 27 (1,534) (3,536)Interest received 49 37net cash used in operating activities (1,485) (3,499)investing activitiesPurchase of property, plant and equipment (4) —Proceeds from sale of discontinued operation — 764Purchase tax recovery relating to sale of discontinued operation — 2,522Investment in Group companies 16 (2,763) (2,837)Repayment of loans to Group companies 16 — 11,274net cash (used in)/provided by investing activities (2,767) 11,723net (decrease)/increase in cash and cash equivalents (4,252) 8,224cash and cash equivalents at beginning of year 20,999 12,897Effect of foreign exchange rate changes 145 (122)cash and cash equivalents at end of year 19 16,892 20,999
25
Go
ve
rn
an
ce
www.regalpetroleum.com
st
ra
te
Gic
re
po
rt
Fin
an
cia
ls
comPany casH FloW statementfor the year ended 31 December 2013

23149-02 15-04-2014 Proof 5
1. accounting PoliciesRegal Petroleum plc is a company quoted on the AIM Market of the London Stock Exchange plc and incorporated in England and Wales under the Companies Act 2006. The registered office is 16 Old Queen Street, London, SW1H 9HP and the Company’s registered number is 4462555. The principal activities of the Group and the nature of the Group’s operations are set out in the Directors’ Report. The following accounting policies have been applied consistently in dealing with items which are considered material in relation to the Group’s financial statements.
going concernThe financial statements have been prepared in accordance with the going concern basis of accounting. The use of this basis of accounting takes into consideration the Company’s and the Group’s current and forecast financing position, additional details of which are provided in the Going Concern section of the Directors’ Report.
Basis of Preparation The Group has prepared its financial statements under IFRSs, as adopted by the European Union. The financial statements are prepared on the historical cost basis except for the valuation of financial assets.
adoption of new standards and interpretationsIn the current year, the following new and revised Standards and Interpretations have been adopted. Their application has not had any significant impact on the amounts reported or the disclosures in these financial statements.
� Amendments to IFRS 7 on Financial instruments asset and liability offsetting (effective 1 January 2013) — the Group does not have any offsetting arrangements in place.
� IFRS 11 and amendments, Joint Arrangements — the Group does not have any joint arrangements.
� IAS 28 (as revised in 2011), amendments, Investments in Associates and Joint Ventures – the Group does not have any associates.
� IFRS 13, Fair Value Measurements – the application of IFRS 13 has not had any material impact on the amounts recognised in the financial statements.
At the date of authorisation of these financial statements, the following Standards and Interpretations which have not been applied in these financial statements were in issue but not yet effective (and in some cases had not yet been adopted by the European Union:
� IFRS 10 (amendments) Consolidated Financial Statements
� IFRS 10 and 12 Consolidated Financial Statements and Disclosures of Interests in Other Entities
� IAS 27 (amendments) Investment Entities
� IAS 36 (amendments) Recoverable Amount Disclosures for Non-Financial Assets
� IAS 39 (amendments) Novation of Derivatives and Continuation of Hedge Accounting
� IFRIC Interpretation 21 Levies
The Directors do not expect that the adoption of the Standards and Interpretations listed above will have a material impact on the financial statements of the Group in future periods.
Beyond the information above, it is not practicable to provide a reasonable estimate of the effect of these standards until a detailed review has been completed.
No new standards or interpretations were early adopted by the Group during the year.
Basis of consolidation The consolidated financial information incorporates the financial information of the Company and entities controlled by the Company (and its subsidiaries) made up to 31 December each year. Control is achieved where the Company has the power to govern the financial and operating policies of an investee entity so as to obtain benefits from its activities.
26
regal petroleum plc Annual Report and Accounts 2013
notes forming part of the financial statements

23149-02 15-04-2014 Proof 5
1. accounting Policies continued
Subsidiaries
The acquisition of subsidiaries is accounted for using the acquisition method. On acquisition, the assets, liabilities and contingent liabilities of a subsidiary are measured at their fair values at the date of acquisition. Any excess of cost of acquisition over the fair values of the identifiable net assets acquired is recognised as goodwill, any deficiency of the cost of acquisition below the fair values of the identifiable net assets acquired (i.e. discount on acquisition) is credited to the income statement in the period of acquisition. The results of subsidiaries acquired or disposed of during the year are included in the consolidated income statement from the effective date of acquisition or up to the effective date of disposal, as appropriate. All intra-group transactions, balances, income and expenses are eliminated on consolidation.
commercial ReservesProved and probable oil and gas reserves are estimated quantities of commercially producible hydrocarbons which the existing geological, geophysical and engineering data show to be recoverable in future years from known reservoirs. The proved and probable reserves included herein conform to the definition approved by the Petroleum Resources Management System.
oil and gas Development and Producing assets The Group applies the successful efforts method of accounting for oil and gas assets, having regard to the requirements of IFRS 6 “Exploration for and Evaluation of Mineral Resources”.
All licence acquisition, exploration and evaluation costs are initially capitalised as intangible assets in cost centres by field or by exploration area, as appropriate, pending determination of commerciality of the relevant property. Directly attributable administration costs are capitalised insofar as they relate to specific exploration activities, as are finance costs to the extent they are directly attributable to financing development projects. Pre-licence costs and general exploration costs not specific to any particular licence or prospect are expensed as incurred.
If prospects are deemed to be impaired (‘unsuccessful’) on completion of the evaluation, the associated costs are charged to the Income Statement. If the field is determined to be commercially viable, the attributable costs are transferred to development/production assets within property, plant and equipment in single field cost centres.
Subsequent expenditure is capitalised only where it either enhances the economic benefits of the development/producing asset or replaces part of the existing development/producing asset.
Net proceeds from any disposal of an exploration asset are initially credited against the previously capitalised costs. Any surplus proceeds are credited to the Income Statement. Net proceeds from any disposal of development/producing assets are credited against the previously capitalised cost. A gain or loss on disposal of a development/producing asset is recognised in the Income Statement to the extent that the net proceeds exceed or are less than the appropriate portion of the net capitalised costs of the asset.
Depreciation, depletion and amortisation
All expenditure carried within each field is amortised from the commencement of commercial production on a unit of production basis, which is the ratio of oil and gas production in the period to the estimated quantities of commercial reserves at the end of the period plus the production in the period, generally on a field by field basis. In certain circumstances, fields within a single development area may be combined for depletion purposes. Costs used in the unit of production calculation comprise the net book value of capitalised costs plus the estimated future field development costs necessary to bring the reserves into production.
Impairment
At each balance sheet date, the Group reviews the carrying amount of development and producing assets to determine whether there is any indication that those assets have suffered an impairment loss. This includes exploration and appraisal costs capitalised which are assessed for impairment in accordance with IFRS 6. If any such indication exists, the recoverable amount of the asset is estimated in order to determine the extent of the impairment loss.
27
go
ve
Rn
an
ce
www.regalpetroleum.com
st
Ra
te
gic
Re
Po
Rt
Fin
an
cia
ls

23149-02 15-04-2014 Proof 5
1. accounting Policies continued
For development/producing assets, the recoverable amount is the greater of fair value/market value less costs to sell and value in use. In assessing value in use, the estimated future cash flows are discounted to their present value using a pre-tax discount rate that reflects current market assessments of the time value of money and the risks specific to the asset. If the recoverable amount of an asset is estimated to be less than its carrying amount, the carrying amount of the asset is reduced to its recoverable amount. Impairment losses are recognised as an expense immediately.
Should an impairment loss subsequently reverse, the carrying amount of the asset is increased to the revised estimate of its recoverable amount, but so that the increased carrying amount does not exceed the carrying amount that would have been determined had no impairment loss been recognised for the asset in prior years. A reversal of an impairment loss is recognised as income immediately.
Decommissioning Where a material liability for the removal of existing production facilities and site restoration at the end of the productive life of a field exists, a provision for decommissioning is recognised. The amount recognised is the present value of estimated future expenditure determined in accordance with local conditions and requirements. The cost of the relevant property, plant and equipment is increased with an amount equivalent to the provision and depreciated on a unit of production basis. Changes in estimates are recognised prospectively, with corresponding adjustments to the provision and the associated fixed asset. The unwinding of the discount on the decommissioning provision is included within finance costs.
intangible assets other than oil and gas assets Intangible assets other than oil and gas assets are stated at cost less accumulated amortisation and any provision for impairment. These assets represent intangible computer software. Amortisation is charged so as to write off the cost, less estimated residual value on a straight-line basis of 20-25% per annum.
Property, Plant and equipment other than oil and gas assets Property, plant and equipment other than oil and gas assets are stated at cost less accumulated depreciation and any provision for impairment. Depreciation is charged so as to write off the cost, less estimated residual value, of assets on a straight-line basis over their useful lives as follows:
Fixtures, fittings and equipment : 20-25% per annum straight line Motor vehicles : 20-25% per annum straight line Plant and machinery : 20-25% per annum straight lineFreehold buildings : 4% per annum straight line
non-current assets Held for saleNon-current assets (and disposal groups) classified as held for sale are measured at the lower of carrying amount and fair value less costs to sell.
Non-current assets and disposal groups are classified as held for sale if their carrying amounts will be recovered through a sale transaction rather than through continuing use. This condition is regarded as met only when the sale is highly probable and the asset (or disposal group) is available for immediate sale in its present condition subject only to terms that are usual and customary for sales of such assets. Management must be committed to the sale, which should be expected to qualify for recognition as a completed sale within one year from the date of classification as held for sale.
inventories Inventories typically consist of materials and hydrocarbons, and are stated at the lower of weighted average cost and net realisable value. Net realisable value represents the estimated selling price less all estimated costs of completion and costs to be incurred in marketing, selling and distribution.
28
regal petroleum plc Annual Report and Accounts 2013
notes forming part of the financial statements continued

23149-02 15-04-2014 Proof 5
1. accounting Policies continued
Revenue Recognition Turnover represents amounts invoiced in respect of sales of oil and gas exclusive of indirect taxes and excise duties and is recognised on delivery of product. To the extent that revenue arises from test production during an evaluation programme, an amount is charged from intangible exploration assets to cost of sales so as to reflect a zero net margin. Interest income is accrued on a time basis, by reference to the principal outstanding and at the effective rate applicable, which is the rate that exactly discounts estimated future cash receipts through the expected life of the financial asset to that asset’s net carrying amount.
Foreign currenciesThe Group’s consolidated accounts and those of the Company are presented in US Dollars. The functional currency of the subsidiaries which operate in Ukraine is Ukrainian Hryvnia. The remaining entities have US Dollars as their functional currency.
The functional currency of individual companies is determined by the primary economic environment in which the entity operates, normally the one in which it primarily generates and expends cash. In preparing the financial statements of the individual companies, transactions in currencies other than the entity’s functional currency (“foreign currencies”) are recorded at the rates of exchange prevailing on the dates of the transactions. At each balance sheet date, monetary assets and liabilities that are denominated in foreign currencies are retranslated at the rates prevailing on the balance sheet date. Non-monetary assets and liabilities carried at fair value that are denominated in foreign currencies are translated at the rates prevailing at the date when the fair value was determined. Non-monetary items which are measured in terms of historical cost in a foreign currency are not retranslated. Gains and losses arising on retranslation are included in net profit or loss for the period, except for exchange differences arising on balances which are considered long term investments where the changes in fair value are recognised directly in equity.
On consolidation, the assets and liabilities of the Group’s subsidiaries which do not use US Dollars as their functional currency are translated into US Dollars at exchange rates prevailing on the balance sheet date. Income and expense items are translated at the average exchange rates for the period unless exchange rates fluctuate significantly. Exchange differences arising, if any, are classified as equity and are recognised in the Group’s foreign exchange reserve. Such translation differences are recognised as income or as expenses in the period in which the operation is disposed of.
With effect from 1 January 2013, the functional currency of two of the Group’s Ukrainian subsidiaries has changed from US Dollars to Ukrainian Hryvnia. The change was triggered by the increasing influence of the Ukrainian Hryvnia on the subsidiaries’ operations. Whilst historically, the majority of the development costs were influenced by US Dollars and Euro, more recently these costs are predominantly in Ukrainian Hryvnia. In addition, the internal gas price in Ukraine is set by the National Electricity Regulatory Commission, and hence the Group’s revenues, have been less influenced by the US Dollar than in previous years.
PensionsThe Group operates a defined contribution pension scheme. The assets of the scheme are held separately from those of the Group in an independently administered fund. The amount charged to the income statement represents the contributions payable to the scheme in respect of the accounting period.
In addition to the defined contribution pension scheme in the United Kingdom, the Group contributes to a local government pension scheme within Ukraine. The Group has no further payment obligations towards the local government pension scheme once the contributions have been paid.
leases Leases are classified as finance leases whenever the terms of the lease transfer substantially all the risks and rewards of ownership to the lessee. All other leases are classified as operating leases.
Assets held under finance leases are recognised as assets of the Group at their fair value or, if lower, at the present value of the minimum lease payments, each determined at the inception of the lease. The corresponding liability is included on the balance sheet as a finance lease obligation. Lease payments are apportioned between finance charges and reduction of the lease obligation so as to achieve a constant rate of interest on the remaining balance of the liability. Finance charges are charged directly against income, unless they are directly attributable to qualifying assets, in which case they are capitalised in accordance with the Group’s policy on borrowing costs (see below).
29
go
ve
Rn
an
ce
www.regalpetroleum.com
st
Ra
te
gic
Re
Po
Rt
Fin
an
cia
ls

23149-02 15-04-2014 Proof 5
1. accounting Policies continued
Rentals payable/receivable under operating leases are charged/credited to the income statement on a straight-line basis over the term of the relevant lease. Benefits received or given as an incentive to enter into an operating lease are also spread on a straight-line basis over the lease term.
taxation The tax expense represents the sum of the tax currently payable and deferred tax.
Current tax, including UK corporation and overseas tax, is provided at amounts expected to be paid (or recovered) using the tax rates and laws that have been enacted or substantially enacted by the balance sheet date.
Deferred tax is the tax expected to be payable or recoverable on differences between the carrying amounts of assets and liabilities in the financial statements and the corresponding tax bases used in the computation of taxable profit, and is accounted for using the balance sheet liability method. Deferred tax liabilities are generally recognised for all taxable temporary differences and deferred tax assets are recognised to the extent that it is probable that taxable profits will be available against which deductible temporary differences can be utilised. Such assets and liabilities are not recognised if the temporary difference arises from goodwill or from the initial recognition (other than in a business combination) of other assets and liabilities in a transaction that affects neither the tax profit nor the accounting profit.
Deferred tax liabilities are recognised for taxable temporary differences arising on investments in subsidiaries and associates, and interests in joint ventures, except where the Group is able to control the reversal of the temporary difference and it is probable that the temporary difference will not reverse in the foreseeable future.
Deferred tax is calculated at the tax rates which are expected to apply in the period when the liability is settled or the asset is realised. Deferred tax is charged or credited in the income statement, except when it relates to items charged or credited directly to equity, in which case the deferred tax is also dealt with in equity.
Other taxes which include recoverable value added tax, sales tax and custom duties represent the amounts receivable or payable to local tax authorities in the countries where the Group operates.
Financial instruments Financial assets and financial liabilities are recognised on the Group’s balance sheet when the Group becomes a party to the contractual provisions of the instrument. The Group does not currently utilise derivative financial instruments.
Trade Receivables
Trade receivables do not carry any interest and are stated at their nominal value as reduced by appropriate allowances for estimated irrecoverable amounts.
Investments
Investments in subsidiaries are stated at cost and reviewed for impairment if there are indications that the carrying value may not be recoverable.
Trade Payables
Trade payables are not interest bearing and are stated at their nominal value.
Bank Borrowings and Loan Notes
Interest-bearing bank borrowings and loan notes are recorded at the proceeds received, net of direct transaction costs. Direct transaction costs are accounted for on an amortised cost basis in profit and loss using the effective interest method and are added/deducted to/from the carrying amount of the instrument to the extent that they are not settled in the period in which they arise.
Equity Instruments
Equity instruments issued by the Company and the Group are recorded at the proceeds received, net of direct issue costs.
30
regal petroleum plc Annual Report and Accounts 2013
notes forming part of the financial statements continued

23149-02 15-04-2014 Proof 5
1. accounting Policies continued
Finance costs and DebtBorrowing costs directly attributable to the acquisition, construction or production of qualifying assets, which are assets that necessarily take a substantial period of time to get ready for their intended use or sale, are added to the cost of those assets, until such time as the assets are substantially ready for their intended use or sale.
Finance costs of debt are allocated to periods over the term of the related debt at the effective interest rate on the carrying amount. Directly attributable transaction costs are deducted from the debt proceeds on initial recognition of the liability and are amortised and charged to the income statement as finance costs over the term of the debt.
All other borrowing costs are expensed as incurred.
cash and cash equivalentsCash and cash equivalents comprise cash on hand and demand deposits and other short term highly liquid investments which are readily convertible to a known amount of cash and are subject to an insignificant risk of changes in value.
2. critical accounting estimates and assumptionsThe Group makes estimates and assumptions concerning the future. The resulting accounting estimates will, by definition, seldom equal the related actual results. The estimates and assumptions which have a risk of causing material adjustment to the carrying amounts of assets and liabilities within the next financial year are discussed below.
(a) Recoverability of Development and Production assets in ukraineAccording to the Group’s accounting policies, costs capitalised as assets are assessed for impairment at each balance sheet date. In assessing whether an impairment loss has occurred, the carrying value of the asset is compared to its recoverable amount, which IAS 36 defines as the higher of fair value less cost to sell and value in use. Management does not believe it possible to measure fair value reliably, due to both the absence of an active market in which to sell the asset and the current political and economic climate in Ukraine. Therefore, as in previous years, management has used value in use, using a discounted cash flow model to measure its recoverable amount. This requires judgement in the following areas:
(i) Sales price — As outlined in the Finance Review and Principal Risks and Uncertainties sections of the Strategic Report, the Ukraine gas price was significantly lower from 1 January 2014. However, it has been announced by the Ukrainian authorities that the gas price will be increased with effect from 1 April 2014. Nevertheless there continues to be a level of uncertainty in forecasting the Ukraine gas price due to the current political and economic climate in Ukraine. The estimate used in the calculation uses the gas price realised in the first quarter of 2014.
(ii) Production levels — Management’s estimate is based on a third party reserves report which relies on a combination of technical and operational data and independent reservoir interpretations.
(iii) Discount rate — Management applies a pre-tax discount rate which reflects both the time value of money and its assessment of the risk associated with development and producing oil and gas assets in Ukraine. Due to the recent events in Ukraine, there is an increased level of risk associated with operating in Ukraine, and consequently a higher discount rate has been applied.
(iv) Life of field — Management’s estimate of recoverable amount is based on recovering reserves beyond the validity of its current production licences. Management believes that the current licences, which are due to expire in July 2024 will be extended under applicable legislation in Ukraine until the end of the economic life of the field, which is assessed to be June 2036. No application for such an extension has been made at the date of this report, however management considers the assumption to be reasonable based on its intention to seek such an extension in due course and that the Group is legally entitled to request an extension.
The impairment assessment carried out at 31 December 2013, has resulted in an impairment loss of $159 million. Further details of this assessment, including the sensitivity to the above assumptions are set out in Note 15.
31
go
ve
Rn
an
ce
www.regalpetroleum.com
st
Ra
te
gic
Re
Po
Rt
Fin
an
cia
ls

23149-02 15-04-2014 Proof 5
2. critical accounting estimates and assumptions continued
(b) DecommissioningThe Group has decommissioning obligations in respect of its Ukraine asset. The full extent to which the provision is required depends on the legal requirements at the time of decommissioning, the costs and timing of any decommissioning works and the discount rate applied to such costs.
During 2013, a detailed assessment of gross decommissioning cost was undertaken on a well-by-well basis using local data on day rates and equipment costs, compared to previous years where the same cost was assumed for each well.
The decommissioning costs are estimated to be incurred by June 2036, which is the end of the economic life of the field. As outlined in (a)(iv) above, management believes that the current licences, which are due to expire in July 2024, will be extended until June 2036.
(c) Depreciation of Development and Production assetsDevelopment and production assets held in property, plant and equipment are depreciated on a unit of production basis at a rate calculated by reference to proven and probable reserves and incorporating the estimated future cost of developing and extracting those reserves. Future development costs are estimated using assumptions about the number of wells required to produce those reserves, the cost of the wells, future production facilities and operating costs, together with assumptions on oil and gas realisations, and are revised annually. The reserves estimates used are determined using estimates of gas in place, recovery factors, future hydrocarbon prices and also take into consideration the Group’s latest development plan for the associated development and production asset. Additionally, as outlined in (a)(iv) above, the latest development plan and therefore the inputs used to determine the depreciation charge, assume that the current licences which are due to expire in July 2024, can be extended until June 2036.
(d) timing of recovery of purchase tax receivableThe Group has significant receivables from the State Budget of Ukraine relating to reimbursement of purchase tax arising on purchases of goods and services from external service and product providers. The Group recognises recoverable purchase tax only to the extent that it is probable that the purchase tax payable arising on the sales of gas and condensate production will be sufficient to offset the purchase tax due from the State within a reasonable period. Estimating the recoverability, net present value and classification (current asset versus non-current asset) of purchase tax receivable requires management to make an estimate of the timing of future revenues in order to calculate the amount and timing of the purchase tax payable available for offset. See Note 18 for further details.
(e) Recoverability of materials inventoryThe majority of the Group’s materials inventory balance comprises items to be used in the Ukraine drilling programme. Where there is uncertainty whether the materials will be realised through the drilling programme, or through sale, the materials are recorded at selling price, less any associated costs. Where materials inventory is intended for sale, management uses current market rates to estimate the recoverable amount through sale.
A full review of the Group’s materials inventory was undertaken following the revision to the field development plan, which reduced the number and phasing of new wells in the fields from 27 to 10. The reduced drilling activity has meant that the Group has a reduced short term requirement for drilling materials. The reduction in future utilisation of this inventory, coupled with unsuccessful attempts during the year to sell unwanted items, has led to the write down of the materials inventory balance, as outlined in Note 17.
(f) Recognition of deferred tax assetThe recognition of deferred tax assets is based upon whether it is more likely than not that sufficient and suitable taxable profits will be available in the future against which the reversal of temporary differences can be deducted. This requires judgement for forecasting future profits.
32
regal petroleum plc Annual Report and Accounts 2013
notes forming part of the financial statements continued

23149-02 15-04-2014 Proof 5
2. critical accounting estimates and assumptions continued
A deferred tax asset of $7.8 million has been recognised in respect of the brought forward losses in the Company. Management believes that these can be offset against forecast future profits, which are derived from intra-group loan interest which is taxable in the UK. The forecast is limited to five years, beyond which management do not consider they can reliably forecast the Group funding structure and hence no deferred tax asset has been recognised in respect of losses of approximately $57 million, not anticipated to be utilised in this five year period.
In addition, a deferred tax asset of $28.5 million has also been recognised on the tax effect of the difference between the carrying value of the Group’s oil and gas development and production asset, and its tax base. This is deemed recoverable on the projected future profits generated by the Group’s operations in Ukraine. The forecast profits are based on the current field development plan, and are determined using the data from the cash flow model, and therefore sensitive to the same assumptions outlined in (a) above.
Further details of the deferred tax assets recognised can be found in Note 23.
(g) Functional currencyAn entity’s functional currency is the currency of the primary economic environment in which the entity operates. If a foreign entity conducts significant amounts of business in more than one underlying currency, management’s judgement will be required to determine the functional currency in which financial results are measured with the greatest degree of relevance and reliability.
With effect from 1 January 2013, the functional currency of two of the Group’s Ukrainian subsidiaries has changed from US Dollars to Ukrainian Hryvnia. The change was triggered by the increasing influence of the Ukrainian Hryvnia on the subsidiaries’ operations, compared to previous years. Whilst historically, the majority of the development costs were influenced by US Dollars and Euros, more recently these costs have been predominantly in Ukrainian Hryvnia. In addition, the internal gas price in Ukraine set by the National Electricity Regulatory Commission, and hence the Group’s revenues, have been less influenced by the US Dollar than in previous years.
3. segmental informationIn line with the Group’s internal reporting framework and management structure, the key strategic and operating decisions are made by the Board of Directors, who review internal monthly management reports, budget and forecast information as part of this. Accordingly the Board of Directors is deemed to be the Chief Operating Decision Maker within the Group.
The Group’s only class of business activity is oil and gas exploration, development and production. The Group’s operations are located in Ukraine, with its head office in the United Kingdom. These geographical regions are the basis on which the Group reports its segment information. The segment results as presented represent operating profit/(loss) before depreciation, amortisation and impairment loss.
ukraine2013$000
united kingdom
2013$000
total2013$000
turnoverGas sales 28,034 — 28,034Condensate sales 8,664 — 8,664Liquefied Petroleum Gas sales 39 39
Total sales 36,737 — 36,737
segment result 14,559 (1,232) 13,327Depreciation and amortisation (17,545)impairment loss (159,199)operating loss (163,417)
segment assets 129,863 25,616 155,479
capital additions* 24,000 4 24,004
33
go
ve
Rn
an
ce
www.regalpetroleum.com
st
Ra
te
gic
Re
Po
Rt
Fin
an
cia
ls

23149-02 15-04-2014 Proof 5
3. segmental information continued
There are no inter-segment sales within the Group and all products are sold in the geographical region in which they are produced. Gas sales to the Group’s largest customer amounted to $25,980,000 (2012: two largest customers amounting to $10,833,000 and $4,711,000). Total revenue generated from operating and interest revenue is $37,598,000 (2012: $42,159,000).
Ukraine2012$000
United Kingdom
2012$000
Total continuing operations
2012$000
Totaldiscontinued
operations†
2012$000
Total2012$000
TurnoverGas sales 30,893 — 30,893 213 31,106Condensate sales 10,210 — 10,210 — 10,210Total sales 41,103 — 41,103 213 41,316
Segment result 25,240 (3,790) 21,450 (176) 21,274Depreciation and amortisation (11,244) — (11,244)Operating profit 10,206 (176) 10,030Segment assets 272,878 26,876 299,754 — 299,754Capital additions* 19,433 — 19,433 — 19,433
* Comprises additions to intangible assets (Note 14) and property plant and equipment (Note 15).
† Discontinued operations all relate to operations in Romania, which were sold in 2012 (see Note 11).
4. (loss)/Profit on ordinary activities before taxation2013$000
2012$000
(loss)/profit on ordinary activities before taxation is stated after charging
Included within cost of salesDepreciation of development and producing asset (see Note 15) 17,312 11,014Production based taxes 7,167 6,129Cost of inventories recognised as an expense 908 777Write downs of inventories recognised as an expense (see Note 17) 3,045 671Staff costs (see Note 7) 2,369 1,060
Included within administrative expensesAuditor’s remuneration (see below) 401 490Depreciation of other assets (see Note 15) 214 174Amortisation of intangible assets (see Note 14) 19 56Staff costs (see Note 7) 4,247 5,024
Other operating expensesImpairment of property, plant and equipment (see Note 15) 159,199 —
34
regal petroleum plc Annual Report and Accounts 2013
notes forming part of the financial statements continued

23149-02 15-04-2014 Proof 5
4. (loss)/Profit on ordinary activities before taxation continued2013$000
2012$000
Audit of the Company 132 208*Audit of Company’s subsidiaries 49 40total audit 181 248Audit related assurances services — interim review 56 66total assurance services 237 314Tax compliance services 28 25Tax advisory services 54 27Corporate finance services 82 124total non-audit services 164 176total audit and other services 401 490
* Includes $32,000 for the audit of the 2012 accounts, charged in 2013.
All amounts shown as auditor’s remuneration were payable to Deloitte LLP and other member firms of Deloitte Touche Tohmatsu Limited.
5. other net gains/(losses)2013$000
2012$000
Losses on disposal of inventory, and properly plant and equipment (30) (38)Foreign exchange gains/(losses) 60 (718)Other income 239 525
269 (231)
Foreign exchange gains and losses arise due to the multicurrency nature of the Group’s trading activities. The Group holds currencies to match the expected underlying currencies of anticipated capital and operational expenditure. Other income mostly comprises equipment rental income.
6. Remuneration of Directors2013$000
2012$000
Directors’ emoluments 906 1,046
The emoluments of the individual Directors were as follows:
Basic salary and fees
2013$000
Bonus2013$000
totalemoluments
2013$000
Totalemoluments
2012$000
Keith Henry 391 — 391 499Alexey Timofeyev 235 — 235 297Adrian Coates 70 — 70 63Alastair Graham 70 — 70 63Alexey Pertin 70 — 70 63Sergei Glazunov 70 — 70 39Denis Rudev — — — 22
906 — 906 1,046
According to the register of Directors’ interests, no rights to subscribe for shares in or debentures of Group companies were granted to any of the Directors or their immediate families during the financial year, and there were no outstanding options to Directors.
35
go
ve
Rn
an
ce
www.regalpetroleum.com
st
Ra
te
gic
Re
Po
Rt
Fin
an
cia
ls

23149-02 15-04-2014 Proof 5
7. staff numbers and costsThe average number of employees on a full time equivalent basis during the year (including Executive Directors) was as follows:
number of employees
group 2013 2012
Management/operational 102 105Administrative support 53 57
155 162
The aggregate staff costs of these employees were as follows:
2013$000
2012$000
Wages and salaries 5,416 4,943Social security costs 191 253Pension costs 1,009 888
6,616 6,084
Total staff costs in 2013 of $6,616,000 (2012: $6,084,000), comprise $2,369,000 recorded within cost of sales, and $4,247,000 recorded in administrative expenses (2012: $1,060,000 and $5,024,000 respectively). The reduction in staff costs recorded in administrative expenses is as a result of these expenses ($523,000) being reallocated to cost of sales, which management believes more accurately reflects the nature of these costs.
8. Finance income2013$000
2012$000
Interest income 861 1,056Unwinding of discount on long term receivables (see Note 18) — 2,485
861 3,541
9. Finance costs2013$000
2012$000
Interest on obligations under finance leases 5 7Discounting on long term receivables (see Note 18) 108 —Unwinding of discount on decommissioning provision (see Note 22) 520 390
633 397
36
regal petroleum plc Annual Report and Accounts 2013
notes forming part of the financial statements continued

23149-02 15-04-2014 Proof 5
10. taxationa) analysis of (credit)/charge in period:
continuingoperations
Discontinued operations total
2013$000
2012$000
2013$000
2012$000
2013$000
2012$000
Current taxOverseas – current year 1,358 1,660 — 10 1,358 1,670Overseas – prior year 124 — — — 124 —Deferred tax (see Note 23)UK — current year (36,965) (395) — — (36,965) (395)UK — prior year (274) (1,187) — — (274) (1,187)
(35,757) 78 — 10 (35,757) 88
b) Factors affecting tax charge for the year:The charge for the year from continued operations can be reconciled to the (loss)/profit as per the Income Statement as follows:
2013 $000
2012$000
(Loss)/profit before tax from continuing operations (162,920) 13,119Tax (credit)/charge at UK tax rate of 23.25% (2012: 24.50%) (37,879) 3,214
tax effects of:Lower foreign corporate tax rates in Ukraine (19%) (689) (185)Disallowed expenses and non-taxable income 3,249 4,504 Recognition of deferred tax assets on historical losses (4,638) (3,169)Recognition of deferred tax on decommissioning (332) —Utilisation of brought forward losses, where no deferred tax asset was previously recognised — (2,809)Adjustment for reduction in UK corporate tax rate 4,682 (290)Prior year adjustments (150) (1,187)Tax (credit)/charge for the year (35,757) 78
11. Discontinued operationsIn July 2012, the Company completed the sale of its wholly owned Subsidiary Regal Petroleum Romania SRL, which held a 50% non-operated interest in the Suceava concession in Romania. The results of these discontinued operations are shown below:
2013$000
2012$000
Revenue — 213Expenses — (136)Profit/(loss) before tax — 77Attributable tax expense — (10)Other losses* — (1,467)Net loss attributable to discontinued operation — (1,400)
* Includes, inter alia, $1,168,000 exchange differences historically recognised in other comprehensive income.
37
go
ve
Rn
an
ce
www.regalpetroleum.com
st
Ra
te
gic
Re
Po
Rt
Fin
an
cia
ls

23149-02 15-04-2014 Proof 5
12. (loss)/Profit for the Financial yearThe Company has taken advantage of the exemption allowed under section 408 of the Companies Act 2006 and has not presented its own income statement in these financial statements. The Group loss for the year includes a Parent Company loss after tax of $174,948,000 for the year ended 31 December 2013 (2012: profit of $13,328,000).
13. (loss)/earnings per shareThe calculation of basic profit or loss per ordinary share has been based on the profit or loss for the year and 320,637,836 (2012: 320,637,836) ordinary shares, being the weighted average number of shares in issue for the year. The impact of potentially dilutive instruments is either insignificant or, for the years for which there was a loss, anti-dilutive.
14. intangible assets
group
2013computer software
$000
2012Computer Software
$000
costAt beginning of year 438 401Additions 101 37Disposals (142) —Exchange differences (5) —At end of year 392 438amortisationAt beginning of year 373 317Charge for year 19 56Disposals (142) —Exchange differences (2) —At end of year 248 373net book value at end of year 144 65
company
2013 computer
software$000
2012 Computer Software
$000
cost At beginning of year 279 279Disposals (142) —At end of year 137 279amortisationAt beginning of year 274 238Charge for year 5 36Disposals (142) —At end of year 137 274net book value at end of year — 5
38
regal petroleum plc Annual Report and Accounts 2013
notes forming part of the financial statements continued

23149-02 15-04-2014 Proof 5
15. Property, Plant and equipment2013 2012
group
Development and
Production assets
ukraine$000
other fixedassets*
$000total$000
Development and
Production assets
Ukraine$000
Other fixedassets*$000
Total$000
cost At beginning of year 261,173 1,133 262,306 241,969 1,025 242,994Additions 23,451 452 23,903 19,204 192 19,396Disposals (505) (285) (790) — (84) (84)Exchange differences (7,938) (28) (7,966) — — —At end of year 276,181 1,272 277,453 261,173 1,133 262,306Depreciation and impairmentAt beginning of year 27,949 849 28,798 16,935 759 17,694Charge for year 17,312 214 17,526 11,014 174 11,188Impairment loss 159,199 — 159,199 — — —Disposals (126) (242) (368) — (84) (84)Exchange differences (1,089) (18) (1,107) — — —At end of year 203,245 803 204,048 27,949 849 28,798net book value at end of year 72,936 469 73,405 233,224 284 233,508
* Other fixed assets include fixtures, fittings and equipment, motor vehicles and plant and machinery.
In accordance with the Group’s accounting policies, oil and gas development and producing assets are tested for an impairment loss at each balance sheet date. In assessing whether an impairment loss has occurred, the carrying amount of the asset is compared to its recoverable amount, which IAS 36 defines as the higher of fair value less cost to sell and value in use. Management does not believe it possible to measure fair value reliably, due to both the absence of an active market in which to sell the asset and the current political and economic climate in Ukraine. Therefore, as in previous years, management has used value in use, using a discounted cash flow model, to measure its recoverable amount.
Due to mixed drilling results, the Group is undertaking geophysical studies, and has slowed down its field development programme on the Mekhediviska-Golotvshinska (“MEX-GOL”) and Svyrydivske (“SV”) gas and condensate fields in Ukraine. The revision to the field development programme has reduced the number and the phasing of new wells in the fields from 27 to 10. An updated reserves report as of 31 December 2013, prepared by ERC Equipoise Limited in London, based on this revised field development programme, revealed a revised estimate of the Group’s 2P reserves of 11.7MMboe, compared to their previous estimate of 31.6MMboe at 31 December 2012. Further details of the updated reserves report are set out in the Operations Review section of the Strategic Report.
This resulted in the recognition of an impairment loss of $159,199,000 (2012: $nil), to match the carrying value of the asset to its recoverable value, based on the revised estimate of value in use. The revised reserves estimate is the basis of the increased development and production asset depreciation charge for the year. It is impracticable to calculate the impact of the revised reserves estimate on the depreciation charge in future periods.
39
go
ve
Rn
an
ce
www.regalpetroleum.com
st
Ra
te
gic
Re
Po
Rt
Fin
an
cia
ls

23149-02 15-04-2014 Proof 5
15. Property, Plant and equipment continued
The calculation of value in use is most sensitive to the following assumptions, the bases of which are set out in Note 2(a):
(i) Commodity prices – The model assumes gas prices of $365/Mm3 (UAH3,020/Mm3), which was the gas price realised by the Group in the first quarter of 2014. A $10 decrease in the gas price would result in a further reduction of $3,735,000 in the carrying value of the asset, whilst a $10 increase in the gas price would result in an increase of $3,736,000.
(ii) Discount rate – The Group has estimated the discounted cash flows using a pre-tax discount rate of 17% (2012: 15%). This discount rate is derived from the management assessment of the relevant business risks associated with the MEX-GOL and SV fields. A 1% increase in the discount rate would result in a further reduction of $3,944,000 in the carrying value, whilst a 1% reduction in the discount rate would result in an increase of $4,285,000 in the carrying value.
(iii) Production levels – Production levels are based on data included in the third party reserves report. This report includes estimated production volumes, including from new wells, over the remaining useful life of the MEX-GOL and SV gas and condensate fields in Ukraine. The report and its estimated production, is based on the Group’s current development programme, which includes the drilling of ten new wells.
(iv) The current licences, which are due to expire in July 2024, can be extended under applicable legislation in Ukraine until the end of the economic life of the field, which is assessed to be June 2036 on the basis of the updated reserves report. No application for such an extension has been made at the date of this report, but management consider the assumption to be reasonable based on their intention to seek such an extension in due course and that the Group is legally entitled to request an extension. However, if the extension were not granted, it would result in a further reduction of $9,339,000 in the carrying value.
company
2013 other fixed
assets*$000
2012 Other fixed
assets*$000
cost At beginning of year 173 173Additions 4 —Disposals (19) —At end of year 158 173DepreciationAt beginning of year 128 88Charge for year 34 40On disposals (19) —At end of year 143 128net book value at end of year 15 45
* Other fixed assets include fixtures, fittings and equipment, motor vehicles and plant and machinery.
40
regal petroleum plc Annual Report and Accounts 2013
notes forming part of the financial statements continued

23149-02 15-04-2014 Proof 5
16. Fixed asset investments
company
shares in subsidiary
undertakings$000
loans to subsidiary
undertakings $000
total $000
cost At 1 January 2012 17,279 240,257 257,536Additions — 16,610 16,610Repayments — (11,274) (11,274)Provision against subsidiary loans — (837) (837)At 31 December 2012 17,279 244,756 262,035cost At 1 January 2013 17,279 244,756 262,035Additions — 18,015 18,015Provision against subsidiary loans — (192,064) (192,064)at 31 December 2013 17,279 70,707 87,986
In accordance with the Company’s accounting policies loans to subsidiaries have been reviewed to assess recoverability. As a result of the impairment recognised in the carrying value of the Group’s assets in Ukraine (see Note 15), a provision of $192,064,000 was recorded against the carrying value of loans between the Company and its subsidiaries.
subsidiary undertakings At 31 December 2013, the Company’s subsidiary undertakings, all of which are included in the consolidated financial statements, were:
country ofincorporation
country of operation Principal activity
% of shares held
Regal Petroleum Corporation Limited Jersey Ukraine Oil & Natural Gas Extraction 100%Regal Petroleum Corporation (Ukraine) Limited Ukraine Ukraine Service Company 100%Refin Limited Ukraine Ukraine Service Company 100%Regal Petroleum Ukraine Limited Ukraine Ukraine Dormant 100%Regal Petroleum (Jersey) Limited Jersey United Kingdom Holding company 100%
Regal Group Services Limited United Kingdom United Kingdom Service Company 100%
Regal Egypt Limited United Kingdom Not applicable Dormant 100%
The Parent Company, Regal Petroleum plc, holds direct interests of 100% of the share capital of Regal Petroleum (Jersey) Limited and Regal Group Services Limited with all other companies owned indirectly by the parent company. Regal Petroleum Corporation Limited and Regal Petroleum Ukraine Limited are controlled through their 100% ownership by Regal Petroleum (Jersey) Limited. Regal Petroleum Corporation (Ukraine) Limited is controlled by its 100% ownership by Regal Petroleum (Jersey) Limited and Regal Group Services Limited, and Refin Limited is controlled by its 100% ownership by Regal Petroleum (Jersey) Limited and Regal Petroleum Corporation (Ukraine) Limited.
Regal Group Services Limited, company number 5252958, has adopted the subsidiary audit exemption allowed under section 479A of the Companies Act 2006, for the year ended 31 December 2013.
Regal Egypt Limited was dissolved in January 2014.
41
go
ve
Rn
an
ce
www.regalpetroleum.com
st
Ra
te
gic
Re
Po
Rt
Fin
an
cia
ls

23149-02 15-04-2014 Proof 5
17. inventories group
non-current2013$000
2012$000
Materials 1,115 2,390
group
current2013$000
2012$000
Materials 3,729 7,467Condensate stock 143 153
3,872 7,620
A full review of the Group’s materials inventory balance was undertaken following the revision to the field development plan, which reduced the number and phasing of new wells in the field. The reduction in future utilisation of this inventory, coupled with unsuccessful attempts during the year to sell unwanted items, has led to the write down of the materials inventory balance.
The majority of the Group’s materials inventory is held at written down value, due to historic impairment charges, and the write down following the review of the materials inventory referred to above. The cumulative total write down recorded on the balance above was $4,809,000 (2012: $3,523,000).
The 2013 review of the Group’s materials inventory resulted in a write down of $3,045,000, which has been recorded within cost of sales in the income statement (2012: $671,000). During 2013 certain items of material inventory were sold resulting in a $313,000 (2012: $104,000) reversal of a prior year impairment.
Non-current inventory includes material which will not be used in the drilling of the next development well.
18. trade and other Receivables
non-current
group company2013$000
2012$000
2013$000
2012$000
Purchase tax receivable 5,953 7,014 — —5,953 7,014 — —
current
group company2013$000
2012$000
2013$000
2012$000
Trade receivables 1 597 — —Prepayments and accrued income 610 3,952 118 329Corporation tax receivable 768 374 — —Purchase tax receivable 8,090 10,538 83 180Other receivables 84 2,074 56 2,074
9,553 17,535 257 2,583
None of the Group’s trade receivables are past due or impaired. All trade receivables are considered to be of high credit quality.
42
regal petroleum plc Annual Report and Accounts 2013
notes forming part of the financial statements continued

23149-02 15-04-2014 Proof 5
18. trade and other Receivables continued
Current purchase tax receivable in respect of the Group includes $7,308,000 (2012: $9,699,000) relating to capital expenditure in Ukraine which is expected to be recovered via an offset against purchase tax payable on future sales in that country. There is an additional $5,953,000 (2012: $7,014,000) which is included within non-current trade and other receivables as, based on the Group’s future sales projections which are derived from the assumptions in the value in use model outlined in Note 2(a), it is not expected to be recoverable within one year. The Directors are satisfied that all such amounts are fully recoverable. The balance is shown at net present value, using a discount rate based on an appropriate long term Ukraine Government bond. The revision to the Group’s field development programme has slowed the phasing and number of new wells to be drilled in the field, and consequently it will take longer for the purchase tax balances to be recovered from future sales. This resulted in a corresponding finance charge of $108,000 (2012: income of $2,485,000 for unwinding of the discount).
19. cash and cash equivalentsgroup company
2013$000
2012$000
2013$000
2012$000
Cash at bank and on hand 9,939 2,506 7,820 61Short-term deposits 15,145 25,947 9,072 20,938
25,084 28,453 16,892 20,999
Cash at bank earns interest at floating rates based on daily bank deposit rates. Short-term deposits are made for varying periods of between one day and six months, depending on the immediate cash requirements of the Group and earn interest at the respective short-term deposit rates. The Group has immediate access to all cash deposits, with no significant penalty.
20. trade and other Payablesgroup company
2013$000
2012$000
2013$000
2012$000
Trade payables 545 443 70 94Taxation and social security 90 216 — 62Accruals and deferred income 2,587 2,385 168 491
3,222 3,044 238 647
Management consider that the carrying amount of trade payables approximates to their fair value.
21. obligations under Finance leasesgroup
2013$000
2012$000
Amounts payable under finance leases:
Within one year — 11
In the second to fifth years inclusive — —
— 11
Less future finance, service and insurance charges — (3)
Present value of lease obligations — 8
Amount due for settlement within 12 months (shown under current liabilities) — 8
Amount due for settlement after 12 months — —
The 2012 finance leases relate to motor vehicles in Ukraine. The average lease term was three years and the average effective borrowing rate was 12.94%. The lease term of these motor vehicles ended during 2013.
43
go
ve
Rn
an
ce
www.regalpetroleum.com
st
Ra
te
gic
Re
Po
Rt
Fin
an
cia
ls

23149-02 15-04-2014 Proof 5
22. Provisions for liabilities and chargesProvision for
decommissioning
group $000other*$000
total $000
At beginning of year 6,776 761 7,537Amounts provided/(utilised) 180 (499) (319)Unwinding of discount (see Note 9) 520 — 520Change in estimate (5,633) — (5,633)Exchange differences (212) — (212)at end of year 1,631 262 1,893
companyother$000
total $000
At beginning of year 522 522Amounts utilised (522) (522)at end of year — —
* Other items at 31 December 2013 relate to provisions for employees’ annual leave.
group company2013$000
2012$000
2013$000
2012$000
Current 262 761 — 522
Non-current 1,631 6,776 — —1,893 7,537 — 522
The provision for decommissioning is based on the net present value of the Group’s estimated liability for the removal of the Ukraine production facilities and site restoration at the end of the production life. This year’s detailed assessment of the gross decommissioning cost was undertaken on a well-by-well basis using local data on day rates and equipment costs, compared to previous years where the same cost was assumed for each well. The change in estimate during 2013 reflects a combination of this revision in the estimated costs and the discount rate applied. These costs are expected to be incurred by 2036 (2012: by 2029), although if the costs were to be incurred at the current expiry of the licences in 2024, the provision for decommissioning at 31 December 2013 would be $2,789,000.
44
regal petroleum plc Annual Report and Accounts 2013
notes forming part of the financial statements continued

23149-02 15-04-2014 Proof 5
23. Deferred tax
company2013$000
2012$000
Deferred tax recognised on tax losses
At beginning of year 3,169 —
Credited to income statement — current year 4,638 3,169
at end of year 7,807 3,169
group2013$000
2012$000
Deferred tax recognised relating to development and production asset
At beginning of year (4,055) (2,468)
Credited/(charged) to income statement — current year 32,327 (2,774)
Credited to income statement — prior year 274 1,187at end of year 28,546 (4,055)
At 31 December 2013 the Group recognised a deferred tax asset of $7,807,000 in relation to UK tax losses carried forward. There was a further $57 million (31 December 2012: $94 million) of unrecognised UK tax losses carried forward for which no deferred tax asset has been recognised. These losses can be carried forward indefinitely, subject to certain rules regarding capital transactions and changes in the trade of the Company. The Directors consider it appropriate to recognise deferred tax assets resulting from accumulated tax losses at 31 December 2013 to the extent that it is probable that there will be sufficient future taxable profits.
The deferred tax asset relating to the Group’s development and producing asset at 31 December 2013 was recognised on the tax effect of the temporary differences between the carrying value of the Group’s development and producing asset in Ukraine, and its tax base. This is deemed recoverable on the projected future profits generated by the Group’s operations in Ukraine. The forecast profits are based on the current field development plan, and are determined using data from the same cash flow model, which was used to determine the carrying value of the Group’s development and production asset in Ukraine, as outlined in Note 15. Based on these projections, the deferred tax asset recognised will be recovered by 2022. However, should future field development not result in additional production, only $3 million of the $29 million deferred tax recognised would be recoverable based on forecast profits available from the Group’s existing wells.
Factors affecting future tax chargeDuring 2013 the main rate of corporation tax in Ukraine was 19%. On 1 January 2014, the rate was reduced to 18%, with further planned reductions to 17% in 2015, and 16% during 2016 being the rate substantially enacted on the balance sheet date.
In March 2013, the UK Government announced reductions in the main rate of UK corporation tax to 21% in 2014, and 20% in 2015. This is not expected to have a material effect on the Group’s tax balances.
24. called up share capital 2013 2012
number $000 Number $000
allotted, called up and fully paidOpening balance at 1 January 320,637,836 28,115 320,637,836 28,115Issued during the year — — — —Closing balance at 31 December 320,637,836 28,115 320,637,836 28,115
There are no restrictions over ordinary shares issued.
45
go
ve
Rn
an
ce
www.regalpetroleum.com
st
Ra
te
gic
Re
Po
Rt
Fin
an
cia
ls

23149-02 15-04-2014 Proof 5
25. other ReservesOther reserves, the movements in which are shown in the statements of changes in equity, comprise the following:
capital contributions Reserve The capital contributions reserve is non-distributable and represents the value of equity invested in subsidiary entities prior to the Company listing.
merger ReserveThe merger reserve represents the difference between the nominal value of shares acquired by the Company and those issued to acquire subsidiary undertakings. This balance relates wholly to the acquisition of Regal Petroleum (Jersey) Limited and that company’s acquisition of Regal Petroleum Corporation Limited during 2002.
Foreign exchange ReserveExchange reserve movement for the year attributable to currency fluctuations.
26. operating lease arrangementsthe group as lessee
group company2013$000
2012$000
2013$000
2012$000
Minimum lease payments under operating leases recognised as an expense for the year 427 399 301 274
At the balance sheet date the Group had outstanding commitments for future minimum lease payments under non-cancellable operating leases which fall due as follows:
land and buildings
group and company2013$000
2012$000
Amounts payable due:— Within one year 350 338— In the second to fifth years inclusive — —
350 338
Operating lease payments represent rentals payable by the Group for office properties, which were negotiated and fixed for an average of one year.
the group as lessorThere was no property rental income recognised as income from subleasing during the year (2012: $nil).
At the balance sheet date, the Group had contracts with tenants for the following future minimum sublease payments:
land and buildings
group and company2013$000
2012$000
Amounts receivable due:— Within one year — 107— In the second to fifth years inclusive — —
— 107
46
regal petroleum plc Annual Report and Accounts 2013
notes forming part of the financial statements continued

23149-02 15-04-2014 Proof 5
27. Reconciliation of operating (loss)/Profit to operating cash Flow
group2013$000
2012$000
Operating (loss)/profit from continuing operations (163,417) 10,206Operating loss from discontinued operations — (176)Depreciation, amortisation and impairment charges 176,744 11,244Write down of inventory (see Note17) 3,045 671Reversal of write down of inventory (313) (104)Movement in provisions (499) 21Decrease in operating stock 164 (79)Decrease in debtors 10,461 10,786Increase in creditors 305 550cash from operations 26,490 33,119
company2013$000
2012$000
Operating loss (195,032) (4,520)Depreciation and amortisation 39 76Movement in provisions (including against subsidiary loans) 191,542 751Decrease in debtors 2,326 148(Decrease)/increase in creditors (409) 9cash used in operations (1,534) (3,536)
28. Financial instrumentscapital Risk managementThe Group manages its capital to ensure that it is able to continue as a going concern whilst maximising the return to stakeholders.
The capital structure of the Group consists of equity attributable to the equity holders of the parent, comprising issued share capital, share premium, reserves and retained deficit.
There are no capital requirements imposed on the Group.
The Group’s financial instruments comprise cash and cash equivalents and various items such as debtors and creditors that arise directly from its operations. The Group has bank accounts denominated in British Pounds, US Dollars, Euros, and Ukraine Hryvnia. The Group does not have any borrowings. The main future risks arising from the Group’s financial instruments are currently currency risk, interest rate risk, liquidity risk and credit risk.
The Group’s financial assets and financial liabilities, measured at amortised costs, which approximates their fair value comprise of the following:
Financial assets
group2013$000
2012$000
Cash and cash equivalents 25,084 28,453Trade and other receivables 85 2,671
25,169 31,124
47
go
ve
Rn
an
ce
www.regalpetroleum.com
st
Ra
te
gic
Re
Po
Rt
Fin
an
cia
ls

23149-02 15-04-2014 Proof 5
28. Financial instruments continued
company2013$000
2012$000
Cash and cash equivalents 16,892 20,999Trade and other receivables 56 2,074
16,948 23,073
Financial liabilities
group2013$000
2012$000
Trade and other payables 545 443Accruals 720 1,554
1,265 1,997
company2013$000
2012$000
Trade and other payables 70 94Accruals 168 296
238 390
currency RiskThe functional currency of the Group’s entities are in US Dollars and Ukraine Hryvnia. The following analysis of net monetary assets and liabilities shows the Group’s currency exposures. Exposures comprise the monetary assets and liabilities of the Group that are not denominated in the functional currency of the relevant entity. As outlined in the Finance Review section of the Strategic Report, with effect from 1 January 2013, the functional currency of two of the Group’s Ukrainian subsidiaries has changed from US Dollars to Ukrainian Hryvnia, resulting in no currency exposure to the Ukraine Hryvnia in 2013.
As a result of the recent political and economic upheaval in Ukraine, there has been a significant devaluation of the Ukrainian Hryvnia against the US Dollar which is likely to affect the carrying value of the Group’s assets in the future. Since 1 January 2014, the Ukrainian Hryvnia has devalued against the US Dollar by approximately 25%.
currency2013$000
2012$000
Canadian Dollars 3 5British Pounds 295 267Euros 1,783 1,830United States Dollars 43 —Ukraine Hryvnia — 7,115
2,124 9,217
Foreign currency sensitivity analysisThe Group is mainly exposed to the currency of Ukraine (Hryvnia), the currency of United Kingdom (Sterling) and the currency of the European Union (Euro).
The following table details the Group’s sensitivity to a 20% increase and decrease in the US Dollar against the stated currency. 20% is the sensitivity rate used when reporting foreign currency risk internally to key management personnel and represents management’s assessment of the reasonably possible change in foreign exchange rates. A positive number below indicates a decrease in loss/increase in profit and other equity where the US Dollar weakens 20% against the relevant currency. For a 20% strengthening of the US Dollar against the relevant currency, there would be an equal and opposite impact on the loss/profit and other equity, and the balances below are shown negative. The Group holds currencies to match the currencies of future capital and operational expenditure.
48
regal petroleum plc Annual Report and Accounts 2013
notes forming part of the financial statements continued

23149-02 15-04-2014 Proof 5
28. Financial instruments continued
Hryvnia sterling euro2013$000
2012$000
2013$000
2012$000
2013$000
2012$000
Profit/(loss)
— 20% strengthening of USD (24,328) (1,436) 594 (68) (356) (97)
— 20% weakening of USD 24,328 1,436 (594) 68 356 97
other equity
— 20% strengthening of USD (1,211) (1,436) 594 (68) (356) (97)
— 20% weakening of USD 1,211 1,436 (594) 68 356 97
interest Rate Risk managementThe Group is not exposed to interest rate risk on financial liabilities as none of the entities in the Group have any external borrowings. The Group does not use interest rate forward contracts and interest rate swap contracts as part of its strategy.
The Group is exposed to interest rate risk on financial assets as entities in the Group hold money market deposits at floating interest rates. The risk is managed by fixing interest rates for a period of time when indications exist that interest rates may move adversely.
The Group’s exposure to interest rates on financial assets and financial liabilities are detailed in the liquidity risk management section below.
interest Rate sensitivity analysisThe sensitivity analysis below has been determined based on exposure to interest rates for non-derivative instruments at the balance sheet date. A 0.5% increase or decrease is used when reporting interest rate risk internally to key management personnel and represents management’s assessment of a reasonably possible change in interest rates.
If interest rates earned on money market deposits had been 0.5% higher/lower and all other variables were held constant, the Group’s:
� loss for the year ended 31 December 2013 would decrease by $40,000 in the event of 0.5% higher interest rates and increase by $40,000 in the event of 0.5% lower interest rates (2012: increase with higher rate by $127,000, and decrease with lower rate by $76,000). This is mainly attributable to the Group’s exposure to interest rates on its money market deposits; and
� other equity reserves would not be affected (2012: not affected).
Interest payable on the Group’s liabilities would have an immaterial effect on the profit or loss for the year.
liquidity RiskThe Group’s objective throughout the year has been to ensure continuity of funding. Operations have primarily been financed through revenue from Ukraine operations.
Details of the Group’s cash management are explained in Note 19.
Liquidity risk for the Group is further detailed under the Going Concern section of the Strategic Report.
credit RiskCredit risk principally arises in respect of the Group’s cash balance. In the UK, where the majority ($16.9 million) of the overall cash is held, the Group only deposits cash surpluses with major banks of high quality credit standing. The remaining balance of $8.2 million was held in Ukraine. As a result of the political turmoil in Ukraine, as outlined in the Strategic Report, Standard & Poor’s downgraded Ukraine’s sovereign credit rating in February 2014 to “CCC with a negative outlook”. There is no credit rating information available for the specific bank in Ukraine where the Group currently holds its cash and cash equivalents.
None of the Group’s trade receivables are past due or impaired. All trade receivables are considered to be of high credit quality.
49
go
ve
Rn
an
ce
www.regalpetroleum.com
st
Ra
te
gic
Re
Po
Rt
Fin
an
cia
ls

23149-02 15-04-2014 Proof 5
28. Financial instruments continued
interest Rate Risk Profile of Financial assetsThe Group had the following cash and cash equivalent balances which are included in financial assets as at 31 December 2013 with an exposure to interest rate risk:
currency
total2013$000
Floating rate financial
assets2013$000
Fixed rate financial
assets2013$000
Total2012$000
Floating rate financial
assets2012$000
Fixed rate financial
assets2012$000
Canadian Dollars 3 3 — 5 5 —Euros 1,783 1,783 — 483 483 —British Pounds 477 477 — 339 339 —Ukraine Hryvnia 7,888 7,888 — 7,184 7,184 —US Dollars 14,933 14,933 — 20,442 20,442 —
25,084 25,084 — 28,453 28,453 —
Cash deposits included in the above balances comprise of short term deposits.
interest Rate Risk Profile of Financial liabilitiesThe Group had no interest bearing financial liabilities at year end (2012: $nil).
maturity of Financial liabilitiesThe maturity profile of financial liabilities, on an undiscounted basis, is as follows:
group2013$000
2012$000
In one year or less 1,265 1,997Within two to five years — —In more than five years — —
1,265 1,997
company2013$000
2012$000
In one year or less 238 390Within two to five years — —In more than five years — —
238 390
Borrowing FacilitiesThe Group did not have any borrowing facilities available to it at the year end (2012: nil).
Fair value of Financial assets and liabilitiesThe fair value of all financial instruments is not materially different from the book value.
29. capital commitments Amounts contracted in relation to the Group’s 2013 investment programme in the Mekhediviska-Golotvshinska and Svyrydivske gas and condensate fields in Ukraine, but not provided for in the financial statements at 31 December 2013 were $2,153,000 (2012: $14,579,000).
50
regal petroleum plc Annual Report and Accounts 2013
notes forming part of the financial statements continued

23149-02 15-04-2014 Proof 5
30. Related Party DisclosuresKey management personnel of the Group are considered to comprise only the Directors. Details of Directors’ remuneration are disclosed in Note 6.
During the year, Group companies entered into the following transactions with related parties who are not members of the Group:
2013$000
2012$000
Purchase of goods 760 —Sale of goods 1,873 —Services received 103 —Services provided 125 140Amounts owing to related parties at balance sheet date 19 —Amounts owed by related parties at balance sheet date 4 —
All related party transactions were with subsidiaries of the ultimate Parent Company. The amounts outstanding were unsecured and will be settled in cash.
The Group has the following transactions and balances with related party banks, which are subsidiaries of the ultimate Parent Company:
2013$000
2012$000
Interest income 812 966Bank charges 17 16Cash held at end of year 7,915 7,186
Cash held with related party banks, is held in Ukraine on similar terms to the remainder of the Group’s cash balances (see Note 19). As a result of the political turmoil in Ukraine, as outlined in the Strategic Report, Standard & Poor’s downgraded Ukraine’s sovereign credit rating in February to “CCC with a negative outlook”.
Regal Petroleum plc is 54% owned by Energees Management Limited. Energees Management Limited is 100% owned by Pelidona Services Limited, which is 100% owned by Lovitia Investments Limited, which is 100% owned by Mr V Novinskiy.
At the date of this report, none of the Company’s controlling parties prepare consolidated financial statements available for public use.
31. Post Balance sheet eventsAs announced on 25 March 2014, the Company engaged independent petroleum consultants, ERC Equipoise Limited, to prepare an updated assessment of the remaining Reserves and Contingent Resources attributable to the Group’s MEX-GOL and SV fields. Further details are included in the Operations Review section of the Strategic Report.
As a result of the recent political and economic upheaval in Ukraine, there has been a significant devaluation of the Ukrainian Hryvnia against the US Dollar which is likely to affect the carrying value of the Group’s assets in the future. Since 1 January 2014, the Ukrainian Hryvnia has devalued against the US Dollar by approximately 25%.
From 1 January 2014, the Group’s average realised gas price in Ukraine was $339/Mm3 (UAH3,051/Mm3). The Group’s realised gas price is close to the maximum internal gas price set by the National Electricity Regulatory Commission of Ukraine (“NERC”). It has been announced by NERC that, with effect from 1 April 2014, the internal gas price will increase to $363/Mm3 (UAH4,020/Mm3 using the exchange rate at 31 March 2014 of UAH11.09/$1.00) for the second quarter of 2014. Further details are set out in the Finance Review section of the Strategic Report.
51
go
ve
Rn
an
ce
www.regalpetroleum.com
st
Ra
te
gic
Re
Po
Rt
Fin
an
cia
ls

23149-02 15-04-2014 Proof 5
52
regal petroleum plc Annual Report and Accounts 2013
notes

23149-02 15-04-2014 Proof 5
aDvisoRs
aaPg American Association of Petroleum Geologists
bbl barrel
boe barrels of oil equivalent
Bscf thousands of millions of standard cubic feet
boepd barrels of oil equivalent per day
giiP gas initially in place
Hses health, safety, environment and security
km kilometres
km2 square kilometres
lPg liquefied petroleum gas
m3 cubic metre
m3/d cubic metres per day
mm³ thousand cubic metres
mtonnes thousand tonnes
mmbbl million barrels
mmboe million barrels of oil equivalent
% per cent
scf standard cubic feet measured at 14.7 pounds per square inch and 60 degrees Fahrenheit
sPe Society of Petroleum Engineers
sPee Society of Petroleum Evaluation Engineers
$ United States Dollar
c United States Cent
uaH Ukrainian Hryvnia
WPc World Petroleum Council
company secretary and Registered officechris Phillips16 Old Queen StreetLondon SW1H 9HPUnited Kingdom
auditorsDeloitte llP2 New Street SquareLondon EC4A 3BZUnited Kingdom
BankersBank of scotland corporateLondon Chief Office155 BishopsgateLondon EC2M 3YBUnited Kingdom
solicitorsPinsent masons llP30 Crown PlaceLondon EC2A 4ESUnited Kingdom
nominated advisorstrand Hanson limited26 Mount RowLondon W1K 3SQUnited Kingdom
Joint Brokermerrill lynch internationalMerrill Lynch Financial Centre2 King Edward StreetLondon EC1A 1HQUnited Kingdom
Joint BrokerJefferies Hoare govettVintners Place68 Upper Thames StreetLondon EC4V 3BJUnited Kingdom
share Registrycomputershare investor services PlcThe PavilionsBridgwater RoadBristol BS99 6ZYUnited Kingdom
PR advisorscitigate Dewe Rogerson3 London Wall BuildingsLondon EC2M 5SYUnited Kingdom
glossaRy
www.regalpetroleum.com

23149-02 15-04-2014 Proof 5
Regal Petroleum plc16 Old Queen StreetLondonSW1H 9HP+44 (0)20 3427 [email protected] code: RPT
Reg
al Petro
leum p
lc Annual R
eport and
Accounts 2013