borders & southern petroleum plc annual report & … annual report.pdf · borders &...
TRANSCRIPT
Borders &
Southern Petroleum
plc Annual R
epo
rt & A
ccounts 2016
Borders & Southern Petroleum plc Annual Report & Accounts 2016
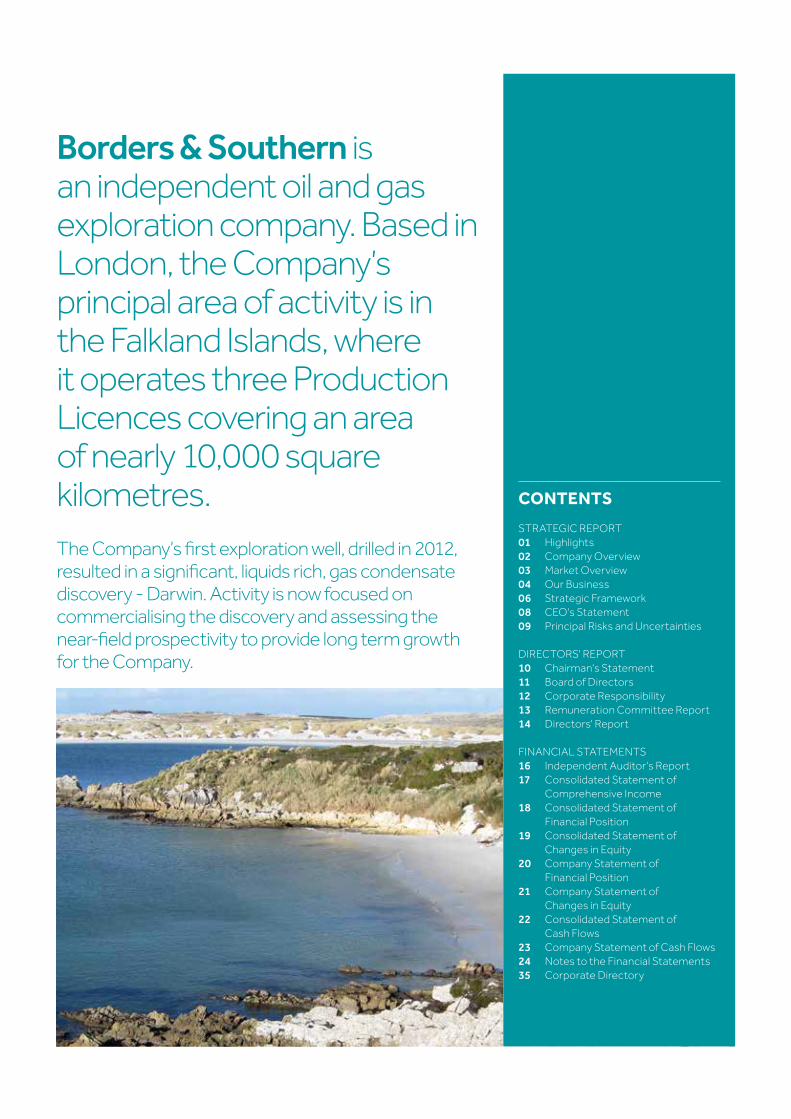
Borders & Southern is an independent oil and gas exploration company. Based in London, the Company’s principal area of activity is in the Falkland Islands, where it operates three Production Licences covering an area of nearly 10,000 square kilometres.The Company’s first exploration well, drilled in 2012, resulted in a significant, liquids rich, gas condensate discovery - Darwin. Activity is now focused on commercialising the discovery and assessing the near-field prospectivity to provide long term growth for the Company.
CONTENTS
STRATEGIC REPORT01 Highlights02 Company Overview03 Market Overview04 Our Business06 Strategic Framework08 CEO's Statement09 Principal Risks and Uncertainties
DIRECTORS' REPORT10 Chairman's Statement11 Board of Directors12 Corporate Responsibility13 Remuneration Committee Report14 Directors' Report
FINANCIAL STATEMENTS16 Independent Auditor's Report17 Consolidated Statement of
Comprehensive Income18 Consolidated Statement of
Financial Position19 Consolidated Statement of
Changes in Equity20 Company Statement of
Financial Position21 Company Statement of
Changes in Equity22 Consolidated Statement of
Cash Flows23 Company Statement of Cash Flows24 Notes to the Financial Statements35 Corporate Directory
01Borders & Southern Petroleum plc Annual Report & Accounts 2016
FinancialStatements
Directors’ Report
StrategicReport
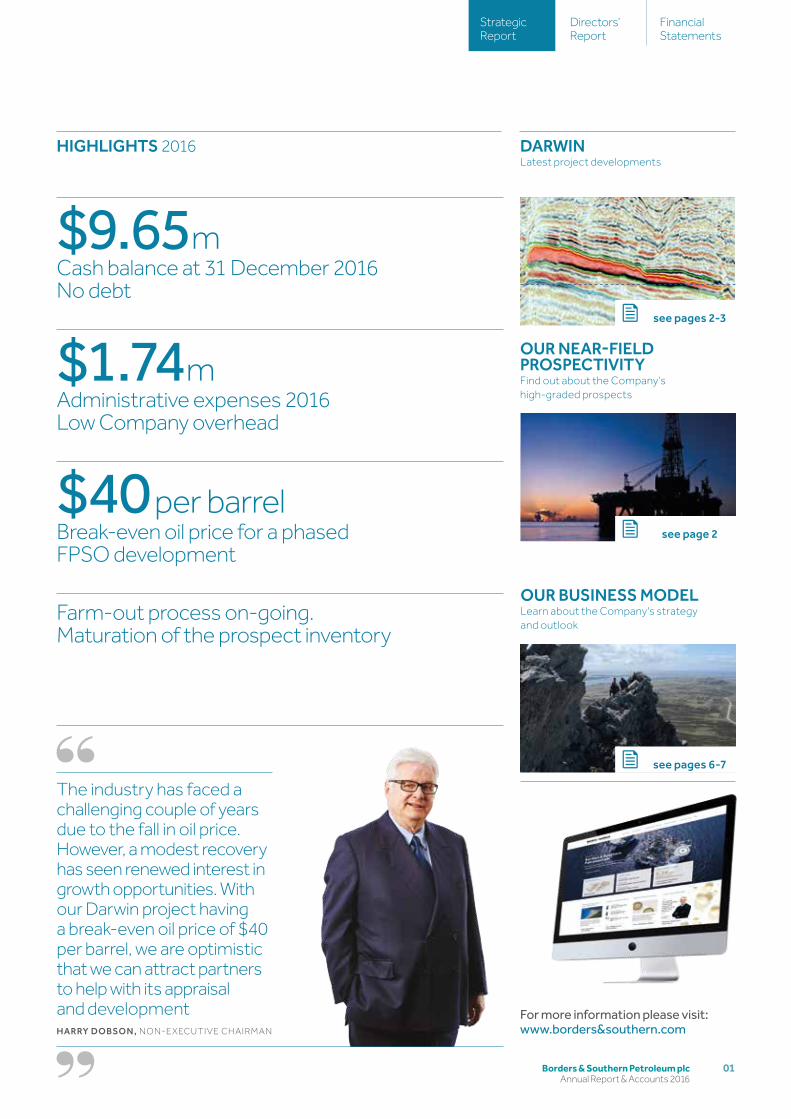
HIGHLIGHTS 2016
$9.65mCash balance at 31 December 2016 No debt
$1.74mAdministrative expenses 2016 Low Company overhead
$40 per barrelBreak-even oil price for a phased FPSO development
Farm-out process on-going. Maturation of the prospect inventory
DARWINLatest project developments
OUR NEAR-FIELD PROSPECTIVITYFind out about the Company's high-graded prospects
OUR BUSINESS MODELLearn about the Company's strategy and outlook
see pages 2-3
see page 2
see pages 6-7
For more information please visit: www.borders&southern.com
The industry has faced a challenging couple of years due to the fall in oil price. However, a modest recovery has seen renewed interest in growth opportunities. With our Darwin project having a break-even oil price of $40 per barrel, we are optimistic that we can attract partners to help with its appraisal and development HARRY DOBSON, NON-E XECUTIVE CHAIRMAN
Borders & Southern Petroleum plc Annual Report & Accounts 2016
02
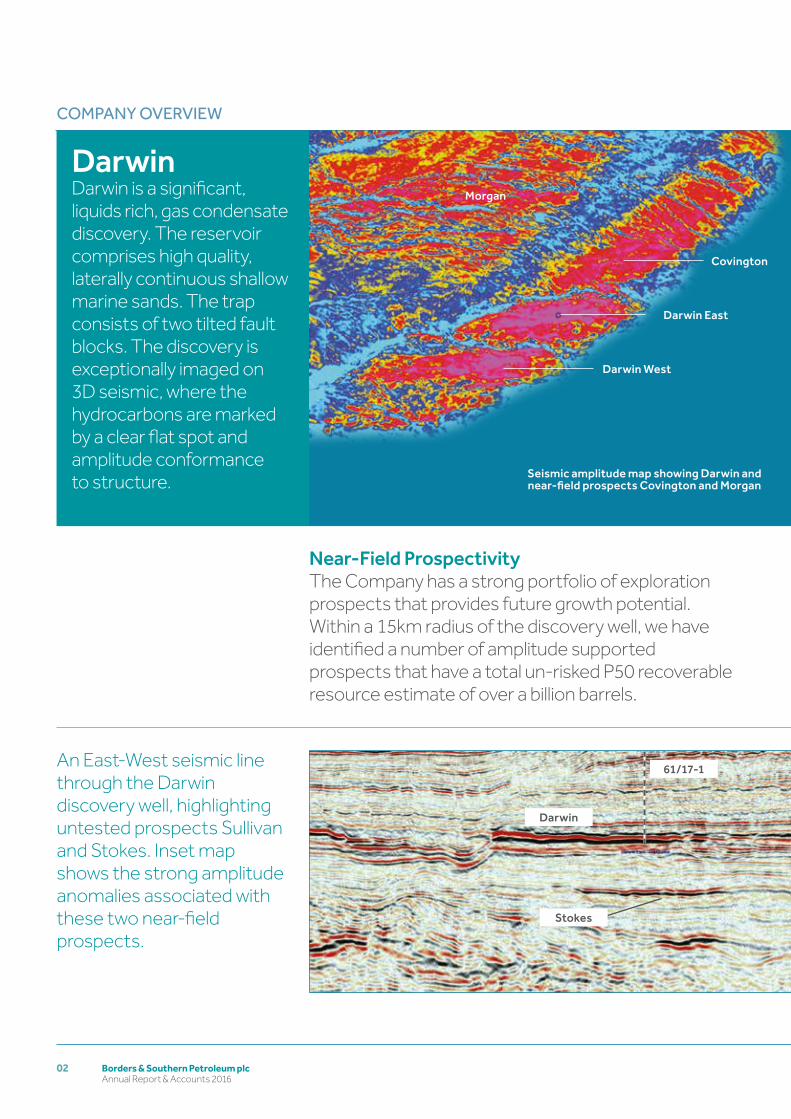
Covington
Morgan
Darwin East
Darwin West
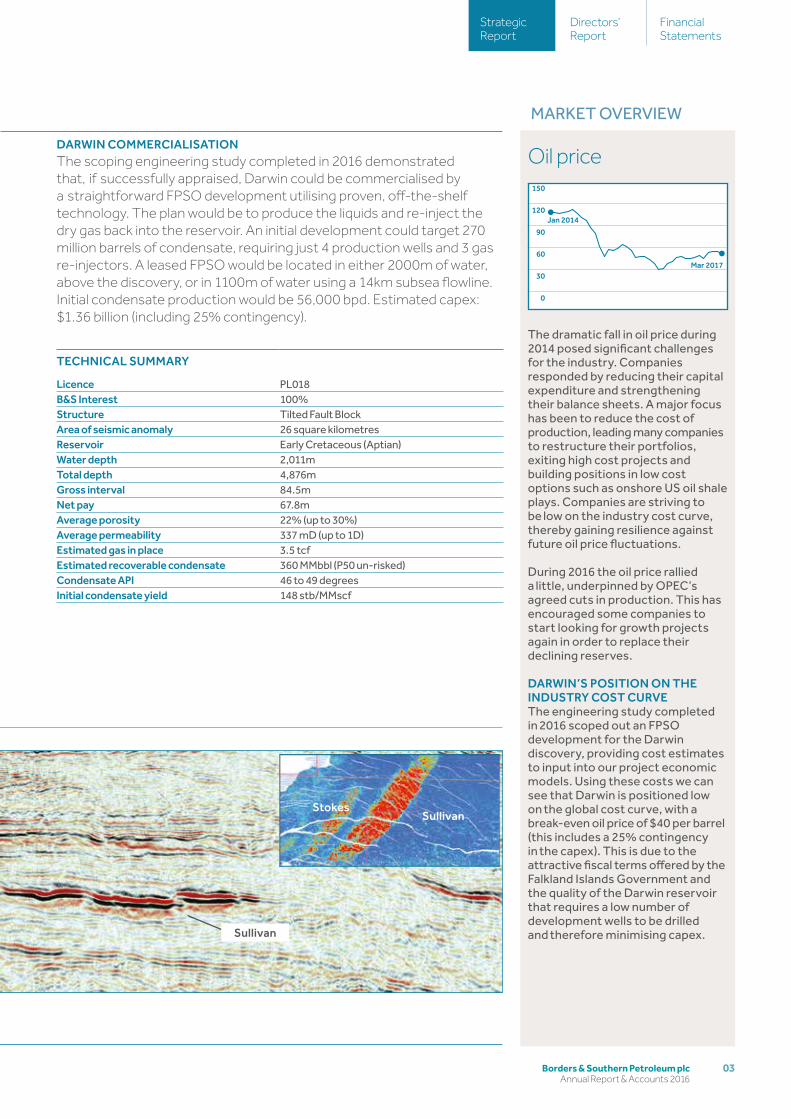
Seismic amplitude map showing Darwin and near-field prospects Covington and Morgan
COMPANY OVERVIEW
DarwinDarwin is a significant, liquids rich, gas condensate discovery. The reservoir comprises high quality, laterally continuous shallow marine sands. The trap consists of two tilted fault blocks. The discovery is exceptionally imaged on 3D seismic, where the hydrocarbons are marked by a clear flat spot and amplitude conformance to structure.
Near-Field ProspectivityThe Company has a strong portfolio of exploration prospects that provides future growth potential. Within a 15km radius of the discovery well, we have identified a number of amplitude supported prospects that have a total un-risked P50 recoverable resource estimate of over a billion barrels.
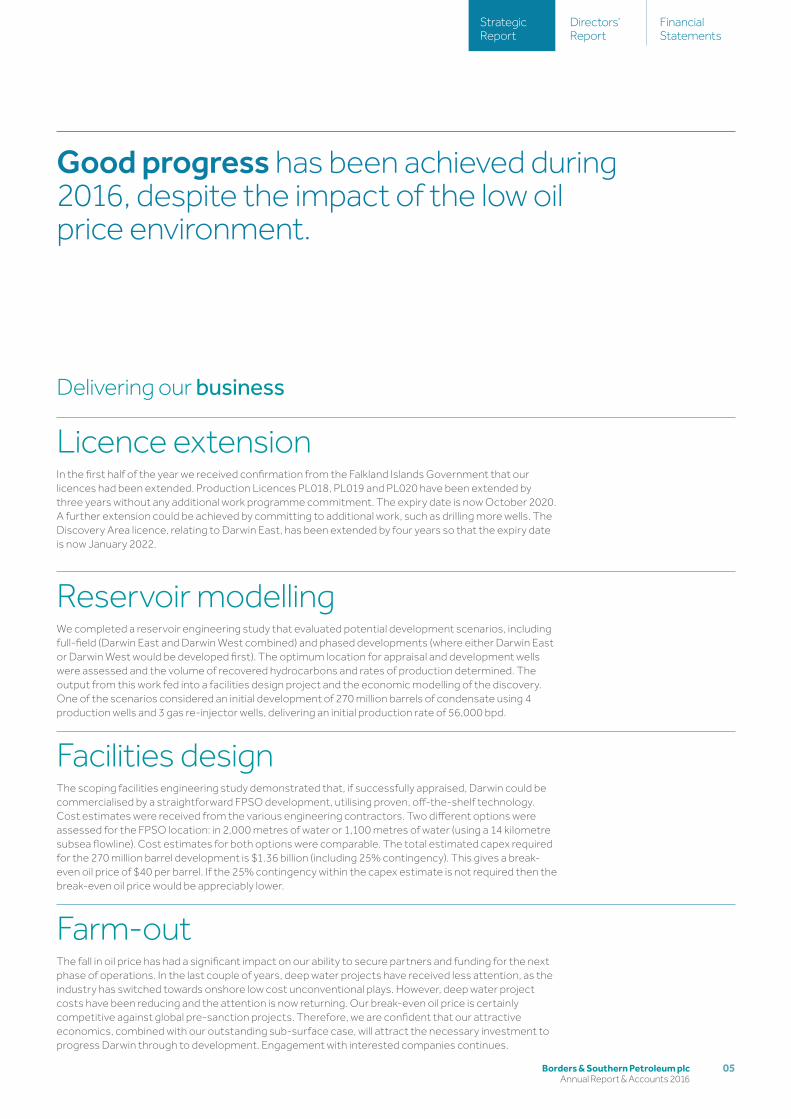
An East-West seismic line through the Darwin discovery well, highlighting untested prospects Sullivan and Stokes. Inset map shows the strong amplitude anomalies associated with these two near-field prospects.
61/17-1
Darwin
Stokes
03Borders & Southern Petroleum plc Annual Report & Accounts 2016
FinancialStatements
Directors’ Report
StrategicReport
DARWIN COMMERCIALISATION The scoping engineering study completed in 2016 demonstrated that, if successfully appraised, Darwin could be commercialised by a straightforward FPSO development utilising proven, off-the-shelf technology. The plan would be to produce the liquids and re-inject the dry gas back into the reservoir. An initial development could target 270 million barrels of condensate, requiring just 4 production wells and 3 gas re-injectors. A leased FPSO would be located in either 2000m of water, above the discovery, or in 1100m of water using a 14km subsea flowline. Initial condensate production would be 56,000 bpd. Estimated capex: $1.36 billion (including 25% contingency).
MARKET OVERVIEW
TECHNICAL SUMMARY
Licence PL018B&S Interest 100%Structure Tilted Fault BlockArea of seismic anomaly 26 square kilometresReservoir Early Cretaceous (Aptian)Water depth 2,011mTotal depth 4,876mGross interval 84.5mNet pay 67.8mAverage porosity 22% (up to 30%)Average permeability 337 mD (up to 1D)Estimated gas in place 3.5 tcfEstimated recoverable condensate 360 MMbbl (P50 un-risked)Condensate API 46 to 49 degreesInitial condensate yield 148 stb/MMscf
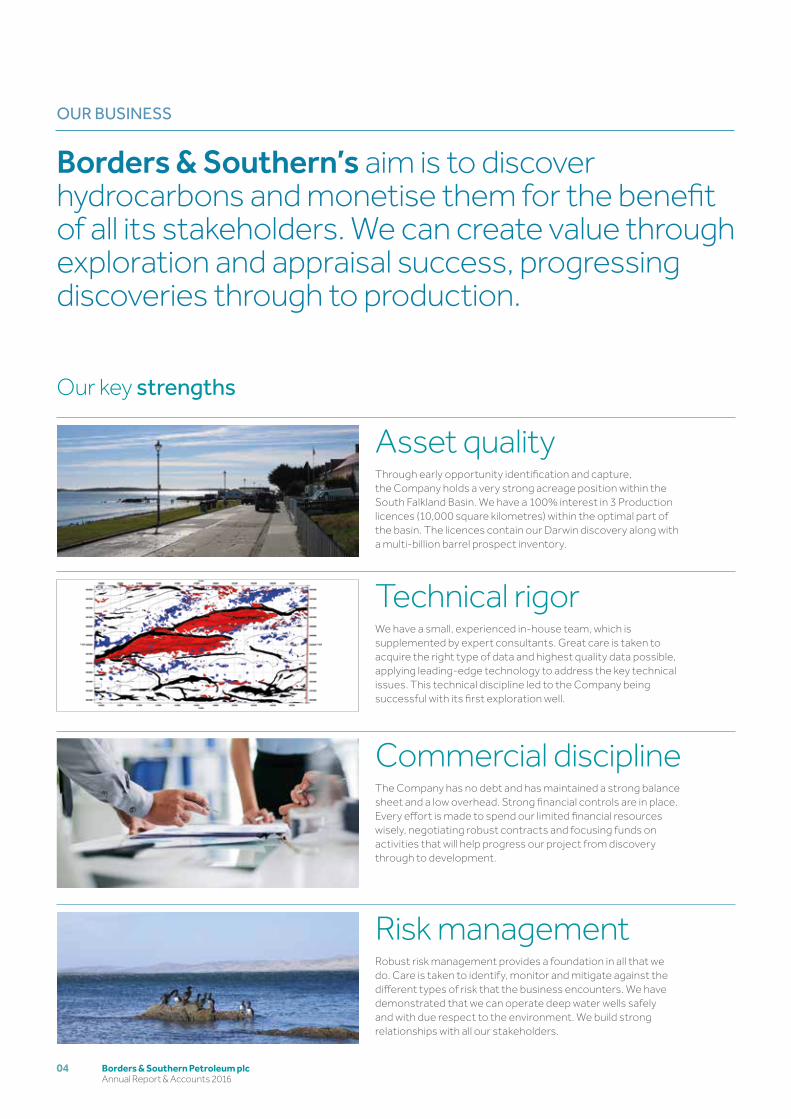
Oil price
0
30
60
90
120
150
Jan 2014
Mar 2017
The dramatic fall in oil price during 2014 posed significant challenges for the industry. Companies responded by reducing their capital expenditure and strengthening their balance sheets. A major focus has been to reduce the cost of production, leading many companies to restructure their portfolios, exiting high cost projects and building positions in low cost options such as onshore US oil shale plays. Companies are striving to be low on the industry cost curve, thereby gaining resilience against future oil price fluctuations.
During 2016 the oil price rallied a little, underpinned by OPEC’s agreed cuts in production. This has encouraged some companies to start looking for growth projects again in order to replace their declining reserves.
DARWIN’S POSITION ON THE INDUSTRY COST CURVE The engineering study completed in 2016 scoped out an FPSO development for the Darwin discovery, providing cost estimates to input into our project economic models. Using these costs we can see that Darwin is positioned low on the global cost curve, with a break-even oil price of $40 per barrel (this includes a 25% contingency in the capex). This is due to the attractive fiscal terms offered by the Falkland Islands Government and the quality of the Darwin reservoir that requires a low number of development wells to be drilled and therefore minimising capex.
StokesSullivan
Sullivan
Borders & Southern Petroleum plc Annual Report & Accounts 2016
04
OUR BUSINESS
Borders & Southern’s aim is to discover hydrocarbons and monetise them for the benefit of all its stakeholders. We can create value through exploration and appraisal success, progressing discoveries through to production.
Our key strengths Delivering our business
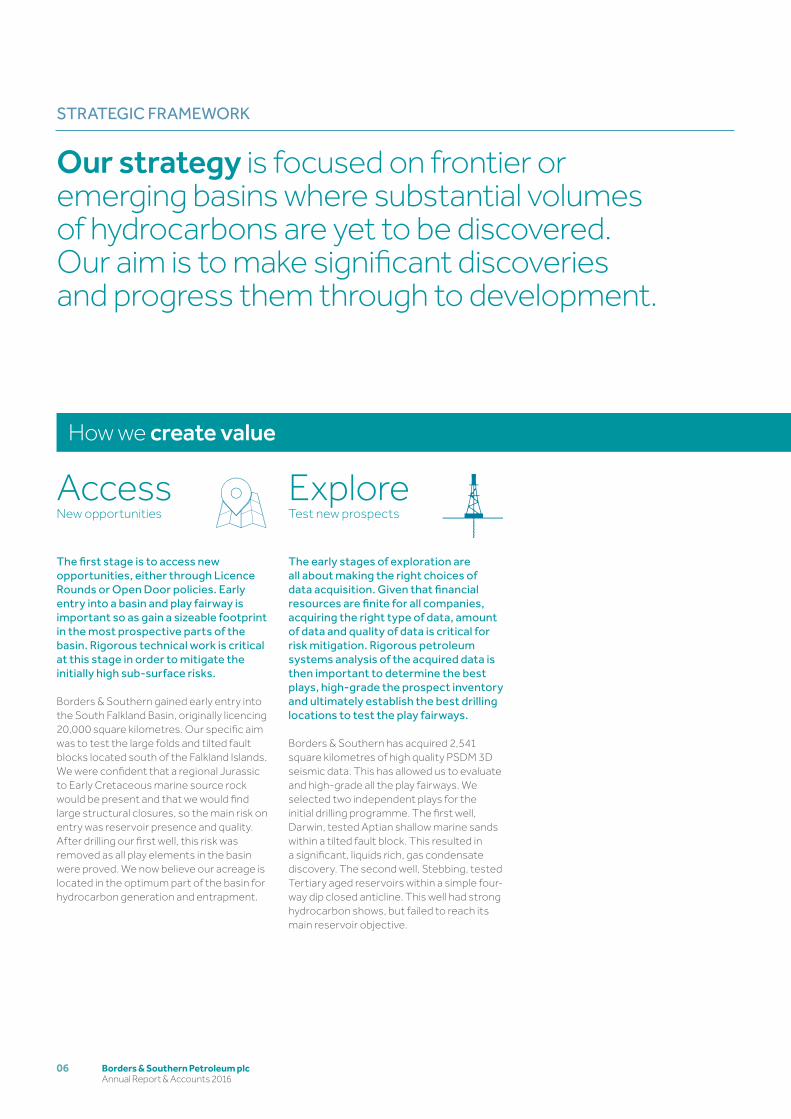
Asset qualityThrough early opportunity identification and capture, the Company holds a very strong acreage position within the South Falkland Basin. We have a 100% interest in 3 Production licences (10,000 square kilometres) within the optimal part of the basin. The licences contain our Darwin discovery along with a multi-billion barrel prospect inventory.
Licence extensionIn the first half of the year we received confirmation from the Falkland Islands Government that our licences had been extended. Production Licences PL018, PL019 and PL020 have been extended by three years without any additional work programme commitment. The expiry date is now October 2020. A further extension could be achieved by committing to additional work, such as drilling more wells. The Discovery Area licence, relating to Darwin East, has been extended by four years so that the expiry date is now January 2022.
Technical rigor We have a small, experienced in-house team, which is supplemented by expert consultants. Great care is taken to acquire the right type of data and highest quality data possible, applying leading-edge technology to address the key technical issues. This technical discipline led to the Company being successful with its first exploration well.
Reservoir modelling We completed a reservoir engineering study that evaluated potential development scenarios, including full-field (Darwin East and Darwin West combined) and phased developments (where either Darwin East or Darwin West would be developed first). The optimum location for appraisal and development wells were assessed and the volume of recovered hydrocarbons and rates of production determined. The output from this work fed into a facilities design project and the economic modelling of the discovery. One of the scenarios considered an initial development of 270 million barrels of condensate using 4 production wells and 3 gas re-injector wells, delivering an initial production rate of 56,000 bpd.
Commercial discipline The Company has no debt and has maintained a strong balance sheet and a low overhead. Strong financial controls are in place. Every effort is made to spend our limited financial resources wisely, negotiating robust contracts and focusing funds on activities that will help progress our project from discovery through to development.
Facilities design The scoping facilities engineering study demonstrated that, if successfully appraised, Darwin could be commercialised by a straightforward FPSO development, utilising proven, off-the-shelf technology. Cost estimates were received from the various engineering contractors. Two different options were assessed for the FPSO location: in 2,000 metres of water or 1,100 metres of water (using a 14 kilometre subsea flowline). Cost estimates for both options were comparable. The total estimated capex required for the 270 million barrel development is $1.36 billion (including 25% contingency). This gives a break-even oil price of $40 per barrel. If the 25% contingency within the capex estimate is not required then the break-even oil price would be appreciably lower.
Risk management Robust risk management provides a foundation in all that we do. Care is taken to identify, monitor and mitigate against the different types of risk that the business encounters. We have demonstrated that we can operate deep water wells safely and with due respect to the environment. We build strong relationships with all our stakeholders.
Farm-outThe fall in oil price has had a significant impact on our ability to secure partners and funding for the next phase of operations. In the last couple of years, deep water projects have received less attention, as the industry has switched towards onshore low cost unconventional plays. However, deep water project costs have been reducing and the attention is now returning. Our break-even oil price is certainly competitive against global pre-sanction projects. Therefore, we are confident that our attractive economics, combined with our outstanding sub-surface case, will attract the necessary investment to progress Darwin through to development. Engagement with interested companies continues.
05Borders & Southern Petroleum plc Annual Report & Accounts 2016
FinancialStatements
Directors’ Report
StrategicReport
Good progress has been achieved during 2016, despite the impact of the low oil price environment.
Our key strengths Delivering our business
Asset qualityThrough early opportunity identification and capture, the Company holds a very strong acreage position within the South Falkland Basin. We have a 100% interest in 3 Production licences (10,000 square kilometres) within the optimal part of the basin. The licences contain our Darwin discovery along with a multi-billion barrel prospect inventory.
Licence extensionIn the first half of the year we received confirmation from the Falkland Islands Government that our licences had been extended. Production Licences PL018, PL019 and PL020 have been extended by three years without any additional work programme commitment. The expiry date is now October 2020. A further extension could be achieved by committing to additional work, such as drilling more wells. The Discovery Area licence, relating to Darwin East, has been extended by four years so that the expiry date is now January 2022.
Technical rigor We have a small, experienced in-house team, which is supplemented by expert consultants. Great care is taken to acquire the right type of data and highest quality data possible, applying leading-edge technology to address the key technical issues. This technical discipline led to the Company being successful with its first exploration well.
Reservoir modelling We completed a reservoir engineering study that evaluated potential development scenarios, including full-field (Darwin East and Darwin West combined) and phased developments (where either Darwin East or Darwin West would be developed first). The optimum location for appraisal and development wells were assessed and the volume of recovered hydrocarbons and rates of production determined. The output from this work fed into a facilities design project and the economic modelling of the discovery. One of the scenarios considered an initial development of 270 million barrels of condensate using 4 production wells and 3 gas re-injector wells, delivering an initial production rate of 56,000 bpd.
Commercial discipline The Company has no debt and has maintained a strong balance sheet and a low overhead. Strong financial controls are in place. Every effort is made to spend our limited financial resources wisely, negotiating robust contracts and focusing funds on activities that will help progress our project from discovery through to development.
Facilities design The scoping facilities engineering study demonstrated that, if successfully appraised, Darwin could be commercialised by a straightforward FPSO development, utilising proven, off-the-shelf technology. Cost estimates were received from the various engineering contractors. Two different options were assessed for the FPSO location: in 2,000 metres of water or 1,100 metres of water (using a 14 kilometre subsea flowline). Cost estimates for both options were comparable. The total estimated capex required for the 270 million barrel development is $1.36 billion (including 25% contingency). This gives a break-even oil price of $40 per barrel. If the 25% contingency within the capex estimate is not required then the break-even oil price would be appreciably lower.
Risk management Robust risk management provides a foundation in all that we do. Care is taken to identify, monitor and mitigate against the different types of risk that the business encounters. We have demonstrated that we can operate deep water wells safely and with due respect to the environment. We build strong relationships with all our stakeholders.
Farm-outThe fall in oil price has had a significant impact on our ability to secure partners and funding for the next phase of operations. In the last couple of years, deep water projects have received less attention, as the industry has switched towards onshore low cost unconventional plays. However, deep water project costs have been reducing and the attention is now returning. Our break-even oil price is certainly competitive against global pre-sanction projects. Therefore, we are confident that our attractive economics, combined with our outstanding sub-surface case, will attract the necessary investment to progress Darwin through to development. Engagement with interested companies continues.
Borders & Southern Petroleum plc Annual Report & Accounts 2016
06
STRATEGIC FRAMEWORK
How we create value How we add value
AccessNew opportunities
ExploreTest new prospects
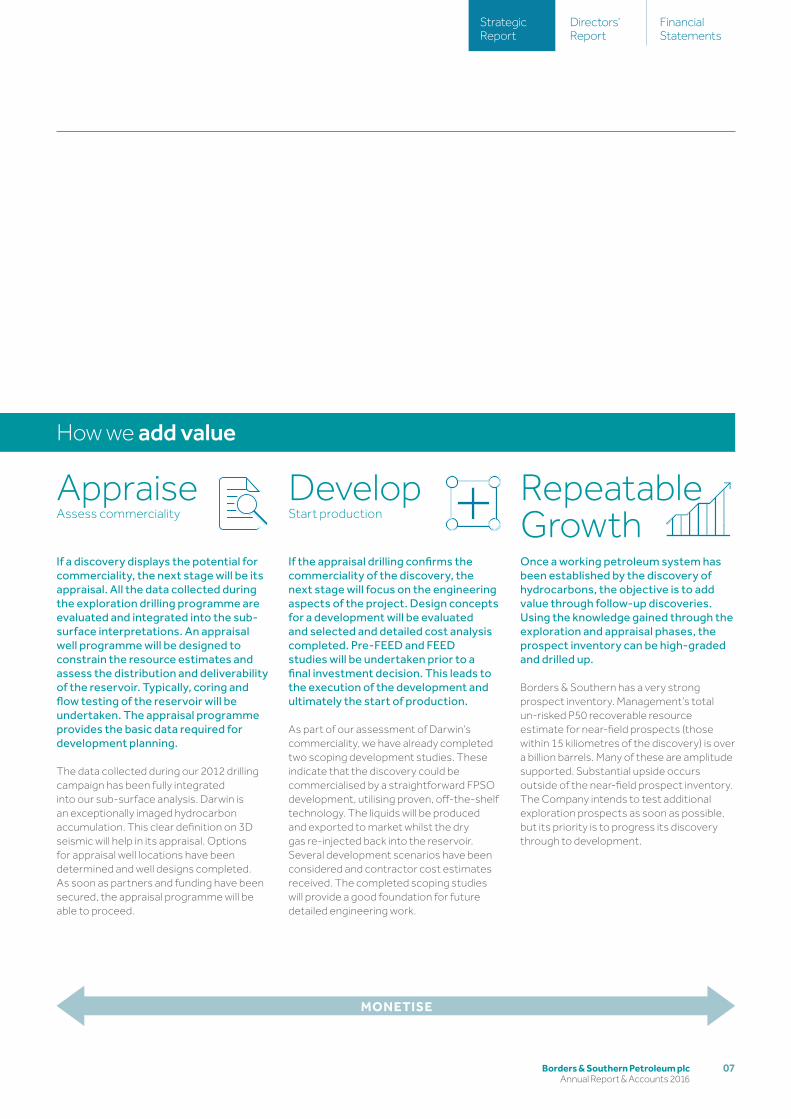
AppraiseAssess commerciality
DevelopStart production
RepeatableGrowth
The first stage is to access new opportunities, either through Licence Rounds or Open Door policies. Early entry into a basin and play fairway is important so as gain a sizeable footprint in the most prospective parts of the basin. Rigorous technical work is critical at this stage in order to mitigate the initially high sub-surface risks.
Borders & Southern gained early entry into the South Falkland Basin, originally licencing 20,000 square kilometres. Our specific aim was to test the large folds and tilted fault blocks located south of the Falkland Islands. We were confident that a regional Jurassic to Early Cretaceous marine source rock would be present and that we would find large structural closures, so the main risk on entry was reservoir presence and quality. After drilling our first well, this risk was removed as all play elements in the basin were proved. We now believe our acreage is located in the optimum part of the basin for hydrocarbon generation and entrapment.
The early stages of exploration are all about making the right choices of data acquisition. Given that financial resources are finite for all companies, acquiring the right type of data, amount of data and quality of data is critical for risk mitigation. Rigorous petroleum systems analysis of the acquired data is then important to determine the best plays, high-grade the prospect inventory and ultimately establish the best drilling locations to test the play fairways.
Borders & Southern has acquired 2,541 square kilometres of high quality PSDM 3D seismic data. This has allowed us to evaluate and high-grade all the play fairways. We selected two independent plays for the initial drilling programme. The first well, Darwin, tested Aptian shallow marine sands within a tilted fault block. This resulted in a significant, liquids rich, gas condensate discovery. The second well, Stebbing, tested Tertiary aged reservoirs within a simple four-way dip closed anticline. This well had strong hydrocarbon shows, but failed to reach its main reservoir objective.
If a discovery displays the potential for commerciality, the next stage will be its appraisal. All the data collected during the exploration drilling programme are evaluated and integrated into the sub-surface interpretations. An appraisal well programme will be designed to constrain the resource estimates and assess the distribution and deliverability of the reservoir. Typically, coring and flow testing of the reservoir will be undertaken. The appraisal programme provides the basic data required for development planning.
The data collected during our 2012 drilling campaign has been fully integrated into our sub-surface analysis. Darwin is an exceptionally imaged hydrocarbon accumulation. This clear definition on 3D seismic will help in its appraisal. Options for appraisal well locations have been determined and well designs completed. As soon as partners and funding have been secured, the appraisal programme will be able to proceed.
If the appraisal drilling confirms the commerciality of the discovery, the next stage will focus on the engineering aspects of the project. Design concepts for a development will be evaluated and selected and detailed cost analysis completed. Pre-FEED and FEED studies will be undertaken prior to a final investment decision. This leads to the execution of the development and ultimately the start of production.
As part of our assessment of Darwin’s commerciality, we have already completed two scoping development studies. These indicate that the discovery could be commercialised by a straightforward FPSO development, utilising proven, off-the-shelf technology. The liquids will be produced and exported to market whilst the dry gas re-injected back into the reservoir. Several development scenarios have been considered and contractor cost estimates received. The completed scoping studies will provide a good foundation for future detailed engineering work.
Once a working petroleum system has been established by the discovery of hydrocarbons, the objective is to add value through follow-up discoveries. Using the knowledge gained through the exploration and appraisal phases, the prospect inventory can be high-graded and drilled up.
Borders & Southern has a very strong prospect inventory. Management’s total un-risked P50 recoverable resource estimate for near-field prospects (those within 15 kiliometres of the discovery) is over a billion barrels. Many of these are amplitude supported. Substantial upside occurs outside of the near-field prospect inventory. The Company intends to test additional exploration prospects as soon as possible, but its priority is to progress its discovery through to development.
Our strategy is focused on frontier or emerging basins where substantial volumes of hydrocarbons are yet to be discovered. Our aim is to make significant discoveries and progress them through to development.
07Borders & Southern Petroleum plc Annual Report & Accounts 2016
FinancialStatements
Directors’ Report
StrategicReport
How we create value How we add value
AccessNew opportunities
ExploreTest new prospects
AppraiseAssess commerciality
DevelopStart production
RepeatableGrowth
The first stage is to access new opportunities, either through Licence Rounds or Open Door policies. Early entry into a basin and play fairway is important so as gain a sizeable footprint in the most prospective parts of the basin. Rigorous technical work is critical at this stage in order to mitigate the initially high sub-surface risks.
Borders & Southern gained early entry into the South Falkland Basin, originally licencing 20,000 square kilometres. Our specific aim was to test the large folds and tilted fault blocks located south of the Falkland Islands. We were confident that a regional Jurassic to Early Cretaceous marine source rock would be present and that we would find large structural closures, so the main risk on entry was reservoir presence and quality. After drilling our first well, this risk was removed as all play elements in the basin were proved. We now believe our acreage is located in the optimum part of the basin for hydrocarbon generation and entrapment.
The early stages of exploration are all about making the right choices of data acquisition. Given that financial resources are finite for all companies, acquiring the right type of data, amount of data and quality of data is critical for risk mitigation. Rigorous petroleum systems analysis of the acquired data is then important to determine the best plays, high-grade the prospect inventory and ultimately establish the best drilling locations to test the play fairways.
Borders & Southern has acquired 2,541 square kilometres of high quality PSDM 3D seismic data. This has allowed us to evaluate and high-grade all the play fairways. We selected two independent plays for the initial drilling programme. The first well, Darwin, tested Aptian shallow marine sands within a tilted fault block. This resulted in a significant, liquids rich, gas condensate discovery. The second well, Stebbing, tested Tertiary aged reservoirs within a simple four-way dip closed anticline. This well had strong hydrocarbon shows, but failed to reach its main reservoir objective.
If a discovery displays the potential for commerciality, the next stage will be its appraisal. All the data collected during the exploration drilling programme are evaluated and integrated into the sub-surface interpretations. An appraisal well programme will be designed to constrain the resource estimates and assess the distribution and deliverability of the reservoir. Typically, coring and flow testing of the reservoir will be undertaken. The appraisal programme provides the basic data required for development planning.
The data collected during our 2012 drilling campaign has been fully integrated into our sub-surface analysis. Darwin is an exceptionally imaged hydrocarbon accumulation. This clear definition on 3D seismic will help in its appraisal. Options for appraisal well locations have been determined and well designs completed. As soon as partners and funding have been secured, the appraisal programme will be able to proceed.
If the appraisal drilling confirms the commerciality of the discovery, the next stage will focus on the engineering aspects of the project. Design concepts for a development will be evaluated and selected and detailed cost analysis completed. Pre-FEED and FEED studies will be undertaken prior to a final investment decision. This leads to the execution of the development and ultimately the start of production.
As part of our assessment of Darwin’s commerciality, we have already completed two scoping development studies. These indicate that the discovery could be commercialised by a straightforward FPSO development, utilising proven, off-the-shelf technology. The liquids will be produced and exported to market whilst the dry gas re-injected back into the reservoir. Several development scenarios have been considered and contractor cost estimates received. The completed scoping studies will provide a good foundation for future detailed engineering work.
Once a working petroleum system has been established by the discovery of hydrocarbons, the objective is to add value through follow-up discoveries. Using the knowledge gained through the exploration and appraisal phases, the prospect inventory can be high-graded and drilled up.
Borders & Southern has a very strong prospect inventory. Management’s total un-risked P50 recoverable resource estimate for near-field prospects (those within 15 kiliometres of the discovery) is over a billion barrels. Many of these are amplitude supported. Substantial upside occurs outside of the near-field prospect inventory. The Company intends to test additional exploration prospects as soon as possible, but its priority is to progress its discovery through to development.
MONETISE
Borders & Southern Petroleum plc Annual Report & Accounts 2016
08
CEO’S STATEMENT
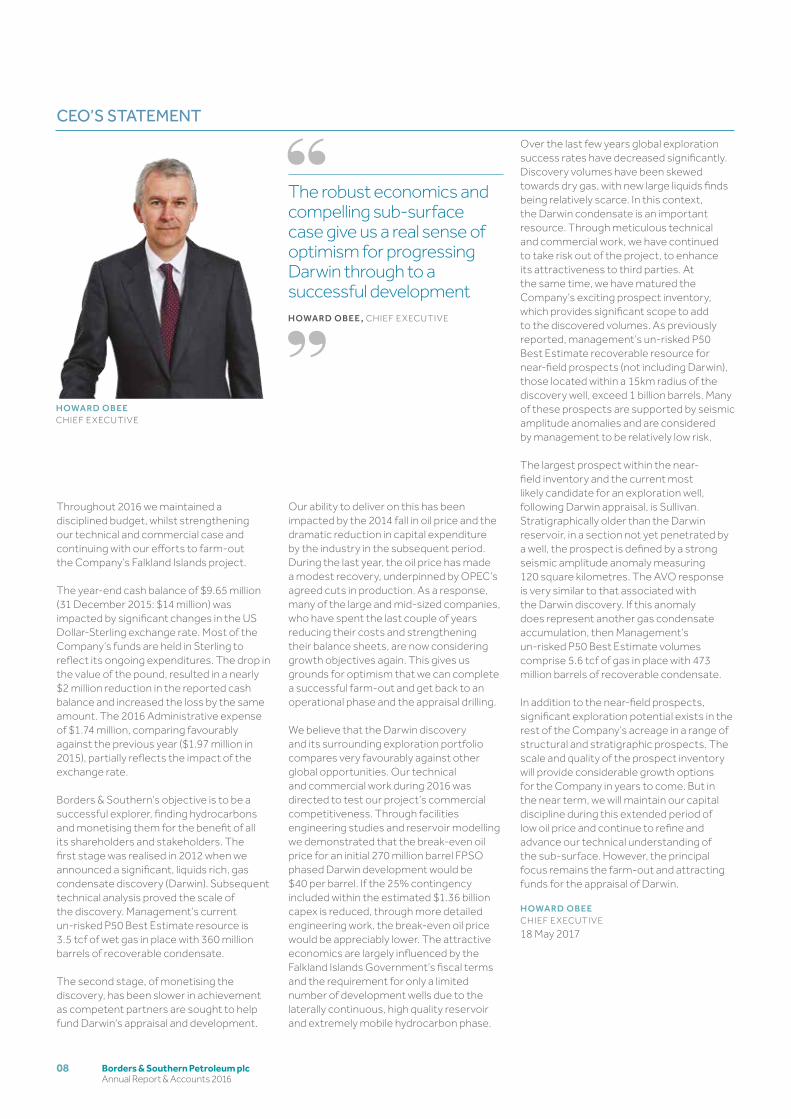
Throughout 2016 we maintained a disciplined budget, whilst strengthening our technical and commercial case and continuing with our efforts to farm-out the Company’s Falkland Islands project.
The year-end cash balance of $9.65 million (31 December 2015: $14 million) was impacted by significant changes in the US Dollar-Sterling exchange rate. Most of the Company’s funds are held in Sterling to reflect its ongoing expenditures. The drop in the value of the pound, resulted in a nearly $2 million reduction in the reported cash balance and increased the loss by the same amount. The 2016 Administrative expense of $1.74 million, comparing favourably against the previous year ($1.97 million in 2015), partially reflects the impact of the exchange rate.
Borders & Southern’s objective is to be a successful explorer, finding hydrocarbons and monetising them for the benefit of all its shareholders and stakeholders. The first stage was realised in 2012 when we announced a significant, liquids rich, gas condensate discovery (Darwin). Subsequent technical analysis proved the scale of the discovery. Management’s current un-risked P50 Best Estimate resource is 3.5 tcf of wet gas in place with 360 million barrels of recoverable condensate.
The second stage, of monetising the discovery, has been slower in achievement as competent partners are sought to help fund Darwin’s appraisal and development.
Our ability to deliver on this has been impacted by the 2014 fall in oil price and the dramatic reduction in capital expenditure by the industry in the subsequent period. During the last year, the oil price has made a modest recovery, underpinned by OPEC’s agreed cuts in production. As a response, many of the large and mid-sized companies, who have spent the last couple of years reducing their costs and strengthening their balance sheets, are now considering growth objectives again. This gives us grounds for optimism that we can complete a successful farm-out and get back to an operational phase and the appraisal drilling.
We believe that the Darwin discovery and its surrounding exploration portfolio compares very favourably against other global opportunities. Our technical and commercial work during 2016 was directed to test our project’s commercial competitiveness. Through facilities engineering studies and reservoir modelling we demonstrated that the break-even oil price for an initial 270 million barrel FPSO phased Darwin development would be $40 per barrel. If the 25% contingency included within the estimated $1.36 billion capex is reduced, through more detailed engineering work, the break-even oil price would be appreciably lower. The attractive economics are largely influenced by the Falkland Islands Government’s fiscal terms and the requirement for only a limited number of development wells due to the laterally continuous, high quality reservoir and extremely mobile hydrocarbon phase.
HOWARD OBEECHIEF E XECUTIVE
The robust economics and compelling sub-surface case give us a real sense of optimism for progressing Darwin through to a successful developmentHOWARD OBEE , CHIEF E XECUTIVE
Over the last few years global exploration success rates have decreased significantly. Discovery volumes have been skewed towards dry gas, with new large liquids finds being relatively scarce. In this context, the Darwin condensate is an important resource. Through meticulous technical and commercial work, we have continued to take risk out of the project, to enhance its attractiveness to third parties. At the same time, we have matured the Company’s exciting prospect inventory, which provides significant scope to add to the discovered volumes. As previously reported, management’s un-risked P50 Best Estimate recoverable resource for near-field prospects (not including Darwin), those located within a 15km radius of the discovery well, exceed 1 billion barrels. Many of these prospects are supported by seismic amplitude anomalies and are considered by management to be relatively low risk.
The largest prospect within the near-field inventory and the current most likely candidate for an exploration well, following Darwin appraisal, is Sullivan. Stratigraphically older than the Darwin reservoir, in a section not yet penetrated by a well, the prospect is defined by a strong seismic amplitude anomaly measuring 120 square kilometres. The AVO response is very similar to that associated with the Darwin discovery. If this anomaly does represent another gas condensate accumulation, then Management’s un-risked P50 Best Estimate volumes comprise 5.6 tcf of gas in place with 473 million barrels of recoverable condensate.
In addition to the near-field prospects, significant exploration potential exists in the rest of the Company’s acreage in a range of structural and stratigraphic prospects. The scale and quality of the prospect inventory will provide considerable growth options for the Company in years to come. But in the near term, we will maintain our capital discipline during this extended period of low oil price and continue to refine and advance our technical understanding of the sub-surface. However, the principal focus remains the farm-out and attracting funds for the appraisal of Darwin.
HOWARD OBEECHIEF E XECUTIVE
18 May 2017
09Borders & Southern Petroleum plc Annual Report & Accounts 2016
FinancialStatements
Directors’ Report
StrategicReport
PRINCIPAL RISKS AND UNCERTAINTIES
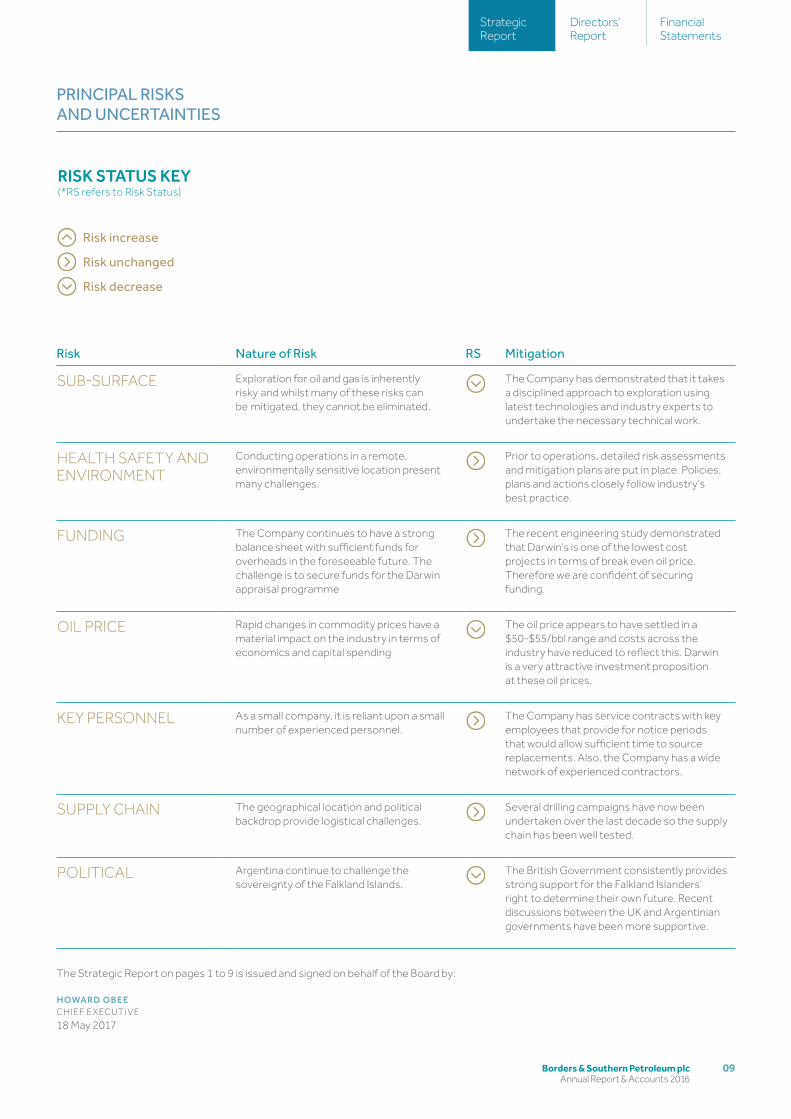
RISK STATUS KEY (*RS refers to Risk Status)
Risk increase
Risk unchanged
Risk decrease
Risk Nature of Risk RS Mitigation
SUB-SURFACE Exploration for oil and gas is inherently risky and whilst many of these risks can be mitigated, they cannot be eliminated.
The Company has demonstrated that it takes a disciplined approach to exploration using latest technologies and industry experts to undertake the necessary technical work.
HEALTH SAFETY AND ENVIRONMENT
Conducting operations in a remote, environmentally sensitive location present many challenges.
Prior to operations, detailed risk assessments and mitigation plans are put in place. Policies, plans and actions closely follow industry’s best practice.
FUNDING The Company continues to have a strong balance sheet with sufficient funds for overheads in the foreseeable future. The challenge is to secure funds for the Darwin appraisal programme
The recent engineering study demonstrated that Darwin’s is one of the lowest cost projects in terms of break even oil price. Therefore we are confident of securing funding.
OIL PRICE Rapid changes in commodity prices have a material impact on the industry in terms of economics and capital spending
The oil price appears to have settled in a $50-$55/bbl range and costs across the industry have reduced to reflect this. Darwin is a very attractive investment proposition at these oil prices.
KEY PERSONNEL As a small company, it is reliant upon a small number of experienced personnel.
The Company has service contracts with keyemployees that provide for notice periods that would allow sufficient time to sourcereplacements. Also, the Company has a wide network of experienced contractors.
SUPPLY CHAIN The geographical location and political backdrop provide logistical challenges.
Several drilling campaigns have now been undertaken over the last decade so the supply chain has been well tested.
POLITICAL Argentina continue to challenge the sovereignty of the Falkland Islands.
The British Government consistently providesstrong support for the Falkland Islanders’ right to determine their own future. Recent discussions between the UK and Argentinian governments have been more supportive.
The Strategic Report on pages 1 to 9 is issued and signed on behalf of the Board by:
HOWARD OBEECHIEF E XECUTIVE
18 May 2017
Borders & Southern Petroleum plc Annual Report & Accounts 2016
10
Borders & Southern recognises that an effective Board facilitates the efficient discharge of the duties imposed by law on Directors and contributes to the delivery of the Company’s strategic objectives. Accordingly, Borders & Southern has structured its Board so that it:• has a proper understanding of, and the
competencies to deal with, the current and emerging issues in the Company’s business;
• exercises independent judgement; and• effectively reviews and challenges
management’s performance. The Board currently comprises the Chairman, two Executive Directors and one Non-Executive Director. Each of the Executive Directors has extensive knowledge of the oil and gas industry combined with general business and financial skills. All of the Directors bring independent judgement to bear on issues of strategy, performance, resources, key appointments and standards. The Board meets regularly throughout the year and all the necessary information is supplied to the Directors on a timely basis to enable them to discharge their duties effectively.
All Directors retire by rotation.
I regularly review the composition and structure of the Board to ensure it both meets industry good practice and is fit for purpose given where the Company is in terms of its development and scale.
MY ROLE AS CHAIRMANI was appointed Chairman of the Company at its inception. As Chairman, I am responsible for the effective running of the Board and for ensuring that it plays a constructive role in the development of the Company. Together with the Chief Executive Officer, I also set and run the agenda for Board meetings.
ROLES OF THE NON-EXECUTIVE DIRECTORNigel Hurst-Brown brings a wealth of business experience to the Board and its Committees. He provides independent views on the Company’s performance, operations and strategy.
REMUNERATION COMMITTEEThe Board has a Remuneration Committee comprising two Non-Executive Directors. The members of the Remuneration Committee and their attendance at
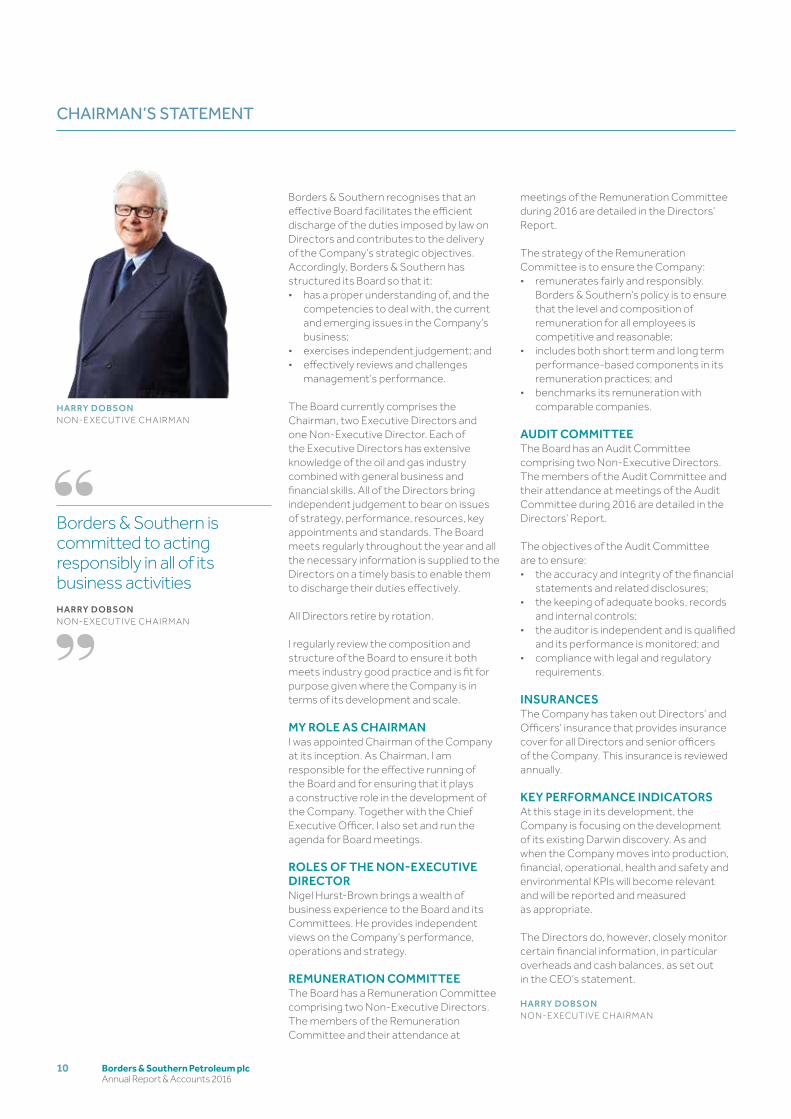
CHAIRMAN’S STATEMENT
HARRY DOBSONNON-E XECUTIVE CHAIRMAN
Borders & Southern is committed to acting responsibly in all of its business activitiesHARRY DOBSONNON-E XECUTIVE CHAIRMAN
meetings of the Remuneration Committee during 2016 are detailed in the Directors’ Report.
The strategy of the Remuneration Committee is to ensure the Company: • remunerates fairly and responsibly.
Borders & Southern’s policy is to ensure that the level and composition of remuneration for all employees is competitive and reasonable;
• includes both short term and long term performance-based components in its remuneration practices; and
• benchmarks its remuneration with comparable companies.
AUDIT COMMITTEEThe Board has an Audit Committee comprising two Non-Executive Directors. The members of the Audit Committee and their attendance at meetings of the Audit Committee during 2016 are detailed in the Directors’ Report.
The objectives of the Audit Committee are to ensure:• the accuracy and integrity of the financial
statements and related disclosures;• the keeping of adequate books, records
and internal controls;• the auditor is independent and is qualified
and its performance is monitored; and• compliance with legal and regulatory
requirements.
INSURANCESThe Company has taken out Directors’ and Officers’ insurance that provides insurance cover for all Directors and senior officers of the Company. This insurance is reviewed annually.
KEY PERFORMANCE INDICATORSAt this stage in its development, the Company is focusing on the development of its existing Darwin discovery. As and when the Company moves into production, financial, operational, health and safety and environmental KPIs will become relevant and will be reported and measured as appropriate.
The Directors do, however, closely monitor certain financial information, in particular overheads and cash balances, as set out in the CEO’s statement.
HARRY DOBSONNON-E XECUTIVE CHAIRMAN

11Borders & Southern Petroleum plc Annual Report & Accounts 2016
FinancialStatements
Directors’ Report
StrategicReport
Harry Dobson is a former investment banker and senior partner of Yorkton Securities. He currently engages in various merchant banking and venture capital activities in North America and Europe, and has acted as Chairman of a number of resource companies including American Pacific Mining Company Inc., Lytton Minerals Limited, Kirkland Lake Gold Inc and Rambler Metals and Mining plc. He is experienced in the organisation and funding of resource projects, including those located in inaccessible locations.
Harry is Chairman of the Remuneration Committee and sits on the Audit Committee.
Howard Obee was appointed Chief Executive when the Company was incorporated in June 2004. He has a PhD in structural geology from Imperial College and has spent over 30 years in the oil industry, initially with BP (1985–1992), and subsequently with BHP Billiton (1992–2004). He trained as an exploration geologist and has held numerous technical and commercial roles, incorporating exploration, new ventures, strategic planning and business development. He has experience of executing seismic and drilling programmes in frontier basins, including those in deep water.
Peter Fleming has over 20 years of upstream oil and gas experience, the majority of which was gained at BHP Billiton both in London and Melbourne. Whilst at BHP Billiton, Peter held senior positions in exploration and business development, investment evaluation, acquisitions and disposals and strategic planning. He holds masters degrees in business administration and finance.
Since qualifying as a Chartered Accountant, Nigel Hurst-Brown has pursued a career in fund management. From 1986 to 1990 he was Chairman of Lloyd’s Investment Managers. In 1990 he moved to Mercury Asset Management as a main Board Director and following Mercury’s acquisition by Merrill Lynch in 1997 became a Managing Director of Merrill Lynch Investment Managers. Currently he is Chief Executive of Hotchkis and Wiley (UK) Limited and a member of the Executive Committee of its US parent Hotchkis and Wiley Capital Management LLC and Non-Executive Chairman of Central Asia Metals plc.
Nigel is Chairman of the Audit Committee and sits on the Remuneration Committee.
CORPORATE GOVERNANCE – BOARD OF DIRECTORS
HOWARD OBEECHIEF E XECUTIVE
HARRY DOBSONNON-E XECUTIVE CHAIRMAN
PETER FLEMINGFINANCE DIRECTOR
NIGEL HURST-BROWNNON-E XECUTIVE DIRECTOR
A AR RE E
A Audit Committee
R Remuneration Committee
E Executive Director
Borders & Southern Petroleum plc Annual Report & Accounts 2016
12
CORPORATE RESPONSIBILITY
Conducting business in a responsible and sustainable way
Focusing on limiting and mitigating the environmental impact
Ensuring health and safety practices follow best practice
Using local suppliers and service providers where possible
Throughout its history, the Company has demonstrated that it conducts its activities in a responsible and sustainable way in line with industry best practices.
13Borders & Southern Petroleum plc Annual Report & Accounts 2016
FinancialStatements
Directors’ Report
StrategicReport
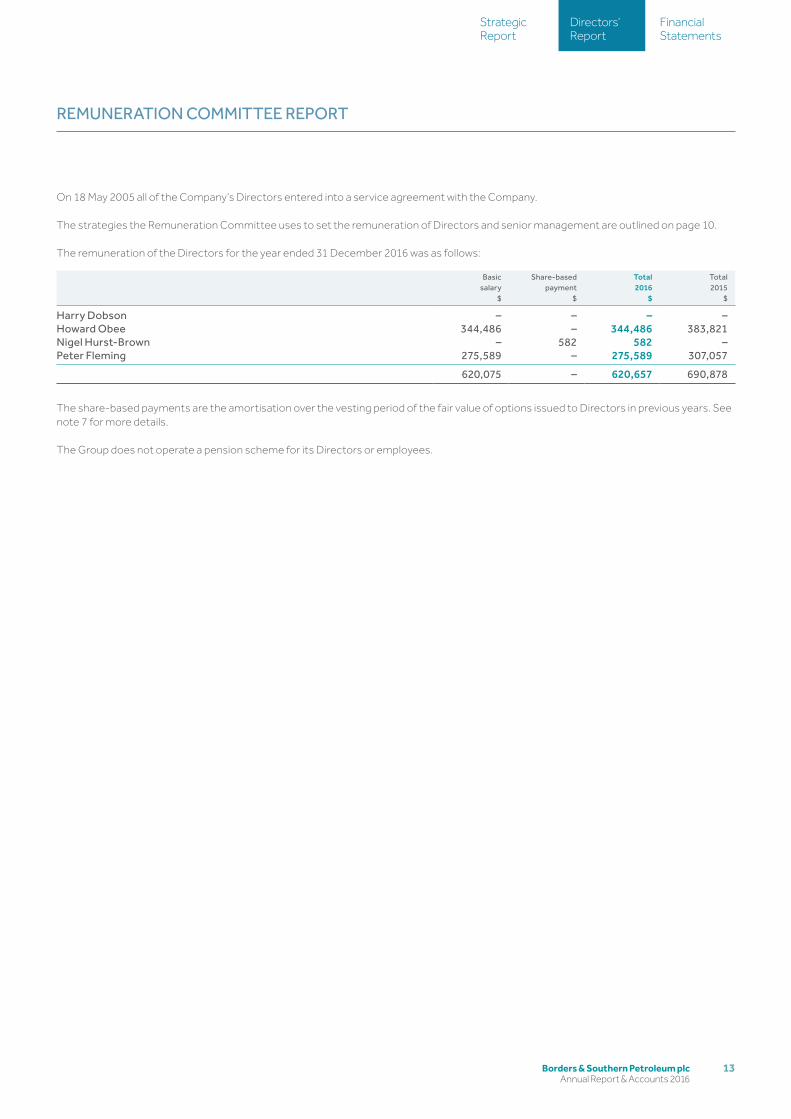
On 18 May 2005 all of the Company’s Directors entered into a service agreement with the Company.
The strategies the Remuneration Committee uses to set the remuneration of Directors and senior management are outlined on page 10.
The remuneration of the Directors for the year ended 31 December 2016 was as follows:
Basic salary
$
Share-based payment
$
Total2016
$
Total 2015
$
Harry Dobson – – – –Howard Obee 344,486 – 344,486 383,821Nigel Hurst-Brown – 582 582 –Peter Fleming 275,589 – 275,589 307,057
620,075 – 620,657 690,878
The share-based payments are the amortisation over the vesting period of the fair value of options issued to Directors in previous years. See note 7 for more details.
The Group does not operate a pension scheme for its Directors or employees.
REMUNERATION COMMITTEE REPORT
Borders & Southern Petroleum plc Annual Report & Accounts 2016
14
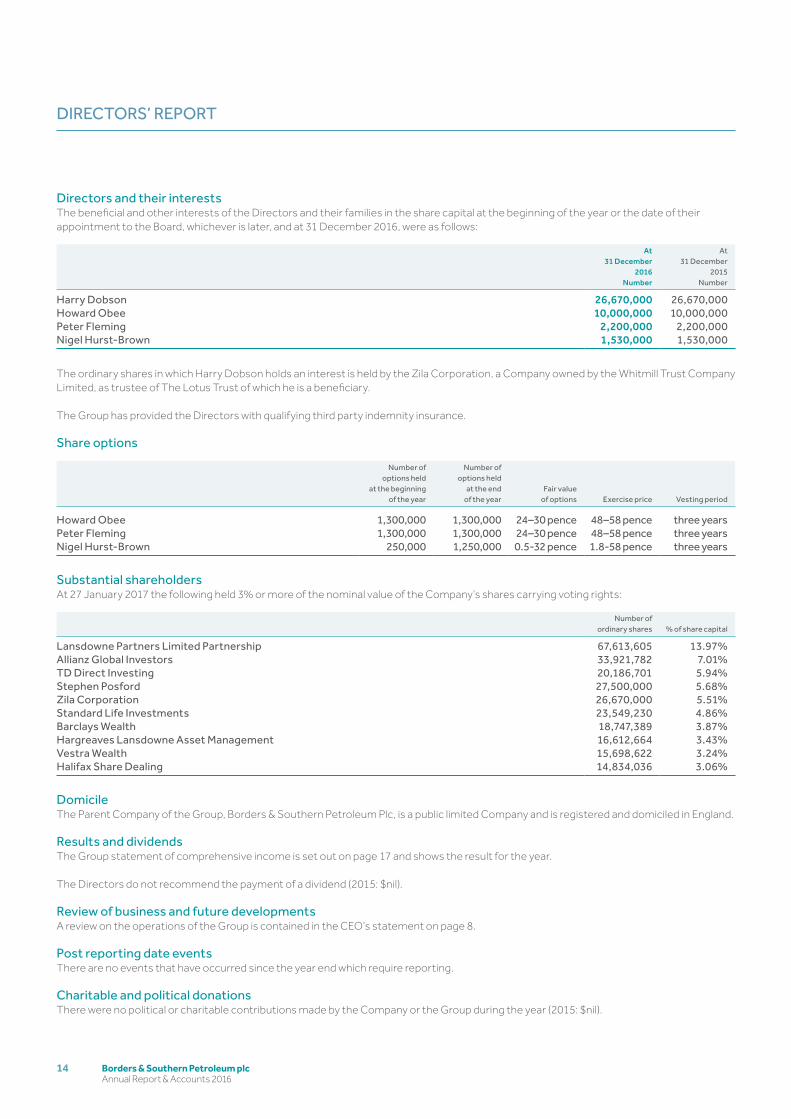
Directors and their interestsThe beneficial and other interests of the Directors and their families in the share capital at the beginning of the year or the date of their appointment to the Board, whichever is later, and at 31 December 2016, were as follows:
At 31 December
2016Number
At 31 December
2015Number
Harry Dobson 26,670,000 26,670,000Howard Obee 10,000,000 10,000,000Peter Fleming 2,200,000 2,200,000Nigel Hurst-Brown 1,530,000 1,530,000
The ordinary shares in which Harry Dobson holds an interest is held by the Zila Corporation, a Company owned by the Whitmill Trust Company Limited, as trustee of The Lotus Trust of which he is a beneficiary.
The Group has provided the Directors with qualifying third party indemnity insurance.
Share options
Number of options held
at the beginningof the year
Number of options held
at the endof the year
Fair value of options Exercise price Vesting period
Howard Obee 1,300,000 1,300,000 24–30 pence 48–58 pence three yearsPeter Fleming 1,300,000 1,300,000 24–30 pence 48–58 pence three yearsNigel Hurst-Brown 250,000 1,250,000 0.5-32 pence 1.8-58 pence three years
Substantial shareholdersAt 27 January 2017 the following held 3% or more of the nominal value of the Company’s shares carrying voting rights:
Number ofordinary shares % of share capital
Lansdowne Partners Limited Partnership 67,613,605 13.97%Allianz Global Investors 33,921,782 7.01%TD Direct Investing 20,186,701 5.94%Stephen Posford 27,500,000 5.68%Zila Corporation 26,670,000 5.51%Standard Life Investments 23,549,230 4.86%Barclays Wealth 18,747,389 3.87%Hargreaves Lansdowne Asset Management 16,612,664 3.43%Vestra Wealth 15,698,622 3.24%Halifax Share Dealing 14,834,036 3.06%
DomicileThe Parent Company of the Group, Borders & Southern Petroleum Plc, is a public limited Company and is registered and domiciled in England.
Results and dividendsThe Group statement of comprehensive income is set out on page 17 and shows the result for the year.
The Directors do not recommend the payment of a dividend (2015: $nil).
Review of business and future developments A review on the operations of the Group is contained in the CEO’s statement on page 8.
Post reporting date eventsThere are no events that have occurred since the year end which require reporting.
Charitable and political donationsThere were no political or charitable contributions made by the Company or the Group during the year (2015: $nil).
DIRECTORS’ REPORT
15Borders & Southern Petroleum plc Annual Report & Accounts 2016
FinancialStatements
Directors’ Report
StrategicReport
Financial instrumentsDetails of the use of financial instruments by the Company and its subsidiary undertaking are contained in note 20 of the financial statements.
Directors’ responsibilitiesThe Directors are responsible for preparing the Directors’ report, the Strategic report and the financial statements in accordance with applicable law and regulations.
Company law requires the Directors to prepare financial statements for each financial year. Under that law the Directors have prepared the Group and Company financial statements in accordance with International Financial Reporting Standards (IFRSs) as adopted by the European Union. Under Company law the Directors must not approve the financial statements unless they are satisfied that they give a true and fair view of the state of affairs of the Group and Company and of the profit or loss of the Group for that period. The Directors are also required to prepare financial statements in accordance with the rules of the London Stock Exchange for companies trading securities on AIM.
In preparing these financial statements, the Directors are required to:• select suitable accounting policies and then apply them consistently;• make judgements and accounting estimates that are reasonable and prudent; • state whether they have been prepared in accordance with IFRSs as adopted by the European Union, subject to any material departures
disclosed and explained in the financial statements; and• prepare the financial statements on the going concern basis unless it is inappropriate to presume that the Company will continue
in business.
The Directors are responsible for keeping adequate accounting records that are sufficient to show and explain the Company’s transactions and disclose with reasonable accuracy at any time the financial position of the Company and enable them to ensure that the financial statements comply with the requirements of the Companies Act 2006. They are also responsible for safeguarding the assets of the Company and hence for taking reasonable steps for the prevention and detection of fraud and other irregularities.
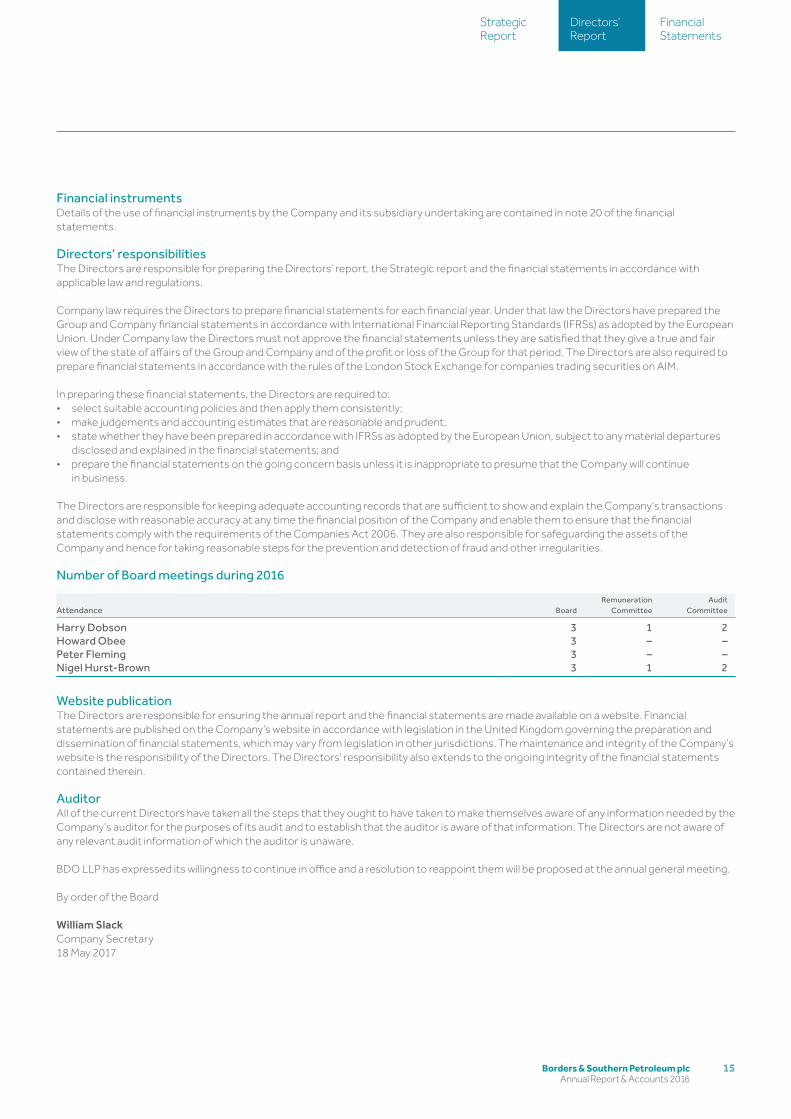
Number of Board meetings during 2016
Attendance BoardRemuneration
CommitteeAudit
Committee
Harry Dobson 3 1 2Howard Obee 3 – –Peter Fleming 3 – –Nigel Hurst-Brown 3 1 2
Website publicationThe Directors are responsible for ensuring the annual report and the financial statements are made available on a website. Financial statements are published on the Company’s website in accordance with legislation in the United Kingdom governing the preparation and dissemination of financial statements, which may vary from legislation in other jurisdictions. The maintenance and integrity of the Company’s website is the responsibility of the Directors. The Directors’ responsibility also extends to the ongoing integrity of the financial statements contained therein.
AuditorAll of the current Directors have taken all the steps that they ought to have taken to make themselves aware of any information needed by the Company’s auditor for the purposes of its audit and to establish that the auditor is aware of that information. The Directors are not aware of any relevant audit information of which the auditor is unaware.
BDO LLP has expressed its willingness to continue in office and a resolution to reappoint them will be proposed at the annual general meeting.
By order of the Board
William SlackCompany Secretary18 May 2017
Borders & Southern Petroleum plc Annual Report & Accounts 2016
16
We have audited the financial statements of Borders & Southern Petroleum Plc for the year ended 31 December 2016 which comprise the consolidated statement of comprehensive income, the consolidated statement of financial position, the consolidated statement of changes in equity, the Company statement of financial position, the Company statement of changes in equity, the consolidated statement of cash flows, the Company statement of cash flows and the related notes. The financial reporting framework that has been applied in their preparation is applicable law and International Financial Reporting Standards (IFRSs) as adopted by the European Union and, as regards the Parent Company financial statements, as applied in accordance with the provisions of the Companies Act 2006.
This report is made solely to the Company’s members, as a body, in accordance with Chapter 3 of Part 16 of the Companies Act 2006. Our audit work has been undertaken so that we might state to the Company’s members those matters we are required to state to them in an auditor’s report and for no other purpose. To the fullest extent permitted by law, we do not accept or assume responsibility to anyone other than the Company and the Company’s members as a body, for our audit work, for this report, or for the opinions we have formed.
Respective responsibilities of Directors and auditorsAs explained more fully in the statement of Directors’ responsibilities, the Directors are responsible for the preparation of the financial statements and for being satisfied that they give a true and fair view. Our responsibility is to audit and express an opinion on the financial statements in accordance with applicable law and International Standards on Auditing (UK and Ireland). Those standards require us to comply with the Financial Reporting Council’s (FRC’s) Ethical Standards for Auditors.
Scope of the audit of the financial statementsA description of the scope of an audit of financial statements is provided on the FRC’s website at www.frc.org.uk/auditscopeukprivate.
Opinion on financial statementsIn our opinion:
• the financial statements give a true and fair view of the state of the Group’s and the Parent Company’s affairs as at 31 December 2016 and of the Group’s loss for the year then ended;
• the Group financial statements have been properly prepared in accordance with IFRSs as adopted by the European Union;• the Parent Company financial statements have been properly prepared in accordance with IFRSs as adopted by the European Union and
as applied in accordance with the provisions of the Companies Act 2006; and• the financial statements have been prepared in accordance with the requirements of the Companies Act 2006.
Opinion on other matters prescribed by the Companies Act 2006In our opinion, based on the work undertaken in the course of the audit:
• The information given in the Strategic Report and Directors’ Report for the financial year for which the financial statements are prepared is consistent with the financial statements.
• The Strategic Report and Directors’ Report have been prepared in accordance with applicable legal requirements.
Matters on which we are required to report by exceptionIn the light of the knowledge and understanding of the Group and Parent Company and its environment obtained in the course of the audit, we have not identified material misstatements in the Strategic Report or the Directors’ Report.
We have nothing to report in respect of the following matters where the Companies Act 2006 requires us to report to you if, in our opinion:
• adequate accounting records have not been kept by the Parent Company, or returns adequate for our audit have not been received from branches not visited by us; or
• the Parent Company’s financial statements are not in agreement with the accounting records and returns; or• certain disclosures of Directors’ remuneration specified by law are not made; or• we have not received all the information and explanations we require for our audit.
Scott Knight (Senior Statutory Auditor)For and on behalf of BDO LLP, statutory auditorLondonUnited Kingdom18 May 2017
BDO LLP is a limited liability partnership registered in England and Wales (with registered number OC305127).
INDEPENDENT AUDITOR’S REPORT TO THE MEMBERS OF BORDERS & SOUTHERN PETROLEUM PLC
17Borders & Southern Petroleum plc Annual Report & Accounts 2016
FinancialStatements
Directors’ Report
StrategicReport
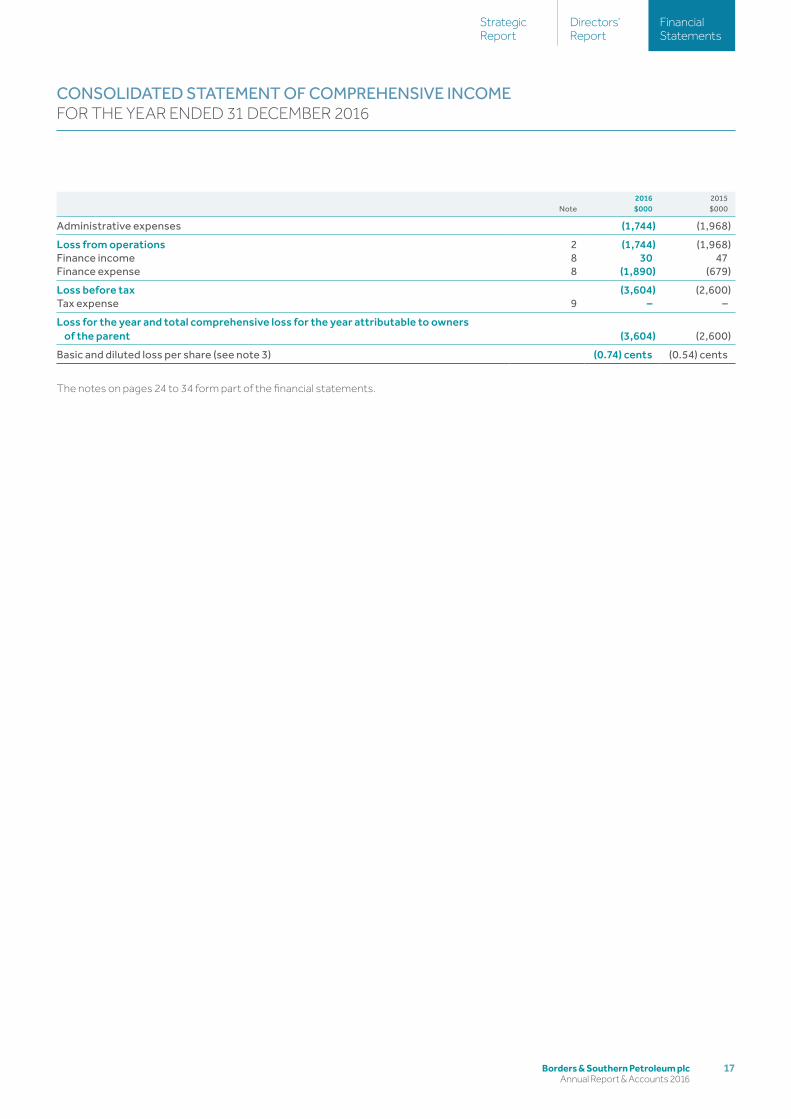
Note2016$000
2015$000
Administrative expenses (1,744) (1,968)
Loss from operations 2 (1,744) (1,968)Finance income 8 30 47Finance expense 8 (1,890) (679)
Loss before tax (3,604) (2,600)Tax expense 9 – –
Loss for the year and total comprehensive loss for the year attributable to owners of the parent (3,604) (2,600)
Basic and diluted loss per share (see note 3) (0.74) cents (0.54) cents
The notes on pages 24 to 34 form part of the financial statements.
CONSOLIDATED STATEMENT OF COMPREHENSIVE INCOMEFOR THE YEAR ENDED 31 DECEMBER 2016
Borders & Southern Petroleum plc Annual Report & Accounts 2016
18
Note
2016 2015
$000 $000 $000 $000
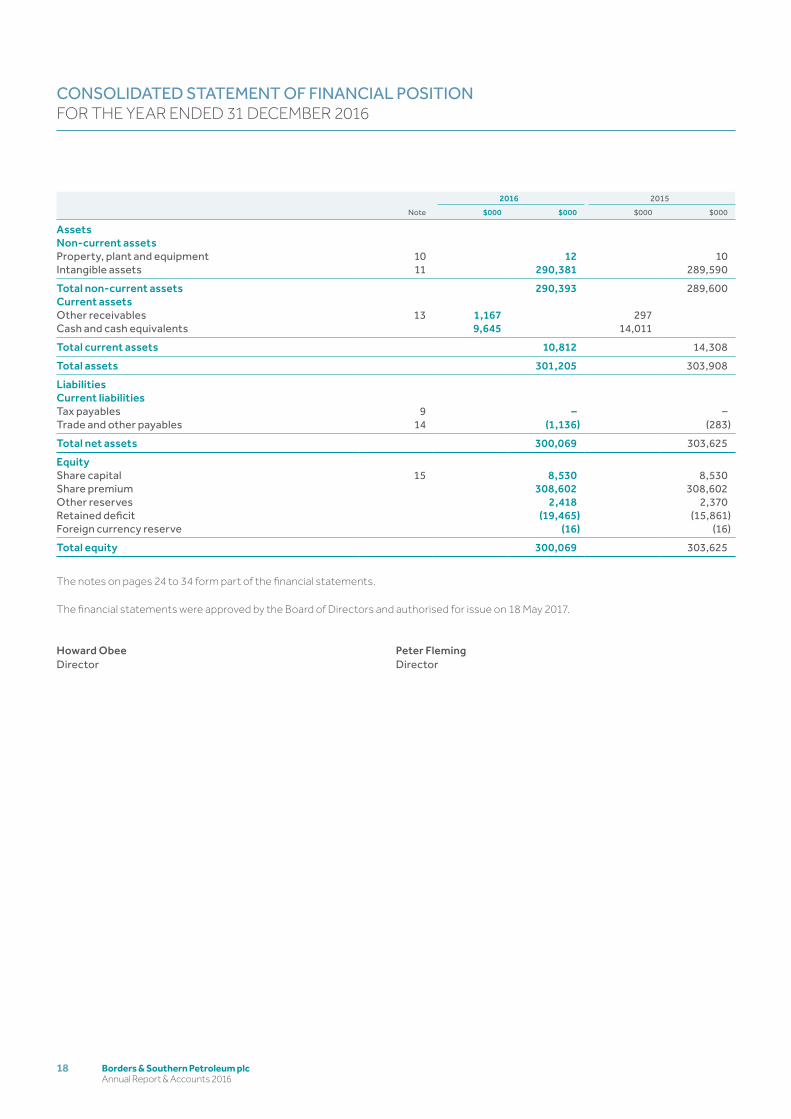
AssetsNon-current assetsProperty, plant and equipment 10 12 10Intangible assets 11 290,381 289,590
Total non-current assets 290,393 289,600Current assetsOther receivables 13 1,167 297Cash and cash equivalents 9,645 14,011
Total current assets 10,812 14,308
Total assets 301,205 303,908
LiabilitiesCurrent liabilitiesTax payables 9 – –Trade and other payables 14 (1,136) (283)
Total net assets 300,069 303,625
EquityShare capital 15 8,530 8,530Share premium 308,602 308,602Other reserves 2,418 2,370Retained deficit (19,465) (15,861)Foreign currency reserve (16) (16)
Total equity 300,069 303,625
The notes on pages 24 to 34 form part of the financial statements.
The financial statements were approved by the Board of Directors and authorised for issue on 18 May 2017.
Howard ObeeDirector
Peter FlemingDirector
CONSOLIDATED STATEMENT OF FINANCIAL POSITION FOR THE YEAR ENDED 31 DECEMBER 2016
19Borders & Southern Petroleum plc Annual Report & Accounts 2016
FinancialStatements
Directors’ Report
StrategicReport
Share capital
$000
Share premium
$000
Other reserves
$000
Retained deficit
$000
Foreigncurrency
reserve$000
Total$000
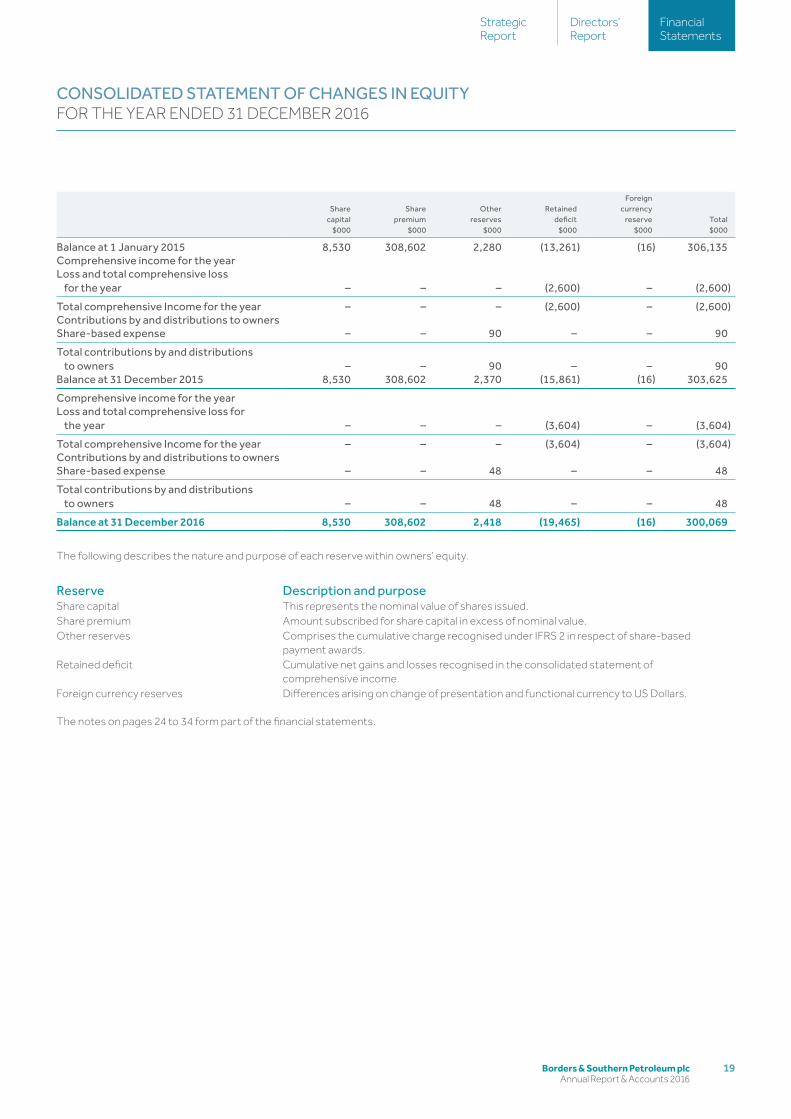
Balance at 1 January 2015 8,530 308,602 2,280 (13,261) (16) 306,135Comprehensive income for the yearLoss and total comprehensive loss
for the year – – – (2,600) – (2,600)
Total comprehensive Income for the year – – – (2,600) – (2,600)Contributions by and distributions to ownersShare-based expense – – 90 – – 90
Total contributions by and distributions to owners – – 90 – – 90
Balance at 31 December 2015 8,530 308,602 2,370 (15,861) (16) 303,625
Comprehensive income for the yearLoss and total comprehensive loss for
the year – – – (3,604) – (3,604)
Total comprehensive Income for the year – – – (3,604) – (3,604)Contributions by and distributions to ownersShare-based expense – – 48 – – 48
Total contributions by and distributions to owners – – 48 – – 48
Balance at 31 December 2016 8,530 308,602 2,418 (19,465) (16) 300,069
The following describes the nature and purpose of each reserve within owners’ equity.
Reserve Description and purposeShare capital This represents the nominal value of shares issued.Share premium Amount subscribed for share capital in excess of nominal value.Other reserves Comprises the cumulative charge recognised under IFRS 2 in respect of share-based
payment awards.Retained deficit Cumulative net gains and losses recognised in the consolidated statement of
comprehensive income.Foreign currency reserves Differences arising on change of presentation and functional currency to US Dollars.
The notes on pages 24 to 34 form part of the financial statements.
CONSOLIDATED STATEMENT OF CHANGES IN EQUITY FOR THE YEAR ENDED 31 DECEMBER 2016
Borders & Southern Petroleum plc Annual Report & Accounts 2016
20
Note
2016 2015
$000 $000 $000 $000
AssetsNon-current assetsProperty, plant and equipment 10 12 10Investments 12 – –Other receivables 13 290,560 289,769
Total non-current assets 290,572 289,779Current assetsOther receivables 13 1,166 297Cash and cash equivalents 9,645 14,011
Total current assets 10,811 14,308
Total assets 301,383 304,087
LiabilitiesCurrent liabilitiesTrade and other payables 14 (1,135) (283)
Total net assets 300,248 303,804
EquityCalled up share capital 15 8,530 8,530Share premium 308,602 308,602Other reserves 2,418 2,370Retained deficit (19,284) (15,680)Foreign currency reserve (18) (18)
Total equity 300,248 303,804
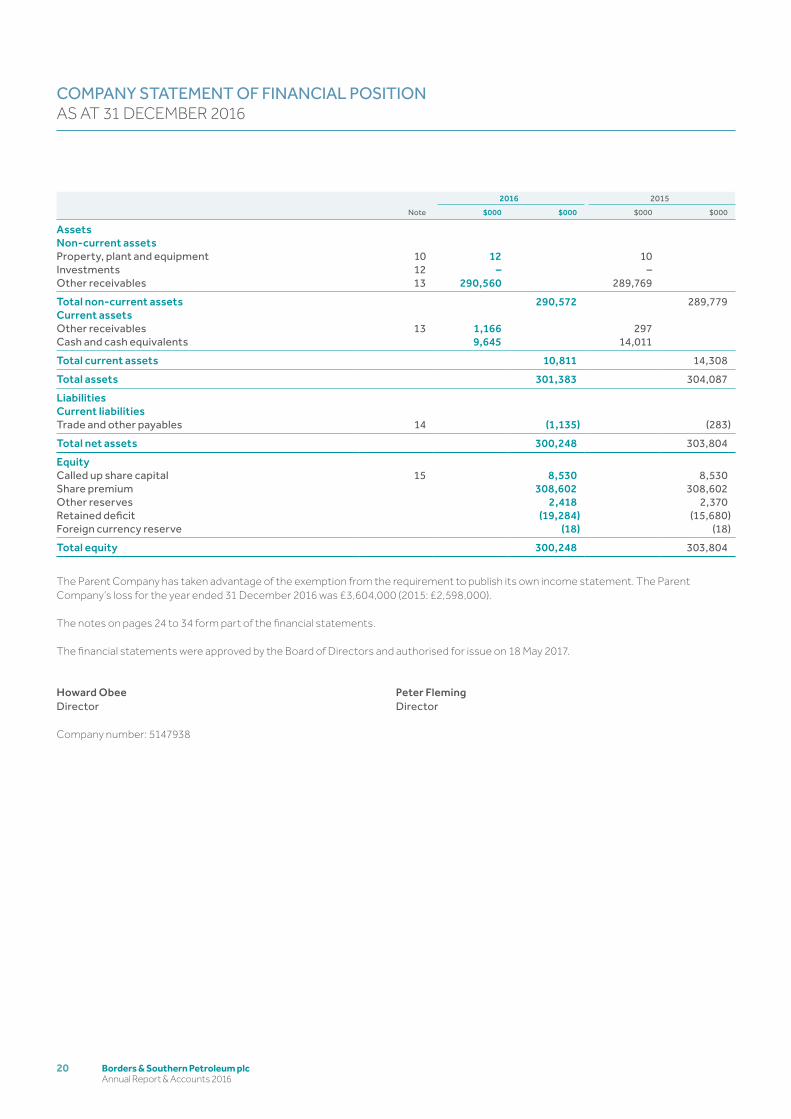
The Parent Company has taken advantage of the exemption from the requirement to publish its own income statement. The Parent Company’s loss for the year ended 31 December 2016 was £3,604,000 (2015: £2,598,000).
The notes on pages 24 to 34 form part of the financial statements.
The financial statements were approved by the Board of Directors and authorised for issue on 18 May 2017.
Howard ObeeDirector
Peter FlemingDirector
Company number: 5147938
COMPANY STATEMENT OF FINANCIAL POSITIONAS AT 31 DECEMBER 2016
21Borders & Southern Petroleum plc Annual Report & Accounts 2016
FinancialStatements
Directors’ Report
StrategicReport
Sharecapital
$000
Sharepremium
reserve$000
Otherreserves
$000
Retaineddeficit
$000
Foreigncurrency
reserve$000
Total$000
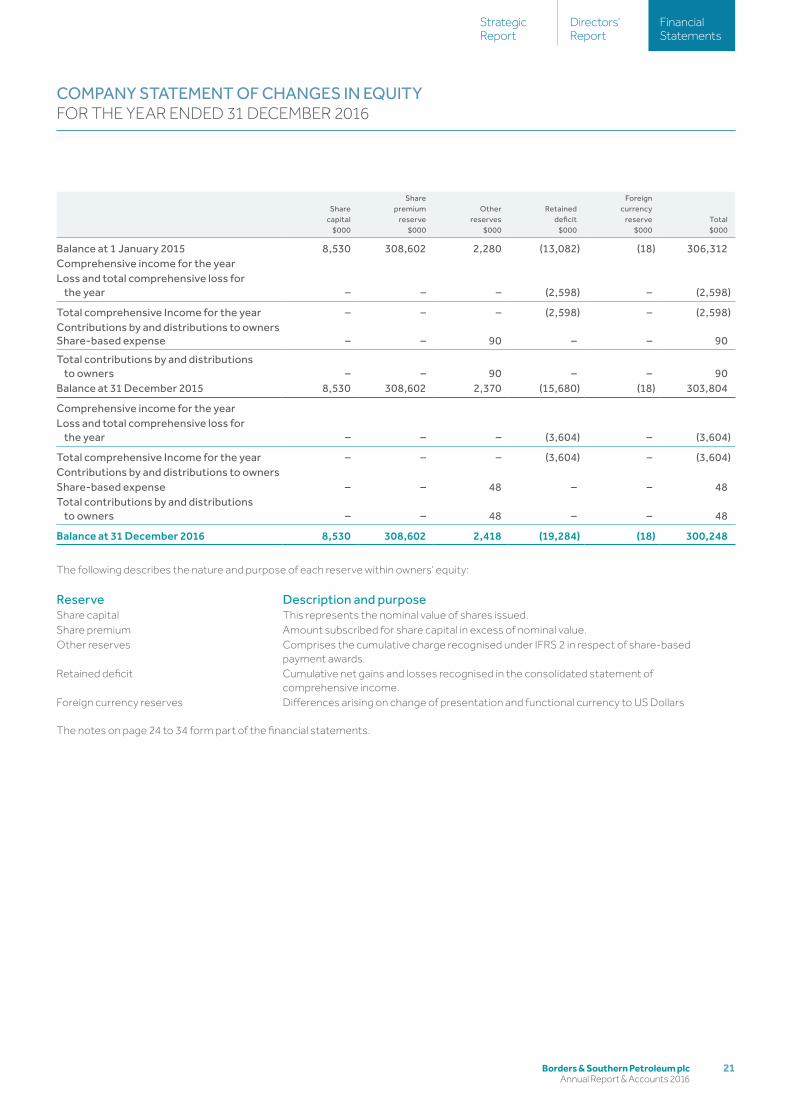
Balance at 1 January 2015 8,530 308,602 2,280 (13,082) (18) 306,312Comprehensive income for the yearLoss and total comprehensive loss for
the year – – – (2,598) – (2,598)
Total comprehensive Income for the year – – – (2,598) – (2,598)Contributions by and distributions to ownersShare-based expense – – 90 – – 90
Total contributions by and distributions to owners – – 90 – – 90
Balance at 31 December 2015 8,530 308,602 2,370 (15,680) (18) 303,804
Comprehensive income for the yearLoss and total comprehensive loss for
the year – – – (3,604) – (3,604)
Total comprehensive Income for the year – – – (3,604) – (3,604)Contributions by and distributions to ownersShare-based expense – – 48 – – 48Total contributions by and distributions
to owners – – 48 – – 48
Balance at 31 December 2016 8,530 308,602 2,418 (19,284) (18) 300,248
The following describes the nature and purpose of each reserve within owners’ equity:
Reserve Description and purposeShare capital This represents the nominal value of shares issued.Share premium Amount subscribed for share capital in excess of nominal value.Other reserves Comprises the cumulative charge recognised under IFRS 2 in respect of share-based
payment awards.Retained deficit Cumulative net gains and losses recognised in the consolidated statement of
comprehensive income.Foreign currency reserves Differences arising on change of presentation and functional currency to US Dollars
The notes on page 24 to 34 form part of the financial statements.
COMPANY STATEMENT OF CHANGES IN EQUITY FOR THE YEAR ENDED 31 DECEMBER 2016
Borders & Southern Petroleum plc Annual Report & Accounts 2016
22
Note
2016 2015
$000 $000 $000 $000
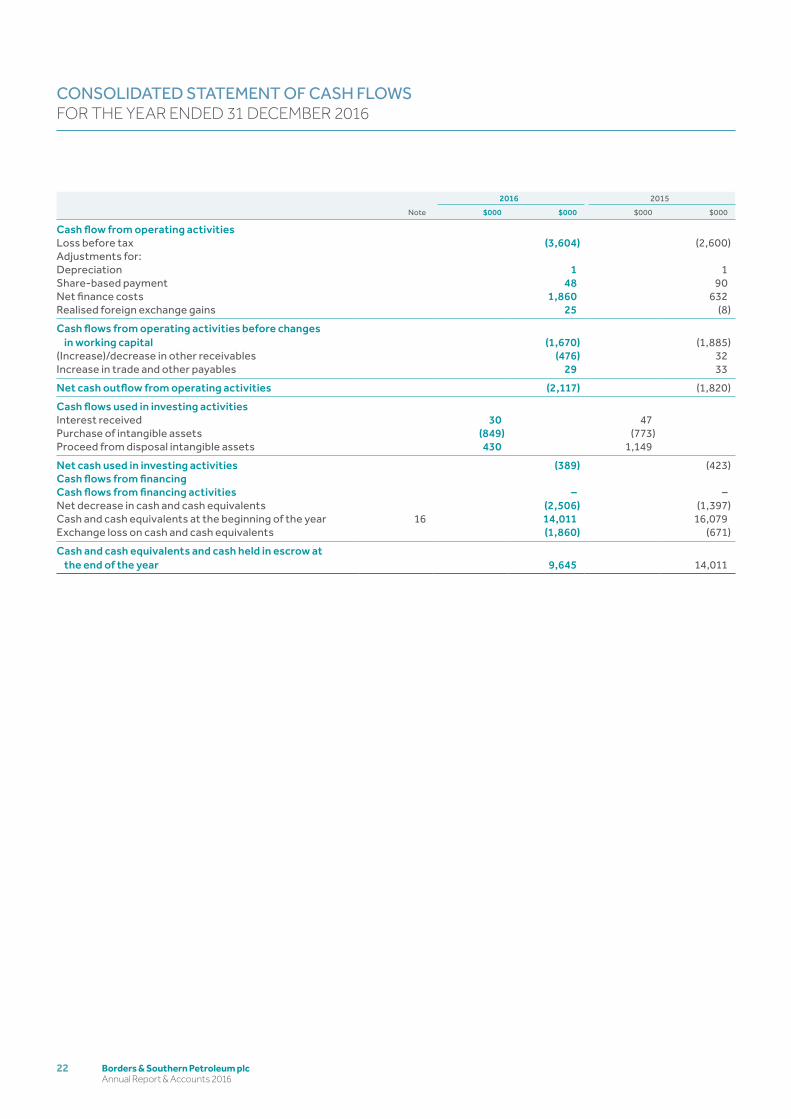
Cash flow from operating activitiesLoss before tax (3,604) (2,600)Adjustments for:Depreciation 1 1Share-based payment 48 90Net finance costs 1,860 632Realised foreign exchange gains 25 (8)
Cash flows from operating activities before changes in working capital (1,670) (1,885)
(Increase)/decrease in other receivables (476) 32Increase in trade and other payables 29 33
Net cash outflow from operating activities (2,117) (1,820)
Cash flows used in investing activitiesInterest received 30 47Purchase of intangible assets (849) (773)Proceed from disposal intangible assets 430 1,149
Net cash used in investing activities (389) (423)Cash flows from financingCash flows from financing activities – –Net decrease in cash and cash equivalents (2,506) (1,397)Cash and cash equivalents at the beginning of the year 16 14,011 16,079Exchange loss on cash and cash equivalents (1,860) (671)
Cash and cash equivalents and cash held in escrow at the end of the year 9,645 14,011
CONSOLIDATED STATEMENT OF CASH FLOWSFOR THE YEAR ENDED 31 DECEMBER 2016
23Borders & Southern Petroleum plc Annual Report & Accounts 2016
FinancialStatements
Directors’ Report
StrategicReport
Note
2016 2015
$000 $000 $000 $000
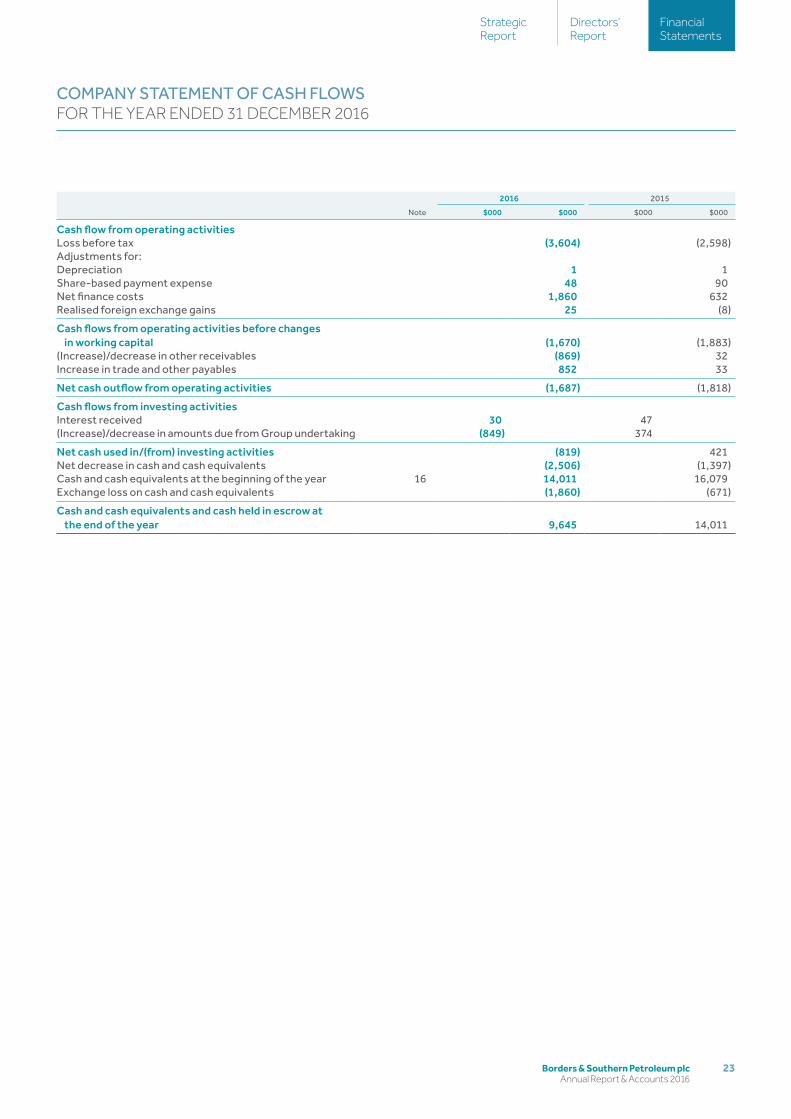
Cash flow from operating activities Loss before tax (3,604) (2,598)Adjustments for:Depreciation 1 1Share-based payment expense 48 90Net finance costs 1,860 632Realised foreign exchange gains 25 (8)
Cash flows from operating activities before changes in working capital (1,670) (1,883)
(Increase)/decrease in other receivables (869) 32Increase in trade and other payables 852 33
Net cash outflow from operating activities (1,687) (1,818)
Cash flows from investing activitiesInterest received 30 47(Increase)/decrease in amounts due from Group undertaking (849) 374
Net cash used in/(from) investing activities (819) 421Net decrease in cash and cash equivalents (2,506) (1,397)Cash and cash equivalents at the beginning of the year 16 14,011 16,079Exchange loss on cash and cash equivalents (1,860) (671)
Cash and cash equivalents and cash held in escrow at the end of the year 9,645 14,011
COMPANY STATEMENT OF CASH FLOWSFOR THE YEAR ENDED 31 DECEMBER 2016

Borders & Southern Petroleum plc Annual Report & Accounts 2016
24
1 Accounting policiesBasis of preparationThe principal accounting policies adopted in the preparation of the financial statements are set out below and have been consistently applied to all years presented.
These consolidated and parent financial statements have been prepared in accordance with International Financial Reporting Standards (IFRSs and IFRIC interpretations) issued by the International Accounting Standards Board (IASB) as adopted by the European Union and with those parts of the Companies Act 2006 applicable to companies preparing their accounts under IFRS.
The consolidated financial statements have been prepared under the historical cost convention.
New and revised standards effective for 31 December 2016 year endThere were no new standards issued in respect of the year ended 31 December 2016 that were relevant for adoption by the Group.
New and revised standards issued but not effective for 31 December 2016 year endAt the date of authorisation of this report the following standards and interpretations, which have not been applied in this report, were in issue but not yet effective: • IFRS 9 Financial Instruments (effective date for annual periods beginning on or after 1 January 2018);• IFRS 15 Revenue from Contracts with customers (effective date for annual periods beginning on or after 1 January 2018);• IFRS 16 Leases (effective date for annual periods beginning on or after 1 January 2019);• IAS 12 (amended) Recognition of Deferred Tax Asset for Unrealised Losses;• IAS 7 Disclosure Initiative; and• IFRS 2 (amended) Classification and Measurement of Share-based Present Transactions.
The Group considers that the only Standard that may have any impact is IFRS 9. The new Standard will replace existing accounting Standards. It is applicable to financial assets and liabilities and will introduce changes to existing accounting concerning classification, measurement and impairment (introducing an expected loss method). The Group considers that whilst IFRS 16 may impact on the Group, the effect will not be significant as the operating leases held by the Group are of low value.
The Group is not revenue generating thus there is no impact of IFRS 15 as there are no revenue contracts in place.
The Group will adopt the above Standards at the time stipulated by that Standard. The Group does not at this time anticipate voluntary early adoption of any of the Standards.
Basis of consolidationSubsidiariesSubsidiaries are all entities (including structured entities) over which the Group has control. The Group controls an entity when the Group is exposed to, or has rights to, variable returns from its involvement with the entity and has the ability to affect those returns through its power over the entity.
Subsidiaries are fully consolidated from the date on which control is transferred to the Group. They are deconsolidated from the date that control ceases. Where necessary, adjustments are made to the financial statements of subsidiaries to bring their accounting policies into line with those used by other members of the Group. All intra-Group transactions, balances, income and expenses are eliminated on consolidation.
Business combinationsThe acquisition method of accounting is used to account for business combinations by the Group. The consideration transferred for the acquisition of a business is the fair value of the assets transferred, liabilities incurred and the equity interests issued by the Group. The consideration transferred includes the fair value of any asset or liability resulting from a contingent consideration arrangement. Acquisition related costs are expensed as incurred. Identifiable assets acquired and liabilities and contingent liabilities assumed in a business combination are measured initially at their fair values at the acquisition date.
Going concernThe Directors are of the opinion that the Group has adequate financial resources to enable it to undertake its planned programme of exploration and appraisal activities for a period of at least 12 months.
The Company’s investments in subsidiariesThe Parent Company’s subsidiaries are carried at cost less amounts provided for impairment.
Finance incomeFinance income consists of interest on cash deposits and foreign exchange gains.
NOTES TO THE FINANCIAL STATEMENTSFOR THE YEAR ENDED 31 DECEMBER 2016
25Borders & Southern Petroleum plc Annual Report & Accounts 2016
FinancialStatements
Directors’ Report
StrategicReport
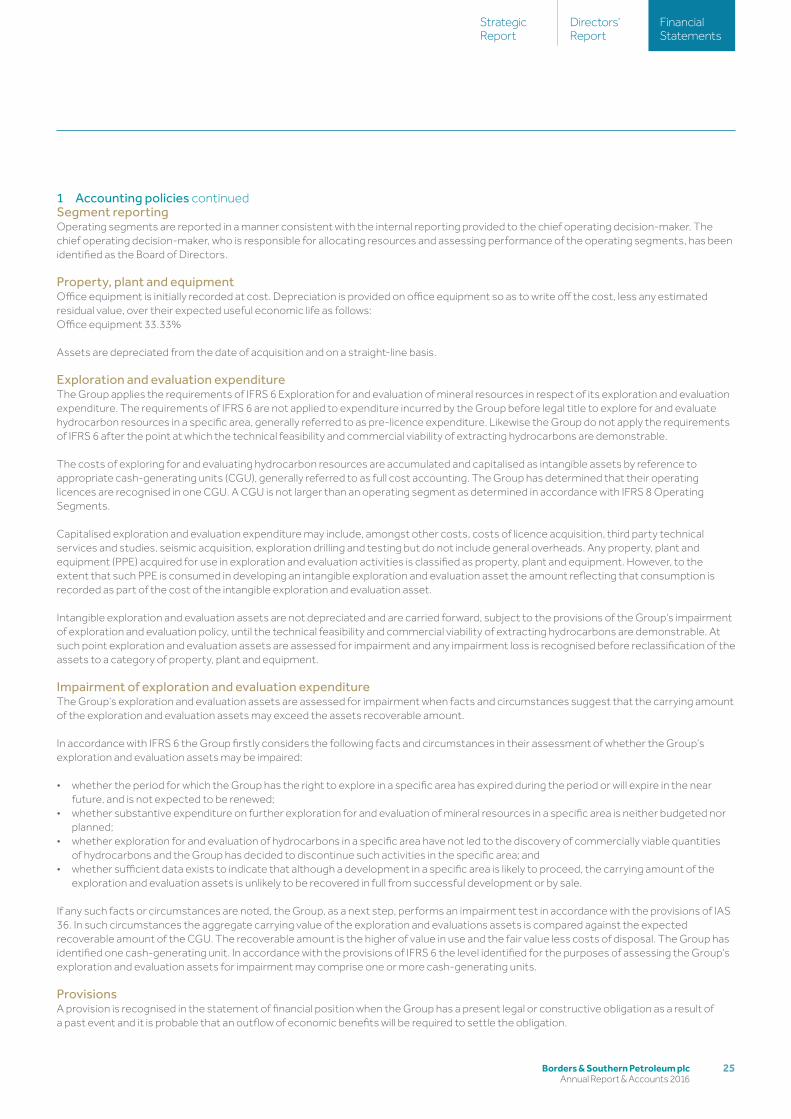
Segment reportingOperating segments are reported in a manner consistent with the internal reporting provided to the chief operating decision-maker. The chief operating decision-maker, who is responsible for allocating resources and assessing performance of the operating segments, has been identified as the Board of Directors.
Property, plant and equipmentOffice equipment is initially recorded at cost. Depreciation is provided on office equipment so as to write off the cost, less any estimated residual value, over their expected useful economic life as follows:Office equipment 33.33%
Assets are depreciated from the date of acquisition and on a straight-line basis.
Exploration and evaluation expenditureThe Group applies the requirements of IFRS 6 Exploration for and evaluation of mineral resources in respect of its exploration and evaluation expenditure. The requirements of IFRS 6 are not applied to expenditure incurred by the Group before legal title to explore for and evaluate hydrocarbon resources in a specific area, generally referred to as pre-licence expenditure. Likewise the Group do not apply the requirements of IFRS 6 after the point at which the technical feasibility and commercial viability of extracting hydrocarbons are demonstrable.
The costs of exploring for and evaluating hydrocarbon resources are accumulated and capitalised as intangible assets by reference to appropriate cash-generating units (CGU), generally referred to as full cost accounting. The Group has determined that their operating licences are recognised in one CGU. A CGU is not larger than an operating segment as determined in accordance with IFRS 8 Operating Segments.
Capitalised exploration and evaluation expenditure may include, amongst other costs, costs of licence acquisition, third party technical services and studies, seismic acquisition, exploration drilling and testing but do not include general overheads. Any property, plant and equipment (PPE) acquired for use in exploration and evaluation activities is classified as property, plant and equipment. However, to the extent that such PPE is consumed in developing an intangible exploration and evaluation asset the amount reflecting that consumption is recorded as part of the cost of the intangible exploration and evaluation asset.
Intangible exploration and evaluation assets are not depreciated and are carried forward, subject to the provisions of the Group’s impairment of exploration and evaluation policy, until the technical feasibility and commercial viability of extracting hydrocarbons are demonstrable. At such point exploration and evaluation assets are assessed for impairment and any impairment loss is recognised before reclassification of the assets to a category of property, plant and equipment.
Impairment of exploration and evaluation expenditureThe Group’s exploration and evaluation assets are assessed for impairment when facts and circumstances suggest that the carrying amount of the exploration and evaluation assets may exceed the assets recoverable amount.
In accordance with IFRS 6 the Group firstly considers the following facts and circumstances in their assessment of whether the Group’s exploration and evaluation assets may be impaired:
• whether the period for which the Group has the right to explore in a specific area has expired during the period or will expire in the near future, and is not expected to be renewed;
• whether substantive expenditure on further exploration for and evaluation of mineral resources in a specific area is neither budgeted nor planned;
• whether exploration for and evaluation of hydrocarbons in a specific area have not led to the discovery of commercially viable quantities of hydrocarbons and the Group has decided to discontinue such activities in the specific area; and
• whether sufficient data exists to indicate that although a development in a specific area is likely to proceed, the carrying amount of the exploration and evaluation assets is unlikely to be recovered in full from successful development or by sale.
If any such facts or circumstances are noted, the Group, as a next step, performs an impairment test in accordance with the provisions of IAS 36. In such circumstances the aggregate carrying value of the exploration and evaluations assets is compared against the expected recoverable amount of the CGU. The recoverable amount is the higher of value in use and the fair value less costs of disposal. The Group has identified one cash-generating unit. In accordance with the provisions of IFRS 6 the level identified for the purposes of assessing the Group’s exploration and evaluation assets for impairment may comprise one or more cash-generating units.
ProvisionsA provision is recognised in the statement of financial position when the Group has a present legal or constructive obligation as a result of a past event and it is probable that an outflow of economic benefits will be required to settle the obligation.
1 Accounting policies continued
Borders & Southern Petroleum plc Annual Report & Accounts 2016
26
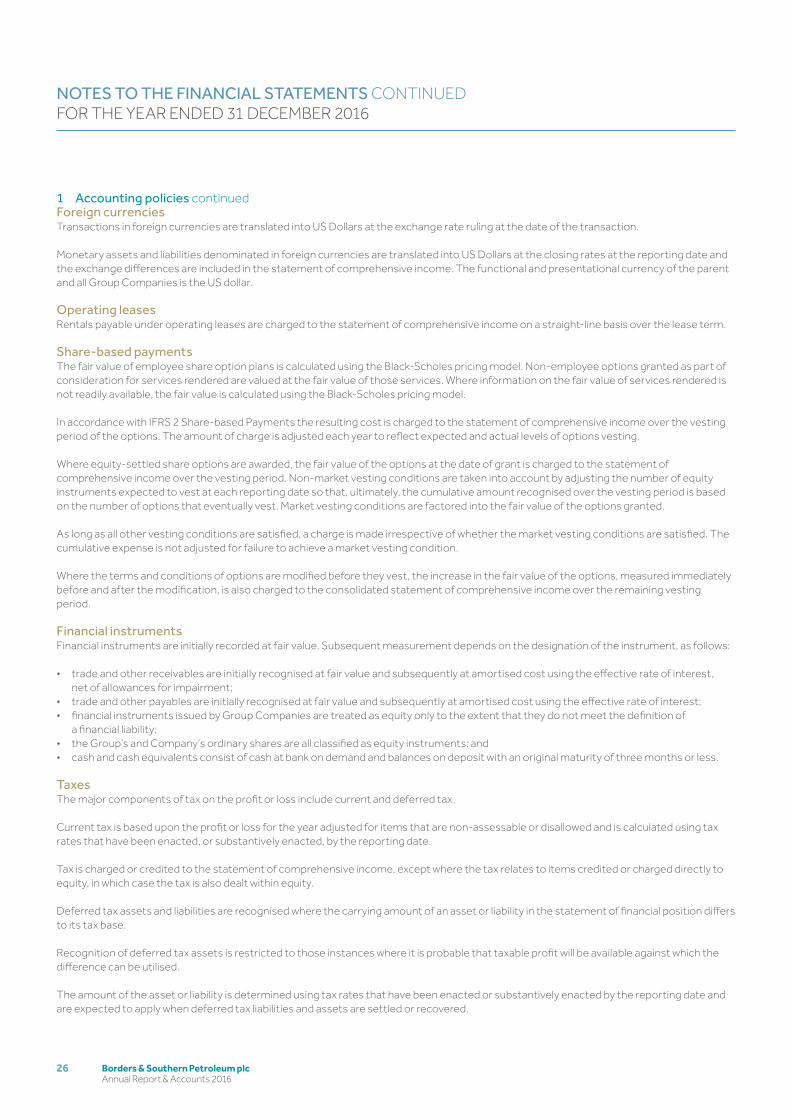
Foreign currenciesTransactions in foreign currencies are translated into US Dollars at the exchange rate ruling at the date of the transaction.
Monetary assets and liabilities denominated in foreign currencies are translated into US Dollars at the closing rates at the reporting date and the exchange differences are included in the statement of comprehensive income. The functional and presentational currency of the parent and all Group Companies is the US dollar.
Operating leasesRentals payable under operating leases are charged to the statement of comprehensive income on a straight-line basis over the lease term.
Share-based paymentsThe fair value of employee share option plans is calculated using the Black-Scholes pricing model. Non-employee options granted as part of consideration for services rendered are valued at the fair value of those services. Where information on the fair value of services rendered is not readily available, the fair value is calculated using the Black-Scholes pricing model.
In accordance with IFRS 2 Share-based Payments the resulting cost is charged to the statement of comprehensive income over the vesting period of the options. The amount of charge is adjusted each year to reflect expected and actual levels of options vesting.
Where equity-settled share options are awarded, the fair value of the options at the date of grant is charged to the statement of comprehensive income over the vesting period. Non-market vesting conditions are taken into account by adjusting the number of equity instruments expected to vest at each reporting date so that, ultimately, the cumulative amount recognised over the vesting period is based on the number of options that eventually vest. Market vesting conditions are factored into the fair value of the options granted.
As long as all other vesting conditions are satisfied, a charge is made irrespective of whether the market vesting conditions are satisfied. The cumulative expense is not adjusted for failure to achieve a market vesting condition.
Where the terms and conditions of options are modified before they vest, the increase in the fair value of the options, measured immediately before and after the modification, is also charged to the consolidated statement of comprehensive income over the remaining vesting period.
Financial instrumentsFinancial instruments are initially recorded at fair value. Subsequent measurement depends on the designation of the instrument, as follows:
• trade and other receivables are initially recognised at fair value and subsequently at amortised cost using the effective rate of interest, net of allowances for impairment;
• trade and other payables are initially recognised at fair value and subsequently at amortised cost using the effective rate of interest;• financial instruments issued by Group Companies are treated as equity only to the extent that they do not meet the definition of
a financial liability;• the Group’s and Company’s ordinary shares are all classified as equity instruments; and• cash and cash equivalents consist of cash at bank on demand and balances on deposit with an original maturity of three months or less.
TaxesThe major components of tax on the profit or loss include current and deferred tax.
Current tax is based upon the profit or loss for the year adjusted for items that are non-assessable or disallowed and is calculated using tax rates that have been enacted, or substantively enacted, by the reporting date.
Tax is charged or credited to the statement of comprehensive income, except where the tax relates to items credited or charged directly to equity, in which case the tax is also dealt within equity.
Deferred tax assets and liabilities are recognised where the carrying amount of an asset or liability in the statement of financial position differs to its tax base.
Recognition of deferred tax assets is restricted to those instances where it is probable that taxable profit will be available against which the difference can be utilised.
The amount of the asset or liability is determined using tax rates that have been enacted or substantively enacted by the reporting date and are expected to apply when deferred tax liabilities and assets are settled or recovered.
1 Accounting policies continued
NOTES TO THE FINANCIAL STATEMENTS CONTINUEDFOR THE YEAR ENDED 31 DECEMBER 2016
27Borders & Southern Petroleum plc Annual Report & Accounts 2016
FinancialStatements
Directors’ Report
StrategicReport
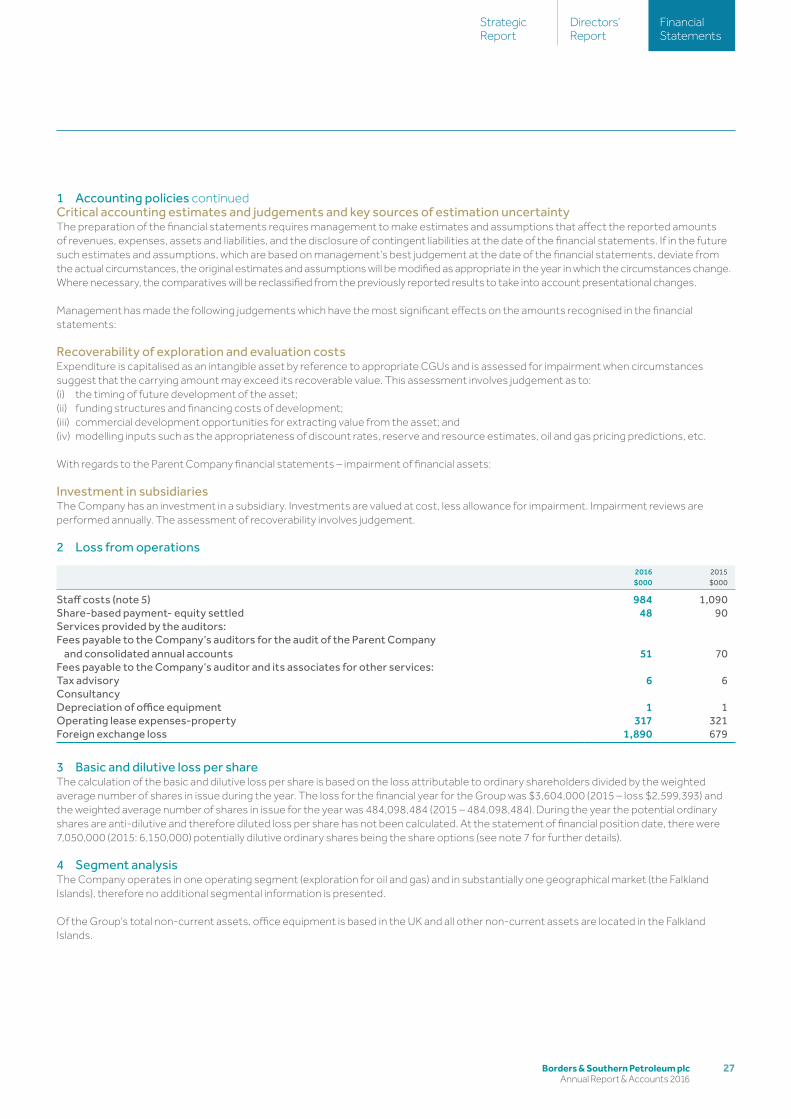
Critical accounting estimates and judgements and key sources of estimation uncertaintyThe preparation of the financial statements requires management to make estimates and assumptions that affect the reported amounts of revenues, expenses, assets and liabilities, and the disclosure of contingent liabilities at the date of the financial statements. If in the future such estimates and assumptions, which are based on management’s best judgement at the date of the financial statements, deviate from the actual circumstances, the original estimates and assumptions will be modified as appropriate in the year in which the circumstances change. Where necessary, the comparatives will be reclassified from the previously reported results to take into account presentational changes.
Management has made the following judgements which have the most significant effects on the amounts recognised in the financial statements:
Recoverability of exploration and evaluation costsExpenditure is capitalised as an intangible asset by reference to appropriate CGUs and is assessed for impairment when circumstances suggest that the carrying amount may exceed its recoverable value. This assessment involves judgement as to:(i) the timing of future development of the asset;(ii) funding structures and financing costs of development;(iii) commercial development opportunities for extracting value from the asset; and(iv) modelling inputs such as the appropriateness of discount rates, reserve and resource estimates, oil and gas pricing predictions, etc.
With regards to the Parent Company financial statements – impairment of financial assets:
Investment in subsidiariesThe Company has an investment in a subsidiary. Investments are valued at cost, less allowance for impairment. Impairment reviews are performed annually. The assessment of recoverability involves judgement.
2 Loss from operations
2016$000
2015$000
Staff costs (note 5) 984 1,090Share-based payment- equity settled 48 90Services provided by the auditors:Fees payable to the Company’s auditors for the audit of the Parent Company
and consolidated annual accounts 51 70Fees payable to the Company’s auditor and its associates for other services:Tax advisory 6 6ConsultancyDepreciation of office equipment 1 1Operating lease expenses-property 317 321Foreign exchange loss 1,890 679
3 Basic and dilutive loss per share The calculation of the basic and dilutive loss per share is based on the loss attributable to ordinary shareholders divided by the weighted average number of shares in issue during the year. The loss for the financial year for the Group was $3,604,000 (2015 – loss $2,599,393) and the weighted average number of shares in issue for the year was 484,098,484 (2015 – 484,098,484). During the year the potential ordinary shares are anti-dilutive and therefore diluted loss per share has not been calculated. At the statement of financial position date, there were 7,050,000 (2015: 6,150,000) potentially dilutive ordinary shares being the share options (see note 7 for further details).
4 Segment analysisThe Company operates in one operating segment (exploration for oil and gas) and in substantially one geographical market (the Falkland Islands), therefore no additional segmental information is presented.
Of the Group’s total non-current assets, office equipment is based in the UK and all other non-current assets are located in the Falkland Islands.
1 Accounting policies continued
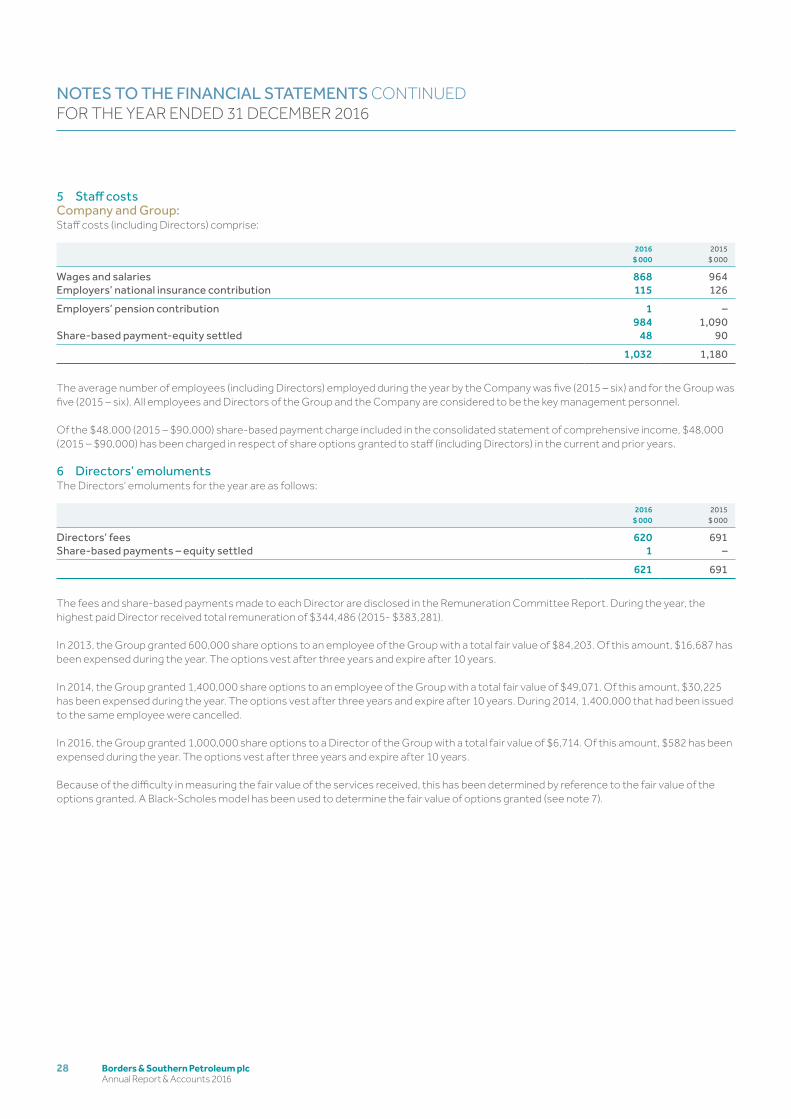
Borders & Southern Petroleum plc Annual Report & Accounts 2016
28
5 Staff costsCompany and Group:Staff costs (including Directors) comprise:
2016$ 000
2015$ 000
Wages and salaries 868 964Employers’ national insurance contribution 115 126
Employers’ pension contribution 1 –984 1,090
Share-based payment-equity settled 48 90
1,032 1,180
The average number of employees (including Directors) employed during the year by the Company was five (2015 – six) and for the Group was five (2015 – six). All employees and Directors of the Group and the Company are considered to be the key management personnel.
Of the $48,000 (2015 – $90,000) share-based payment charge included in the consolidated statement of comprehensive income, $48,000 (2015 – $90,000) has been charged in respect of share options granted to staff (including Directors) in the current and prior years.
6 Directors’ emolumentsThe Directors’ emoluments for the year are as follows:
2016$ 000
2015$ 000
Directors’ fees 620 691Share-based payments – equity settled 1 –
621 691
The fees and share-based payments made to each Director are disclosed in the Remuneration Committee Report. During the year, the highest paid Director received total remuneration of $344,486 (2015- $383,281).
In 2013, the Group granted 600,000 share options to an employee of the Group with a total fair value of $84,203. Of this amount, $16,687 has been expensed during the year. The options vest after three years and expire after 10 years.
In 2014, the Group granted 1,400,000 share options to an employee of the Group with a total fair value of $49,071. Of this amount, $30,225 has been expensed during the year. The options vest after three years and expire after 10 years. During 2014, 1,400,000 that had been issued to the same employee were cancelled.
In 2016, the Group granted 1,000,000 share options to a Director of the Group with a total fair value of $6,714. Of this amount, $582 has been expensed during the year. The options vest after three years and expire after 10 years.
Because of the difficulty in measuring the fair value of the services received, this has been determined by reference to the fair value of the options granted. A Black-Scholes model has been used to determine the fair value of options granted (see note 7).
NOTES TO THE FINANCIAL STATEMENTS CONTINUEDFOR THE YEAR ENDED 31 DECEMBER 2016
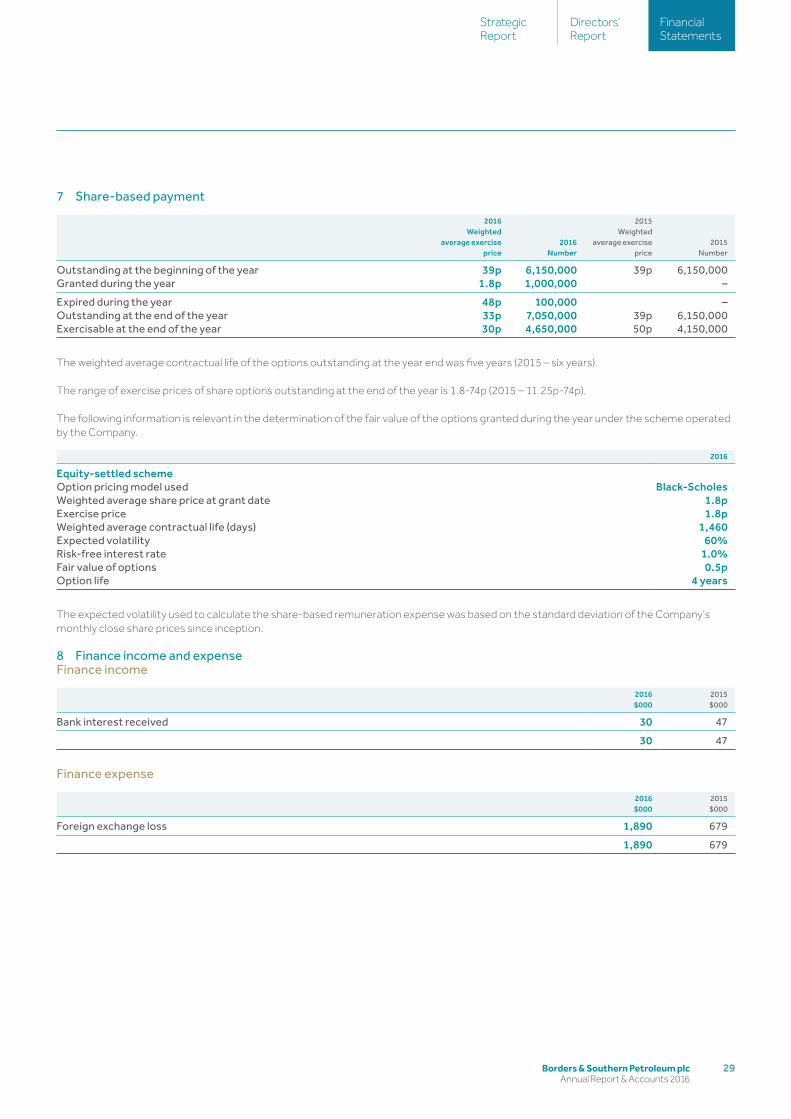
29Borders & Southern Petroleum plc Annual Report & Accounts 2016
FinancialStatements
Directors’ Report
StrategicReport
7 Share-based payment
2016Weighted
average exerciseprice
2016Number
2015Weighted
average exercise price
2015Number
Outstanding at the beginning of the year 39p 6,150,000 39p 6,150,000Granted during the year 1.8p 1,000,000 –
Expired during the year 48p 100,000 –Outstanding at the end of the year 33p 7,050,000 39p 6,150,000Exercisable at the end of the year 30p 4,650,000 50p 4,150,000
The weighted average contractual life of the options outstanding at the year end was five years (2015 – six years).
The range of exercise prices of share options outstanding at the end of the year is 1.8-74p (2015 – 11.25p-74p).
The following information is relevant in the determination of the fair value of the options granted during the year under the scheme operated by the Company.
2016
Equity-settled schemeOption pricing model used Black-ScholesWeighted average share price at grant date 1.8pExercise price 1.8pWeighted average contractual life (days) 1,460Expected volatility 60%Risk-free interest rate 1.0%Fair value of options 0.5pOption life 4 years
The expected volatility used to calculate the share-based remuneration expense was based on the standard deviation of the Company’s monthly close share prices since inception.
8 Finance income and expenseFinance income
2016$000
2015$000
Bank interest received 30 47
30 47
Finance expense
2016$000
2015$000
Foreign exchange loss 1,890 679
1,890 679
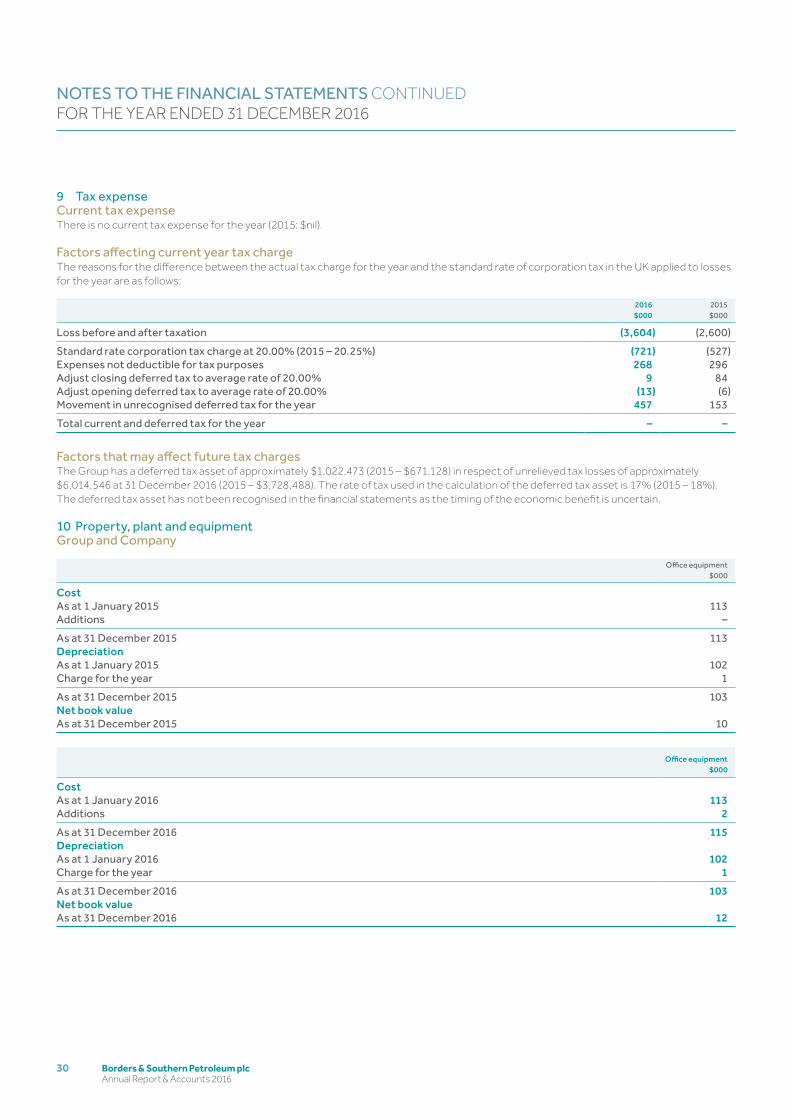
Borders & Southern Petroleum plc Annual Report & Accounts 2016
30
9 Tax expenseCurrent tax expenseThere is no current tax expense for the year (2015: $nil).
Factors affecting current year tax chargeThe reasons for the difference between the actual tax charge for the year and the standard rate of corporation tax in the UK applied to losses for the year are as follows:
2016$000
2015$000
Loss before and after taxation (3,604) (2,600)
Standard rate corporation tax charge at 20.00% (2015 – 20.25%) (721) (527)Expenses not deductible for tax purposes 268 296Adjust closing deferred tax to average rate of 20.00% 9 84Adjust opening deferred tax to average rate of 20.00% (13) (6)Movement in unrecognised deferred tax for the year 457 153
Total current and deferred tax for the year – –
Factors that may affect future tax chargesThe Group has a deferred tax asset of approximately $1,022,473 (2015 – $671,128) in respect of unrelieved tax losses of approximately $6,014,546 at 31 December 2016 (2015 – $3,728,488). The rate of tax used in the calculation of the deferred tax asset is 17% (2015 – 18%).The deferred tax asset has not been recognised in the financial statements as the timing of the economic benefit is uncertain.
10 Property, plant and equipmentGroup and Company
Office equipment$000
CostAs at 1 January 2015 113Additions –
As at 31 December 2015 113DepreciationAs at 1 January 2015 102Charge for the year 1
As at 31 December 2015 103Net book valueAs at 31 December 2015 10
Office equipment$000
CostAs at 1 January 2016 113Additions 2
As at 31 December 2016 115DepreciationAs at 1 January 2016 102Charge for the year 1
As at 31 December 2016 103Net book valueAs at 31 December 2016 12
NOTES TO THE FINANCIAL STATEMENTS CONTINUEDFOR THE YEAR ENDED 31 DECEMBER 2016
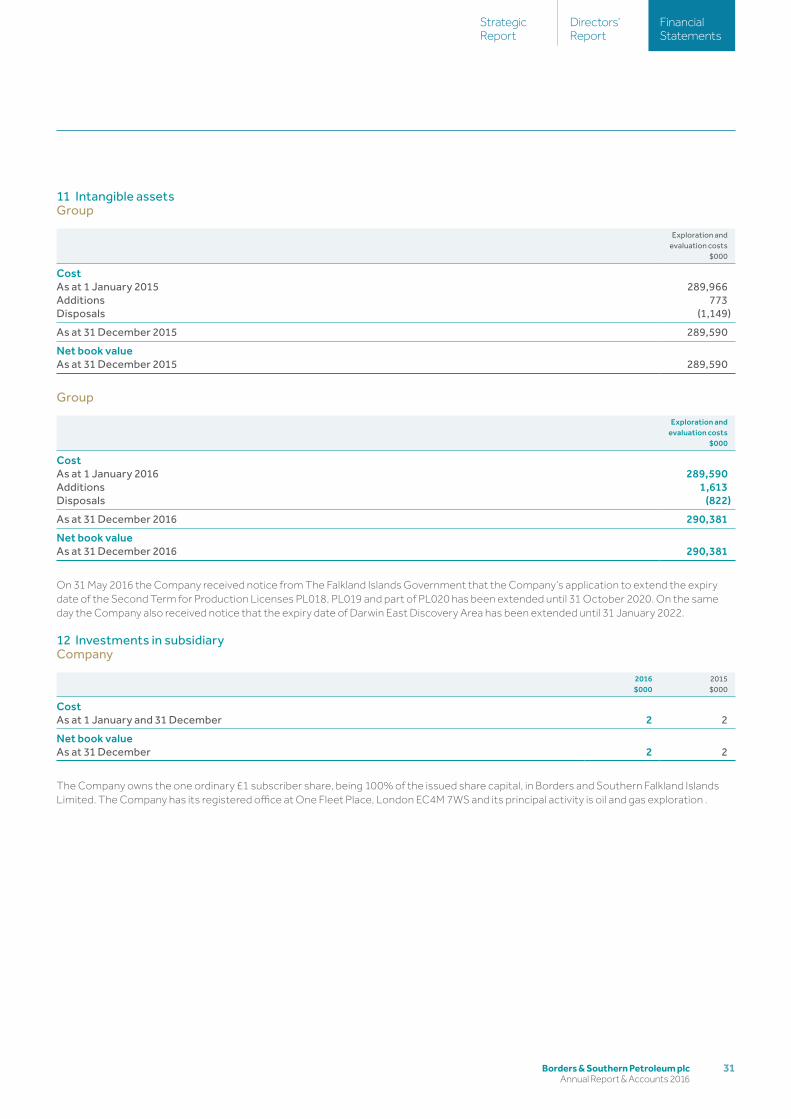
31Borders & Southern Petroleum plc Annual Report & Accounts 2016
FinancialStatements
Directors’ Report
StrategicReport
11 Intangible assetsGroup
Exploration and evaluation costs
$000
CostAs at 1 January 2015 289,966Additions 773Disposals (1,149)
As at 31 December 2015 289,590
Net book valueAs at 31 December 2015 289,590
Group
Exploration and evaluation costs
$000
CostAs at 1 January 2016 289,590Additions 1,613Disposals (822)
As at 31 December 2016 290,381
Net book valueAs at 31 December 2016 290,381
On 31 May 2016 the Company received notice from The Falkland Islands Government that the Company’s application to extend the expiry date of the Second Term for Production Licenses PL018, PL019 and part of PL020 has been extended until 31 October 2020. On the same day the Company also received notice that the expiry date of Darwin East Discovery Area has been extended until 31 January 2022.
12 Investments in subsidiaryCompany
2016$000
2015$000
CostAs at 1 January and 31 December 2 2
Net book valueAs at 31 December 2 2
The Company owns the one ordinary £1 subscriber share, being 100% of the issued share capital, in Borders and Southern Falkland Islands Limited. The Company has its registered office at One Fleet Place, London EC4M 7WS and its principal activity is oil and gas exploration .
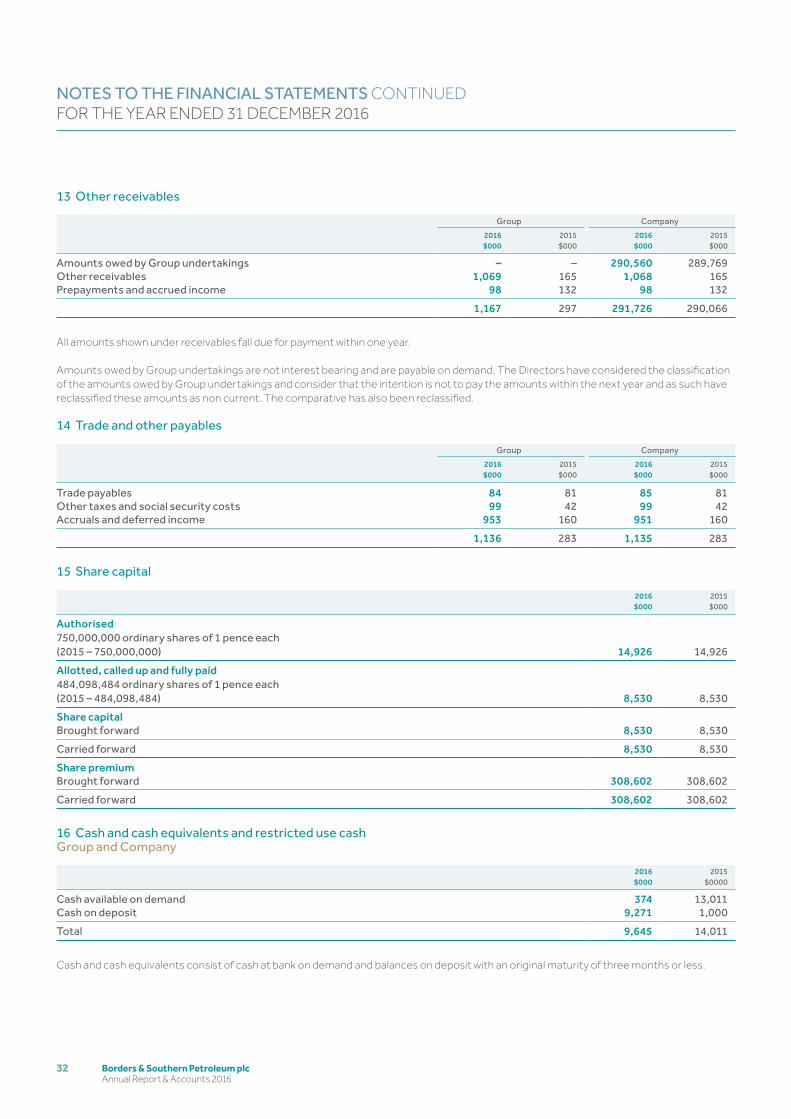
Borders & Southern Petroleum plc Annual Report & Accounts 2016
32
13 Other receivables
Group Company
2016$000
2015$000
2016$000
2015$000
Amounts owed by Group undertakings – – 290,560 289,769Other receivables 1,069 165 1,068 165Prepayments and accrued income 98 132 98 132
1,167 297 291,726 290,066
All amounts shown under receivables fall due for payment within one year.
Amounts owed by Group undertakings are not interest bearing and are payable on demand. The Directors have considered the classification of the amounts owed by Group undertakings and consider that the intention is not to pay the amounts within the next year and as such have reclassified these amounts as non current. The comparative has also been reclassified.
14 Trade and other payables
Group Company
2016$000
2015$000
2016$000
2015$000
Trade payables 84 81 85 81Other taxes and social security costs 99 42 99 42Accruals and deferred income 953 160 951 160
1,136 283 1,135 283
15 Share capital
2016$000
2015$000
Authorised750,000,000 ordinary shares of 1 pence each(2015 – 750,000,000) 14,926 14,926
Allotted, called up and fully paid484,098,484 ordinary shares of 1 pence each(2015 – 484,098,484) 8,530 8,530
Share capitalBrought forward 8,530 8,530
Carried forward 8,530 8,530
Share premiumBrought forward 308,602 308,602
Carried forward 308,602 308,602
16 Cash and cash equivalents and restricted use cashGroup and Company
2016$000
2015$0000
Cash available on demand 374 13,011Cash on deposit 9,271 1,000
Total 9,645 14,011
Cash and cash equivalents consist of cash at bank on demand and balances on deposit with an original maturity of three months or less.
NOTES TO THE FINANCIAL STATEMENTS CONTINUEDFOR THE YEAR ENDED 31 DECEMBER 2016
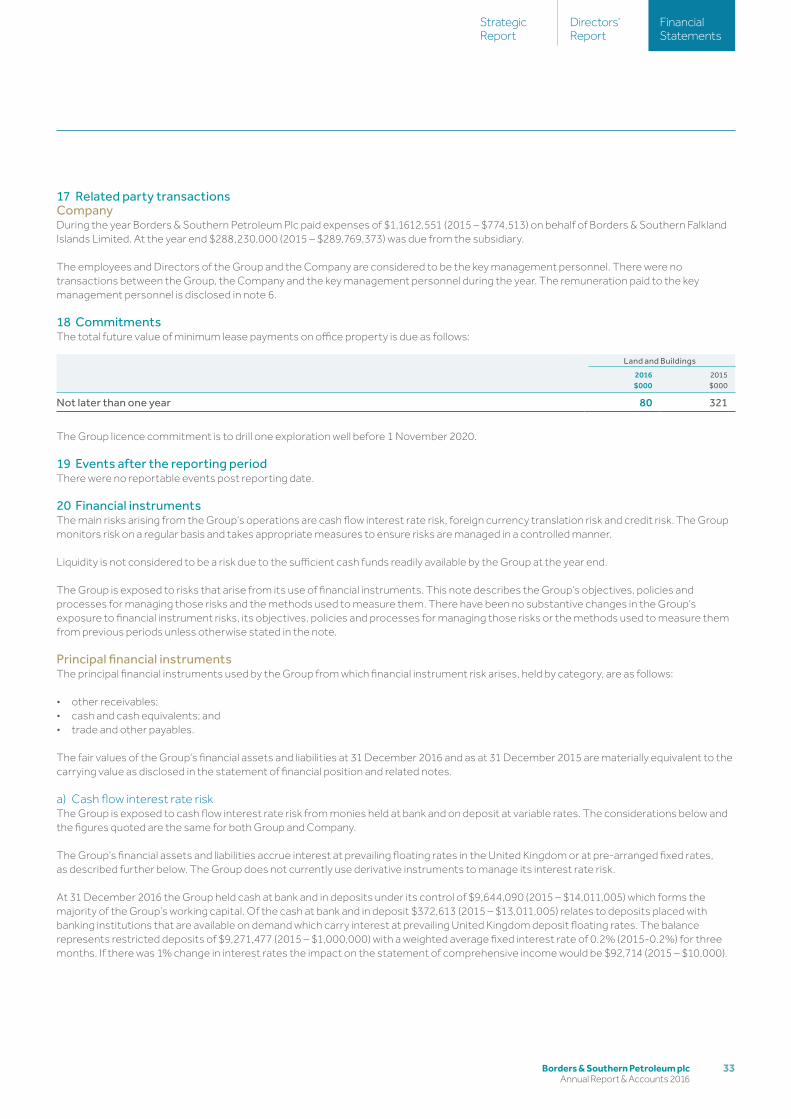
33Borders & Southern Petroleum plc Annual Report & Accounts 2016
FinancialStatements
Directors’ Report
StrategicReport
17 Related party transactionsCompanyDuring the year Borders & Southern Petroleum Plc paid expenses of $1,1612,551 (2015 – $774,513) on behalf of Borders & Southern Falkland Islands Limited. At the year end $288,230,000 (2015 – $289,769,373) was due from the subsidiary.
The employees and Directors of the Group and the Company are considered to be the key management personnel. There were no transactions between the Group, the Company and the key management personnel during the year. The remuneration paid to the key management personnel is disclosed in note 6.
18 Commitments The total future value of minimum lease payments on office property is due as follows:
Land and Buildings
2016$000
2015$000
Not later than one year 80 321
The Group licence commitment is to drill one exploration well before 1 November 2020.
19 Events after the reporting periodThere were no reportable events post reporting date.
20 Financial instrumentsThe main risks arising from the Group’s operations are cash flow interest rate risk, foreign currency translation risk and credit risk. The Group monitors risk on a regular basis and takes appropriate measures to ensure risks are managed in a controlled manner.
Liquidity is not considered to be a risk due to the sufficient cash funds readily available by the Group at the year end.
The Group is exposed to risks that arise from its use of financial instruments. This note describes the Group’s objectives, policies and processes for managing those risks and the methods used to measure them. There have been no substantive changes in the Group’s exposure to financial instrument risks, its objectives, policies and processes for managing those risks or the methods used to measure them from previous periods unless otherwise stated in the note.
Principal financial instrumentsThe principal financial instruments used by the Group from which financial instrument risk arises, held by category, are as follows:
• other receivables;• cash and cash equivalents; and• trade and other payables.
The fair values of the Group’s financial assets and liabilities at 31 December 2016 and as at 31 December 2015 are materially equivalent to the carrying value as disclosed in the statement of financial position and related notes.
a) Cash flow interest rate riskThe Group is exposed to cash flow interest rate risk from monies held at bank and on deposit at variable rates. The considerations below and the figures quoted are the same for both Group and Company.
The Group’s financial assets and liabilities accrue interest at prevailing floating rates in the United Kingdom or at pre-arranged fixed rates, as described further below. The Group does not currently use derivative instruments to manage its interest rate risk.
At 31 December 2016 the Group held cash at bank and in deposits under its control of $9,644,090 (2015 – $14,011,005) which forms the majority of the Group’s working capital. Of the cash at bank and in deposit $372,613 (2015 – $13,011,005) relates to deposits placed with banking institutions that are available on demand which carry interest at prevailing United Kingdom deposit floating rates. The balance represents restricted deposits of $9,271,477 (2015 – $1,000,000) with a weighted average fixed interest rate of 0.2% (2015-0.2%) for three months. If there was 1% change in interest rates the impact on the statement of comprehensive income would be $92,714 (2015 – $10,000).
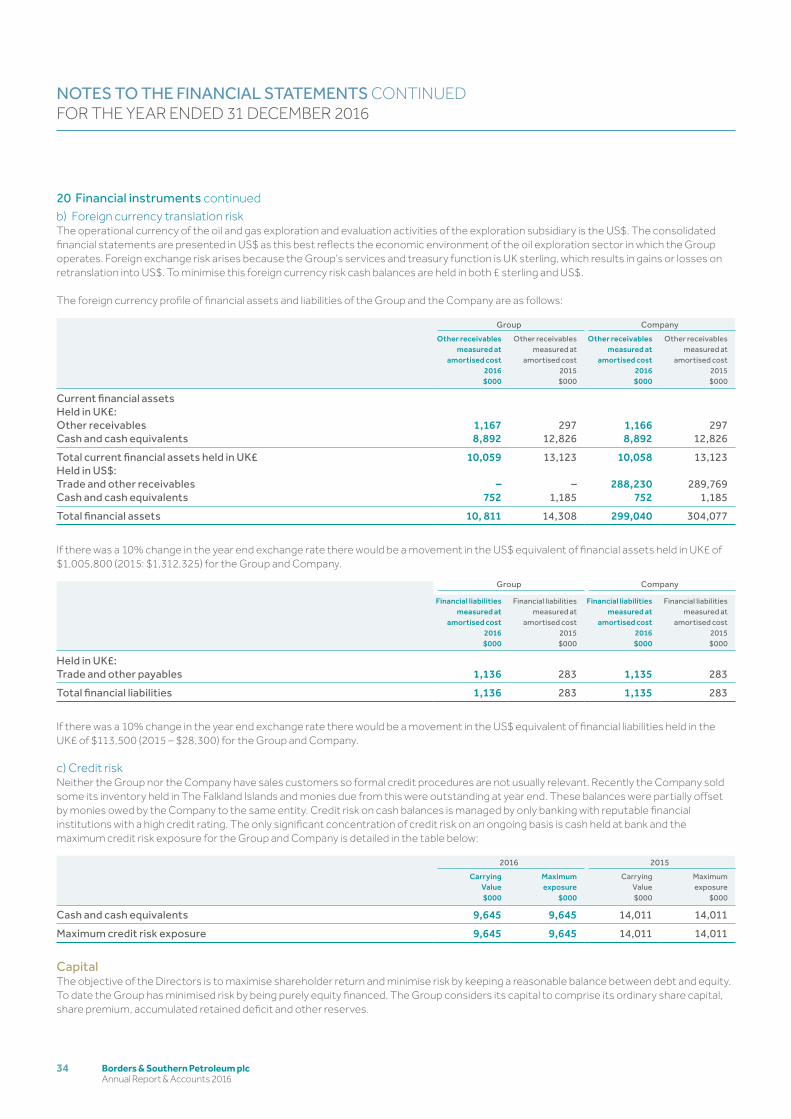
Borders & Southern Petroleum plc Annual Report & Accounts 2016
34
b) Foreign currency translation riskThe operational currency of the oil and gas exploration and evaluation activities of the exploration subsidiary is the US$. The consolidated financial statements are presented in US$ as this best reflects the economic environment of the oil exploration sector in which the Group operates. Foreign exchange risk arises because the Group’s services and treasury function is UK sterling, which results in gains or losses on retranslation into US$. To minimise this foreign currency risk cash balances are held in both £ sterling and US$.
The foreign currency profile of financial assets and liabilities of the Group and the Company are as follows:
Group Company
Other receivables measured at
amortised cost2016$000
Other receivables measured at
amortised cost2015$000
Other receivables measured at
amortised cost2016$000
Other receivables measured at
amortised cost2015$000
Current financial assetsHeld in UK£:Other receivables 1,167 297 1,166 297Cash and cash equivalents 8,892 12,826 8,892 12,826
Total current financial assets held in UK£ 10,059 13,123 10,058 13,123Held in US$:Trade and other receivables – – 288,230 289,769Cash and cash equivalents 752 1,185 752 1,185
Total financial assets 10, 811 14,308 299,040 304,077
If there was a 10% change in the year end exchange rate there would be a movement in the US$ equivalent of financial assets held in UK£ of $1,005,800 (2015: $1,312,325) for the Group and Company.
Group Company
Financial liabilities measured at
amortised cost2016$000
Financial liabilities measured at
amortised cost2015$000
Financial liabilities measured at
amortised cost2016$000
Financial liabilities measured at
amortised cost2015$000
Held in UK£:Trade and other payables 1,136 283 1,135 283
Total financial liabilities 1,136 283 1,135 283
If there was a 10% change in the year end exchange rate there would be a movement in the US$ equivalent of financial liabilities held in the UK£ of $113,500 (2015 – $28,300) for the Group and Company.
c) Credit riskNeither the Group nor the Company have sales customers so formal credit procedures are not usually relevant. Recently the Company sold some its inventory held in The Falkland Islands and monies due from this were outstanding at year end. These balances were partially offset by monies owed by the Company to the same entity. Credit risk on cash balances is managed by only banking with reputable financial institutions with a high credit rating. The only significant concentration of credit risk on an ongoing basis is cash held at bank and the maximum credit risk exposure for the Group and Company is detailed in the table below:
2016 2015
Carrying Value$000
Maximumexposure
$000
CarryingValue$000
Maximumexposure
$000
Cash and cash equivalents 9,645 9,645 14,011 14,011
Maximum credit risk exposure 9,645 9,645 14,011 14,011
CapitalThe objective of the Directors is to maximise shareholder return and minimise risk by keeping a reasonable balance between debt and equity. To date the Group has minimised risk by being purely equity financed. The Group considers its capital to comprise its ordinary share capital, share premium, accumulated retained deficit and other reserves.
20 Financial instruments continued
NOTES TO THE FINANCIAL STATEMENTS CONTINUEDFOR THE YEAR ENDED 31 DECEMBER 2016
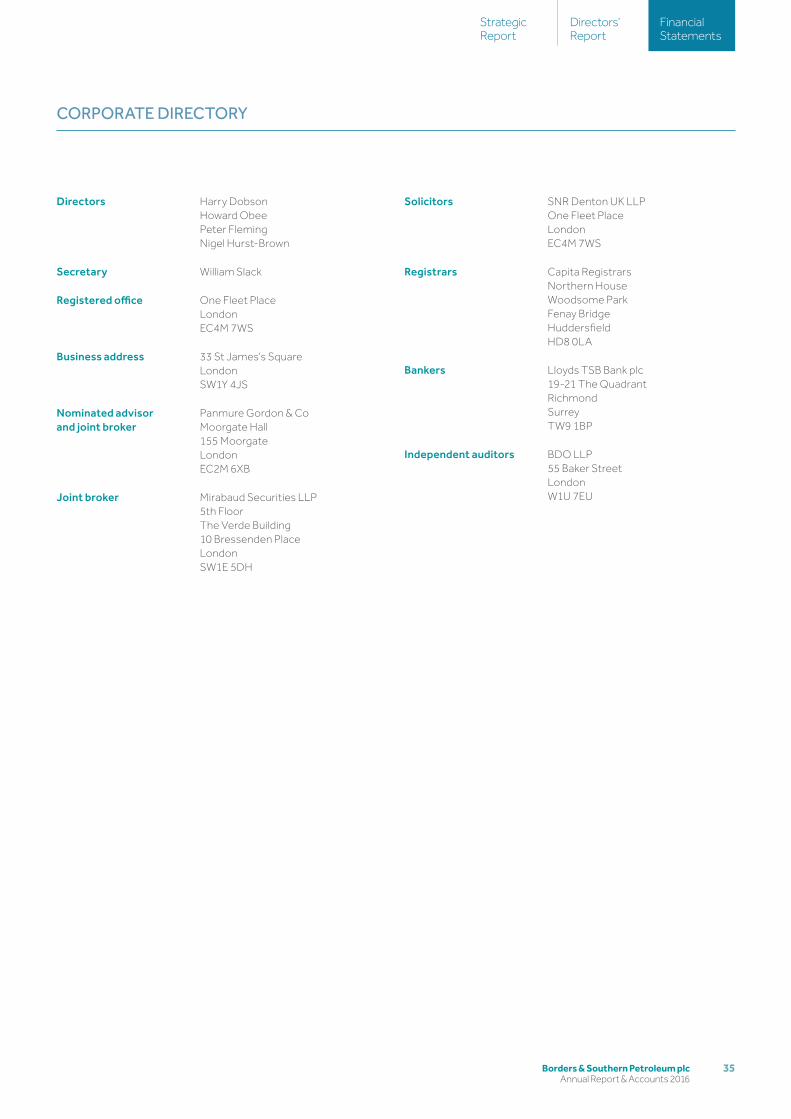
35Borders & Southern Petroleum plc Annual Report & Accounts 2016
FinancialStatements
Directors’ Report
StrategicReport
Solicitors SNR Denton UK LLPOne Fleet PlaceLondonEC4M 7WS
Registrars Capita RegistrarsNorthern HouseWoodsome ParkFenay BridgeHuddersfieldHD8 0LA
Bankers Lloyds TSB Bank plc 19-21 The Quadrant Richmond Surrey TW9 1BP
Independent auditors BDO LLP55 Baker StreetLondonW1U 7EU
Directors Harry DobsonHoward ObeePeter FlemingNigel Hurst-Brown
Secretary William Slack
Registered office One Fleet PlaceLondonEC4M 7WS
Business address 33 St James’s SquareLondonSW1Y 4JS
Nominated advisorand joint broker
Panmure Gordon & CoMoorgate Hall155 MoorgateLondonEC2M 6XB
Joint broker Mirabaud Securities LLP5th FloorThe Verde Building10 Bressenden PlaceLondonSW1E 5DH
CORPORATE DIRECTORY

Borders & Southern Petroleum plc Annual Report & Accounts 2016
36
NOTES


33 St James’s SquareLondon SW1Y 4JSUnited Kingdom
Telephone: +44 (0)20 7661 9348Fax: +44 (0)20 7661 8055
Borders &
Southern Petroleum
plc Annual R
epo
rt & A
ccounts 2016