rating canadian provinces: methodology and outlook presentation to the aaae – september 12, 2011
TRANSCRIPT

Rating Canadian Provinces: Methodology and OutlookPresentation to the AAAE – September 12, 2011

2
Introduction
• Credit rating agencies have been in the news due to the downgrades of several European countries and the discussion surrounding the US debt ceiling / fiscal sustainability.
• Canada and the provinces continue to maintain their high credit ratings. We don’t expect any widespread rating adjustments in 2011.
• Today’s presentation will give an insight into Moody’s Investors Service, in particular the Sub-sovereign rating process.

3
Topics for Discussion
• Credit rating definitions
• Regional and Local Government Rating Methodology
• Outlook for the Provinces

4
Credit Rating Definitions

What We Measure
All credit rating agencies attempt to measure the “credit worthiness” of issuers.
However, credit worthiness can vary from one agency to another.
At Moody’s Investors Service, we rate the expected loss :
EL = probability of default x (1-recovery rate)

Moody's Global Rating Scale Idealized 10-Year Expected Loss Rates
Time Horizon (in years)
1 2 3 4 5 6 7 8 9 10
Aaa 0.0000% 0.0001% 0.0004% 0.0010% 0.0016% 0.0022% 0.0029% 0.0036% 0.0045% 0.0055%
Aa1 0.0003% 0.0017% 0.0055% 0.0116% 0.0171% 0.0231% 0.0297% 0.0369% 0.0451% 0.0550%
Aa2 0.0007% 0.0044% 0.0143% 0.0259% 0.0374% 0.0490% 0.0611% 0.0743% 0.0902% 0.1100%
Aa3 0.0017% 0.0105% 0.0325% 0.0556% 0.0781% 0.1007% 0.1249% 0.1496% 0.1799% 0.2200%
A1 0.0032% 0.0204% 0.0644% 0.1040% 0.1436% 0.1815% 0.2233% 0.2640% 0.3152% 0.3850%
A2 0.0060% 0.0385% 0.1221% 0.1898% 0.2569% 0.3207% 0.3905% 0.4560% 0.5401% 0.6600%
A3 0.0214% 0.0825% 0.1980% 0.2970% 0.4015% 0.5005% 0.6105% 0.7150% 0.8360% 0.9900%
Baa1 0.0495% 0.1540% 0.3080% 0.4565% 0.6050% 0.7535% 0.9185% 1.0835% 1.2485% 1.4300%
Baa2 0.0935% 0.2585% 0.4565% 0.6600% 0.8690% 1.0835% 1.3255% 1.5675% 1.7820% 1.9800%
Baa3 0.2310% 0.5775% 0.9405% 1.3090% 1.6775% 2.0350% 2.3815% 2.7335% 3.0635% 3.3550%
Ba1 0.4785% 1.1110% 1.7215% 2.3100% 2.9040% 3.4375% 3.8830% 4.3395% 4.7795% 5.1700%
Ba2 0.8580% 1.9085% 2.8490% 3.7400% 4.6255% 5.3735% 5.8850% 6.4130% 6.9575% 7.4250%
Ba3 1.5455% 3.0305% 4.3285% 5.3845% 6.5230% 7.4195% 8.0410% 8.6405% 9.1905% 9.7130%
B1 2.5740% 4.6090% 6.3690% 7.6175% 8.8660% 9.8395% 10.5215% 11.1265% 11.6820% 12.2100%
B2 3.9380% 6.4185% 8.5525% 9.9715% 11.3905% 12.4575% 13.2055% 13.8325% 14.4210% 14.9600%
B3 6.3910% 9.1355% 11.5665% 13.2220% 14.8775% 16.0600% 17.0500% 17.9190% 18.5790% 19.1950%
Caa1 9.5599% 12.7788% 15.7512% 17.8634% 19.9726% 21.4317% 22.7620% 24.0113% 25.1195% 26.2350%
Caa2 14.3000% 17.8750% 21.4500% 24.1340% 26.8125% 28.6000% 30.3875% 32.1750% 33.9625% 35.7500%
Caa3 28.0446% 31.3548% 34.3475% 36.4331% 38.4017% 39.6611% 40.8817% 42.0669% 43.2196% 44.3850%
http://www.moodys.com/sites/products/DefaultResearch/102249_RM.pdf
Inve
stm
ent
Gra
deS
pecu
lativ
e G
rade

7
Canadian RLG Rated Universe
Province Rating Outlook Muncipality Rating Outlook
British Columbia Aaa Stable Vancouver Aaa StableAlberta Aaa Stable Winnipeg Aaa StableSaskatchewan Aa1 Stable Durham Aaa StableManitoba Aa1 Stable Halton Aaa StableOntario Aa1 Stable London Aaa StableQuebec Aa2 Stable Muskoka Aa2 StableNew Brunswick Aa2 Stable North Bay Aa1 StableNova Scoita Aa2 Stable Ottawa Aaa StablePrince Edward Island Aa2 Stable Peel Aaa StableNewfoundland and Labrador Aa2 Stable Toronto Aa1 Stable
Waterloo Aaa StableTerritory York Aaa StableNorthwest Territories Aa1 Stable Montreal Aa2 Stable
Quebec City Aa2 StableSt. John’s Aa2 Stable

8
Sub-Sovereign RLG Rating Methodology

9
Regional and Local Government Rating Methodology
The rating reflects the application of our Joint-Default Analysis methodology with two main inputs: baseline credit assessment (BCA) and likelihood of extraordinary support.
Baseline credit
assessment
BCA
Extraordinary support
MOODY’S
credit rating×

10
Regional and Local Government Rating Methodology
The BCA:
The baseline credit assessment numerically classifies variables from 6 broad categories to ensure uniformity across issuers:
• 2 are system wide, 4 are issuer specific
• 2 are qualitative, 4 are quantitative
The BCA is neither a matrix for automatically assigning an assessement nor a substitute for rating committee judgements.

11
Regional and Local Government Rating Methodology
Broad credit factors for the baseline credit assessment:
• Operating environment
• Institutional framework
• Financial position and performance
• Debt profile
• Governance and management
• Economic fundamentals

12
Regional and Local Government Rating Methodology
Operating environment:
• The national economic and political context in which RLGs function
• Wealth – reflection of ability to pay
• Stability – relates to financial stress
• Government effectiveness – stability and responsiveness of government institutions
• By definition operating environment scores are identical for all sub-sovereign issuers within the same country

13
Regional and Local Government Rating Methodology
Institutional framework:
• The arrangements that determine intergovernmental relations and shape RLG powers and responsibilities
• Revenue raising – degree of autonomy RLG has for deciding its own-source revenue
• Spending powers – degree of autonomy RLG has for deciding spending levels
• Borrowing capabilities – degree of autonomy RLG has for determining borrowing needs
• Qualitative

14
Regional and Local Government Rating Methodology
Financial position and performance:
• Strength of performance is a consequence of the accumulated decisions of policy makers
• Revenues and expenses – are they broad-based or narrow? Sustainable and reasonable?
• Bottom line – are expenses contained below revenue?
• Liquidity – does RLG have sufficient cash to cover debt service, salaries and suppliers?
• Interest payments relative to revenue – higher interest payments will impact on spending decisions

15
Regional and Local Government Rating Methodology
Debt profile:
• Study the amount of debt, the burden it poses, structure and composition and legal framework
• Short-term vs long-term – interest rate risks
• Ratio of net debt to operating revenue – proxy for debt servicing capacity. Multi-year trend also provides assessment of the ability to pay debt
• Ratio of short-term direct debt to direct debt – helps in assessing market access and interest rate risks over one-year time horizon.

16
Regional and Local Government Rating Methodology
Governance and management:
• We take into consideration the government structure, fiscal management practices, transparency and political and administrative arrangements
• Fiscal management – does RLG consistently meet targets?
• Investment and debt management – follow strict policies or are they lax?
• Transparency and disclosure – regular reporting, independently audits
• Institutional capacity – clearly defined rules and procedures for resolving budgetary issues
• Qualitatitive

17
Regional and Local Government Rating Methodology
Economic fundamentals
• Ability to service debt is tied to the ability to raise revenues, which is tied to the local economy’s ability to generate revenues
• Economic fundamentals – broad economy, labour market performance
• Are important sectors growing or fading?
• GDP per capita

18
Regional and Local Government Rating Methodology
To complete the analysis, we consider the likelihood of extraordinary support coming from the higher tier government to prevent a default by the lower tier government, should this extreme situation ever occur.
Baseline credit
assessment
BCA
Extraordinary support
MOODY’S
credit rating×

19
Reports and publications
20
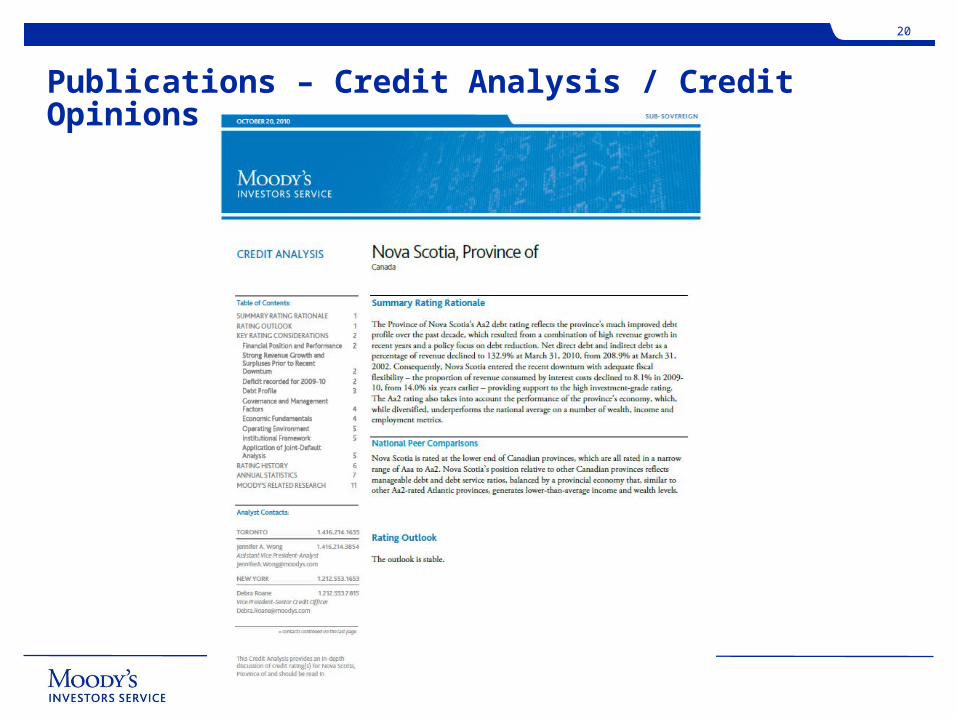
Publications – Credit Analysis / Credit Opinions

21
Publications – Special Comments

22
Publications – Articles in Weekly Credit Outlook

23
Outlook for the Provinces

24
Backdrop: Sluggish World Recovery
Source: Moody’s Global Macro-Risk Scenarios 2011-2012: Strong Headwinds Ahead, August 2011

25
Backdrop: Sluggish World Recovery
Source: Moody’s Global Macro-Risk Scenarios 2011-2012: Strong Headwinds Ahead, August 2011

26
Canadian Economy Continuing Its Expansion…
2005
Q1
2005
Q2
2005
Q3
2005
Q4
2006
Q1
2006
Q2
2006
Q3
2006
Q4
2007
Q1
2007
Q2
2007
Q3
2007
Q4
2008
Q1
2008
Q2
2008
Q3
2008
Q4
2009
Q1
2009
Q2
2009
Q3
2009
Q4
2010
Q1
2010
Q2
2010
Q3
2010
Q4
2011
Q1
2011
Q2
-3%
-2%
-1%
0%
1%
2%
Source: Statistics Canada
27
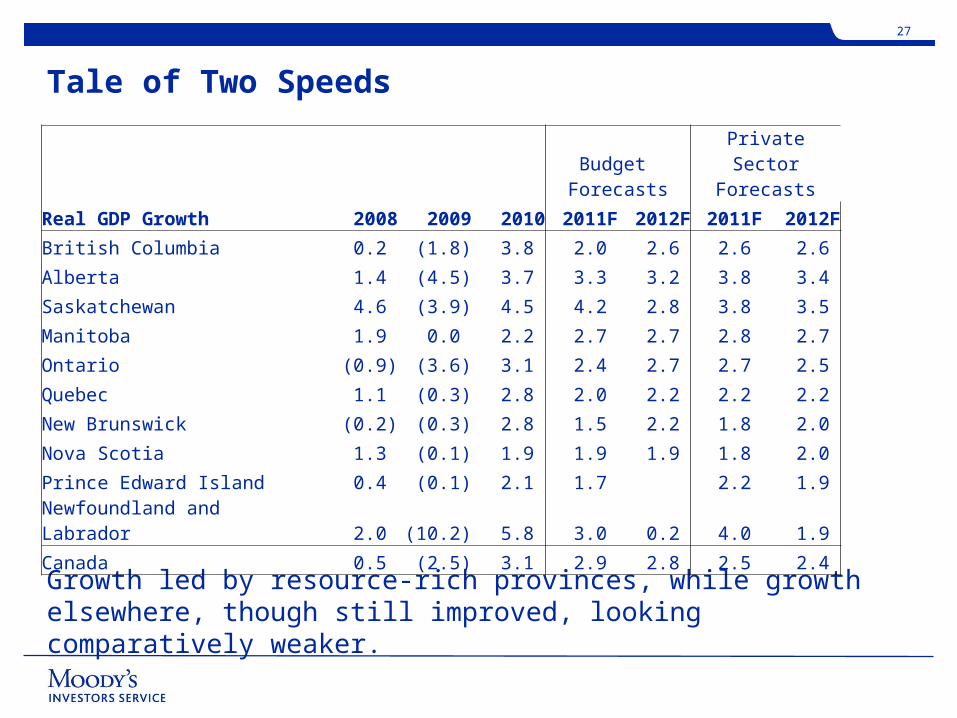
Tale of Two Speeds
Growth led by resource-rich provinces, while growth elsewhere, though still improved, looking comparatively weaker.
Budget
ForecastsPrivate Sector
Forecasts
Real GDP Growth 2008 2009 2010 2011F 2012F 2011F 2012F
British Columbia 0.2 (1.8) 3.8 2.0 2.6 2.6 2.6
Alberta 1.4 (4.5) 3.7 3.3 3.2 3.8 3.4
Saskatchewan 4.6 (3.9) 4.5 4.2 2.8 3.8 3.5
Manitoba 1.9 0.0 2.2 2.7 2.7 2.8 2.7
Ontario (0.9) (3.6) 3.1 2.4 2.7 2.7 2.5
Quebec 1.1 (0.3) 2.8 2.0 2.2 2.2 2.2
New Brunswick (0.2) (0.3) 2.8 1.5 2.2 1.8 2.0
Nova Scotia 1.3 (0.1) 1.9 1.9 1.9 1.8 2.0
Prince Edward Island 0.4 (0.1) 2.1 1.7 2.2 1.9
Newfoundland and Labrador 2.0 (10.2) 5.8 3.0 0.2 4.0 1.9
Canada 0.5 (2.5) 3.1 2.9 2.8 2.5 2.4

28
Sector Outlook Remains Negative as Challenges Persist
• While the sector outlook for Canadian provinces remains negative as fiscal challenges persist and debt increase.
• But we do not anticipate widespread rating adjustments in 2011.
• This reflects our view that the core factors underpinning the narrow Aaa to Aa2 rating range will not be affected.
• As the economy continues its expansion, we expect provincial governments will begin switching their focus from supporting demand to eliminating deficits.

29
Provinces Were Affected by the Downturn, But From an Improved Financial Position
Significant improvements in fiscal positions and debt burdens of Canadian provinces in the years leading up to the recent downturn placed the provinces, to varying degrees, in stronger positions to face the challenges of the recent recession.
20.0%
21.0%
22.0%
23.0%
24.0%
25.0%
26.0%
27.0%
28.0%
29.0%
30.0%
95%
105%
115%
125%
135%
145%
155%
Aggregate provincial debt-to-revenue (LHS)
Aggregate provincial debt-to-GDP (RHS)

30
Significant Fiscal Imbalances in 2009-10 and 2010-11
-15.0%
-10.0%
-5.0%
0.0%
5.0%
10.0%
15.0%
85%
95%
105%
115%
125%
135%
145%
155%
165%
Aggregate provincial consolidated surplus (deficit)-to-revenue (RHS)
Aggregate provincial debt-to-revenue (LHS)
31
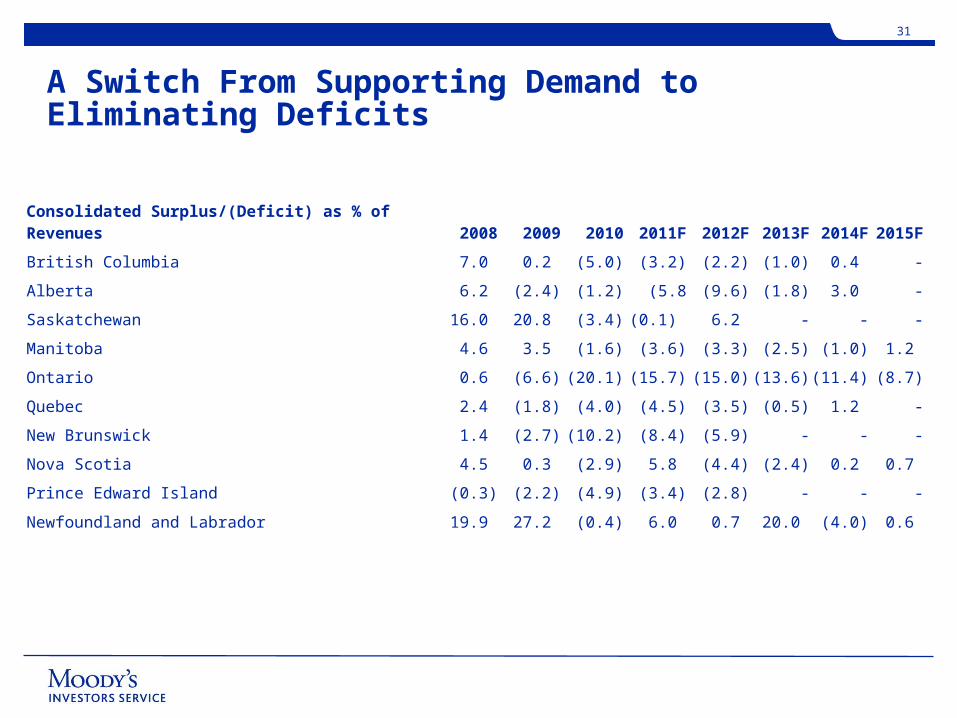
A Switch From Supporting Demand to Eliminating Deficits
Consolidated Surplus/(Deficit) as % of Revenues 2008 2009 2010 2011F 2012F 2013F 2014F 2015F
British Columbia 7.0 0.2 (5.0) (3.2) (2.2) (1.0) 0.4 -
Alberta 6.2 (2.4) (1.2) (5.8 (9.6) (1.8) 3.0 -
Saskatchewan 16.0 20.8 (3.4) (0.1) 6.2 - - -
Manitoba 4.6 3.5 (1.6) (3.6) (3.3) (2.5) (1.0) 1.2
Ontario 0.6 (6.6) (20.1) (15.7) (15.0) (13.6) (11.4) (8.7)
Quebec 2.4 (1.8) (4.0) (4.5) (3.5) (0.5) 1.2 -
New Brunswick 1.4 (2.7) (10.2) (8.4) (5.9) - - -
Nova Scotia 4.5 0.3 (2.9) 5.8 (4.4) (2.4) 0.2 0.7
Prince Edward Island (0.3) (2.2) (4.9) (3.4) (2.8) - - -
Newfoundland and Labrador 19.9 27.2 (0.4) 6.0 0.7 20.0 (4.0) 0.6

32
Expect Debt Burdens to Deteriorate Further in 2011, Albeit Moderately
BC AB SK MB ON QC NB NS PE NL0
50
100
150
200
2010 debt as % of revenues 2011f debt as % of revenues2012f debt as % of revenues
%

33
But Debt Affordability Has So Far Remained Manageable
0
5
10
15
20NS
NL
QC
NB
PE
%
0
5
10
15
20
AB
BC
SK
ON
MB
%
Interest expense as % of total expenses

34
Challenges: Provincial Elections
Province Party Election Date
Prince Edward Island
Liberal 3 October 2011
Manitoba NDP 4 October 2011
Ontario Liberal 7 October 2011
Newfoundland Progressive Conservatives
11 October 2011
Saskatchewan Saskatchewan Party
7 November 2011
Territory Party Election Date
Northwest Territories
Independent 3 October 2011
35
Challenges:
- Health and education spending
- Volatile revenue from natural resources
- Federal transfers
36
Provinces Have the Fiscal Flexibility to Reverse the Deterioration
• Moderately paced economic expansion, coupled with continued expense pressures will mean fiscal consolidation will likely take place over several years
• Canadian provinces have broad discretion over revenues and spending, including unfettered access to a broad range of tax bases and the ability to alter expenditure programs when needed
• This broad discretion over revenues and spending is the platform on which provinces will execute their fiscal consolidation plans

37
Jennifer WongAVP/AnalystSub-Sovereign GroupMoody’s Investors Service70 York St., Suite 1400Toronto, ON M5J [email protected]
Michael YakeAVP/AnalystSub-Sovereign GroupMoody’s Investors Service70 York St., Suite 1400Toronto, ON M5J [email protected]
Aaron WongAssociate AnalystSub-Sovereign GroupMoody’s Investors Service70 York St., Suite 1400Toronto, ON M5J [email protected]

38
© 2009 Moody’s Investors Service, Inc. and/or its licensors and affiliates (collectively, “MOODY’S”). All rights reserved. ALL INFORMATION CONTAINED HEREIN IS PROTECTED BY COPYRIGHT LAW AND NONE OF SUCH INFORMATION MAY BE COPIED OR OTHERWISE REPRODUCED, REPACKAGED, FURTHER TRANSMITTED, TRANSFERRED, DISSEMINATED, REDISTRIBUTED OR RESOLD, OR STORED FOR SUBSEQUENT USE FOR ANY SUCH PURPOSE, IN WHOLE OR IN PART, IN ANY FORM OR MANNER OR BY ANY MEANS WHATSOEVER, BY ANY PERSON WITHOUT MOODY’S PRIOR WRITTEN CONSENT. All information contained herein is obtained by MOODY’S from sources believed by it to be accurate and reliable. Because of the possibility of human or mechanical error as well as other factors, however, all information contained herein is provided “AS IS” without warranty of any kind. Under no circumstances shall MOODY’S have any liability to any person or entity for (a) any loss or damage in whole or in part caused by, resulting from, or relating to, any error (negligent or otherwise) or other circumstance or contingency within or outside the control of MOODY’S or any of its directors, officers, employees or agents in connection with the procurement, collection, compilation, analysis, interpretation, communication, publication or delivery of any such information, or (b) any direct, indirect, special, consequential, compensatory or incidental damages whatsoever (including without limitation, lost profits), even if MOODY’S is advised in advance of the possibility of such damages, resulting from the use of or inability to use, any such information. The ratings, financial reporting analysis, projections, and other observations, if any, constituting part of the information contained herein are, and must be construed solely as, statements of opinion and not statements of fact or recommendations to purchase, sell or hold any securities. NO WARRANTY, EXPRESS OR IMPLIED, AS TO THE ACCURACY, TIMELINESS, COMPLETENESS, MERCHANTABILITY OR FITNESS FOR ANY PARTICULAR PURPOSE OF ANY SUCH RATING OR OTHER OPINION OR INFORMATION IS GIVEN OR MADE BY MOODY’S IN ANY FORM OR MANNER WHATSOEVER. Each rating or other opinion must be weighed solely as one factor in any investment decision made by or on behalf of any user of the information contained herein, and each such user must accordingly make its own study and evaluation of each security and of each issuer and guarantor of, and each provider of credit support for, each security that it may consider purchasing, holding or selling.
Moody’s Investors Service, Inc. (“MIS”), a wholly-owned credit rating agency subsidiary of Moody’s Corporation (“MCO”), hereby discloses that most issuers of debt securities (including corporate and municipal bonds, debentures, notes and commercial paper) and preferred stock rated by MIS have, prior to assignment of any rating, agreed to pay to MIS for appraisal and rating services rendered by it fees ranging from $1,500 to approximately $2,500,000. MCO and MIS also maintain policies and procedures to address the independence of MIS’s ratings and rating processes. Information regarding certain affiliations that may exist between directors of MCO and rated entities, and between entities who hold ratings from MIS and have also publicly reported to the SEC an ownership interest in MCO of more than 5%, is posted annually at www.moodys.com under the heading “Shareholder Relations — Corporate Governance — Director and Shareholder Affiliation Policy.”