rains review 2004 the rains model: the approach. cost-effectiveness needs integration...
Post on 19-Dec-2015
217 views
TRANSCRIPT

RAINS review 2004
The RAINS model:
The approach
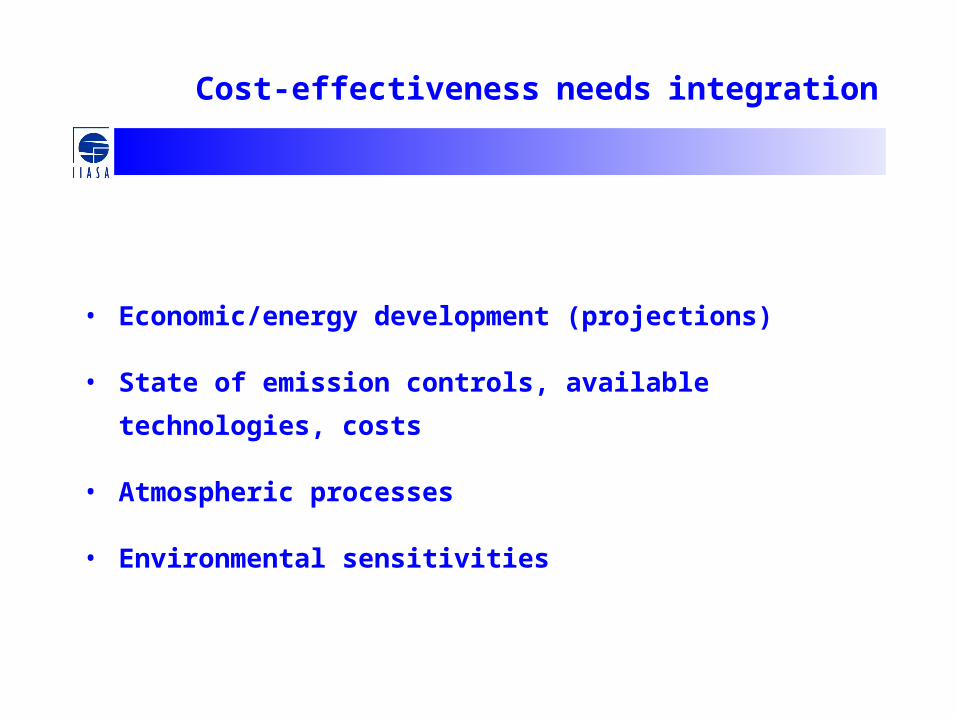
Cost-effectiveness needs integration
• Economic/energy development (projections)
• State of emission controls, available technologies, costs
• Atmospheric processes
• Environmental sensitivities

The RAINS model:Scenario analysis mode
Energy/agriculture projections
Emissions
Emission control options
Atmospheric dispersion
Costs
Driving forces
Health & environmental impact indicators

A multi-pollutant/multi-effect framework
Primary PM
Health impacts:- PM
SO2 NOx VOC NH3
via secondary aerosols
Acidification
Eutrophication
- Ozone
Vegetation damage: - Ozone

RAINS: A modular approach
Economicactivities
Emission controlpolicies
Agriculture
NOx emissions
SO2 emissions
Solvents, fuels,industry
Energy use
NH3 dispersion
S dispersion
VOC emissions
NH3 emissions
Transport
Critical loadsf. acidification
Critical loads f.eutrophication
NOx dispersion
O3 formation
NH3 control& costs
NOx/VOC control&costs
VOC control& costs
Emission control costs
Critical levelsfor ozone
Environmentaltargets
Primary PM dispersionOther activities PM control
& costs
Primary PM emissions
Secondary aerosols
PM Population exposure
SO2 control& costs
NOx control& costs
O3 Populationexposure
Environmental impacts

Integrated assessment in CAFE with the RAINS model
Energy/agriculture projections
Emissions
Emission control options
Atmospheric dispersion
Health and environmental impacts
Environmental targets
Costs OPTIMIZATION
Driving forces
BASELINE SCENARIO

Per-capita costs Scenario H1
EU-15
UK
Sweden
SpainPortugal
Netherlands
Luxembourg
ItalyIreland
Greece
Germany
FranceFinland
Denmark
Belgium
Austria
0
100
200
300
0.0 0.5 1.0 1.5 2.0 2.5 3.0 3.5
Average ozone population exposure index of REF(ppm.h)
Tota
l em
issi
on
co
ntr
ol c
ost
s/ca
pit
a (E
UR
O/y
r)
H1
REF

Uniform or effect-based scenarios?
REF
G5/3
G5/2
G5/1
UNIFORMPER CAPITAEMISSIONS
UNIFORM% REDUCTION
0
5
10
15
20
200 250 300 350 400 450 500 550 600
Population exposure index (million persons.ppm.hours)
Co
sts
ab
ov
e R
EF
( Bil
lio
n E
UR
O/y
r)

Cost-effectiveness vs. cost-benefit
Cost-effectiveness:
• Find least-cost solution to achieve exogenously given environmental policy targets.
• Decision makers set targets and decide about appropriate balance with costs
Cost-benefit analysis:
• The optimal balance between costs and measures is internalized by the model.
• No room for exogenous decision maker.
• Consensus on quantification of benefits required.

The cost-effectiveness approach
Decision makers
Decide about•Ambition level (environmental targets)
•Level of acceptable risk
•Willingness to pay
Models help to separate policy and technical issues:
Models
Identify cost-effective and robust measures:
• Balance controls over different countries, sectors and pollutants
• Regional differences in Europe
• Side-effects of present policies
• Maximize synergies with other air quality problems
• Search for robust strategies

System boundaries
Driving forces of air pollution (energy use, transport, agriculture)
• are driven by other issues, and• have impacts on other issues too.
• Critical boundaries:– Greenhouse gas emissions and climate change policies– Agricultural policies– Other air pollution impacts on water and soil (nitrogen
deposition over seas, nitrate in groundwater, etc.)– Quantification of AP effects where scientific basis is not
robust enough
Interactions between emission controls for air pollution and greenhouse gases
A “sneak preview” of the RAINS extension to GHGs

Reference case (REF)
• “Pre-Kyoto” energy projections for 2020
• Air pollution control according to recent EU legislation (NEC Directive, LCP Directive, Auto-Oil, etc.)

Scenario 1
CO2 control in the power sector
• Cost-effective measures to reduce CO2 emissions in the power sector by 15 %
• Subject to exogenous electricity demand
• Recent EU legislation for air pollutants

CO2 reduction measures applied in Scenario 1
-60% -40% -20% 0% 20% 40% 60% 80% 100%
Wind, solar
Biomass
Hydro
Gas
Hard coal
Brown coal
cf. REFScenario 1

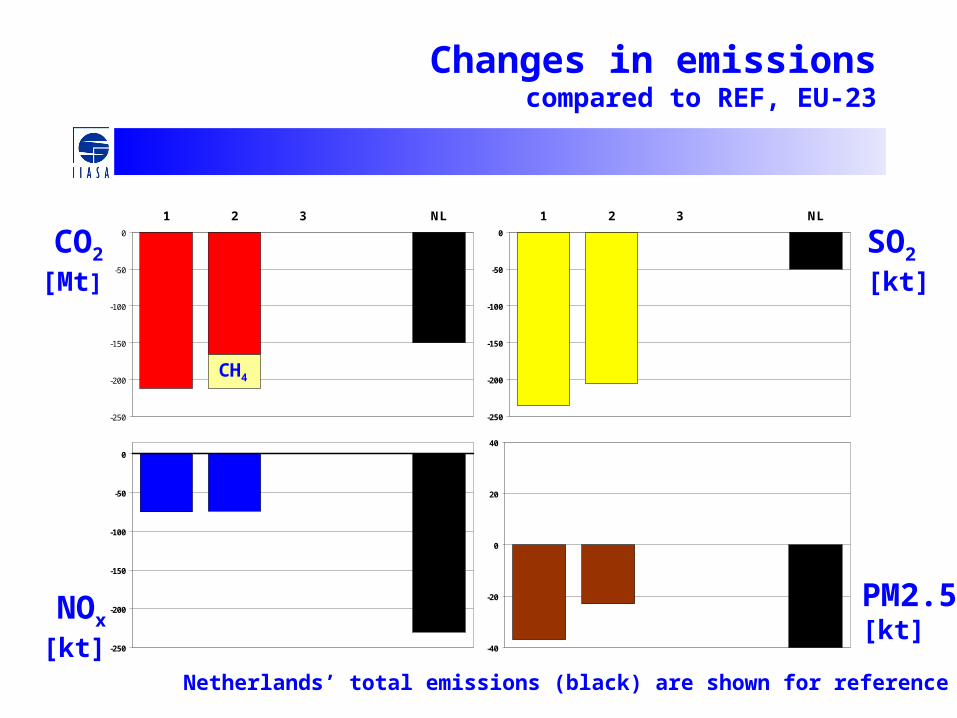
Changes in emissionscompared to REF, EU-23
CO2
[Mt]
NOx
[kt]
SO2
[kt]
PM2.5[kt]
-250
-200
-150
-100
-50
0
1 2 3 NL
-250
-200
-150
-100
-50
0
-40
-20
0
20
40
-250
-200
-150
-100
-50
0
1 2 3 NL
Netherlands’ total emissions (grey) are shown for reference

Emission control costs(billion €/yr, compared to REF)
Control of Scenario 1
CO2 +3.5
CH4 0
GHGs +3.5
SO2 -1.4
NOx -0.3
PM -0.6
Air pollutants -2.3
Total +1.2

Differences in premature deaths (cases/year, compared to REF)
-4000
-3000
-2000
-1000
0
1000
1 2 3

Scenario 2
Multi-GHG control
• In each country, the equivalent CO2 reductions of Scenario 1 are achieved with CO2 and CH4 controls
• Recent EU legislation for air pollutants

CO2 reduction measures applied in Scenarios 1 and 2
-60% -40% -20% 0% 20% 40% 60% 80% 100%
Wind, solar
Biomass
Hydro
Gas
Hard coal
Brown coal
cf. REFScenario 2 Scenario 1

CH4 reduction measures applied in Scenario 2
0 2 4 6 8 10 12 14
Paper recycling
Improved feed conversion efficiency
Decreased gas flaring
Improved I&M for gas distribution
Use gas in oil extraction
Gas recovery coal mines
Increased gas utilization
Ban agricultural waste burning
Further increased gas utilization
Housing adaptation
Alternative rice strains
Digestion
Integrated waste water systems
Doubling leak control frequency
Other waste diversion
Replacement of grey cast iron network
Propionate precursors
MtCO2eq
-250
-200
-150
-100
-50
0
1 2 3 NL
-250
-200
-150
-100
-50
0
-40
-20
0
20
40
-250
-200
-150
-100
-50
0
1 2 3 NL
Changes in emissionscompared to REF, EU-23
CO2
[Mt]
NOx
[kt]
SO2
[kt]
PM2.5[kt]
Netherlands’ total emissions (black) are shown for reference
CH4

Emission control costs(billion €/yr, compared to REF)
Control of Scenario 1 Scenario 2
CO2 +3.5 +2.1
CH4 0 -1.2
GHGs +3.5 +0.9
SO2 -1.4 -1.2
NOx -0.3 -0.2
PM -0.6 -0.4
Air pollutants -2.3 -1.8
Total +1.2 -0.9

Scenario 3
Increased biomass use in households
• Shift to biomass use for domestic heating:10% of light fuel oil is replaced by biomass

-250
-200
-150
-100
-50
0
1 2 3 NL
-250
-200
-150
-100
-50
0
-40
-20
0
20
40
-250
-200
-150
-100
-50
0
1 2 3 NL
Netherlands’ total emissions (black) are shown for reference
CO2
[Mt]
NOx
[kt]
SO2
[kt]
PM2.5[kt]
Changes in emissionscompared to REF, EU-23
CH4

Differences in premature deaths(cases/year, compared to REF)
-4000
-3000
-2000
-1000
0
1000
1 2 3