ireland’s reenhouse as emission projections 2015 ghg projections... · ireland’s greenhouse gas...
TRANSCRIPT

Ireland’s Greenhouse Gas Emission Projections
2014-2035
18th May 2015

Page 1 of 17
Ireland’s Greenhouse Gas Emission Projections - Overview
This report provides an updated assessment of Ireland’s progress towards achieving its emission reduction targets set down under the EU Effort Sharing Decision (Decision No 406/2009/EC) for the years 2013-2020. Ireland’s 2020 target is to achieve a 20% reduction of non-Emission Trading Scheme (non-ETS) sector emissions (i.e. agriculture, transport, the built environment, waste and non-energy intensive industry) on 2005 levels with annual binding limits set for each year over the period 2013-2020. The annual limits establish a linear pathway required to meet the 2020 target.
For this year’s projections, the EPA has estimated new annual limits and a 2020 target for Ireland which incorporate methodological changes underpinning greenhouse gas emission inventories and projections. It is estimated that non-ETS sector emissions are projected to be 9% - 14% below 2005 levels by 2020. This compares to the target of 20% below 2005 levels by 2020.
Agriculture and transport dominate non-ETS sector emissions; emission trends from these sectors will be key determinants in terms of meeting targets with both projected to increase in the period to 2020.
To determine compliance under the Effort Sharing Decision, any
overachievement of the binding emission limit in a particular year (in the period 2013 to 2020) can be banked and used towards compliance in a future year. For example, if non-ETS sector emissions for 2013 are below the annual binding limit, the difference can be used towards compliance in subsequent years.
Under the ‘worst case’ scenario, Ireland is projected to cumulatively exceed its obligations by 4 Mtonnes of CO2eq over the period 2013-2020.
Under the ‘best case’ scenario, Ireland is projected to cumulatively meet its compliance obligations over the 2013-2020 period and meet its 2020 target. This takes into account the overachievement of the annual limits in the period 2013-2017 which is banked and used in the years 2018-2020. It is important to note that achieving the outlook under the ‘best case’ scenario will require focus and effort which includes meeting renewable targets for transport and heat as well as energy efficiency targets. Failure to deliver on these ambitions will result in Ireland exceeding its EU compliance obligations.
It is important to also note that even if Ireland complies with its 2013-2020 obligations there will be new obligations (as yet undefined) for the years 2021-2030. A starting point for post-2020 obligations in excess of the range of expected outcomes for 2020 (i.e. 9%-14% below 2005 levels) will inevitably lead to severe compliance challenges early in the following decade and beyond. In this context Ireland is not on track towards decarbonising the economy in the long term in line with the Climate Action and Low Carbon Development Bill 2015 and will face steep challenges post-2020 unless further polices and measures are put in place over and above those envisaged between now and 2020.

Page 2 of 17
Figure 1 shows projected emission levels for non-ETS sector emissions under the With Measures (worst case) and With Additional Measures (best case) scenarios. In addition, it shows the annual compliance/non-compliance in relation to the annual emission limits1.
Figure 1. With Measures and With Additional Measures greenhouse gas emissions projections and comparison with the linear reduction pathway required between 2013 and 2020
1 In accordance with Article 3 (2) of Effort Sharing Decision (Decision No 406/2009/EC), Ireland’s non ETS greenhouse gas emissions in 2013 must not exceed its average annual greenhouse gas emissions during 2008, 2009 and 2010. Therefore the 2013 limit applied in Figure 1 is based on the average 2008-2010 non ETS totals (46.18 Mtonnes of CO2eq) and follows a trajectory to the 2020 target which is 20% below 2005 levels (applying new IPPC guidelines and UNFCCC methodologies).
0
5
10
15
20
25
30
35
40
45
50
2013 2014 2015 2016 2017 2018 2019 2020
CO
2 e
q M
ton
ne
s
WM non-ETS Emission Projections WAM non-ETS Emission Projections Annual Limits
Page 3 of 17
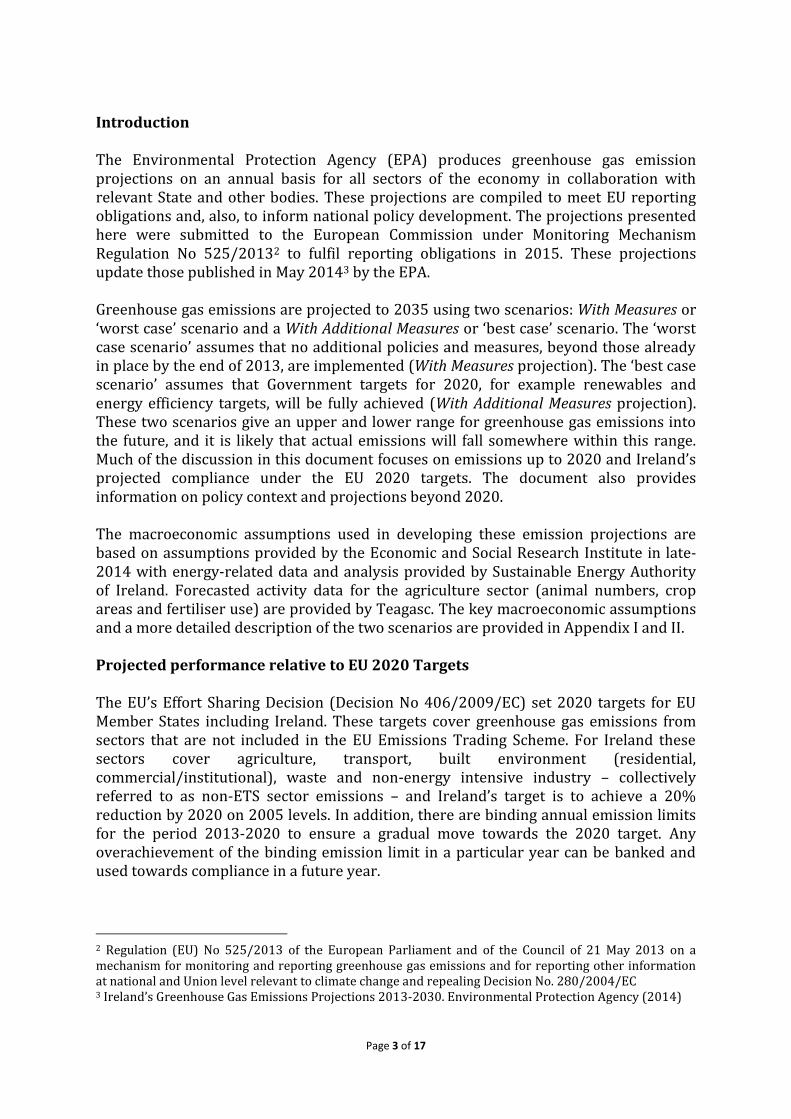
Introduction The Environmental Protection Agency (EPA) produces greenhouse gas emission projections on an annual basis for all sectors of the economy in collaboration with relevant State and other bodies. These projections are compiled to meet EU reporting obligations and, also, to inform national policy development. The projections presented here were submitted to the European Commission under Monitoring Mechanism Regulation No 525/20132 to fulfil reporting obligations in 2015. These projections update those published in May 20143 by the EPA. Greenhouse gas emissions are projected to 2035 using two scenarios: With Measures or ‘worst case’ scenario and a With Additional Measures or ‘best case’ scenario. The ‘worst case scenario’ assumes that no additional policies and measures, beyond those already in place by the end of 2013, are implemented (With Measures projection). The ‘best case scenario’ assumes that Government targets for 2020, for example renewables and energy efficiency targets, will be fully achieved (With Additional Measures projection). These two scenarios give an upper and lower range for greenhouse gas emissions into the future, and it is likely that actual emissions will fall somewhere within this range. Much of the discussion in this document focuses on emissions up to 2020 and Ireland’s projected compliance under the EU 2020 targets. The document also provides information on policy context and projections beyond 2020. The macroeconomic assumptions used in developing these emission projections are based on assumptions provided by the Economic and Social Research Institute in late-2014 with energy-related data and analysis provided by Sustainable Energy Authority of Ireland. Forecasted activity data for the agriculture sector (animal numbers, crop areas and fertiliser use) are provided by Teagasc. The key macroeconomic assumptions and a more detailed description of the two scenarios are provided in Appendix I and II. Projected performance relative to EU 2020 Targets The EU’s Effort Sharing Decision (Decision No 406/2009/EC) set 2020 targets for EU Member States including Ireland. These targets cover greenhouse gas emissions from sectors that are not included in the EU Emissions Trading Scheme. For Ireland these sectors cover agriculture, transport, built environment (residential, commercial/institutional), waste and non-energy intensive industry – collectively referred to as non-ETS sector emissions – and Ireland’s target is to achieve a 20% reduction by 2020 on 2005 levels. In addition, there are binding annual emission limits for the period 2013-2020 to ensure a gradual move towards the 2020 target. Any overachievement of the binding emission limit in a particular year can be banked and used towards compliance in a future year.
2 Regulation (EU) No 525/2013 of the European Parliament and of the Council of 21 May 2013 on a mechanism for monitoring and reporting greenhouse gas emissions and for reporting other information at national and Union level relevant to climate change and repealing Decision No. 280/2004/EC 3 Ireland’s Greenhouse Gas Emissions Projections 2013-2030. Environmental Protection Agency (2014)

Page 4 of 17
Figure 2. Projected sectoral share of non-ETS greenhouse gas emissions in 2020 for the With Additional Measures scenario The main findings from the projections published in this report are:
Agriculture and transport dominate non-ETS sector emissions accounting for approximately 75% of emissions in 2020, as shown in Figure 2 above. Emission trends from these sectors will be key determinants in terms of meeting targets.
o Agriculture emissions are projected to increase 2% by 2020 on current levels. This reflects the impact of Food Harvest 2020 and removal of the milk quota regime in 2015. Relative to 2005, agriculture emissions are projected to decrease by 5% by 2020.
o Transport emissions are projected to show strong growth over the period to 2020 with a 13%-19% increase on current levels depending on the level of policy implementation. Relative to 2005, transport emissions are projected to remain the same or, at best, decrease by 4% by 2020.
Ireland’s non-ETS sector emissions are projected to be 9% - 14% below 2005
levels by 2020.
To determine compliance under the Effort Sharing Decision (Decision No 406/2009/EC), any overachievement of the binding emission limit in a particular year can be banked and used towards compliance in a future year. Under the ‘worst case’ scenario, Ireland is projected to exceed its annual limit in 2017. The overachievement in relation to annual limits over the period 2013-2016 can be used towards compliance so that cumulatively Ireland is projected to exceed its obligations by 4 Mtonnes of CO2eq over the period 2013-2020.
Under the ‘best case scenario’, Ireland will exceed its annual limit in 2018. As above, overachievement in relation to annual limits over the period 2013-2017 can be used towards compliance so that Ireland is projected to cumulatively meet its compliance obligations over the 2013-2020 period under the ‘best case scenario’.
Energy - non-CO2,
1.0%
Agriculture, 45.6%
Transport, 29.3%
Industry & Commercial,
7.7%
Residential, 11.6%
Waste, 1.9%

Page 5 of 17
It is important to note that achieving these reductions will require focus and
effort which includes meeting renewable targets for transport and heat as well as energy efficiency targets. Failure to deliver on these ambitions will result in Ireland exceeding its EU compliance obligations.
The impact of forest sinks is not included in this compliance assessment. This is in line with EU accounting rules which do not allow the use of forest sinks to meet EU 2020 targets. Member States can, however, achieve compliance through a number of other mechanisms which are set out in the EU Effort Sharing Decision (Decision No 406/2009/EC). These include borrowing a quantity of its annual emission allocation i.e. limit from the following year, use of transfers from other Member States and the limited use of international credits from project activities as long as certain criteria are met. There are anticipated to be changes to the Effort Sharing annual limits and 2020 targets for some Member States, including Ireland, as a result of changes to reporting guidelines and methodologies which were recently adopted in relation to compiling greenhouse gas emission inventories4. Box 1 details these changes and how the EPA is dealing with these anticipated changes to the limits in the presentation of these projections. 4 E.g. new sources added (e.g. CO2 emissions from urea application to agricultural soils), Global Warming Potentials have changed (e.g. GWP of N2O changed from 310 to 298, GWP of Methane changed from 21 to 25)
Box 1. New methodologies and UNFCCC reporting guidelines – Impacts on EU Effort Sharing Annual Limits and 2020 Targets
In accordance with Article 27 of the Monitoring Mechanism Regulation (Regulation (EU) 525/2013) the European Commission is required to examine the impact of the use of the 2006 IPCC Guidelines for National Greenhouse Gas Inventories and significant changes brought about by the UNFCCC methodologies by December 2016. This may lead to a revision of the Effort Sharing Decision targets for Ireland and therefore the 2013-2020 annual limits. New UNFCCC reporting guidelines were used for the first time for compiling greenhouse gas inventories for the period 1990-2013. The adoption of these new reporting obligations and application of the methodological approaches include implementing the IPCC 2006 Guidelines, inclusion of a new greenhouse gas (nitrogen triflouride), and new global warming potentials (GWPs). These new methods were subsequently used in compiling the projections discussed in this report. For this year’s projections, the EPA has estimated annual limits and a 2020 target for Ireland which incorporate the methodology changes discussed above to allow for a like-for-like comparison to be made between the projections published in this report and recalculated annual limits and 2020 targets. These estimates are provided to give an indication of how Ireland is likely to perform relative to amended EU targets over the period 2013-2020 and may be subject to change following the Commission’s examination of the impact of guidelines referred to above.

Page 6 of 17
Figure 3 shows the projected cumulative distance to target over the period 2013-2020. It is important to note that the ‘best case scenario’ (With Additional Measures projection) assumes that all targets in Government policy documents such as the NEEAP5 and NREAP6 are met. The difficulties associated with meeting these targets should, however, not be underestimated. Failure to meet these targets will result in even higher emissions levels than those projected under this scenario and will result in Ireland’s emission levels moving even further from its emission reduction targets.
Figure 3. Projected cumulative distance to target for Ireland’s Non-ETS emissions 2013 to 2020
5 Maximising Ireland’s Energy Efficiency. The National Energy Efficiency Action Plan 2009-2020. Department of Communications, Energy and Natural Resources, 2014; Ireland’s third National Energy Efficiency Action Plan to 2020. Department of Communications, Energy and Natural Resources, 2014. 6 National Renewable Energy Action Plan, Ireland. Submitted to the European Commission under Article 4 of Directive 2009/28/EC. Department of Communications, Energy and Natural Resources, 2010
-12
-10
-8
-6
-4
-2
0
2
4
6
2013 2014 2015 2016 2017 2018 2019 2020
CO
2e
q, M
ton
ne
s
WM non-ETS Emission Projections WAM non-ETS Emission Projections

Page 7 of 17
Sectoral Emissions to 2020 Transport
Under the With Measures scenario, transport emissions are projected to increase by 19% over the period 2013 – 2020 to 13.2 Mt CO2eq. The With Measures scenario includes:
o the impact of VRT and motor tax changes (introduced in 2008), public transport efficiencies (e.g. integrated ticketing) and the carbon tax imposed on fuels since 2010
o improvements to the fuel economy of private cars, supported by EU Regulation which mandates maximum levels of CO2 for new cars to 120g/km in 2015 and 95g/km in 2020
o 6% of transport energy demand comes from biofuels by 2020 which is supported by the Biofuel Obligation Scheme 20107.
Under the With Additional Measures scenario, transport emissions are projected
to increase by 13% over the period 2013 – 2020 to 12.5 Mt CO2eq returning transport emissions to 2009 levels by 2020. In this scenario, it is assumed that:
o the RES-T target8 is met and biofuel use is 10% of total transport fuel demand by 2020. The Biofuels Obligation Scheme 20107 and the rollout of electric vehicles (50,000 electric vehicles deployed by 2020) underpin the achievement of this target. This is the main measure assumed to deliver emission reductions in the transport sector.
o More efficient road traffic movements (e.g. eco driving techniques) are in place.
Agriculture
Agriculture sector emissions arise from enteric fermentation, manure management and nitrogen & urea application to soils. For agriculture emission projections, two scenarios or outlooks for the future are estimated both of which assume full achievement of the Food Harvest 20209 targets by 2020. The difference between the two scenarios is less than 1% and is attributable to the inclusion of nitrogen fertilizer use efficiencies in the With Additional Measures scenario. The data underpinning the projections include forecasted animal numbers, crop areas and projected nitrogen fertiliser application to soils supplied by Teagasc.
Total emissions from agriculture are projected to increase by 2% over the period
2013 – 2020 to 19.3 Mt CO2eq under the With Additional Measures scenario. The
7http://www.dcenr.gov.ie/Energy/Sustainable+and+Renewable+Energy+Division/Biofuels+Obligation+Scheme.htm 8 Renewable Energy Directive of June 2009 (28/EC/2009) 9 http://www.agriculture.gov.ie/media/migration/agri-foodindustry/foodharvest2020/2020FoodHarvestEng240810.pdf

Page 8 of 17
dairy cow herd is projected to increase by 21% on current levels while the beef herd is projected to decrease by 7% by 2020. Nitrogen fertiliser use is projected to increase by 3% on 2013 levels by 2020.
Enteric fermentation, soils & indirect emissions and manure management
account for on average 55%, 30% and 9%, respectively of total emissions from agriculture. Emissions from the combustion of fossil fuels accounts for on average 4% of total emissions from agriculture. Carbon dioxide emissions from lime and urea application to agricultural soils account for the remaining 2%.
Residential
Under the With Measures scenario, emissions from the residential sector are projected to decrease by 9% to 6 Mt CO2eq between 2013 and 2020. The following measures are included in the With Measures emission projection: SEAI’s Greener Homes Scheme, Warmer Homes Scheme, Home Energy Savings Scheme, Energy Efficient Boiler Standard, Part L of the 2002 and 2008 Building Regulations and the carbon tax on fuels introduced in 2010.
Under the With Additional Measures scenario, emissions are projected to decrease by 23% between 2013 and 2020 to 5 Mt CO2eq. Under this scenario, SEAI’s Better Energy Homes (residential retrofit) accounts for approximately 85% of the additional emission savings foreseen. This scenario also includes the effect of further amendments to building regulations.
Industry and Commercial Services
Under the With Measures scenario, emissions from the industry and commercial services sector are projected to decrease by 5% to 8.6 Mt between 2013 and 2020. The impact of the Accelerated Capital Allowance Scheme, Building Regulations, SEAI energy agreements such as the Large Industry Network, Combined Heat and Power and supports for energy efficiency improvements are included in this scenario.
Under the With Additional Measures scenario, emissions from the industry and commercial services sector are projected to decrease by 20% to 7 Mt between 2013 and 2020. In this scenario, energy demand from industrial and commercial services sectors is 14% lower than the With Measures scenario as energy efficiency policies and measures are assumed to be adopted and implemented. These include the implementation of 2012 Building Regulations and the public and commercial sector components of the National Retrofit Scheme. In addition, increased penetration of renewables in line with meeting the national RES-H target of 12% is assumed.
Waste
There is one scenario for greenhouse gas emissions from the waste sector. The waste sector includes landfill, waste incineration, open burning of waste, mechanical & biological treatment and wastewater treatment. The scenario

Page 9 of 17
assumes a continued requirement for landfill as a disposal option for residual waste10 as well as commercial waste-to-energy incineration at two sites in Ireland (i.e. Carranstown from 2012 and Poolbeg from 2018). Under this scenario it is also assumed that recycling of waste materials increases by on average 1% per year and that the total municipal solid waste generated increases in line with GNP growth.
It is assumed that the Landfill Directive targets (Directive 1999/31/EC), for the diversion of biodegradable waste from landfill, is met in 2016 following on from Ireland’s achievement of the 2010 and 2013 targets. Achievement of the targets in 2016 is assumed on the basis of measures and initiatives designed to divert biodegradable waste from landfill. These include guidance published by the EPA11 for EPA landfill licence holders in relation to biodegradable waste diversion obligations, increases in the landfill levy and the introduction of the Food Waste Regulations for commercial operations (2009) and households (2013) which require the source separation and collection of food waste for recycling.
For the waste sector, greenhouse gas emissions are projected to decrease by
20% by 2020 on current levels which is primarily attributable to methane emissions from landfill nearly halving by 2020 compared with 2013. This is underpinned by increased recovery (including recycling and energy recovery) of waste materials and adherence to Food Waste Regulations which reduces the organic content of landfilled waste and thus its greenhouse gas production potential.
It is also assumed that methane capture at landfills increases from the current
level of 61% of total methane generated in 2013 to 75% in 2020.
Energy These emissions are not covered by the EU Effort Sharing Decision (Decision No
406/2009/EC), however, the data is given here for information.
Energy sector emissions are mainly from power generation with approximately 3% of these emissions coming from oil refining, peat briquetting and fugitive emissions.
Under the With Measures scenario, total energy sector emissions are projected to increase by 11% over the period 2013 – 2020 to 13 Mt CO2eq12. The increase is driven by increased demand for electricity with coal-fired power generation
10
Residual waste is defined as the fraction of collected waste remaining after a treatment or diversion step which generally requires further treatment or disposal 11 Municipal Solid Waste – Pre-treatment & Residuals Management. An EPA Technical Guidance Document. (2009) 12 This is an increase compared to 2014 projections due to differences in underlying assumptions (e.g. refer to Appendix 1) and methodological changes applied to 2015 projections.

Page 10 of 17
being maintained and gas-fired generation increasing by over 20%. By 2020 22% of electricity generation is projected to come from renewable sources.
Under the With Additional Measures scenario, total energy sector emissions are
projected to decrease by 14% over the period 2013 – 2020 to 10 Mt CO2eq. In this scenario, energy demand is lower than the With Measures scenario as a result of improved energy efficiency and also renewable energy is assumed to reach 40% penetration by 2020. The largest renewable energy contribution comes from wind, which is estimated to be significantly higher than in the With Measures scenario in terms of generation input.

Page 11 of 17
Policy context for greenhouse gas emission reductions beyond 2020 National: Climate Action and Low Carbon Development Bill 2015 The Department of Environment, Community and Local Government published the Climate Action and Low Carbon Development Bill 2015 in January 2015 having secured Government approval for the provisions of the Bill. The Bill sets out the national objective of transitioning to a low carbon, climate resilient and environmentally sustainable economy in the period up to and including the year 2050. The Bill provides for the preparation, and approval by the Government, of five-yearly National Low Carbon Transition and Mitigation Plans (or “National Mitigation Plans”) which will set out how Ireland’s national greenhouse gas emissions are to be reduced, in line with both existing EU legislative requirements and wider international commitments under the United Nations Framework Convention on Climate Change (UNFCCC). In particular, each successive National Mitigation Plan will specify the policy measures that will be required to be adopted by each relevant Minister of the Government to reduce greenhouse gas emissions in their sectors and to enable a whole-of-Government approach towards achieving the national transition objective. European : 2030 framework for climate and energy policies EU leaders agreed a 2030 policy framework in October 2014 that will see a domestic EU greenhouse gas reduction target of at least 40% compared to 1990. To achieve the overall 40% target, the sectors covered by the EU emissions trading system (EU ETS) would have to reduce their emissions by 43% compared to 2005. Emissions from sectors outside the EU ETS would need to be cut by 30% below the 2005 level. This will need to be translated into Member State targets. Renewable energy will play a key role in the transition towards a competitive, secure and sustainable energy system. The Commission proposed an objective of increasing the share of renewable energy to at least 27% of the EU's energy consumption by 2030. The European Council endorsed this target which is binding at EU level. In relation to energy efficiency, the European Commission proposed a 30% energy savings target for 2030, following a review of the Energy Efficiency Directive. The European Council, however, endorsed an indicative target of 27% to be reviewed in 2020 having in mind a 30% target. International: The 2015 international agreement UN negotiations are under way to develop a new international climate change agreement that will cover all countries. It is hoped that the new agreement will be adopted at the Paris climate conference in December 2015 and implemented from 2020.

Page 12 of 17
The climate conferences in Warsaw (2013) and Lima (2014) agreed that all countries are to put forward their proposed emissions reduction targets for the 2015 agreement as "intended nationally determined contributions" well in advance of the Paris conference. The Environment Council approved the EU's intended nationally determined contribution in March 2015 which is to achieve at least 40% domestic reduction in greenhouse gas emissions compared to 1990 levels by 2030. This translates the agreement by EU leaders in October 2014, referred to above, on the EU 2030 climate and energy framework. Projected Greenhouse Gas Emissions to 2035 The main focus of the discussion of greenhouse gas emissions between 2020 and 2035 is on trends in non-ETS sector emissions. Based on current emission projections, it is estimated that by 2035 total non-ETS emissions will be 6%-14% below 2005. The estimates of greenhouse gas emissions to 2035 assume a continuation of the effect of policies and measures that are in place in 2020 – for example, in the transport sector the RES-T 10% ratio is assumed to remain fixed. It is recognised that this is a conservative outlook, however, these figures are published to illustrate how emissions might look into the longer-term in the absence of any additional policies and measures. The trend in emission levels under both the With Measures and the With Additional Measures scenarios are presented for the non-ETS sectors in Figure 4. Figure 4 includes the required target pathway to Irelands 2020 target as a reference. It is evident that post-2020, in the absence of further policies and measures above those envisaged in place by 2020, that Ireland will face extremely challenging emission reduction obligations.
Figure 4. With Measures and With Additional Measures greenhouse gas emissions projections for the non-ETS sectors to 2035
0
5
10
15
20
25
30
35
40
45
50
2013 2014 2015 2016 2017 2018 2019 2020 2021 2022 2023 2024 2025 2026 2027 2028 2029 2030 2031 2032 2033 2034 2035
CO
2eq
, Mto
nn
es
WM non-ETS Emission Projections WAM non-ETS Emission Projections 2020 target path

Page 13 of 17
Transport sector emissions are projected to increase by 20% over the period 2020-2035. This is driven by an increase in the national car fleet to 2.6 million in 2035. This increase is also underpinned by a projected increase in population to 5.3 million by 2035 and a sustained 3% annual average growth in personal consumption over the period. It is assumed that the renewable energy penetration in both the With Measures and With Additional Measures scenario is maintained at 2020 levels in percentage terms supported by the Biofuel Obligation Scheme 20107 as well as some improvements in vehicle standards. It is assumed that no further policies and measures are implemented post-2020. As previously discussed total emissions from the agricultural sector, based on data provided by Teagasc to the EPA, are projected to increase by 2% between 2013 and 2020. This is predominantly driven by a projected increase in dairy cow numbers of 21% between 2013 and 2020, following the abolition of milk quotas in 2015, which is offset by decreasing numbers in the beef herd. For 2035 it is estimated that dairy cow numbers will have increased to 1.6 million head (from 1.36 million in 2020) and that fertiliser nitrogen use will remain relatively stable post-2020 at approximately 380,000 tonnes. The beef herd is forecasted to contract by 20% between 2020 and 2035 from 5.3 million head to 4.2 million head (having already contracted by 7% between 2013 and 2020). As a result, agriculture emissions are projected to peak in 2025 and decline thereafter to 19 Mtonnes of CO2eq in 2035 returning emissions from this sector to 2012 levels. The combined contribution of agriculture and transport sectors to non-ETS sector emissions in 2035 is 80%. The substantial growth in transport emissions between 2020 and 2035 increases the transport sector’s contribution to non-ETS emission total from 29% in 2020 to 35% in 2035 in the With Additional Measures scenario. Projected sectoral shares in 2035 under the With Additional Measures scenario are presented in Figure 5.
Figure 5. Projected sectoral share of non-ETS greenhouse gas emissions in 2035 for the With Additional Measures scenario
Energy - non-CO2, 1%
Agriculture, 45%
Transport, 35%
Industry & Commercial, 7%
Residential, 8% Waste, 1%

Page 14 of 17
Further energy efficiencies and renewables penetration in the residential, industrial and commercial sectors will be required to reduce the contribution to non-ETS sector emissions in 2035. With respect to the ETS sector emissions in period 2020 to 2035, it is assumed that renewables penetration in electricity generation is maintained. However in the With Additional Measures scenario it is assumed that coal fired electricity generation is replaced by gas post-2025. It should be noted, however, that there are consequences of such an assumption in terms of maintaining a diverse fuel mix in electricity generation and security of supply issues in terms of natural gas. Overall it is evident, based on this analysis, that Ireland is not on track towards decarbonising the economy in the long term in line with the Climate Action and Low Carbon Development Bill 2015 and will face steep challenges post-2020 unless further polices and measures are put in place over and above those envisaged between now and 2020.

Page 15 of 17
Appendix I Underlying Assumptions The following are key underlying data underpinning this year’s greenhouse gas emissions projections:
Energy-related emissions projections are based on energy forecasts provided to the EPA by Sustainable Energy Authority of Ireland (SEAI) in December 2014.
The energy forecasts are based on a set of macroeconomic assumptions from the Economic and Social Research Institute (e.g. data from the Quarterly Economic Commentary13 published in Autumn 2014). Therefore these projections incorporate the recent return to growth that was anticipated in Autumn 2014.
Agriculture emissions projections are based on data from Teagasc’s FAPRI-Ireland model which were provided to the EPA in January 2015. The FAPRI-Ireland model is a dynamic, partial equilibrium model which is linked both to the FAPRI-EU and world modelling systems.
A key assumption underpinning the agriculture emissions projections is that the Food Harvest 2020 targets will be met in full. Teagasc provide updated projected activity data to the EPA on a yearly basis. Projected activity data for the agriculture sector differs from year to year due to changing market forces within the industry and the projected effect that these will have on meeting the targets set out in Food Harvest 2020.
Table 1.1 outlines the key macroeconomic assumptions that underpin the current projections. Table 1.1 Key macroeconomic assumptions underlying the projections
2012 – 2015 2016 – 2020 2021-2025 2026-2030 2030-2035 Average Annual % Growth
GDP +2.5% +4.6% +2.6% +1.3% +1.2% GNP +3.8% +3.6% +3.4% +2.9% +1.2% Personal Consumption 0.4% +2.5% +4.4% +3.4% +1.2% Annual Average 2015 2020 2025 2030 2035 Population (‘000) 4,647 4,837 5,010 5,162 5,314 Housing stock (‘000) 1,992 2,062 2,173 2,290 2,412 EUETS: Carbon €2010/tCO2
7 10 14 35 57
Carbon tax €2010/tCO2 20 20 20 35 57 Coal $2010/boe 16.4 20.1 23.7 27.6 31.6
Oil $2010/boe 93.6 98.9 124.3 154.2 188.4
Gas $2010/boe 50.8 49.3 58.7 62.5 62.5
Peat €/MWh 25 25 25 25 25
13 http://www.esri.ie/__uuid/0d17fc57-8726-40ab-b362-d4877cb921a4/index.xml?id=4086

Page 16 of 17
Appendix II Description of emissions scenarios Two emissions projections scenarios are presented which show two potential outlooks to 2035 depending on policy development and implementation. These are called
With Measures With Additional Measures
The With Measures scenario is based primarily on SEAI’s Baseline energy forecast which incorporates the anticipated impact of policies and measures that were in place (and legislatively provided for) by end of 2013.
The With Additional Measures scenario is based on SEAI’s NEEAP/NREAP energy forecast. The NEEAP/NREAP energy forecast builds on the Baseline energy forecast with additional assumptions included to account for Ireland’s NEEAP5 and NREAP6. Therefore this scenario includes existing and planned policies and measures. The key additional measures that are assumed to be achieved in full and are included in the With Additional Measures emission projection are that, by 2020, Ireland will have achieved:
20% improvement in energy efficiency across all sectors 33% energy end-use efficiency savings target for the public sector 40% renewable electricity (RES-E) share 12% renewable heat (RES-H) share 10% renewable transport (RES-T) share
The difference between the With Measures and With Additional Measures scenario shows the impact of additional policies and measures and renewables penetration which are assumed to deliver the NEEAP and NREAP targets. Table 2.1. shows the sectors where the additional measures are assumed to be implemented and the associated savings. Table 2.1. CO2eq savings from additional policies and measures by sector
CO2eq, ktonnes 2015 2020 Energy – (mainly in EU-ETS) 1,360 2,796 Industry 229 766 Services 211 641 Residential 353 850 Transport 104 640 Agriculture - 156 Total 2,259 5,849

Page 17 of 17
Appendix III
Units: 1 Mt = 1,000 kilotonnes = 1,000,000 tonnes CO2eq: total greenhouse gas emissions expressed as CO2 equivalents. The CO2 emission is added to the equivalent emission of methane, nitrous oxide and so-called F-gases which are converted to CO2 equivalents using their global warming potentials. F-gases: These gases comprise the following four gases, HFCs (Hydroflurocarbons), PFCs (Perfluorcarbons), SF6 (Sulphur Hexafluoride) and nitrogen trifluoride (NF3). They have very much higher global warming potentials than the naturally occurring GHGs (carbon dioxide, methane and nitrous oxide).
Table 3.1. Historical and projected emissions by sector (Mt CO2eq per annum) for With Measures and With Additional Measures scenarios
Energy Residential Industry &
Commercial Agriculture Transport Waste
Total
P
roje
cte
d
H
isto
rica
l
1990 11.43 7.52 9.54 20.83 5.14 1.65 56.12 1995 13.55 6.45 9.80 21.09 6.27 1.98 59.14 2000 16.24 6.46 12.68 20.57 10.79 1.75 68.50 2005 15.86 7.27 12.46 20.35 13.12 1.79 70.84 2006 15.10 7.16 12.11 19.91 13.80 1.88 69.97 2007 14.62 6.93 12.30 18.88 14.39 1.44 68.55 2008 14.73 7.52 12.12 18.97 13.66 1.32 68.32 2009 2010 2011 2012 2013
13.14 13.39 11.97 12.74 11.32
7.47 7.80 6.61 6.23 6.40
9.75 9.52 8.84 9.07 9.02
18.96 18.98 18.37 18.92 19.04
12.44 11.53 11.22 10.84 11.07
1.17 1.17 1.28 1.27 1.44
62.92 62.40 58.30 59.07 58.29
With Measures Scenario 2015 13.64 6.15 8.29 18.72 11.86 1.30 59.97 2020 2025 2030 2035
12.58 13.48 14.16 15.42
5.81 5.53 5.28 5.06
8.60 8.90 9.03 9.20
19.49 19.99 19.67 19.08
13.18 14.22 14.97 15.76
1.15 1.06 0.99 0.94
60.70 63.20 64.10 65.46
With Additional Measures Scenario 2015 12.28 5.80 7.85 18.72 11.76 1.30 57.71 2020 2025 2030 2035
9.78 6.80 8.25 9.61
4.96 4.48 3.99 3.50
7.18 7.31 7.26 7.25
19.33 19.84 19.52 18.93
12.54 13.54 14.25 15.01
1.15 1.06 0.99 0.94
54.94 53.02 54.26 55.24
Table 3.2. Historical and projected emissions for the non-ETS and ETS sectors (Mt CO2eq) for With Measures and With Additional Measures scenarios
Non-ETS sector ETS sector Total
Pro
ject
ed
His
tori
cal
2005 48.38 22.29 70.84 2006 48.19 21.70 69.97 2007 47.24 21.24 68.55 2008 47.87 20.38 68.32 2009 2010 2011 2012 2013
45.65 45.01 42.49 42.21 42.61
17.21 17.35 15.79 16.85 15.67
62.92 62.40 58.30 59.07 58.29
With Measures Scenario
2015 42.36 17.61 59.97 2020 43.91 16.88 60.70 2025 45.14 18.04 63.20 2030 2035
45.27 45.28
18.82 20.17
64.10 65.46
With Additional Measures Scenario
2015 2020 2025 2030 2035
41.62 41.40 42.26 41.99 41.55
16.09 13.53 10.75 12.26 13.68
57.71 54.94 53.02 54.26 55.24
Note: Numbers may not sum exactly due to rounding