quarterly mortgage bankers performance report | q1 …
TRANSCRIPT

QUARTERLY MORTGAGE BANKERSPERFORMANCE REPORT | Q1 2018
mba.org/research18930
REVENUE, COST AND VOLUME STATISTICS FOR NON-DEPOSITORY INSTITUTIONS
YOUR FIRM ANALYSIS REPORTSINGLE-USER PRODUCTCopying or other redistribution of any MBA research publication — in whole or in part — violates U.S. copyright law as well as any applicable MBA terms of use. Activities that are not permitted without MBA’s advance permission include photocopying, faxing, excerpting, forwarding electronically and sharing of online access. Multi-user licenses are also available. Contact [email protected] for more information.

© 2018 Mortgage Bankers Association (MBA). All rights reserved, except as explicitly granted. 1919 M Street NW, 5th Floor, Washington, DC 20036 | (202) 557-2700
This data is provided by MBA solely for use as a reference. No part of the survey or data may be reproduced, stored in a retrieval system, transmitted or redistributed in any form or by any means, electronic, mechanical, photocopying, recording or otherwise, without MBA’s prior written consent.
DisclaimerAlthough the MBA takes great care in producing this and all related data products, the MBA does not guarantee that the information is accurate, current or suitable for any particular purpose. The referenced data are provided on an “as is” basis, with no warranties of any kind whatsoever, either express or implied, including, but not limited to, any warranties of title or accuracy or any implied warranties of merchantability or fitness for a particular purpose. Use of the data is at the user’s sole risk. In no event will MBA be liable for any damages whatsoever arising out of or related to the data, including, but not limited to direct, indirect, incidental, special, consequential or punitive damages, whether under a contract, tort or any other theory of liability, even if MBA is aware of the possibility of such damages.
18930

REVENUE, COST AND VOLUME STATISTICS FOR NON-DEPOSITORY INSTITUTIONS
QUARTERLY MORTGAGE PERFORMANCE REPORT Q1 2018YOUR FIRM ANALYSIS REPORT

iv QUARTERLY MORTGAGE BANKERS PERFORMANCE REPORT | Q1 2018 Results from the Mortgage Bankers Association © Mortgage Bankers Association 2018. All rights reserved.
QUARTERLY MORTGAGE BANKERS PERFORMANCE REPORTThe Mortgage Bankers Association (MBA) is pleased to pres-ent the next report in a quarterly series on the revenues and expenses associated with the origination and servicing of one-to-four-unit residential mortgage loans. This report offers a variety of performance metrics on the mortgage banking industry and is intended as a financial and operational bench-mark for independent mortgage companies and subsidiaries of banks, thrifts and non-depository institutions.
In addition to revenue and expense data, the report includes detailed information on production and servicing volume mixes by product type, as well as employee productivity. An overall net income summary and balance sheet profile are also part of the report. Some notes to keep in mind:
• The underlying company data are derived from the Quar-terly Mortgage Bankers Financial Reporting WebMB Form (MBFRF), through a joint agreement with MBA, Fannie Mae, Freddie Mac and Ginnie Mae. Independent mortgage com-panies are required to submit quarterly MBFRF data to the agencies and have the option of releasing their data to MBA for use in aggregate industry statistics.
• MBA produces five MBFRF publications per year: four quarterly reports and one annual summary report. These reports may be purchased as a one-year subscription of all four quarterly publications (the Quarterly Mortgage Bankers Performance Reports), which includes the Annual Mortgage Bankers Performance Report, free of additional charge. Alternatively, the Annual Report may be purchased as a stand-alone product.
• MBA member companies who release MBFRF data to MBA on a quarterly basis are also eligible to receive their indi-vidual company benchmarks in the same format as the quarterly reports at no additional charge. This product, called the “Your Firm Analysis” report, is available exclu-sively to MBA members.
• The reports incorporate both production-only and servic-ing-only companies, as well as companies in both produc-tion and servicing.
• The results (such as cost per loan, servicing revenues in basis points, etc.) are based on simple averages. In other words, companies with more originations or servicing vol-ume are not given more weight in the calculations. All com-panies in the sample are given the same weight so that the results reflect a typical lender.
• The production results are broken out into peer groups based on originations levels, company type and produc-tion channel (retail originations only versus wholesale). This way, retail channel-only companies are able to compare themselves to other retail channel-only companies of simi-lar volume.
MBA follows the general timeline below for the release of the Quarterly Mortgage Bankers Performance Report and Annual Mortgage Bankers Performance Report:
1st Quarter: June | 2nd Quarter: September 3rd Quarter: December | 4th Quarter: April | Annual: June
Michael Fratantoni, Ph.D. Senior Vice President and Chief Economist Mortgage Bankers Association
Marina Walsh Vice President, Industry Analysis | Research and Economics Mortgage Bankers Association
On behalf of MBA, we wish to thank those mortgage banking companies
that released their data to us. Please do not hesitate to contact us at
[email protected] or visit mba.org/research for more information.

QUARTERLY MORTGAGE BANKERS PERFORMANCE REPORT | Q1 2018 Results from the Mortgage Bankers Association v © Mortgage Bankers Association 2018. All rights reserved.
TABLE OF CONTENTSHIGHLIGHTS
A. Select Highlights . . . . . . . . . . . . . . . . . . . . . . . . . . . . . . . . . . . . . . . . . . . . . . . . . 1
RESIDENTIAL LOAN PRODUCTION
B. Residential Loan Production — HistoricalB1 Net Loan Production Income and Expense, $ per loan . . . . . . . . . . . . . . . . . . . . . . . . . . . . . 2B2 Net Loan Production Income and Expense, Basis Points . . . . . . . . . . . . . . . . . . . . . . . . . . . . 3B3 Production Mix ($). . . . . . . . . . . . . . . . . . . . . . . . . . . . . . . . . . . . . . . . . . . . . . . . . . 4B4 Production Mix (#). . . . . . . . . . . . . . . . . . . . . . . . . . . . . . . . . . . . . . . . . . . . . . . . . . 5B5 Production Mix (Avg Loan Balances) . . . . . . . . . . . . . . . . . . . . . . . . . . . . . . . . . . . . . . . 6
C. Residential Loan Production — by Quarterly Production Volume $C1 Net Loan Production Income and Expense, $ per loan . . . . . . . . . . . . . . . . . . . . . . . . . . . . . 7C2 Net Loan Production Income and Expense, Basis Points . . . . . . . . . . . . . . . . . . . . . . . . . . . . 8C3 Production Mix ($). . . . . . . . . . . . . . . . . . . . . . . . . . . . . . . . . . . . . . . . . . . . . . . . . . 9C4 Production Mix (#). . . . . . . . . . . . . . . . . . . . . . . . . . . . . . . . . . . . . . . . . . . . . . . . . 10C5 Production Mix (Avg Loan Balances) . . . . . . . . . . . . . . . . . . . . . . . . . . . . . . . . . . . . . . 11
D. Residential Loan Production — by Retail / Consumer Direct vs Wholesale Production MixD1 Net Loan Production Income and Expense, $ per loan . . . . . . . . . . . . . . . . . . . . . . . . . . . . 12D2 Net Loan Production Income and Expense, Basis Points . . . . . . . . . . . . . . . . . . . . . . . . . . . . 13D3 Production Mix ($). . . . . . . . . . . . . . . . . . . . . . . . . . . . . . . . . . . . . . . . . . . . . . . . . .14D4 Production Mix (#). . . . . . . . . . . . . . . . . . . . . . . . . . . . . . . . . . . . . . . . . . . . . . . . . 15D5 Production Mix (Avg Loan Balances) . . . . . . . . . . . . . . . . . . . . . . . . . . . . . . . . . . . . . . 16
E. Residential Loan Production — Historical Retail / Consumer Direct Production Only CompaniesE1 Net Loan Production Income and Expense, $ per loan . . . . . . . . . . . . . . . . . . . . . . . . . . . . . 17E2 Net Loan Production Income and Expense, Basis Points . . . . . . . . . . . . . . . . . . . . . . . . . . . .18E3 Production Mix ($). . . . . . . . . . . . . . . . . . . . . . . . . . . . . . . . . . . . . . . . . . . . . . . . . .19E4 Production Mix (#) . . . . . . . . . . . . . . . . . . . . . . . . . . . . . . . . . . . . . . . . . . . . . . . . 20E5 Production Mix (Avg Loan Balances) . . . . . . . . . . . . . . . . . . . . . . . . . . . . . . . . . . . . . . .21
F. Residential Loan Production — Retail / Consumer Direct Production Only Companies by Production $F1 Net Loan Production Income and Expense, $ per loan . . . . . . . . . . . . . . . . . . . . . . . . . . . . 22F2 Net Loan Production Income and Expense, Basis Points . . . . . . . . . . . . . . . . . . . . . . . . . . . 23F3 Production Mix ($). . . . . . . . . . . . . . . . . . . . . . . . . . . . . . . . . . . . . . . . . . . . . . . . . 24F4 Production Mix (#). . . . . . . . . . . . . . . . . . . . . . . . . . . . . . . . . . . . . . . . . . . . . . . . . 25F5 Production Mix (Avg Loan Balances) . . . . . . . . . . . . . . . . . . . . . . . . . . . . . . . . . . . . . . 26
G. Residential Loan Production — by Company TypeG1 Net Loan Production Income and Expense, $ per loan . . . . . . . . . . . . . . . . . . . . . . . . . . . . 27G2 Net Loan Production Income and Expense, Basis Points . . . . . . . . . . . . . . . . . . . . . . . . . . . 28G3 Production Mix ($). . . . . . . . . . . . . . . . . . . . . . . . . . . . . . . . . . . . . . . . . . . . . . . . . 29G4 Production Mix (#). . . . . . . . . . . . . . . . . . . . . . . . . . . . . . . . . . . . . . . . . . . . . . . . . 30G5 Production Mix (Avg Loan Balances) . . . . . . . . . . . . . . . . . . . . . . . . . . . . . . . . . . . . . . 31
H. Residential Loan Production — by Average Loan BalanceH1 Net Loan Production Income and Expense, $ per loan . . . . . . . . . . . . . . . . . . . . . . . . . . . . 32H2 Net Loan Production Income and Expense, Basis Points . . . . . . . . . . . . . . . . . . . . . . . . . . . 33H3 Production Mix ($). . . . . . . . . . . . . . . . . . . . . . . . . . . . . . . . . . . . . . . . . . . . . . . . . 34H4 Production Mix (#). . . . . . . . . . . . . . . . . . . . . . . . . . . . . . . . . . . . . . . . . . . . . . . . . 35H5 Production Mix (Avg Loan Balances) . . . . . . . . . . . . . . . . . . . . . . . . . . . . . . . . . . . . . . 36

vi QUARTERLY MORTGAGE BANKERS PERFORMANCE REPORT | Q1 2018 Results from the Mortgage Bankers Association © Mortgage Bankers Association 2018. All rights reserved.
TABLE OF CONTENTS (Continued)RESIDENTIAL LOAN PRODUCTION (Continued)
I. Residential Loan Production — Independent Mortgage Companies by Production $I1 Net Loan Production Income and Expense, $ per loan . . . . . . . . . . . . . . . . . . . . . . . . . . . . 37I2 Net Loan Production Income and Expense, Basis Points . . . . . . . . . . . . . . . . . . . . . . . . . . . 38I3 Production Mix ($). . . . . . . . . . . . . . . . . . . . . . . . . . . . . . . . . . . . . . . . . . . . . . . . . 39I4 Production Mix (#). . . . . . . . . . . . . . . . . . . . . . . . . . . . . . . . . . . . . . . . . . . . . . . . . 40I5 Production Mix (Avg Loan Balances) . . . . . . . . . . . . . . . . . . . . . . . . . . . . . . . . . . . . . . 41
J. Residential Loan Production — Independent Mortgage Companies, Retail Only by Production $J1 Net Loan Production Income and Expense, $ per loan . . . . . . . . . . . . . . . . . . . . . . . . . . . . 42J2 Net Loan Production Income and Expense, Basis Points . . . . . . . . . . . . . . . . . . . . . . . . . . . 43J3 Production Mix ($). . . . . . . . . . . . . . . . . . . . . . . . . . . . . . . . . . . . . . . . . . . . . . . . . 44J4 Production Mix (#). . . . . . . . . . . . . . . . . . . . . . . . . . . . . . . . . . . . . . . . . . . . . . . . . 45J5 Production Mix (Avg Loan Balances) . . . . . . . . . . . . . . . . . . . . . . . . . . . . . . . . . . . . . . 46
K. Residential Loan Production — by Government Production Percent in $K1 Net Loan Production Income and Expense, $ per loan . . . . . . . . . . . . . . . . . . . . . . . . . . . . 47K2 Net Loan Production Income and Expense, Basis Points . . . . . . . . . . . . . . . . . . . . . . . . . . . 48K3 Production Mix ($). . . . . . . . . . . . . . . . . . . . . . . . . . . . . . . . . . . . . . . . . . . . . . . . . 49K4 Production Mix (#). . . . . . . . . . . . . . . . . . . . . . . . . . . . . . . . . . . . . . . . . . . . . . . . . 50K5 Production Mix (Avg Loan Balances) . . . . . . . . . . . . . . . . . . . . . . . . . . . . . . . . . . . . . . 51
RESIDENTIAL LOAN SERVICING
L. Residential Loan Servicing — HistoricalL1 Servicing Income and Expense, $ per loan . . . . . . . . . . . . . . . . . . . . . . . . . . . . . . . . . . . 52L2 Servicing Income and Expense, Basis Points . . . . . . . . . . . . . . . . . . . . . . . . . . . . . . . . . . 53L3 Servicing Mix ($). . . . . . . . . . . . . . . . . . . . . . . . . . . . . . . . . . . . . . . . . . . . . . . . . . 54L4 Servicing Mix (#). . . . . . . . . . . . . . . . . . . . . . . . . . . . . . . . . . . . . . . . . . . . . . . . . . 55L5 Servicing Mix (Avg Loan Balances) . . . . . . . . . . . . . . . . . . . . . . . . . . . . . . . . . . . . . . . 56
M. Residential Loan Servicing — by Servicing Volume #M1 Servicing Income and Expense, $ per loan . . . . . . . . . . . . . . . . . . . . . . . . . . . . . . . . . . . 57M2 Servicing Income and Expense, Basis Points . . . . . . . . . . . . . . . . . . . . . . . . . . . . . . . . . . 58M3 Servicing Mix ($). . . . . . . . . . . . . . . . . . . . . . . . . . . . . . . . . . . . . . . . . . . . . . . . . . 59M4 Servicing Mix (#). . . . . . . . . . . . . . . . . . . . . . . . . . . . . . . . . . . . . . . . . . . . . . . . . . 60M5 Servicing Mix (Avg Loan Balances) . . . . . . . . . . . . . . . . . . . . . . . . . . . . . . . . . . . . . . . 61
N. Residential Loan Servicing — In-House vs. Subserviced by OthersN1 Servicing Income and Expenses, $ per loan . . . . . . . . . . . . . . . . . . . . . . . . . . . . . . . . . . 62N2 Servicing Income and Expenses, Basis Points . . . . . . . . . . . . . . . . . . . . . . . . . . . . . . . . . 63N3 Servicing Mix ($). . . . . . . . . . . . . . . . . . . . . . . . . . . . . . . . . . . . . . . . . . . . . . . . . . 64N4 Servicing Mix (#). . . . . . . . . . . . . . . . . . . . . . . . . . . . . . . . . . . . . . . . . . . . . . . . . . 65N5 Servicing Mix (Avg Loan Balances) . . . . . . . . . . . . . . . . . . . . . . . . . . . . . . . . . . . . . . . 66
O. Residential Loan Servicing — by Company TypeO1 Servicing Income and Expense, $ per loan . . . . . . . . . . . . . . . . . . . . . . . . . . . . . . . . . . . 67O2 Servicing Income and Expense, Basis Points . . . . . . . . . . . . . . . . . . . . . . . . . . . . . . . . . . 68O3 Servicing Mix ($). . . . . . . . . . . . . . . . . . . . . . . . . . . . . . . . . . . . . . . . . . . . . . . . . . 69O4 Servicing Mix (#). . . . . . . . . . . . . . . . . . . . . . . . . . . . . . . . . . . . . . . . . . . . . . . . . . 70O5 Servicing Mix (Avg Loan Balances) . . . . . . . . . . . . . . . . . . . . . . . . . . . . . . . . . . . . . . . 71

QUARTERLY MORTGAGE BANKERS PERFORMANCE REPORT | Q1 2018 Results from the Mortgage Bankers Association vii © Mortgage Bankers Association 2018. All rights reserved.
TABLE OF CONTENTS (Continued)P. Residential Loan Servicing — by Government Servicing Percent in CountP1 Servicing Income and Expense, $ per loan . . . . . . . . . . . . . . . . . . . . . . . . . . . . . . . . . . . 72P2 Servicing Income and Expense, Basis Points . . . . . . . . . . . . . . . . . . . . . . . . . . . . . . . . . . 73P3 Servicing Mix ($). . . . . . . . . . . . . . . . . . . . . . . . . . . . . . . . . . . . . . . . . . . . . . . . . . 74P4 Servicing Mix (#). . . . . . . . . . . . . . . . . . . . . . . . . . . . . . . . . . . . . . . . . . . . . . . . . . 75P5 Servicing Mix (Avg Loan Balances) . . . . . . . . . . . . . . . . . . . . . . . . . . . . . . . . . . . . . . . 76
BALANCE SHEET AND NET INCOME SUMMARY, ALL FIRMS
Q. Balance Sheet, Performance Ratios and Net Income Summary — HistoricalQ1 Balance Sheet, Simple Averages . . . . . . . . . . . . . . . . . . . . . . . . . . . . . . . . . . . . . . . . . 77Q2 Performance Ratios . . . . . . . . . . . . . . . . . . . . . . . . . . . . . . . . . . . . . . . . . . . . . . . . 78Q3 Net Income Summary, in $000s . . . . . . . . . . . . . . . . . . . . . . . . . . . . . . . . . . . . . . . . . 79
R. Balance Sheet, Performance Ratios and Net Income Summary — by Asset SizeR1 Balance Sheet, Simple Averages . . . . . . . . . . . . . . . . . . . . . . . . . . . . . . . . . . . . . . . . . 80R2 Performance Ratios . . . . . . . . . . . . . . . . . . . . . . . . . . . . . . . . . . . . . . . . . . . . . . . . 81R3 Net Income Summary, in $000s . . . . . . . . . . . . . . . . . . . . . . . . . . . . . . . . . . . . . . . . . 82
S. Balance Sheet, Performance Ratios and Net Income Summary — by Company TypeS1 Balance Sheet, Simple Averages . . . . . . . . . . . . . . . . . . . . . . . . . . . . . . . . . . . . . . . . . 83S2 Performance Ratios . . . . . . . . . . . . . . . . . . . . . . . . . . . . . . . . . . . . . . . . . . . . . . . . 84S3 Net Income Summary, in $000s . . . . . . . . . . . . . . . . . . . . . . . . . . . . . . . . . . . . . . . . . 85
T. Capital and Liquidity ProfileT1 Capital and Liquidity Profile . . . . . . . . . . . . . . . . . . . . . . . . . . . . . . . . . . . . . . . . . . . 86

% Institutions with Pre‐Tax Net Income > 0
Net Production Income ($ per loan)
Net Production Income (bps)
88% 92%86%
72% 73%
90% 94%
73%67%
86%77%
56% 60%
0%
20%
40%
60%
80%
100%
1,447 1,5221,238
493825
1,686 1,773
575
224
1,122 929
237‐118
37
‐1,500
‐1,000
‐500
0
500
1,000
1,500
2,000
2,500
60 67 5522 33
73 74
2410
46 409
‐8
2
‐100
‐80
‐60
‐40
‐20
0
20
40
60
80
100
120
140
QUARTERLY MORTGAGE BANKERS PERFORMANCE REPORT | Q1 2018 Results from the Mortgage Bankers Association© Mortgage Bankers Association 2018. All rights reserved.

Revenue and Expenses (bps)
Cost per Loan
Median Productivity ‐ Retail Only Companies
372 368 362 362377 372 365
347
395377 375
362 370 377
311 301 306
340 344
300 292 323
385
331 335 353
377 375
0
100
200
300
400
500
Revenues (bps) Expenses (bps)
$7,195 $6,984 $7,080$7,747 $7,845
$7,120 $6,969$7,562
$8,887$7,774 $8,060 $8,475 $8,957 $9,253
0
2,000
4,000
6,000
8,000
10,000
12,000
3.85
4.994.52
4.043.70
5.465.85
4.90
3.32
4.42 4.15 3.89
3.00
0.00
5.09
5.83 5.33
4.39 3.93
5.22 5.62
4.99
3.64
4.78 4.63 4.46
3.62
‐
0
2
4
6
8
10
12
Closings per Sales Employee per Mo.
Closings per Fulfillment Employee per Mo.
QUARTERLY MORTGAGE BANKERS PERFORMANCE REPORT | Q1 2018 Results from the Mortgage Bankers Association© Mortgage Bankers Association 2018. All rights reserved.

QUARTER 1, 2018
Quarterly Mortgage Bankers Performance ReportA ‐ Highlights
Your Firm All Firms Previous Qtr. Previous Yr. Repeater Repeater YTDQ1 2018 Q1 2018 Q4 2017 Q1 2017 Q1 2018 Q4 2017 2018
Company Analysis (All Business Channels)Number of Companies Reporting 1 346 332 333 308 308 346 Pre‐Tax Net Income/Equity (%) 0.74 0.61 (2.00) 6.47 0.41 0.66 0.61 % Institutions with Pre‐tax Net Income>0 ‐ 60.12 56.33 66.97 59.74 58.44 60.12
Residential Production BusinessNumber of Companies Reporting 1 343 329 342 300 300 343 Quarterly Originations Volume:Avg. Total Loans Originated ($000s) 282,962 449,801 505,476 454,520 440,136 522,702 449,801 Avg. Total Loans Originated (#) 1,174 1,866 2,059 1,944 1,813 2,161 1,866 Average Loan Balance ($) 240,605 244,722 249,617 238,343 245,807 244,929 244,722
Net Financial Income (in Basis Points):Origination‐Related Income 46.74 75.84 69.30 69.38 78.59 69.29 75.84 Net Interest Income 0.75 1.56 1.86 3.30 1.22 1.72 1.56 Net Secondary Marketing Income 357.24 292.28 290.83 322.25 299.28 291.32 292.28 Loan Production Expense 374.86 377.44 352.69 384.50 382.98 351.99 377.44 Total Net Production Income 1.94 (7.76) 9.29 10.42 (3.89) 10.33 (7.76)
Closings per Total Prod. Employee per Mo. 1.35 1.92 2.01 1.74 1.68 2.00 1.92
Residential Loan ServicingNumber of Companies 1 208 192 198 166 166 208 Average Servicing Volume:Average Servicing Portfolio ($000) 1,215,845 14,262,892 15,697,921 12,758,179 16,642,720 16,110,395 14,262,892 Average Servicing Portfolio (#) 6,867 82,848 93,603 76,256 96,992 94,760 82,848 Average Loan Balance ($) 177,030 189,446 188,318 189,926 188,252 187,833 189,446
Net Servicing Income ($ per loan):Net Servicing Operating Income 385 225 197 258 236 198 225 Total Net Servicing Financial Income 198 320 33 225 330 28 320
Average Loans Serviced per FTE (Simple) 1,754 1,118 1,053 1,423 1,084 1,032 1,118
QUARTERLY MORTGAGE BANKERS PERFORMANCE REPORT | Q1 2018 Results from the Mortgage Bankers Association© Mortgage Bankers Association 2018. All rights reserved. 1

QUARTER 1, 2018
Quarterly Mortgage Bankers Performance ReportResidential Loan Production ‐ HistoricalB1 ‐ Net Loan Production Income and Expense, $ per loan, Simple Average
Your Firm All Firms Previous Qtr. Previous Yr. Repeater Repeater YTD$ PER LOAN Q1 2018 Q1 2018 Q4 2017 Q1 2017 Q1 2018 Q4 2017 2018
ORIGINATION‐RELATED INCOMELoan Origination Fees 91 1,161 1,051 1,006 1,178 1,042 1,161 Correspondent and Broker Fee Income (1) 96 96 122 103 79 96 Other Origination‐Related Income (2) 1,202 495 478 437 505 460 495 Total Origination‐Related Income 1,293 1,752 1,624 1,566 1,786 1,582 1,752
NET INTEREST INCOMEWarehousing Income 645 510 509 479 519 507 510 Warehousing Expense 659 462 458 402 479 457 462
Net Interest Income (14) 47 51 77 40 50 47
SECONDARY MARKETING INCOMESecondary Mktg Gains (Losses) 7,614 4,551 4,633 5,055 4,656 4,572 4,551 Capitalized Servicing/Svg Released Premiums 397 2,532 2,450 2,458 2,606 2,443 2,532 Repurchase Reserve Provision ‐ (43) (45) (43) (43) (47) (43)
Net Secondary Marketing Income 8,011 7,040 7,037 7,469 7,219 6,968 7,040
Total Loan Production Revenue 9,290 8,840 8,712 9,111 9,045 8,599 8,840
EXPENSESPersonnel 4,920 5,899 5,560 5,802 5,993 5,486 5,899 Sales Personnel 2,382 2,469 2,560 2,401 2,542 2,537 2,469 Fulfillment Personnel 1,220 1,414 1,328 1,432 1,457 1,295 1,414 Production Support Employees 246 685 587 664 680 576 685 Management and Directors 216 476 489 470 456 476 476 Benefits 856 855 596 836 857 602 855
Occupancy and Equipment 587 539 462 519 548 460 539 Technology‐Related Expenses 241 219 195 192 226 195 219 Other Direct Expenses 2,949 1,753 1,717 1,784 1,734 1,645 1,753 Outsourcing and Professional fees 874 333 282 322 330 276 333 Other Operating Expenses 2,075 1,419 1,435 1,462 1,404 1,369 1,419
Direct Loan Production Expenses 8,697 8,409 7,934 8,297 8,501 7,785 8,409
Corporate Allocation 542 548 541 590 588 537 548
Total Loan Production Expense 9,253 8,957 8,475 8,887 9,089 8,322 8,957
TOTAL NET PRODUCTION INCOME 37 (118) 237 224 (44) 277 (118)
MEMO ITEMSOriginations Volume:Avg. Total Loans Originated ($000s) 282,962 449,801 505,476 454,520 440,136 522,702 449,801 Avg. Total Loans Originated (#) 1,174 1,866 2,059 1,944 1,813 2,161 1,866 Average Loan Balance ($) 240,605 244,722 249,617 238,343 245,807 244,929 244,722 Avg. Pull‐Through (Closings/Applications #) 48.29 69.88 76.23 69.80 70.38 76.50 69.88
Average Days in Warehouse 19 16 17 17 16 17 16
Employees:Total Production FTEs (excluding 0 reporters) 287 380 363 371 369 381 380
ProductivitySimple Avg.Closings per Sales Employee per Mo. 3.2 4.9 5.8 5.0 4.8 5.9 4.9Closings per Fulfillment Employee per Mo. 3.4 5.2 6.9 5.0 5.0 6.2 5.2Closings per Prod Support Employee per Mo. 14.3 12.9 15.4 12.7 12.6 15.8 12.9Closings per Total Prod. Employee per Mo. 1.2 1.9 2.0 1.7 1.7 2.0 1.9
Weighted Avg.Closings per Sales Employee per Mo. 3.1 3.7 4.5 4.3 3.7 4.5 3.7Closings per Fulfillment Employee per Mo. 3.3 4.3 5.1 4.3 4.3 5.1 4.3Closings per Prod Support Employee per Mo. 14.3 10.0 10.4 9.3 9.8 10.5 10.0Closings per Total Prod. Employee per Mo. 1.5 1.6 1.9 1.8 1.6 1.9 1.6
MedianClosings per Sales Employee per Mo. 3.2 3.2 3.9 3.4 3.2 4.0 3.2Closings per Fulfillment Employee per Mo. 3.4 3.7 4.6 3.8 3.7 4.6 3.7Closings per Prod Support Employee per Mo. 14.4 8.9 10.7 8.6 8.8 10.9 8.9Closings per Total Prod. Employee per Mo. 1.2 1.4 1.6 1.4 1.4 1.7 1.4
Number of Companies Reporting 1 343 329 342 300 300 343
(1) Correspondent and Broker Income: Fee income earned on loans acquired from correspondents and brokers(2) Other Originations Income: Underwriting, processing, administration and other fees
QUARTERLY MORTGAGE BANKERS PERFORMANCE REPORT | Q1 2018 Results from the Mortgage Bankers Association© Mortgage Bankers Association 2018. All rights reserved. 2

QUARTER 1, 2018
Quarterly Mortgage Bankers Performance ReportResidential Loan Production ‐ HistoricalB2 ‐ Net Loan Production Income and Expense, Basis Points, Simple Average
Your Firm All Firms Previous Qtr. Previous Yr. Repeater Repeater YTDBASIS POINTS Q1 2018 Q1 2018 Q4 2017 Q1 2017 Q1 2018 Q4 2017 2018
ORIGINATION‐RELATED INCOMELoan Origination Fees 3.81 50.70 45.28 45.04 52.64 46.40 50.70 Correspondent and Broker Fee Income (1) 4.80 4.69 6.02 5.15 3.79 4.80 Other Origination‐Related Income (2) 41.69 20.35 19.33 18.32 20.81 19.10 20.35 Total Origination‐Related Income 45.50 75.84 69.30 69.38 78.59 69.29 75.84
NET INTEREST INCOMEWarehousing Income 26.07 20.66 20.43 20.32 20.84 20.55 20.66 Warehousing Expense 25.49 19.10 18.58 17.02 19.62 18.83 19.10
Net Interest Income 0.58 1.56 1.86 3.30 1.22 1.72 1.56
SECONDARY MARKETING INCOMESecondary Mktg Gains (Losses) 311.94 188.78 192.99 219.11 193.24 192.45 188.78 Capitalized Servicing/Svg Released Premiums 18.68 105.21 99.65 104.99 107.73 100.77 105.21 Repurchase Reserve Provision ‐ (1.71) (1.81) (1.85) (1.69) (1.90) (1.71)
Net Secondary Marketing Income 330.62 292.28 290.83 322.25 299.28 291.32 292.28
Total Loan Production Revenue 376.70 369.68 361.98 394.93 379.09 362.32 369.68
EXPENSESPersonnel 199.83 247.92 231.05 251.01 251.61 231.66 247.92 Sales Personnel 98.09 101.88 104.33 102.18 105.15 105.76 101.88 Fulfillment Personnel 49.93 60.25 56.28 63.15 61.90 55.29 60.25 Production Support Employees 9.60 29.09 24.40 28.53 28.86 24.23 29.09 Management and Directors 7.80 20.00 20.71 20.58 19.25 20.46 20.00 Benefits 34.41 36.70 25.33 36.57 36.45 25.93 36.70
Occupancy and Equipment 23.49 22.54 19.30 22.48 23.01 19.51 22.54 Technology‐Related Expenses 8.97 9.59 8.27 8.43 9.94 8.42 9.59 Other Direct Expenses 120.74 74.36 71.99 77.54 73.83 69.97 74.36 Outsourcing and Professional fees 35.26 13.95 11.55 13.87 13.75 11.61 13.95 Other Operating Expenses 85.48 60.40 60.44 63.67 60.08 58.36 60.40
Direct Loan Production Expenses 353.03 354.40 330.60 359.46 358.39 329.56 354.40
Corporate Allocation 21.73 23.04 22.09 25.05 24.59 22.43 23.04
Total Loan Production Expense 374.76 377.44 352.69 384.50 382.98 351.99 377.44
TOTAL NET PRODUCTION INCOME 1.94 (7.76) 9.29 10.42 (3.89) 10.33 (7.76)
MEMO ITEMSOriginations Volume:Avg. Total Loans Originated ($000s) 282,960 449,801 505,476 454,520 440,136 522,702 449,801 Avg. Total Loans Originated (#) 1,175 1,866 2,059 1,944 1,813 2,161 1,866 Average Loan Balance ($) 240,612 244,722 249,617 238,343 245,807 244,929 244,722 Avg. Pull‐Through (Closings/Applications #) 48.29 69.88 76.23 69.80 70.38 76.50 69.88
Average Days in Warehouse 19 16 17 17 16 17 16
Employees:Total Production FTEs (excluding 0 reporters) 289 380 363 371 369 381 380
ProductivitySimple Avg.Closings per Sales Employee per Mo. 3.2 4.9 5.8 5.0 4.8 5.9 4.9Closings per Fulfillment Employee per Mo. 3.4 5.2 6.9 5.0 5.0 6.2 5.2Closings per Prod Support Employee per Mo. 14.4 12.9 15.4 12.7 12.6 15.8 12.9Closings per Total Prod. Employee per Mo. 1.3 1.9 2.0 1.7 1.7 2.0 1.9
Weighted Avg.Closings per Sales Employee per Mo. 3.2 3.7 4.5 4.3 3.7 4.5 3.7Closings per Fulfillment Employee per Mo. 3.4 4.3 5.1 4.3 4.3 5.1 4.3Closings per Prod Support Employee per Mo. 14.4 10.0 10.4 9.3 9.8 10.5 10.0Closings per Total Prod. Employee per Mo. 1.3 1.6 1.9 1.8 1.6 1.9 1.6
MedianClosings per Sales Employee per Mo. 3.2 3.2 3.9 3.4 3.2 4.0 3.2Closings per Fulfillment Employee per Mo. 3.4 3.7 4.6 3.8 3.7 4.6 3.7Closings per Prod Support Employee per Mo. 14.4 8.9 10.7 8.6 8.8 10.9 8.9Closings per Total Prod. Employee per Mo. 1.3 1.4 1.6 1.4 1.4 1.7 1.4
Number of Companies Reporting 1 343 329 342 300 300 343
(1) Correspondent and Broker Income: Fee income earned on loans acquired from correspondents and brokers(2) Other Originations Income: Underwriting, processing, administration and other fees
QUARTERLY MORTGAGE BANKERS PERFORMANCE REPORT | Q1 2018 Results from the Mortgage Bankers Association© Mortgage Bankers Association 2018. All rights reserved. 3

QUARTER 1, 2018
Quarterly Mortgage Bankers Performance ReportResidential Loan Production ‐ HistoricalB3 ‐ Production Mix ($), Simple Average
Your Firm All Firms Previous Qtr. Previous Yr. Repeater Repeater YTDPERCENT BASED ON $ Q1 2018 Q1 2018 Q4 2017 Q1 2017 Q1 2018 Q4 2017 2018Avg. Total Loans Originated ($000s) 282,960 449,801 505,476 454,520 440,136 522,702 449,801 Avg. Total Loans Originated (#) 1,175 1,866 2,059 1,944 1,813 2,161 1,866Average Loan Balance 240,612 244,722 249,617 238,343 245,807 244,929 244,722
Production Mix by Product TypeFirst Mortgages: 99.63 99.26 98.93 99.07 99.33 98.96 99.26Government (FHA/VA/RHS) ‐ Fixed 40.10 32.67 32.30 35.27 32.26 32.88 32.67Government (FHA/VA/RHS) ‐ ARM 0.23 0.76 0.66 0.62 0.83 0.72 0.76Prime (Conforming) ‐ Fixed 57.23 56.97 56.09 53.11 57.29 55.83 56.97Prime (Conforming) ‐ ARM 0.36 1.54 1.55 2.26 1.57 1.46 1.54Prime (Non‐Conforming Jumbo) ‐ Fixed 1.45 4.22 5.00 4.46 4.41 4.94 4.22Prime (Non‐Conforming Jumbo) ‐ ARM 0.25 1.58 2.10 2.20 1.66 1.83 1.58Other Fixed 1.02 0.76 0.76 0.80 0.81 1.02Other ARM 0.50 0.47 0.40 0.50 0.50 0.50
Closed‐End Second Mortgages 0.13 0.12 0.13 0.11 0.12 0.13Funded HELOCs 0.08 0.10 0.16 0.09 0.10 0.08Reverse 0.37 0.39 0.83 0.60 0.43 0.80 0.39Other 0.14 0.02 0.04 0.04 0.03 0.14
Total 100.00 100.00 100.00 100.00 100.00 100.00 100.00
1st Mtg Fixed Rate vs ARMFixed Rate 99.12 95.60 95.19 94.47 95.42 95.46 95.60ARM 0.88 4.40 4.81 5.53 4.58 4.54 4.40
Total 100.00 100.00 100.00 100.00 100.00 100.00 100.00
1st Mtg Jumbo vs. Non‐JumboJumbo 1.74 8.33 8.74 8.49 8.80 8.53 8.33Non‐Jumbo 98.26 91.67 91.26 91.51 91.20 91.47 91.67
Total 100.00 100.00 100.00 100.00 100.00 100.00 100.00
1st Mtg Production Channel MixRetail/Direct Marketing 33.14 84.37 85.15 83.77 85.06 85.56 84.37Wholesale/Broker and Correspondent 66.86 15.63 14.85 16.23 14.94 14.44 15.63
Total 100.00 100.00 100.00 100.00 100.00 100.00 100.00
1st Mtg Purchase vs RefiPurchase 62.90 71.20 70.80 67.84 72.15 71.77 71.20Refinancing 37.10 28.80 29.20 32.16 27.85 28.23 28.80
Rate‐Term 15.89 12.17 12.61 15.12 11.66 12.21 12.17Cash‐Out 21.21 15.82 15.68 16.01 15.47 15.08 15.82Other / Unknown 0.81 0.90 1.03 0.72 0.94 0.81
Total 100.00 100.00 100.00 100.00 100.00 100.00 100.001st Mtg FICO Score DistributionEquals 600 or less 2.62 1.63 1.59 1.43 1.67 1.65 1.63Greater than 600, less than or equal to 650 14.45 10.35 10.22 10.20 10.32 10.31 10.35Greater than 650, less than or equal to 700 25.25 21.51 21.55 22.21 21.24 21.63 21.51Greater than 700, less than or equal to 750 24.80 26.94 26.45 26.94 27.03 26.34 26.94Greater than 750 32.88 39.56 40.18 39.22 39.75 40.06 39.56
Total 100.00 100.00 100.00 100.00 100.00 100.00 100.00
1st Mtg Simple Average FICO (based on #) 705 722 722 721 723 722 722
1st Mtg LTV DistributionEquals 60% of less 10.86 9.36 9.44 10.31 9.31 8.96 9.36Greater than 60%, less than or equal to 70% 9.15 7.90 8.07 8.30 7.94 7.85 7.90Greater than 70%, less than or equal to 80% 28.70 27.03 28.28 27.18 27.19 28.26 27.03Greater than 80%, less than or equal to 90% 10.27 13.41 13.16 13.27 13.31 13.12 13.41Greater than 90%, less than or equal to 100% 38.62 39.90 38.63 39.09 39.83 39.40 39.90Greater than 100% 2.40 2.39 2.43 1.85 2.42 2.41 2.39
Total 100.00 100.00 100.00 100.00 100.00 100.00 100.00
1st Mtg Average LTV (based on $) 82.69 82.26 81.74 81.74 82.20 82.02 82.26
1st Mtg Production Sold by Investor TypeOriginated for Portfolio 0.14 0.08 0.05 0.16 0.08 0.14Originated for Sale to Others: 100.00 99.86 99.92 99.95 99.84 99.92 99.86Sale to Fannie/Freddie/Ginnie 18.58 33.85 33.97 38.03 32.55 33.76 33.85All Other Sale to Others 81.42 66.00 65.95 61.92 67.29 66.15 66.00
Total 100.00 100.00 100.00 100.00 100.00 100.00 100.001st Mtg Servicing Released vs RetainedServicing Released 81.42 77.38 76.31 74.48 77.42 75.61 77.38Servicing Retained 18.58 22.62 23.69 25.52 22.58 24.39 22.62
Total 100.00 100.00 100.00 100.00 100.00 100.00 100.00
Number of Companies Reporting 1 343 329 342 300 300 343
QUARTERLY MORTGAGE BANKERS PERFORMANCE REPORT | Q1 2018 Results from the Mortgage Bankers Association© Mortgage Bankers Association 2018. All rights reserved. 4

QUARTER 1, 2018
Quarterly Mortgage Bankers Performance ReportResidential Loan Production ‐ HistoricalB4 ‐ Production Mix (#), Simple Average
Your Firm All Firms Previous Qtr. Previous Yr. Repeater Repeater YTDPERCENT BASED ON # Q1 2018 Q1 2018 Q4 2017 Q1 2017 Q1 2018 Q4 2017 2018Avg. Total Loans Originated ($000s) 282,960 449,801 505,476 454,520 440,136 522,702 449,801 Avg. Total Loans Originated (#) 1,175 1,866 2,059 1,944 1,813 2,161 1,866Average Loan Balance 240,612 244,722 249,617 238,343 245,807 244,929 244,722Production Mix by Product TypeFirst Mortgages: 99.51 97.61 97.31 97.45 97.80 97.33 97.61Government (FHA/VA/RHS) ‐ Fixed 44.97 34.13 33.77 36.77 33.86 34.34 34.13Government (FHA/VA/RHS) ‐ ARM 0.16 0.71 0.58 0.57 0.79 0.63 0.71Prime (Conforming) ‐ Fixed 53.56 57.66 57.42 54.47 58.14 57.01 57.66Prime (Conforming) ‐ ARM 0.25 1.31 1.31 1.78 1.36 1.25 1.31Prime (Non‐Conforming Jumbo) ‐ Fixed 0.50 1.86 2.30 1.96 1.96 2.24 1.86Prime (Non‐Conforming Jumbo) ‐ ARM 0.08 0.58 0.87 0.90 0.62 0.73 0.58Other Fixed 0.96 0.68 0.68 0.70 0.73 0.96Other ARM 0.38 0.37 0.31 0.37 0.39 0.38
Closed‐End Second Mortgages 1.49 1.39 1.30 1.34 1.44 1.49Funded HELOCs 0.19 0.22 0.40 0.21 0.22 0.19Reverse 0.49 0.50 1.01 0.75 0.56 0.93 0.50Other 0.21 0.07 0.11 0.09 0.08 0.21
Total 100.00 100.00 100.00 100.00 100.00 100.00 100.00
1st Mtg Fixed Rate vs ARMFixed Rate 99.48 96.97 96.80 96.35 96.82 96.94 96.97ARM 0.52 3.03 3.20 3.65 3.18 3.06 3.03
Total 100.00 100.00 100.00 100.00 100.00 100.00 100.00
1st Mtg Jumbo vs. Non‐JumboJumbo 0.59 4.55 4.33 4.35 4.91 4.22 4.55Non‐Jumbo 99.41 95.45 95.67 95.65 95.09 95.78 95.45
Total 100.00 100.00 100.00 100.00 100.00 100.00 100.00
1st Mtg Production Channel MixRetail/Direct Marketing 40.92 84.66 85.44 84.04 85.39 85.81 84.66Wholesale/Broker and Correspondent 59.08 15.34 14.56 15.96 14.61 14.19 15.34
Total 100.00 100.00 100.00 100.00 100.00 100.00 100.001st Mtg Purchase vs RefiPurchase 66.08 71.61 71.37 68.14 72.62 72.41 71.61Refinancing 33.92 28.39 28.63 31.86 27.38 27.59 28.39
Rate‐Term 13.84 11.79 12.01 14.73 11.27 11.55 11.79Cash‐Out 20.08 15.77 15.75 16.06 15.38 15.12 15.77Other / Unknown 0.83 0.88 1.07 0.74 0.91 0.83
Total 100.00 100.00 100.00 100.00 100.00 100.00 100.001st Mtg FICO Score DistributionEquals 600 or less 2.89 1.77 1.70 1.53 1.81 1.77 1.77Greater than 600, less than or equal to 650 17.33 11.59 11.48 11.30 11.60 11.56 11.59Greater than 650, less than or equal to 700 27.91 22.94 22.94 23.63 22.75 23.05 22.94Greater than 700, less than or equal to 750 23.39 26.39 25.95 26.33 26.40 25.82 26.39Greater than 750 28.48 37.31 37.92 37.21 37.44 37.80 37.31
Total 100.00 100.00 100.00 100.00 100.00 100.00 100.00
1st Mortgage Simple Average FICO (based on #) 705 722 722 721 723 722 722
1st Mtg LTV DistributionEquals 60% of less 10.77 11.16 11.15 11.88 11.07 10.71 11.16Greater than 60%, less than or equal to 70% 8.04 7.49 7.61 7.86 7.50 7.38 7.49Greater than 70%, less than or equal to 80% 25.46 25.07 26.19 25.30 25.21 26.12 25.07Greater than 80%, less than or equal to 90% 9.49 12.45 12.22 12.39 12.32 12.17 12.45Greater than 90%, less than or equal to 100% 43.14 41.13 40.06 40.42 41.15 40.92 41.13Greater than 100% 3.10 2.70 2.77 2.15 2.74 2.72 2.70
Total 100.00 100.00 100.00 100.00 100.00 100.00 100.00
1st Mtg Average LTV (based on $) 83.69 82.26 81.74 81.74 82.20 82.02 82.26
1st Mtg Production Sold by Investor TypeOriginated for Portfolio 0.10 0.05 0.05 0.11 0.06 0.10Originated for Sale to Others: 100.00 99.90 99.95 99.95 99.89 99.94 99.90Sale to Fannie/Freddie/Ginnie 19.82 34.95 35.60 39.22 33.70 35.54 34.95All Other Sale to Others 80.18 64.95 64.35 60.74 66.20 64.41 64.95
Total 100.00 100.00 100.00 100.00 100.00 100.00 100.001st Mtg Servicing Released vs RetainedServicing Released 73.79 76.92 75.61 74.27 76.90 74.78 76.92Servicing Retained 26.21 23.08 24.39 25.73 23.10 25.22 23.08
Total 100.00 100.00 100.00 100.00 100.00 100.00 100.00
Number of Companies Reporting 1 343 329 342 300 300 343
QUARTERLY MORTGAGE BANKERS PERFORMANCE REPORT | Q1 2018 Results from the Mortgage Bankers Association© Mortgage Bankers Association 2018. All rights reserved. 5

QUARTER 1, 2018
Quarterly Mortgage Bankers Performance ReportResidential Loan Production ‐ HistoricalB5 ‐ Production Mix (Avg Loan Balances), Simple Average
Your Firm All Firms Previous Qtr. Previous Yr. Repeater Repeater YTDLOAN BALANCES Q1 2018 Q1 2018 Q4 2017 Q1 2017 Q1 2018 Q4 2017 2018Avg. Total Loans Originated ($000s) 282,960 449,801 505,476 454,520 440,136 522,702 449,801 Avg. Total Loans Originated (#) 1,175 1,866 2,059 1,944 1,813 2,161 1,866Average Loan Balance 240,612 244,722 249,617 238,343 245,807 244,929 244,722
Production Mix by Product TypeFirst Mortgages: 240,882 249,041 254,291 242,949 249,991 249,482 249,041Government (FHA/VA/RHS) ‐ Fixed 214,564 231,950 232,978 226,148 232,381 231,803 231,950Government (FHA/VA/RHS) ‐ ARM 340,999 309,229 317,466 323,383 311,012 319,263 309,229Prime (Conforming) ‐ Fixed 257,086 239,414 240,459 230,401 239,913 236,988 239,414Prime (Conforming) ‐ ARM 351,666 328,025 330,876 316,512 325,692 326,046 328,025Prime (Non‐Conforming Jumbo) ‐ Fixed 690,832 690,655 689,892 678,151 688,441 687,088 690,655Prime (Non‐Conforming Jumbo) ‐ ARM 727,999 811,098 771,732 773,899 806,678 767,815 811,098Other Fixed 312,666 316,316 282,545 307,654 300,335 312,666Other ARM 451,921 418,638 440,559 473,642 422,064 451,921
Closed‐End Second Mortgages 32,296 43,888 35,664 32,328 41,786 32,296Funded HELOCs 118,961 137,220 106,635 120,915 125,294 118,961Reverse 176,199 174,752 171,360 184,097 172,086 167,945 174,752Other 170,973 186,284 209,908 187,745 186,284 170,973
1st Mtg Fixed Rate vs ARMFixed Rate 240,012 244,592 248,106 236,243 245,385 244,554 244,592ARM 410,832 468,381 467,483 433,927 472,820 458,373 468,381
1st Mtg Jumbo vs. Non‐JumboJumbo 696,142 690,816 680,375 679,222 687,603 674,772 690,816Non‐Jumbo 238,149 240,656 240,659 233,108 241,640 237,698 240,656
1st Mtg Production Channel MixRetail/Direct Marketing 195,227 246,631 251,547 240,737 247,093 246,257 246,631Wholesale/Broker and Correspondent 272,493 253,494 257,677 253,403 257,407 247,586 253,494
1st Mtg Purchase vs RefiPurchase 229,321 249,006 253,914 243,677 249,682 248,375 249,006Refinancing 263,437 252,080 261,182 246,368 252,981 256,932 252,080
Rate‐Term 276,369 260,749 276,180 255,150 260,911 272,798 260,749Cash‐Out 254,522 248,734 251,583 242,496 249,380 245,975 248,734Other / Unknown 282,816 286,935 212,214 287,914 281,557 282,816
1st Mtg FICO Score DistributionEquals 600 or less 216,823 214,783 215,727 207,727 212,818 212,847 214,783Greater than 600, less than or equal to 650 200,896 219,010 219,744 212,391 219,197 217,528 219,010Greater than 650, less than or equal to 700 217,641 232,522 236,835 227,723 233,065 232,495 232,522Greater than 700, less than or equal to 750 255,437 253,865 259,146 248,788 255,765 254,274 253,865Greater than 750 278,579 265,166 268,818 259,642 266,750 263,777 265,166
1st Mtg LTV DistributionEquals 60% of less 243,332 209,341 215,109 211,201 210,743 209,420 209,341Greater than 60%, less than or equal to 70% 274,000 262,973 271,263 258,511 263,995 267,735 262,973Greater than 70%, less than or equal to 80% 271,737 267,697 273,787 260,682 269,290 268,471 267,697Greater than 80%, less than or equal to 90% 260,693 267,943 272,309 258,446 268,934 268,386 267,943Greater than 90%, less than or equal to 100% 215,662 240,650 240,469 232,975 241,025 237,020 240,650Greater than 100% 182,296 189,346 215,007 187,011 190,089 216,659 189,346
1st Mtg Production Sold by Investor TypeOriginated for Portfolio 327,333 261,590 222,189 347,536 260,117 327,333Originated for Sale to Others: 240,887 246,535 250,435 239,147 247,431 246,709 246,535Sale to Fannie/Freddie/Ginnie 226,008 217,320 231,821 219,353 218,922 228,421 217,320All Other Sale to Others 244,563 265,049 288,383 282,368 265,006 285,774 265,049
1st Mtg Servicing Released vs RetainedServicing Released 265,793 262,296 278,229 255,327 262,896 275,571 262,296Servicing Retained 170,794 249,546 247,212 243,830 247,725 236,813 249,546
Number of Companies Reporting 1 343 329 342 300 300 343
QUARTERLY MORTGAGE BANKERS PERFORMANCE REPORT | Q1 2018 Results from the Mortgage Bankers Association© Mortgage Bankers Association 2018. All rights reserved. 6

QUARTER 1, 2018
Quarterly Mortgage Bankers Performance ReportResidential Loan Production ‐ by Quarterly Production Volume $C1 ‐ Net Loan Production Income and Expense, $ per loan, Simple Average
$ PER LOAN Your Firm <50M 50‐100M 100‐250M >250M Total
ORIGINATION‐RELATED INCOMELoan Origination Fees 91 1,454 1,297 1,389 741 1,161 Correspondent and Broker Fee Income (1) 146 110 61 91 96 Other Origination‐Related Income (2) 1,202 583 445 575 406 495 Total Origination‐Related Income 1,293 2,183 1,853 2,025 1,239 1,752
NET INTEREST INCOMEWarehousing Income 645 387 450 511 605 510 Warehousing Expense 659 329 461 459 537 462
Net Interest Income (14) 58 (11) 53 68 47
SECONDARY MARKETING INCOMESecondary Mktg Gains (Losses) 7,614 3,187 4,425 4,955 5,008 4,551 Capitalized Servicing/Svg Released Premiums 397 2,187 2,538 2,663 2,603 2,532 Repurchase Reserve Provision ‐ (4) (39) (37) (70) (43)
Net Secondary Marketing Income 8,011 5,370 6,924 7,581 7,541 7,040
Total Loan Production Revenue 9,290 7,610 8,765 9,659 8,848 8,840
EXPENSESPersonnel 4,920 5,266 5,994 6,315 5,836 5,899 Sales Personnel 2,382 1,856 2,478 2,733 2,571 2,469 Fulfillment Personnel 1,220 1,552 1,401 1,451 1,315 1,414 Production Support Employees 246 568 725 666 741 685 Management and Directors 216 510 523 543 377 476 Benefits 856 780 867 922 831 855
Occupancy and Equipment 587 480 530 562 556 539 Technology‐Related Expenses 241 213 263 230 189 219 Other Direct Expenses 2,949 1,862 1,882 1,777 1,605 1,753 Outsourcing and Professional fees 874 385 358 352 277 333 Other Operating Expenses 2,075 1,477 1,524 1,425 1,328 1,419
Direct Loan Production Expenses 8,697 7,821 8,668 8,884 8,186 8,409
Corporate Allocation 542 323 499 716 554 548
Total Loan Production Expense 9,253 8,144 9,167 9,601 8,740 8,957
TOTAL NET PRODUCTION INCOME 37 (534) (401) 58 108 (118)
MEMO ITEMSOriginations Volume:Avg. Total Loans Originated ($000s) 282,962 27,069 75,445 165,355 1,114,009 449,801 Avg. Total Loans Originated (#) 1,174 136 326 713 4,579 1,866 Average Loan Balance ($) 240,605 214,143 258,965 248,714 250,094 244,722 Avg. Pull‐Through (Closings/Applications #) 48.29 65.55 72.30 68.68 71.16 69.88
Average Days in Warehouse 19 13 15 16 19 16
Employees:Total Production FTEs (excluding 0 reporters) 287 35 120 215 838 380
ProductivitySimple Avg.Closings per Sales Employee per Mo. 3.2 4.9 4.4 4.6 5.4 4.9Closings per Fulfillment Employee per Mo. 3.4 4.7 5.4 4.2 6.1 5.2Closings per Prod Support Employee per Mo. 14.3 9.1 10.5 13.0 15.6 12.9Closings per Total Prod. Employee per Mo. 1.2 1.7 1.8 1.6 2.4 1.9
Weighted Avg.Closings per Sales Employee per Mo. 3.1 2.9 2.2 2.4 4.1 3.7Closings per Fulfillment Employee per Mo. 3.3 3.5 2.8 3.5 4.5 4.3Closings per Prod Support Employee per Mo. 14.3 5.7 4.9 7.0 11.1 10.0Closings per Total Prod. Employee per Mo. 1.5 1.3 0.9 1.1 1.8 1.6
MedianClosings per Sales Employee per Mo. 3.2 3.3 2.9 2.8 3.7 3.2Closings per Fulfillment Employee per Mo. 3.4 3.1 3.7 3.4 4.1 3.7Closings per Prod Support Employee per Mo. 14.4 6.8 8.5 8.8 11.6 8.9Closings per Total Prod. Employee per Mo. 1.2 1.2 1.4 1.3 1.4 1.4
Number of Companies Reporting 1 63 63 99 118 343
(1) Correspondent and Broker Income: Fee income earned on loans acquired from correspondents and brokers(2) Other Originations Income: Underwriting, processing, administration and other fees
QUARTERLY MORTGAGE BANKERS PERFORMANCE REPORT | Q1 2018 Results from the Mortgage Bankers Association© Mortgage Bankers Association 2018. All rights reserved. 7

QUARTER 1, 2018
Quarterly Mortgage Bankers Performance ReportResidential Loan Production ‐ by Quarterly Production Volume $C2 ‐ Net Loan Production Income and Expense, Basis Points, Simple Average
BASIS POINTS Your Firm <50M 50‐100M 100‐250M >250M Total
ORIGINATION‐RELATED INCOMELoan Origination Fees 3.81 74.12 48.65 59.70 31.73 50.70 Correspondent and Broker Fee Income (1) 9.72 4.96 2.97 3.61 4.80 Other Origination‐Related Income (2) 41.69 27.80 17.06 23.95 15.11 20.35 Total Origination‐Related Income 45.50 111.65 70.67 86.62 50.45 75.84
NET INTEREST INCOMEWarehousing Income 26.07 17.81 17.92 20.21 24.03 20.66 Warehousing Expense 25.49 15.59 18.63 18.40 21.82 19.10
Net Interest Income 0.58 2.22 (0.71) 1.81 2.21 1.56
SECONDARY MARKETING INCOMESecondary Mktg Gains (Losses) 311.94 138.82 183.36 199.69 209.19 188.78 Capitalized Servicing/Svg Released Premiums 18.68 100.28 103.16 109.65 105.21 105.21 Repurchase Reserve Provision ‐ (0.29) (1.34) (1.53) (2.82) (1.71)
Net Secondary Marketing Income 330.62 238.81 285.18 307.82 311.59 292.28
Total Loan Production Revenue 376.70 352.67 355.14 396.24 364.24 369.68
EXPENSESPersonnel 199.83 251.01 242.24 257.62 241.18 247.92 Sales Personnel 98.09 82.81 97.34 111.30 106.58 101.88 Fulfillment Personnel 49.93 72.81 56.87 61.10 54.62 60.25 Production Support Employees 9.60 29.23 30.79 26.33 30.44 29.09 Management and Directors 7.80 24.80 21.97 21.53 15.11 20.00 Benefits 34.41 41.36 35.28 37.35 34.42 36.70
Occupancy and Equipment 23.49 22.65 21.41 22.61 23.02 22.54 Technology‐Related Expenses 8.97 10.87 10.90 9.97 7.88 9.59 Other Direct Expenses 120.74 86.88 73.79 75.51 67.01 74.36 Outsourcing and Professional fees 35.26 18.26 13.53 14.28 11.62 13.95 Other Operating Expenses 85.48 68.63 60.26 61.23 55.39 60.40
Direct Loan Production Expenses 353.03 371.41 348.33 365.70 339.08 354.40
Corporate Allocation 21.73 18.61 19.79 28.06 22.93 23.04
Total Loan Production Expense 374.76 390.02 368.12 393.76 362.00 377.44
TOTAL NET PRODUCTION INCOME 1.94 (37.35) (12.98) 2.48 2.24 (7.76)
MEMO ITEMSOriginations Volume:Avg. Total Loans Originated ($000s) 282,960 27,069 75,445 165,355 1,114,009 449,801 Avg. Total Loans Originated (#) 1,175 136 326 713 4,579 1,866 Average Loan Balance ($) 240,612 214,143 258,965 248,714 250,094 244,722 Avg. Pull‐Through (Closings/Applications #) 48.29 65.55 72.30 68.68 71.16 69.88
Average Days in Warehouse 19 13 15 16 19 16
Employees:Total Production FTEs (excluding 0 reporters) 289 35 120 215 838 380
ProductivitySimple Avg.Closings per Sales Employee per Mo. 3.2 4.9 4.4 4.6 5.4 4.9Closings per Fulfillment Employee per Mo. 3.4 4.7 5.4 4.2 6.1 5.2Closings per Prod Support Employee per Mo. 14.4 9.1 10.5 13.0 15.6 12.9Closings per Total Prod. Employee per Mo. 1.3 1.7 1.8 1.6 2.4 1.9
Weighted Avg.Closings per Sales Employee per Mo. 3.2 2.9 2.2 2.4 4.1 3.7Closings per Fulfillment Employee per Mo. 3.4 3.5 2.8 3.5 4.5 4.3Closings per Prod Support Employee per Mo. 14.4 5.7 4.9 7.0 11.1 10.0Closings per Total Prod. Employee per Mo. 1.3 1.3 0.9 1.1 1.8 1.6
MedianClosings per Sales Employee per Mo. 3.2 3.3 2.9 2.8 3.7 3.2Closings per Fulfillment Employee per Mo. 3.4 3.1 3.7 3.4 4.1 3.7Closings per Prod Support Employee per Mo. 14.4 6.8 8.5 8.8 11.6 8.9Closings per Total Prod. Employee per Mo. 1.3 1.2 1.4 1.3 1.4 1.4
Number of Companies Reporting 1 63 63 99 118 343
(1) Correspondent and Broker Income: Fee income earned on loans acquired from correspondents and brokers(2) Other Originations Income: Underwriting, processing, administration and other fees
QUARTERLY MORTGAGE BANKERS PERFORMANCE REPORT | Q1 2018 Results from the Mortgage Bankers Association© Mortgage Bankers Association 2018. All rights reserved. 8

QUARTER 1, 2018
Quarterly Mortgage Bankers Performance ReportResidential Loan Production ‐ by Quarterly Production Volume $C3 ‐ Production Mix ($), Simple Average
PERCENT BASED ON $ Your Firm <50M 50‐100M 100‐250M >250M TotalAvg. Total Loans Originated ($000s) 282,960 27,069 75,445 165,355 1,114,009 449,801 Avg. Total Loans Originated (#) 1,175 136 326 713 4,579 1,866Average Loan Balance 240,612 214,143 258,965 248,714 250,094 244,722Production Mix by Product TypeFirst Mortgages: 99.63 99.27 98.60 99.63 99.29 99.26Government (FHA/VA/RHS) ‐ Fixed 40.10 28.63 29.34 32.25 36.95 32.67Government (FHA/VA/RHS) ‐ ARM 0.23 1.47 0.74 1.01 0.17 0.76Prime (Conforming) ‐ Fixed 57.23 61.52 59.74 56.11 53.79 56.97Prime (Conforming) ‐ ARM 0.36 1.56 2.10 1.77 1.04 1.54Prime (Non‐Conforming Jumbo) ‐ Fixed 1.45 2.47 4.18 5.16 4.39 4.22Prime (Non‐Conforming Jumbo) ‐ ARM 0.25 1.59 1.60 1.53 1.61 1.58Other Fixed 1.95 0.12 1.43 0.66 1.02Other ARM 0.09 0.79 0.36 0.69 0.50
Closed‐End Second Mortgages 0.25 0.07 0.09 0.13 0.13Funded HELOCs 0.00 0.01 0.09 0.16 0.08Reverse 0.37 0.48 0.73 0.15 0.36 0.39Other 0.00 0.58 0.05 0.05 0.14
Total 100.00 100.00 100.00 100.00 100.00 100.00
1st Mtg Fixed Rate vs ARMFixed Rate 99.12 95.29 94.76 95.31 96.45 95.60ARM 0.88 4.71 5.24 4.69 3.55 4.40
Total 100.00 100.00 100.00 100.00 100.00 100.00
1st Mtg Jumbo vs. Non‐JumboJumbo 1.74 4.89 9.24 9.51 8.65 8.33Non‐Jumbo 98.26 95.11 90.76 90.49 91.35 91.67
Total 100.00 100.00 100.00 100.00 100.00 100.00
1st Mtg Production Channel MixRetail/Direct Marketing 33.14 82.86 88.94 89.11 78.70 84.37Wholesale/Broker and Correspondent 66.86 17.14 11.06 10.89 21.30 15.63
Total 100.00 100.00 100.00 100.00 100.00 100.00
1st Mtg Purchase vs RefiPurchase 62.90 72.17 69.23 72.35 70.76 71.20Refinancing 37.10 27.83 30.77 27.65 29.24 28.80
Rate‐Term 15.89 10.13 14.01 12.73 11.81 12.17Cash‐Out 21.21 15.63 16.48 14.45 16.72 15.82Other / Unknown 2.07 0.28 0.47 0.71 0.81
Total 100.00 100.00 100.00 100.00 100.00 100.001st Mtg FICO Score DistributionEquals 600 or less 2.62 1.21 2.48 1.27 1.72 1.63Greater than 600, less than or equal to 650 14.45 8.97 8.85 10.41 11.86 10.35Greater than 650, less than or equal to 700 25.25 22.55 19.87 20.95 22.31 21.51Greater than 700, less than or equal to 750 24.80 26.39 27.78 27.23 26.55 26.94Greater than 750 32.88 40.87 41.02 40.15 37.57 39.56
Total 100.00 100.00 100.00 100.00 100.00 100.00
1st Mtg Simple Average FICO (based on #) 705 726 726 723 718 7221st Mtg LTV DistributionEquals 60% of less 10.86 9.80 10.22 9.06 8.91 9.36Greater than 60%, less than or equal to 70% 9.15 8.02 8.62 7.53 7.77 7.90Greater than 70%, less than or equal to 80% 28.70 26.75 28.35 27.50 26.07 27.03Greater than 80%, less than or equal to 90% 10.27 14.27 12.52 13.51 13.35 13.41Greater than 90%, less than or equal to 100% 38.62 39.47 37.69 39.00 42.09 39.90Greater than 100% 2.40 1.68 2.60 3.40 1.82 2.39
Total 100.00 100.00 100.00 100.00 100.00 100.00
1st Mtg Average LTV (based on $) 82.69 79.95 81.31 82.45 83.81 82.26
1st Mtg Production Sold by Investor TypeOriginated for Portfolio 0.09 0.05 0.33 0.06 0.14Originated for Sale to Others: 100.00 99.91 99.95 99.67 99.94 99.86Sale to Fannie/Freddie/Ginnie 18.58 42.63 25.48 20.05 45.11 33.85All Other Sale to Others 81.42 57.28 74.47 79.62 54.83 66.00
Total 100.00 100.00 100.00 100.00 100.00 100.001st Mtg Servicing Released vs RetainedServicing Released 81.42 75.17 79.56 86.15 70.27 77.38Servicing Retained 18.58 24.83 20.44 13.85 29.73 22.62
Total 100.00 100.00 100.00 100.00 100.00 100.00
Number of Companies Reporting 1 63 63 99 118 343
QUARTERLY MORTGAGE BANKERS PERFORMANCE REPORT | Q1 2018 Results from the Mortgage Bankers Association© Mortgage Bankers Association 2018. All rights reserved. 9

QUARTER 1, 2018
Quarterly Mortgage Bankers Performance ReportResidential Loan Production ‐ by Quarterly Production Volume $C4 ‐ Production Mix (#), Simple Average
PERCENT BASED ON # Your Firm <50M 50‐100M 100‐250M >250M TotalAvg. Total Loans Originated ($000s) 282,960 27,069 75,445 165,355 1,114,009 449,801 Avg. Total Loans Originated (#) 1,175 136 326 713 4,579 1,866Average Loan Balance 240,612 214,143 258,965 248,714 250,094 244,722
Production Mix by Product TypeFirst Mortgages: 99.51 97.83 97.37 98.41 96.95 97.61Government (FHA/VA/RHS) ‐ Fixed 44.97 29.93 30.69 33.92 38.39 34.13Government (FHA/VA/RHS) ‐ ARM 0.16 1.51 0.70 0.88 0.16 0.71Prime (Conforming) ‐ Fixed 53.56 61.17 60.91 57.55 54.15 57.66Prime (Conforming) ‐ ARM 0.25 1.27 1.78 1.64 0.81 1.31Prime (Non‐Conforming Jumbo) ‐ Fixed 0.50 1.10 1.99 2.36 1.79 1.86Prime (Non‐Conforming Jumbo) ‐ ARM 0.08 0.55 0.65 0.61 0.55 0.58Other Fixed 2.24 0.12 1.20 0.54 0.96Other ARM 0.06 0.53 0.26 0.56 0.38
Closed‐End Second Mortgages 1.73 0.94 1.08 1.99 1.49Funded HELOCs 0.02 0.04 0.20 0.35 0.19Reverse 0.49 0.43 0.82 0.23 0.59 0.50Other 0.00 0.82 0.08 0.12 0.21
Total 100.00 100.00 100.00 100.00 100.00 100.00
1st Mtg Fixed Rate vs ARMFixed Rate 99.48 96.59 96.29 96.58 97.86 96.97ARM 0.52 3.41 3.71 3.42 2.14 3.03
Total 100.00 100.00 100.00 100.00 100.00 100.00
1st Mtg Jumbo vs. Non‐JumboJumbo 0.59 2.03 5.84 5.28 4.56 4.55Non‐Jumbo 99.41 97.97 94.16 94.72 95.44 95.45
Total 100.00 100.00 100.00 100.00 100.00 100.00
1st Mtg Production Channel MixRetail/Direct Marketing 40.92 83.11 88.70 89.27 79.41 84.66Wholesale/Broker and Correspondent 59.08 16.89 11.30 10.73 20.59 15.34
Total 100.00 100.00 100.00 100.00 100.00 100.00
1st Mtg Purchase vs RefiPurchase 66.08 72.20 69.28 72.87 71.47 71.61Refinancing 33.92 27.80 30.72 27.13 28.53 28.39
Rate‐Term 13.84 10.25 13.64 12.11 11.37 11.79Cash‐Out 20.08 15.32 16.80 14.56 16.47 15.77Other / Unknown 2.23 0.28 0.47 0.69 0.83
Total 100.00 100.00 100.00 100.00 100.00 100.001st Mtg FICO Score DistributionEquals 600 or less 2.89 1.30 2.47 1.42 1.93 1.77Greater than 600, less than or equal to 650 17.33 9.70 9.97 11.80 13.31 11.59Greater than 650, less than or equal to 700 27.91 23.64 21.20 22.51 23.87 22.94Greater than 700, less than or equal to 750 23.39 26.31 27.20 26.64 25.78 26.39Greater than 750 28.48 39.05 39.16 37.62 35.11 37.31
Total 100.00 100.00 100.00 100.00 100.00 100.00
1st Mortgage Simple Average FICO (based on #) 705 726 726 723 718 7221st Mtg LTV DistributionEquals 60% of less 10.77 11.80 12.17 11.10 10.34 11.16Greater than 60%, less than or equal to 70% 8.04 7.86 8.24 7.09 7.24 7.49Greater than 70%, less than or equal to 80% 25.46 25.01 26.69 25.40 23.96 25.07Greater than 80%, less than or equal to 90% 9.49 13.23 11.53 12.51 12.47 12.45Greater than 90%, less than or equal to 100% 43.14 40.06 38.52 40.27 43.82 41.13Greater than 100% 3.10 2.04 2.85 3.63 2.18 2.70
Total 100.00 100.00 100.00 100.00 100.00 100.001st Mtg Average LTV (based on $) 83.69 79.95 81.31 82.45 83.81 82.26
1st Mtg Production Sold by Investor TypeOriginated for Portfolio 0.14 0.03 0.21 0.03 0.10Originated for Sale to Others: 100.00 99.86 99.97 99.79 99.97 99.90Sale to Fannie/Freddie/Ginnie 19.82 42.58 26.44 21.35 46.65 34.95All Other Sale to Others 80.18 57.28 73.52 78.44 53.32 64.95
Total 100.00 100.00 100.00 100.00 100.00 100.001st Mtg Servicing Released vs RetainedServicing Released 73.79 74.96 79.37 85.88 69.42 76.92Servicing Retained 26.21 25.04 20.63 14.12 30.58 23.08
Total 100.00 100.00 100.00 100.00 100.00 100.00
Number of Companies Reporting 1 63 63 99 118 343
QUARTERLY MORTGAGE BANKERS PERFORMANCE REPORT | Q1 2018 Results from the Mortgage Bankers Association© Mortgage Bankers Association 2018. All rights reserved. 10

QUARTER 1, 2018
Quarterly Mortgage Bankers Performance ReportResidential Loan Production ‐ by Quarterly Production Volume $C5 ‐ Production Mix (Avg Loan Balances), Simple Average
LOAN BALANCES Your Firm <50M 50‐100M 100‐250M >250M TotalAvg. Total Loans Originated ($000s) 282,960 27,069 75,445 165,355 1,114,009 449,801 Avg. Total Loans Originated (#) 1,175 136 326 713 4,579 1,866Average Loan Balance 240,612 214,143 258,965 248,714 250,094 244,722
Production Mix by Product TypeFirst Mortgages: 240,882 216,561 262,995 252,013 256,438 249,041Government (FHA/VA/RHS) ‐ Fixed 214,564 204,407 239,028 237,996 236,868 231,950Government (FHA/VA/RHS) ‐ ARM 340,999 202,452 276,683 284,609 334,366 309,229Prime (Conforming) ‐ Fixed 257,086 216,292 248,832 238,521 247,139 239,414Prime (Conforming) ‐ ARM 351,666 288,266 323,756 309,177 353,942 328,025Prime (Non‐Conforming Jumbo) ‐ Fixed 690,832 652,271 701,325 681,658 702,150 690,655Prime (Non‐Conforming Jumbo) ‐ ARM 727,999 809,283 831,603 776,437 827,442 811,098Other Fixed 167,954 304,685 287,791 355,731 312,666Other ARM 398,333 480,660 407,487 477,377 451,921
Closed‐End Second Mortgages 26,130 20,831 37,417 33,342 32,296Funded HELOCs 9,000 67,250 129,652 124,358 118,961Reverse 176,199 158,114 193,500 171,746 174,218 174,752Other 7,000 187,407 243,504 148,939 170,973
1st Mtg Fixed Rate vs ARMFixed Rate 240,012 213,203 256,729 248,143 251,890 244,592ARM 410,832 417,841 428,043 459,780 507,741 468,381
1st Mtg Jumbo vs. Non‐JumboJumbo 696,142 666,971 704,246 671,501 708,063 690,816Non‐Jumbo 238,149 207,553 249,362 241,070 253,054 240,656
1st Mtg Production Channel MixRetail/Direct Marketing 195,227 215,796 259,043 251,790 251,408 246,631Wholesale/Broker and Correspondent 272,493 201,034 254,256 245,218 273,163 253,494
1st Mtg Purchase vs RefiPurchase 229,321 218,102 265,893 251,311 254,577 249,006Refinancing 263,437 217,637 257,991 255,264 264,455 252,080
Rate‐Term 276,369 218,642 263,829 268,326 272,994 260,749Cash‐Out 254,522 224,580 254,674 244,734 260,641 248,734Other / Unknown 156,667 373,311 248,667 320,969 282,816
1st Mtg FICO Score DistributionEquals 600 or less 216,823 184,790 221,098 219,467 217,888 214,783Greater than 600, less than or equal to 650 200,896 200,915 226,941 221,495 222,361 219,010Greater than 650, less than or equal to 700 217,641 205,112 247,601 235,105 236,976 232,522Greater than 700, less than or equal to 750 255,437 214,193 267,887 258,767 263,528 253,865Greater than 750 278,579 226,715 275,298 273,082 273,543 265,166
1st Mtg LTV DistributionEquals 60% of less 243,332 182,200 220,364 206,816 219,692 209,341Greater than 60%, less than or equal to 70% 274,000 219,359 276,918 266,072 275,207 262,973Greater than 70%, less than or equal to 80% 271,737 227,423 280,720 272,879 277,643 267,697Greater than 80%, less than or equal to 90% 260,693 235,729 279,728 272,997 274,768 267,943Greater than 90%, less than or equal to 100% 215,662 215,482 253,853 245,643 242,869 240,650Greater than 100% 182,296 167,839 176,635 193,000 196,821 189,346
1st Mtg Production Sold by Investor TypeOriginated for Portfolio 141,833 472,917 386,524 302,784 327,333Originated for Sale to Others: 240,887 213,086 262,181 250,883 251,199 246,535Sale to Fannie/Freddie/Ginnie 226,008 187,969 238,198 207,185 228,257 217,320All Other Sale to Others 244,563 230,884 281,234 258,593 276,741 265,049
1st Mtg Servicing Released vs RetainedServicing Released 265,793 216,800 266,410 257,905 282,888 262,296Servicing Retained 170,794 237,336 299,488 257,734 231,174 249,546
Number of Companies Reporting 1 63 63 99 118 343
QUARTERLY MORTGAGE BANKERS PERFORMANCE REPORT | Q1 2018 Results from the Mortgage Bankers Association© Mortgage Bankers Association 2018. All rights reserved. 11

QUARTER 1, 2018
Quarterly Mortgage Bankers Performance ReportResidential Loan Production ‐ by Retail/Consumer Direct vs Wholesale Production Mix in DollarD1 ‐ Net Loan Production Income and Expense, $ per loan, Simple Average
$ PER LOAN Your Firm
100%
Retail/CD
Mixed Retail/
Wholesale
75% or More
Wholesale Total
ORIGINATION‐RELATED INCOMELoan Origination Fees 91 1,291 1,133 294 1,161 Correspondent and Broker Fee Income (1) ‐ 155 560 96 Other Origination‐Related Income (2) 1,202 608 315 349 495 Total Origination‐Related Income 1,293 1,899 1,603 1,203 1,752
NET INTEREST INCOMEWarehousing Income 645 507 540 424 510 Warehousing Expense 659 449 537 301 462
Net Interest Income (14) 58 3 124 47
SECONDARY MARKETING INCOMESecondary Mktg Gains (Losses) 7,614 5,082 4,477 1,075 4,551 Capitalized Servicing/Svg Released Premiums 397 2,711 2,480 1,490 2,532 Repurchase Reserve Provision ‐ (39) (56) (30) (43)
Net Secondary Marketing Income 8,011 7,754 6,902 2,535 7,040
Total Loan Production Revenue 9,290 9,711 8,508 3,862 8,840
EXPENSESPersonnel 4,920 6,362 5,882 2,673 5,899 Sales Personnel 2,382 2,724 2,459 723 2,469 Fulfillment Personnel 1,220 1,481 1,471 799 1,414 Production Support Employees 246 731 667 313 685 Management and Directors 216 534 432 239 476 Benefits 856 892 853 599 855
Occupancy and Equipment 587 566 571 229 539 Technology‐Related Expenses 241 236 195 187 219 Other Direct Expenses 2,949 1,866 1,729 1,042 1,753 Outsourcing and Professional fees 874 349 290 377 333 Other Operating Expenses 2,075 1,516 1,439 665 1,419
Direct Loan Production Expenses 8,697 9,030 8,376 4,130 8,409
Corporate Allocation 542 534 651 308 548
Total Loan Production Expense 9,253 9,564 9,027 4,438 8,957
TOTAL NET PRODUCTION INCOME 37 148 (519) (577) (118)
MEMO ITEMSOriginations Volume:Avg. Total Loans Originated ($000s) 282,962 234,084 921,669 312,826 449,801 Avg. Total Loans Originated (#) 1,174 941 3,835 1,463 1,866 Average Loan Balance ($) 240,605 249,469 240,945 225,773 244,722 Avg. Pull‐Through (Closings/Applications #) 48.29 70.30 69.60 67.90 69.88
Average Days in Warehouse 19 16 17 18 16
Employees:Total Production FTEs (excluding 0 reporters) 287 272 672 112 380
ProductivitySimple Avg.Closings per Sales Employee per Mo. 3.2 4.0 4.8 13.7 4.9Closings per Fulfillment Employee per Mo. 3.4 4.5 5.4 8.7 5.2Closings per Prod Support Employee per Mo. 14.3 10.6 14.3 24.0 12.9Closings per Total Prod. Employee per Mo. 1.2 1.5 1.7 5.4 1.9
Weighted Avg.Closings per Sales Employee per Mo. 3.1 2.7 4.3 11.9 3.7Closings per Fulfillment Employee per Mo. 3.3 3.4 4.7 7.6 4.3Closings per Prod Support Employee per Mo. 14.3 7.4 11.3 21.5 10.0Closings per Total Prod. Employee per Mo. 1.5 1.2 1.9 4.4 1.6
MedianClosings per Sales Employee per Mo. 3.2 3.0 3.3 10.8 3.2Closings per Fulfillment Employee per Mo. 3.4 3.6 3.7 5.3 3.7Closings per Prod Support Employee per Mo. 14.4 8.0 8.5 22.2 8.9Closings per Total Prod. Employee per Mo. 1.2 1.3 1.4 3.0 1.4
Number of Companies Reporting 1 208 104 30 343
(1) Correspondent and Broker Income: Fee income earned on loans acquired from correspondents and brokers(2) Other Originations Income: Underwriting, processing, administration and other fees
QUARTERLY MORTGAGE BANKERS PERFORMANCE REPORT | Q1 2018 Results from the Mortgage Bankers Association© Mortgage Bankers Association 2018. All rights reserved. 12

QUARTER 1, 2018
Quarterly Mortgage Bankers Performance ReportResidential Loan Production ‐ by Retail/Consumer Direct vs Wholesale Production Mix in DollarD2 ‐ Net Loan Production Income and Expense, Basis Points, Simple Average
BASIS POINTS Your Firm
100%
Retail/CD
Mixed Retail/
Wholesale
75% or More
Wholesale Total
ORIGINATION‐RELATED INCOMELoan Origination Fees 3.81 56.30 49.64 12.28 50.70 Correspondent and Broker Fee Income (1) ‐ 7.67 28.25 4.80 Other Origination‐Related Income (2) 41.69 24.83 12.61 16.79 20.35 Total Origination‐Related Income 45.50 81.13 69.92 57.32 75.84
NET INTEREST INCOMEWarehousing Income 26.07 20.15 22.74 16.98 20.66 Warehousing Expense 25.49 18.12 23.07 12.23 19.10
Net Interest Income 0.58 2.04 (0.33) 4.74 1.56
SECONDARY MARKETING INCOMESecondary Mktg Gains (Losses) 311.94 205.60 193.25 53.74 188.78 Capitalized Servicing/Svg Released Premiums 18.68 110.37 106.94 63.90 105.21 Repurchase Reserve Provision ‐ (1.51) (2.22) (1.35) (1.71)
Net Secondary Marketing Income 330.62 314.46 297.97 116.28 292.28
Total Loan Production Revenue 376.70 397.63 367.56 178.34 369.68
EXPENSESPersonnel 199.83 262.17 253.77 124.92 247.92 Sales Personnel 98.09 111.04 104.15 29.29 101.88 Fulfillment Personnel 49.93 62.37 63.47 36.35 60.25 Production Support Employees 9.60 29.61 29.84 17.58 29.09 Management and Directors 7.80 21.77 18.82 12.53 20.00 Benefits 34.41 37.38 37.49 29.18 36.70
Occupancy and Equipment 23.49 23.12 24.85 10.05 22.54 Technology‐Related Expenses 8.97 10.09 8.77 8.84 9.59 Other Direct Expenses 120.74 78.18 73.98 48.48 74.36 Outsourcing and Professional fees 35.26 14.14 12.84 16.67 13.95 Other Operating Expenses 85.48 64.05 61.14 31.81 60.40
Direct Loan Production Expenses 353.03 373.56 361.37 192.29 354.40
Corporate Allocation 21.73 21.67 28.16 15.53 23.04
Total Loan Production Expense 374.76 395.24 389.53 207.82 377.44
TOTAL NET PRODUCTION INCOME 1.94 2.40 (21.97) (29.48) (7.76)
MEMO ITEMSOriginations Volume:Avg. Total Loans Originated ($000s) 282,960 234,084 921,669 312,826 449,801 Avg. Total Loans Originated (#) 1,175 941 3,835 1,463 1,866 Average Loan Balance ($) 240,612 249,469 240,945 225,773 244,722 Avg. Pull‐Through (Closings/Applications #) 48.29 70.30 69.60 67.90 69.88
Average Days in Warehouse 19 16 17 18 16
Employees:Total Production FTEs (excluding 0 reporters) 289 272 672 112 380
ProductivitySimple Avg.Closings per Sales Employee per Mo. 3.2 4.0 4.8 13.7 4.9Closings per Fulfillment Employee per Mo. 3.4 4.5 5.4 8.7 5.2Closings per Prod Support Employee per Mo. 14.4 10.6 14.3 24.0 12.9Closings per Total Prod. Employee per Mo. 1.3 1.5 1.7 5.4 1.9
Weighted Avg.Closings per Sales Employee per Mo. 3.2 2.7 4.3 11.9 3.7Closings per Fulfillment Employee per Mo. 3.4 3.4 4.7 7.6 4.3Closings per Prod Support Employee per Mo. 14.4 7.4 11.3 21.5 10.0Closings per Total Prod. Employee per Mo. 1.3 1.2 1.9 4.4 1.6
MedianClosings per Sales Employee per Mo. 3.2 3.0 3.3 10.8 3.2Closings per Fulfillment Employee per Mo. 3.4 3.6 3.7 5.3 3.7Closings per Prod Support Employee per Mo. 14.4 8.0 8.5 22.2 8.9Closings per Total Prod. Employee per Mo. 1.3 1.3 1.4 3.0 1.4
Number of Companies Reporting 1 208 104 30 343
(1) Correspondent and Broker Income: Fee income earned on loans acquired from correspondents and brokers(2) Other Originations Income: Underwriting, processing, administration and other fees
QUARTERLY MORTGAGE BANKERS PERFORMANCE REPORT | Q1 2018 Results from the Mortgage Bankers Association© Mortgage Bankers Association 2018. All rights reserved. 13

QUARTER 1, 2018
Quarterly Mortgage Bankers Performance ReportResidential Loan Production ‐ by Retail/Consumer Direct vs Wholesale Production Mix in DollarD3 ‐ Production Mix ($), Simple Average
PERCENT BASED ON $ Your Firm
100%
Retail/CD
Mixed Retail/
Wholesale
75% or More
Wholesale TotalAvg. Total Loans Originated ($000s) 282,960 234,084 921,669 312,826 449,801 Avg. Total Loans Originated (#) 1,175 941 3,835 1,463 1,866Average Loan Balance 240,612 249,469 240,945 225,773 244,722Production Mix by Product TypeFirst Mortgages: 99.63 99.28 99.13 99.55 99.26Government (FHA/VA/RHS) ‐ Fixed 40.10 30.56 36.60 33.49 32.67Government (FHA/VA/RHS) ‐ ARM 0.23 0.54 0.84 2.03 0.76Prime (Conforming) ‐ Fixed 57.23 58.52 54.59 54.29 56.97Prime (Conforming) ‐ ARM 0.36 1.98 1.05 0.26 1.54Prime (Non‐Conforming Jumbo) ‐ Fixed 1.45 4.47 3.64 4.61 4.22Prime (Non‐Conforming Jumbo) ‐ ARM 0.25 2.00 1.17 0.16 1.58Other Fixed 1.01 0.63 2.46 1.02Other ARM 0.20 0.61 2.24 0.50
Closed‐End Second Mortgages 0.13 0.07 0.35 0.13Funded HELOCs 0.11 0.05 0.00 0.08Reverse 0.37 0.28 0.69 0.08 0.39Other 0.20 0.05 0.02 0.14
Total 100.00 100.00 100.00 100.00 100.00
1st Mtg Fixed Rate vs ARMFixed Rate 99.12 95.27 96.30 95.31 95.60ARM 0.88 4.73 3.70 4.69 4.40
Total 100.00 100.00 100.00 100.00 100.00
1st Mtg Jumbo vs. Non‐JumboJumbo 1.74 8.67 7.97 7.25 8.33Non‐Jumbo 98.26 91.33 92.03 92.75 91.67
Total 100.00 100.00 100.00 100.00 100.00
1st Mtg Production Channel MixRetail/Direct Marketing 33.14 100.00 75.53 6.62 84.37Wholesale/Broker and Correspondent 66.86 0.00 24.47 93.38 15.63
Total 100.00 100.00 100.00 100.00 100.00
1st Mtg Purchase vs RefiPurchase 62.90 74.91 67.17 59.33 71.20Refinancing 37.10 25.09 32.83 40.67 28.80
Rate‐Term 15.89 10.27 13.76 19.65 12.17Cash‐Out 21.21 14.36 17.54 20.19 15.82Other / Unknown 0.46 1.52 0.83 0.81
Total 100.00 100.00 100.00 100.00 100.00
1st Mtg FICO Score DistributionEquals 600 or less 2.62 0.89 2.58 3.49 1.63Greater than 600, less than or equal to 650 14.45 9.23 12.47 10.68 10.35Greater than 650, less than or equal to 700 25.25 20.37 23.44 22.62 21.51Greater than 700, less than or equal to 750 24.80 27.27 26.66 25.54 26.94Greater than 750 32.88 42.23 34.85 37.66 39.56
Total 100.00 100.00 100.00 100.00 100.00
1st Mtg Simple Average FICO (based on #) 705 727 714 719 722
1st Mtg LTV DistributionEquals 60% of less 10.86 8.98 9.44 11.80 9.36Greater than 60%, less than or equal to 70% 9.15 7.56 8.21 9.25 7.90Greater than 70%, less than or equal to 80% 28.70 28.35 25.41 23.56 27.03Greater than 80%, less than or equal to 90% 10.27 13.73 13.04 12.49 13.41Greater than 90%, less than or equal to 100% 38.62 40.10 40.25 37.08 39.90Greater than 100% 2.40 1.28 3.64 5.81 2.39
Total 100.00 100.00 100.00 100.00 100.001st Mtg Average LTV (based on $) 82.69 81.85 82.91 82.80 82.26
1st Mtg Production Sold by Investor TypeOriginated for Portfolio 0.18 0.06 0.16 0.14Originated for Sale to Others: 100.00 99.82 99.94 99.84 99.86Sale to Fannie/Freddie/Ginnie 18.58 24.77 42.66 64.26 33.85All Other Sale to Others 81.42 75.05 57.28 35.58 66.00
Total 100.00 100.00 100.00 100.00 100.001st Mtg Servicing Released vs RetainedServicing Released 81.42 84.69 68.13 53.85 77.38Servicing Retained 18.58 15.31 31.87 46.15 22.62
Total 100.00 100.00 100.00 100.00 100.00
Number of Companies Reporting 1 208 104 30 343
QUARTERLY MORTGAGE BANKERS PERFORMANCE REPORT | Q1 2018 Results from the Mortgage Bankers Association© Mortgage Bankers Association 2018. All rights reserved. 14

QUARTER 1, 2018
Quarterly Mortgage Bankers Performance ReportResidential Loan Production ‐ by Retail/Consumer Direct vs Wholesale Production Mix in DollarD4 ‐ Production Mix (#), Simple Average
PERCENT BASED ON # Your Firm
100%
Retail/CD
Mixed Retail/
Wholesale
75% or More
Wholesale TotalAvg. Total Loans Originated ($000s) 282,960 234,084 921,669 312,826 449,801 Avg. Total Loans Originated (#) 1,175 941 3,835 1,463 1,866Average Loan Balance 240,612 249,469 240,945 225,773 244,722
Production Mix by Product TypeFirst Mortgages: 99.51 97.64 97.77 96.77 97.61Government (FHA/VA/RHS) ‐ Fixed 44.97 31.81 38.59 34.47 34.13Government (FHA/VA/RHS) ‐ ARM 0.16 0.53 0.75 1.85 0.71Prime (Conforming) ‐ Fixed 53.56 59.72 54.79 53.37 57.66Prime (Conforming) ‐ ARM 0.25 1.74 0.78 0.21 1.31Prime (Non‐Conforming Jumbo) ‐ Fixed 0.50 1.97 1.58 2.15 1.86Prime (Non‐Conforming Jumbo) ‐ ARM 0.08 0.74 0.44 0.06 0.58Other Fixed 0.98 0.44 2.73 0.96Other ARM 0.15 0.39 1.93 0.38
Closed‐End Second Mortgages 1.46 1.11 3.07 1.49Funded HELOCs 0.25 0.12 0.00 0.19Reverse 0.49 0.36 0.88 0.14 0.50Other 0.29 0.11 0.02 0.21
Total 100.00 100.00 100.00 100.00 100.00
1st Mtg Fixed Rate vs ARMFixed Rate 99.48 96.79 97.59 95.95 96.97ARM 0.52 3.21 2.41 4.05 3.03
Total 100.00 100.00 100.00 100.00 100.00
1st Mtg Jumbo vs. Non‐JumboJumbo 0.59 4.75 4.46 3.55 4.55Non‐Jumbo 99.41 95.25 95.54 96.45 95.45
Total 100.00 100.00 100.00 100.00 100.00
1st Mtg Production Channel MixRetail/Direct Marketing 40.92 100.00 76.18 7.65 84.66Wholesale/Broker and Correspondent 59.08 0.00 23.82 92.35 15.34
Total 100.00 100.00 100.00 100.00 100.00
1st Mtg Purchase vs RefiPurchase 66.08 75.02 67.88 60.72 71.61Refinancing 33.92 24.98 32.12 39.28 28.39
Rate‐Term 13.84 10.03 13.28 18.74 11.79Cash‐Out 20.08 14.45 17.30 19.81 15.77Other / Unknown 0.50 1.54 0.73 0.83
Total 100.00 100.00 100.00 100.00 100.001st Mtg FICO Score DistributionEquals 600 or less 2.89 0.97 2.87 3.48 1.77Greater than 600, less than or equal to 650 17.33 10.29 14.04 12.03 11.59Greater than 650, less than or equal to 700 27.91 21.79 24.94 23.93 22.94Greater than 700, less than or equal to 750 23.39 26.80 26.02 24.80 26.39Greater than 750 28.48 40.15 32.13 35.75 37.31
Total 100.00 100.00 100.00 100.00 100.00
1st Mortgage Simple Average FICO (based on #) 705 727 714 719 722
1st Mtg LTV DistributionEquals 60% of less 10.77 10.74 11.37 13.48 11.16Greater than 60%, less than or equal to 70% 8.04 7.27 7.58 8.74 7.49Greater than 70%, less than or equal to 80% 25.46 26.42 23.27 22.14 25.07Greater than 80%, less than or equal to 90% 9.49 12.67 12.16 11.91 12.45Greater than 90%, less than or equal to 100% 43.14 41.34 41.65 37.56 41.13Greater than 100% 3.10 1.56 3.98 6.16 2.70
Total 100.00 100.00 100.00 100.00 100.00
1st Mtg Average LTV (based on $) 83.69 81.85 82.91 82.80 82.261st Mtg Production Sold by Investor TypeOriginated for Portfolio 0.13 0.03 0.13 0.10Originated for Sale to Others: 100.00 99.87 99.97 99.87 99.90Sale to Fannie/Freddie/Ginnie 19.82 25.63 44.16 65.44 34.95All Other Sale to Others 80.18 74.24 55.81 34.43 64.95
Total 100.00 100.00 100.00 100.00 100.001st Mtg Servicing Released vs RetainedServicing Released 73.79 84.51 67.13 53.45 76.92Servicing Retained 26.21 15.49 32.87 46.55 23.08
Total 100.00 100.00 100.00 100.00 100.00
Number of Companies Reporting 1 208 104 30 343
QUARTERLY MORTGAGE BANKERS PERFORMANCE REPORT | Q1 2018 Results from the Mortgage Bankers Association© Mortgage Bankers Association 2018. All rights reserved. 15

QUARTER 1, 2018
Quarterly Mortgage Bankers Performance ReportResidential Loan Production ‐ by Retail/Consumer Direct vs Wholesale Production Mix in DollarD5 ‐ Production Mix (Avg Loan Balances), Simple Average
LOAN BALANCES Your Firm
100%
Retail/CD
Mixed Retail/
Wholesale
75% or More
Wholesale TotalAvg. Total Loans Originated ($000s) 282,960 234,084 921,669 312,826 449,801 Avg. Total Loans Originated (#) 1,175 941 3,835 1,463 1,866Average Loan Balance 240,612 249,469 240,945 225,773 244,722
Production Mix by Product TypeFirst Mortgages: 240,882 253,839 245,203 230,091 249,041Government (FHA/VA/RHS) ‐ Fixed 214,564 239,951 225,479 200,272 231,950Government (FHA/VA/RHS) ‐ ARM 340,999 339,425 288,233 258,193 309,229Prime (Conforming) ‐ Fixed 257,086 243,153 237,691 220,199 239,414Prime (Conforming) ‐ ARM 351,666 321,121 338,505 353,089 328,025Prime (Non‐Conforming Jumbo) ‐ Fixed 690,832 687,584 692,911 711,453 690,655Prime (Non‐Conforming Jumbo) ‐ ARM 727,999 792,889 838,747 892,308 811,098Other Fixed 265,777 328,866 377,262 312,666Other ARM 309,046 607,611 441,561 451,921
Closed‐End Second Mortgages 34,651 24,117 71,342 32,296Funded HELOCs 103,363 142,767 118,961Reverse 176,199 182,490 164,312 147,864 174,752Other 186,183 141,218 176,250 170,973
1st Mtg Fixed Rate vs ARMFixed Rate 240,012 249,396 240,288 227,068 244,592ARM 410,832 467,073 478,994 420,330 468,381
1st Mtg Jumbo vs. Non‐JumboJumbo 696,142 687,644 699,882 668,666 690,816Non‐Jumbo 238,149 246,401 237,015 214,713 240,656
1st Mtg Production Channel MixRetail/Direct Marketing 195,227 253,839 242,726 194,571 246,631Wholesale/Broker and Correspondent 272,493 259,282 233,429 253,494
1st Mtg Purchase vs RefiPurchase 229,321 254,776 245,516 222,140 249,006Refinancing 263,437 253,521 254,310 235,228 252,080
Rate‐Term 276,369 263,928 261,932 237,054 260,749Cash‐Out 254,522 249,231 251,052 237,655 248,734Other / Unknown 207,125 332,903 259,674 282,816
1st Mtg FICO Score DistributionEquals 600 or less 216,823 219,313 211,073 201,541 214,783Greater than 600, less than or equal to 650 200,896 223,826 217,811 191,647 219,010Greater than 650, less than or equal to 700 217,641 236,392 230,566 213,307 232,522Greater than 700, less than or equal to 750 255,437 257,389 251,781 237,646 253,865Greater than 750 278,579 266,273 269,704 243,217 265,166
1st Mtg LTV DistributionEquals 60% of less 243,332 213,595 204,582 197,234 209,341Greater than 60%, less than or equal to 70% 274,000 263,962 267,484 241,143 262,973Greater than 70%, less than or equal to 80% 271,737 271,880 268,121 238,137 267,697Greater than 80%, less than or equal to 90% 260,693 274,294 263,368 241,025 267,943Greater than 90%, less than or equal to 100% 215,662 246,315 236,521 217,133 240,650Greater than 100% 182,296 192,070 188,502 176,090 189,346
1st Mtg Production Sold by Investor TypeOriginated for Portfolio 333,818 277,892 448,500 327,333Originated for Sale to Others: 240,887 251,853 240,120 234,571 246,535Sale to Fannie/Freddie/Ginnie 226,008 213,959 226,756 204,913 217,320All Other Sale to Others 244,563 264,414 266,174 266,954 265,049
1st Mtg Servicing Released vs RetainedServicing Released 265,793 258,417 271,898 251,836 262,296Servicing Retained 170,794 263,101 235,389 235,656 249,546
Number of Companies Reporting 1 208 104 30 343
QUARTERLY MORTGAGE BANKERS PERFORMANCE REPORT | Q1 2018 Results from the Mortgage Bankers Association© Mortgage Bankers Association 2018. All rights reserved. 16

QUARTER 1, 2018
Quarterly Mortgage Bankers Performance ReportResidential Loan Production ‐ Historical Retail/Consumer Direct Production Only CompaniesE1 ‐ Net Loan Production Income and Expense, $ per loan, Simple Average
Your Firm All Firms Previous Qtr. Previous Yr. Repeater Repeater YTD$ PER LOAN Q1 2018 Q1 2018 Q4 2017 Q1 2017 Q1 2018 Q4 2017 2018
ORIGINATION‐RELATED INCOMELoan Origination Fees 91 1,291 1,218 1,175 1,279 1,189 1,291 Correspondent and Broker Fee Income (1) ‐ ‐ ‐ ‐ ‐ ‐ Other Origination‐Related Income (2) 1,202 608 589 498 653 565 608 Total Origination‐Related Income 1,293 1,899 1,807 1,672 1,933 1,754 1,899
NET INTEREST INCOMEWarehousing Income 645 507 495 482 516 500 507 Warehousing Expense 659 449 429 391 456 438 449
Net Interest Income (14) 58 66 92 60 63 58
SECONDARY MARKETING INCOMESecondary Mktg Gains (Losses) 7,614 5,082 5,058 5,553 5,105 4,958 5,082 Capitalized Servicing/Svg Released Premiums 397 2,711 2,573 2,558 2,732 2,572 2,711 Repurchase Reserve Provision ‐ (39) (44) (35) (40) (44) (39)
Net Secondary Marketing Income 8,011 7,754 7,588 8,076 7,797 7,486 7,754
Total Loan Production Revenue 9,290 9,711 9,460 9,840 9,789 9,303 9,711
EXPENSESPersonnel 4,920 6,362 6,022 6,177 6,389 5,905 6,362 Sales Personnel 2,382 2,724 2,798 2,631 2,749 2,780 2,724 Fulfillment Personnel 1,220 1,481 1,408 1,506 1,516 1,330 1,481 Production Support Employees 246 731 648 691 716 637 731 Management and Directors 216 534 548 500 500 536 534 Benefits 856 892 621 849 907 622 892
Occupancy and Equipment 587 566 489 549 573 480 566 Technology‐Related Expenses 241 236 197 204 243 197 236 Other Direct Expenses 2,949 1,866 1,791 1,889 1,806 1,709 1,866 Outsourcing and Professional fees 874 349 289 329 348 282 349 Other Operating Expenses 2,075 1,516 1,502 1,560 1,458 1,427 1,516
Direct Loan Production Expenses 8,697 9,030 8,499 8,820 9,010 8,291 9,030
Corporate Allocation 542 534 547 610 567 516 534
Total Loan Production Expense 9,253 9,564 9,046 9,431 9,577 8,807 9,564
TOTAL NET PRODUCTION INCOME 37 148 414 409 212 496 148
MEMO ITEMSOriginations Volume:Avg. Total Loans Originated ($000s) 282,962 234,084 311,423 282,340 243,111 297,986 234,084 Avg. Total Loans Originated (#) 1,174 941 1,227 1,151 977 1,195 941 Average Loan Balance ($) 240,605 249,469 253,779 240,505 250,115 249,580 249,469 Avg. Pull‐Through (Closings/Applications #) 48.29 70.30 78.80 70.17 70.73 79.22 70.30
Average Days in Warehouse 19 16 17 17 16 17 16
Employees:Total Production FTEs (excluding 0 reporters) 287 272 271 285 269 268 272
ProductivitySimple Avg.Closings per Sales Employee per Mo. 3.2 4.0 4.7 4.0 4.1 4.8 4.0Closings per Fulfillment Employee per Mo. 3.4 4.5 5.7 4.4 4.4 5.7 4.5Closings per Prod Support Employee per Mo. 14.3 10.6 12.7 11.9 10.6 12.9 10.6Closings per Total Prod. Employee per Mo. 1.2 1.5 1.7 1.5 1.5 1.8 1.5
Weighted Avg.Closings per Sales Employee per Mo. 3.1 2.7 3.5 3.2 2.8 3.5 2.7Closings per Fulfillment Employee per Mo. 3.3 3.4 4.4 3.6 3.6 4.3 3.4Closings per Prod Support Employee per Mo. 14.3 7.4 9.4 7.9 7.7 9.3 7.4Closings per Total Prod. Employee per Mo. 1.5 1.2 1.5 1.3 1.2 1.5 1.2
MedianClosings per Sales Employee per Mo. 3.2 3.0 3.9 3.3 3.0 3.9 3.0Closings per Fulfillment Employee per Mo. 3.4 3.6 4.5 3.6 3.7 4.6 3.6Closings per Prod Support Employee per Mo. 14.4 8.0 9.8 8.0 8.0 10.0 8.0Closings per Total Prod. Employee per Mo. 1.2 1.3 1.6 1.3 1.3 1.6 1.3
Number of Companies Reporting 1 208 211 209 182 182 208
(1) Correspondent and Broker Income: Fee income earned on loans acquired from correspondents and brokers(2) Other Originations Income: Underwriting, processing, administration and other fees
QUARTERLY MORTGAGE BANKERS PERFORMANCE REPORT | Q1 2018 Results from the Mortgage Bankers Association© Mortgage Bankers Association 2018. All rights reserved. 17

QUARTER 1, 2018
Quarterly Mortgage Bankers Performance ReportResidential Loan Production ‐ Historical Retail/Consumer Direct Production Only CompaniesE2 ‐ Net Loan Production Income and Expense, Basis Points, Simple Average
Your Firm All Firms Previous Qtr. Previous Yr. Repeater Repeater YTDBASIS POINTS Q1 2018 Q1 2018 Q4 2017 Q1 2017 Q1 2018 Q4 2017 2018
ORIGINATION‐RELATED INCOMELoan Origination Fees 3.81 56.30 52.44 52.76 57.73 53.48 56.30 Correspondent and Broker Fee Income (1) ‐ ‐ ‐ ‐ ‐ ‐ Other Origination‐Related Income (2) 41.69 24.83 23.55 21.43 27.09 23.31 24.83 Total Origination‐Related Income 45.50 81.13 76.00 74.18 84.82 76.79 81.13
NET INTEREST INCOMEWarehousing Income 26.07 20.15 19.55 20.16 20.24 19.83 20.15 Warehousing Expense 25.49 18.12 17.22 16.46 18.21 17.63 18.12
Net Interest Income 0.58 2.04 2.34 3.70 2.03 2.20 2.04
SECONDARY MARKETING INCOMESecondary Mktg Gains (Losses) 311.94 205.60 207.06 240.37 206.94 203.39 205.60 Capitalized Servicing/Svg Released Premiums 18.68 110.37 103.13 108.01 109.98 104.18 110.37 Repurchase Reserve Provision ‐ (1.51) (1.71) (1.56) (1.53) (1.74) (1.51)
Net Secondary Marketing Income 330.62 314.46 308.48 346.82 315.39 305.82 314.46
Total Loan Production Revenue 376.70 397.63 386.81 424.70 402.25 384.81 397.63
EXPENSESPersonnel 199.83 262.17 247.64 266.53 263.42 245.31 262.17 Sales Personnel 98.09 111.04 113.69 111.92 112.61 114.73 111.04 Fulfillment Personnel 49.93 62.37 59.25 66.04 63.55 56.01 62.37 Production Support Employees 9.60 29.61 25.98 29.67 29.07 25.67 29.61 Management and Directors 7.80 21.77 22.79 21.92 20.49 22.64 21.77 Benefits 34.41 37.38 25.93 36.98 37.70 26.25 37.38
Occupancy and Equipment 23.49 23.12 20.14 23.63 23.55 19.96 23.12 Technology‐Related Expenses 8.97 10.09 8.30 8.92 10.46 8.43 10.09 Other Direct Expenses 120.74 78.18 74.65 82.93 76.65 72.23 78.18 Outsourcing and Professional fees 35.26 14.14 11.72 14.01 14.00 11.71 14.14 Other Operating Expenses 85.48 64.05 62.93 68.92 62.65 60.52 64.05
Direct Loan Production Expenses 353.03 373.56 350.73 382.02 374.08 345.93 373.56
Corporate Allocation 21.73 21.67 21.49 25.03 22.79 20.96 21.67
Total Loan Production Expense 374.76 395.24 372.22 407.05 396.87 366.89 395.24
TOTAL NET PRODUCTION INCOME 1.94 2.40 14.59 17.65 5.38 17.92 2.40
MEMO ITEMSOriginations Volume:Avg. Total Loans Originated ($000s) 282,960 234,084 311,423 282,340 243,111 297,986 234,084 Avg. Total Loans Originated (#) 1,175 941 1,227 1,151 977 1,195 941 Average Loan Balance ($) 240,612 249,469 253,779 240,505 250,115 249,580 249,469 Avg. Pull‐Through (Closings/Applications #) 48.29 70.30 78.80 70.17 70.73 79.22 70.30
Average Days in Warehouse 19 16 17 17 16 17 16
Employees:Total Production FTEs (excluding 0 reporters) 289 272 271 285 269 268 272
ProductivitySimple Avg.Closings per Sales Employee per Mo. 3.2 4.0 4.7 4.0 4.1 4.8 4.0Closings per Fulfillment Employee per Mo. 3.4 4.5 5.7 4.4 4.4 5.7 4.5Closings per Prod Support Employee per Mo. 14.4 10.6 12.7 11.9 10.6 12.9 10.6Closings per Total Prod. Employee per Mo. 1.3 1.5 1.7 1.5 1.5 1.8 1.5
Weighted Avg.Closings per Sales Employee per Mo. 3.2 2.7 3.5 3.2 2.8 3.5 2.7Closings per Fulfillment Employee per Mo. 3.4 3.4 4.4 3.6 3.6 4.3 3.4Closings per Prod Support Employee per Mo. 14.4 7.4 9.4 7.9 7.7 9.3 7.4Closings per Total Prod. Employee per Mo. 1.3 1.2 1.5 1.3 1.2 1.5 1.2
MedianClosings per Sales Employee per Mo. 3.2 3.0 3.9 3.3 3.0 3.9 3.0Closings per Fulfillment Employee per Mo. 3.4 3.6 4.5 3.6 3.7 4.6 3.6Closings per Prod Support Employee per Mo. 14.4 8.0 9.8 8.0 8.0 10.0 8.0Closings per Total Prod. Employee per Mo. 1.3 1.3 1.6 1.3 1.3 1.6 1.3
Number of Companies Reporting 1 208 211 209 182 182 208
(1) Correspondent and Broker Income: Fee income earned on loans acquired from correspondents and brokers(2) Other Originations Income: Underwriting, processing, administration and other fees
QUARTERLY MORTGAGE BANKERS PERFORMANCE REPORT | Q1 2018 Results from the Mortgage Bankers Association© Mortgage Bankers Association 2018. All rights reserved. 18

QUARTER 1, 2018
Quarterly Mortgage Bankers Performance ReportResidential Loan Production ‐ Historical Retail/Consumer Direct Production Only CompaniesE3 ‐ Production Mix ($), Simple Average
Your Firm All Firms Previous Qtr. Previous Yr. Repeater Repeater YTDPERCENT BASED ON $ Q1 2018 Q1 2018 Q4 2017 Q1 2017 Q1 2018 Q4 2017 2018Avg. Total Loans Originated ($000s) 282,960 234,084 311,423 282,340 243,111 297,986 234,084 Avg. Total Loans Originated (#) 1,175 941 1,227 1,151 977 1,195 941Average Loan Balance 240,612 249,469 253,779 240,505 250,115 249,580 249,469
Production Mix by Product TypeFirst Mortgages: 99.63 99.28 98.94 99.02 99.40 99.01 99.28Government (FHA/VA/RHS) ‐ Fixed 40.10 30.56 30.57 33.09 29.38 30.01 30.56Government (FHA/VA/RHS) ‐ ARM 0.23 0.54 0.09 0.10 0.57 0.09 0.54Prime (Conforming) ‐ Fixed 57.23 58.52 57.72 54.33 59.55 58.39 58.52Prime (Conforming) ‐ ARM 0.36 1.98 1.86 2.77 2.07 1.81 1.98Prime (Non‐Conforming Jumbo) ‐ Fixed 1.45 4.47 5.31 5.03 4.82 5.40 4.47Prime (Non‐Conforming Jumbo) ‐ ARM 0.25 2.00 2.56 2.61 2.08 2.37 2.00Other Fixed 1.01 0.72 0.85 0.82 0.82 1.01Other ARM 0.20 0.11 0.25 0.12 0.12 0.20
Closed‐End Second Mortgages 0.13 0.13 0.16 0.13 0.14 0.13Funded HELOCs 0.11 0.13 0.24 0.12 0.13 0.11Reverse 0.37 0.28 0.78 0.55 0.30 0.71 0.28Other 0.20 0.01 0.03 0.04 0.01 0.20
Total 100.00 100.00 100.00 100.00 100.00 100.00 100.00
1st Mtg Fixed Rate vs ARMFixed Rate 99.12 95.27 95.34 94.21 95.14 95.59 95.27ARM 0.88 4.73 4.66 5.79 4.86 4.41 4.73
Total 100.00 100.00 100.00 100.00 100.00 100.00 100.00
1st Mtg Jumbo vs. Non‐JumboJumbo 1.74 8.67 8.62 9.07 9.16 8.56 8.67Non‐Jumbo 98.26 91.33 91.38 90.93 90.84 91.44 91.33
Total 100.00 100.00 100.00 100.00 100.00 100.00 100.00
1st Mtg Production Channel MixRetail/Direct Marketing 33.14 100.00 100.00 100.00 100.00 100.00 100.00Wholesale/Broker and Correspondent 66.86 0.00 0.00 0.00 0.00 0.00 0.00
Total 100.00 100.00 100.00 100.00 100.00 100.00 100.00
1st Mtg Purchase vs RefiPurchase 62.90 74.91 73.63 71.57 75.64 74.99 74.91Refinancing 37.10 25.09 26.37 28.43 24.36 25.01 25.09
Rate‐Term 15.89 10.27 10.81 12.57 9.55 10.16 10.27Cash‐Out 21.21 14.36 15.11 14.95 14.29 14.41 14.36Other / Unknown 0.46 0.45 0.91 0.52 0.44 0.46
Total 100.00 100.00 100.00 100.00 100.00 100.00 100.00
1st Mtg FICO Score DistributionEquals 600 or less 2.62 0.89 0.91 1.02 0.78 0.76 0.89Greater than 600, less than or equal to 650 14.45 9.23 9.24 9.41 9.11 8.95 9.23Greater than 650, less than or equal to 700 25.25 20.37 20.68 21.60 19.87 20.47 20.37Greater than 700, less than or equal to 750 24.80 27.27 26.79 26.93 27.31 26.80 27.27Greater than 750 32.88 42.23 42.39 41.05 42.93 43.02 42.23
Total 100.00 100.00 100.00 100.00 100.00 100.00 100.001st Mtg Simple Average FICO (based on #) 705 727 727 724 728 728 7271st Mtg LTV DistributionEquals 60% of less 10.86 8.98 9.29 9.58 9.23 8.97 8.98Greater than 60%, less than or equal to 70% 9.15 7.56 7.93 7.96 7.77 7.79 7.56Greater than 70%, less than or equal to 80% 28.70 28.35 29.42 28.00 28.66 29.84 28.35Greater than 80%, less than or equal to 90% 10.27 13.73 13.48 13.64 13.51 13.36 13.73Greater than 90%, less than or equal to 100% 38.62 40.10 38.43 39.46 39.77 38.79 40.10Greater than 100% 2.40 1.28 1.45 1.35 1.07 1.25 1.28
Total 100.00 100.00 100.00 100.00 100.00 100.00 100.001st Mtg Average LTV (based on $) 82.69 81.85 80.83 81.59 81.54 81.12 81.85
1st Mtg Production Sold by Investor TypeOriginated for Portfolio 0.18 0.07 0.05 0.20 0.08 0.18Originated for Sale to Others: 100.00 99.82 99.93 99.95 99.80 99.92 99.82Sale to Fannie/Freddie/Ginnie 18.58 24.77 24.23 28.51 23.33 23.03 24.77All Other Sale to Others 81.42 75.05 75.69 71.44 76.47 76.88 75.05
Total 100.00 100.00 100.00 100.00 100.00 100.00 100.001st Mtg Servicing Released vs RetainedServicing Released 81.42 84.69 84.01 81.62 85.75 84.47 84.69Servicing Retained 18.58 15.31 15.99 18.38 14.25 15.53 15.31
Total 100.00 100.00 100.00 100.00 100.00 100.00 100.00
Number of Companies Reporting 1 208 211 209 182 182 208
QUARTERLY MORTGAGE BANKERS PERFORMANCE REPORT | Q1 2018 Results from the Mortgage Bankers Association© Mortgage Bankers Association 2018. All rights reserved. 19

QUARTER 1, 2018
Quarterly Mortgage Bankers Performance ReportResidential Loan Production ‐ Historical Retail/Consumer Direct Production Only CompaniesE4 ‐ Production Mix (#), Simple Average
Your Firm All Firms Previous Qtr. Previous Yr. Repeater Repeater YTDPERCENT BASED ON # Q1 2018 Q1 2018 Q4 2017 Q1 2017 Q1 2018 Q4 2017 2018Avg. Total Loans Originated ($000s) 282,960 234,084 311,423 282,340 243,111 297,986 234,084 Avg. Total Loans Originated (#) 1,175 941 1,227 1,151 977 1,195 941Average Loan Balance 240,612 249,469 253,779 240,505 250,115 249,580 249,469
Production Mix by Product TypeFirst Mortgages: 99.51 97.64 97.15 97.15 97.78 97.27 97.64Government (FHA/VA/RHS) ‐ Fixed 44.97 31.81 31.76 34.59 30.62 31.12 31.81Government (FHA/VA/RHS) ‐ ARM 0.16 0.53 0.08 0.08 0.57 0.08 0.53Prime (Conforming) ‐ Fixed 53.56 59.72 59.46 56.00 60.95 60.23 59.72Prime (Conforming) ‐ ARM 0.25 1.74 1.60 2.13 1.85 1.58 1.74Prime (Non‐Conforming Jumbo) ‐ Fixed 0.50 1.97 2.38 2.24 2.14 2.40 1.97Prime (Non‐Conforming Jumbo) ‐ ARM 0.08 0.74 1.05 1.09 0.78 0.93 0.74Other Fixed 0.98 0.73 0.85 0.79 0.84 0.98Other ARM 0.15 0.10 0.17 0.08 0.11 0.15
Closed‐End Second Mortgages 1.46 1.53 1.50 1.46 1.55 1.46Funded HELOCs 0.25 0.30 0.60 0.28 0.29 0.25Reverse 0.49 0.36 0.94 0.62 0.39 0.80 0.36Other 0.29 0.08 0.12 0.09 0.09 0.29
Total 100.00 100.00 100.00 100.00 100.00 100.00 100.00
1st Mtg Fixed Rate vs ARMFixed Rate 99.48 96.79 97.12 96.39 96.67 97.26 96.79ARM 0.52 3.21 2.88 3.61 3.33 2.74 3.21
Total 100.00 100.00 100.00 100.00 100.00 100.00 100.00
1st Mtg Jumbo vs. Non‐JumboJumbo 0.59 4.75 3.84 4.35 5.13 3.76 4.75Non‐Jumbo 99.41 95.25 96.16 95.65 94.87 96.24 95.25
Total 100.00 100.00 100.00 100.00 100.00 100.00 100.00
1st Mtg Production Channel MixRetail/Direct Marketing 40.92 100.00 100.00 100.00 100.00 100.00 100.00Wholesale/Broker and Correspondent 59.08 0.00 0.00 0.00 0.00 0.00 0.00
Total 100.00 100.00 100.00 100.00 100.00 100.00 100.00
1st Mtg Purchase vs RefiPurchase 66.08 75.02 73.91 71.58 75.77 75.40 75.02Refinancing 33.92 24.98 26.09 28.42 24.23 24.60 24.98
Rate‐Term 13.84 10.03 10.32 12.29 9.33 9.52 10.03Cash‐Out 20.08 14.45 15.34 15.21 14.33 14.67 14.45Other / Unknown 0.50 0.43 0.92 0.57 0.41 0.50
Total 100.00 100.00 100.00 100.00 100.00 100.00 100.00
1st Mtg FICO Score DistributionEquals 600 or less 2.89 0.97 0.99 1.09 0.86 0.86 0.97Greater than 600, less than or equal to 650 17.33 10.29 10.43 10.42 10.17 10.09 10.29Greater than 650, less than or equal to 700 27.91 21.79 22.02 23.05 21.37 21.88 21.79Greater than 700, less than or equal to 750 23.39 26.80 26.30 26.41 26.72 26.31 26.80Greater than 750 28.48 40.15 40.27 39.04 40.89 40.87 40.15
Total 100.00 100.00 100.00 100.00 100.00 100.00 100.001st Mortgage Simple Average FICO (based on #) 705 727 727 724 728 728 7271st Mtg LTV DistributionEquals 60% of less 10.77 10.74 11.23 11.43 11.05 10.95 10.74Greater than 60%, less than or equal to 70% 8.04 7.27 7.56 7.58 7.47 7.43 7.27Greater than 70%, less than or equal to 80% 25.46 26.42 27.25 25.93 26.73 27.59 26.42Greater than 80%, less than or equal to 90% 9.49 12.67 12.42 12.65 12.44 12.28 12.67Greater than 90%, less than or equal to 100% 43.14 41.34 39.75 40.81 40.95 40.23 41.34Greater than 100% 3.10 1.56 1.79 1.60 1.35 1.52 1.56
Total 100.00 100.00 100.00 100.00 100.00 100.00 100.001st Mtg Average LTV (based on $) 83.69 81.85 80.83 81.59 81.54 81.12 81.85
1st Mtg Production Sold by Investor TypeOriginated for Portfolio 0.13 0.06 0.05 0.14 0.07 0.13Originated for Sale to Others: 100.00 99.87 99.94 99.95 99.86 99.93 99.87Sale to Fannie/Freddie/Ginnie 19.82 25.63 25.64 29.79 24.22 24.50 25.63All Other Sale to Others 80.18 74.24 74.30 70.16 75.64 75.43 74.24
Total 100.00 100.00 100.00 100.00 100.00 100.00 100.001st Mtg Servicing Released vs RetainedServicing Released 73.79 84.51 83.96 81.25 85.49 84.33 84.51Servicing Retained 26.21 15.49 16.04 18.75 14.51 15.67 15.49
Total 100.00 100.00 100.00 100.00 100.00 100.00 100.00
Number of Companies Reporting 1 208 211 209 182 182 208
QUARTERLY MORTGAGE BANKERS PERFORMANCE REPORT | Q1 2018 Results from the Mortgage Bankers Association© Mortgage Bankers Association 2018. All rights reserved. 20

QUARTER 1, 2018
Quarterly Mortgage Bankers Performance ReportResidential Loan Production ‐ Historical Retail/Consumer Direct Production Only CompaniesE5 ‐ Production Mix (Avg Loan Balances), Simple Average
Your Firm All Firms Previous Qtr. Previous Yr. Repeater Repeater YTDLOAN BALANCES Q1 2018 Q1 2018 Q4 2017 Q1 2017 Q1 2018 Q4 2017 2018Avg. Total Loans Originated ($000s) 282,960 234,084 311,423 282,340 243,111 297,986 234,084 Avg. Total Loans Originated (#) 1,175 941 1,227 1,151 977 1,195 941Average Loan Balance 240,612 249,469 253,779 240,505 250,115 249,580 249,469
Production Mix by Product TypeFirst Mortgages: 240,882 253,839 258,825 245,916 254,367 254,133 253,839Government (FHA/VA/RHS) ‐ Fixed 214,564 239,951 239,860 228,028 240,540 240,189 239,951Government (FHA/VA/RHS) ‐ ARM 340,999 339,425 339,631 335,100 346,048 344,071 339,425Prime (Conforming) ‐ Fixed 257,086 243,153 243,653 231,116 242,854 239,673 243,153Prime (Conforming) ‐ ARM 351,666 321,121 329,995 318,350 315,056 323,512 321,121Prime (Non‐Conforming Jumbo) ‐ Fixed 690,832 687,584 692,392 669,890 683,711 686,440 687,584Prime (Non‐Conforming Jumbo) ‐ ARM 727,999 792,889 754,264 773,225 784,057 755,294 792,889Other Fixed 265,777 256,553 201,579 261,289 253,265 265,777Other ARM 309,046 364,260 410,474 314,360 309,722 309,046
Closed‐End Second Mortgages 34,651 40,701 39,134 34,174 40,172 34,651Funded HELOCs 103,363 146,141 107,348 104,991 133,383 103,363Reverse 176,199 182,490 179,831 203,178 177,018 176,098 182,490Other 186,183 128,692 239,758 206,403 128,692 186,183
1st Mtg Fixed Rate vs ARMFixed Rate 240,012 249,396 252,122 238,207 249,926 248,948 249,396ARM 410,832 467,073 467,717 438,161 467,546 459,969 467,073
1st Mtg Jumbo vs. Non‐JumboJumbo 696,142 687,644 687,365 676,764 683,173 681,226 687,644Non‐Jumbo 238,149 246,401 241,785 233,138 247,209 238,699 246,401
1st Mtg Production Channel MixRetail/Direct Marketing 195,227 253,839 258,825 245,845 254,367 254,133 253,839Wholesale/Broker and Correspondent 272,493
1st Mtg Purchase vs RefiPurchase 229,321 254,776 259,691 249,187 255,271 253,510 254,776Refinancing 263,437 253,521 264,368 247,102 253,969 260,911 253,521
Rate‐Term 276,369 263,928 282,501 259,152 263,551 281,340 263,928Cash‐Out 254,522 249,231 251,613 240,423 249,619 245,873 249,231Other / Unknown 207,125 247,440 192,006 202,070 239,440 207,125
1st Mtg FICO Score DistributionEquals 600 or less 216,823 219,313 222,343 213,146 216,342 217,230 219,313Greater than 600, less than or equal to 650 200,896 223,826 222,322 215,399 223,906 220,798 223,826Greater than 650, less than or equal to 700 217,641 236,392 241,314 229,827 237,134 236,579 236,392Greater than 700, less than or equal to 750 255,437 257,389 263,599 250,947 259,449 258,600 257,389Greater than 750 278,579 266,273 272,122 264,932 266,605 267,144 266,273
1st Mtg LTV DistributionEquals 60% of less 243,332 213,595 214,337 207,051 214,279 210,005 213,595Greater than 60%, less than or equal to 70% 274,000 263,962 273,460 260,854 264,373 269,822 263,962Greater than 70%, less than or equal to 80% 271,737 271,880 279,544 265,852 273,115 273,973 271,880Greater than 80%, less than or equal to 90% 260,693 274,294 279,287 264,023 274,665 275,007 274,294Greater than 90%, less than or equal to 100% 215,662 246,315 246,773 235,500 247,543 243,464 246,315Greater than 100% 182,296 192,070 233,461 190,046 193,042 237,703 192,070
1st Mtg Production Sold by Investor TypeOriginated for Portfolio 333,818 270,076 222,720 379,083 267,683 333,818Originated for Sale to Others: 240,887 251,853 253,812 241,660 252,447 250,471 251,853Sale to Fannie/Freddie/Ginnie 226,008 213,959 241,059 218,046 216,192 239,097 213,959All Other Sale to Others 244,563 264,414 281,750 284,453 264,171 278,181 264,414
1st Mtg Servicing Released vs RetainedServicing Released 265,793 258,417 275,486 252,281 258,402 274,170 258,417Servicing Retained 170,794 263,101 254,706 238,073 258,791 247,202 263,101
Number of Companies Reporting 1 208 211 209 182 182 208
QUARTERLY MORTGAGE BANKERS PERFORMANCE REPORT | Q1 2018 Results from the Mortgage Bankers Association© Mortgage Bankers Association 2018. All rights reserved. 21

QUARTER 1, 2018
Quarterly Mortgage Bankers Performance ReportResidential Loan Production ‐ Retail/Consumer Direct Production Only Companies by Production $F1 ‐ Net Loan Production Income and Expense, $ per loan, Simple Average
$ PER LOAN Your Firm <50M 50‐100M 100‐250M >250M Total YTD 2018
ORIGINATION‐RELATED INCOMELoan Origination Fees 91 1,562 1,296 1,409 927 1,291 1,291 Correspondent and Broker Fee Income (1) ‐ ‐ ‐ ‐ ‐ ‐ Other Origination‐Related Income (2) 1,202 699 562 617 559 608 608 Total Origination‐Related Income 1,293 2,261 1,858 2,026 1,486 1,899 1,899
NET INTEREST INCOMEWarehousing Income 645 406 466 538 586 507 507 Warehousing Expense 659 360 452 478 485 449 449
Net Interest Income (14) 46 15 60 102 58 58
SECONDARY MARKETING INCOMESecondary Mktg Gains (Losses) 7,614 3,201 5,035 5,236 6,481 5,082 5,082 Capitalized Servicing/Svg Released Premiums 397 2,649 2,551 2,903 2,666 2,711 2,711 Repurchase Reserve Provision ‐ (2) (43) (40) (64) (39) (39)
Net Secondary Marketing Income 8,011 5,848 7,543 8,099 9,083 7,754 7,754
Total Loan Production Revenue 9,290 8,154 9,416 10,184 10,671 9,711 9,711
EXPENSESPersonnel 4,920 5,715 6,271 6,509 6,792 6,362 6,362 Sales Personnel 2,382 2,146 2,574 2,870 3,147 2,724 2,724 Fulfillment Personnel 1,220 1,640 1,437 1,312 1,582 1,481 1,481 Production Support Employees 246 642 775 732 767 731 731 Management and Directors 216 491 603 643 389 534 534 Benefits 856 797 882 952 908 892 892
Occupancy and Equipment 587 542 534 560 619 566 566 Technology‐Related Expenses 241 218 248 257 215 236 236 Other Direct Expenses 2,949 1,973 1,917 1,803 1,810 1,866 1,866 Outsourcing and Professional fees 874 359 375 398 264 349 349 Other Operating Expenses 2,075 1,615 1,542 1,405 1,546 1,516 1,516
Direct Loan Production Expenses 8,697 8,449 8,970 9,128 9,437 9,030 9,030
Corporate Allocation 542 252 463 728 598 534 534
Total Loan Production Expense 9,253 8,701 9,433 9,856 10,035 9,564 9,564
TOTAL NET PRODUCTION INCOME 37 (546) (17) 329 636 148 148
MEMO ITEMSOriginations Volume:Avg. Total Loans Originated ($000s) 282,962 26,533 74,910 159,953 617,497 234,084 234,084 Avg. Total Loans Originated (#) 1,174 123 320 673 2,419 941 941 Average Loan Balance ($) 240,605 223,387 249,827 258,653 259,837 249,469 249,469 Avg. Pull‐Through (Closings/Applications #) 48.29 67.22 71.45 69.79 71.70 70.30 70.30
Average Days in Warehouse 19 13 15 17 17 16 16
Employees:Total Production FTEs (excluding 0 reporters) 287 37 139 220 626 272 272
ProductivitySimple Avg.Closings per Sales Employee per Mo. 3.2 3.7 3.8 4.7 3.6 4.0 4.0Closings per Fulfillment Employee per Mo. 3.4 4.5 5.0 4.5 4.3 4.5 4.5Closings per Prod Support Employee per Mo. 14.3 8.1 10.5 11.2 11.5 10.6 10.6Closings per Total Prod. Employee per Mo. 1.2 1.4 1.6 1.6 1.4 1.5 1.5
Weighted Avg.Closings per Sales Employee per Mo. 3.1 2.5 1.9 2.2 3.0 2.7 2.7Closings per Fulfillment Employee per Mo. 3.3 3.3 2.5 3.7 3.5 3.4 3.4Closings per Prod Support Employee per Mo. 14.3 4.7 4.3 6.9 8.4 7.4 7.4Closings per Total Prod. Employee per Mo. 1.5 1.1 0.8 1.0 1.3 1.2 1.2
MedianClosings per Sales Employee per Mo. 3.2 2.7 2.8 2.9 3.3 3.0 3.0Closings per Fulfillment Employee per Mo. 3.4 3.1 3.6 3.7 3.9 3.6 3.6Closings per Prod Support Employee per Mo. 14.4 6.0 8.9 7.2 10.5 8.0 8.0Closings per Total Prod. Employee per Mo. 1.2 1.0 1.4 1.3 1.3 1.3 1.3
Number of Companies Reporting 1 45 44 64 55 208 208
(1) Correspondent and Broker Income: Fee income earned on loans acquired from correspondents and brokers(2) Other Originations Income: Underwriting, processing, administration and other fees
QUARTERLY MORTGAGE BANKERS PERFORMANCE REPORT | Q1 2018 Results from the Mortgage Bankers Association© Mortgage Bankers Association 2018. All rights reserved. 22

QUARTER 1, 2018
Quarterly Mortgage Bankers Performance ReportResidential Loan Production ‐ Retail/Consumer Direct Production Only Companies by Production $F2 ‐ Net Loan Production Income and Expense, Basis Points, Simple Average
BASIS POINTS Your Firm <50M 50‐100M 100‐250M >250M Total YTD 2018
ORIGINATION‐RELATED INCOMELoan Origination Fees 3.81 78.67 49.84 59.56 39.38 56.30 56.30 Correspondent and Broker Fee Income (1) ‐ ‐ ‐ ‐ ‐ ‐ Other Origination‐Related Income (2) 41.69 33.23 21.41 24.45 21.14 24.83 24.83 Total Origination‐Related Income 45.50 111.90 71.25 84.02 60.52 81.13 81.13
NET INTEREST INCOMEWarehousing Income 26.07 18.76 18.87 20.42 22.01 20.15 20.15 Warehousing Expense 25.49 16.73 18.57 18.30 18.67 18.12 18.12
Net Interest Income 0.58 2.02 0.30 2.12 3.33 2.04 2.04
SECONDARY MARKETING INCOMESecondary Mktg Gains (Losses) 311.94 132.81 209.18 205.93 261.93 205.60 205.60 Capitalized Servicing/Svg Released Premiums 18.68 117.44 106.77 114.96 102.14 110.37 110.37 Repurchase Reserve Provision ‐ (0.09) (1.62) (1.62) (2.46) (1.51) (1.51)
Net Secondary Marketing Income 330.62 250.16 314.33 319.26 361.60 314.46 314.46
Total Loan Production Revenue 376.70 364.08 385.88 405.40 425.45 397.63 397.63
EXPENSESPersonnel 199.83 260.66 259.31 257.21 271.47 262.17 262.17 Sales Personnel 98.09 93.75 104.92 114.52 126.03 111.04 111.04 Fulfillment Personnel 49.93 75.07 58.91 54.15 64.33 62.37 62.37 Production Support Employees 9.60 29.58 33.21 26.78 30.06 29.61 29.61 Management and Directors 7.80 21.73 25.77 24.96 14.89 21.77 21.77 Benefits 34.41 40.53 36.50 36.80 36.16 37.38 37.38
Occupancy and Equipment 23.49 24.09 21.63 21.94 24.89 23.12 23.12 Technology‐Related Expenses 8.97 10.55 10.23 10.81 8.75 10.09 10.09 Other Direct Expenses 120.74 86.93 76.73 75.18 75.69 78.18 78.18 Outsourcing and Professional fees 35.26 16.51 14.08 15.49 10.67 14.14 14.14 Other Operating Expenses 85.48 70.42 62.65 59.70 65.02 64.05 64.05
Direct Loan Production Expenses 353.03 382.23 367.90 365.15 380.79 373.56 373.56
Corporate Allocation 21.73 13.81 19.15 27.63 23.19 21.67 21.67
Total Loan Production Expense 374.76 396.04 387.05 392.78 403.99 395.24 395.24
TOTAL NET PRODUCTION INCOME 1.94 (31.95) (1.17) 12.62 21.47 2.40 2.40
MEMO ITEMSOriginations Volume:Avg. Total Loans Originated ($000s) 282,960 26,533 74,910 159,953 617,497 234,084 234,084 Avg. Total Loans Originated (#) 1,175 123 320 673 2,419 941 941 Average Loan Balance ($) 240,612 223,387 249,827 258,653 259,837 249,469 249,469 Avg. Pull‐Through (Closings/Applications #) 48.29 67.22 71.45 69.79 71.70 70.30 70.30
Average Days in Warehouse 19 13 15 17 17 16 16
Employees:Total Production FTEs (excluding 0 reporters) 289 37 139 220 626 272 272
ProductivitySimple Avg.Closings per Sales Employee per Mo. 3.2 3.7 3.8 4.7 3.6 4.0 4.0Closings per Fulfillment Employee per Mo. 3.4 4.5 5.0 4.5 4.3 4.5 4.5Closings per Prod Support Employee per Mo. 14.4 8.1 10.5 11.2 11.5 10.6 10.6Closings per Total Prod. Employee per Mo. 1.3 1.4 1.6 1.6 1.4 1.5 1.5
Weighted Avg.Closings per Sales Employee per Mo. 3.2 2.5 1.9 2.2 3.0 2.7 2.7Closings per Fulfillment Employee per Mo. 3.4 3.3 2.5 3.7 3.5 3.4 3.4Closings per Prod Support Employee per Mo. 14.4 4.7 4.3 6.9 8.4 7.4 7.4Closings per Total Prod. Employee per Mo. 1.3 1.1 0.8 1.0 1.3 1.2 1.2
MedianClosings per Sales Employee per Mo. 3.2 2.7 2.8 2.9 3.3 3.0 3.0Closings per Fulfillment Employee per Mo. 3.4 3.1 3.6 3.7 3.9 3.6 3.6Closings per Prod Support Employee per Mo. 14.4 6.0 8.9 7.2 10.5 8.0 8.0Closings per Total Prod. Employee per Mo. 1.3 1.0 1.4 1.3 1.3 1.3 1.3
Number of Companies Reporting 1 45 44 64 55 208 208
(1) Correspondent and Broker Income: Fee income earned on loans acquired from correspondents and brokers(2) Other Originations Income: Underwriting, processing, administration and other fees
QUARTERLY MORTGAGE BANKERS PERFORMANCE REPORT | Q1 2018 Results from the Mortgage Bankers Association© Mortgage Bankers Association 2018. All rights reserved. 23

QUARTER 1, 2018
Quarterly Mortgage Bankers Performance ReportResidential Loan Production ‐ Retail/Consumer Direct Production Only Companies by Production $F3 ‐ Production Mix ($), Simple Average
PERCENT BASED ON $ Your Firm <50M 50‐100M 100‐250M >250M Total YTD 2018Avg. Total Loans Originated ($000s) 282,960 26,533 74,910 159,953 617,497 234,084 234,084 Avg. Total Loans Originated (#) 1,175 123 320 673 2,419 941 941Average Loan Balance 240,612 223,387 249,827 258,653 259,837 249,469 249,469
Production Mix by Product TypeFirst Mortgages: 99.63 99.17 98.71 99.56 99.49 99.28 99.28Government (FHA/VA/RHS) ‐ Fixed 40.10 29.40 29.07 30.09 33.25 30.56 30.56Government (FHA/VA/RHS) ‐ ARM 0.23 2.03 0.29 0.01 0.13 0.54 0.54Prime (Conforming) ‐ Fixed 57.23 60.23 61.88 56.83 56.40 58.52 58.52Prime (Conforming) ‐ ARM 0.36 1.84 2.34 2.46 1.24 1.98 1.98Prime (Non‐Conforming Jumbo) ‐ Fixed 1.45 1.99 3.43 6.21 5.32 4.47 4.47Prime (Non‐Conforming Jumbo) ‐ ARM 0.25 2.03 1.46 1.98 2.41 2.00 2.00Other Fixed 1.59 0.06 1.51 0.71 1.01 1.01Other ARM 0.07 0.19 0.46 0.02 0.20 0.20
Closed‐End Second Mortgages 0.17 0.10 0.12 0.14 0.13 0.13Funded HELOCs 0.00 0.01 0.12 0.26 0.11 0.11Reverse 0.37 0.66 0.35 0.13 0.10 0.28 0.28Other 0.00 0.83 0.08 0.00 0.20 0.20
Total 100.00 100.00 100.00 100.00 100.00 100.00 100.00
1st Mtg Fixed Rate vs ARMFixed Rate 99.12 94.02 95.72 95.06 96.17 95.27 95.27ARM 0.88 5.98 4.28 4.94 3.83 4.73 4.73
Total 100.00 100.00 100.00 100.00 100.00 100.00 100.00
1st Mtg Jumbo vs. Non‐JumboJumbo 1.74 4.96 6.90 11.17 10.14 8.67 8.67Non‐Jumbo 98.26 95.04 93.10 88.83 89.86 91.33 91.33
Total 100.00 100.00 100.00 100.00 100.00 100.00 100.00
1st Mtg Production Channel MixRetail/Direct Marketing 33.14 100.00 100.00 100.00 100.00 100.00 100.00Wholesale/Broker and Correspondent 66.86 0.00 0.00 0.00 0.00 0.00 0.00
Total 100.00 100.00 100.00 100.00 100.00 100.00 100.00
1st Mtg Purchase vs RefiPurchase 62.90 74.35 72.85 76.28 75.40 74.91 74.91Refinancing 37.10 25.65 27.15 23.72 24.60 25.09 25.09
Rate‐Term 15.89 8.84 13.44 9.34 10.00 10.27 10.27Cash‐Out 21.21 15.61 13.69 13.75 14.59 14.36 14.36Other / Unknown 1.20 0.02 0.63 0.01 0.46 0.46
Total 100.00 100.00 100.00 100.00 100.00 100.00 100.00
1st Mtg FICO Score DistributionEquals 600 or less 2.62 1.04 0.94 0.62 1.06 0.89 0.89Greater than 600, less than or equal to 650 14.45 9.26 8.32 8.70 10.59 9.23 9.23Greater than 650, less than or equal to 700 25.25 21.88 19.51 19.35 21.03 20.37 20.37Greater than 700, less than or equal to 750 24.80 26.38 27.96 27.87 26.75 27.27 27.27Greater than 750 32.88 41.44 43.27 43.46 40.57 42.23 42.23
Total 100.00 100.00 100.00 100.00 100.00 100.00 100.00
1st Mtg Simple Average FICO (based on #) 705 726 730 728 724 727 7271st Mtg LTV DistributionEquals 60% of less 10.86 9.33 9.04 9.32 8.23 8.98 8.98Greater than 60%, less than or equal to 70% 9.15 7.73 7.67 7.54 7.36 7.56 7.56Greater than 70%, less than or equal to 80% 28.70 27.40 28.75 29.07 27.95 28.35 28.35Greater than 80%, less than or equal to 90% 10.27 14.39 13.31 13.68 13.60 13.73 13.73Greater than 90%, less than or equal to 100% 38.62 39.97 39.76 39.18 41.59 40.10 40.10Greater than 100% 2.40 1.19 1.48 1.21 1.27 1.28 1.28
Total 100.00 100.00 100.00 100.00 100.00 100.00 100.001st Mtg Average LTV (based on $) 82.69 79.68 82.04 81.58 83.74 81.85 81.85
1st Mtg Production Sold by Investor TypeOriginated for Portfolio 0.03 0.07 0.50 0.01 0.18 0.18Originated for Sale to Others: 100.00 99.97 99.93 99.50 99.99 99.82 99.82Sale to Fannie/Freddie/Ginnie 18.58 36.37 21.18 13.09 31.96 24.77 24.77All Other Sale to Others 81.42 63.60 78.75 86.41 68.03 75.05 75.05
Total 100.00 100.00 100.00 100.00 100.00 100.00 100.001st Mtg Servicing Released vs RetainedServicing Released 81.42 80.91 81.63 90.57 82.89 84.69 84.69Servicing Retained 18.58 19.09 18.37 9.43 17.11 15.31 15.31
Total 100.00 100.00 100.00 100.00 100.00 100.00 100.00
Number of Companies Reporting 1 45 44 64 55 208 208
QUARTERLY MORTGAGE BANKERS PERFORMANCE REPORT | Q1 2018 Results from the Mortgage Bankers Association© Mortgage Bankers Association 2018. All rights reserved. 24

QUARTER 1, 2018
Quarterly Mortgage Bankers Performance ReportResidential Loan Production ‐ Retail/Consumer Direct Production Only Companies by Production $F4 ‐ Production Mix (#), Simple Average
PERCENT BASED ON # Your Firm <50M 50‐100M 100‐250M >250M Total YTD 2018Avg. Total Loans Originated ($000s) 282,960 26,533 74,910 159,953 617,497 234,084 234,084 Avg. Total Loans Originated (#) 1,175 123 320 673 2,419 941 941Average Loan Balance 240,612 223,387 249,827 258,653 259,837 249,469 249,469
Production Mix by Product TypeFirst Mortgages: 99.51 98.03 96.86 98.23 97.25 97.64 97.64Government (FHA/VA/RHS) ‐ Fixed 44.97 30.52 30.04 31.60 34.52 31.81 31.81Government (FHA/VA/RHS) ‐ ARM 0.16 2.06 0.27 0.01 0.11 0.53 0.53Prime (Conforming) ‐ Fixed 53.56 60.69 62.51 58.71 57.86 59.72 59.72Prime (Conforming) ‐ ARM 0.25 1.53 1.98 2.32 1.05 1.74 1.74Prime (Non‐Conforming Jumbo) ‐ Fixed 0.50 0.83 1.35 2.95 2.25 1.97 1.97Prime (Non‐Conforming Jumbo) ‐ ARM 0.08 0.70 0.50 0.81 0.87 0.74 0.74Other Fixed 1.65 0.05 1.50 0.56 0.98 0.98Other ARM 0.04 0.16 0.33 0.01 0.15 0.15
Closed‐End Second Mortgages 1.40 1.26 1.19 1.98 1.46 1.46Funded HELOCs 0.00 0.05 0.27 0.60 0.25 0.25Reverse 0.49 0.57 0.66 0.19 0.15 0.36 0.36Other 0.00 1.18 0.12 0.03 0.29 0.29
Total 100.00 100.00 100.00 100.00 100.00 100.00 100.00
1st Mtg Fixed Rate vs ARMFixed Rate 99.48 95.64 97.04 96.49 97.90 96.79 96.79ARM 0.52 4.36 2.96 3.51 2.10 3.21 3.21
Total 100.00 100.00 100.00 100.00 100.00 100.00 100.001st Mtg Jumbo vs. Non‐JumboJumbo 0.59 2.00 3.92 6.76 5.26 4.75 4.75Non‐Jumbo 99.41 98.00 96.08 93.24 94.74 95.25 95.25
Total 100.00 100.00 100.00 100.00 100.00 100.00 100.001st Mtg Production Channel MixRetail/Direct Marketing 40.92 100.00 100.00 100.00 100.00 100.00 100.00Wholesale/Broker and Correspondent 59.08 0.00 0.00 0.00 0.00 0.00 0.00
Total 100.00 100.00 100.00 100.00 100.00 100.00 100.00
1st Mtg Purchase vs RefiPurchase 66.08 73.98 72.72 76.49 75.98 75.02 75.02Refinancing 33.92 26.02 27.28 23.51 24.02 24.98 24.98
Rate‐Term 13.84 9.40 13.05 8.96 9.38 10.03 10.03Cash‐Out 20.08 15.19 14.21 13.94 14.63 14.45 14.45Other / Unknown 1.42 0.02 0.61 0.01 0.50 0.50
Total 100.00 100.00 100.00 100.00 100.00 100.00 100.00
1st Mtg FICO Score DistributionEquals 600 or less 2.89 1.08 0.99 0.70 1.17 0.97 0.97Greater than 600, less than or equal to 650 17.33 9.65 9.49 9.96 11.88 10.29 10.29Greater than 650, less than or equal to 700 27.91 23.17 20.88 20.82 22.53 21.79 21.79Greater than 700, less than or equal to 750 23.39 26.46 27.28 27.28 26.11 26.80 26.80Greater than 750 28.48 39.65 41.36 41.24 38.30 40.15 40.15
Total 100.00 100.00 100.00 100.00 100.00 100.00 100.00
1st Mortgage Simple Average FICO (based on #) 705 726 730 728 724 727 727
1st Mtg LTV DistributionEquals 60% of less 10.77 10.94 10.79 11.36 9.82 10.74 10.74Greater than 60%, less than or equal to 70% 8.04 7.72 7.46 7.10 6.95 7.27 7.27Greater than 70%, less than or equal to 80% 25.46 25.89 27.34 26.86 25.58 26.42 26.42Greater than 80%, less than or equal to 90% 9.49 13.24 12.07 12.67 12.69 12.67 12.67Greater than 90%, less than or equal to 100% 43.14 40.76 40.64 40.47 43.42 41.34 41.34Greater than 100% 3.10 1.45 1.70 1.55 1.53 1.56 1.56
Total 100.00 100.00 100.00 100.00 100.00 100.00 100.00
1st Mtg Average LTV (based on $) 83.69 79.68 82.04 81.58 83.74 81.85 81.851st Mtg Production Sold by Investor TypeOriginated for Portfolio 0.11 0.05 0.32 0.01 0.13 0.13Originated for Sale to Others: 100.00 99.89 99.95 99.68 99.99 99.87 99.87Sale to Fannie/Freddie/Ginnie 19.82 35.95 21.82 14.56 33.24 25.63 25.63All Other Sale to Others 80.18 63.93 78.14 85.13 66.75 74.24 74.24
Total 100.00 100.00 100.00 100.00 100.00 100.00 100.001st Mtg Servicing Released vs RetainedServicing Released 73.79 81.05 81.52 90.50 82.32 84.51 84.51Servicing Retained 26.21 18.95 18.48 9.50 17.68 15.49 15.49
Total 100.00 100.00 100.00 100.00 100.00 100.00 100.00
Number of Companies Reporting 1 45 44 64 55 208 208
QUARTERLY MORTGAGE BANKERS PERFORMANCE REPORT | Q1 2018 Results from the Mortgage Bankers Association© Mortgage Bankers Association 2018. All rights reserved. 25

QUARTER 1, 2018
Quarterly Mortgage Bankers Performance ReportResidential Loan Production ‐ Retail/Consumer Direct Production Only Companies by Production $F5 ‐ Production Mix (Avg Loan Balances), Simple Average
LOAN BALANCES Your Firm <50M 50‐100M 100‐250M >250M Total YTD 2018Avg. Total Loans Originated ($000s) 282,960 26,533 74,910 159,953 617,497 234,084 234,084 Avg. Total Loans Originated (#) 1,175 123 320 673 2,419 941 941Average Loan Balance 240,612 223,387 249,827 258,653 259,837 249,469 249,469
Production Mix by Product TypeFirst Mortgages: 240,882 225,636 255,600 262,227 265,746 253,839 253,839Government (FHA/VA/RHS) ‐ Fixed 214,564 216,917 241,176 248,311 247,031 239,951 239,951Government (FHA/VA/RHS) ‐ ARM 340,999 262,531 283,686 378,625 377,891 339,425 339,425Prime (Conforming) ‐ Fixed 257,086 225,515 247,464 245,073 251,480 243,153 243,153Prime (Conforming) ‐ ARM 351,666 286,647 303,124 322,515 348,636 321,121 321,121Prime (Non‐Conforming Jumbo) ‐ Fixed 690,832 649,871 698,205 679,728 702,037 687,584 687,584Prime (Non‐Conforming Jumbo) ‐ ARM 727,999 802,539 815,848 758,146 811,016 792,889 792,889Other Fixed 161,594 331,667 252,372 295,594 265,777 265,777Other ARM 423,500 349,400 329,545 244,407 309,046 309,046
Closed‐End Second Mortgages 30,185 21,480 42,279 34,308 34,651 34,651Funded HELOCs 63,000 102,441 112,802 103,363 103,363Reverse 176,199 165,737 193,968 185,933 178,790 182,490 182,490Other 187,407 243,504 113,308 186,183 186,183
1st Mtg Fixed Rate vs ARMFixed Rate 240,012 221,544 251,940 257,856 260,305 249,396 249,396ARM 410,832 416,932 410,390 463,087 532,422 467,073 467,073
1st Mtg Jumbo vs. Non‐JumboJumbo 696,142 670,036 695,920 672,007 707,326 687,644 687,644Non‐Jumbo 238,149 216,207 249,158 251,082 262,904 246,401 246,401
1st Mtg Production Channel MixRetail/Direct Marketing 195,227 225,636 255,600 262,227 265,746 253,839 253,839Wholesale/Broker and Correspondent 272,493
1st Mtg Purchase vs RefiPurchase 229,321 227,668 259,095 263,163 263,739 254,776 254,776Refinancing 263,437 225,151 247,473 261,980 271,411 253,521 253,521
Rate‐Term 276,369 226,053 259,501 273,834 283,112 263,928 263,928Cash‐Out 254,522 236,969 242,639 252,097 261,095 249,231 249,231Other / Unknown 139,023 227,000 255,855 221,000 207,125 207,125
1st Mtg FICO Score DistributionEquals 600 or less 216,823 190,899 212,601 226,137 228,387 219,313 219,313Greater than 600, less than or equal to 650 200,896 215,074 217,102 227,860 231,406 223,826 223,826Greater than 650, less than or equal to 700 217,641 209,861 241,532 244,659 244,515 236,392 236,392Greater than 700, less than or equal to 750 255,437 219,992 262,470 268,863 270,814 257,389 257,389Greater than 750 278,579 235,607 268,386 274,853 279,369 266,273 266,273
1st Mtg LTV DistributionEquals 60% of less 243,332 196,457 213,563 218,764 221,140 213,595 213,595Greater than 60%, less than or equal to 70% 274,000 221,906 265,040 277,327 280,734 263,962 263,962Greater than 70%, less than or equal to 80% 271,737 233,224 269,667 285,382 289,180 271,880 271,880Greater than 80%, less than or equal to 90% 260,693 247,146 277,383 284,198 282,720 274,294 274,294Greater than 90%, less than or equal to 100% 215,662 221,457 251,099 256,183 251,435 246,315 246,315Greater than 100% 182,296 179,200 181,425 194,970 200,545 192,070 192,070
1st Mtg Production Sold by Investor TypeOriginated for Portfolio 61,250 472,917 351,944 337,633 333,818 333,818Originated for Sale to Others: 240,887 221,053 256,216 262,117 259,616 251,853 251,853Sale to Fannie/Freddie/Ginnie 226,008 192,630 223,826 201,427 233,554 213,959 213,959All Other Sale to Others 244,563 240,674 258,866 270,378 276,693 264,414 264,414
1st Mtg Servicing Released vs RetainedServicing Released 265,793 219,081 260,580 268,572 272,210 258,417 258,417Servicing Retained 170,794 269,065 289,983 260,626 247,743 263,101 263,101
Number of Companies Reporting 1 45 44 64 55 208 208
QUARTERLY MORTGAGE BANKERS PERFORMANCE REPORT | Q1 2018 Results from the Mortgage Bankers Association© Mortgage Bankers Association 2018. All rights reserved. 26
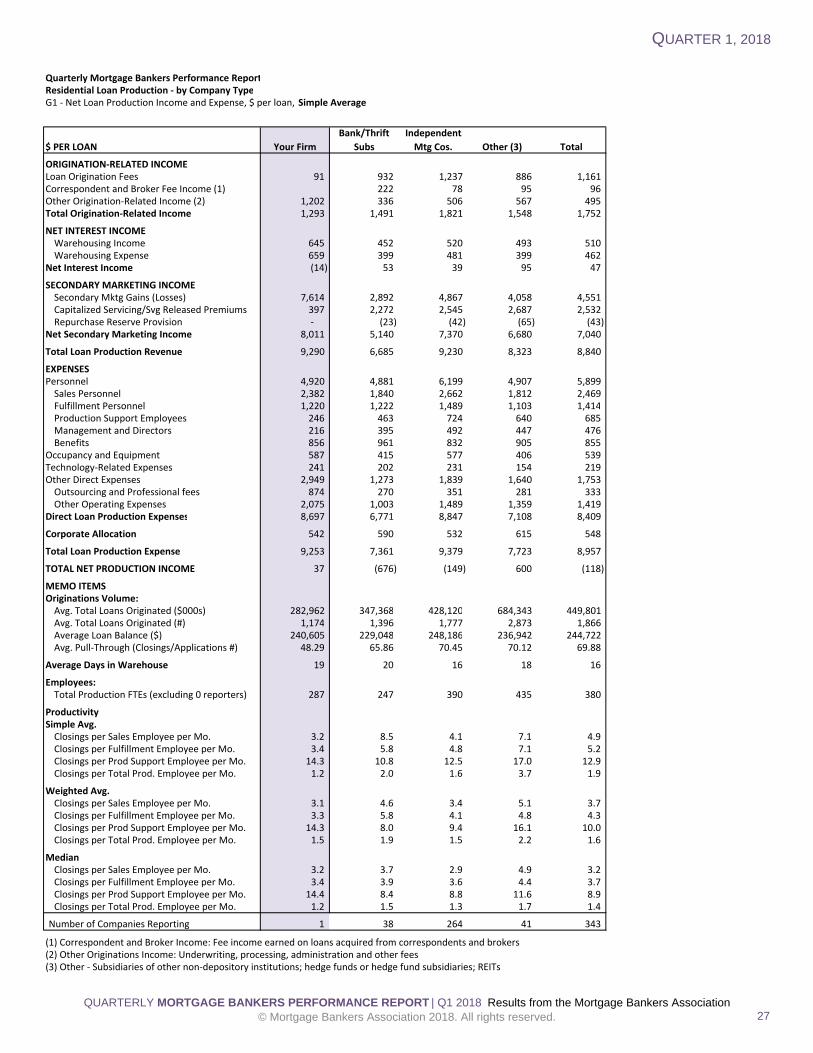
QUARTER 1, 2018
Quarterly Mortgage Bankers Performance ReportResidential Loan Production ‐ by Company TypeG1 ‐ Net Loan Production Income and Expense, $ per loan, Simple Average
$ PER LOAN Your Firm
Bank/Thrift
Subs
Independent
Mtg Cos. Other (3) Total
ORIGINATION‐RELATED INCOMELoan Origination Fees 91 932 1,237 886 1,161 Correspondent and Broker Fee Income (1) 222 78 95 96 Other Origination‐Related Income (2) 1,202 336 506 567 495 Total Origination‐Related Income 1,293 1,491 1,821 1,548 1,752
NET INTEREST INCOMEWarehousing Income 645 452 520 493 510 Warehousing Expense 659 399 481 399 462
Net Interest Income (14) 53 39 95 47
SECONDARY MARKETING INCOMESecondary Mktg Gains (Losses) 7,614 2,892 4,867 4,058 4,551 Capitalized Servicing/Svg Released Premiums 397 2,272 2,545 2,687 2,532 Repurchase Reserve Provision ‐ (23) (42) (65) (43)
Net Secondary Marketing Income 8,011 5,140 7,370 6,680 7,040
Total Loan Production Revenue 9,290 6,685 9,230 8,323 8,840
EXPENSESPersonnel 4,920 4,881 6,199 4,907 5,899 Sales Personnel 2,382 1,840 2,662 1,812 2,469 Fulfillment Personnel 1,220 1,222 1,489 1,103 1,414 Production Support Employees 246 463 724 640 685 Management and Directors 216 395 492 447 476 Benefits 856 961 832 905 855
Occupancy and Equipment 587 415 577 406 539 Technology‐Related Expenses 241 202 231 154 219 Other Direct Expenses 2,949 1,273 1,839 1,640 1,753 Outsourcing and Professional fees 874 270 351 281 333 Other Operating Expenses 2,075 1,003 1,489 1,359 1,419
Direct Loan Production Expenses 8,697 6,771 8,847 7,108 8,409
Corporate Allocation 542 590 532 615 548
Total Loan Production Expense 9,253 7,361 9,379 7,723 8,957
TOTAL NET PRODUCTION INCOME 37 (676) (149) 600 (118)
MEMO ITEMSOriginations Volume:Avg. Total Loans Originated ($000s) 282,962 347,368 428,120 684,343 449,801 Avg. Total Loans Originated (#) 1,174 1,396 1,777 2,873 1,866 Average Loan Balance ($) 240,605 229,048 248,186 236,942 244,722 Avg. Pull‐Through (Closings/Applications #) 48.29 65.86 70.45 70.12 69.88
Average Days in Warehouse 19 20 16 18 16
Employees:Total Production FTEs (excluding 0 reporters) 287 247 390 435 380
ProductivitySimple Avg.Closings per Sales Employee per Mo. 3.2 8.5 4.1 7.1 4.9Closings per Fulfillment Employee per Mo. 3.4 5.8 4.8 7.1 5.2Closings per Prod Support Employee per Mo. 14.3 10.8 12.5 17.0 12.9Closings per Total Prod. Employee per Mo. 1.2 2.0 1.6 3.7 1.9
Weighted Avg.Closings per Sales Employee per Mo. 3.1 4.6 3.4 5.1 3.7Closings per Fulfillment Employee per Mo. 3.3 5.8 4.1 4.8 4.3Closings per Prod Support Employee per Mo. 14.3 8.0 9.4 16.1 10.0Closings per Total Prod. Employee per Mo. 1.5 1.9 1.5 2.2 1.6
MedianClosings per Sales Employee per Mo. 3.2 3.7 2.9 4.9 3.2Closings per Fulfillment Employee per Mo. 3.4 3.9 3.6 4.4 3.7Closings per Prod Support Employee per Mo. 14.4 8.4 8.8 11.6 8.9Closings per Total Prod. Employee per Mo. 1.2 1.5 1.3 1.7 1.4
Number of Companies Reporting 1 38 264 41 343
(1) Correspondent and Broker Income: Fee income earned on loans acquired from correspondents and brokers(2) Other Originations Income: Underwriting, processing, administration and other fees (3) Other ‐ Subsidiaries of other non‐depository institutions; hedge funds or hedge fund subsidiaries; REITs
QUARTERLY MORTGAGE BANKERS PERFORMANCE REPORT | Q1 2018 Results from the Mortgage Bankers Association© Mortgage Bankers Association 2018. All rights reserved. 27
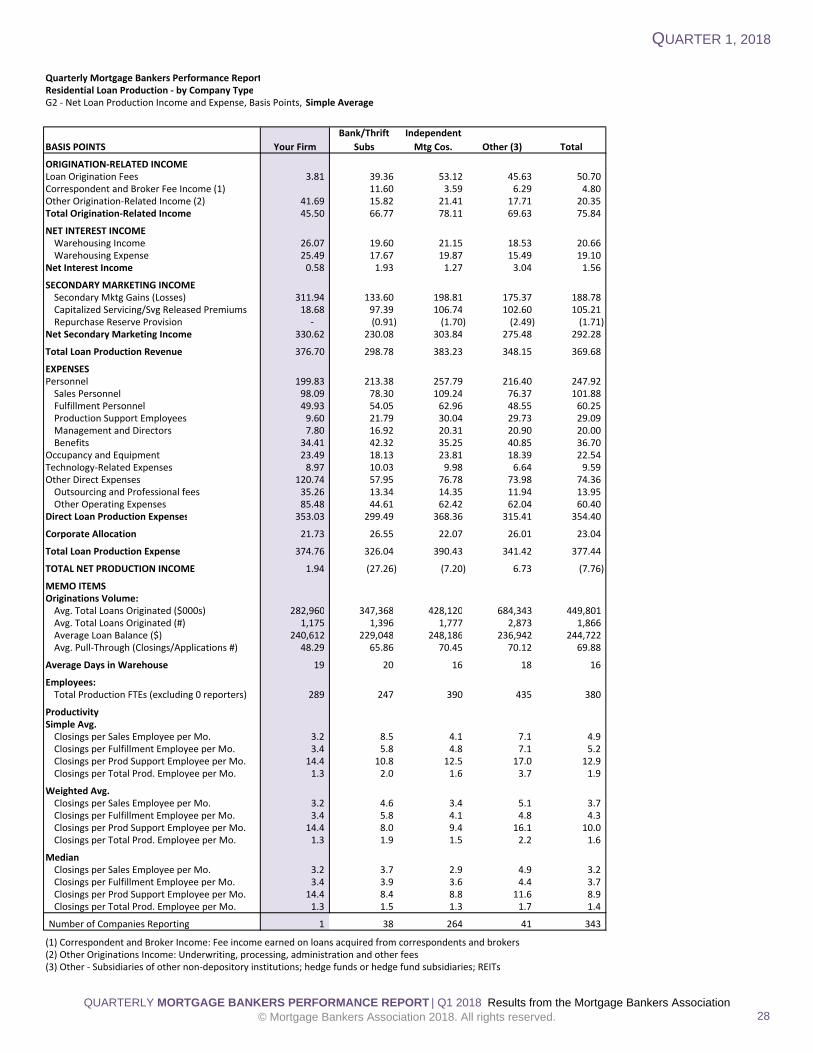
QUARTER 1, 2018
Quarterly Mortgage Bankers Performance ReportResidential Loan Production ‐ by Company TypeG2 ‐ Net Loan Production Income and Expense, Basis Points, Simple Average
BASIS POINTS Your Firm
Bank/Thrift
Subs
Independent
Mtg Cos. Other (3) Total
ORIGINATION‐RELATED INCOMELoan Origination Fees 3.81 39.36 53.12 45.63 50.70 Correspondent and Broker Fee Income (1) 11.60 3.59 6.29 4.80 Other Origination‐Related Income (2) 41.69 15.82 21.41 17.71 20.35 Total Origination‐Related Income 45.50 66.77 78.11 69.63 75.84
NET INTEREST INCOMEWarehousing Income 26.07 19.60 21.15 18.53 20.66 Warehousing Expense 25.49 17.67 19.87 15.49 19.10
Net Interest Income 0.58 1.93 1.27 3.04 1.56
SECONDARY MARKETING INCOMESecondary Mktg Gains (Losses) 311.94 133.60 198.81 175.37 188.78 Capitalized Servicing/Svg Released Premiums 18.68 97.39 106.74 102.60 105.21 Repurchase Reserve Provision ‐ (0.91) (1.70) (2.49) (1.71)
Net Secondary Marketing Income 330.62 230.08 303.84 275.48 292.28
Total Loan Production Revenue 376.70 298.78 383.23 348.15 369.68
EXPENSESPersonnel 199.83 213.38 257.79 216.40 247.92 Sales Personnel 98.09 78.30 109.24 76.37 101.88 Fulfillment Personnel 49.93 54.05 62.96 48.55 60.25 Production Support Employees 9.60 21.79 30.04 29.73 29.09 Management and Directors 7.80 16.92 20.31 20.90 20.00 Benefits 34.41 42.32 35.25 40.85 36.70
Occupancy and Equipment 23.49 18.13 23.81 18.39 22.54 Technology‐Related Expenses 8.97 10.03 9.98 6.64 9.59 Other Direct Expenses 120.74 57.95 76.78 73.98 74.36 Outsourcing and Professional fees 35.26 13.34 14.35 11.94 13.95 Other Operating Expenses 85.48 44.61 62.42 62.04 60.40
Direct Loan Production Expenses 353.03 299.49 368.36 315.41 354.40
Corporate Allocation 21.73 26.55 22.07 26.01 23.04
Total Loan Production Expense 374.76 326.04 390.43 341.42 377.44
TOTAL NET PRODUCTION INCOME 1.94 (27.26) (7.20) 6.73 (7.76)
MEMO ITEMSOriginations Volume:Avg. Total Loans Originated ($000s) 282,960 347,368 428,120 684,343 449,801 Avg. Total Loans Originated (#) 1,175 1,396 1,777 2,873 1,866 Average Loan Balance ($) 240,612 229,048 248,186 236,942 244,722 Avg. Pull‐Through (Closings/Applications #) 48.29 65.86 70.45 70.12 69.88
Average Days in Warehouse 19 20 16 18 16
Employees:Total Production FTEs (excluding 0 reporters) 289 247 390 435 380
ProductivitySimple Avg.Closings per Sales Employee per Mo. 3.2 8.5 4.1 7.1 4.9Closings per Fulfillment Employee per Mo. 3.4 5.8 4.8 7.1 5.2Closings per Prod Support Employee per Mo. 14.4 10.8 12.5 17.0 12.9Closings per Total Prod. Employee per Mo. 1.3 2.0 1.6 3.7 1.9
Weighted Avg.Closings per Sales Employee per Mo. 3.2 4.6 3.4 5.1 3.7Closings per Fulfillment Employee per Mo. 3.4 5.8 4.1 4.8 4.3Closings per Prod Support Employee per Mo. 14.4 8.0 9.4 16.1 10.0Closings per Total Prod. Employee per Mo. 1.3 1.9 1.5 2.2 1.6
MedianClosings per Sales Employee per Mo. 3.2 3.7 2.9 4.9 3.2Closings per Fulfillment Employee per Mo. 3.4 3.9 3.6 4.4 3.7Closings per Prod Support Employee per Mo. 14.4 8.4 8.8 11.6 8.9Closings per Total Prod. Employee per Mo. 1.3 1.5 1.3 1.7 1.4
Number of Companies Reporting 1 38 264 41 343
(1) Correspondent and Broker Income: Fee income earned on loans acquired from correspondents and brokers(2) Other Originations Income: Underwriting, processing, administration and other fees (3) Other ‐ Subsidiaries of other non‐depository institutions; hedge funds or hedge fund subsidiaries; REITs
QUARTERLY MORTGAGE BANKERS PERFORMANCE REPORT | Q1 2018 Results from the Mortgage Bankers Association© Mortgage Bankers Association 2018. All rights reserved. 28

QUARTER 1, 2018
Quarterly Mortgage Bankers Performance ReportResidential Loan Production ‐ by Company TypeG3 ‐ Production Mix ($), Simple Average
% BASED ON $ Your Firm
Bank/Thrift
Subs
Independent
Mtg Cos. Other TotalAvg. Total Loans Originated ($000s) 282,960 347,368 428,120 684,343 449,801 Avg. Total Loans Originated (#) 1,175 1,396 1,777 2,873 1,866Average Loan Balance 240,612 229,048 248,186 236,942 244,722
Production Mix by Product TypeFirst Mortgages: 99.63 99.72 99.14 99.61 99.26Government (FHA/VA/RHS) ‐ Fixed 40.10 23.68 34.16 31.36 32.67Government (FHA/VA/RHS) ‐ ARM 0.23 0.02 0.81 1.08 0.76Prime (Conforming) ‐ Fixed 57.23 60.05 56.75 55.55 56.97Prime (Conforming) ‐ ARM 0.36 1.58 1.25 3.40 1.54Prime (Non‐Conforming Jumbo) ‐ Fixed 1.45 6.71 3.86 4.21 4.22Prime (Non‐Conforming Jumbo) ‐ ARM 0.25 2.02 1.47 1.90 1.58Other Fixed 5.33 0.28 1.81 1.02Other ARM 0.33 0.56 0.31 0.50
Closed‐End Second Mortgages 0.05 0.11 0.36 0.13Funded HELOCs 0.07 0.10 0.00 0.08Reverse 0.37 0.02 0.50 0.01 0.39Other 0.14 0.16 0.02 0.14
Total 100.00 100.00 100.00 100.00 100.001st Mtg Fixed Rate vs ARMFixed Rate 99.12 96.04 95.89 93.31 95.60ARM 0.88 3.96 4.11 6.69 4.40
Total 100.00 100.00 100.00 100.00 100.00
1st Mtg Jumbo vs. Non‐JumboJumbo 1.74 12.46 8.05 6.25 8.33Non‐Jumbo 98.26 87.54 91.95 93.75 91.67
Total 100.00 100.00 100.00 100.00 100.00
1st Mtg Production Channel MixRetail/Direct Marketing 33.14 76.88 85.44 84.45 84.37Wholesale/Broker and Correspondent 66.86 23.12 14.56 15.55 15.63
Total 100.00 100.00 100.00 100.00 100.00
1st Mtg Purchase vs RefiPurchase 62.90 70.01 71.27 71.86 71.20Refinancing 37.10 29.99 28.73 28.14 28.80
Rate‐Term 15.89 12.21 12.08 12.71 12.17Cash‐Out 21.21 16.61 15.83 15.05 15.82Other / Unknown 1.17 0.82 0.39 0.81
Total 100.00 100.00 100.00 100.00 100.001st Mtg FICO Score DistributionEquals 600 or less 2.62 0.31 1.55 3.41 1.63Greater than 600, less than or equal to 650 14.45 7.25 10.77 10.43 10.35Greater than 650, less than or equal to 700 25.25 19.94 21.85 20.75 21.51Greater than 700, less than or equal to 750 24.80 26.86 27.05 26.28 26.94Greater than 750 32.88 45.64 38.78 39.12 39.56
Total 100.00 100.00 100.00 100.00 100.00
1st Mtg Simple Average FICO (based on #) 705 732 721 722 7221st Mtg LTV DistributionEquals 60% of less 10.86 10.11 9.24 9.46 9.36Greater than 60%, less than or equal to 70% 9.15 8.82 7.84 7.50 7.90Greater than 70%, less than or equal to 80% 28.70 30.56 26.55 26.92 27.03Greater than 80%, less than or equal to 90% 10.27 13.12 13.46 13.39 13.41Greater than 90%, less than or equal to 100% 38.62 35.78 40.46 40.02 39.90Greater than 100% 2.40 1.61 2.46 2.70 2.39
Total 100.00 100.00 100.00 100.00 100.00
1st Mtg Average LTV (based on $) 82.69 81.42 82.48 81.54 82.261st Mtg Production Sold by Investor TypeOriginated for Portfolio 0.86 0.06 0.01 0.14Originated for Sale to Others: 100.00 99.14 99.94 99.99 99.86Sale to Fannie/Freddie/Ginnie 18.58 39.08 31.60 43.93 33.85All Other Sale to Others 81.42 60.06 68.34 56.06 66.00
Total 100.00 100.00 100.00 100.00 100.001st Mtg Servicing Released vs RetainedServicing Released 81.42 72.68 79.54 66.55 77.38Servicing Retained 18.58 27.32 20.46 33.45 22.62
Total 100.00 100.00 100.00 100.00 100.00
Number of Companies Reporting 1 38 264 41 343
QUARTERLY MORTGAGE BANKERS PERFORMANCE REPORT | Q1 2018 Results from the Mortgage Bankers Association© Mortgage Bankers Association 2018. All rights reserved. 29

QUARTER 1, 2018
Quarterly Mortgage Bankers Performance ReportResidential Loan Production ‐ by Company TypeG4 ‐ Production Mix (#), Simple Average
% BASED ON # Your Firm
Bank/Thrift
Subs
Independent
Mtg Cos. Other TotalAvg. Total Loans Originated ($000s) 282,960 347,368 428,120 684,343 449,801 Avg. Total Loans Originated (#) 1,175 1,396 1,777 2,873 1,866Average Loan Balance 240,612 229,048 248,186 236,942 244,722Production Mix by Product TypeFirst Mortgages: 99.51 98.76 97.58 96.76 97.61Government (FHA/VA/RHS) ‐ Fixed 44.97 25.47 35.85 31.09 34.13Government (FHA/VA/RHS) ‐ ARM 0.16 0.04 0.77 0.99 0.71Prime (Conforming) ‐ Fixed 53.56 62.31 57.19 56.42 57.66Prime (Conforming) ‐ ARM 0.25 1.44 1.00 3.23 1.31Prime (Non‐Conforming Jumbo) ‐ Fixed 0.50 3.28 1.61 2.14 1.86Prime (Non‐Conforming Jumbo) ‐ ARM 0.08 0.86 0.50 0.90 0.58Other Fixed 5.15 0.23 1.79 0.96Other ARM 0.20 0.43 0.20 0.38
Closed‐End Second Mortgages 0.83 1.34 3.06 1.49Funded HELOCs 0.16 0.22 0.01 0.19Reverse 0.49 0.02 0.64 0.01 0.50Other 0.24 0.22 0.16 0.21
Total 100.00 100.00 100.00 100.00 100.001st Mtg Fixed Rate vs ARMFixed Rate 99.48 97.42 97.26 94.66 96.97ARM 0.52 2.58 2.74 5.34 3.03
Total 100.00 100.00 100.00 100.00 100.001st Mtg Jumbo vs. Non‐JumboJumbo 0.59 7.02 4.41 3.11 4.55Non‐Jumbo 99.41 92.98 95.59 96.89 95.45
Total 100.00 100.00 100.00 100.00 100.00
1st Mtg Production Channel MixRetail/Direct Marketing 40.92 76.59 85.73 85.28 84.66Wholesale/Broker and Correspondent 59.08 23.41 14.27 14.72 15.34
Total 100.00 100.00 100.00 100.00 100.001st Mtg Purchase vs RefiPurchase 66.08 69.99 71.84 71.64 71.61Refinancing 33.92 30.01 28.16 28.36 28.39
Rate‐Term 13.84 12.24 11.54 12.99 11.79Cash‐Out 20.08 16.67 15.76 15.00 15.77Other / Unknown 1.10 0.87 0.38 0.83
Total 100.00 100.00 100.00 100.00 100.00
1st Mtg FICO Score DistributionEquals 600 or less 2.89 0.37 1.72 3.37 1.77Greater than 600, less than or equal to 650 17.33 8.08 12.12 11.36 11.59Greater than 650, less than or equal to 700 27.91 21.93 23.27 21.73 22.94Greater than 700, less than or equal to 750 23.39 26.29 26.50 25.80 26.39Greater than 750 28.48 43.33 36.40 37.75 37.31
Total 100.00 100.00 100.00 100.00 100.00
1st Mortgage Simple Average FICO (based on #) 705 732 721 722 7221st Mtg LTV DistributionEquals 60% of less 10.77 13.20 10.73 12.13 11.16Greater than 60%, less than or equal to 70% 8.04 8.42 7.38 7.35 7.49Greater than 70%, less than or equal to 80% 25.46 27.95 24.65 25.22 25.07Greater than 80%, less than or equal to 90% 9.49 11.83 12.51 12.63 12.45Greater than 90%, less than or equal to 100% 43.14 36.39 41.97 39.94 41.13Greater than 100% 3.10 2.21 2.76 2.73 2.70
Total 100.00 100.00 100.00 100.00 100.00
1st Mtg Average LTV (based on $) 83.69 81.42 82.48 81.54 82.261st Mtg Production Sold by Investor TypeOriginated for Portfolio 0.48 0.06 0.01 0.10Originated for Sale to Others: 100.00 99.52 99.94 99.99 99.90Sale to Fannie/Freddie/Ginnie 19.82 41.14 32.51 45.36 34.95All Other Sale to Others 80.18 58.39 67.43 54.63 64.95
Total 100.00 100.00 100.00 100.00 100.001st Mtg Servicing Released vs RetainedServicing Released 73.79 72.55 78.95 66.69 76.92Servicing Retained 26.21 27.45 21.05 33.31 23.08
Total 100.00 100.00 100.00 100.00 100.00
Number of Companies Reporting 1 38 264 41 343
QUARTERLY MORTGAGE BANKERS PERFORMANCE REPORT | Q1 2018 Results from the Mortgage Bankers Association© Mortgage Bankers Association 2018. All rights reserved. 30

QUARTER 1, 2018
Quarterly Mortgage Bankers Performance ReportResidential Loan Production ‐ by Company TypeG5 ‐ Production Mix (Avg Loan Balances), Simple Average
LOAN BALANCES Your Firm
Bank/Thrift
Subs
Independent
Mtg Cos. Other TotalAvg. Total Loans Originated ($000s) 282,960 347,368 428,120 684,343 449,801Avg. Total Loans Originated (#) 1,175 1,396 1,777 2,873 1,866Average Loan Balance 240,612 229,048 248,186 236,942 244,722
Production Mix by Product TypeFirst Mortgages: 240,882 231,255 252,666 242,184 249,041Government (FHA/VA/RHS) ‐ Fixed 214,564 203,370 234,798 237,733 231,950Government (FHA/VA/RHS) ‐ ARM 340,999 154,333 312,646 318,489 309,229Prime (Conforming) ‐ Fixed 257,086 213,281 245,286 225,275 239,414Prime (Conforming) ‐ ARM 351,666 278,824 334,769 324,317 328,025Prime (Non‐Conforming Jumbo) ‐ Fixed 690,832 657,501 699,975 654,239 690,655Prime (Non‐Conforming Jumbo) ‐ ARM 727,999 750,116 831,533 717,033 811,098Other Fixed 249,948 341,170 262,078 312,666Other ARM 417,810 460,446 420,676 451,921
Closed‐End Second Mortgages 31,633 31,883 35,470 32,296Funded HELOCs 114,945 121,311 74,455 118,961Reverse 176,199 177,167 175,832 145,411 174,752Other 232,656 179,332 93,364 170,973
1st Mtg Fixed Rate vs ARMFixed Rate 240,012 226,667 248,158 238,239 244,592ARM 410,832 401,786 479,575 448,246 468,381
1st Mtg Jumbo vs. Non‐JumboJumbo 696,142 639,965 700,771 666,376 690,816Non‐Jumbo 238,149 213,665 246,014 231,303 240,656
1st Mtg Production Channel MixRetail/Direct Marketing 195,227 234,210 249,560 238,604 246,631Wholesale/Broker and Correspondent 272,493 207,741 267,349 202,051 253,494
1st Mtg Purchase vs RefiPurchase 229,321 235,992 251,779 243,283 249,006Refinancing 263,437 230,275 256,938 240,265 252,080
Rate‐Term 276,369 235,340 267,071 243,962 260,749Cash‐Out 254,522 224,156 254,066 232,042 248,734Other / Unknown 316,848 278,947 243,024 282,816
1st Mtg FICO Score DistributionEquals 600 or less 216,823 172,427 216,769 225,987 214,783Greater than 600, less than or equal to 650 200,896 208,449 220,500 219,058 219,010Greater than 650, less than or equal to 700 217,641 205,563 236,920 228,530 232,522Greater than 700, less than or equal to 750 255,437 233,894 257,867 246,116 253,865Greater than 750 278,579 239,881 271,014 250,757 265,166
1st Mtg LTV DistributionEquals 60% of less 243,332 182,671 216,506 186,901 209,341Greater than 60%, less than or equal to 70% 274,000 237,971 268,641 248,973 262,973Greater than 70%, less than or equal to 80% 271,737 249,310 272,070 256,242 267,697Greater than 80%, less than or equal to 90% 260,693 255,047 271,393 257,450 267,943Greater than 90%, less than or equal to 100% 215,662 225,324 242,526 242,401 240,650Greater than 100% 182,296 164,303 191,823 196,273 189,346
1st Mtg Production Sold by Investor TypeOriginated for Portfolio 481,473 231,434 447,167 327,333Originated for Sale to Others: 240,887 229,251 249,633 242,492 246,535Sale to Fannie/Freddie/Ginnie 226,008 194,820 221,365 214,311 217,320All Other Sale to Others 244,563 258,511 266,145 263,687 265,049
1st Mtg Servicing Released vs RetainedServicing Released 265,793 216,707 268,956 256,312 262,296Servicing Retained 170,794 232,348 254,252 229,699 249,546
Number of Companies Reporting 1 38 264 41 343
QUARTERLY MORTGAGE BANKERS PERFORMANCE REPORT | Q1 2018 Results from the Mortgage Bankers Association© Mortgage Bankers Association 2018. All rights reserved. 31

QUARTER 1, 2018
Quarterly Mortgage Bankers Performance ReportResidential Loan Production ‐ By Average Loan BalanceH1 ‐ Net Loan Production Income and Expense, $ per loan, Simple Average
$ PER LOAN Your Firm <175,000
175,000‐
225,000
225,000‐
275,000 >275,000 Total
ORIGINATION‐RELATED INCOMELoan Origination Fees 91 1,030 1,346 984 1,247 1,161 Correspondent and Broker Fee Income (1) 152 140 51 71 96 Other Origination‐Related Income (2) 1,202 304 422 427 748 495 Total Origination‐Related Income 1,293 1,486 1,908 1,462 2,066 1,752
NET INTEREST INCOMEWarehousing Income 645 261 430 530 704 510 Warehousing Expense 659 249 429 497 575 462
Net Interest Income (14) 12 1 33 129 47
SECONDARY MARKETING INCOMESecondary Mktg Gains (Losses) 7,614 2,657 3,992 5,057 5,593 4,551 Capitalized Servicing/Svg Released Premiums 397 1,609 2,322 2,553 3,228 2,532 Repurchase Reserve Provision ‐ (12) (33) (55) (57) (43)
Net Secondary Marketing Income 8,011 4,254 6,282 7,555 8,763 7,040
Total Loan Production Revenue 9,290 5,751 8,191 9,050 10,958 8,840
EXPENSESPersonnel 4,920 3,893 5,522 6,133 7,121 5,899 Sales Personnel 2,382 1,277 2,258 2,756 3,021 2,469 Fulfillment Personnel 1,220 1,020 1,408 1,425 1,624 1,414 Production Support Employees 246 564 649 643 833 685 Management and Directors 216 327 446 460 606 476 Benefits 856 705 761 848 1,037 855
Occupancy and Equipment 587 321 509 543 683 539 Technology‐Related Expenses 241 159 254 209 229 219 Other Direct Expenses 2,949 1,239 1,689 1,777 2,074 1,753 Outsourcing and Professional fees 874 250 314 281 457 333 Other Operating Expenses 2,075 989 1,374 1,496 1,617 1,419
Direct Loan Production Expenses 8,697 5,613 7,973 8,663 10,106 8,409
Corporate Allocation 542 414 505 554 660 548
Total Loan Production Expense 9,253 6,027 8,478 9,216 10,766 8,957
TOTAL NET PRODUCTION INCOME 37 (276) (287) (167) 191 (118)
MEMO ITEMSOriginations Volume:Avg. Total Loans Originated ($000s) 282,962 131,535 360,693 703,649 433,169 449,801 Avg. Total Loans Originated (#) 1,174 890 1,749 2,847 1,436 1,866 Average Loan Balance ($) 240,605 149,556 202,151 248,153 335,690 244,722 Avg. Pull‐Through (Closings/Applications #) 48.29 68.48 72.71 68.32 69.42 69.88
Average Days in Warehouse 19 16 17 16 16 16
Employees:Total Production FTEs (excluding 0 reporters) 287 135 376 578 299 380
ProductivitySimple Avg.Closings per Sales Employee per Mo. 3.2 9.0 4.5 4.2 4.1 4.9Closings per Fulfillment Employee per Mo. 3.4 6.6 5.6 4.9 4.2 5.2Closings per Prod Support Employee per Mo. 14.3 14.6 14.7 12.0 11.3 12.9Closings per Total Prod. Employee per Mo. 1.2 3.4 1.9 1.6 1.5 1.9
Weighted Avg.Closings per Sales Employee per Mo. 3.1 4.0 3.5 3.7 4.0 3.7Closings per Fulfillment Employee per Mo. 3.3 5.1 4.7 4.1 4.0 4.3Closings per Prod Support Employee per Mo. 14.3 12.5 10.1 9.7 10.0 10.0Closings per Total Prod. Employee per Mo. 1.5 2.2 1.6 1.6 1.6 1.6
MedianClosings per Sales Employee per Mo. 3.2 4.2 3.3 2.9 3.0 3.2Closings per Fulfillment Employee per Mo. 3.4 4.3 3.7 3.6 3.7 3.7Closings per Prod Support Employee per Mo. 14.4 11.3 10.7 9.2 6.9 8.9Closings per Total Prod. Employee per Mo. 1.2 1.6 1.4 1.3 1.3 1.4
Number of Companies Reporting 1 52 93 104 94 343
(1) Correspondent and Broker Income: Fee income earned on loans acquired from correspondents and brokers(2) Other Originations Income: Underwriting, processing, administration and other fees
QUARTERLY MORTGAGE BANKERS PERFORMANCE REPORT | Q1 2018 Results from the Mortgage Bankers Association© Mortgage Bankers Association 2018. All rights reserved. 32

QUARTER 1, 2018
Quarterly Mortgage Bankers Performance ReportResidential Loan Production ‐ By Average Loan BalanceH2 ‐ Net Loan Production Income and Expense, Basis Points, Simple Average
BASIS POINTS Your Firm <175,000
175,000‐
225,000
225,000‐
275,000 >275,000 Total
ORIGINATION‐RELATED INCOMELoan Origination Fees 3.81 71.14 66.01 39.64 36.46 50.70 Correspondent and Broker Fee Income (1) 11.01 7.26 2.04 1.97 4.80 Other Origination‐Related Income (2) 41.69 19.58 20.91 17.20 23.70 20.35 Total Origination‐Related Income 45.50 101.73 94.19 58.89 62.14 75.84
NET INTEREST INCOMEWarehousing Income 26.07 17.25 21.23 21.37 21.21 20.66 Warehousing Expense 25.49 16.47 21.22 20.05 17.42 19.10
Net Interest Income 0.58 0.77 0.01 1.32 3.79 1.56
SECONDARY MARKETING INCOMESecondary Mktg Gains (Losses) 311.94 174.49 195.10 206.16 171.20 188.78 Capitalized Servicing/Svg Released Premiums 18.68 105.16 115.60 102.64 97.80 105.21 Repurchase Reserve Provision ‐ (0.79) (1.60) (2.25) (1.73) (1.71)
Net Secondary Marketing Income 330.62 278.86 309.10 306.55 267.27 292.28
Total Loan Production Revenue 376.70 381.36 403.30 366.76 333.20 369.68
EXPENSESPersonnel 199.83 259.55 272.53 248.41 216.61 247.92 Sales Personnel 98.09 83.77 111.43 111.71 91.57 101.88 Fulfillment Personnel 49.93 67.65 69.62 57.64 49.76 60.25 Production Support Employees 9.60 37.50 32.19 26.02 24.78 29.09 Management and Directors 7.80 22.59 21.65 18.58 18.52 20.00 Benefits 34.41 48.03 37.63 34.46 31.99 36.70
Occupancy and Equipment 23.49 21.52 25.03 22.07 21.16 22.54 Technology‐Related Expenses 8.97 11.02 12.57 8.49 7.05 9.59 Other Direct Expenses 120.74 83.82 83.35 71.70 63.15 74.36 Outsourcing and Professional fees 35.26 16.92 15.64 11.28 13.60 13.95 Other Operating Expenses 85.48 66.90 67.71 60.42 49.56 60.40
Direct Loan Production Expenses 353.03 375.91 393.48 350.66 307.97 354.40
Corporate Allocation 21.73 27.10 24.72 22.37 19.87 23.04
Total Loan Production Expense 374.76 403.01 418.20 373.04 327.84 377.44
TOTAL NET PRODUCTION INCOME 1.94 (21.65) (14.90) (6.28) 5.35 (7.76)
MEMO ITEMSOriginations Volume:Avg. Total Loans Originated ($000s) 282,960 131,535 360,693 703,649 433,169 449,801 Avg. Total Loans Originated (#) 1,175 890 1,749 2,847 1,436 1,866 Average Loan Balance ($) 240,612 149,556 202,151 248,153 335,690 244,722 Avg. Pull‐Through (Closings/Applications #) 48.29 68.48 72.71 68.32 69.42 69.88
Average Days in Warehouse 19 16 17 16 16 16
Employees:Total Production FTEs (excluding 0 reporters) 289 135 376 578 299 380
ProductivitySimple Avg.Closings per Sales Employee per Mo. 3.2 9.0 4.5 4.2 4.1 4.9Closings per Fulfillment Employee per Mo. 3.4 6.6 5.6 4.9 4.2 5.2Closings per Prod Support Employee per Mo. 14.4 14.6 14.7 12.0 11.3 12.9Closings per Total Prod. Employee per Mo. 1.3 3.4 1.9 1.6 1.5 1.9
Weighted Avg.Closings per Sales Employee per Mo. 3.2 4.0 3.5 3.7 4.0 3.7Closings per Fulfillment Employee per Mo. 3.4 5.1 4.7 4.1 4.0 4.3Closings per Prod Support Employee per Mo. 14.4 12.5 10.1 9.7 10.0 10.0Closings per Total Prod. Employee per Mo. 1.3 2.2 1.6 1.6 1.6 1.6
MedianClosings per Sales Employee per Mo. 3.2 4.2 3.3 2.9 3.0 3.2Closings per Fulfillment Employee per Mo. 3.4 4.3 3.7 3.6 3.7 3.7Closings per Prod Support Employee per Mo. 14.4 11.3 10.7 9.2 6.9 8.9Closings per Total Prod. Employee per Mo. 1.3 1.6 1.4 1.3 1.3 1.4
Number of Companies Reporting 1 52 93 104 94 343
(1) Correspondent and Broker Income: Fee income earned on loans acquired from correspondents and brokers(2) Other Originations Income: Underwriting, processing, administration and other fees
QUARTERLY MORTGAGE BANKERS PERFORMANCE REPORT | Q1 2018 Results from the Mortgage Bankers Association© Mortgage Bankers Association 2018. All rights reserved. 33

QUARTER 1, 2018
Quarterly Mortgage Bankers Performance ReportResidential Loan Production ‐ By Average Loan BalanceH3 ‐ Production Mix ($), Simple Average
PERCENT BASED ON $ Your Firm <175,000
175,000‐
225,000
225,000‐
275,000 >275,000 Total Avg. Total Loans Originated ($000s) 282,960 131,535 360,693 703,649 433,169 449,801 Avg. Total Loans Originated (#) 1,175 890 1,749 2,847 1,436 1,866Average Loan Balance 240,612 149,556 202,151 248,153 335,690 244,722
Production Mix by Product TypeFirst Mortgages: 99.63 98.96 99.39 99.30 99.25 99.26Government (FHA/VA/RHS) ‐ Fixed 40.10 37.44 37.71 32.88 24.80 32.67Government (FHA/VA/RHS) ‐ ARM 0.23 1.75 1.31 0.28 0.18 0.76Prime (Conforming) ‐ Fixed 57.23 56.49 55.75 58.27 57.02 56.97Prime (Conforming) ‐ ARM 0.36 0.58 1.12 1.49 2.54 1.54Prime (Non‐Conforming Jumbo) ‐ Fixed 1.45 0.66 2.40 4.15 8.08 4.22Prime (Non‐Conforming Jumbo) ‐ ARM 0.25 0.27 0.92 1.55 2.99 1.58Other Fixed 1.62 0.14 0.54 2.08 1.02Other ARM 0.14 0.03 0.15 1.56 0.50
Closed‐End Second Mortgages 0.39 0.06 0.08 0.11 0.13Funded HELOCs 0.00 0.12 0.09 0.09 0.08Reverse 0.37 0.61 0.37 0.47 0.19 0.39Other 0.04 0.06 0.06 0.36 0.14
Total 100.00 100.00 100.00 100.00 100.00 100.00
1st Mtg Fixed Rate vs ARMFixed Rate 99.12 97.25 96.60 96.50 92.70 95.60ARM 0.88 2.75 3.40 3.50 7.30 4.40
Total 100.00 100.00 100.00 100.00 100.00 100.00
1st Mtg Jumbo vs. Non‐JumboJumbo 1.74 1.27 4.10 11.02 13.46 8.33Non‐Jumbo 98.26 98.73 95.90 88.98 86.54 91.67
Total 100.00 100.00 100.00 100.00 100.00 100.00
1st Mtg Production Channel MixRetail/Direct Marketing 33.14 77.12 83.32 86.20 87.37 84.37Wholesale/Broker and Correspondent 66.86 22.88 16.68 13.80 12.63 15.63
Total 100.00 100.00 100.00 100.00 100.00 100.001st Mtg Purchase vs RefiPurchase 62.90 71.39 71.48 69.54 72.65 71.20Refinancing 37.10 28.61 28.52 30.46 27.35 28.80
Rate‐Term 15.89 13.02 13.27 12.08 10.72 12.17Cash‐Out 21.21 14.12 14.79 17.35 16.09 15.82Other / Unknown 1.48 0.46 1.03 0.55 0.81
Total 100.00 100.00 100.00 100.00 100.00 100.00
1st Mtg FICO Score DistributionEquals 600 or less 2.62 1.61 2.64 1.34 0.97 1.63Greater than 600, less than or equal to 650 14.45 11.83 12.50 10.35 7.38 10.35Greater than 650, less than or equal to 700 25.25 24.95 22.88 21.47 18.27 21.51Greater than 700, less than or equal to 750 24.80 26.00 25.81 27.34 28.15 26.94Greater than 750 32.88 35.60 36.17 39.49 45.24 39.56
Total 100.00 100.00 100.00 100.00 100.00 100.00
1st Mtg Simple Average FICO (based on #) 705 717 715 721 733 722
1st Mtg LTV DistributionEquals 60% of less 10.86 6.59 7.29 8.95 13.44 9.36Greater than 60%, less than or equal to 70% 9.15 6.31 6.70 7.91 9.99 7.90Greater than 70%, less than or equal to 80% 28.70 24.08 23.96 27.85 30.82 27.03Greater than 80%, less than or equal to 90% 10.27 12.14 13.46 13.71 13.76 13.41Greater than 90%, less than or equal to 100% 38.62 47.56 44.93 39.32 31.24 39.90Greater than 100% 2.40 3.33 3.66 2.25 0.76 2.39
Total 100.00 100.00 100.00 100.00 100.00 100.001st Mtg Average LTV (based on $) 82.69 82.60 85.16 82.85 78.42 82.26
1st Mtg Production Sold by Investor TypeOriginated for Portfolio 0.01 0.09 0.07 0.35 0.14Originated for Sale to Others: 100.00 99.99 99.91 99.93 99.65 99.86Sale to Fannie/Freddie/Ginnie 18.58 49.04 41.17 29.28 23.15 33.85All Other Sale to Others 81.42 50.96 58.74 70.65 76.50 66.00
Total 100.00 100.00 100.00 100.00 100.00 100.001st Mtg Servicing Released vs RetainedServicing Released 81.42 63.33 76.85 78.86 83.16 77.38Servicing Retained 18.58 36.67 23.15 21.14 16.84 22.62
Total 100.00 100.00 100.00 100.00 100.00 100.00
Number of Companies Reporting 1 52 93 104 94 343
QUARTERLY MORTGAGE BANKERS PERFORMANCE REPORT | Q1 2018 Results from the Mortgage Bankers Association© Mortgage Bankers Association 2018. All rights reserved. 34

QUARTER 1, 2018
Quarterly Mortgage Bankers Performance ReportResidential Loan Production ‐ By Average Loan BalanceH4 ‐ Production Mix (#), Simple Average
PERCENT BASED ON # Your Firm <175,000
175,000‐
225,000
225,000‐
275,000 >275,000 Total Avg. Total Loans Originated ($000s) 282,960 131,535 360,693 703,649 433,169 449,801 Avg. Total Loans Originated (#) 1,175 890 1,749 2,847 1,436 1,866Average Loan Balance 240,612 149,556 202,151 248,153 335,690 244,722Production Mix by Product TypeFirst Mortgages: 99.51 96.21 98.24 97.32 98.08 97.61Government (FHA/VA/RHS) ‐ Fixed 44.97 38.33 40.07 34.57 25.45 34.13Government (FHA/VA/RHS) ‐ ARM 0.16 1.78 1.14 0.29 0.17 0.71Prime (Conforming) ‐ Fixed 53.56 53.69 54.89 58.67 61.49 57.66Prime (Conforming) ‐ ARM 0.25 0.39 0.86 1.22 2.38 1.31Prime (Non‐Conforming Jumbo) ‐ Fixed 0.50 0.18 0.80 1.62 4.10 1.86Prime (Non‐Conforming Jumbo) ‐ ARM 0.08 0.06 0.27 0.48 1.30 0.58Other Fixed 1.69 0.20 0.37 1.99 0.96Other ARM 0.07 0.02 0.11 1.20 0.38
Closed‐End Second Mortgages 3.27 1.11 1.55 0.81 1.49Funded HELOCs 0.00 0.26 0.20 0.21 0.19Reverse 0.49 0.48 0.34 0.74 0.40 0.50Other 0.05 0.05 0.19 0.50 0.21
Total 100.00 100.00 100.00 100.00 100.00 100.001st Mtg Fixed Rate vs ARMFixed Rate 99.48 97.67 97.70 97.84 94.90 96.97ARM 0.52 2.33 2.30 2.16 5.10 3.03
Total 100.00 100.00 100.00 100.00 100.00 100.00
1st Mtg Jumbo vs. Non‐JumboJumbo 0.59 0.35 1.41 7.15 7.11 4.55Non‐Jumbo 99.41 99.65 98.59 92.85 92.89 95.45
Total 100.00 100.00 100.00 100.00 100.00 100.001st Mtg Production Channel MixRetail/Direct Marketing 40.92 77.32 83.85 86.60 87.36 84.66Wholesale/Broker and Correspondent 59.08 22.68 16.15 13.40 12.64 15.34
Total 100.00 100.00 100.00 100.00 100.00 100.00
1st Mtg Purchase vs RefiPurchase 66.08 71.87 72.26 69.98 72.62 71.61Refinancing 33.92 28.13 27.74 30.02 27.38 28.39
Rate‐Term 13.84 12.91 12.93 11.44 10.45 11.79Cash‐Out 20.08 13.65 14.35 17.54 16.38 15.77Other / Unknown 1.58 0.46 1.04 0.56 0.83
Total 100.00 100.00 100.00 100.00 100.00 100.00
1st Mtg FICO Score DistributionEquals 600 or less 2.89 1.66 2.82 1.51 1.07 1.77Greater than 600, less than or equal to 650 17.33 12.67 14.17 11.67 8.33 11.59Greater than 650, less than or equal to 700 27.91 26.55 24.56 22.99 19.24 22.94Greater than 700, less than or equal to 750 23.39 25.91 24.98 26.70 27.71 26.39Greater than 750 28.48 33.22 33.47 37.12 43.64 37.31
Total 100.00 100.00 100.00 100.00 100.00 100.00
1st Mortgage Simple Average FICO (based on #) 705 717 715 721 733 7221st Mtg LTV DistributionEquals 60% of less 10.77 8.81 8.63 10.55 15.70 11.16Greater than 60%, less than or equal to 70% 8.04 6.04 6.52 7.44 9.33 7.49Greater than 70%, less than or equal to 80% 25.46 22.38 22.32 25.79 28.53 25.07Greater than 80%, less than or equal to 90% 9.49 11.42 12.24 12.65 13.00 12.45Greater than 90%, less than or equal to 100% 43.14 47.54 46.31 41.00 32.50 41.13Greater than 100% 3.10 3.81 3.98 2.57 0.93 2.70
Total 100.00 100.00 100.00 100.00 100.00 100.00
1st Mtg Average LTV (based on $) 83.69 82.60 85.16 82.85 78.42 82.26
1st Mtg Production Sold by Investor TypeOriginated for Portfolio 0.01 0.06 0.03 0.27 0.10Originated for Sale to Others: 100.00 99.99 99.94 99.97 99.73 99.90Sale to Fannie/Freddie/Ginnie 19.82 49.02 42.07 30.52 24.91 34.95All Other Sale to Others 80.18 50.97 57.87 69.45 74.82 64.95
Total 100.00 100.00 100.00 100.00 100.00 100.001st Mtg Servicing Released vs RetainedServicing Released 73.79 63.10 76.28 78.33 82.74 76.92Servicing Retained 26.21 36.90 23.72 21.67 17.26 23.08
Total 100.00 100.00 100.00 100.00 100.00 100.00
Number of Companies Reporting 1 52 93 104 94 343
QUARTERLY MORTGAGE BANKERS PERFORMANCE REPORT | Q1 2018 Results from the Mortgage Bankers Association© Mortgage Bankers Association 2018. All rights reserved. 35

QUARTER 1, 2018
Quarterly Mortgage Bankers Performance ReportResidential Loan Production ‐ By Average Loan BalanceH5 ‐ Production Mix (Avg Loan Balances), Simple Average
LOAN BALANCES Your Firm <175,000
175,000‐
225,000
225,000‐
275,000 >275,000 Total Avg. Total Loans Originated ($000s) 282,960 131,535 360,693 703,649 433,169 449,801 Avg. Total Loans Originated (#) 1,175 890 1,749 2,847 1,436 1,866Average Loan Balance 240,612 149,556 202,151 248,153 335,690 244,722
Production Mix by Product TypeFirst Mortgages: 240,882 154,142 204,677 254,037 339,901 249,041Government (FHA/VA/RHS) ‐ Fixed 214,564 144,212 191,062 235,499 319,482 231,950Government (FHA/VA/RHS) ‐ ARM 340,999 187,315 310,970 272,871 385,004 309,229Prime (Conforming) ‐ Fixed 257,086 159,755 206,085 247,221 307,659 239,414Prime (Conforming) ‐ ARM 351,666 257,161 277,138 336,945 376,534 328,025Prime (Non‐Conforming Jumbo) ‐ Fixed 690,832 596,244 650,738 684,367 754,791 690,655Prime (Non‐Conforming Jumbo) ‐ ARM 727,999 685,625 797,109 791,788 862,261 811,098Other Fixed 208,983 186,707 287,902 400,043 312,666Other ARM 320,775 377,717 365,254 608,586 451,921
Closed‐End Second Mortgages 24,745 21,245 27,330 50,771 32,296Funded HELOCs 111,671 105,010 140,090 118,961Reverse 176,199 133,874 142,687 204,205 181,005 174,752Other 143,327 245,447 191,157 116,275 170,973
1st Mtg Fixed Rate vs ARMFixed Rate 240,012 153,801 202,095 250,385 330,451 244,592ARM 410,832 321,179 422,195 461,431 559,966 468,381
1st Mtg Jumbo vs. Non‐JumboJumbo 696,142 621,713 649,385 675,836 770,121 690,816Non‐Jumbo 238,149 152,673 198,942 256,178 313,589 240,656
1st Mtg Production Channel MixRetail/Direct Marketing 195,227 152,863 201,554 251,227 336,500 246,631Wholesale/Broker and Correspondent 272,493 152,325 229,475 272,295 340,507 253,494
1st Mtg Purchase vs RefiPurchase 229,321 155,398 202,798 252,538 342,107 249,006Refinancing 263,437 158,253 214,938 260,089 333,470 252,080
Rate‐Term 276,369 166,258 217,539 271,024 345,330 260,749Cash‐Out 254,522 155,062 213,678 253,631 331,462 248,734Other / Unknown 142,258 235,052 246,857 486,939 282,816
1st Mtg FICO Score DistributionEquals 600 or less 216,823 137,136 188,360 215,405 296,191 214,783Greater than 600, less than or equal to 650 200,896 143,405 180,026 222,930 298,446 219,010Greater than 650, less than or equal to 700 217,641 144,603 190,002 236,118 320,179 232,522Greater than 700, less than or equal to 750 255,437 154,295 211,966 260,000 344,575 253,865Greater than 750 278,579 164,888 228,630 270,373 353,914 265,166
1st Mtg LTV DistributionEquals 60% of less 243,332 111,460 175,488 217,021 289,140 209,341Greater than 60%, less than or equal to 70% 274,000 157,418 213,350 270,841 363,851 262,973Greater than 70%, less than or equal to 80% 271,737 162,393 219,194 274,917 368,086 267,697Greater than 80%, less than or equal to 90% 260,693 163,841 225,353 276,518 360,144 267,943Greater than 90%, less than or equal to 100% 215,662 155,165 200,848 245,296 323,055 240,650Greater than 100% 182,296 128,358 166,331 207,868 241,477 189,346
1st Mtg Production Sold by Investor TypeOriginated for Portfolio 97,700 351,091 311,919 356,775 327,333Originated for Sale to Others: 240,887 153,734 203,556 251,188 336,402 246,535Sale to Fannie/Freddie/Ginnie 226,008 149,823 190,663 217,514 290,917 217,320All Other Sale to Others 244,563 159,018 216,404 265,972 360,590 265,049
1st Mtg Servicing Released vs RetainedServicing Released 265,793 166,295 208,314 280,334 338,543 262,296Servicing Retained 170,794 145,077 206,327 244,792 352,255 249,546
Number of Companies Reporting 1 52 93 104 94 343
QUARTERLY MORTGAGE BANKERS PERFORMANCE REPORT | Q1 2018 Results from the Mortgage Bankers Association© Mortgage Bankers Association 2018. All rights reserved. 36

QUARTER 1, 2018
Quarterly Mortgage Bankers Performance ReportResidential Loan Production ‐ Independent Mortgage Companies by Production $I1 ‐ Net Loan Production Income and Expense, $ per loan, Simple Average
$ PER LOAN Your Firm <50M 50‐100M 100‐250M >250MTotal
(Indep. Only) YTD 2018
ORIGINATION‐RELATED INCOMELoan Origination Fees 91 1,616 1,330 1,450 807 1,237 1,237 Correspondent and Broker Fee Income (1) 103 49 48 109 78 78 Other Origination‐Related Income (2) 1,202 719 501 528 383 506 506 Total Origination‐Related Income 1,293 2,439 1,881 2,025 1,299 1,821 1,821
NET INTEREST INCOMEWarehousing Income 645 445 503 496 589 520 520 Warehousing Expense 659 371 498 479 529 481 481
Net Interest Income (14) 75 5 16 60 39 39
SECONDARY MARKETING INCOMESecondary Mktg Gains (Losses) 7,614 3,900 4,528 5,357 5,099 4,867 4,867 Capitalized Servicing/Svg Released Premiums 397 2,407 2,697 2,580 2,501 2,545 2,545 Repurchase Reserve Provision ‐ (4) (38) (39) (67) (42) (42)
Net Secondary Marketing Income 8,011 6,303 7,186 7,898 7,533 7,370 7,370
Total Loan Production Revenue 9,290 8,817 9,072 9,939 8,892 9,230 9,230
EXPENSESPersonnel 4,920 5,963 6,327 6,505 5,975 6,199 6,199 Sales Personnel 2,382 2,267 2,717 2,869 2,646 2,662 2,662 Fulfillment Personnel 1,220 1,815 1,460 1,515 1,320 1,489 1,489 Production Support Employees 246 594 795 657 808 724 724 Management and Directors 216 534 489 574 400 492 492 Benefits 856 753 865 890 800 832 832
Occupancy and Equipment 587 554 586 585 577 577 577 Technology‐Related Expenses 241 212 260 260 201 231 231 Other Direct Expenses 2,949 2,113 1,891 1,856 1,660 1,839 1,839 Outsourcing and Professional fees 874 419 398 371 273 351 351 Other Operating Expenses 2,075 1,695 1,493 1,484 1,387 1,489 1,489
Direct Loan Production Expenses 8,697 8,842 9,063 9,205 8,412 8,847 8,847
Corporate Allocation 542 342 445 782 452 532 532
Total Loan Production Expense 9,253 9,183 9,508 9,987 8,865 9,379 9,379
TOTAL NET PRODUCTION INCOME 37 (367) (437) (48) 28 (149) (149)
MEMO ITEMSOriginations Volume:Avg. Total Loans Originated ($000s) 282,962 28,339 76,059 162,664 1,055,647 428,120 428,120 Avg. Total Loans Originated (#) 1,174 134 317 695 4,357 1,777 1,777 Average Loan Balance ($) 240,605 226,990 267,185 246,869 249,612 248,186 248,186 Avg. Pull‐Through (Closings/Applications #) 48.29 68.28 74.42 69.19 70.11 70.45 70.45
Average Days in Warehouse 19 14 15 14 18 16 16
Employees:Total Production FTEs (excluding 0 reporters) 287 41 134 226 849 390 390
ProductivitySimple Avg.Closings per Sales Employee per Mo. 3.2 4.0 3.7 3.5 4.9 4.1 4.1Closings per Fulfillment Employee per Mo. 3.4 3.8 5.5 4.2 5.5 4.8 4.8Closings per Prod Support Employee per Mo. 14.3 8.3 9.9 13.3 15.0 12.5 12.5Closings per Total Prod. Employee per Mo. 1.2 1.2 1.7 1.6 1.8 1.6 1.6
Weighted Avg.Closings per Sales Employee per Mo. 3.1 2.6 1.9 2.2 3.8 3.4 3.4Closings per Fulfillment Employee per Mo. 3.3 3.0 2.5 3.4 4.3 4.1 4.1Closings per Prod Support Employee per Mo. 14.3 5.0 4.2 7.3 10.4 9.4 9.4Closings per Total Prod. Employee per Mo. 1.5 1.1 0.8 1.0 1.7 1.5 1.5
MedianClosings per Sales Employee per Mo. 3.2 2.5 2.6 2.7 3.4 2.9 2.9Closings per Fulfillment Employee per Mo. 3.4 3.0 3.7 3.4 4.1 3.6 3.6Closings per Prod Support Employee per Mo. 14.4 6.4 7.8 9.4 11.5 8.8 8.8Closings per Total Prod. Employee per Mo. 1.2 1.0 1.2 1.2 1.4 1.3 1.3
Number of Companies Reporting 1 45 49 80 90 264 264
(1) Correspondent and Broker Income: Fee income earned on loans acquired from correspondents and brokers(2) Other Originations Income: Underwriting, processing, administration and other fees
QUARTERLY MORTGAGE BANKERS PERFORMANCE REPORT | Q1 2018 Results from the Mortgage Bankers Association© Mortgage Bankers Association 2018. All rights reserved. 37
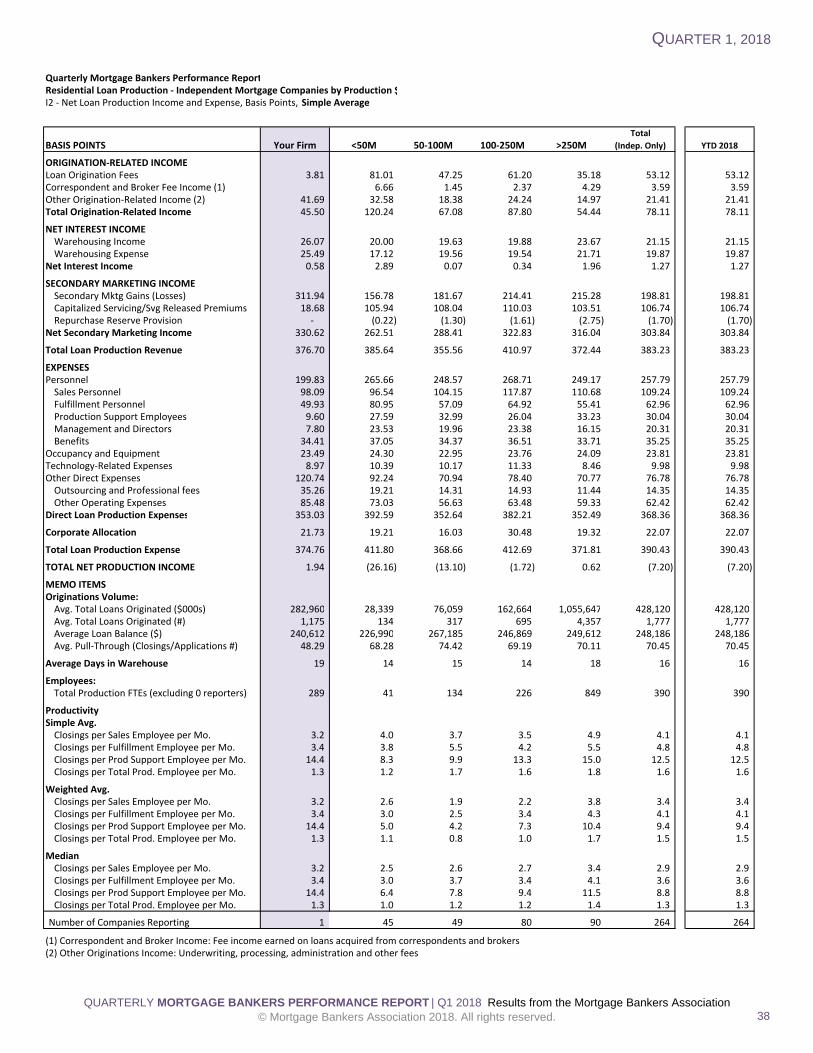
QUARTER 1, 2018
Quarterly Mortgage Bankers Performance ReportResidential Loan Production ‐ Independent Mortgage Companies by Production $I2 ‐ Net Loan Production Income and Expense, Basis Points, Simple Average
BASIS POINTS Your Firm <50M 50‐100M 100‐250M >250MTotal
(Indep. Only) YTD 2018
ORIGINATION‐RELATED INCOMELoan Origination Fees 3.81 81.01 47.25 61.20 35.18 53.12 53.12 Correspondent and Broker Fee Income (1) 6.66 1.45 2.37 4.29 3.59 3.59 Other Origination‐Related Income (2) 41.69 32.58 18.38 24.24 14.97 21.41 21.41 Total Origination‐Related Income 45.50 120.24 67.08 87.80 54.44 78.11 78.11
NET INTEREST INCOMEWarehousing Income 26.07 20.00 19.63 19.88 23.67 21.15 21.15 Warehousing Expense 25.49 17.12 19.56 19.54 21.71 19.87 19.87
Net Interest Income 0.58 2.89 0.07 0.34 1.96 1.27 1.27
SECONDARY MARKETING INCOMESecondary Mktg Gains (Losses) 311.94 156.78 181.67 214.41 215.28 198.81 198.81 Capitalized Servicing/Svg Released Premiums 18.68 105.94 108.04 110.03 103.51 106.74 106.74 Repurchase Reserve Provision ‐ (0.22) (1.30) (1.61) (2.75) (1.70) (1.70)
Net Secondary Marketing Income 330.62 262.51 288.41 322.83 316.04 303.84 303.84
Total Loan Production Revenue 376.70 385.64 355.56 410.97 372.44 383.23 383.23
EXPENSESPersonnel 199.83 265.66 248.57 268.71 249.17 257.79 257.79 Sales Personnel 98.09 96.54 104.15 117.87 110.68 109.24 109.24 Fulfillment Personnel 49.93 80.95 57.09 64.92 55.41 62.96 62.96 Production Support Employees 9.60 27.59 32.99 26.04 33.23 30.04 30.04 Management and Directors 7.80 23.53 19.96 23.38 16.15 20.31 20.31 Benefits 34.41 37.05 34.37 36.51 33.71 35.25 35.25
Occupancy and Equipment 23.49 24.30 22.95 23.76 24.09 23.81 23.81 Technology‐Related Expenses 8.97 10.39 10.17 11.33 8.46 9.98 9.98 Other Direct Expenses 120.74 92.24 70.94 78.40 70.77 76.78 76.78 Outsourcing and Professional fees 35.26 19.21 14.31 14.93 11.44 14.35 14.35 Other Operating Expenses 85.48 73.03 56.63 63.48 59.33 62.42 62.42
Direct Loan Production Expenses 353.03 392.59 352.64 382.21 352.49 368.36 368.36
Corporate Allocation 21.73 19.21 16.03 30.48 19.32 22.07 22.07
Total Loan Production Expense 374.76 411.80 368.66 412.69 371.81 390.43 390.43
TOTAL NET PRODUCTION INCOME 1.94 (26.16) (13.10) (1.72) 0.62 (7.20) (7.20)
MEMO ITEMSOriginations Volume:Avg. Total Loans Originated ($000s) 282,960 28,339 76,059 162,664 1,055,647 428,120 428,120 Avg. Total Loans Originated (#) 1,175 134 317 695 4,357 1,777 1,777 Average Loan Balance ($) 240,612 226,990 267,185 246,869 249,612 248,186 248,186 Avg. Pull‐Through (Closings/Applications #) 48.29 68.28 74.42 69.19 70.11 70.45 70.45
Average Days in Warehouse 19 14 15 14 18 16 16
Employees:Total Production FTEs (excluding 0 reporters) 289 41 134 226 849 390 390
ProductivitySimple Avg.Closings per Sales Employee per Mo. 3.2 4.0 3.7 3.5 4.9 4.1 4.1Closings per Fulfillment Employee per Mo. 3.4 3.8 5.5 4.2 5.5 4.8 4.8Closings per Prod Support Employee per Mo. 14.4 8.3 9.9 13.3 15.0 12.5 12.5Closings per Total Prod. Employee per Mo. 1.3 1.2 1.7 1.6 1.8 1.6 1.6
Weighted Avg.Closings per Sales Employee per Mo. 3.2 2.6 1.9 2.2 3.8 3.4 3.4Closings per Fulfillment Employee per Mo. 3.4 3.0 2.5 3.4 4.3 4.1 4.1Closings per Prod Support Employee per Mo. 14.4 5.0 4.2 7.3 10.4 9.4 9.4Closings per Total Prod. Employee per Mo. 1.3 1.1 0.8 1.0 1.7 1.5 1.5
MedianClosings per Sales Employee per Mo. 3.2 2.5 2.6 2.7 3.4 2.9 2.9Closings per Fulfillment Employee per Mo. 3.4 3.0 3.7 3.4 4.1 3.6 3.6Closings per Prod Support Employee per Mo. 14.4 6.4 7.8 9.4 11.5 8.8 8.8Closings per Total Prod. Employee per Mo. 1.3 1.0 1.2 1.2 1.4 1.3 1.3
Number of Companies Reporting 1 45 49 80 90 264 264
(1) Correspondent and Broker Income: Fee income earned on loans acquired from correspondents and brokers(2) Other Originations Income: Underwriting, processing, administration and other fees
QUARTERLY MORTGAGE BANKERS PERFORMANCE REPORT | Q1 2018 Results from the Mortgage Bankers Association© Mortgage Bankers Association 2018. All rights reserved. 38

QUARTER 1, 2018
Quarterly Mortgage Bankers Performance ReportResidential Loan Production ‐ Independent Mortgage Companies by Production $I3 ‐ Production Mix ($), Simple Average
PERCENT BASED ON $ Your Firm <50M 50‐100M 100‐250M >250MTotal
(Indep. Only) YTD 2018
Avg. Total Loans Originated ($000s) 282,960 28,339 76,059 162,664 1,055,647 428,120 428,120 Avg. Total Loans Originated (#) 1,175 134 317 695 4,357 1,777 1,777Average Loan Balance 240,612 226,990 267,185 246,869 249,612 248,186 248,186
Production Mix by Product TypeFirst Mortgages: 99.63 99.17 98.26 99.58 99.20 99.14 99.14Government (FHA/VA/RHS) ‐ Fixed 40.10 31.20 31.25 33.84 37.52 34.16 34.16Government (FHA/VA/RHS) ‐ ARM 0.23 2.04 0.16 1.26 0.16 0.81 0.81Prime (Conforming) ‐ Fixed 57.23 60.01 59.03 56.74 53.89 56.75 56.75Prime (Conforming) ‐ ARM 0.36 1.67 1.45 1.08 1.07 1.25 1.25Prime (Non‐Conforming Jumbo) ‐ Fixed 1.45 2.21 3.98 4.69 3.89 3.86 3.86Prime (Non‐Conforming Jumbo) ‐ ARM 0.25 1.91 1.22 1.29 1.54 1.47 1.47Other Fixed 0.06 0.15 0.36 0.37 0.28 0.28Other ARM 0.07 1.02 0.33 0.76 0.56 0.56
Closed‐End Second Mortgages 0.16 0.04 0.10 0.12 0.11 0.11Funded HELOCs 0.00 0.01 0.08 0.20 0.10 0.10Reverse 0.37 0.67 0.94 0.17 0.47 0.50 0.50Other 0.00 0.74 0.06 0.01 0.16 0.16
Total 100.00 100.00 100.00 100.00 100.00 100.00 100.00
1st Mtg Fixed Rate vs ARMFixed Rate 99.12 94.31 96.14 96.03 96.43 95.89 95.89ARM 0.88 5.69 3.86 3.97 3.57 4.11 4.11
Total 100.00 100.00 100.00 100.00 100.00 100.00 100.00
1st Mtg Jumbo vs. Non‐JumboJumbo 1.74 5.08 9.25 8.10 8.81 8.05 8.05Non‐Jumbo 98.26 94.92 90.75 91.90 91.19 91.95 91.95
Total 100.00 100.00 100.00 100.00 100.00 100.00 100.00
1st Mtg Production Channel MixRetail/Direct Marketing 33.14 88.08 89.71 89.05 78.50 85.44 85.44Wholesale/Broker and Correspondent 66.86 11.92 10.29 10.95 21.50 14.56 14.56
Total 100.00 100.00 100.00 100.00 100.00 100.00 100.00
1st Mtg Purchase vs RefiPurchase 62.90 72.91 71.09 73.19 68.83 71.27 71.27Refinancing 37.10 27.09 28.91 26.81 31.17 28.73 28.73
Rate‐Term 15.89 9.94 12.83 12.65 12.24 12.08 12.08Cash‐Out 21.21 14.71 16.00 13.64 18.22 15.83 15.83Other / Unknown 2.44 0.08 0.51 0.70 0.82 0.82
Total 100.00 100.00 100.00 100.00 100.00 100.00 100.00
1st Mtg FICO Score DistributionEquals 600 or less 2.62 1.56 1.36 1.50 1.68 1.55 1.55Greater than 600, less than or equal to 650 14.45 9.49 9.12 11.20 11.94 10.77 10.77Greater than 650, less than or equal to 700 25.25 22.57 20.52 21.35 22.66 21.85 21.85Greater than 700, less than or equal to 750 24.80 26.72 28.02 27.19 26.58 27.05 27.05Greater than 750 32.88 39.67 40.99 38.76 37.14 38.78 38.78
Total 100.00 100.00 100.00 100.00 100.00 100.00 100.001st Mtg Simple Average FICO (based on #) 705 724 726 720 717 721 721
1st Mtg LTV DistributionEquals 60% of less 10.86 10.21 10.01 8.30 9.16 9.24 9.24Greater than 60%, less than or equal to 70% 9.15 7.53 8.63 7.27 8.06 7.84 7.84Greater than 70%, less than or equal to 80% 28.70 25.35 28.09 26.81 26.08 26.55 26.55Greater than 80%, less than or equal to 90% 10.27 15.20 12.09 13.43 13.36 13.46 13.46Greater than 90%, less than or equal to 100% 38.62 40.14 39.29 40.28 41.42 40.46 40.46Greater than 100% 2.40 1.57 1.90 3.91 1.91 2.46 2.46
Total 100.00 100.00 100.00 100.00 100.00 100.00 100.00
1st Mtg Average LTV (based on $) 82.69 80.44 81.42 82.87 83.67 82.48 82.48
1st Mtg Production Sold by Investor TypeOriginated for Portfolio 0.12 0.03 0.09 0.01 0.06 0.06Originated for Sale to Others: 100.00 99.88 99.97 99.91 99.99 99.94 99.94Sale to Fannie/Freddie/Ginnie 18.58 35.65 18.59 20.01 46.42 31.60 31.60All Other Sale to Others 81.42 64.23 81.37 79.91 53.57 68.34 68.34
Total 100.00 100.00 100.00 100.00 100.00 100.00 100.001st Mtg Servicing Released vs RetainedServicing Released 81.42 77.37 88.60 86.46 69.62 79.54 79.54Servicing Retained 18.58 22.63 11.40 13.54 30.38 20.46 20.46
Total 100.00 100.00 100.00 100.00 100.00 100.00 100.00
Number of Companies Reporting 1 45 49 80 90 264 264
QUARTERLY MORTGAGE BANKERS PERFORMANCE REPORT | Q1 2018 Results from the Mortgage Bankers Association© Mortgage Bankers Association 2018. All rights reserved. 39

QUARTER 1, 2018
Quarterly Mortgage Bankers Performance ReportResidential Loan Production ‐ Independent Mortgage Companies by Production $I4 ‐ Production Mix (#), Simple Average
PERCENT BASED ON # Your Firm <50M 50‐100M 100‐250M >250MTotal
(Indep. Only) YTD 2018
Avg. Total Loans Originated ($000s) 282,960 28,339 76,059 162,664 1,055,647 428,120 428,120 Avg. Total Loans Originated (#) 1,175 134 317 695 4,357 1,777 1,777Average Loan Balance 240,612 226,990 267,185 246,869 249,612 248,186 248,186Production Mix by Product TypeFirst Mortgages: 99.51 98.28 96.92 98.25 96.98 97.58 97.58Government (FHA/VA/RHS) ‐ Fixed 44.97 32.85 32.56 35.71 39.26 35.85 35.85Government (FHA/VA/RHS) ‐ ARM 0.16 2.07 0.17 1.08 0.16 0.77 0.77Prime (Conforming) ‐ Fixed 53.56 60.42 60.01 57.45 53.80 57.19 57.19Prime (Conforming) ‐ ARM 0.25 1.35 1.18 0.91 0.80 1.00 1.00Prime (Non‐Conforming Jumbo) ‐ Fixed 0.50 0.90 1.73 2.07 1.50 1.61 1.61Prime (Non‐Conforming Jumbo) ‐ ARM 0.08 0.61 0.43 0.46 0.51 0.50 0.50Other Fixed 0.04 0.15 0.33 0.29 0.23 0.23Other ARM 0.04 0.68 0.25 0.64 0.43 0.43
Closed‐End Second Mortgages 1.10 0.92 1.26 1.76 1.34 1.34Funded HELOCs 0.03 0.05 0.19 0.45 0.22 0.22Reverse 0.49 0.60 1.06 0.27 0.77 0.64 0.64Other 0.00 1.06 0.03 0.04 0.22 0.22
Total 100.00 100.00 100.00 100.00 100.00 100.00 100.00
1st Mtg Fixed Rate vs ARMFixed Rate 99.48 95.91 97.50 97.26 97.82 97.26 97.26ARM 0.52 4.09 2.50 2.74 2.18 2.74 2.74
Total 100.00 100.00 100.00 100.00 100.00 100.00 100.00
1st Mtg Jumbo vs. Non‐JumboJumbo 0.59 1.99 6.07 4.20 4.88 4.41 4.41Non‐Jumbo 99.41 98.01 93.93 95.80 95.12 95.59 95.59
Total 100.00 100.00 100.00 100.00 100.00 100.00 100.00
1st Mtg Production Channel MixRetail/Direct Marketing 40.92 88.33 89.39 89.25 79.22 85.73 85.73Wholesale/Broker and Correspondent 59.08 11.67 10.61 10.75 20.78 14.27 14.27
Total 100.00 100.00 100.00 100.00 100.00 100.00 100.00
1st Mtg Purchase vs RefiPurchase 66.08 73.05 71.31 73.88 69.69 71.84 71.84Refinancing 33.92 26.95 28.69 26.12 30.31 28.16 28.16
Rate‐Term 13.84 9.69 12.47 11.95 11.60 11.54 11.54Cash‐Out 20.08 14.54 16.14 13.66 18.02 15.76 15.76Other / Unknown 2.73 0.07 0.51 0.69 0.87 0.87
Total 100.00 100.00 100.00 100.00 100.00 100.00 100.001st Mtg FICO Score DistributionEquals 600 or less 2.89 1.67 1.40 1.68 1.94 1.72 1.72Greater than 600, less than or equal to 650 17.33 10.47 10.24 12.70 13.46 12.12 12.12Greater than 650, less than or equal to 700 27.91 23.49 21.86 22.94 24.23 23.27 23.27Greater than 700, less than or equal to 750 23.39 26.80 27.60 26.50 25.73 26.50 26.50Greater than 750 28.48 37.57 38.89 36.18 34.64 36.40 36.40
Total 100.00 100.00 100.00 100.00 100.00 100.00 100.00
1st Mortgage Simple Average FICO (based on #) 705 724 726 720 717 721 721
1st Mtg LTV DistributionEquals 60% of less 10.77 11.51 11.63 10.06 10.44 10.73 10.73Greater than 60%, less than or equal to 70% 8.04 7.46 8.15 6.77 7.47 7.38 7.38Greater than 70%, less than or equal to 80% 25.46 23.94 26.40 24.77 23.94 24.65 24.65Greater than 80%, less than or equal to 90% 9.49 14.08 11.27 12.45 12.45 12.51 12.51Greater than 90%, less than or equal to 100% 43.14 41.20 40.33 41.82 43.39 41.97 41.97Greater than 100% 3.10 1.80 2.22 4.13 2.32 2.76 2.76
Total 100.00 100.00 100.00 100.00 100.00 100.00 100.00
1st Mtg Average LTV (based on $) 83.69 80.44 81.42 82.87 83.67 82.48 82.481st Mtg Production Sold by Investor TypeOriginated for Portfolio 0.19 0.03 0.06 0.01 0.06 0.06Originated for Sale to Others: 100.00 99.81 99.97 99.94 99.99 99.94 99.94Sale to Fannie/Freddie/Ginnie 19.82 35.71 19.14 21.03 47.80 32.51 32.51All Other Sale to Others 80.18 64.10 80.83 78.91 52.18 67.43 67.43
Total 100.00 100.00 100.00 100.00 100.00 100.00 100.001st Mtg Servicing Released vs RetainedServicing Released 73.79 77.02 88.22 86.20 68.53 78.95 78.95Servicing Retained 26.21 22.98 11.78 13.80 31.47 21.05 21.05
Total 100.00 100.00 100.00 100.00 100.00 100.00 100.00
Number of Companies Reporting 1 45 49 80 90 264 264
QUARTERLY MORTGAGE BANKERS PERFORMANCE REPORT | Q1 2018 Results from the Mortgage Bankers Association© Mortgage Bankers Association 2018. All rights reserved. 40

QUARTER 1, 2018
Quarterly Mortgage Bankers Performance ReportResidential Loan Production ‐ Independent Mortgage Companies by Production $I5 ‐ Production Mix (Avg Loan Balances), Simple Average
LOAN BALANCES Your Firm <50M 50‐100M 100‐250M >250MTotal
(Indep. Only) YTD 2018
Avg. Total Loans Originated ($000s) 282,960 28,339 76,059 162,664 1,055,647 428,120 428,120 Avg. Total Loans Originated (#) 1,175 134 317 695 4,357 1,777 1,777Average Loan Balance 240,612 226,990 267,185 246,869 249,612 248,186 248,186
Production Mix by Product TypeFirst Mortgages: 240,882 228,772 271,817 250,455 256,151 252,666 252,666Government (FHA/VA/RHS) ‐ Fixed 214,564 215,507 250,143 235,460 235,249 234,798 234,798Government (FHA/VA/RHS) ‐ ARM 340,999 234,648 323,514 284,609 328,747 312,646 312,646Prime (Conforming) ‐ Fixed 257,086 228,295 260,493 241,339 248,817 245,286 245,286Prime (Conforming) ‐ ARM 351,666 288,244 339,380 312,093 361,816 334,769 334,769Prime (Non‐Conforming Jumbo) ‐ Fixed 690,832 673,851 710,354 692,496 707,457 699,975 699,975Prime (Non‐Conforming Jumbo) ‐ ARM 727,999 859,984 850,376 779,692 853,952 831,533 831,533Other Fixed 325,000 304,685 279,344 391,367 341,170 341,170Other ARM 423,500 480,660 415,901 480,999 460,446 460,446
Closed‐End Second Mortgages 30,665 10,406 35,146 34,636 31,883 31,883Funded HELOCs 9,000 81,000 131,321 125,035 121,311 121,311Reverse 176,199 158,114 193,500 169,249 178,842 175,832 175,832Other 187,407 301,158 105,104 179,332 179,332
1st Mtg Fixed Rate vs ARMFixed Rate 240,012 224,723 266,163 246,557 251,496 248,158 248,158ARM 410,832 452,496 452,412 465,164 511,299 479,575 479,575
1st Mtg Jumbo vs. Non‐JumboJumbo 696,142 700,820 722,461 681,618 707,786 700,771 700,771Non‐Jumbo 238,149 219,041 261,335 240,188 256,037 246,014 246,014
1st Mtg Production Channel MixRetail/Direct Marketing 195,227 228,844 267,731 249,481 249,843 249,560 249,560Wholesale/Broker and Correspondent 272,493 224,189 272,376 251,351 284,171 267,349 267,349
1st Mtg Purchase vs RefiPurchase 229,321 229,052 273,287 249,532 253,405 251,779 251,779Refinancing 263,437 230,521 267,657 256,673 264,664 256,938 256,938
Rate‐Term 276,369 236,859 273,201 270,056 274,114 267,071 267,071Cash‐Out 254,522 237,983 264,592 247,505 261,010 254,066 254,066Other / Unknown 157,278 389,933 244,515 321,320 278,947 278,947
1st Mtg FICO Score DistributionEquals 600 or less 216,823 189,278 236,707 216,242 216,801 216,769 216,769Greater than 600, less than or equal to 650 200,896 209,235 228,210 220,791 221,721 220,500 220,500Greater than 650, less than or equal to 700 217,641 216,948 258,302 234,554 237,368 236,920 236,920Greater than 700, less than or equal to 750 255,437 223,376 276,042 258,206 264,915 257,867 257,867Greater than 750 278,579 242,214 285,793 273,566 274,972 271,014 271,014
1st Mtg LTV DistributionEquals 60% of less 243,332 200,242 227,953 208,489 225,351 216,506 216,506Greater than 60%, less than or equal to 70% 274,000 227,908 289,537 266,983 278,199 268,641 268,641Greater than 70%, less than or equal to 80% 271,737 239,834 289,353 271,227 279,169 272,070 272,070Greater than 80%, less than or equal to 90% 260,693 249,582 284,473 271,027 275,648 271,393 271,393Greater than 90%, less than or equal to 100% 215,662 225,848 259,324 242,614 241,642 242,526 242,526Greater than 100% 182,296 182,343 183,340 193,229 196,135 191,823 191,823
1st Mtg Production Sold by Investor TypeOriginated for Portfolio 141,833 361,875 284,443 197,415 231,434 231,434Originated for Sale to Others: 240,887 226,196 269,927 251,060 248,961 249,633 249,633Sale to Fannie/Freddie/Ginnie 226,008 197,881 258,451 209,843 226,546 221,365 221,365All Other Sale to Others 244,563 245,938 289,682 258,421 269,342 266,145 266,145
1st Mtg Servicing Released vs RetainedServicing Released 265,793 227,572 283,978 257,000 288,989 268,956 268,956Servicing Retained 170,794 261,581 316,060 258,722 229,837 254,252 254,252
Number of Companies Reporting 1 45 49 80 90 264 264
QUARTERLY MORTGAGE BANKERS PERFORMANCE REPORT | Q1 2018 Results from the Mortgage Bankers Association© Mortgage Bankers Association 2018. All rights reserved. 41

QUARTER 1, 2018
Quarterly Mortgage Bankers Performance ReportResidential Loan Production ‐ Independent Mortgage Companies, Retail Only by Production $J1 ‐ Net Loan Production Income and Expense, $ per loan, Simple Average
$ PER LOAN Your Firm <50M 50M ‐ 100M 100‐250M >250M
Total (Indep,
Retail Only) YTD 2018
ORIGINATION‐RELATED INCOMELoan Origination Fees 91 1,722 1,300 1,422 1,015 1,361 1,361 Correspondent and Broker Fee Income (1) ‐ ‐ ‐ ‐ ‐ ‐ Other Origination‐Related Income (2) 1,202 801 643 509 446 587 587 Total Origination‐Related Income 1,293 2,523 1,943 1,931 1,462 1,949 1,949
NET INTEREST INCOMEWarehousing Income 645 446 499 522 546 506 506 Warehousing Expense 659 390 460 495 478 460 460
Net Interest Income (14) 56 39 27 68 46 46
SECONDARY MARKETING INCOMESecondary Mktg Gains (Losses) 7,614 3,777 5,067 5,590 6,816 5,376 5,376 Capitalized Servicing/Svg Released Premiums 397 2,751 2,724 2,782 2,323 2,650 2,650 Repurchase Reserve Provision ‐ (2) (44) (43) (47) (35) (35)
Net Secondary Marketing Income 8,011 6,526 7,747 8,328 9,092 7,991 7,991
Total Loan Production Revenue 9,290 9,105 9,729 10,287 10,621 9,986 9,986
EXPENSESPersonnel 4,920 6,385 6,663 6,696 6,850 6,658 6,658 Sales Personnel 2,382 2,505 2,823 3,028 3,258 2,924 2,924 Fulfillment Personnel 1,220 1,824 1,530 1,331 1,565 1,541 1,541 Production Support Employees 246 718 839 777 840 793 793 Management and Directors 216 517 553 670 380 539 539 Benefits 856 820 919 891 808 861 861
Occupancy and Equipment 587 631 588 577 630 605 605 Technology‐Related Expenses 241 230 262 293 233 258 258 Other Direct Expenses 2,949 2,149 1,799 1,872 1,954 1,937 1,937 Outsourcing and Professional fees 874 378 429 424 249 372 372 Other Operating Expenses 2,075 1,771 1,369 1,448 1,705 1,565 1,565
Direct Loan Production Expenses 8,697 9,395 9,312 9,439 9,667 9,457 9,457
Corporate Allocation 542 283 403 800 473 519 519
Total Loan Production Expense 9,253 9,678 9,715 10,239 10,140 9,976 9,976
TOTAL NET PRODUCTION INCOME 37 (573) 14 48 481 10 10
MEMO ITEMSOriginations Volume:Avg. Total Loans Originated ($000s) 282,962 27,794 76,508 158,172 601,806 220,312 220,312 Avg. Total Loans Originated (#) 1,174 128 317 655 2,436 902 902 Average Loan Balance ($) 240,605 230,885 258,107 255,970 251,533 249,830 249,830 Avg. Pull‐Through (Closings/Applications #) 48.29 69.13 73.22 71.12 71.52 71.39 71.39
Average Days in Warehouse 19 13 16 15 16 15 15
Employees:Total Production FTEs (excluding 0 reporters) 287 42 157 238 647 277 277
ProductivitySimple Avg.Closings per Sales Employee per Mo. 3.2 3.4 3.5 3.4 3.5 3.4 3.4Closings per Fulfillment Employee per Mo. 3.4 3.6 4.8 4.4 4.5 4.4 4.4Closings per Prod Support Employee per Mo. 14.3 7.5 10.1 10.8 11.5 10.2 10.2Closings per Total Prod. Employee per Mo. 1.2 1.1 1.6 1.6 1.4 1.4 1.4
Weighted Avg.Closings per Sales Employee per Mo. 3.1 2.4 1.7 2.0 2.8 2.5 2.5Closings per Fulfillment Employee per Mo. 3.3 3.0 2.2 3.5 3.6 3.4 3.4Closings per Prod Support Employee per Mo. 14.3 4.3 3.7 6.8 8.0 7.0 7.0Closings per Total Prod. Employee per Mo. 1.5 1.0 0.7 0.9 1.3 1.1 1.1
MedianClosings per Sales Employee per Mo. 3.2 2.5 2.7 2.9 3.3 2.8 2.8Closings per Fulfillment Employee per Mo. 3.4 3.1 3.6 3.7 3.9 3.5 3.5Closings per Prod Support Employee per Mo. 14.4 5.5 8.5 8.0 10.2 7.9 7.9Closings per Total Prod. Employee per Mo. 1.2 1.0 1.2 1.3 1.3 1.2 1.2
Number of Companies Reporting 1 35 35 50 39 159 159
(1) Correspondent and Broker Income: Fee income earned on loans acquired from correspondents and brokers(2) Other Originations Income: Underwriting, processing, administration and other fees
QUARTERLY MORTGAGE BANKERS PERFORMANCE REPORT | Q1 2018 Results from the Mortgage Bankers Association© Mortgage Bankers Association 2018. All rights reserved. 42

QUARTER 1, 2018
Quarterly Mortgage Bankers Performance ReportResidential Loan Production ‐ Independent Mortgage Companies, Retail Only by Production $J2 ‐ Net Loan Production Income and Expense, Basis Points, Simple Average
BASIS POINTS Your Firm <50M 50M ‐ 100M 100‐250M >250M
Total (Indep,
Retail Only) YTD 2018
ORIGINATION‐RELATED INCOMELoan Origination Fees 3.81 87.44 45.85 57.72 44.73 58.46 58.46 Correspondent and Broker Fee Income (1) ‐ ‐ ‐ ‐ ‐ ‐ Other Origination‐Related Income (2) 41.69 36.54 23.87 23.21 17.43 24.87 24.87 Total Origination‐Related Income 45.50 123.98 69.72 80.92 62.16 83.33 83.33
NET INTEREST INCOMEWarehousing Income 26.07 20.42 19.89 20.26 21.44 20.51 20.51 Warehousing Expense 25.49 18.37 18.63 19.29 19.03 18.88 18.88
Net Interest Income 0.58 2.05 1.26 0.97 2.41 1.63 1.63
SECONDARY MARKETING INCOMESecondary Mktg Gains (Losses) 311.94 149.33 206.28 216.82 282.56 215.77 215.77 Capitalized Servicing/Svg Released Premiums 18.68 119.46 111.39 115.05 94.63 110.21 110.21 Repurchase Reserve Provision ‐ (0.11) (1.62) (1.78) (1.93) (1.41) (1.41)
Net Secondary Marketing Income 330.62 268.68 316.05 330.10 375.26 324.56 324.56
Total Loan Production Revenue 376.70 394.71 387.04 411.99 439.84 409.53 409.53
EXPENSESPersonnel 199.83 282.27 268.40 268.69 280.36 274.48 274.48 Sales Personnel 98.09 106.98 112.15 121.83 133.25 119.23 119.23 Fulfillment Personnel 49.93 80.45 61.31 56.46 65.38 64.99 64.99 Production Support Employees 9.60 32.56 35.30 28.89 33.34 32.20 32.20 Management and Directors 7.80 21.48 22.83 26.83 14.86 21.83 21.83 Benefits 34.41 40.80 36.82 34.69 33.53 36.22 36.22
Occupancy and Equipment 23.49 27.39 23.31 22.87 25.84 24.69 24.69 Technology‐Related Expenses 8.97 11.28 10.35 12.48 9.72 11.07 11.07 Other Direct Expenses 120.74 90.84 68.65 77.37 84.41 80.14 80.14 Outsourcing and Professional fees 35.26 17.49 15.81 16.28 10.17 14.95 14.95 Other Operating Expenses 85.48 73.35 52.84 61.08 74.23 65.20 65.20
Direct Loan Production Expenses 353.03 411.77 370.71 381.41 400.32 390.38 390.38
Corporate Allocation 21.73 15.98 16.30 29.95 20.33 21.51 21.51
Total Loan Production Expense 374.76 427.76 387.01 411.35 420.65 411.89 411.89
TOTAL NET PRODUCTION INCOME 1.94 (33.05) 0.03 0.64 19.19 (2.36) (2.36)
MEMO ITEMSOriginations Volume:Avg. Total Loans Originated ($000s) 282,960 27,794 76,508 158,172 601,806 220,312 220,312 Avg. Total Loans Originated (#) 1,175 128 317 655 2,436 902 902 Average Loan Balance ($) 240,612 230,885 258,107 255,970 251,533 249,830 249,830 Avg. Pull‐Through (Closings/Applications #) 48.29 69.13 73.22 71.12 71.52 71.39 71.39
Average Days in Warehouse 19 13 16 15 16 15 15
Employees:Total Production FTEs (excluding 0 reporters) 289 42 157 238 647 277 277
ProductivitySimple Avg.Closings per Sales Employee per Mo. 3.2 3.4 3.5 3.4 3.5 3.4 3.4Closings per Fulfillment Employee per Mo. 3.4 3.6 4.8 4.4 4.5 4.4 4.4Closings per Prod Support Employee per Mo. 14.4 7.5 10.1 10.8 11.5 10.2 10.2Closings per Total Prod. Employee per Mo. 1.3 1.1 1.6 1.6 1.4 1.4 1.4
Weighted Avg.Closings per Sales Employee per Mo. 3.2 2.4 1.7 2.0 2.8 2.5 2.5Closings per Fulfillment Employee per Mo. 3.4 3.0 2.2 3.5 3.6 3.4 3.4Closings per Prod Support Employee per Mo. 14.4 4.3 3.7 6.8 8.0 7.0 7.0Closings per Total Prod. Employee per Mo. 1.3 1.0 0.7 0.9 1.3 1.1 1.1
MedianClosings per Sales Employee per Mo. 3.2 2.5 2.7 2.9 3.3 2.8 2.8Closings per Fulfillment Employee per Mo. 3.4 3.1 3.6 3.7 3.9 3.5 3.5Closings per Prod Support Employee per Mo. 14.4 5.5 8.5 8.0 10.2 7.9 7.9Closings per Total Prod. Employee per Mo. 1.3 1.0 1.2 1.3 1.3 1.2 1.2
Number of Companies Reporting 1 35 35 50 39 159 159
(1) Correspondent and Broker Income: Fee income earned on loans acquired from correspondents and brokers(2) Other Originations Income: Underwriting, processing, administration and other fees
QUARTERLY MORTGAGE BANKERS PERFORMANCE REPORT | Q1 2018 Results from the Mortgage Bankers Association© Mortgage Bankers Association 2018. All rights reserved. 43

QUARTER 1, 2018
Quarterly Mortgage Bankers Performance ReportResidential Loan Production ‐ Independent Mortgage Companies, Retail Only by Production $J3 ‐ Production Mix ($), Simple Average
PERCENT BASED ON $ Your Firm <50M 50M ‐ 100M 100‐250M >250M
Total (Indep,
Retail Only) YTD 2018Avg. Total Loans Originated ($000s) 282,960 27,794 76,508 158,172 601,806 220,312 220,312 Avg. Total Loans Originated (#) 1,175 128 317 655 2,436 902 902Average Loan Balance 240,612 230,885 258,107 255,970 251,533 249,830 249,830Production Mix by Product TypeFirst Mortgages: 99.63 98.95 98.45 99.51 99.33 99.11 99.11Government (FHA/VA/RHS) ‐ Fixed 40.10 30.56 31.21 31.14 34.90 31.95 31.95Government (FHA/VA/RHS) ‐ ARM 0.23 2.61 0.23 0.01 0.04 0.64 0.64Prime (Conforming) ‐ Fixed 57.23 59.48 59.92 58.53 55.81 58.38 58.38Prime (Conforming) ‐ ARM 0.36 1.84 1.43 1.47 1.25 1.49 1.49Prime (Non‐Conforming Jumbo) ‐ Fixed 1.45 2.08 3.86 5.74 4.67 4.26 4.26Prime (Non‐Conforming Jumbo) ‐ ARM 0.25 2.21 1.49 1.67 2.50 1.95 1.95Other Fixed 0.08 0.07 0.53 0.13 0.23 0.23Other ARM 0.09 0.24 0.42 0.02 0.21 0.21
Closed‐End Second Mortgages 0.21 0.05 0.14 0.16 0.14 0.14Funded HELOCs 0.00 0.01 0.10 0.37 0.13 0.13Reverse 0.37 0.85 0.44 0.16 0.13 0.37 0.37Other 0.00 1.04 0.09 0.01 0.26 0.26
Total 100.00 100.00 100.00 100.00 100.00 100.00 100.00
1st Mtg Fixed Rate vs ARMFixed Rate 99.12 93.23 96.60 96.41 96.15 95.69 95.69ARM 0.88 6.77 3.40 3.59 3.85 4.31 4.31
Total 100.00 100.00 100.00 100.00 100.00 100.00 100.00
1st Mtg Jumbo vs. Non‐JumboJumbo 1.74 5.24 7.36 9.91 10.50 8.48 8.48Non‐Jumbo 98.26 94.76 92.64 90.09 89.50 91.52 91.52
Total 100.00 100.00 100.00 100.00 100.00 100.00 100.00
1st Mtg Production Channel MixRetail/Direct Marketing 33.14 100.00 100.00 100.00 100.00 100.00 100.00Wholesale/Broker and Correspondent 66.86 0.00 0.00 0.00 0.00 0.00 0.00
Total 100.00 100.00 100.00 100.00 100.00 100.00 100.001st Mtg Purchase vs RefiPurchase 62.90 74.85 74.11 77.29 72.50 74.88 74.88Refinancing 37.10 25.15 25.89 22.71 27.50 25.12 25.12
Rate‐Term 15.89 8.64 12.64 8.88 10.43 10.03 10.03Cash‐Out 21.21 14.97 13.23 13.14 17.06 14.53 14.53Other / Unknown 1.54 0.02 0.69 0.01 0.56 0.56
Total 100.00 100.00 100.00 100.00 100.00 100.00 100.00
1st Mtg FICO Score DistributionEquals 600 or less 2.62 1.21 0.88 0.70 1.17 0.97 0.97Greater than 600, less than or equal to 650 14.45 9.44 8.32 9.18 10.98 9.49 9.49Greater than 650, less than or equal to 700 25.25 21.76 19.67 19.57 21.80 20.62 20.62Greater than 700, less than or equal to 750 24.80 26.63 27.64 27.88 26.52 27.22 27.22Greater than 750 32.88 40.96 43.49 42.66 39.53 41.70 41.70
Total 100.00 100.00 100.00 100.00 100.00 100.00 100.00
1st Mtg Simple Average FICO (based on #) 705 726 729 726 722 726 726
1st Mtg LTV DistributionEquals 60% of less 10.86 9.65 8.95 8.60 8.35 8.84 8.84Greater than 60%, less than or equal to 70% 9.15 7.43 7.52 7.45 7.63 7.50 7.50Greater than 70%, less than or equal to 80% 28.70 26.17 28.14 28.59 27.36 27.66 27.66Greater than 80%, less than or equal to 90% 10.27 15.17 12.58 13.75 13.59 13.77 13.77Greater than 90%, less than or equal to 100% 38.62 40.59 41.15 40.39 41.57 40.89 40.89Greater than 100% 2.40 1.00 1.66 1.22 1.50 1.34 1.34
Total 100.00 100.00 100.00 100.00 100.00 100.00 100.00
1st Mtg Average LTV (based on $) 82.69 79.51 82.32 81.72 83.83 81.91 81.911st Mtg Production Sold by Investor TypeOriginated for Portfolio 0.04 0.05 0.14 0.01 0.07 0.07Originated for Sale to Others: 100.00 99.96 99.95 99.86 99.99 99.93 99.93Sale to Fannie/Freddie/Ginnie 18.58 32.19 14.54 11.69 35.42 22.83 22.83All Other Sale to Others 81.42 67.77 85.41 88.17 64.57 77.11 77.11
Total 100.00 100.00 100.00 100.00 100.00 100.00 100.001st Mtg Servicing Released vs RetainedServicing Released 81.42 78.77 87.87 90.90 81.35 85.32 85.32Servicing Retained 18.58 21.23 12.13 9.10 18.65 14.68 14.68
Total 100.00 100.00 100.00 100.00 100.00 100.00 100.00
Number of Companies Reporting 1 35 35 50 39 159 159
QUARTERLY MORTGAGE BANKERS PERFORMANCE REPORT | Q1 2018 Results from the Mortgage Bankers Association© Mortgage Bankers Association 2018. All rights reserved. 44

QUARTER 1, 2018
Quarterly Mortgage Bankers Performance ReportResidential Loan Production ‐ Independent Mortgage Companies, Retail Only by Production $J4 ‐ Production Mix (#), Simple Average
PERCENT BASED ON # Your Firm <50M 50M ‐ 100M 100‐250M >250M
Total (Indep,
Retail Only) YTD 2018Avg. Total Loans Originated ($000s) 282,960 27,794 76,508 158,172 601,806 220,312 220,312 Avg. Total Loans Originated (#) 1,175 128 317 655 2,436 902 902Average Loan Balance 240,612 230,885 258,107 255,970 251,533 249,830 249,830
Production Mix by Product TypeFirst Mortgages: 99.51 97.88 96.41 98.09 96.67 97.33 97.33Government (FHA/VA/RHS) ‐ Fixed 44.97 32.05 32.04 33.08 36.16 33.38 33.38Government (FHA/VA/RHS) ‐ ARM 0.16 2.65 0.23 0.01 0.03 0.65 0.65Prime (Conforming) ‐ Fixed 53.56 60.07 60.63 59.74 56.56 59.23 59.23Prime (Conforming) ‐ ARM 0.25 1.51 1.21 1.26 1.04 1.25 1.25Prime (Non‐Conforming Jumbo) ‐ Fixed 0.50 0.80 1.55 2.59 1.85 1.78 1.78Prime (Non‐Conforming Jumbo) ‐ ARM 0.08 0.71 0.49 0.60 0.88 0.67 0.67Other Fixed 0.05 0.06 0.48 0.14 0.21 0.21Other ARM 0.05 0.21 0.32 0.02 0.16 0.16
Closed‐End Second Mortgages 1.38 1.23 1.39 2.27 1.57 1.57Funded HELOCs 0.00 0.06 0.24 0.83 0.29 0.29Reverse 0.49 0.74 0.82 0.23 0.20 0.47 0.47Other 0.00 1.48 0.05 0.02 0.35 0.35
Total 100.00 100.00 100.00 100.00 100.00 100.00 100.00
1st Mtg Fixed Rate vs ARMFixed Rate 99.48 95.06 97.81 97.77 97.96 97.23 97.23ARM 0.52 4.94 2.19 2.23 2.04 2.77 2.77
Total 100.00 100.00 100.00 100.00 100.00 100.00 100.00
1st Mtg Jumbo vs. Non‐JumboJumbo 0.59 2.01 4.41 5.45 5.68 4.54 4.54Non‐Jumbo 99.41 97.99 95.59 94.55 94.32 95.46 95.46
Total 100.00 100.00 100.00 100.00 100.00 100.00 100.001st Mtg Production Channel MixRetail/Direct Marketing 40.92 100.00 100.00 100.00 100.00 100.00 100.00Wholesale/Broker and Correspondent 59.08 0.00 0.00 0.00 0.00 0.00 0.00
Total 100.00 100.00 100.00 100.00 100.00 100.00 100.00
1st Mtg Purchase vs RefiPurchase 66.08 74.94 73.98 77.74 73.01 75.14 75.14Refinancing 33.92 25.06 26.02 22.26 26.99 24.86 24.86
Rate‐Term 13.84 8.54 12.29 8.38 9.80 9.63 9.63Cash‐Out 20.08 14.69 13.71 13.22 17.18 14.62 14.62Other / Unknown 1.83 0.03 0.66 0.01 0.62 0.62
Total 100.00 100.00 100.00 100.00 100.00 100.00 100.00
1st Mtg FICO Score DistributionEquals 600 or less 2.89 1.25 0.91 0.80 1.31 1.05 1.05Greater than 600, less than or equal to 650 17.33 10.06 9.55 10.56 12.31 10.66 10.66Greater than 650, less than or equal to 700 27.91 23.03 21.18 21.12 23.30 22.09 22.09Greater than 700, less than or equal to 750 23.39 26.79 27.09 27.23 25.83 26.76 26.76Greater than 750 28.48 38.88 41.27 40.29 37.25 39.45 39.45
Total 100.00 100.00 100.00 100.00 100.00 100.00 100.00
1st Mortgage Simple Average FICO (based on #) 705 726 729 726 722 726 726
1st Mtg LTV DistributionEquals 60% of less 10.77 10.65 10.51 10.18 9.78 10.26 10.26Greater than 60%, less than or equal to 70% 8.04 7.36 7.24 6.92 7.21 7.16 7.16Greater than 70%, less than or equal to 80% 25.46 24.98 26.54 26.40 25.04 25.78 25.78Greater than 80%, less than or equal to 90% 9.49 14.01 11.59 12.72 12.69 12.75 12.75Greater than 90%, less than or equal to 100% 43.14 41.83 42.24 42.18 43.47 42.43 42.43Greater than 100% 3.10 1.18 1.88 1.60 1.80 1.62 1.62
Total 100.00 100.00 100.00 100.00 100.00 100.00 100.00
1st Mtg Average LTV (based on $) 83.69 79.51 82.32 81.72 83.83 81.91 81.91
1st Mtg Production Sold by Investor TypeOriginated for Portfolio 0.14 0.04 0.10 0.01 0.07 0.07Originated for Sale to Others: 100.00 99.86 99.96 99.90 99.99 99.93 99.93Sale to Fannie/Freddie/Ginnie 19.82 31.79 15.07 12.85 36.62 23.53 23.53All Other Sale to Others 80.18 68.07 84.88 87.05 63.36 76.40 76.40
Total 100.00 100.00 100.00 100.00 100.00 100.00 100.001st Mtg Servicing Released vs RetainedServicing Released 73.79 78.83 87.52 90.82 80.46 85.02 85.02Servicing Retained 26.21 21.17 12.48 9.18 19.54 14.98 14.98
Total 100.00 100.00 100.00 100.00 100.00 100.00 100.00Number of Companies Reporting 1 35 35 50 39 159 159
QUARTERLY MORTGAGE BANKERS PERFORMANCE REPORT | Q1 2018 Results from the Mortgage Bankers Association© Mortgage Bankers Association 2018. All rights reserved. 45

QUARTER 1, 2018
Quarterly Mortgage Bankers Performance ReportResidential Loan Production ‐ Independent Mortgage Companies, Retail Only by Production $J5 ‐ Production Mix (Avg Loan Balances), Simple Average
LOAN BALANCES Your Firm <50M 50M ‐ 100M 100‐250M >250M
Total (Indep,
Retail Only) YTD 2018Avg. Total Loans Originated ($000s) 282,960 27,794 76,508 158,172 601,806 220,312 220,312 Avg. Total Loans Originated (#) 1,175 128 317 655 2,436 902 902Average Loan Balance 240,612 230,885 258,107 255,970 251,533 249,830 249,830
Production Mix by Product TypeFirst Mortgages: 240,882 232,978 264,771 259,750 258,564 254,671 254,671Government (FHA/VA/RHS) ‐ Fixed 214,564 220,444 248,888 243,120 238,698 238,329 238,329Government (FHA/VA/RHS) ‐ ARM 340,999 262,531 323,514 378,625 415,596 361,315 361,315Prime (Conforming) ‐ Fixed 257,086 231,993 255,184 247,732 246,710 245,725 245,725Prime (Conforming) ‐ ARM 351,666 291,455 316,347 328,086 340,879 323,705 323,705Prime (Non‐Conforming Jumbo) ‐ Fixed 690,832 680,057 703,034 687,821 712,940 697,547 697,547Prime (Non‐Conforming Jumbo) ‐ ARM 727,999 864,230 835,666 753,632 842,093 813,198 813,198Other Fixed 325,000 331,667 276,244 259,495 291,224 291,224Other ARM 423,500 349,400 360,109 235,042 313,270 313,270
Closed‐End Second Mortgages 32,408 10,484 40,574 36,347 33,482 33,482Funded HELOCs 81,500 99,335 112,025 104,507 104,507Reverse 176,199 165,737 193,968 182,450 177,911 180,959 180,959Other 187,407 301,158 148,389 218,130 218,130
1st Mtg Fixed Rate vs ARMFixed Rate 240,012 228,428 261,418 255,376 252,784 250,138 250,138ARM 410,832 436,384 439,352 478,352 533,299 479,123 479,123
1st Mtg Jumbo vs. Non‐JumboJumbo 696,142 714,592 711,546 683,178 711,979 701,872 701,872Non‐Jumbo 238,149 222,597 258,530 248,203 261,260 248,203 248,203
1st Mtg Production Channel MixRetail/Direct Marketing 195,227 232,978 264,771 259,750 258,564 254,671 254,671Wholesale/Broker and Correspondent 272,493
1st Mtg Purchase vs RefiPurchase 229,321 233,263 268,705 260,092 256,691 255,248 255,248Refinancing 263,437 236,725 254,884 263,659 262,370 255,486 255,486
Rate‐Term 276,369 245,235 269,412 276,419 276,246 268,653 268,653Cash‐Out 254,522 247,039 249,653 254,784 257,509 252,717 252,717Other / Unknown 139,023 227,000 250,134 221,000 201,934 201,934
1st Mtg FICO Score DistributionEquals 600 or less 216,823 187,228 223,087 220,229 220,058 216,044 216,044Greater than 600, less than or equal to 650 200,896 218,447 224,840 224,553 224,653 223,308 223,308Greater than 650, less than or equal to 700 217,641 216,565 250,423 242,630 238,846 237,680 237,680Greater than 700, less than or equal to 750 255,437 225,410 270,981 266,846 265,585 258,325 258,325Greater than 750 278,579 245,659 279,495 273,343 273,836 268,870 268,870
1st Mtg LTV DistributionEquals 60% of less 243,332 209,107 219,749 223,238 222,065 219,135 219,135Greater than 60%, less than or equal to 70% 274,000 228,752 277,609 278,757 276,610 267,212 267,212Greater than 70%, less than or equal to 80% 271,737 240,577 281,281 283,314 282,856 273,554 273,554Greater than 80%, less than or equal to 90% 260,693 257,581 284,322 281,843 276,336 275,642 275,642Greater than 90%, less than or equal to 100% 215,662 227,035 257,144 250,931 244,904 245,560 245,560Greater than 100% 182,296 189,964 186,521 192,018 195,005 191,575 191,575
1st Mtg Production Sold by Investor TypeOriginated for Portfolio 61,250 361,875 284,443 173,333 233,069 233,069Originated for Sale to Others: 240,887 229,373 264,500 262,594 250,686 252,727 252,727Sale to Fannie/Freddie/Ginnie 226,008 196,964 237,890 203,294 226,210 214,162 214,162All Other Sale to Others 244,563 250,291 268,500 270,632 270,359 266,026 266,026
1st Mtg Servicing Released vs RetainedServicing Released 265,793 224,879 269,537 266,354 268,765 258,955 258,955Servicing Retained 170,794 276,800 312,079 258,906 246,501 267,603 267,603
Number of Companies Reporting 1 35 35 50 39 159 159
QUARTERLY MORTGAGE BANKERS PERFORMANCE REPORT | Q1 2018 Results from the Mortgage Bankers Association© Mortgage Bankers Association 2018. All rights reserved. 46

QUARTER 1, 2018
Quarterly Mortgage Bankers Performance ReportResidential Loan Production ‐ by Govt. Production Percent in $K1 ‐ Net Loan Production Income and Expense, $ per loan, Simple Average
$ PER LOAN Your Firm
<50%
Govt $
>=50%
Govt $ Total
ORIGINATION‐RELATED INCOMELoan Origination Fees 91 1,128 1,363 1,161 Correspondent and Broker Fee Income (1) 97 89 96 Other Origination‐Related Income (2) 1,202 530 284 495 Total Origination‐Related Income 1,293 1,755 1,735 1,752
NET INTEREST INCOMEWarehousing Income 645 515 476 510 Warehousing Expense 659 449 542 462
Net Interest Income (14) 66 (66) 47
SECONDARY MARKETING INCOMESecondary Mktg Gains (Losses) 7,614 4,575 4,411 4,551 Capitalized Servicing/Svg Released Premiums 397 2,583 2,228 2,532 Repurchase Reserve Provision ‐ (40) (59) (43)
Net Secondary Marketing Income 8,011 7,117 6,580 7,040
Total Loan Production Revenue 9,290 8,938 8,249 8,840
EXPENSESPersonnel 4,920 6,059 4,937 5,899 Sales Personnel 2,382 2,526 2,132 2,469 Fulfillment Personnel 1,220 1,439 1,260 1,414 Production Support Employees 246 705 561 685 Management and Directors 216 500 332 476 Benefits 856 888 652 855
Occupancy and Equipment 587 554 444 539 Technology‐Related Expenses 241 215 242 219 Other Direct Expenses 2,949 1,716 1,971 1,753 Outsourcing and Professional fees 874 325 386 333 Other Operating Expenses 2,075 1,392 1,585 1,419
Direct Loan Production Expenses 8,697 8,545 7,595 8,409
Corporate Allocation 542 572 409 548
Total Loan Production Expense 9,253 9,116 8,004 8,957
TOTAL NET PRODUCTION INCOME 37 (178) 245 (118)
MEMO ITEMSOriginations Volume:Avg. Total Loans Originated ($000s) 282,962 421,410 620,144 449,801 Avg. Total Loans Originated (#) 1,174 1,694 2,899 1,866 Average Loan Balance ($) 240,605 251,087 206,529 244,722 Avg. Pull‐Through (Closings/Applications #) 48.29 69.83 70.19 69.88
Average Days in Warehouse 19 16 20 16
Employees:Total Production FTEs (excluding 0 reporters) 287 381 375 380
ProductivitySimple Avg.Closings per Sales Employee per Mo. 3.2 4.6 6.4 4.9Closings per Fulfillment Employee per Mo. 3.4 4.9 6.8 5.2Closings per Prod Support Employee per Mo. 14.3 12.4 16.1 12.9Closings per Total Prod. Employee per Mo. 1.2 1.7 3.4 1.9
Weighted Avg.Closings per Sales Employee per Mo. 3.1 3.4 5.5 3.7Closings per Fulfillment Employee per Mo. 3.3 4.1 5.6 4.3Closings per Prod Support Employee per Mo. 14.3 9.8 11.0 10.0Closings per Total Prod. Employee per Mo. 1.5 1.5 2.6 1.6
MedianClosings per Sales Employee per Mo. 3.2 3.2 3.3 3.2Closings per Fulfillment Employee per Mo. 3.4 3.7 3.7 3.7Closings per Prod Support Employee per Mo. 14.4 8.5 11.1 8.9Closings per Total Prod. Employee per Mo. 1.2 1.4 1.4 1.4
Number of Companies Reporting 1 294 49 343
(1) Correspondent and Broker Income: Fee income earned on loans acquired from correspondents and brokers(2) Other Originations Income: Underwriting, processing, administration and other fees
QUARTERLY MORTGAGE BANKERS PERFORMANCE REPORT | Q1 2018 Results from the Mortgage Bankers Association© Mortgage Bankers Association 2018. All rights reserved. 47

QUARTER 1, 2018
Quarterly Mortgage Bankers Performance ReportResidential Loan Production ‐ by Govt. Production Percent in $K2 ‐ Net Loan Production Income and Expense, Basis Points, Simple Average
BASIS POINTS Your Firm
<50%
Govt $
>=50%
Govt $ Total
ORIGINATION‐RELATED INCOMELoan Origination Fees 3.81 47.71 68.65 50.70 Correspondent and Broker Fee Income (1) 4.89 4.27 4.80 Other Origination‐Related Income (2) 41.69 21.72 12.13 20.35 Total Origination‐Related Income 45.50 74.31 85.04 75.84
NET INTEREST INCOMEWarehousing Income 26.07 20.19 23.48 20.66 Warehousing Expense 25.49 17.83 26.73 19.10
Net Interest Income 0.58 2.36 (3.25) 1.56
SECONDARY MARKETING INCOMESecondary Mktg Gains (Losses) 311.94 185.87 206.24 188.78 Capitalized Servicing/Svg Released Premiums 18.68 104.17 111.48 105.21 Repurchase Reserve Provision ‐ (1.56) (2.62) (1.71)
Net Secondary Marketing Income 330.62 288.48 315.09 292.28
Total Loan Production Revenue 376.70 365.15 396.88 369.68
EXPENSESPersonnel 199.83 248.88 242.19 247.92 Sales Personnel 98.09 102.04 100.92 101.88 Fulfillment Personnel 49.93 59.87 62.49 60.25 Production Support Employees 9.60 29.11 28.97 29.09 Management and Directors 7.80 20.60 16.43 20.00 Benefits 34.41 37.25 33.38 36.70
Occupancy and Equipment 23.49 22.71 21.48 22.54 Technology‐Related Expenses 8.97 9.18 12.02 9.59 Other Direct Expenses 120.74 71.22 93.15 74.36 Outsourcing and Professional fees 35.26 13.49 16.75 13.95 Other Operating Expenses 85.48 57.73 76.40 60.40
Direct Loan Production Expenses 353.03 351.99 368.84 354.40
Corporate Allocation 21.73 23.44 20.64 23.04
Total Loan Production Expense 374.76 375.43 389.48 377.44
TOTAL NET PRODUCTION INCOME 1.94 (10.29) 7.40 (7.76)
MEMO ITEMSOriginations Volume:Avg. Total Loans Originated ($000s) 282,960 421,410 620,144 449,801 Avg. Total Loans Originated (#) 1,175 1,694 2,899 1,866 Average Loan Balance ($) 240,612 251,087 206,529 244,722 Avg. Pull‐Through (Closings/Applications #) 48.29 69.83 70.19 69.88
Average Days in Warehouse 19 16 20 16
Employees:Total Production FTEs (excluding 0 reporters) 289 381 375 380
ProductivitySimple Avg.Closings per Sales Employee per Mo. 3.2 4.6 6.4 4.9Closings per Fulfillment Employee per Mo. 3.4 4.9 6.8 5.2Closings per Prod Support Employee per Mo. 14.4 12.4 16.1 12.9Closings per Total Prod. Employee per Mo. 1.3 1.7 3.4 1.9
Weighted Avg.Closings per Sales Employee per Mo. 3.2 3.4 5.5 3.7Closings per Fulfillment Employee per Mo. 3.4 4.1 5.6 4.3Closings per Prod Support Employee per Mo. 14.4 9.8 11.0 10.0Closings per Total Prod. Employee per Mo. 1.3 1.5 2.6 1.6
MedianClosings per Sales Employee per Mo. 3.2 3.2 3.3 3.2Closings per Fulfillment Employee per Mo. 3.4 3.7 3.7 3.7Closings per Prod Support Employee per Mo. 14.4 8.5 11.1 8.9Closings per Total Prod. Employee per Mo. 1.3 1.4 1.4 1.4
Number of Companies Reporting 1 294 49 343
(1) Correspondent and Broker Income: Fee income earned on loans acquired from correspondents and brokers(2) Other Originations Income: Underwriting, processing, administration and other fees
QUARTERLY MORTGAGE BANKERS PERFORMANCE REPORT | Q1 2018 Results from the Mortgage Bankers Association© Mortgage Bankers Association 2018. All rights reserved. 48

QUARTER 1, 2018
Quarterly Mortgage Bankers Performance ReportResidential Loan Production ‐ by Govt. Production Percent in $K3 ‐ Production Mix ($), Simple Average
PERCENT BASED ON $ Your Firm
<50%
Govt $
>=50%
Govt $ TotalAvg. Total Loans Originated ($000s) 282,960 421,410 620,144 449,801 Avg. Total Loans Originated (#) 1,175 1,694 2,899 1,866Average Loan Balance 240,612 251,087 206,529 244,722
Production Mix by Product TypeFirst Mortgages: 99.63 99.32 98.92 99.26Government (FHA/VA/RHS) ‐ Fixed 40.10 27.71 62.41 32.67Government (FHA/VA/RHS) ‐ ARM 0.23 0.11 4.66 0.76Prime (Conforming) ‐ Fixed 57.23 61.43 30.24 56.97Prime (Conforming) ‐ ARM 0.36 1.74 0.31 1.54Prime (Non‐Conforming Jumbo) ‐ Fixed 1.45 4.77 0.95 4.22Prime (Non‐Conforming Jumbo) ‐ ARM 0.25 1.81 0.20 1.58Other Fixed 1.17 0.09 1.02Other ARM 0.58 0.07 0.50
Closed‐End Second Mortgages 0.14 0.11 0.13Funded HELOCs 0.09 0.02 0.08Reverse 0.37 0.31 0.86 0.39Other 0.15 0.09 0.14
Total 100.00 100.00 100.00 100.00
1st Mtg Fixed Rate vs ARMFixed Rate 99.12 95.74 94.76 95.60ARM 0.88 4.26 5.24 4.40
Total 100.00 100.00 100.00 100.00
1st Mtg Jumbo vs. Non‐JumboJumbo 1.74 9.25 2.83 8.33Non‐Jumbo 98.26 90.75 97.17 91.67
Total 100.00 100.00 100.00 100.00
1st Mtg Production Channel MixRetail/Direct Marketing 33.14 86.61 70.93 84.37Wholesale/Broker and Correspondent 66.86 13.39 29.07 15.63
Total 100.00 100.00 100.00 100.00
1st Mtg Purchase vs RefiPurchase 62.90 72.53 63.22 71.20Refinancing 37.10 27.47 36.78 28.80
Rate‐Term 15.89 10.85 20.08 12.17Cash‐Out 21.21 15.75 16.24 15.82Other / Unknown 0.87 0.45 0.81
Total 100.00 100.00 100.00 100.00
1st Mtg FICO Score DistributionEquals 600 or less 2.62 0.86 6.24 1.63Greater than 600, less than or equal to 650 14.45 9.02 18.29 10.35Greater than 650, less than or equal to 700 25.25 20.50 27.58 21.51Greater than 700, less than or equal to 750 24.80 27.54 23.39 26.94Greater than 750 32.88 42.08 24.50 39.56
Total 100.00 100.00 100.00 100.00
1st Mtg Simple Average FICO (based on #) 705 727 691 7221st Mtg LTV DistributionEquals 60% of less 10.86 10.13 4.75 9.36Greater than 60%, less than or equal to 70% 9.15 8.43 4.75 7.90Greater than 70%, less than or equal to 80% 28.70 28.87 16.04 27.03Greater than 80%, less than or equal to 90% 10.27 13.50 12.89 13.41Greater than 90%, less than or equal to 100% 38.62 37.73 52.90 39.90Greater than 100% 2.40 1.35 8.67 2.39
Total 100.00 100.00 100.00 100.00
1st Mtg Average LTV (based on $) 82.69 81.56 86.58 82.26
1st Mtg Production Sold by Investor TypeOriginated for Portfolio 0.15 0.11 0.14Originated for Sale to Others: 100.00 99.85 99.89 99.86Sale to Fannie/Freddie/Ginnie 18.58 30.48 54.24 33.85All Other Sale to Others 81.42 69.37 45.66 66.00
Total 100.00 100.00 100.00 100.001st Mtg Servicing Released vs RetainedServicing Released 81.42 79.80 61.63 77.38Servicing Retained 18.58 20.20 38.37 22.62
Total 100.00 100.00 100.00 100.00
Number of Companies Reporting 1 294 49 343
QUARTERLY MORTGAGE BANKERS PERFORMANCE REPORT | Q1 2018 Results from the Mortgage Bankers Association© Mortgage Bankers Association 2018. All rights reserved. 49
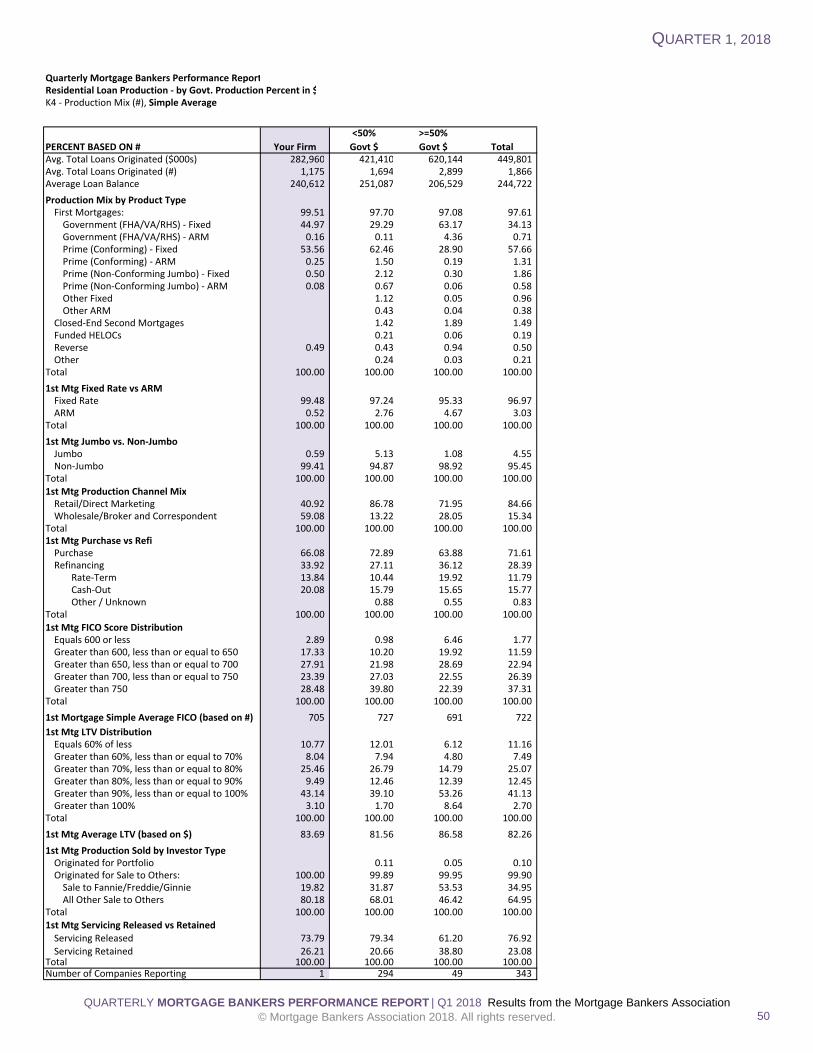
QUARTER 1, 2018
Quarterly Mortgage Bankers Performance ReportResidential Loan Production ‐ by Govt. Production Percent in $K4 ‐ Production Mix (#), Simple Average
PERCENT BASED ON # Your Firm
<50%
Govt $
>=50%
Govt $ TotalAvg. Total Loans Originated ($000s) 282,960 421,410 620,144 449,801 Avg. Total Loans Originated (#) 1,175 1,694 2,899 1,866Average Loan Balance 240,612 251,087 206,529 244,722
Production Mix by Product TypeFirst Mortgages: 99.51 97.70 97.08 97.61Government (FHA/VA/RHS) ‐ Fixed 44.97 29.29 63.17 34.13Government (FHA/VA/RHS) ‐ ARM 0.16 0.11 4.36 0.71Prime (Conforming) ‐ Fixed 53.56 62.46 28.90 57.66Prime (Conforming) ‐ ARM 0.25 1.50 0.19 1.31Prime (Non‐Conforming Jumbo) ‐ Fixed 0.50 2.12 0.30 1.86Prime (Non‐Conforming Jumbo) ‐ ARM 0.08 0.67 0.06 0.58Other Fixed 1.12 0.05 0.96Other ARM 0.43 0.04 0.38
Closed‐End Second Mortgages 1.42 1.89 1.49Funded HELOCs 0.21 0.06 0.19Reverse 0.49 0.43 0.94 0.50Other 0.24 0.03 0.21
Total 100.00 100.00 100.00 100.00
1st Mtg Fixed Rate vs ARMFixed Rate 99.48 97.24 95.33 96.97ARM 0.52 2.76 4.67 3.03
Total 100.00 100.00 100.00 100.00
1st Mtg Jumbo vs. Non‐JumboJumbo 0.59 5.13 1.08 4.55Non‐Jumbo 99.41 94.87 98.92 95.45
Total 100.00 100.00 100.00 100.001st Mtg Production Channel MixRetail/Direct Marketing 40.92 86.78 71.95 84.66Wholesale/Broker and Correspondent 59.08 13.22 28.05 15.34
Total 100.00 100.00 100.00 100.001st Mtg Purchase vs RefiPurchase 66.08 72.89 63.88 71.61Refinancing 33.92 27.11 36.12 28.39
Rate‐Term 13.84 10.44 19.92 11.79Cash‐Out 20.08 15.79 15.65 15.77Other / Unknown 0.88 0.55 0.83
Total 100.00 100.00 100.00 100.001st Mtg FICO Score DistributionEquals 600 or less 2.89 0.98 6.46 1.77Greater than 600, less than or equal to 650 17.33 10.20 19.92 11.59Greater than 650, less than or equal to 700 27.91 21.98 28.69 22.94Greater than 700, less than or equal to 750 23.39 27.03 22.55 26.39Greater than 750 28.48 39.80 22.39 37.31
Total 100.00 100.00 100.00 100.00
1st Mortgage Simple Average FICO (based on #) 705 727 691 722
1st Mtg LTV DistributionEquals 60% of less 10.77 12.01 6.12 11.16Greater than 60%, less than or equal to 70% 8.04 7.94 4.80 7.49Greater than 70%, less than or equal to 80% 25.46 26.79 14.79 25.07Greater than 80%, less than or equal to 90% 9.49 12.46 12.39 12.45Greater than 90%, less than or equal to 100% 43.14 39.10 53.26 41.13Greater than 100% 3.10 1.70 8.64 2.70
Total 100.00 100.00 100.00 100.00
1st Mtg Average LTV (based on $) 83.69 81.56 86.58 82.26
1st Mtg Production Sold by Investor TypeOriginated for Portfolio 0.11 0.05 0.10Originated for Sale to Others: 100.00 99.89 99.95 99.90Sale to Fannie/Freddie/Ginnie 19.82 31.87 53.53 34.95All Other Sale to Others 80.18 68.01 46.42 64.95
Total 100.00 100.00 100.00 100.001st Mtg Servicing Released vs RetainedServicing Released 73.79 79.34 61.20 76.92Servicing Retained 26.21 20.66 38.80 23.08
Total 100.00 100.00 100.00 100.00Number of Companies Reporting 1 294 49 343
QUARTERLY MORTGAGE BANKERS PERFORMANCE REPORT | Q1 2018 Results from the Mortgage Bankers Association© Mortgage Bankers Association 2018. All rights reserved. 50

QUARTER 1, 2018
Quarterly Mortgage Bankers Performance ReportResidential Loan Production ‐ by Govt. Production Percent in $K5 ‐ Production Mix (Avg Loan Balances), Simple Average
LOAN BALANCES Your Firm
<50%
Govt $
>=50%
Govt $ TotalAvg. Total Loans Originated ($000s) 282,960 421,410 620,144 449,801 Avg. Total Loans Originated (#) 1,175 1,694 2,899 1,866Average Loan Balance 240,612 251,087 206,529 244,722
Production Mix by Product TypeFirst Mortgages: 240,882 255,409 210,828 249,041Government (FHA/VA/RHS) ‐ Fixed 214,564 236,431 205,890 231,950Government (FHA/VA/RHS) ‐ ARM 340,999 333,728 251,654 309,229Prime (Conforming) ‐ Fixed 257,086 243,500 213,476 239,414Prime (Conforming) ‐ ARM 351,666 326,551 341,831 328,025Prime (Non‐Conforming Jumbo) ‐ Fixed 690,832 689,241 704,036 690,655Prime (Non‐Conforming Jumbo) ‐ ARM 727,999 807,839 855,720 811,098Other Fixed 317,283 278,034 312,666Other ARM 458,208 409,170 451,921
Closed‐End Second Mortgages 30,889 44,858 32,296Funded HELOCs 121,983 85,708 118,961Reverse 176,199 176,390 159,605 174,752Other 136,137 391,600 170,973
1st Mtg Fixed Rate vs ARMFixed Rate 240,012 250,437 209,517 244,592ARM 410,832 482,241 370,521 468,381
1st Mtg Jumbo vs. Non‐JumboJumbo 696,142 693,004 674,985 690,816Non‐Jumbo 238,149 246,320 206,786 240,656
1st Mtg Production Channel MixRetail/Direct Marketing 195,227 253,524 205,704 246,631Wholesale/Broker and Correspondent 272,493 261,067 222,037 253,494
1st Mtg Purchase vs RefiPurchase 229,321 255,693 208,054 249,006Refinancing 263,437 257,992 216,238 252,080
Rate‐Term 276,369 266,759 224,166 260,749Cash‐Out 254,522 253,003 222,729 248,734Other / Unknown 310,893 170,506 282,816
1st Mtg FICO Score DistributionEquals 600 or less 216,823 219,196 194,447 214,783Greater than 600, less than or equal to 650 200,896 222,756 196,840 219,010Greater than 650, less than or equal to 700 217,641 237,525 202,606 232,522Greater than 700, less than or equal to 750 255,437 259,728 218,804 253,865Greater than 750 278,579 269,178 241,426 265,166
1st Mtg LTV DistributionEquals 60% of less 243,332 216,411 166,330 209,341Greater than 60%, less than or equal to 70% 274,000 272,366 206,028 262,973Greater than 70%, less than or equal to 80% 271,737 275,080 223,704 267,697Greater than 80%, less than or equal to 90% 260,693 275,525 222,760 267,943Greater than 90%, less than or equal to 100% 215,662 245,748 210,165 240,650Greater than 100% 182,296 187,986 195,989 189,346
1st Mtg Production Sold by Investor TypeOriginated for Portfolio 322,444 383,552 327,333Originated for Sale to Others: 240,887 252,746 209,006 246,535Sale to Fannie/Freddie/Ginnie 226,008 220,194 200,459 217,320All Other Sale to Others 244,563 269,222 238,994 265,049
1st Mtg Servicing Released vs RetainedServicing Released 265,793 268,055 224,050 262,296Servicing Retained 170,794 253,227 226,233 249,546
Number of Companies Reporting 1 294 49 343
QUARTERLY MORTGAGE BANKERS PERFORMANCE REPORT | Q1 2018 Results from the Mortgage Bankers Association© Mortgage Bankers Association 2018. All rights reserved. 51

QUARTER 1, 2018
Quarterly Mortgage Bankers Performance ReportResidential Loan Servicing ‐ HistoricalL1 ‐ Servicing Income and Expense, $ per loan, Simple AverageANNUALIZED Data for Revenue and Expenses
Your Firm All Firms Previous Qtr. Previous Yr. Repeater Repeater YTD$ PER LOAN Q1 2018 Q1 2018 Q4 2017 Q1 2017 Q1 2018 Q4 2017 2018
DIRECT REVENUEServicing Fees 582 497 504 525 501 511 497 First Mortgages, Seconds, Other 582 464 464 490 465 476 464 Subservicing Fees Earned 33 40 35 35 34 33
Late Fees and Other Ancillary Income 19 57 23 42 49 26 57 Total Direct Servicing Revenue 601 554 527 567 550 536 554
DIRECT EXPENSESPersonnel 31 114 104 110 108 107 114 Loan Administration Employees 26 102 96 100 96 99 102 Benefits 5 10 7 8 10 7 10 Other Personnel Expenses 2 1 2 2 1 2
Occupancy and Equipment 2 6 5 8 5 6 6 Other Direct Expenses 145 167 176 156 158 181 167 Subservicing Fees Paid 101 135 141 124 125 145 135 Other Miscellaneous Expenses 44 32 35 32 34 36 32
Total Direct Expenses 178 287 285 274 271 294 287
DIRECT SERVICING NET INCOME 423 266 242 293 278 243 266
INDIRECT EXPENSESUnreimbursed FC/REO Svg Expenses 2 13 5 2 12 2 Corporate Allocation 4 30 20 20 31 19 30
Total Indirect Expenses 4 32 33 25 32 32 32
NET INTEREST INCOMEEscrow Earnings ‐ 2 2 2 2 2 2 Corporate Interest Losses on MBS Pools (2) (2) (2) (2) (3) (2) Other Interest Expense (17) (9) (11) (9) (10) (13) (9)
Net Interest Income (17) (9) (12) (9) (10) (13) (9)
NET OPERATING INCOME 402 225 197 258 236 198 225
MSR FINANCIAL ITEMSAmortized Cost of Servicing Rights / Loan Decay (213) (96) (120) (96) (80) (103) (96) Net Gain (Loss) on Bulk Sale of Servicing 16 (9) 1 27 (11) 16 Net Gain (Loss) from MSR Valuations & Hedging 175 (35) 62 147 (56) 175
Total Financial Items (213) 95 (164) (33) 94 (170) 95
TOTAL NET FINANCIAL INCOME 189 320 33 225 330 28 320
Memorandum Items:Average Servicing Portfolio ($000) 1,215,845 14,262,892 15,697,921 12,758,179 16,642,720 16,110,395 14,262,892 Average Servicing Portfolio (#) 6,867 82,848 93,603 76,256 96,992 94,760 82,848Average Loan Balance ($) 177,030 189,446 188,318 189,926 188,252 187,833 189,446
# Servicing FTEs (excluding 0 reporters) 5 118 120 90 137 131 118
Average Loans Serviced per FTE (Simple) 1,716 1,118 1,053 1,423 1,084 1,032 1,118Average Loans Serviced per FTE (Weighted) 1,716 774 775 766 785 783 774Average Loans Serviced per FTE (Median) 1,716 711 687 874 712 687 711
Average Personnel Cost per FTE (Simple) 58,000 64,233 63,429 63,305 64,170 63,034 64,233Average Personnel Cost per FTE (Weighted) 58,000 71,577 69,736 77,249 71,198 69,756 71,577Average Personnel Cost per FTE (Median) 58,000 62,667 63,692 58,824 62,890 61,545 62,667
Subservicing for Others (% based on $) 7.16 9.00 7.04 8.38 8.29 7.16Subservicing for Others (% based on #) 7.31 9.24 6.87 8.56 8.57 7.31Subservicing for Others ‐ Avg Balance ($) 164,519 159,612 169,543 158,782 156,728 164,519
Subservicing by Others (% based on $) 100.00 56.36 53.13 56.50 54.18 52.71 56.36Subservicing by Others (% based on #) 100.00 56.21 53.08 56.98 53.99 52.65 56.21Subservicing by Others ‐ Avg Balance ($) 177,030 205,065 199,447 200,418 203,201 199,990 205,065
Number of Companies 1 208 192 198 166 166 208
QUARTERLY MORTGAGE BANKERS PERFORMANCE REPORT | Q1 2018 Results from the Mortgage Bankers Association© Mortgage Bankers Association 2018. All rights reserved. 52

QUARTER 1, 2018
Quarterly Mortgage Bankers Performance ReportResidential Loan Servicing ‐ HistoricalL2 ‐ Servicing Income and Expense, Basis Points, Simple AverageANNUALIZED Data for Revenue and Expenses
Your Firm All Firms Previous Qtr. Previous Yr. Repeater Repeater YTDBASIS POINTS Q1 2018 Q1 2018 Q4 2017 Q1 2017 Q1 2018 Q4 2017 2018
DIRECT REVENUEServicing Fees 32.92 26.68 27.07 28.01 26.83 27.46 26.68 First Mortgages, Seconds, Other 32.92 24.78 24.78 25.97 24.79 25.47 24.78 Subservicing Fees Earned 1.89 2.29 2.04 2.03 1.99 1.89
Late Fees and Other Ancillary Income 1.14 2.92 1.56 2.48 2.38 1.70 2.92 Total Direct Servicing Revenue 34.06 29.60 28.63 30.49 29.21 29.16 29.60
DIRECT EXPENSESPersonnel 1.89 6.73 5.96 6.45 6.29 6.24 6.73 Loan Administration Employees 1.52 5.99 5.43 5.76 5.58 5.66 5.99 Benefits 0.37 0.62 0.46 0.55 0.62 0.51 0.62 Other Personnel Expenses 0.12 0.06 0.14 0.09 0.07 0.12
Occupancy and Equipment 0.21 0.34 0.33 0.47 0.31 0.35 0.34 Other Direct Expenses 8.28 8.63 9.33 8.45 8.31 9.82 8.63 Subservicing Fees Paid 5.83 6.72 7.23 6.42 6.28 7.60 6.72 Other Miscellaneous Expenses 2.45 1.91 2.09 2.03 2.03 2.22 1.91
Total Direct Expenses 10.38 15.70 15.61 15.38 14.91 16.40 15.70
DIRECT SERVICING NET INCOME 23.68 13.90 13.02 15.11 14.30 12.75 13.90
INDIRECT EXPENSESUnreimbursed FC/REO Svg Expenses 0.14 0.92 0.43 0.14 0.77 0.14 Corporate Allocation 0.28 1.85 1.24 1.20 1.93 1.21 1.85
Total Indirect Expenses 0.28 1.99 2.16 1.63 2.07 1.98 1.99
NET INTEREST INCOMEEscrow Earnings ‐ 0.13 0.15 0.11 0.15 0.15 0.13 Corporate Interest Losses on MBS Pools (0.11) (0.12) (0.10) (0.10) (0.13) (0.11) Other Interest Expense (1.01) (0.47) (0.65) (0.48) (0.53) (0.68) (0.47)
Net Interest Income (1.01) (0.45) (0.62) (0.48) (0.48) (0.66) (0.45)
NET OPERATING INCOME 22.39 11.45 10.24 13.01 11.75 10.11 11.45
MSR FINANCIAL ITEMSAmortized Cost of Servicing Rights / Loan Decay (12.06) (4.66) (6.02) (5.04) (4.22) (5.47) (4.66) Net Gain (Loss) on Bulk Sale of Servicing 0.60 (0.48) 0.02 1.08 (0.56) 0.60 Net Gain (Loss) from MSR Valuations & Hedging 8.54 (0.87) 2.98 7.13 (1.59) 8.54
Total Financial Items (12.06) 4.47 (7.37) (2.04) 3.99 (7.62) 4.47
TOTAL NET FINANCIAL INCOME 10.33 15.93 2.87 10.97 15.74 2.50 15.93
Memorandum Items:Average Servicing Portfolio ($000) 1,215,845 14,262,892 15,697,921 12,758,179 16,642,720 16,110,395 14,262,892 Average Servicing Portfolio (#) 6,867 82,848 93,603 76,256 96,992 94,760 82,848Average Loan Balance ($) 177,030 189,446 188,318 189,926 188,252 187,833 189,446
# Servicing FTEs (excluding 0 reporters) 3 118 120 90 137 131 118
Average Loans Serviced per FTE 1,716 1,118 1,053 1,423 1,084 1,032 1,118Average Loans Serviced per FTE (Weighted) 1,716 774 775 766 785 783 774Average Loans Serviced per FTE (Median) 1,716 711 687 874 712 687 711
Average Personnel Cost per FTE 56,000 64,233 63,429 63,305 64,170 63,034 64,233Average Personnel Cost per FTE (Weighted) 56,000 71,577 69,736 77,249 71,198 69,756 71,577Average Personnel Cost per FTE (Median) 56,000 62,667 63,692 58,824 62,890 61,545 62,667
Subservicing for Others (% based on $) 7.16 9.00 7.04 8.38 8.29 7.16Subservicing for Others (% based on #) 7.31 9.24 6.87 8.56 8.57 7.31Subservicing for Others ‐ Avg Balance ($) 164,519 159,612 169,543 158,782 156,728 164,519
Subservicing by Others (% based on $) 100.00 56.36 53.13 56.50 54.18 52.71 56.36Subservicing by Others (% based on #) 100.00 56.21 53.08 56.98 53.99 52.65 56.21Subservicing by Others ‐ Avg Balance ($) 177,030 205,065 199,447 200,418 203,201 199,990 205,065
Number of Companies Reporting 1 208 192 198 166 166 208
QUARTERLY MORTGAGE BANKERS PERFORMANCE REPORT | Q1 2018 Results from the Mortgage Bankers Association© Mortgage Bankers Association 2018. All rights reserved. 53
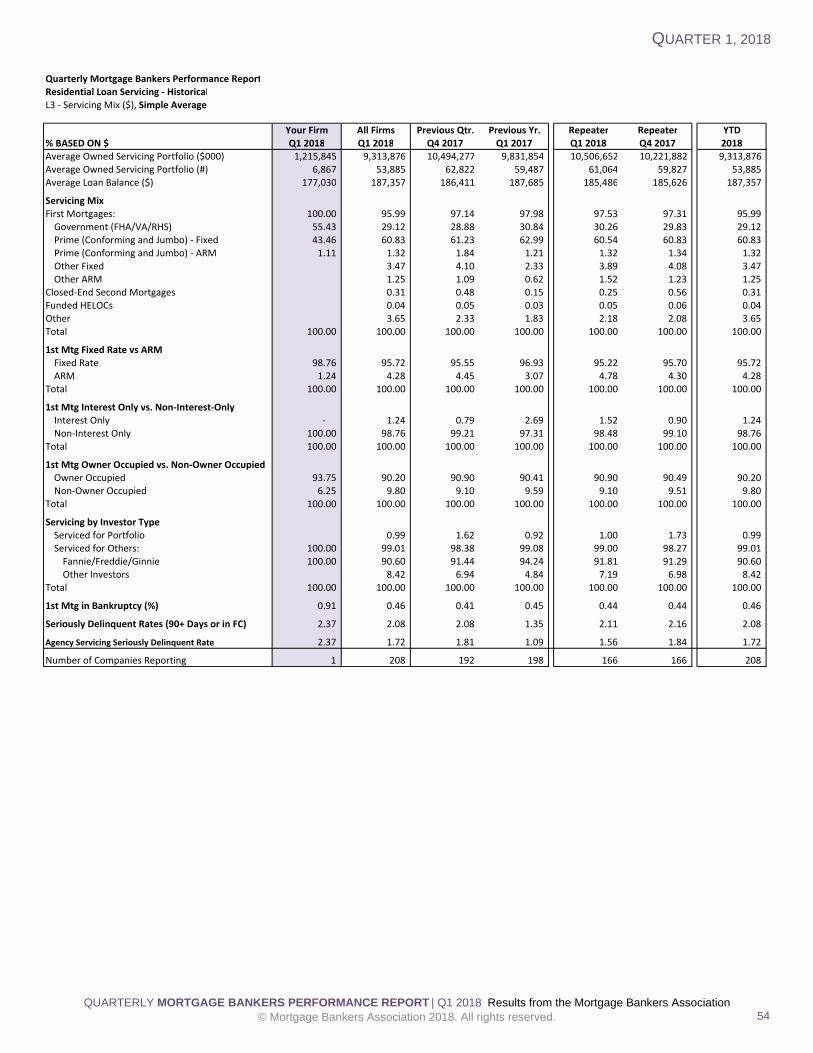
QUARTER 1, 2018
Quarterly Mortgage Bankers Performance ReportResidential Loan Servicing ‐ HistoricalL3 ‐ Servicing Mix ($), Simple Average
Your Firm All Firms Previous Qtr. Previous Yr. Repeater Repeater YTD% BASED ON $ Q1 2018 Q1 2018 Q4 2017 Q1 2017 Q1 2018 Q4 2017 2018Average Owned Servicing Portfolio ($000) 1,215,845 9,313,876 10,494,277 9,831,854 10,506,652 10,221,882 9,313,876 Average Owned Servicing Portfolio (#) 6,867 53,885 62,822 59,487 61,064 59,827 53,885 Average Loan Balance ($) 177,030 187,357 186,411 187,685 185,486 185,626 187,357
Servicing MixFirst Mortgages: 100.00 95.99 97.14 97.98 97.53 97.31 95.99 Government (FHA/VA/RHS) 55.43 29.12 28.88 30.84 30.26 29.83 29.12 Prime (Conforming and Jumbo) ‐ Fixed 43.46 60.83 61.23 62.99 60.54 60.83 60.83 Prime (Conforming and Jumbo) ‐ ARM 1.11 1.32 1.84 1.21 1.32 1.34 1.32 Other Fixed 3.47 4.10 2.33 3.89 4.08 3.47 Other ARM 1.25 1.09 0.62 1.52 1.23 1.25
Closed‐End Second Mortgages 0.31 0.48 0.15 0.25 0.56 0.31 Funded HELOCs 0.04 0.05 0.03 0.05 0.06 0.04 Other 3.65 2.33 1.83 2.18 2.08 3.65 Total 100.00 100.00 100.00 100.00 100.00 100.00 100.00
1st Mtg Fixed Rate vs ARMFixed Rate 98.76 95.72 95.55 96.93 95.22 95.70 95.72 ARM 1.24 4.28 4.45 3.07 4.78 4.30 4.28
Total 100.00 100.00 100.00 100.00 100.00 100.00 100.00
1st Mtg Interest Only vs. Non‐Interest‐OnlyInterest Only ‐ 1.24 0.79 2.69 1.52 0.90 1.24 Non‐Interest Only 100.00 98.76 99.21 97.31 98.48 99.10 98.76
Total 100.00 100.00 100.00 100.00 100.00 100.00 100.00
1st Mtg Owner Occupied vs. Non‐Owner OccupiedOwner Occupied 93.75 90.20 90.90 90.41 90.90 90.49 90.20 Non‐Owner Occupied 6.25 9.80 9.10 9.59 9.10 9.51 9.80
Total 100.00 100.00 100.00 100.00 100.00 100.00 100.00
Servicing by Investor TypeServiced for Portfolio 0.99 1.62 0.92 1.00 1.73 0.99 Serviced for Others: 100.00 99.01 98.38 99.08 99.00 98.27 99.01 Fannie/Freddie/Ginnie 100.00 90.60 91.44 94.24 91.81 91.29 90.60 Other Investors 8.42 6.94 4.84 7.19 6.98 8.42
Total 100.00 100.00 100.00 100.00 100.00 100.00 100.00
1st Mtg in Bankruptcy (%) 0.91 0.46 0.41 0.45 0.44 0.44 0.46
Seriously Delinquent Rates (90+ Days or in FC) 2.37 2.08 2.08 1.35 2.11 2.16 2.08
Agency Servicing Seriously Delinquent Rate 2.37 1.72 1.81 1.09 1.56 1.84 1.72
Number of Companies Reporting 1 208 192 198 166 166 208
QUARTERLY MORTGAGE BANKERS PERFORMANCE REPORT | Q1 2018 Results from the Mortgage Bankers Association© Mortgage Bankers Association 2018. All rights reserved. 54

QUARTER 1, 2018
Quarterly Mortgage Bankers Performance ReportResidential Loan Servicing ‐ HistoricalL4 ‐ Servicing Mix (#), Simple Average
Your Firm All Firms Previous Qtr. Previous Yr. Repeater Repeater YTD
% BASED ON # Q1 2018 Q1 2018 Q4 2017 Q1 2017 Q1 2018 Q4 2017 2018Average Owned Servicing Portfolio ($000) 1,215,845 9,313,876 10,494,277 9,831,854 10,506,652 10,221,882 9,313,876 Average Owned Servicing Portfolio (#) 6,867 53,885 62,822 59,487 61,064 59,827 53,885 Average Loan Balance ($) 177,030 187,357 186,411 187,685 185,486 185,626 187,357
Servicing MixFirst Mortgages: 100.00 94.74 96.06 97.19 96.32 96.07 94.74 Government (FHA/VA/RHS) 62.72 29.16 28.97 31.07 30.33 29.92 29.16 Prime (Conforming and Jumbo) ‐ Fixed 36.48 60.31 60.89 62.61 60.11 60.37 60.31 Prime (Conforming and Jumbo) ‐ ARM 0.80 1.05 1.54 0.96 1.05 1.06 1.05 Other Fixed 3.29 3.93 2.15 3.69 3.89 3.29 Other ARM 0.94 0.73 0.41 1.14 0.82 0.94
Closed‐End Second Mortgages 1.68 1.37 0.88 1.24 1.58 1.68 Funded HELOCs 0.11 0.12 0.10 0.13 0.14 0.11 Other 3.46 2.44 1.83 2.31 2.21 3.46 Total 100.00 100.00 100.00 100.00 100.00 100.00 100.00
1st Mtg Fixed Rate vs ARMFixed Rate 99.16 96.44 96.32 97.45 96.02 96.51 96.44 ARM 0.84 3.56 3.68 2.55 3.98 3.49 3.56
Total 100.00 100.00 100.00 100.00 100.00 100.00 100.00
1st Mtg Interest Only vs. Non‐Interest‐OnlyInterest Only ‐ 1.12 0.67 2.64 1.39 0.76 1.12 Non‐Interest Only 100.00 98.88 99.33 97.36 98.61 99.24 98.88
Total 100.00 100.00 100.00 100.00 100.00 100.00 100.00
1st Mtg Owner Occupied vs. Non‐Owner OccupiedOwner Occupied 94.61 88.79 89.42 88.85 89.35 88.96 88.79 Non‐Owner Occupied 5.39 11.21 10.58 11.15 10.65 11.04 11.21
Total 100.00 100.00 100.00 100.00 100.00 100.00 100.00
Servicing by Investor TypeServiced for Portfolio 0.85 1.46 0.83 0.84 1.56 0.85 Serviced for Others: 100.00 99.15 98.54 99.17 99.16 98.44 99.15 Fannie/Freddie/Ginnie 100.00 91.14 91.99 94.56 92.49 91.91 91.14 Other Investors 8.00 6.55 4.61 6.67 6.53 8.00
Total 100.00 100.00 100.00 100.00 100.00 100.00 100.00
1st Mtg in Bankruptcy (%) 0.91 0.46 0.41 0.45 0.44 0.44 0.46
Seriously Delinquent Rates (90+ Days or in FC) 2.58 1.98 1.96 1.60 1.99 2.02 1.98
Agency Servicing Seriously Delinquent Rate 2.58 1.72 1.70 1.18 1.53 1.73 1.72
Number of Companies Reporting 1 208 192 198 166 166 208
QUARTERLY MORTGAGE BANKERS PERFORMANCE REPORT | Q1 2018 Results from the Mortgage Bankers Association© Mortgage Bankers Association 2018. All rights reserved. 55

QUARTER 1, 2018
Quarterly Mortgage Bankers Performance ReportResidential Loan Servicing ‐ HistoricalL5 ‐ Servicing Mix (Avg Loan Balances), Simple Average
Your Firm All Firms Previous Qtr. Previous Yr. Repeater Repeater YTDLOAN BALANCES Q1 2018 Q1 2018 Q4 2017 Q1 2017 Q1 2018 Q4 2017 2018Average Owned Servicing Portfolio ($000) 1,215,845 9,313,876 10,494,277 9,831,854 10,506,652 10,221,882 9,313,876 Average Owned Servicing Portfolio (#) 6,867 53,885 62,822 59,487 61,064 59,827 53,885 Average Loan Balance ($) 177,030 187,357 186,411 187,685 185,486 185,626 187,357
Servicing MixFirst Mortgages: 177,030 190,594 188,802 189,460 188,205 188,348 190,594 Government (FHA/VA/RHS) ‐ Fixed 156,139 183,731 185,315 182,975 184,641 184,957 183,731 Government (FHA/VA/RHS) ‐ ARM 449,999 199,598 202,935 194,362 200,023 197,344 199,598 Prime (Conforming and Jumbo) ‐ Fixed 211,005 192,525 189,636 192,631 189,818 189,404 192,525 Prime (Conforming and Jumbo) ‐ ARM 251,629 252,865 262,140 252,554 253,677 255,453 252,865 Other Fixed 200,780 209,083 205,840 209,446 201,983 200,780 Other ARM 254,008 291,251 300,547 265,090 298,206 254,008
Closed‐End Second Mortgages 38,650 49,595 42,753 43,197 47,936 38,650 Funded HELOCs 81,795 56,703 71,556 81,717 56,703 81,795 Other 164,617 127,522 177,369 129,279 121,597 164,617
1st Mtg Fixed Rate vs ARMFixed Rate 176,318 188,372 186,574 188,138 185,637 186,085 188,372 ARM 262,069 243,130 252,469 241,940 243,794 246,297 243,130
1st Mtg Interest Only vs. Non‐Interest‐OnlyInterest Only 386,831 358,274 311,006 363,192 359,496 386,831 Non‐Interest Only 177,030 190,243 187,871 190,102 187,719 187,271 190,243
1st Mtg Owner Occupied vs. Non‐Owner OccupiedOwner Occupied 175,460 194,048 192,901 191,951 192,146 192,560 194,048 Non‐Owner Occupied 204,511 168,202 161,616 161,214 163,000 161,002 168,202
Servicing by Investor TypeServiced for Portfolio 193,185 198,786 202,849 197,726 198,878 193,185 Serviced for Others: 177,030 190,030 187,982 189,314 187,650 187,412 190,030 Fannie/Freddie/Ginnie 177,030 188,888 186,031 188,014 185,414 185,430 188,888 Other Investors 200,763 212,816 212,076 207,480 206,150 200,763
Seriously Delinquent Rates (90+ Days or in FC) 162,757 177,196 177,131 174,235 178,617 177,689 177,196
Agency Servicing Seriously Delinquent 162,757 184,520 178,294 175,733 183,488 181,046 184,520
Number of Companies Reporting 1 208 192 198 166 166 208
QUARTERLY MORTGAGE BANKERS PERFORMANCE REPORT | Q1 2018 Results from the Mortgage Bankers Association© Mortgage Bankers Association 2018. All rights reserved. 56

QUARTER 1, 2018
Quarterly Mortgage Bankers Performance ReportResidential Loan Servicing ‐ By Servicing Volume #M1 ‐ Servicing Income and Expense, $ per loan, Simple AverageANNUALIZED Data for Revenue and Expenses
$ PER LOAN Your Firm <2,500 2,500‐10,000 10,000‐50,000 >50,000 Total
DIRECT REVENUEServicing Fees 582 500 491 510 481 497 First Mortgages, Seconds, Other 582 497 445 499 373 464 Subservicing Fees Earned 4 46 11 108 33
Late Fees and Other Ancillary Income 19 84 48 40 34 57 Total Direct Servicing Revenue 601 584 540 550 515 554
DIRECT EXPENSESPersonnel 31 166 90 68 102 114 Loan Administration Employees 26 155 78 57 86 102 Benefits 5 10 9 9 13 10 Other Personnel Expenses 1 4 2 3 2
Occupancy and Equipment 2 3 6 6 11 6 Other Direct Expenses 145 207 163 161 102 167 Subservicing Fees Paid 101 197 125 120 43 135 Other Miscellaneous Expenses 44 9 38 40 59 32
Total Direct Expenses 178 375 259 235 215 287
DIRECT SERVICING NET INCOME 423 209 280 315 300 266
INDIRECT EXPENSESUnreimbursed FC/REO Svg Expenses 0 3 3 2 2 Corporate Allocation 4 35 27 27 30 30
Total Indirect Expenses 4 35 30 31 32 32
NET INTEREST INCOMEEscrow Earnings ‐ ‐ 0 2 8 2 Corporate Interest Losses on MBS Pools (0) (0) (6) (3) (2) Other Interest Expense (17) (0) (4) (10) (32) (9)
Net Interest Income (17) (1) (4) (14) (26) (9)
NET OPERATING INCOME 402 173 246 270 242 225
MSR FINANCIAL ITEMSAmortized Cost of Servicing Rights / Loan Decay (213) (141) (114) (54) (36) (96) Net Gain (Loss) on Bulk Sale of Servicing (21) 63 37 3 16 Net Gain (Loss) from MSR Valuations & Hedging 182 196 163 148 175
Total Financial Items (213) 21 146 146 114 95
TOTAL NET FINANCIAL INCOME 189 195 392 416 356 320
Memorandum Items:Average Servicing Portfolio ($000) 1,215,845 190,235 971,336 4,109,189 73,119,213 14,262,892 Average Servicing Portfolio (#) 6,867 937 5,206 23,833 425,665 82,848Average Loan Balance ($) 177,030 207,053 190,270 170,364 177,979 189,446
# Servicing FTEs (excluding 0 reporters) 5 2 8 30 584 118
Average Loans Serviced per FTE (Simple) 1,716 525 1,465 1,531 1,326 1,118Average Loans Serviced per FTE (Weighted) 1,716 441 680 758 779 774Average Loans Serviced per FTE (Median) 1,716 425 915 1,118 935 711
Average Personnel Cost per FTE (Simple) 58,000 62,605 63,934 60,718 71,681 64,233Average Personnel Cost per FTE (Weighted) 58,000 57,143 68,013 63,762 72,189 71,577Average Personnel Cost per FTE (Median) 58,000 60,000 62,724 60,217 72,646 62,667
Subservicing for Others (% based on $) 0.89 5.62 4.71 25.05 7.16Subservicing for Others (% based on #) 0.87 5.39 4.80 26.13 7.31Subservicing for Others ‐ Avg Balance ($) 241,960 244,719 139,203 150,965 164,519
Subservicing by Others (% based on $) 100.00 72.45 57.10 54.91 24.68 56.36Subservicing by Others (% based on #) 100.00 72.40 56.62 54.87 24.66 56.21Subservicing by Others ‐ Avg Balance ($) 177,030 211,399 205,120 196,317 197,745 205,065
Number of Companies 1 75 47 49 37 208
QUARTERLY MORTGAGE BANKERS PERFORMANCE REPORT | Q1 2018 Results from the Mortgage Bankers Association© Mortgage Bankers Association 2018. All rights reserved. 57

QUARTER 1, 2018
Quarterly Mortgage Bankers Performance ReportResidential Loan Servicing ‐ By Servicing Volume #M2 ‐ Servicing Income and Expense, Basis Points, Simple AverageANNUALIZED Data for Revenue and Expenses
BASIS POINTS Your Firm <2,500 2,500‐10,000 10,000‐50,000 >50,000 Total
DIRECT REVENUEServicing Fees 32.92 24.55 26.35 29.58 27.56 26.68 First Mortgages, Seconds, Other 32.92 24.42 24.49 28.75 20.64 24.78 Subservicing Fees Earned 0.13 1.85 0.83 6.92 1.89
Late Fees and Other Ancillary Income 1.14 2.83 2.78 3.22 2.88 2.92 Total Direct Servicing Revenue 34.06 27.39 29.13 32.80 30.44 29.60
DIRECT EXPENSESPersonnel 1.89 9.30 4.89 5.10 6.02 6.73 Loan Administration Employees 1.52 8.69 4.24 4.19 5.11 5.99 Benefits 0.37 0.57 0.48 0.74 0.76 0.62 Other Personnel Expenses 0.04 0.17 0.17 0.15 0.12
Occupancy and Equipment 0.21 0.16 0.27 0.48 0.63 0.34 Other Direct Expenses 8.28 9.80 8.45 9.04 5.95 8.63 Subservicing Fees Paid 5.83 9.32 6.39 6.19 2.55 6.72 Other Miscellaneous Expenses 2.45 0.48 2.06 2.85 3.40 1.91
Total Direct Expenses 10.38 19.26 13.61 14.62 12.60 15.70
DIRECT SERVICING NET INCOME 23.68 8.13 15.53 18.18 17.84 13.90
INDIRECT EXPENSESUnreimbursed FC/REO Svg Expenses 0.00 0.23 0.24 0.18 0.14 Corporate Allocation 0.28 1.91 1.73 1.48 2.37 1.85
Total Indirect Expenses 0.28 1.92 1.96 1.72 2.55 1.99
NET INTEREST INCOMEEscrow Earnings ‐ ‐ 0.02 0.15 0.50 0.13 Corporate Interest Losses on MBS Pools (0.02) (0.01) (0.32) (0.15) (0.11) Other Interest Expense (1.01) (0.02) (0.22) (0.49) (1.65) (0.47)
Net Interest Income (1.01) (0.04) (0.21) (0.67) (1.31) (0.45)
NET OPERATING INCOME 22.39 6.17 13.36 15.80 13.98 11.45
MSR FINANCIAL ITEMSAmortized Cost of Servicing Rights / Loan Decay (12.06) (5.84) (6.19) (3.36) (2.02) (4.66) Net Gain (Loss) on Bulk Sale of Servicing (1.02) 2.44 1.66 0.12 0.60 Net Gain (Loss) from MSR Valuations & Hedging 9.03 9.32 8.11 7.11 8.54
Total Financial Items (12.06) 2.16 5.57 6.40 5.21 4.47
TOTAL NET FINANCIAL INCOME 10.33 8.33 18.93 22.20 19.19 15.93
Memorandum Items:Average Servicing Portfolio ($000) 1,215,845 190,235 971,336 4,109,189 73,119,213 14,262,892 Average Servicing Portfolio (#) 6,867 937 5,206 23,833 425,665 82,848Average Loan Balance ($) 177,030 207,053 190,270 170,364 177,979 189,446
# Servicing FTEs (excluding 0 reporters) 3 2 8 30 584 118
Average Loans Serviced per FTE 1,716 525 1,465 1,531 1,326 1,118Average Loans Serviced per FTE (Weighted) 1,716 441 680 758 779 774Average Loans Serviced per FTE (Median) 1,716 425 915 1,118 935 711
Average Personnel Cost per FTE 56,000 62,605 63,934 60,718 71,681 64,233Average Personnel Cost per FTE (Weighted) 56,000 57,143 68,013 63,762 72,189 71,577Average Personnel Cost per FTE (Median) 56,000 60,000 62,724 60,217 72,646 62,667
Subservicing for Others (% based on $) 0.89 5.62 4.71 25.05 7.16Subservicing for Others (% based on #) 0.87 5.39 4.80 26.13 7.31Subservicing for Others ‐ Avg Balance ($) 241,960 244,719 139,203 150,965 164,519
Subservicing by Others (% based on $) 100.00 72.45 57.10 54.91 24.68 56.36Subservicing by Others (% based on #) 100.00 72.40 56.62 54.87 24.66 56.21Subservicing by Others ‐ Avg Balance ($) 177,030 211,399 205,120 196,317 197,745 205,065
Number of Companies Reporting 1 75 47 49 37 208
QUARTERLY MORTGAGE BANKERS PERFORMANCE REPORT | Q1 2018 Results from the Mortgage Bankers Association© Mortgage Bankers Association 2018. All rights reserved. 58

QUARTER 1, 2018
Quarterly Mortgage Bankers Performance ReportResidential Loan Servicing ‐ By Servicing Volume #M3 ‐ Servicing Mix ($), Simple Average
% BASED ON $ Your Firm <2,500 2,500‐10,000 10,000‐50,000 >50,000 TotalAverage Owned Servicing Portfolio ($000) 1,215,845 187,356 873,706 3,975,843 45,604,162 9,313,876 Average Owned Servicing Portfolio (#) 6,867 926 4,884 22,808 264,637 53,885 Average Loan Balance ($) 177,030 206,974 181,817 170,508 176,794 187,357
Servicing MixFirst Mortgages: 100.00 98.33 99.37 97.33 85.29 95.99 Government (FHA/VA/RHS) 55.43 18.45 32.37 42.87 28.50 29.12 Prime (Conforming and Jumbo) ‐ Fixed 43.46 76.31 61.26 50.87 42.12 60.83 Prime (Conforming and Jumbo) ‐ ARM 1.11 1.02 1.19 0.58 3.06 1.32 Other Fixed 1.84 3.21 1.93 9.13 3.47 Other ARM 0.72 1.34 1.08 2.47 1.25
Closed‐End Second Mortgages 0.05 0.42 0.56 0.39 0.31 Funded HELOCs 0.01 0.09 0.02 0.09 0.04 Other 1.61 0.13 2.09 14.23 3.65 Total 100.00 100.00 100.00 100.00 100.00 100.00
1st Mtg Fixed Rate vs ARMFixed Rate 98.76 96.64 96.75 96.26 91.43 95.72 ARM 1.24 3.36 3.25 3.74 8.57 4.28
Total 100.00 100.00 100.00 100.00 100.00 100.00
1st Mtg Interest Only vs. Non‐Interest‐OnlyInterest Only ‐ 1.51 2.40 0.07 0.78 1.24 Non‐Interest Only 100.00 98.49 97.60 99.93 99.22 98.76
Total 100.00 100.00 100.00 100.00 100.00 100.00
1st Mtg Owner Occupied vs. Non‐Owner OccupiedOwner Occupied 93.75 88.81 90.59 92.67 89.03 90.20 Non‐Owner Occupied 6.25 11.19 9.41 7.33 10.97 9.80
Total 100.00 100.00 100.00 100.00 100.00 100.00
Servicing by Investor TypeServiced for Portfolio 0.55 0.88 0.84 2.29 0.99 Serviced for Others: 100.00 99.45 99.12 99.16 97.71 99.01 Fannie/Freddie/Ginnie 100.00 93.33 91.66 92.64 80.35 90.60 Other Investors 6.12 7.46 6.52 17.36 8.42
Total 100.00 100.00 100.00 100.00 100.00 100.00
1st Mtg in Bankruptcy (%) 0.91 0.20 0.25 0.84 0.76 0.46
Seriously Delinquent Rates (90+ Days or in FC) 2.37 1.40 1.65 1.70 4.29 2.08
Agency Servicing Seriously Delinquent Rate 2.37 1.47 1.97 1.51 2.13 1.72
Number of Companies Reporting 1 75 47 49 37 208
QUARTERLY MORTGAGE BANKERS PERFORMANCE REPORT | Q1 2018 Results from the Mortgage Bankers Association© Mortgage Bankers Association 2018. All rights reserved. 59

QUARTER 1, 2018
Quarterly Mortgage Bankers Performance ReportResidential Loan Servicing ‐ By Servicing Volume #M4 ‐ Servicing Mix (#), Simple Average
% BASED ON # Your Firm <2,500 2,500‐10,000 10,000‐50,000 >50,000 TotalAverage Owned Servicing Portfolio ($000) 1,215,845 187,356 873,706 3,975,843 45,604,162 9,313,876 Average Owned Servicing Portfolio (#) 6,867 926 4,884 22,808 264,637 53,885 Average Loan Balance ($) 177,030 206,974 181,817 170,508 176,794 187,357
Servicing MixFirst Mortgages: 100.00 98.14 98.43 95.49 82.28 94.74 Government (FHA/VA/RHS) 62.72 18.34 33.51 42.24 28.35 29.16 Prime (Conforming and Jumbo) ‐ Fixed 36.48 76.71 60.09 50.01 40.97 60.31 Prime (Conforming and Jumbo) ‐ ARM 0.80 0.77 0.99 0.45 2.48 1.05 Other Fixed 1.84 3.00 1.68 8.70 3.29 Other ARM 0.48 0.84 1.10 1.78 0.94
Closed‐End Second Mortgages 0.15 1.37 3.60 2.64 1.68 Funded HELOCs 0.02 0.13 0.03 0.39 0.11 Other 1.69 0.07 0.88 14.68 3.46 Total 100.00 100.00 100.00 100.00 100.00 100.00
1st Mtg Fixed Rate vs ARMFixed Rate 99.16 97.08 97.58 96.77 92.91 96.44 ARM 0.84 2.92 2.42 3.23 7.09 3.56
Total 100.00 100.00 100.00 100.00 100.00 100.00
1st Mtg Interest Only vs. Non‐Interest‐OnlyInterest Only ‐ 1.44 2.31 0.04 0.41 1.12 Non‐Interest Only 100.00 98.56 97.69 99.96 99.59 98.88
Total 100.00 100.00 100.00 100.00 100.00 100.00
1st Mtg Owner Occupied vs. Non‐Owner OccupiedOwner Occupied 94.61 87.06 89.27 91.39 88.01 88.79 Non‐Owner Occupied 5.39 12.94 10.73 8.61 11.99 11.21
Total 100.00 100.00 100.00 100.00 100.00 100.00
Servicing by Investor TypeServiced for Portfolio 0.54 0.89 0.75 1.62 0.85 Serviced for Others: 100.00 99.46 99.11 99.25 98.38 99.15 Fannie/Freddie/Ginnie 100.00 93.46 92.44 92.91 81.86 91.14 Other Investors 6.00 6.67 6.33 16.52 8.00
Total 100.00 100.00 100.00 100.00 100.00 100.00
1st Mtg in Bankruptcy (%) 0.91 0.20 0.25 0.84 0.76 0.46
Seriously Delinquent Rates (90+ Days or in FC) 2.58 1.38 1.68 1.68 3.80 1.98
Agency Servicing Seriously Delinquent Rate 2.58 1.44 2.01 1.52 2.11 1.72
Number of Companies Reporting 1 75 47 49 37 208
QUARTERLY MORTGAGE BANKERS PERFORMANCE REPORT | Q1 2018 Results from the Mortgage Bankers Association© Mortgage Bankers Association 2018. All rights reserved. 60

QUARTER 1, 2018
Quarterly Mortgage Bankers Performance ReportResidential Loan Servicing ‐ By Servicing Volume #M5 ‐ Servicing Mix (Avg Loan Balances), Simple Average
LOAN BALANCES Your Firm <2,500 2,500‐10,000 10,000‐50,000 >50,000 TotalAverage Owned Servicing Portfolio ($000) 1,215,845 187,356 873,706 3,975,843 45,604,162 9,313,876 Average Owned Servicing Portfolio (#) 6,867 926 4,884 22,808 264,637 53,885 Average Loan Balance ($) 177,030 206,974 181,817 170,508 176,794 187,357
Servicing MixFirst Mortgages: 177,030 208,291 183,453 173,725 185,912 190,594 Government (FHA/VA/RHS) ‐ Fixed 156,139 217,610 175,402 175,100 162,220 183,731 Government (FHA/VA/RHS) ‐ ARM 449,999 263,664 246,002 196,789 173,476 199,598 Prime (Conforming and Jumbo) ‐ Fixed 211,005 204,213 186,989 174,378 202,158 192,525 Prime (Conforming and Jumbo) ‐ ARM 251,629 307,154 238,191 236,840 228,795 252,865 Other Fixed 205,656 190,486 150,825 226,535 200,780 Other ARM 366,802 226,799 171,111 231,206 254,008
Closed‐End Second Mortgages 48,928 46,427 43,236 23,023 38,650 Funded HELOCs 87,583 153,221 67,613 35,969 81,795 Other 98,295 185,382 245,259 145,415 164,617
1st Mtg Fixed Rate vs ARMFixed Rate 176,318 206,309 180,829 172,575 182,120 188,372 ARM 262,069 283,477 239,827 229,249 219,152 243,130
1st Mtg Interest Only vs. Non‐Interest‐OnlyInterest Only 299,258 369,233 354,430 420,130 386,831 Non‐Interest Only 177,030 208,258 183,478 173,689 185,289 190,243
1st Mtg Owner Occupied vs. Non‐Owner OccupiedOwner Occupied 175,460 212,641 188,135 176,486 187,620 194,048 Non‐Owner Occupied 204,511 182,695 159,369 149,961 174,275 168,202
Servicing by Investor TypeServiced for Portfolio 197,839 178,892 192,150 203,968 193,185 Serviced for Others: 177,030 207,759 183,436 173,849 184,207 190,030 Fannie/Freddie/Ginnie 177,030 206,553 182,011 175,632 178,676 188,888 Other Investors 205,178 203,496 165,721 219,849 200,763
Seriously Delinquent Rates (90+ Days or in FC) 162,757 194,286 178,202 162,667 168,316 177,196
Agency Servicing Seriously Delinquent 162,757 201,053 194,571 170,375 167,170 184,520
Number of Companies Reporting 1 75 47 49 37 208
QUARTERLY MORTGAGE BANKERS PERFORMANCE REPORT | Q1 2018 Results from the Mortgage Bankers Association© Mortgage Bankers Association 2018. All rights reserved. 61

QUARTER 1, 2018
Quarterly Mortgage Bankers Performance ReportResidential Loan Servicing ‐ In‐House vs Subserviced by Others in CountN1 ‐ Servicing Income and Expense, $ per loan, Simple AverageANNUALIZED Data for Revenue and Expenses
$ PER LOAN: Your Firm
Primarily In‐
House
Servicing
Primarily
Subserviced by
Others Total
DIRECT REVENUEServicing Fees 582 418 557 497 First Mortgages, Seconds, Other 582 348 552 464 Subservicing Fees Earned 70 5 33
Late Fees and Other Ancillary Income 19 32 76 57 Total Direct Servicing Revenue 601 449 633 554
DIRECT EXPENSESPersonnel 31 132 101 114 Loan Administration Employees 26 111 96 102 Benefits 5 17 5 10 Other Personnel Expenses 4 1 2
Occupancy and Equipment 2 11 1 6 Other Direct Expenses 145 68 243 167 Subservicing Fees Paid 101 7 233 135 Other Miscellaneous Expenses 44 62 10 32
Total Direct Expenses 178 211 346 287
DIRECT SERVICING NET INCOME 423 238 288 266
INDIRECT EXPENSESUnreimbursed FC/REO Svg Expenses 4 0 2 Corporate Allocation 4 28 32 30
Total Indirect Expenses 4 32 32 32
NET INTEREST INCOMEEscrow Earnings ‐ 4 0 2 Corporate Interest Losses on MBS Pools (2) (2) (2) Other Interest Expense (17) (9) (9) (9)
Net Interest Income (17) (6) (11) (9)
NET OPERATING INCOME 402 200 244 225
MSR FINANCIAL ITEMSAmortized Cost of Servicing Rights / Loan Decay (213) (53) (128) (96) Net Gain (Loss) on Bulk Sale of Servicing 21 12 16 Net Gain (Loss) from MSR Valuations & Hedging 107 227 175
Total Financial Items (213) 75 111 95
TOTAL NET FINANCIAL INCOME 189 274 355 320
Memorandum Items:Average Servicing Portfolio ($000) 1,215,845 27,300,593 4,318,883 14,262,892 Average Servicing Portfolio (#) 6,867 164,719 20,404 82,848Average Loan Balance ($) 177,030 169,856 204,387 189,446
# Servicing FTEs (excluding 0 reporters) 5 235 6 118
Average Loans Serviced per FTE (Simple) 1,716 823 1,402 1,118Average Loans Serviced per FTE (Weighted) 1,716 749 1,750 774Average Loans Serviced per FTE (Median) 1,716 672 911 711
Average Personnel Cost per FTE (Simple) 58,000 64,459 64,014 64,233Average Personnel Cost per FTE (Weighted) 58,000 71,732 65,471 71,577Average Personnel Cost per FTE (Median) 58,000 62,921 61,231 62,667
Subservicing for Others (% based on $) 15.58 0.73 7.16Subservicing for Others (% based on #) 15.80 0.84 7.31Subservicing for Others ‐ Avg Balance ($) 162,804 176,521 164,519
Subservicing by Others (% based on $) 100.00 0.23 99.16 56.36Subservicing by Others (% based on #) 100.00 0.21 98.92 56.21Subservicing by Others ‐ Avg Balance ($) 177,030 207,123 204,926 205,065
Number of Companies 1 90 118 208
QUARTERLY MORTGAGE BANKERS PERFORMANCE REPORT | Q1 2018 Results from the Mortgage Bankers Association© Mortgage Bankers Association 2018. All rights reserved. 62

QUARTER 1, 2018
Quarterly Mortgage Bankers Performance ReportResidential Loan Servicing ‐ In‐House vs Subserviced by Others in CountN2 ‐ Servicing Income and Expense, Basis Points, Simple AverageANNUALIZED Data for Revenue and Expenses
BASIS POINTS: Your Firm
Primarily In‐
House
Servicing
Primarily
Subserviced by
Others Total
DIRECT REVENUEServicing Fees 32.92 25.74 27.39 26.68 First Mortgages, Seconds, Other 32.92 21.77 27.08 24.78 Subservicing Fees Earned 3.97 0.30 1.89
Late Fees and Other Ancillary Income 1.14 2.94 2.91 2.92 Total Direct Servicing Revenue 34.06 28.68 30.30 29.60
DIRECT EXPENSESPersonnel 1.89 8.11 5.67 6.73 Loan Administration Employees 1.52 6.82 5.35 5.99 Benefits 0.37 1.07 0.29 0.62 Other Personnel Expenses 0.23 0.04 0.12
Occupancy and Equipment 0.21 0.70 0.07 0.34 Other Direct Expenses 8.28 4.21 12.00 8.63 Subservicing Fees Paid 5.83 0.41 11.53 6.72 Other Miscellaneous Expenses 2.45 3.80 0.48 1.91
Total Direct Expenses 10.38 13.02 17.75 15.70
DIRECT SERVICING NET INCOME 23.68 15.66 12.55 13.90
INDIRECT EXPENSESUnreimbursed FC/REO Svg Expenses 0.32 0.01 0.14 Corporate Allocation 0.28 2.00 1.74 1.85
Total Indirect Expenses 0.28 2.32 1.74 1.99
NET INTEREST INCOMEEscrow Earnings ‐ 0.27 0.02 0.13 Corporate Interest Losses on MBS Pools (0.12) (0.11) (0.11) Other Interest Expense (1.01) (0.51) (0.43) (0.47)
Net Interest Income (1.01) (0.36) (0.52) (0.45)
NET OPERATING INCOME 22.39 12.98 10.29 11.45
MSR FINANCIAL ITEMSAmortized Cost of Servicing Rights / Loan Decay (12.06) (3.35) (5.66) (4.66) Net Gain (Loss) on Bulk Sale of Servicing 0.94 0.33 0.60 Net Gain (Loss) from MSR Valuations & Hedging 5.41 10.92 8.54
Total Financial Items (12.06) 3.01 5.59 4.47
TOTAL NET FINANCIAL INCOME 10.33 15.99 15.88 15.93
Memorandum Items:Average Servicing Portfolio ($000) 1,215,845 27,300,593 4,318,883 14,262,892 Average Servicing Portfolio (#) 6,867 164,719 20,404 82,848Average Loan Balance ($) 177,030 169,856 204,387 189,446
# Servicing FTEs (excluding 0 reporters) 3 235 6 118
Average Loans Serviced per FTE 1,716 823 1,402 1,118Average Loans Serviced per FTE (Weighted) 1,716 749 1,750 774Average Loans Serviced per FTE (Median) 1,716 672 911 711
Average Personnel Cost per FTE 56,000 64,459 64,014 64,233Average Personnel Cost per FTE (Weighted) 56,000 71,732 65,471 71,577Average Personnel Cost per FTE (Median) 56,000 62,921 61,231 62,667
Subservicing for Others (% based on $) 15.58 0.73 7.16Subservicing for Others (% based on #) 15.80 0.84 7.31Subservicing for Others ‐ Avg Balance ($) 162,804 176,521 164,519
Subservicing by Others (% based on $) 100.00 0.23 99.16 56.36Subservicing by Others (% based on #) 100.00 0.21 98.92 56.21Subservicing by Others ‐ Avg Balance ($) 177,030 207,123 204,926 205,065
Number of Companies Reporting 1 90 118 208
QUARTERLY MORTGAGE BANKERS PERFORMANCE REPORT | Q1 2018 Results from the Mortgage Bankers Association© Mortgage Bankers Association 2018. All rights reserved. 63

QUARTER 1, 2018
Quarterly Mortgage Bankers Performance ReportResidential Loan Servicing ‐ In‐House vs Subserviced by Others in CountN3 ‐ Servicing Mix ($), Simple Average
% BASED ON $ Your Firm
Primarily In‐
House
Servicing
Primarily
Subserviced by
Others TotalAverage Owned Servicing Portfolio ($000) 1,215,845 15,968,531 4,238,292 9,313,876 Average Owned Servicing Portfolio (#) 6,867 98,601 19,780 53,885 Average Loan Balance ($) 177,030 164,215 204,812 187,357
Servicing MixFirst Mortgages: 100.00 94.15 97.38 95.99 Government (FHA/VA/RHS) 55.43 29.29 29.00 29.12 Prime (Conforming and Jumbo) ‐ Fixed 43.46 53.26 66.54 60.83 Prime (Conforming and Jumbo) ‐ ARM 1.11 1.57 1.13 1.32 Other Fixed 7.72 0.26 3.47 Other ARM 2.32 0.45 1.25
Closed‐End Second Mortgages 0.69 0.03 0.31 Funded HELOCs 0.09 0.00 0.04 Other 5.07 2.58 3.65 Total 100.00 100.00 100.00 100.00
1st Mtg Fixed Rate vs ARMFixed Rate 98.76 94.16 96.91 95.72ARM 1.24 5.84 3.09 4.28
Total 100.00 100.00 100.00 100.00
1st Mtg Interest Only vs. Non‐Interest‐OnlyInterest Only ‐ 0.47 1.82 1.24Non‐Interest Only 100.00 99.53 98.18 98.76
Total 100.00 100.00 100.00 100.00
1st Mtg Owner Occupied vs. Non‐Owner OccupiedOwner Occupied 93.75 91.03 89.59 90.20Non‐Owner Occupied 6.25 8.97 10.41 9.80
Total 100.00 100.00 100.00 100.00
Servicing by Investor TypeServiced for Portfolio 1.32 0.75 0.99Serviced for Others: 100.00 98.68 99.25 99.01Fannie/Freddie/Ginnie 100.00 83.52 95.74 90.60Other Investors 15.16 3.51 8.42
Total 100.00 100.00 100.00 100.00
1st Mtg in Bankruptcy (%) 0.91 0.72 0.27 0.46
Seriously Delinquent Rates (90+ Days or in FC) 2.37 2.64 1.67 2.08
Agency Servicing Seriously Delinquent Rate 2.37 1.73 1.71 1.72
Number of Companies Reporting 1 90 118 208
QUARTERLY MORTGAGE BANKERS PERFORMANCE REPORT | Q1 2018 Results from the Mortgage Bankers Association© Mortgage Bankers Association 2018. All rights reserved. 64

QUARTER 1, 2018
Quarterly Mortgage Bankers Performance ReportResidential Loan Servicing ‐ In‐House vs Subserviced by Others in CountN4 ‐ Servicing Mix (#), Simple Average
% BASED ON # Your Firm
Primarily In‐
House
Servicing
Primarily
Subserviced by
Others TotalAverage Owned Servicing Portfolio ($000) 1,215,845 15,968,531 4,238,292 9,313,876 Average Owned Servicing Portfolio (#) 6,867 98,601 19,780 53,885 Average Loan Balance ($) 177,030 164,215 204,812 187,357
Servicing MixFirst Mortgages: 100.00 91.42 97.25 94.74 Government (FHA/VA/RHS) 62.72 28.64 29.55 29.16 Prime (Conforming and Jumbo) ‐ Fixed 36.48 52.38 66.29 60.31 Prime (Conforming and Jumbo) ‐ ARM 0.80 1.32 0.85 1.05 Other Fixed 7.29 0.26 3.29 Other ARM 1.79 0.30 0.94
Closed‐End Second Mortgages 3.78 0.10 1.68 Funded HELOCs 0.25 0.01 0.11 Other 4.54 2.65 3.46 Total 100.00 100.00 100.00 100.00
1st Mtg Fixed Rate vs ARMFixed Rate 99.16 95.11 97.44 96.44ARM 0.84 4.89 2.56 3.56
Total 100.00 100.00 100.00 100.00
1st Mtg Interest Only vs. Non‐Interest‐OnlyInterest Only ‐ 0.25 1.77 1.12Non‐Interest Only 100.00 99.75 98.23 98.88
Total 100.00 100.00 100.00 100.00
1st Mtg Owner Occupied vs. Non‐Owner OccupiedOwner Occupied 94.61 90.00 87.89 88.79Non‐Owner Occupied 5.39 10.00 12.11 11.21
Total 100.00 100.00 100.00 100.00
Servicing by Investor TypeServiced for Portfolio 1.04 0.72 0.85Serviced for Others: 100.00 98.96 99.28 99.15Fannie/Freddie/Ginnie 100.00 84.57 95.92 91.14Other Investors 14.39 3.36 8.00
Total 100.00 100.00 100.00 100.00
1st Mtg in Bankruptcy (%) 0.91 0.72 0.27 0.46
Seriously Delinquent Rates (90+ Days or in FC) 2.58 2.37 1.70 1.98
Agency Servicing Seriously Delinquent Rate 2.58 1.71 1.73 1.72
Number of Companies Reporting 1 90 118 208
QUARTERLY MORTGAGE BANKERS PERFORMANCE REPORT | Q1 2018 Results from the Mortgage Bankers Association© Mortgage Bankers Association 2018. All rights reserved. 65

QUARTER 1, 2018
Quarterly Mortgage Bankers Performance ReportResidential Loan Servicing ‐ In‐House vs Subserviced by Others in CountN5 ‐ Servicing Mix (Avg Loan Balances), Simple Average
LOAN BALANCES Your Firm
Primarily In‐
House
Servicing
Primarily
Subserviced by
Others TotalAverage Owned Servicing Portfolio ($000) 1,215,845 15,968,531 4,238,292 9,313,876 Average Owned Servicing Portfolio (#) 6,867 98,601 19,780 53,885 Average Loan Balance ($) 177,030 164,215 204,812 187,357
Servicing MixFirst Mortgages: 177,030 169,880 206,264 190,594 Government (FHA/VA/RHS) ‐ Fixed 156,139 157,734 203,084 183,731 Government (FHA/VA/RHS) ‐ ARM 449,999 184,067 218,581 199,598 Prime (Conforming and Jumbo) ‐ Fixed 211,005 170,158 207,503 192,525 Prime (Conforming and Jumbo) ‐ ARM 251,629 203,011 283,545 252,865 Other Fixed 188,832 233,037 200,780 Other ARM 201,402 404,312 254,008
Closed‐End Second Mortgages 32,715 45,269 38,650 Funded HELOCs 62,751 119,883 81,795 Other 173,054 141,416 164,617
1st Mtg Fixed Rate vs ARMFixed Rate 176,318 167,160 204,419 188,372 ARM 262,069 195,436 278,183 243,130
1st Mtg Interest Only vs. Non‐Interest‐OnlyInterest Only 421,662 330,564 386,831 Non‐Interest Only 177,030 168,857 206,330 190,243
1st Mtg Owner Occupied vs. Non‐Owner OccupiedOwner Occupied 175,460 172,044 210,120 194,048 Non‐Owner Occupied 204,511 154,779 176,622 168,202
Servicing by Investor TypeServiced for Portfolio 183,344 200,459 193,185 Serviced for Others: 177,030 168,918 205,368 190,030 Fannie/Freddie/Ginnie 177,030 165,838 205,239 188,888 Other Investors 183,483 235,322 200,763
Seriously Delinquent Rates (90+ Days or in FC) 162,757 151,306 196,550 177,196
Agency Servicing Seriously Delinquent 162,757 158,895 202,862 184,520
Number of Companies Reporting 1 90 118 208
QUARTERLY MORTGAGE BANKERS PERFORMANCE REPORT | Q1 2018 Results from the Mortgage Bankers Association© Mortgage Bankers Association 2018. All rights reserved. 66

QUARTER 1, 2018
Quarterly Mortgage Bankers Performance ReportResidential Loan Servicing ‐ By Company TypeO1 ‐ Servicing Income and Expense, $ per loan, Simple AverageANNUALIZED Data for Revenue and Expenses
$ PER LOAN: Your Firm
Bank/ Thrift
Subs
Independent
Mtg Cos. Other (1) Total
DIRECT REVENUEServicing Fees 582 424 522 437 497 First Mortgages, Seconds, Other 582 350 500 376 464 Subservicing Fees Earned 73 21 61 33
Late Fees and Other Ancillary Income 19 20 66 37 57 Total Direct Servicing Revenue 601 444 587 475 554
DIRECT EXPENSESPersonnel 31 151 117 91 114 Loan Administration Employees 26 127 107 74 102 Benefits 5 13 8 15 10 Other Personnel Expenses 11 1 2 2
Occupancy and Equipment 2 7 5 7 6 Other Direct Expenses 145 143 184 118 167 Subservicing Fees Paid 101 108 154 78 135 Other Miscellaneous Expenses 44 35 29 40 32
Total Direct Expenses 178 302 306 216 287
DIRECT SERVICING NET INCOME 423 142 281 259 266
INDIRECT EXPENSESUnreimbursed FC/REO Svg Expenses 1 2 1 2 Corporate Allocation 4 27 30 33 30
Total Indirect Expenses 4 28 32 34 32
NET INTEREST INCOMEEscrow Earnings ‐ 2 2 3 2 Corporate Interest Losses on MBS Pools (2) (2) (1) (2) Other Interest Expense (17) (3) (6) (23) (9)
Net Interest Income (17) (3) (6) (20) (9)
NET OPERATING INCOME 402 111 243 204 225
MSR FINANCIAL ITEMSAmortized Cost of Servicing Rights / Loan Decay (213) (112) (106) (52) (96) Net Gain (Loss) on Bulk Sale of Servicing 1 17 19 16 Net Gain (Loss) from MSR Valuations & Hedging 39 191 168 175
Total Financial Items (213) (71) 102 134 95
TOTAL NET FINANCIAL INCOME 189 40 345 339 320
Memorandum Items:Average Servicing Portfolio ($000) 1,215,845 14,408,357 8,206,721 35,836,658 14,262,892 Average Servicing Portfolio (#) 6,867 74,879 45,729 218,452 82,848Average Loan Balance ($) 177,030 163,635 194,578 180,948 189,446
# Servicing FTEs (excluding 0 reporters) 5 84 76 284 118
Average Loans Serviced per FTE (Simple) 1,716 970 1,036 1,475 1,118Average Loans Serviced per FTE (Weighted) 1,716 1,005 690 827 774Average Loans Serviced per FTE (Median) 1,716 842 692 992 711
Average Personnel Cost per FTE (Simple) 58,000 76,540 61,087 70,545 64,233Average Personnel Cost per FTE (Weighted) 58,000 68,846 75,365 68,220 71,577Average Personnel Cost per FTE (Median) 58,000 69,000 60,842 66,800 62,667
Subservicing for Others (% based on $) 11.20 3.13 20.02 7.16Subservicing for Others (% based on #) 10.87 3.15 20.82 7.31Subservicing for Others ‐ Avg Balance ($) 174,486 168,160 157,475 164,519
Subservicing by Others (% based on $) 100.00 56.23 61.48 38.12 56.36Subservicing by Others (% based on #) 100.00 56.19 61.29 38.10 56.21Subservicing by Others ‐ Avg Balance ($) 177,030 163,987 207,978 209,499 205,065
Number of Companies 1 16 150 42 208
(1) Other ‐ Subsidiaries of other non‐depository institutions; hedge funds or hedge fund subsidiaries; REITs
QUARTERLY MORTGAGE BANKERS PERFORMANCE REPORT | Q1 2018 Results from the Mortgage Bankers Association© Mortgage Bankers Association 2018. All rights reserved. 67

QUARTER 1, 2018
Quarterly Mortgage Bankers Performance ReportResidential Loan Servicing ‐ By Company TypeO2 ‐ Servicing Income and Expense, Basis Points, Simple AverageANNUALIZED Data for Revenue and Expenses
BASIS POINTS: Your Firm
Bank/ Thrift
Subs
Independent
Mtg Cos. Other (1) Total
DIRECT REVENUEServicing Fees 32.92 25.76 27.13 25.41 26.68 First Mortgages, Seconds, Other 32.92 21.63 26.06 21.42 24.78 Subservicing Fees Earned 4.12 1.07 3.99 1.89
Late Fees and Other Ancillary Income 1.14 1.16 2.76 4.17 2.92 Total Direct Servicing Revenue 34.06 26.92 29.89 29.58 29.60
DIRECT EXPENSESPersonnel 1.89 10.99 6.42 6.23 6.73 Loan Administration Employees 1.52 9.45 5.86 5.12 5.99 Benefits 0.37 1.08 0.48 0.95 0.62 Other Personnel Expenses 0.46 0.07 0.16 0.12
Occupancy and Equipment 0.21 0.45 0.30 0.46 0.34 Other Direct Expenses 8.28 8.36 9.24 6.56 8.63 Subservicing Fees Paid 5.83 6.21 7.52 4.04 6.72 Other Miscellaneous Expenses 2.45 2.15 1.72 2.52 1.91
Total Direct Expenses 10.38 19.79 15.96 13.24 15.70
DIRECT SERVICING NET INCOME 23.68 7.13 13.93 16.34 13.90
INDIRECT EXPENSESUnreimbursed FC/REO Svg Expenses 0.07 0.16 0.12 0.14 Corporate Allocation 0.28 1.51 1.64 2.73 1.85
Total Indirect Expenses 0.28 1.58 1.80 2.85 1.99
NET INTEREST INCOMEEscrow Earnings ‐ 0.10 0.10 0.22 0.13 Corporate Interest Losses on MBS Pools (0.12) (0.13) (0.06) (0.11) Other Interest Expense (1.01) (0.15) (0.30) (1.19) (0.47)
Net Interest Income (1.01) (0.17) (0.32) (1.02) (0.45)
NET OPERATING INCOME 22.39 5.38 11.82 12.46 11.45
MSR FINANCIAL ITEMSAmortized Cost of Servicing Rights / Loan Decay (12.06) (6.83) (4.95) (2.77) (4.66) Net Gain (Loss) on Bulk Sale of Servicing 0.08 0.62 0.70 0.60 Net Gain (Loss) from MSR Valuations & Hedging 1.93 9.63 7.15 8.54
Total Financial Items (12.06) (4.82) 5.30 5.08 4.47
TOTAL NET FINANCIAL INCOME 10.33 0.56 17.11 17.54 15.93
Memorandum Items:Average Servicing Portfolio ($000) 1,215,845 14,408,357 8,206,721 35,836,658 14,262,892 Average Servicing Portfolio (#) 6,867 74,879 45,729 218,452 82,848Average Loan Balance ($) 177,030 163,635 194,578 180,948 189,446
# Servicing FTEs (excluding 0 reporters) 3 84 76 284 118
Average Loans Serviced per FTE 1,716 970 1,036 1,475 1,118Average Loans Serviced per FTE (Weighted) 1,716 1,005 690 827 774Average Loans Serviced per FTE (Median) 1,716 842 692 992 711
Average Personnel Cost per FTE 56,000 76,540 61,087 70,545 64,233Average Personnel Cost per FTE (Weighted) 56,000 68,846 75,365 68,220 71,577Average Personnel Cost per FTE (Median) 56,000 69,000 60,842 66,800 62,667
Subservicing for Others (% based on $) 11.20 3.13 20.02 7.16Subservicing for Others (% based on #) 10.87 3.15 20.82 7.31Subservicing for Others ‐ Avg Balance ($) 174,486 168,160 157,475 164,519
Subservicing by Others (% based on $) 100.00 56.23 61.48 38.12 56.36Subservicing by Others (% based on #) 100.00 56.19 61.29 38.10 56.21Subservicing by Others ‐ Avg Balance ($) 177,030 163,987 207,978 209,499 205,065
Number of Companies Reporting 1 16 150 42 208
(1) Other ‐ Subsidiaries of other non‐depository institutions; hedge funds or hedge fund subsidiaries; REITs
QUARTERLY MORTGAGE BANKERS PERFORMANCE REPORT | Q1 2018 Results from the Mortgage Bankers Association© Mortgage Bankers Association 2018. All rights reserved. 68

QUARTER 1, 2018
Quarterly Mortgage Bankers Performance ReportResidential Loan Servicing ‐ By Company TypeO3 ‐ Servicing Mix ($), Simple Average
% BASED ON $ Your Firm
Bank/Thrift
Subs
Independent
Mtg. Cos Other (1) TotalAverage Owned Servicing Portfolio ($000) 1,215,845 13,545,102 6,486,775 17,798,770 9,313,876 Average Owned Servicing Portfolio (#) 6,867 70,182 35,812 112,224 53,885 Average Loan Balance ($) 177,030 158,454 194,651 171,952 187,357
Servicing MixFirst Mortgages: 100.00 99.88 97.33 89.60 95.99 Government (FHA/VA/RHS) 55.43 12.96 31.71 25.95 29.12 Prime (Conforming and Jumbo) ‐ Fixed 43.46 78.83 62.51 47.69 60.83 Prime (Conforming and Jumbo) ‐ ARM 1.11 1.64 1.05 2.17 1.32 Other Fixed 6.38 1.01 11.30 3.47 Other ARM 0.08 1.04 2.48 1.25
Closed‐End Second Mortgages 0.11 0.03 1.43 0.31 Funded HELOCs 0.01 0.00 0.20 0.04 Other 0.00 2.64 8.77 3.65 Total 100.00 100.00 100.00 100.00 100.00
1st Mtg Fixed Rate vs ARMFixed Rate 98.76 98.26 96.18 92.99 95.72ARM 1.24 1.74 3.82 7.01 4.28
Total 100.00 100.00 100.00 100.00 100.00
1st Mtg Interest Only vs. Non‐Interest‐OnlyInterest Only ‐ 0.12 1.50 0.73 1.24Non‐Interest Only 100.00 99.88 98.50 99.27 98.76
Total 100.00 100.00 100.00 100.00 100.00
1st Mtg Owner Occupied vs. Non‐Owner OccupiedOwner Occupied 93.75 92.47 89.77 90.87 90.20Non‐Owner Occupied 6.25 7.53 10.23 9.13 9.80
Total 100.00 100.00 100.00 100.00 100.00
Servicing by Investor TypeServiced for Portfolio 2.37 0.72 1.42 0.99Serviced for Others: 100.00 97.63 99.28 98.58 99.01Fannie/Freddie/Ginnie 100.00 96.67 93.63 76.67 90.60Other Investors 0.96 5.65 21.90 8.42
Total 100.00 100.00 100.00 100.00 100.00
1st Mtg in Bankruptcy (%) 0.91 0.28 0.37 0.88 0.46
Seriously Delinquent Rates (90+ Days or in FC) 2.37 0.60 1.68 3.88 2.08
Agency Servicing Seriously Delinquent Rate 2.37 0.45 1.64 2.57 1.72
Number of Companies Reporting 1 16 150 42 208
(1) Other ‐ Subsidiaries of other non‐depository institutions; hedge funds or hedge fund subsidiaries; REITs
QUARTERLY MORTGAGE BANKERS PERFORMANCE REPORT | Q1 2018 Results from the Mortgage Bankers Association© Mortgage Bankers Association 2018. All rights reserved. 69

QUARTER 1, 2018
Quarterly Mortgage Bankers Performance ReportResidential Loan Servicing ‐ By Company TypeO4 ‐ Servicing Mix (#), Simple Average
% BASED ON # Your Firm
Bank/Thrift
Subs
Independent
Mtg. Cos Other (1) TotalAverage Owned Servicing Portfolio ($000) 1,215,845 13,545,102 6,486,775 17,798,770 9,313,876 Average Owned Servicing Portfolio (#) 6,867 70,182 35,812 112,224 53,885 Average Loan Balance ($) 177,030 158,454 194,651 171,952 187,357
Servicing MixFirst Mortgages: 100.00 99.64 97.31 83.43 94.74 Government (FHA/VA/RHS) 62.72 13.66 32.14 24.31 29.16 Prime (Conforming and Jumbo) ‐ Fixed 36.48 78.41 62.51 45.19 60.31 Prime (Conforming and Jumbo) ‐ ARM 0.80 1.17 0.86 1.69 1.05 Other Fixed 6.31 1.01 10.44 3.29 Other ARM 0.10 0.79 1.81 0.94
Closed‐End Second Mortgages 0.32 0.11 7.96 1.68 Funded HELOCs 0.04 0.01 0.53 0.11 Other 0.00 2.57 8.08 3.46 Total 100.00 100.00 100.00 100.00 100.00
1st Mtg Fixed Rate vs ARMFixed Rate 99.16 98.70 96.73 94.41 96.44ARM 0.84 1.30 3.27 5.59 3.56
Total 100.00 100.00 100.00 100.00 100.00
1st Mtg Interest Only vs. Non‐Interest‐OnlyInterest Only ‐ 0.09 1.44 0.38 1.12Non‐Interest Only 100.00 99.91 98.56 99.62 98.88
Total 100.00 100.00 100.00 100.00 100.00
1st Mtg Owner Occupied vs. Non‐Owner OccupiedOwner Occupied 94.61 90.59 88.31 89.82 88.79Non‐Owner Occupied 5.39 9.41 11.69 10.18 11.21
Total 100.00 100.00 100.00 100.00 100.00
Servicing by Investor TypeServiced for Portfolio 1.58 0.66 1.28 0.85Serviced for Others: 100.00 98.42 99.34 98.72 99.15Fannie/Freddie/Ginnie 100.00 97.50 94.08 77.45 91.14Other Investors 0.91 5.25 21.27 8.00
Total 100.00 100.00 100.00 100.00 100.00
1st Mtg in Bankruptcy (%) 0.91 0.28 0.37 0.88 0.46
Seriously Delinquent Rates (90+ Days or in FC) 2.58 0.64 1.70 3.34 1.98
Agency Servicing Seriously Delinquent Rate 2.58 0.48 1.67 2.47 1.72
Number of Companies Reporting 1 16 150 42 208
(1) Other ‐ Subsidiaries of other non‐depository institutions; hedge funds or hedge fund subsidiaries; REITs
QUARTERLY MORTGAGE BANKERS PERFORMANCE REPORT | Q1 2018 Results from the Mortgage Bankers Association© Mortgage Bankers Association 2018. All rights reserved. 70

QUARTER 1, 2018
Quarterly Mortgage Bankers Performance ReportResidential Loan Servicing ‐ By Company TypeO5 ‐ Servicing Mix (Avg Loan Balances), Simple Average
LOAN BALANCES Your Firm
Bank/Thrift
Subs
Independent
Mtg. Cos Other (1) TotalAverage Owned Servicing Portfolio ($000) 1,215,845 13,545,102 6,486,775 17,798,770 9,313,876 Average Owned Servicing Portfolio (#) 6,867 70,182 35,812 112,224 53,885 Average Loan Balance ($) 177,030 158,454 194,651 171,952 187,357
Servicing MixFirst Mortgages: 177,030 158,874 195,766 184,114 190,594 Government (FHA/VA/RHS) ‐ Fixed 156,139 141,711 192,689 169,450 183,731 Government (FHA/VA/RHS) ‐ ARM 449,999 143,851 202,399 208,963 199,598 Prime (Conforming and Jumbo) ‐ Fixed 211,005 160,047 195,188 196,095 192,525 Prime (Conforming and Jumbo) ‐ ARM 251,629 261,592 249,660 259,609 252,865 Other Fixed 148,270 222,467 189,765 200,780 Other ARM 128,724 334,317 203,467 254,008
Closed‐End Second Mortgages 43,627 45,513 30,178 38,650 Funded HELOCs 69,000 87,050 80,621 81,795 Other 94,417 153,708 185,922 164,617
1st Mtg Fixed Rate vs ARMFixed Rate 176,318 158,037 193,731 180,616 188,372 ARM 262,069 250,896 244,391 235,872 243,130
1st Mtg Interest Only vs. Non‐Interest‐OnlyInterest Only 315,172 457,748 325,518 386,831 Non‐Interest Only 177,030 158,820 195,579 183,568 190,243
1st Mtg Owner Occupied vs. Non‐Owner OccupiedOwner Occupied 175,460 162,404 199,542 186,743 194,048 Non‐Owner Occupied 204,511 132,372 170,704 176,219 168,202
Servicing by Investor TypeServiced for Portfolio 220,650 198,592 161,169 193,185 Serviced for Others: 177,030 157,277 195,086 184,413 190,030 Fannie/Freddie/Ginnie 177,030 157,165 193,099 185,872 188,888 Other Investors 161,206 204,533 203,950 200,763
Seriously Delinquent Rates (90+ Days or in FC) 162,757 145,528 185,022 163,627 177,196
Agency Servicing Seriously Delinquent 162,757 142,654 192,524 172,961 184,520
Number of Companies Reporting 1 16 150 42 208
(1) Other ‐ Subsidiaries of other non‐depository institutions; hedge funds or hedge fund subsidiaries; REITs
QUARTERLY MORTGAGE BANKERS PERFORMANCE REPORT | Q1 2018 Results from the Mortgage Bankers Association© Mortgage Bankers Association 2018. All rights reserved. 71

QUARTER 1, 2018
Quarterly Mortgage Bankers Performance ReportResidential Loan Servicing ‐ By Govt. Servicing Percent in CountP1 ‐ Servicing Income and Expense, $ per loan, Simple AverageANNUALIZED Data for Revenue and Expenses
$ PER LOAN: Your Firm
<50%
Govt #
>= 50%
Govt # Total
DIRECT REVENUEServicing Fees 582 482 545 497 First Mortgages, Seconds, Other 582 442 534 464 Subservicing Fees Earned 40 11 33
Late Fees and Other Ancillary Income 19 63 37 57 Total Direct Servicing Revenue 601 545 582 554
DIRECT EXPENSESPersonnel 31 123 86 114 Loan Administration Employees 26 111 75 102 Benefits 5 10 10 10 Other Personnel Expenses 2 1 2
Occupancy and Equipment 2 6 6 6 Other Direct Expenses 145 164 177 167 Subservicing Fees Paid 101 131 148 135 Other Miscellaneous Expenses 44 33 29 32
Total Direct Expenses 178 293 269 287
DIRECT SERVICING NET INCOME 423 252 313 266
INDIRECT EXPENSESUnreimbursed FC/REO Svg Expenses 1 4 2 Corporate Allocation 4 33 22 30
Total Indirect Expenses 4 34 27 32
NET INTEREST INCOMEEscrow Earnings ‐ 2 1 2 Corporate Interest Losses on MBS Pools (2) (4) (2) Other Interest Expense (17) (10) (5) (9)
Net Interest Income (17) (9) (8) (9)
NET OPERATING INCOME 402 209 278 225
MSR FINANCIAL ITEMSAmortized Cost of Servicing Rights / Loan Decay (213) (105) (63) (96) Net Gain (Loss) on Bulk Sale of Servicing 12 29 16 Net Gain (Loss) from MSR Valuations & Hedging 207 71 175
Total Financial Items (213) 113 37 95
TOTAL NET FINANCIAL INCOME 189 322 315 320
Memorandum Items:Average Servicing Portfolio ($000) 1,215,845 13,907,939 15,414,679 14,262,892 Average Servicing Portfolio (#) 6,867 83,477 80,806 82,848Average Loan Balance ($) 177,030 191,997 181,167 189,446
# Servicing FTEs (excluding 0 reporters) 5 125 99 118
Average Loans Serviced per FTE (Simple) 1,716 1,023 1,393 1,118Average Loans Serviced per FTE (Weighted) 1,716 745 881 774Average Loans Serviced per FTE (Median) 1,716 661 896 711
Average Personnel Cost per FTE (Simple) 58,000 64,863 62,415 64,233Average Personnel Cost per FTE (Weighted) 58,000 71,852 70,572 71,577Average Personnel Cost per FTE (Median) 58,000 64,000 58,097 62,667
Subservicing for Others (% based on $) 7.84 4.94 7.16Subservicing for Others (% based on #) 8.05 4.94 7.31Subservicing for Others ‐ Avg Balance ($) 160,761 173,286 164,519
Subservicing by Others (% based on $) 100.00 56.25 56.68 56.36Subservicing by Others (% based on #) 100.00 56.09 56.59 56.21Subservicing by Others ‐ Avg Balance ($) 177,030 209,988 189,311 205,065
Number of Companies 1 159 49 208
(1) Other ‐ Subsidiaries of other non‐depository institutions; hedge funds or hedge fund subsidiaries; REITs
QUARTERLY MORTGAGE BANKERS PERFORMANCE REPORT | Q1 2018 Results from the Mortgage Bankers Association© Mortgage Bankers Association 2018. All rights reserved. 72

QUARTER 1, 2018
Quarterly Mortgage Bankers Performance ReportResidential Loan Servicing ‐ By Govt. Servicing Percent in CountP2 ‐ Servicing Income and Expense, Basis Points, Simple AverageANNUALIZED Data for Revenue and Expenses
BASIS POINTS: Your Firm
<50%
Govt #
>= 50%
Govt # Total
DIRECT REVENUEServicing Fees 32.92 25.61 30.12 26.68 First Mortgages, Seconds, Other 32.92 23.30 29.60 24.78 Subservicing Fees Earned 2.31 0.52 1.89
Late Fees and Other Ancillary Income 1.14 3.13 2.24 2.92 Total Direct Servicing Revenue 34.06 28.75 32.36 29.60
DIRECT EXPENSESPersonnel 1.89 7.21 5.18 6.73 Loan Administration Employees 1.52 6.44 4.50 5.99 Benefits 0.37 0.63 0.60 0.62 Other Personnel Expenses 0.13 0.08 0.12
Occupancy and Equipment 0.21 0.34 0.36 0.34 Other Direct Expenses 8.28 8.33 9.60 8.63 Subservicing Fees Paid 5.83 6.39 7.78 6.72 Other Miscellaneous Expenses 2.45 1.94 1.83 1.91
Total Direct Expenses 10.38 15.88 15.14 15.70
DIRECT SERVICING NET INCOME 23.68 12.87 17.22 13.90
INDIRECT EXPENSESUnreimbursed FC/REO Svg Expenses 0.09 0.30 0.14 Corporate Allocation 0.28 2.06 1.17 1.85
Total Indirect Expenses 0.28 2.15 1.47 1.99
NET INTEREST INCOMEEscrow Earnings ‐ 0.16 0.03 0.13 Corporate Interest Losses on MBS Pools (0.09) (0.20) (0.11) Other Interest Expense (1.01) (0.52) (0.29) (0.47)
Net Interest Income (1.01) (0.45) (0.46) (0.45)
NET OPERATING INCOME 22.39 10.27 15.29 11.45
MSR FINANCIAL ITEMSAmortized Cost of Servicing Rights / Loan Decay (12.06) (4.92) (3.81) (4.66) Net Gain (Loss) on Bulk Sale of Servicing 0.38 1.29 0.60 Net Gain (Loss) from MSR Valuations & Hedging 10.05 3.61 8.54
Total Financial Items (12.06) 5.52 1.08 4.47
TOTAL NET FINANCIAL INCOME 10.33 15.79 16.37 15.93
Memorandum Items:Average Servicing Portfolio ($000) 1,215,845 13,907,939 15,414,679 14,262,892 Average Servicing Portfolio (#) 6,867 83,477 80,806 82,848Average Loan Balance ($) 177,030 191,997 181,167 189,446
# Servicing FTEs (excluding 0 reporters) 3 125 99 118
Average Loans Serviced per FTE 1,716 1,023 1,393 1,118Average Loans Serviced per FTE (Weighted) 1,716 745 881 774Average Loans Serviced per FTE (Median) 1,716 661 896 711
Average Personnel Cost per FTE 56,000 64,863 62,415 64,233Average Personnel Cost per FTE (Weighted) 56,000 71,852 70,572 71,577Average Personnel Cost per FTE (Median) 56,000 64,000 58,097 62,667
Subservicing for Others (% based on $) 7.84 4.94 7.16Subservicing for Others (% based on #) 8.05 4.94 7.31Subservicing for Others ‐ Avg Balance ($) 160,761 173,286 164,519
Subservicing by Others (% based on $) 100.00 56.25 56.68 56.36Subservicing by Others (% based on #) 100.00 56.09 56.59 56.21Subservicing by Others ‐ Avg Balance ($) 177,030 209,988 189,311 205,065
Number of Companies Reporting 1 159 49 208
(1) Other ‐ Subsidiaries of other non‐depository institutions; hedge funds or hedge fund subsidiaries; REITs
QUARTERLY MORTGAGE BANKERS PERFORMANCE REPORT | Q1 2018 Results from the Mortgage Bankers Association© Mortgage Bankers Association 2018. All rights reserved. 73

QUARTER 1, 2018
Quarterly Mortgage Bankers Performance ReportResidential Loan Servicing ‐ By Govt. Servicing Percent in CountP3 ‐ Servicing Mix ($), Simple Average
% BASED ON $ Your Firm
< 50%
Govt #
>= 50%
Govt # TotalAverage Owned Servicing Portfolio ($000) 1,215,845 9,139,084 9,881,059 9,313,876 Average Owned Servicing Portfolio (#) 6,867 54,090 53,223 53,885 Average Loan Balance ($) 177,030 190,087 178,555 187,357
Servicing MixFirst Mortgages: 100.00 94.84 99.72 95.99 Government (FHA/VA/RHS) 55.43 15.04 74.53 29.12 Prime (Conforming and Jumbo) ‐ Fixed 43.46 72.40 23.54 60.83 Prime (Conforming and Jumbo) ‐ ARM 1.11 1.57 0.50 1.32 Other Fixed 4.20 1.09 3.47 Other ARM 1.62 0.06 1.25
Closed‐End Second Mortgages 0.41 0.02 0.31 Funded HELOCs 0.06 0.00 0.04 Other 4.70 0.26 3.65 Total 100.00 100.00 100.00 100.00
1st Mtg Fixed Rate vs ARMFixed Rate 98.76 96.24 94.11 95.72ARM 1.24 3.76 5.89 4.28
Total 100.00 100.00 100.00 100.00
1st Mtg Interest Only vs. Non‐Interest‐OnlyInterest Only ‐ 1.64 0.01 1.24Non‐Interest Only 100.00 98.36 99.99 98.76
Total 100.00 100.00 100.00 100.00
1st Mtg Owner Occupied vs. Non‐Owner OccupiedOwner Occupied 93.75 89.60 92.06 90.20Non‐Owner Occupied 6.25 10.40 7.94 9.80
Total 100.00 100.00 100.00 100.00
Servicing by Investor TypeServiced for Portfolio 0.87 1.34 0.99Serviced for Others: 100.00 99.13 98.66 99.01Fannie/Freddie/Ginnie 100.00 89.54 93.90 90.60Other Investors 9.59 4.76 8.42
Total 100.00 100.00 100.00 100.00
1st Mtg in Bankruptcy (%) 0.91 0.36 0.81 0.46
Seriously Delinquent Rates (90+ Days or in FC) 2.37 1.66 3.32 2.08
Agency Servicing Seriously Delinquent Rate 2.37 1.39 2.52 1.72
Number of Companies Reporting 1 159 49 208
(1) Other ‐ Subsidiaries of other non‐depository institutions; hedge funds or hedge fund subsidiaries; REITs
QUARTERLY MORTGAGE BANKERS PERFORMANCE REPORT | Q1 2018 Results from the Mortgage Bankers Association© Mortgage Bankers Association 2018. All rights reserved. 74

QUARTER 1, 2018
Quarterly Mortgage Bankers Performance ReportResidential Loan Servicing ‐ By Govt. Servicing Percent in CountP4 ‐ Servicing Mix (#), Simple Average
% BASED ON # Your Firm
<50%
Govt #
>= 50%
Govt # TotalAverage Owned Servicing Portfolio ($000) 1,215,845 9,139,084 9,881,059 9,313,876 Average Owned Servicing Portfolio (#) 6,867 54,090 53,223 53,885 Average Loan Balance ($) 177,030 190,087 178,555 187,357
Servicing MixFirst Mortgages: 100.00 93.22 99.65 94.74 Government (FHA/VA/RHS) 62.72 14.79 75.51 29.16 Prime (Conforming and Jumbo) ‐ Fixed 36.48 71.97 22.71 60.31 Prime (Conforming and Jumbo) ‐ ARM 0.80 1.26 0.38 1.05 Other Fixed 3.99 1.00 3.29 Other ARM 1.22 0.06 0.94
Closed‐End Second Mortgages 2.17 0.11 1.68 Funded HELOCs 0.15 0.00 0.11 Other 4.46 0.24 3.46 Total 100.00 100.00 100.00 100.00
1st Mtg Fixed Rate vs ARMFixed Rate 99.16 96.98 94.74 96.44ARM 0.84 3.02 5.26 3.56
Total 100.00 100.00 100.00 100.00
1st Mtg Interest Only vs. Non‐Interest‐OnlyInterest Only ‐ 1.49 0.01 1.12Non‐Interest Only 100.00 98.51 99.99 98.88
Total 100.00 100.00 100.00 100.00
1st Mtg Owner Occupied vs. Non‐Owner OccupiedOwner Occupied 94.61 87.93 91.42 88.79Non‐Owner Occupied 5.39 12.07 8.58 11.21
Total 100.00 100.00 100.00 100.00
Servicing by Investor TypeServiced for Portfolio 0.79 1.05 0.85Serviced for Others: 100.00 99.21 98.95 99.15Fannie/Freddie/Ginnie 100.00 90.15 94.24 91.14Other Investors 9.05 4.72 8.00
Total 100.00 100.00 100.00 100.00
1st Mtg in Bankruptcy (%) 0.91 0.36 0.81 0.46
Seriously Delinquent Rates (90+ Days or in FC) 2.58 1.59 3.12 1.98
Agency Servicing Seriously Delinquent Rate 2.58 1.44 2.40 1.72
Number of Companies Reporting 1 159 49 208
(1) Other ‐ Subsidiaries of other non‐depository institutions; hedge funds or hedge fund subsidiaries; REITs
QUARTERLY MORTGAGE BANKERS PERFORMANCE REPORT | Q1 2018 Results from the Mortgage Bankers Association© Mortgage Bankers Association 2018. All rights reserved. 75

QUARTER 1, 2018
Quarterly Mortgage Bankers Performance ReportResidential Loan Servicing ‐ By Govt. Servicing Percent in CountP5 ‐ Servicing Mix (Avg Loan Balances), Simple Average
LOAN BALANCES Your Firm
<50%
Govt #
>= 50%
Govt # TotalAverage Owned Servicing Portfolio ($000) 1,215,845 9,139,084 9,881,059 9,313,876 Average Owned Servicing Portfolio (#) 6,867 54,090 53,223 53,885 Average Loan Balance ($) 177,030 190,087 178,555 187,357
Servicing MixFirst Mortgages: 177,030 194,402 178,704 190,594 Government (FHA/VA/RHS) ‐ Fixed 156,139 187,728 174,656 183,731 Government (FHA/VA/RHS) ‐ ARM 449,999 188,867 211,863 199,598 Prime (Conforming and Jumbo) ‐ Fixed 211,005 194,387 185,891 192,525 Prime (Conforming and Jumbo) ‐ ARM 251,629 254,299 248,278 252,865 Other Fixed 209,028 158,161 200,780 Other ARM 264,351 171,269 254,008
Closed‐End Second Mortgages 37,719 42,374 38,650 Funded HELOCs 80,822 92,500 81,795 Other 163,645 173,364 164,617
1st Mtg Fixed Rate vs ARMFixed Rate 176,318 192,082 176,788 188,372 ARM 262,069 248,156 228,054 243,130
1st Mtg Interest Only vs. Non‐Interest‐OnlyInterest Only 402,136 315,405 386,831 Non‐Interest Only 177,030 194,038 178,702 190,243
1st Mtg Owner Occupied vs. Non‐Owner OccupiedOwner Occupied 175,460 198,247 180,838 194,048 Non‐Owner Occupied 204,511 171,659 157,908 168,202
Servicing by Investor TypeServiced for Portfolio 193,065 193,503 193,185 Serviced for Others: 177,030 193,775 178,337 190,030 Fannie/Freddie/Ginnie 177,030 192,382 178,119 188,888 Other Investors 213,572 162,336 200,763
Seriously Delinquent Rates (90+ Days or in FC) 162,757 177,212 177,149 177,196
Agency Servicing Seriously Delinquent 162,757 182,096 190,501 184,520
Number of Companies Reporting 1 159 49 208
(1) Other ‐ Subsidiaries of other non‐depository institutions; hedge funds or hedge fund subsidiaries; REITs
QUARTERLY MORTGAGE BANKERS PERFORMANCE REPORT | Q1 2018 Results from the Mortgage Bankers Association© Mortgage Bankers Association 2018. All rights reserved. 76

QUARTER 1, 2018
Quarterly Mortgage Bankers Performance ReportBalance Sheet, Performance Ratios and Net Income Summary ‐ HistoricalQ1 ‐ Balance Sheet, Simple Averages
Your Firm All Firms Previous Qtr. Previous Yr. Repeater Repeater YTDIN THOUSANDS ($000s) Q1 2018 Q1 2018 Q4 2017 Q1 2017 Q1 2018 Q4 2017 2018
TOTAL ASSETSCurrent AssetsCash and Cash Equivalents, Unrestricted 1,293 9,383 9,193 10,755 9,044 9,559 9,383 Cash and Cash Equivalents, Restricted 854 1,762 1,437 1,778 1,607 1,478 1,762 Marketable Securities, Held to Maturity ‐ 1,190 1 3,968 8 1 1,190 Marketable Securities, Avail. for Sale ‐ 241 150 196 182 152 241 Trading Account Securities ‐ 90 53 76 101 57 90 Reverse Repurchase Agreements 4 14 9 5 15 4 Receivables ‐ Unrelated Parties 1,400 3,453 3,567 2,979 3,712 3,733 3,453 Mortgage Loans HFS 91,657 91,032 104,787 101,854 91,910 107,523 91,032
Total Current Assets 95,204 107,155 119,201 121,615 106,569 122,517 107,155
Noncurrent AssetsMortgage Loans HFI ‐ 2,896 1,796 5,580 1,951 1,852 2,896 Receivables ‐ Related Parties 165 3,388 3,439 1,382 3,748 3,690 3,388 Net Mortgage Servicing Rights 7,555 15,940 14,599 21,722 14,706 15,042 15,940 Real Estate Owned ‐ 224 126 257 134 133 224 Reserve for Other Losses (Contra) (276) (358) (457) (310) (381) (276) Goodwill and Other Intangible Assets 616 544 1,018 487 498 616 Investments in Joint Ventures, Partnerships, Non Mtg, Other 1,647 725 1,078 716 746 1,647 Deferred Tax Assets 152 196 107 179 208 152 P&I, T&I, FC and Other Advances 1,424 1,325 3,747 1,404 1,425 1,424 Foreclosure Claims Receivable 283 221 243 225 239 283 Property, Equipment, Leasehold 551 1,884 1,813 2,401 1,870 1,842 1,884 Other Assets 1,702 9,351 5,382 9,117 5,915 5,439 9,351
Total Noncurrent Assets 9,973 37,528 29,806 46,193 31,025 30,731 37,528
TOTAL ASSETS 105,177 144,683 149,007 167,808 137,594 153,248 144,683
LIABILITIESLines of Credit 83,219 86,696 96,337 98,522 84,904 98,818 86,696 Repurchase Reserves 1,766 1,069 1,061 1,309 1,086 1,112 1,069 Accrued Expenses 3,185 4,570 4,960 6,628 4,454 5,119 4,570 Other Short‐Term Debt 215 8,824 8,033 9,017 7,305 8,433 8,824 Long‐Term Debt 213 5,783 4,089 10,100 4,003 4,049 5,783 Other Liabilities ‐ 2,230 2,105 2,774 2,264 2,091 2,230
TOTAL LIABILITIES 88,598 109,171 116,586 128,351 104,017 119,622 109,171
EQUITYCommon & Preferred Stock 31 487 667 605 512 645 487 Paid‐In Capital 11 7,042 6,682 9,982 7,287 6,934 7,042 Retained Earnings 16,537 19,052 15,659 17,782 16,102 16,171 19,052 Treasury Stock (115) (120) (144) (93) (95) (115) Gnrl, Ltd Partners', & Members' Capital 9,044 9,533 11,232 9,768 9,972 9,044
TOTAL EQUITY (GAAP Net Worth) 16,579 35,511 32,420 39,457 33,576 33,626 35,511
TOTAL LIABILITIES & EQUITY 105,177 144,683 149,007 167,808 137,594 153,248 144,683
MEMORANDUM ITEMSAdjusted Tangible Net Worth 16,415 31,362 28,286 36,116 29,178 29,284 31,362 (Equity less goodwill and other intangibles, less
affiliated receivables, less total restricted retained
earnings, less pledged assets net of associated
liabilities)
Number of Companies Reporting 1 346 332 333 308 308 346
QUARTERLY MORTGAGE BANKERS PERFORMANCE REPORT | Q1 2018 Results from the Mortgage Bankers Association© Mortgage Bankers Association 2018. All rights reserved. 77

QUARTER 1, 2018
Quarterly Mortgage Bankers Performance ReportBalance Sheet, Performance Ratios and Net Income Summary ‐ HistoricalQ2 ‐ Performance Ratios, Simple Average
Your Firm All Firms Previous Qtr. Previous Yr. Repeater Repeater YTDPERCENTAGES (%) Q1 2018 Q1 2018 Q4 2017 Q1 2017 Q1 2018 Q4 2017 2018
PROFITABILITY(annualized where appropriate) (1)Pre‐Tax Net Income/Equity (%) 0.11 0.61 (2.00) 6.47 0.41 0.66 0.61Pre‐Tax Net Income/Assets (%) 0.13 0.63 0.27 1.90 0.78 0.61 0.63Pre‐Tax Net Income/Tangible Net Worth 0.03 0.00 (0.01) 0.02 0.00 0.00 0.00Net Interest Margin (Net interest Income/Assets) (%) 0.07 0.20 0.24 0.29 0.17 0.24 0.20Noninterest Income/Assets (%) 41.82 50.06 50.19 50.66 50.98 50.78 50.06Noninterest Expense/Assets (%) 42.64 49.63 50.16 49.05 50.38 50.41 49.63% Institutions with Pre‐tax Net Income>0 0.00 60.12 56.33 66.97 59.74 58.44 60.12
LEVERAGE/LIQUIDITYTotal Liabilities/Equity 5.33 3.61 4.13 3.33 3.62 4.07 3.61Total Liabilities/Equity (Weighted) 5.33 3.07 3.60 3.25 3.10 3.56 3.07Current Assets/Current Liabilities 1.07 2.12 1.83 2.10 1.80 1.72 2.12Current Assets/Current Liabilities (Weighted) 1.07 1.06 1.08 1.05 1.09 1.08 1.06Total Equity/Total Asset 0.15 0.32 0.29 0.31 0.32 0.29 0.32Total Equity/Total Asset (Weighted) 0.15 0.25 0.22 0.24 0.24 0.22 0.25Tangible Net Worth/Total Assets (%) 15.60 30.26 27.51 29.37 29.77 27.30 30.26Liquidity/Tangible Net Worth (%) 7.87 44.98 49.48 43.84 45.14 49.55 44.98Cash and Equivalents/Current AssetsUnrestricted Cash and Equivalents/Current Assets 0.02 0.18 0.16 0.17 0.18 0.16 0.18Restricted Cash and Equivalents/Current Assets 0.02 0.02 0.02 0.02 0.02 0.02 0.02
Total Cash and Equivalents/Current Assets 0.03 0.20 0.18 0.19 0.20 0.18 0.20Marketable Securities/Current Assets 0.00 0.01 0.00 0.01 0.01 0.00 0.01Receivables/Current Assets 0.02 0.03 0.02 0.03 0.03 0.03 0.03LHFS/Current Assets 0.95 0.76 0.79 0.77 0.76 0.79 0.76Current Assets/Assets 0.92 0.78 0.81 0.78 0.78 0.81 0.78Noncurrent Assets/Assets 0.10 0.22 0.19 0.22 0.22 0.19 0.22Net Working Capital/Assets 0.07 0.14 0.13 0.13 0.14 0.13 0.14
OTHER# Company Employees 333 389 378 411 389 390 389
Number of Companies Reporting 1 346 332 333 308 308 346
(1) Includes all business channels: 1‐4 unit residential originations and servicing, portfolio management, and any commercial/construction lending if applicable
QUARTERLY MORTGAGE BANKERS PERFORMANCE REPORT | Q1 2018 Results from the Mortgage Bankers Association© Mortgage Bankers Association 2018. All rights reserved. 78

QUARTER 1, 2018
Quarterly Mortgage Bankers Performance ReportBalance Sheet, Performance Ratios and Net Income Summary ‐ Historical (1)Q3 ‐ Net Income Summary, Simple Averages
Your Firm All Firms Previous Qtr. Previous Yr. Repeater Repeater YTDIN THOUSANDS ($000s) Q1 2018 Q1 2018 Q4 2017 Q1 2017 Q1 2018 Q4 2017 2018
NET INTEREST INCOMEInterest IncomeWarehousing Interest Income 808 768 917 856 795 938 768 Servicing‐Related/Escrow Earnings ‐ 4 3 13 4 3 4 Interest Income ‐ Loans Held for Investment and Securities ‐ 49 14 79 14 14 49 Other Interest Income and Adjustments 1 45 24 35 27 26 45
Total Interest Income 809 866 958 984 840 981 866 Interest ExpenseWarehousing Interest Expense 770 696 821 716 713 840 696 Servicing‐Related Interest Expense ‐ 23 14 62 14 13 23 Other Interest Expense and Adjustments 36 116 99 184 93 104 116
Total Interest Expense 806 836 935 962 820 958 836 Net Interest Income 3 30 23 22 20 23 30
NON‐INTEREST INCOMEOrigination Fees and Ancillary Revenue 2,007 2,235 2,677 2,458 2,304 2,717 2,235 Net Secondary Marketing Gain on Sale 8,108 9,746 11,025 11,825 9,908 11,431 9,746 Direct Servicing Revenue 1,035 1,552 1,499 2,165 1,586 1,579 1,552 MSR Amortization, Valuation Changes net of Hedging +/ (‐) (366) 355 (332) (595) 187 (368) 355 Other Non‐Interest Income 216 214 295 129 263 280 214
Non‐Interest Income 10,998 14,104 15,164 15,983 14,248 15,640 14,104
Total Gross Income 10,962 14,134 15,187 16,004 14,268 15,663 14,134
NON‐CORPORATE PERSONNEL EXPENSEOriginations Employees 4,793 6,938 7,871 7,709 7,027 8,090 6,938 Servicing Employees 45 287 269 364 291 289 287 Other Non‐Corporate Personnel ‐ 180 162 148 191 171 180 Benefits and Other Personnel Expense 112 1,264 1,012 1,406 1,230 1,059 1,264
Non‐Corporate Personnel Expense 5,850 8,670 9,315 9,628 8,738 9,609 8,670
OTHER EXPENSEOccupancy, Equipment, Technology 980 1,121 1,178 1,220 1,126 1,216 1,121 Unallocated Corporate/Overhead Expense 651 828 941 1,138 877 956 828 Other Non‐Interest Expense 3,420 2,622 3,365 3,132 2,726 3,415 2,622
Total Other Expense 5,050 4,571 5,484 5,491 4,730 5,587 4,571
Total Gross Non‐Interest Expenses 10,900 13,241 14,799 15,118 13,468 15,196 13,241
PRE‐TAX NET INCOME (Before Adjustments) 62 893 389 886 800 467 893
ADJUSTMENTSIncome Tax Benefit (Cost) 12 (81) 143 (73) (49) 151 (81) Non‐Recurring Items Gain (Loss) ‐ (2) (4) ‐ (1) ‐ Minority Interest Income (Loss) (8) (15) (2) (9) (16) (8)
Total Adjustments 12 (89) 127 (80) (58) 134 (89)
Net Income After Adjustments 50 804 516 807 742 601 804
Number of Companies Reporting 1 346 332 333 308 308 346
(1) Includes all business channels: 1‐4 unit residential originations and servicing, portfolio management, and any commercial/construction lending if applicable
QUARTERLY MORTGAGE BANKERS PERFORMANCE REPORT | Q1 2018 Results from the Mortgage Bankers Association© Mortgage Bankers Association 2018. All rights reserved. 79

QUARTER 1, 2018
Quarterly Mortgage Bankers Performance ReportBalance Sheet, Performance Ratios and Net Income Summary ‐ by Asset SizeR1 ‐ Balance Sheet, Simple Averages
IN THOUSANDS ($000s) Your Firm <25M 25‐50M 50‐100M >100M Total
TOTAL ASSETSCurrent AssetsCash and Cash Equivalents, Unrestricted 1,293 2,919 4,514 6,446 20,660 9,383 Cash and Cash Equivalents, Restricted 854 208 718 617 4,661 1,762 Marketable Securities, Held to Maturity ‐ 1 ‐ 1 3,883 1,190 Marketable Securities, Avail. for Sale ‐ 28 129 39 646 241 Trading Account Securities ‐ 32 6 ‐ 261 90 Reverse Repurchase Agreements 1 ‐ ‐ 13 4 Receivables ‐ Unrelated Parties 1,400 324 739 1,221 9,675 3,453 Mortgage Loans HFS 91,657 7,421 23,358 49,071 242,737 91,032
Total Current Assets 95,204 10,934 29,464 57,395 282,536 107,155
Noncurrent AssetsMortgage Loans HFI ‐ 243 365 1,872 7,788 2,896 Receivables ‐ Related Parties 165 202 538 604 10,111 3,388 Net Mortgage Servicing Rights 7,555 1,417 2,286 5,980 45,324 15,940 Real Estate Owned ‐ 45 38 213 528 224 Reserve for Other Losses (Contra) (16) (50) (143) (761) (276) Goodwill and Other Intangible Assets 54 149 324 1,649 616 Investments in Joint Ventures, Partnerships, Non Mtg, Other 282 681 766 4,149 1,647 Deferred Tax Assets 12 159 39 347 152 P&I, T&I, FC and Other Advances 188 123 322 4,184 1,424 Foreclosure Claims Receivable 18 33 29 868 283 Property, Equipment, Leasehold 551 347 916 1,229 4,405 1,884 Other Assets 1,702 550 1,425 3,973 26,494 9,351
Total Noncurrent Assets 9,973 3,340 6,662 15,206 105,083 37,528
TOTAL ASSETS 105,177 14,274 36,126 72,601 387,619 144,683
LIABILITIESLines of Credit 83,219 6,879 20,216 45,548 233,535 86,696 Repurchase Reserves 1,766 114 332 564 2,794 1,069 Accrued Expenses 3,185 428 1,254 1,950 12,401 4,570 Other Short‐Term Debt 215 585 2,618 1,707 25,330 8,824 Long‐Term Debt 213 444 800 1,525 16,937 5,783 Other Liabilities ‐ 190 168 788 6,485 2,230
TOTAL LIABILITIES 88,598 8,639 25,387 52,083 297,482 109,171
EQUITYCommon & Preferred Stock 31 376 237 274 902 487 Paid‐In Capital 11 1,379 1,789 4,705 17,473 7,042 Retained Earnings 16,537 3,064 6,171 11,900 47,469 19,052 Treasury Stock (179) (52) (42) (147) (115) Gnrl, Ltd Partners', & Members' Capital 995 2,594 3,681 24,440 9,044
TOTAL EQUITY (GAAP Net Worth) 16,579 5,635 10,739 20,518 90,137 35,511
TOTAL LIABILITIES & EQUITY 105,177 14,274 36,126 72,601 387,619 144,683
MEMORANDUM ITEMSAdjusted Tangible Net Worth 16,415 5,368 9,975 19,499 78,025 31,362 (Equity less goodwill and other intangibles, less
affiliated receivables, less total restricted retained
earnings, less pledged assets net of associated
liabilities)
Number of Companies Reporting 1 98 75 67 106 346
QUARTERLY MORTGAGE BANKERS PERFORMANCE REPORT | Q1 2018 Results from the Mortgage Bankers Association© Mortgage Bankers Association 2018. All rights reserved. 80

QUARTER 1, 2018
Quarterly Mortgage Bankers Performance ReportBalance Sheet, Performance Ratios and Net Income Summary ‐ by Asset SizeR2 ‐ Performance Ratios, Simple Average
PERCENTAGES (%) Your Firm <25M 25‐50M 50‐100M >100M Total
PROFITABILITY(annualized where appropriate) (1)Pre‐Tax Net Income/Equity (%) 0.11 (8.96) (5.94) 4.95 11.36 0.61Pre‐Tax Net Income/Assets (%) 0.13 (2.81) 0.50 1.35 3.43 0.63Pre‐Tax Net Income/Tangible Net Worth 0.03 (0.02) (0.02) 0.01 0.03 0.00Net Interest Margin (Net interest Income/Assets) (%) 0.07 0.18 0.13 0.48 0.08 0.20Noninterest Income/Assets (%) 41.82 53.40 54.57 52.02 42.54 50.06Noninterest Expense/Assets (%) 42.64 56.39 54.19 51.15 39.19 49.63% Institutions with Pre‐tax Net Income>0 0.00 41.84 61.33 64.18 73.58 60.12
LEVERAGE/LIQUIDITYTotal Liabilities/Equity 5.33 2.02 3.53 4.18 4.76 3.61Total Liabilities/Equity (Weighted) 5.33 1.53 2.36 2.54 3.30 3.07Current Assets/Current Liabilities 1.07 3.51 1.69 1.50 1.52 2.12Current Assets/Current Liabilities (Weighted) 1.07 1.37 1.21 1.15 1.03 1.06Total Equity/Total Asset 0.15 0.45 0.30 0.28 0.24 0.32Total Equity/Total Asset (Weighted) 0.15 0.39 0.30 0.28 0.23 0.25Tangible Net Worth/Total Assets (%) 15.60 42.83 28.06 26.95 22.30 30.26Liquidity/Tangible Net Worth (%) 7.87 57.96 47.84 39.04 34.86 44.98Cash and Equivalents/Current AssetsUnrestricted Cash and Equivalents/Current Assets 0.02 0.33 0.16 0.13 0.09 0.18Restricted Cash and Equivalents/Current Assets 0.02 0.03 0.03 0.01 0.02 0.02
Total Cash and Equivalents/Current Assets 0.03 0.36 0.19 0.14 0.11 0.20Marketable Securities/Current Assets 0.00 0.01 0.00 0.00 0.02 0.01Receivables/Current Assets 0.02 0.03 0.03 0.03 0.03 0.03LHFS/Current Assets 0.95 0.59 0.78 0.83 0.84 0.76Current Assets/Assets 0.92 0.77 0.81 0.78 0.77 0.78Noncurrent Assets/Assets 0.10 0.23 0.19 0.22 0.23 0.22Net Working Capital/Assets 0.07 0.26 0.14 0.10 0.06 0.14
OTHER# Company Employees 333 88 151 350 861 389
Number of Companies Reporting 1 98 75 67 106 346
(1) Includes all business channels: 1‐4 unit residential originations and servicing, portfolio management, and any commercial/constructionlending if applicable
QUARTERLY MORTGAGE BANKERS PERFORMANCE REPORT | Q1 2018 Results from the Mortgage Bankers Association© Mortgage Bankers Association 2018. All rights reserved. 81

QUARTER 1, 2018
Quarterly Mortgage Bankers Performance ReportBalance Sheet, Performance Ratios and Net Income Summary ‐ by Asset Size (1)R3 ‐ Net Income Summary, Simple Averages
IN THOUSANDS ($000s) Your Firm <25M 25‐50M 50‐100M >100M Total
NET INTEREST INCOMEInterest IncomeWarehousing Interest Income 808 66 213 453 2,007 768 Servicing‐Related/Escrow Earnings ‐ 1 1 (0) 11 4 Interest Income ‐ Loans Held for Investment and Securities ‐ 2 3 9 151 49 Other Interest Income and Adjustments 1 3 11 30 119 45
Total Interest Income 809 72 228 492 2,288 866 Interest ExpenseWarehousing Interest Expense 770 63 202 367 1,839 696 Servicing‐Related Interest Expense ‐ 0 0 3 74 23 Other Interest Expense and Adjustments 36 4 14 26 349 116
Total Interest Expense 806 68 216 396 2,262 836 Net Interest Income 3 4 12 96 26 30
NON‐INTEREST INCOMEOrigination Fees and Ancillary Revenue 2,007 462 1,241 1,894 4,794 2,235 Net Secondary Marketing Gain on Sale 8,108 1,369 3,292 6,247 24,270 9,746 Direct Servicing Revenue 1,035 161 249 896 4,177 1,552 MSR Amortization, Valuation Changes net of Hedging +/ (‐) (366) (7) 22 76 1,104 355 Other Non‐Interest Income 216 41 116 149 485 214
Non‐Interest Income 10,998 2,025 4,919 9,262 34,829 14,104
Total Gross Income 10,962 2,029 4,931 9,358 34,854 14,134
NON‐CORPORATE PERSONNEL EXPENSEOriginations Employees 4,793 1,055 2,687 4,856 16,702 6,938 Servicing Employees 45 34 41 276 702 287 Other Non‐Corporate Personnel ‐ 9 76 102 462 180 Benefits and Other Personnel Expense 112 184 428 869 3,104 1,264
Non‐Corporate Personnel Expense 5,850 1,282 3,232 6,104 20,970 8,670
OTHER EXPENSEOccupancy, Equipment, Technology 980 183 440 792 2,677 1,121 Unallocated Corporate/Overhead Expense 651 125 255 516 2,082 828 Other Non‐Interest Expense 3,420 506 989 1,699 6,316 2,622
Total Other Expense 5,050 814 1,683 3,008 11,075 4,571
Total Gross Non‐Interest Expenses 10,900 2,095 4,916 9,112 32,045 13,241
PRE‐TAX NET INCOME (Before Adjustments) 62 (66) 16 246 2,809 893
ADJUSTMENTSIncome Tax Benefit (Cost) 12 9 43 11 (309) (81) Non‐Recurring Items Gain (Loss) ‐ ‐ ‐ ‐ ‐ Minority Interest Income (Loss) (2) ‐ ‐ (24) (8)
Total Adjustments 12 7 43 11 (333) (89)
Net Income After Adjustments 50 (59) 59 257 2,476 804
Number of Companies Reporting 1 98 75 67 106 346
(1) Includes all business channels: 1‐4 unit residential originations and servicing, portfolio management, and any commercial/constructionlending if applicable
QUARTERLY MORTGAGE BANKERS PERFORMANCE REPORT | Q1 2018 Results from the Mortgage Bankers Association© Mortgage Bankers Association 2018. All rights reserved. 82

QUARTER 1, 2018
Quarterly Mortgage Bankers Performance ReportBalance Sheet, Performance Ratios and Net Income Summary ‐ by Company TypeS1 ‐ Balance Sheet, Simple Averages
IN THOUSANDS ($000s) Your Firm
Bank/Thrift
Subs
Independent
Mtg Cos. Other (1) Total
TOTAL ASSETSCurrent AssetsCash and Cash Equivalents, Unrestricted 1,293 9,140 8,052 18,913 9,383 Cash and Cash Equivalents, Restricted 854 442 1,825 2,469 1,762 Marketable Securities, Held to Maturity ‐ ‐ 9 10,495 1,190 Marketable Securities, Avail. for Sale ‐ ‐ 252 376 241 Trading Account Securities ‐ ‐ 114 ‐ 90 Reverse Repurchase Agreements 42 ‐ ‐ 4 Receivables ‐ Unrelated Parties 1,400 1,156 2,514 12,029 3,453 Mortgage Loans HFS 91,657 78,428 88,493 119,791 91,032
Total Current Assets 95,204 89,208 101,259 164,073 107,155
Noncurrent AssetsMortgage Loans HFI ‐ 4,862 1,271 12,561 2,896 Receivables ‐ Related Parties 165 545 710 24,614 3,388 Net Mortgage Servicing Rights 7,555 6,704 15,774 25,154 15,940 Real Estate Owned ‐ 233 171 586 224 Reserve for Other Losses (Contra) (142) (331) (7) (276) Goodwill and Other Intangible Assets 1,494 509 594 616 Investments in Joint Ventures, Partnerships, Non Mtg, Other 99 658 9,921 1,647 Deferred Tax Assets (46) 150 335 152 P&I, T&I, FC and Other Advances 115 1,245 3,817 1,424 Foreclosure Claims Receivable 0 350 68 283 Property, Equipment, Leasehold 551 1,195 1,931 2,162 1,884 Other Assets 1,702 4,583 7,630 25,550 9,351
Total Noncurrent Assets 9,973 19,640 30,066 105,352 37,528
TOTAL ASSETS 105,177 108,848 131,325 269,425 144,683
LIABILITIESLines of Credit 83,219 66,462 83,530 126,498 86,696 Repurchase Reserves 1,766 1,110 916 2,105 1,069 Accrued Expenses 3,185 1,855 4,684 6,137 4,570 Other Short‐Term Debt 215 10,174 6,341 25,028 8,824 Long‐Term Debt 213 1,240 5,405 12,388 5,783 Other Liabilities ‐ 1,152 1,689 6,953 2,230
TOTAL LIABILITIES 88,598 81,993 102,565 179,109 109,171
EQUITYCommon & Preferred Stock 31 98 594 80 487 Paid‐In Capital 11 9,360 3,971 26,524 7,042 Retained Earnings 16,537 14,686 17,135 36,278 19,052 Treasury Stock ‐ (143) (19) (115) Gnrl, Ltd Partners', & Members' Capital 2,710 7,204 27,452 9,044
TOTAL EQUITY (GAAP Net Worth) 16,579 26,854 28,760 90,316 35,511
TOTAL LIABILITIES & EQUITY 105,177 108,848 131,325 269,425 144,683
MEMORANDUM ITEMSAdjusted Tangible Net Worth 16,415 24,812 27,393 64,857 31,362 (Equity less goodwill and other intangibles, less
affiliated receivables, less total restricted retained
earnings, less pledged assets net of associated
liabilities)
Number of Companies Reporting 1 34 273 39 346
(1) Other: Subsidiaries of other non‐depository institutions; hedge funds or hedge fund subsidiaries; REITs
QUARTERLY MORTGAGE BANKERS PERFORMANCE REPORT | Q1 2018 Results from the Mortgage Bankers Association© Mortgage Bankers Association 2018. All rights reserved. 83

QUARTER 1, 2018
Quarterly Mortgage Bankers Performance ReportBalance Sheet, Performance Ratios and Net Income Summary ‐ by Company TypeS2 ‐ Performance Ratios, Simple Average
PERCENTAGES (%) Your Firm
Bank/Thrift
Subs
Independent
Mtg Cos. Other (2) Total
PROFITABILITY(annualized where appropriate) (1)Pre‐Tax Net Income/Equity (%) 0.11 (5.44) (1.64) 21.63 0.61Pre‐Tax Net Income/Assets (%) 0.13 (2.63) 0.47 4.58 0.63Pre‐Tax Net Income/Tangible Net Worth 0.03 (0.03) (0.01) 0.08 0.00Net Interest Margin (Net interest Income/Assets) (%) 0.07 0.62 0.13 0.30 0.20Noninterest Income/Assets (%) 41.82 39.56 52.32 43.41 50.06Noninterest Expense/Assets (%) 42.64 42.80 51.98 39.13 49.63% Institutions with Pre‐tax Net Income>0 0.00 55.88 59.71 66.67 60.12
LEVERAGE/LIQUIDITYTotal Liabilities/Equity 5.33 2.90 3.81 2.82 3.61Total Liabilities/Equity (Weighted) 5.33 3.05 3.57 1.98 3.07Current Assets/Current Liabilities 1.07 5.78 1.71 1.73 2.12Current Assets/Current Liabilities (Weighted) 1.07 1.12 1.06 1.03 1.06Total Equity/Total Asset 0.15 0.52 0.29 0.37 0.32Total Equity/Total Asset (Weighted) 0.15 0.25 0.22 0.34 0.25Tangible Net Worth/Total Assets (%) 15.60 48.77 27.69 32.16 30.26Liquidity/Tangible Net Worth (%) 7.87 49.41 45.31 38.85 44.98Cash and Equivalents/Current AssetsUnrestricted Cash and Equivalents/Current Assets 0.02 0.35 0.16 0.18 0.18Restricted Cash and Equivalents/Current Assets 0.02 0.01 0.02 0.04 0.02
Total Cash and Equivalents/Current Assets 0.03 0.36 0.18 0.22 0.20Marketable Securities/Current Assets 0.00 0.00 0.01 0.03 0.01Receivables/Current Assets 0.02 0.02 0.03 0.06 0.03LHFS/Current Assets 0.95 0.61 0.78 0.70 0.76Current Assets/Assets 0.92 0.76 0.79 0.73 0.78Noncurrent Assets/Assets 0.10 0.24 0.21 0.27 0.22Net Working Capital/Assets 0.07 0.31 0.12 0.14 0.14
OTHER# Company Employees 333 242 407 391 389
Number of Companies Reporting 1 34 273 39 346
(1) Includes all business channels ‐ 1‐4 unit residential originations and servicing, portfolio management, and any commercial/construction lending if applicable(2) Other: Subsidiaries of other non‐depository institutions; hedge funds or hedge fund subsidiaries; REITs
QUARTERLY MORTGAGE BANKERS PERFORMANCE REPORT | Q1 2018 Results from the Mortgage Bankers Association© Mortgage Bankers Association 2018. All rights reserved. 84

QUARTER 1, 2018
Quarterly Mortgage Bankers Performance ReportBalance Sheet, Performance Ratios and Net Income Summary ‐ by Company Type (2)S3 ‐ Net Income Summary, Simple Averages
IN THOUSANDS ($000s) Your Firm
Bank/Thrift
Subs
Independent
Mtg Cos. Other (1) Total
NET INTEREST INCOMEInterest IncomeWarehousing Interest Income 808 737 733 1,040 768 Servicing‐Related/Escrow Earnings ‐ 1 5 0 4 Interest Income ‐ Loans Held for Investment and Securities ‐ 40 9 337 49 Other Interest Income and Adjustments 1 26 44 74 45
Total Interest Income 809 804 790 1,451 866 Interest ExpenseWarehousing Interest Expense 770 658 686 801 696 Servicing‐Related Interest Expense ‐ 2 23 44 23 Other Interest Expense and Adjustments 36 16 95 354 116
Total Interest Expense 806 675 804 1,199 836 Net Interest Income 3 129 (14) 252 30
NON‐INTEREST INCOMEOrigination Fees and Ancillary Revenue 2,007 1,242 2,334 2,407 2,235 Net Secondary Marketing Gain on Sale 8,108 6,703 9,781 12,156 9,746 Direct Servicing Revenue 1,035 776 1,407 3,251 1,552 MSR Amortization, Valuation Changes net of Hedging +/ (‐) (366) (68) 433 183 355 Other Non‐Interest Income 216 128 200 390 214
Non‐Interest Income 10,998 8,781 14,154 18,387 14,104
Total Gross Income 10,962 8,910 14,141 18,639 14,134
NON‐CORPORATE PERSONNEL EXPENSEOriginations Employees 4,793 4,798 7,206 6,931 6,938 Servicing Employees 45 129 262 603 287 Other Non‐Corporate Personnel ‐ 34 197 190 180 Benefits and Other Personnel Expense 112 1,070 1,225 1,711 1,264
Non‐Corporate Personnel Expense 5,850 6,031 8,889 9,435 8,670
OTHER EXPENSEOccupancy, Equipment, Technology 980 808 1,158 1,134 1,121 Unallocated Corporate/Overhead Expense 651 534 796 1,310 828 Other Non‐Interest Expense 3,420 1,616 2,572 3,844 2,622
Total Other Expense 5,050 2,959 4,526 6,288 4,571
Total Gross Non‐Interest Expenses 10,900 8,989 13,416 15,723 13,241
PRE‐TAX NET INCOME (Before Adjustments) 62 (80) 725 2,916 893
ADJUSTMENTSIncome Tax Benefit (Cost) 12 30 (29) (542) (81) Non‐Recurring Items Gain (Loss) ‐ ‐ ‐ ‐ Minority Interest Income (Loss) (7) (9) (0) (8)
Total Adjustments 12 23 (38) (542) (89)
Net Income After Adjustments 50 (57) 687 2,374 804
Number of Companies Reporting 1 34 273 39 346
(1) Other ‐ Subsidiaries of other non‐depository institutions; hedge funds or hedge fund subsidiaries; REITs(2) Includes all business channels ‐ 1‐4 unit residential originations and servicing, portfolio management, and any commercial/construction lending if applicable
QUARTERLY MORTGAGE BANKERS PERFORMANCE REPORT | Q1 2018 Results from the Mortgage Bankers Association© Mortgage Bankers Association 2018. All rights reserved. 85

MBA's Quarterly Capital and Liquidity Profile
Q1 2018 Q1 2018 Q4 2017 Q1 2018 Q4 2017 Q1 2018 Q4 2017
1Q 2018: MBFRF SERVICING SAMPLE Your Firm Median Median Median Median Median Median
PROFILE
Average Owned Servicing Portfolio (#) 6,867 4,620 5,524 3,782 4,098 10,391 10,167
% Government Owned Servicing (#) 62.73 19.45 19.56 6.71 2.52 70.71 70.99
LIQUIDITY AND CAPITAL ADEQUACY METRICS
Unrestricted Cash and Cash
Equivalents/Monthly Recurring Operating
Expenses (Ratio, representing number of
months) (1) 0.45 2.26 2.86 2.52 3.02 1.51 2.03
Unrestricted Cash and Cash Equivalents +
Unused Portion of Servicing Advance
Lines/Monthly Recurring Operating
Expenses (Ratio, representing number of
months) (2) 0.45 2.62 3.03 2.94 3.29 1.87 2.44
Tangible Net Worth/Total Assets (%) (3) 15.60 23.25 21.85 24.16 24.70 19.69 19.46
Liquidity/Tangible Net Worth (%) (4) 7.87 27.32 30.59 30.57 35.97 23.07 22.85
Agency Servicing Seriously Delinquent Rate
(% based on #) (5) 2.58 1.09 1.03 0.79 0.78 2.13 2.22
FHFA Liquidity Metric/Agency Servicing
UPB (bps) (6) 10.63 63.74 61.93 88.84 79.54 35.15 37.68
Number of Companies Reporting 1 208 192 159 147 49 45
(4) Measures the solvency of a company. This ratio indicates the extent to which funds are available for the company's operations (i.e., for working capital) vs. frozen in the form of fixed assets.
(5) The number of residential (1‐4 unit) loans serviced for agencies (Fannie Mae, Freddie Mac, Ginnie Mae) that are 90 or more days delinquent or in the process of foreclosure, divided by the total agency loans
serviced.
(6) Allowable liquid assets per Fannie Mae divided by the agency servicing UPB. A minimum liquidity requirement of 3.5 bps for all IMB servicers, plus 200 bps if NPL agency servicing UPB > 6% of total agency
servicing UPB.
Full Sample Gov't Servicing <50% Gov't Servicing >=50%
(1) Number of months to keep mortgage business operable assuming no additional revenue (in event of a company stoppage). How long, in months, the company could meet operating expenses without
receiving new income.
(2) Number of months to keep mortgage business operable assuming no additional revenue (in event of a company stoppage). How long, in months, the company could meet operating expenses without
receiving new income, incorporating not only unrestricted cash but the unused portion of servicing advance lines.
(3) A measure of leverage. A low percentage indicates possible overleveraging and a high percentage indicates less leverage. The percentage helps determine whether a company has enough capital. Fannie
Mae's expectation is 6% or higher.