quality assurance project plan san antonio river … · quality assurance project plan san antonio...
TRANSCRIPT
Quality Assurance Project Plan San Antonio River Authority
------P.O. Box 839980
San Antonio, Texas 78283-9980
Clean Rivers Program ". ..
.. ··¥···· r -'--·-rJ-z\.\h .:
Water Quality Planning Division
Texas Commission on Environmental Quality
P.O. Box 13087, MC 234
Austin, Texas 78711-3087
Effective Period: FY 2016 to FY 2017
Questions concerning this QAPP should be directed to: Patricia M. Carvajal Quality Control & Data Management Supervisor P.O. Box 839980 San Antonio, Texas 78283-9980 {210)302-3672 [email protected]
San Antonio River Authority QAPP Last revised on August 21, 2015
Page 1 flnaify1617crp qapp_sara-08212015. pdf
Al Approval Page Texas Commission on Environmental Quality Water Quality Planning Division
w( ~ ;., UJ.;a.o g )7-'t I ht'J
Patricia Wise, Manager 'Date Water Quality Monitoring & Assessment Section Patricia. wise@tceg. texas.gov
Allison Fischer Date Project Quality Assurance Specialist CRP
anagement and Analysis Cathy .anderson (dltceq .texa s.gov
Monitoring Division
arah Eagl Clean Rivers Program
~~::z;:z Russell Bond Project Manager, CRP [email protected]
Date
~ rl-8 I?<!(~ bate Daniel Burke
elf;;{&~ [&k_ 'il zx{'Z.olr-Date
TCEQ Quality Assurance Manager [email protected]
San Antonio River Authority QAPP last revised on August 211 2015
Lead CRP Quality Assurance Specialist Laboratory and Quality Assurance Section [email protected]
Page 2 finalfy1617 crp qa pp_sa ra-08212015.pdf
~:~~~ ff:\ ~ ?/ ~ ~ffff)l~L ··-···~····2/:Jl:! · · ~-·~
Patricia M. Ca ]a . ate San Antonio River A thority Quality Assurance Officer [email protected]
IIDll'lk>~llver Authority Regional Environmental Laboratory
- ··~. ,_!._,/, ··oavid Hernandez - . · ~'tate~ San Antonio River Authorit . Laboratory Supervisor dflvidh@sara·!;ll.grg
San Antonio River Authority QAPP Las.t revised on August 21, 2015
~tll.!E~b)~~· +-_:'~'J...::_{1. !L!i J anette Hern~ Date an Antonio River Authority
laboratory Quality Assurance Officer lbernandez@sara·tx.org
Page a draftfyl517crp qapp_sara.OSZI2015
LCRA-ELS
Alicia Gill Laboratory Manager
San Antonio River Authority QAPP Last revised on August 21, 2015
(\)A A~ ~'1/vt 0:1-:lJJ:~,( ') Jenhifer Blossom Date Laboratory Quality Assurance Officer
Page4 draftfy1617crp qapp_sara-08212015
Guadalupe Blanco River Authority
san Antonio River Authority QAPP Last revised on August 21, 2015
Page 5 draftfyl617crp qapp_sara-0821.2015
!land era County River Authority and Groundwater District
~(D_t. _____ !:L David Mauk, General Manager
San Antonio River Authority QAPP last revised on August 21, 201.5
l fn~~~t:J!i Date
Page 6 draftfyl617crp qapp_sara-08<12015
Date
Sub,tier participants (e.g., subcontractors, sub participants, or other units of government) will sign the QAPP, indicating the organization's awareness of, and commitmen~ to requirements contained in this quality assurance project plan and any amendments or added appendices of this plan. Signatures in sectionAl will eliminate the need for adherence letters to be maintained.
San Antonio River Authority QAPP Last revised on ALl gust 21, 2015
Page 7 draftfy1617crp qapp_sara~08212015
San Antonio River Authority QAPP Page 8 Last revised on August 21, 2015 finalfy1617crp qapp_sara-08212015.pdf
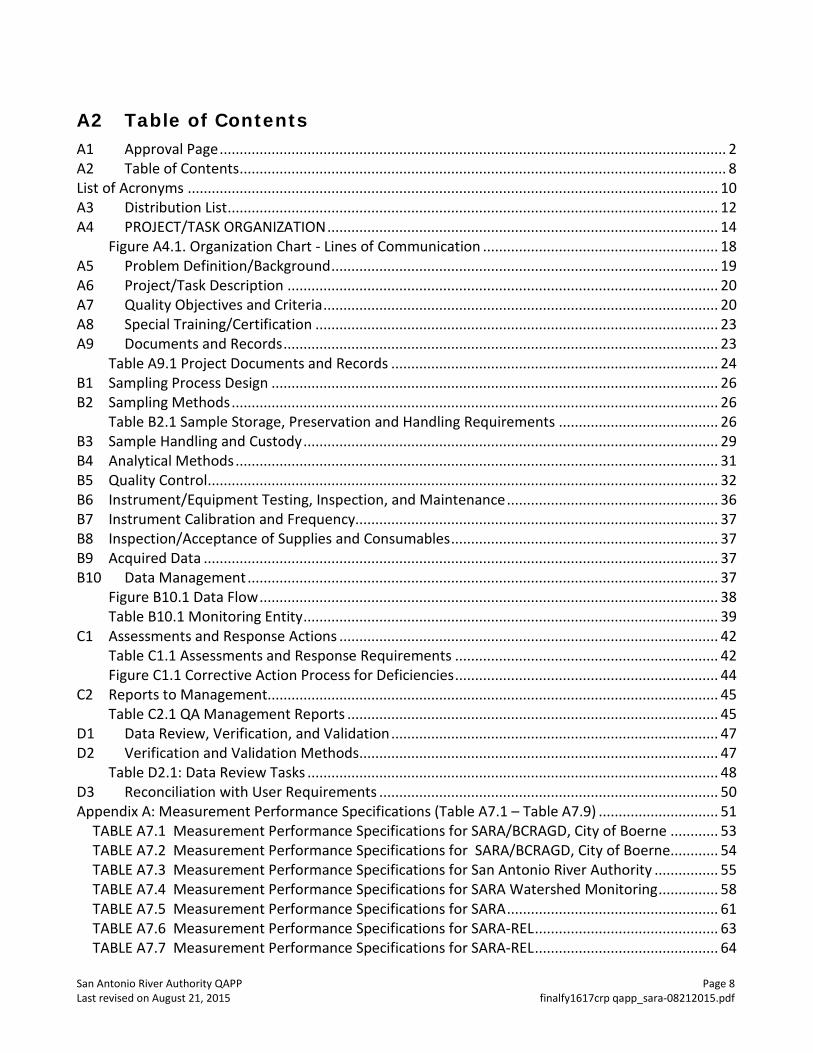
A2 Table of Contents A1 Approval Page ............................................................................................................................... 2 A2 Table of Contents .......................................................................................................................... 8 List of Acronyms ..................................................................................................................................... 10 A3 Distribution List ........................................................................................................................... 12 A4 PROJECT/TASK ORGANIZATION .................................................................................................. 14
Figure A4.1. Organization Chart - Lines of Communication ........................................................... 18 A5 Problem Definition/Background ................................................................................................. 19 A6 Project/Task Description ............................................................................................................ 20 A7 Quality Objectives and Criteria ................................................................................................... 20 A8 Special Training/Certification ..................................................................................................... 23 A9 Documents and Records ............................................................................................................. 23
Table A9.1 Project Documents and Records .................................................................................. 24 B1 Sampling Process Design ................................................................................................................ 26 B2 Sampling Methods .......................................................................................................................... 26
Table B2.1 Sample Storage, Preservation and Handling Requirements ........................................ 26 B3 Sample Handling and Custody ........................................................................................................ 29 B4 Analytical Methods ......................................................................................................................... 31 B5 Quality Control ................................................................................................................................ 32 B6 Instrument/Equipment Testing, Inspection, and Maintenance ..................................................... 36 B7 Instrument Calibration and Frequency ........................................................................................... 37 B8 Inspection/Acceptance of Supplies and Consumables ................................................................... 37 B9 Acquired Data ................................................................................................................................. 37 B10 Data Management ...................................................................................................................... 37
Figure B10.1 Data Flow ................................................................................................................... 38 Table B10.1 Monitoring Entity ........................................................................................................ 39
C1 Assessments and Response Actions ............................................................................................... 42 Table C1.1 Assessments and Response Requirements .................................................................. 42 Figure C1.1 Corrective Action Process for Deficiencies .................................................................. 44
C2 Reports to Management................................................................................................................. 45 Table C2.1 QA Management Reports ............................................................................................. 45
D1 Data Review, Verification, and Validation .................................................................................. 47 D2 Verification and Validation Methods .......................................................................................... 47
Table D2.1: Data Review Tasks ....................................................................................................... 48 D3 Reconciliation with User Requirements ..................................................................................... 50 Appendix A: Measurement Performance Specifications (Table A7.1 – Table A7.9) .............................. 51
TABLE A7.1 Measurement Performance Specifications for SARA/BCRAGD, City of Boerne ............ 53 TABLE A7.2 Measurement Performance Specifications for SARA/BCRAGD, City of Boerne ............ 54 TABLE A7.3 Measurement Performance Specifications for San Antonio River Authority ................ 55 TABLE A7.4 Measurement Performance Specifications for SARA Watershed Monitoring ............... 58 TABLE A7.5 Measurement Performance Specifications for SARA ..................................................... 61 TABLE A7.6 Measurement Performance Specifications for SARA-REL .............................................. 63 TABLE A7.7 Measurement Performance Specifications for SARA-REL .............................................. 64
San Antonio River Authority QAPP Page 9 Last revised on August 21, 2015 finalfy1617crp qapp_sara-08212015.pdf
TABLE A7.8 Measurement Performance Specifications for LCRA-ELS .............................................. 65 TABLE A7.9 Measurement Performance Specifications for GBRA .................................................... 66
Appendix B: Task 3 Work Plan & Sampling Process Design and Monitoring Schedule (Plan) ............... 67 TASK 3: WATER QUALITY MONITORING ........................................................................................ 68 Table B1.1 FY2016 Monitoring Schedule ........................................................................................ 74
Appendix C: Station Location Maps ........................................................................................................ 86 Figure C1.1 FY 2016 Monitoring Map ................................................................................................. 88
Appendix D: Field Data Sheets/Chain of Custody Forms........................................................................ 89 Appendix E: Data Review Checklist and Summary Shells ..................................................................... 123
San Antonio River Authority QAPP Page 10 Last revised on August 21, 2015 finalfy1617crp qapp_sara-08212015.pdf
List of Acronyms AWRL Ambient Water Reporting Limit BCRAGD Bandera County River Authority & Groundwater District BMP Best Management Practices CAP Corrective Action Plan COB City of Boerne COC Chain of Custody CRP Clean Rivers Program DM Data Manager DMRG Surface Water Quality Monitoring Data Management Reference Guide DM&A Data Management and Analysis DTS Data Transformation Package DQO Data Quality Objective ESD Environmental Sciences Department EPA United States Environmental Protection Agency FY Fiscal Year GBRA Guadalupe Blanco River Authority GIS Geographical Information System GPS Global Positioning System IBI Index of Biotic Integrity IT Information Technology Department (SARA) LCRA Lower Colorado River Authority LCS Laboratory Control Sample LCSD Laboratory Control Sample Duplicate LIMS Laboratory Information Management System LOD Limit of Detection LOQ Limit of Quantitation LOS Laboratory Operations Supervisor MS Matrix spike MSD Matrix Spike Duplicate NELAP National Environmental Lab Accreditation Program PM Project Manager QA Quality Assurance QAM Quality Manual QAO Quality Assurance Officer QAPP Quality Assurance Project Plan QAS Quality Assurance Specialist QC Quality Control QMP Quality Management Plan RPD Relative Percent Difference RSD Relative Standard Deviation SARA San Antonio River Authority SLOC Station Location SOP Standard Operating Procedure SQL Structured Query Language
San Antonio River Authority QAPP Page 11 Last revised on August 21, 2015 finalfy1617crp qapp_sara-08212015.pdf
SWQM Surface Water Quality Monitoring SWQMIS Surface Water Quality Monitoring Information System TMDL Total Maximum Daily Load TCEQ Texas Commission on Environmental Quality TNI The NELAC Institute TSWQS Texas Surface Water Quality Standard USAR Upper San Antonio River VOA Volatile Organic Analytes WMS Watershed Monitoring Supervisor
San Antonio River Authority QAPP Page 12 Last revised on August 21, 2015 finalfy1617crp qapp_sara-08212015.pdf
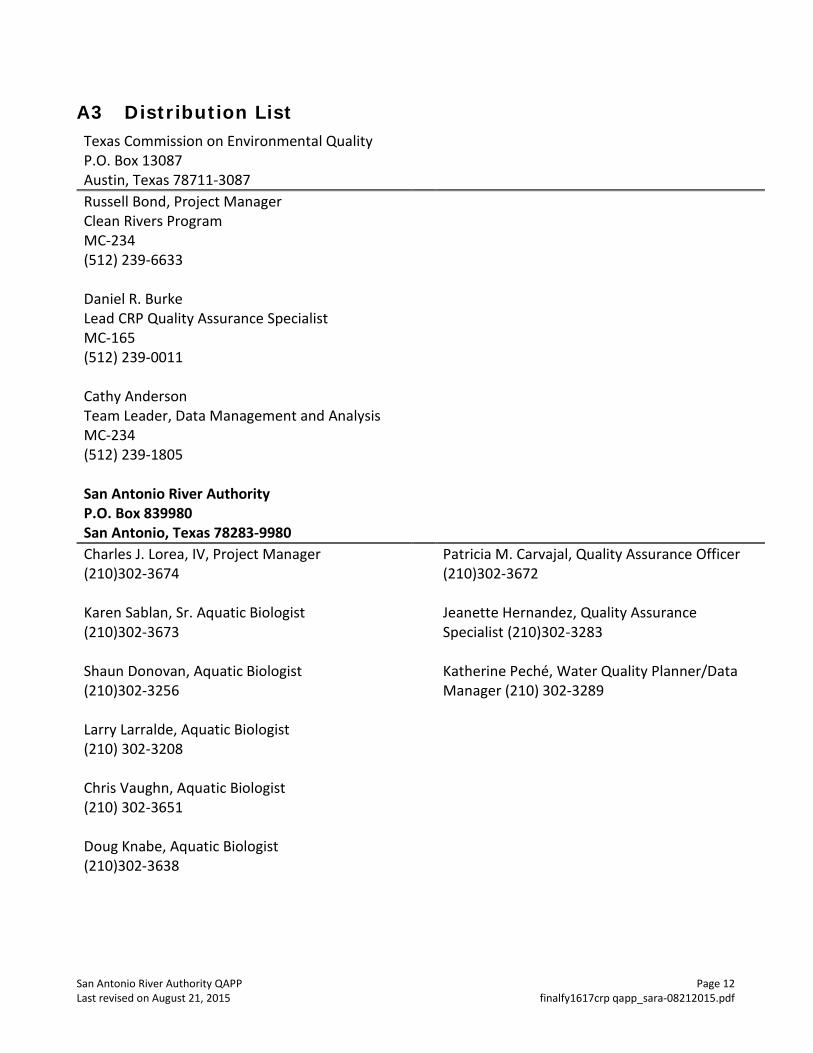
A3 Distribution List Texas Commission on Environmental Quality P.O. Box 13087 Austin, Texas 78711-3087 Russell Bond, Project Manager Clean Rivers Program MC-234 (512) 239-6633
Daniel R. Burke Lead CRP Quality Assurance Specialist MC-165 (512) 239-0011
Cathy Anderson Team Leader, Data Management and Analysis MC-234 (512) 239-1805
San Antonio River Authority P.O. Box 839980 San Antonio, Texas 78283-9980 Charles J. Lorea, IV, Project Manager (210)302-3674
Patricia M. Carvajal, Quality Assurance Officer (210)302-3672
Karen Sablan, Sr. Aquatic Biologist (210)302-3673
Jeanette Hernandez, Quality Assurance Specialist (210)302-3283
Shaun Donovan, Aquatic Biologist (210)302-3256
Katherine Peché, Water Quality Planner/Data Manager (210) 302-3289
Larry Larralde, Aquatic Biologist (210) 302-3208
Chris Vaughn, Aquatic Biologist (210) 302-3651
Doug Knabe, Aquatic Biologist (210)302-3638
San Antonio River Authority QAPP Page 13 Last revised on August 21, 2015 finalfy1617crp qapp_sara-08212015.pdf
San Antonio River Authority Regional Environmental Laboratory P.O. Box 839980 San Antonio, Texas 78283-9980 David Hernandez, Manager (210)302-3669
Greg Mateo, Water Quality Scientist III (210)302-3290
Lower Colorado River Authority – Environmental Laboratory Services 3700 Lake Austin Blvd. Austin, Texas 78703 Alicia Gill, LCRA Laboratory Manager (512)356-6022
Jennifer Blossom, (512)730-5144
Bandera County River Authority & Groundwater District P.O. Box 177 Bandera, Texas 78003 David Mauk, General Manager (830)796-7260
Morgan Ayers (830)796-7260
Guadalupe County River Authority Regional Environmental Laboratory 933 East Court St. Seguin, Texas 78155 Josie Longoria, Laboratory Manager (830) 379-5822 x247
City of Boerne Ryan Bass Resource Conservation & Economic Development Coordinator City of Boerne (830)248-1538
The San Antonio River Authority will provide copies of this project plan and any amendments or appendices of this plan to each person on this list and to each sub-tier project participant, e.g., subcontractors, sub participant, or other units of government. The San Antonio River Authority will document distribution of the plan and any amendments and appendices, maintain this documentation as part of the project’s quality assurance records, and will ensure the documentation is available for review.
San Antonio River Authority QAPP Page 14 Last revised on August 21, 2015 finalfy1617crp qapp_sara-08212015.pdf
A4 PROJECT/TASK ORGANIZATION Description of Responsibilities TCEQ
Sarah Eagle CRP Work Leader
Responsible for Texas Commission on Environmental Quality (TCEQ) activities supporting the development and implementation of the Texas Clean Rivers Program (CRP). Responsible for verifying that the TCEQ Quality Management Plan (QMP) is followed by CRP staff. Supervises TCEQ CRP staff. Reviews and responds to any deficiencies, corrective actions, or findings related to the area of responsibility. Oversees the development of Quality Assurance (QA) guidance for the CRP. Reviews and approves all QA audits, corrective actions, reviews, reports, work plans, contracts, QAPPs, and TCEQ Quality Management Plan. Enforces corrective action, as required, where QA protocols are not met. Ensures CRP personnel are fully trained.
Daniel R. Burke CRP Lead Quality Assurance Specialist
Participates in the development, approval, implementation, and maintenance of written QA standards (e.g., Program Guidance, SOPs, QAPPs, QMP). Assists program and project manager in developing and implementing quality system. Serves on planning team for CRP special projects. Coordinates the review and approval of CRP QAPPs. Prepares and distributes annual audit plans. Conducts monitoring systems audits of Planning Agencies. Concurs with and monitors implementation of corrective actions. Conveys QA problems to appropriate management. Recommends that work be stopped in order to safeguard programmatic objectives, worker safety, public health, or environmental protection. Ensures maintenance of QAPPs and audit records for the CRP.
Russell Bond CRP Project Manager
Responsible for the development, implementation, and maintenance of CRP contracts. Tracks, reviews, and approves deliverables. Participates in the development, approval, implementation, and maintenance of written QA standards (e.g., Program Guidance, SOPs, QAPPs, QMP). Assists CRP Lead QA Specialist in conducting San Antonio River Authority audits. Verifies QAPPs are being followed by contractors and that projects are producing data of known quality. Coordinates project planning with the San Antonio River Authority Project Manager. Reviews and approves data and reports produced by contractors. Notifies QA Specialists of circumstances which may adversely affect the quality of data derived from the collection and analysis of samples. Develops, enforces, and monitors corrective action measures to ensure contractors meet deadlines and scheduled commitments.
Cathy Anderson Team Leader, Data Management and Analysis (DM&A) Team
Participates in the development, approval, implementation, and maintenance of written QA standards (e.g., Program Guidance, SOPs, QAPPs, QMP). Ensures DM&A staff perform data management related tasks, including coordination and tracking of CRP data sets from initial submittal through CRP Project Manager review and approval; ensuring that data are reported following
San Antonio River Authority QAPP Page 15 Last revised on August 21, 2015 finalfy1617crp qapp_sara-08212015.pdf
instructions in the Surface Water Quality Monitoring Data Management Reference Guide, 2015, or most current version (DMRG); running automated data validation checks in Surface Water Quality Monitoring Information System (SWQMIS) and coordinating data verification and error correction with CRP Project Managers; generating SWQMIS summary reports to assist CRP Project Managers' data review; identifying data anomalies and inconsistencies; providing training and guidance to CRP and Planning Agencies on technical data issues to ensure that data are submitted according to documented procedures; reviewing QAPPs for valid stream monitoring stations, validity of parameter codes, submitting entity code(s), collecting entity code(s), and monitoring type code(s); developing and maintaining data management-related standard operating procedures (SOPs) for CRP data management; and coordinating and processing data correction requests.
Peter Bohls CRP Data Manager, DM&A Team
Responsible for coordination and tracking of CRP data sets from initial submittal through CRP Project Manager review and approval. Ensures that data are reported following instructions in the DMRG 2015. Runs automated data validation checks in SWQMIS and coordinates data verification and error correction with CRP Project Managers. Generates SWQMIS summary reports to assist CRP Project Managers’ data review. Identifies data anomalies and inconsistencies. Provides training and guidance to CRP and Planning Agencies on technical data issues to ensure that data are submitted according to documented procedures. Reviews QAPPs for valid stream monitoring stations. Checks validity of parameter codes, submitting entity code(s), collecting entity code(s), and monitoring type code(s). Develops and maintains data management-related SOPs for CRP data management. Coordinates and processes data correction requests. Participates in the development, implementation, and maintenance of written QA standards (e.g., Program Guidance, SOPs, QAPPs, QMP).
Allison Fischer CRP Project Quality Assurance Specialist
Serves as liaison between CRP management and TCEQ QA management. Participates in the development, approval, implementation, and maintenance of written QA standards (e.g., Program Guidance, SOPs, QAPPs, QMP). Serves on planning team for CRP special projects and reviews QAPPs in coordination with other CRP staff. Coordinates documentation and implementation of corrective action for the CRP. SAN ANTONIO RIVER AUTHORITY
Charles J. Lorea, IV San Antonio River Authority Project Manager
Responsible for implementing and monitoring CRP requirements in contracts, QAPPs, and QAPP amendments and appendices. Coordinates basin planning activities and work of basin partners. Ensures monitoring systems audits are conducted to ensure QAPPs are followed by San Antonio River Authority participants and that projects are producing data of known quality. Ensures that subparticipants are qualified to perform contracted work. Ensures CRP project managers and/or QA Specialists are notified of deficiencies and corrective actions, and that issues are resolved. Responsible for validating that data collected are acceptable for reporting to the TCEQ.
San Antonio River Authority QAPP Page 16 Last revised on August 21, 2015 finalfy1617crp qapp_sara-08212015.pdf
Patricia M. Carvajal San Antonio River Authority Quality Assurance Officer
Responsible for coordinating the implementation of the QA program. Responsible for writing and maintaining the QAPP and monitoring its implementation. Responsible for maintaining records of QAPP distribution, including appendices and amendments. Responsible for maintaining written records of sub-tier commitment to requirements specified in this QAPP. Responsible for identifying, receiving, and maintaining project QA records. Responsible for coordinating with the TCEQ QAS to resolve QA-related issues. Notifies the San Antonio River Authority Project Manager of particular circumstances which may adversely affect the quality of data. Coordinates and monitors deficiencies and corrective action. Coordinates and maintains records of data verification and validation. Coordinates the research and review of technical QA material and data related to water quality monitoring system design and analytical techniques. Conducts monitoring systems audits on project participants to determine compliance with project and program specifications, issues written reports, and follows through on findings. Ensures that field staff is properly trained and that training records are maintained.
Katherine Peché San Antonio River Authority Data Manager
Responsible for ensuring that field data are properly reviewed and verified. Responsible for the transfer of basin quality-assured water quality data to the TCEQ in a format compatible with SWQMIS. Maintains quality-assured data on San Antonio River Authority internet sites. Other key participants (e.g., contractors/participants, field sampling supervisors, laboratories) must be listed and the project duties of each should be summarized. Bandera County River Authority and Groundwater District
David Mauk BCRAGD General Manager
Responsible for overall performance, administration, and reporting of analyses performed by BCRAGD field staff. Responsible for supervision of field personnel involved in generating analytical data for the project. Ensures that field personnel have adequate training and a thorough knowledge of the QAPP and related SOPs. Responsible for oversight of all field operations ensuring that all QA/QC requirements are met, documentation is complete and adequately maintained, and results are reported accurately.
Morgan Ayers BCRAGD Quality Assurance Officer
Maintains operating procedures that are in compliance with the QAPP, amendments and appendices. Responsible for the overall quality control and quality assurance of analyses performed by BCRAGD’s field staff. Assists with monitoring systems audits for CRP projects. Additionally, the QAO will review and verify all field data for integrity and continuity, reasonableness and conformance to project requirements, and then validated against the data quality objectives listed in Table A7.9. Responsible for coordinating the implementation of the QA program. Responsible for identifying, receiving, and maintaining project quality assurance records. Notifies the SARA QAO of particular
San Antonio River Authority QAPP Page 17 Last revised on August 21, 2015 finalfy1617crp qapp_sara-08212015.pdf
circumstances which may adversely affect the quality of data (i.e., post-calibration failure). Coordinates and monitors deficiencies, nonconformances and corrective action. Coordinates and maintains records of data verification and validation. Coordinates the research and review of technical QA material and data related to water quality monitoring system design and analytical techniques.
City of Boerne
Ryan Bass Resource Conservation & Economic Development Coordinator
Responsible for overall performance, administration, and reporting of analyses performed by City of Boerne. Responsible for collection of samples and all associated QA/QC documentation. Ensures that field personnel have adequate training and a thorough knowledge of the QAPP and related SOPs. Responsible for oversight of all field operations ensuring that all QA/QC requirements are met, documentation is complete and adequately maintained, and results are reported accurately. Maintains operating procedures that are in compliance with the QAPP, amendments and appendices. Responsible for the overall quality control and quality assurance of analyses performed by BCRAGD’s field staff. Assists with monitoring systems audits for CRP projects. Additionally, the QAO will review and verify all field data for integrity and continuity, reasonableness and conformance to project requirements, and then validated against the data quality objectives listed in Table A7.9. Responsible for coordinating the implementation of the QA program. Responsible for identifying, receiving, and maintaining project quality assurance records. Notifies the SARA QAO of particular circumstances which may adversely affect the quality of data (i.e., post-calibration failure). Coordinates and monitors deficiencies, nonconformances and corrective action. Coordinates and maintains records of data verification and validation. Coordinates the research and review of technical QA material and data related to water quality monitoring system design and analytical techniques.
San Antonio River Authority QAPP Page 18 Last revised on August 21, 2015 finalfy1617crp qapp_sara-08212015.pdf
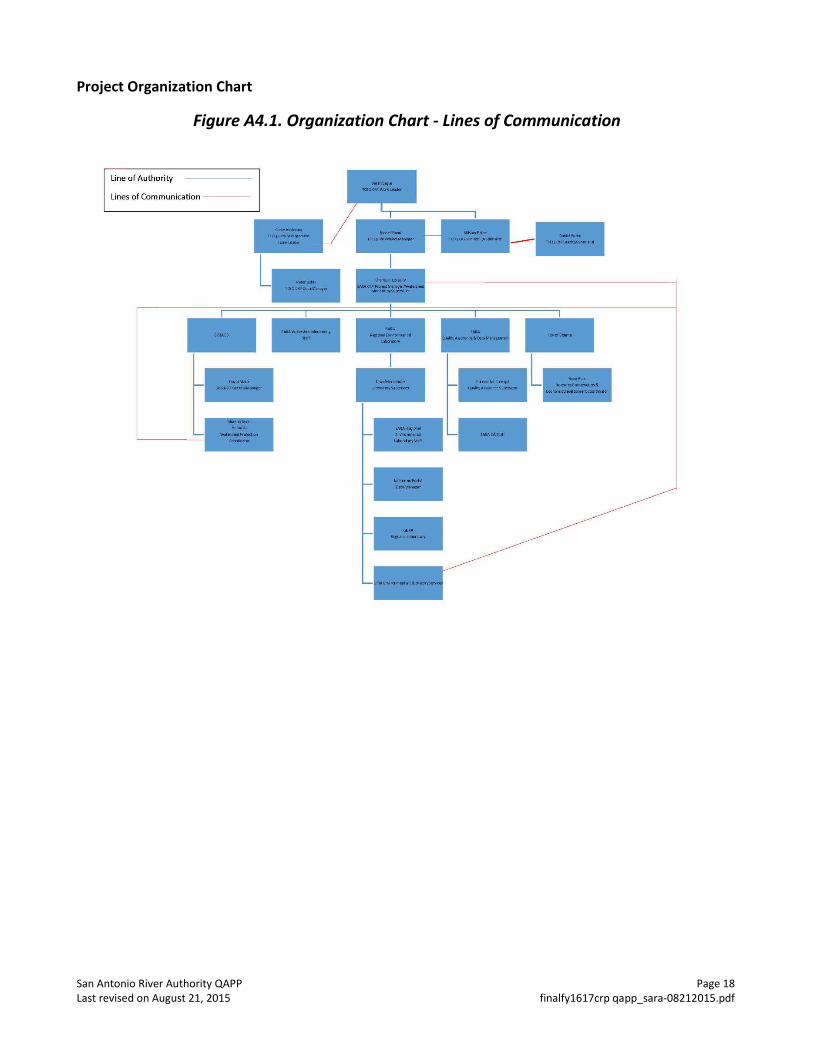
Project Organization Chart
Figure A4.1. Organization Chart - Lines of Communication
Line of Authority
Lines of Communication
San Antonio River Authority QAPP Page 19 Last revised on August 21, 2015 finalfy1617crp qapp_sara-08212015.pdf
A5 Problem Definition/Background In 1991, the Texas Legislature passed the Texas Clean River Act (Senate Bill 818) in response to growing concerns that water resource issues were not being pursued in an integrated, systematic manner. The act requires that ongoing water quality assessments be conducted for each river basin in Texas, an approach that integrates water quality issues within the watershed. The CRP legislation mandates that each river authority (or local governing entity) shall submit quality-assured data collected in the river basin to the commission. Quality-assured data in the context of the legislation means data that comply with TCEQ rules for surface water quality monitoring (SWQM) programs, including rules governing the methods under which water samples are collected and analyzed and data from those samples are assessed and maintained. This QAPP addresses the program developed between the San Antonio River Authority and the TCEQ to carry out the activities mandated by the legislation. The QAPP was developed and will be implemented in accordance with provisions of the TCEQ Quality Management Plan, January 2013 or most recent version (QMP). The purpose of this QAPP is to clearly delineate San Antonio River Authority QA policy, management structure, and procedures which will be used to implement the QA requirements necessary to verify and validate the surface water quality data collected. The QAPP is reviewed by the TCEQ to help ensure that data generated for the purposes described above are scientifically valid and legally defensible. This process will ensure that data collected under this QAPP and submitted to SWQMIS have been collected and managed in a way that guarantees its reliability and therefore can be used in water quality assessments, total maximum daily load (TMDL) development, establishing water quality standards, making permit decisions and used by other programs deemed appropriate by the TCEQ. Project results will be used to support the achievement of CRP objectives, as contained in the Clean Rivers Program Guidance and Reference Guide FY 2016 -2017. The design for the current monitoring program was developed through a coordinated monitoring meeting. Representatives from the TCEQ met with SARA staff as well as other partner agencies to determine where there was a need for sampling. Sample sites were determined based on need, taking into account: current and future TMDL collection efforts, USGS sample stations, other data gatherers (GBRA and LCRA), and data needs for future 303d lists by assessment units, Basin Highlights Reports and Basin Summary Reports. In an effort to provide additional data to the TCEQ, SARA stream monitoring sites will also be sampled in accordance with this QAPP and submitted to the TCEQ. Routine monitoring will be conducted at several locations each week at various locations along the urban reach of the Upper San Antonio River (USAR Synoptic Monitoring). All of the samples will be collected at approximately 7:30am. This monitoring is funded by SARA and is included in the Appendix B Monitoring Schedule. This work is investigative at this point and once adequate data points have been collected the data will be examined. Monitoring locations can be found in Appendix B of this document
San Antonio River Authority QAPP Page 20 Last revised on August 21, 2015 finalfy1617crp qapp_sara-08212015.pdf
A6 Project/Task Description See Appendix B for the project-related work plan tasks and schedule of deliverables for a description of work defined in this QAPP. Attach work plan tasks pertaining to this QAPP. See Appendix B for sampling design and monitoring pertaining to this QAPP. Amendments to the QAPP Revisions to the QAPP may be necessary to address incorrectly documented information or to reflect changes in project organization, tasks, schedules, objectives, and methods. Requests for amendments will be directed from the San Antonio River Authority Project Manager to the CRP Project Manager electronically. The San Antonio River Authority will submit a completed QAPP Amendment document, including a justification of the amendment, a table of changes, and all pages, sections or attachments affected by the amendment. Amendments are effective immediately upon approval by the San Antonio River Authority Project Manager, the San Antonio River Authority QAO, the CRP Project Manager, the TCEQ QA Manager (or designee), the CRP Project QA Specialist, and additional parties affected by the amendment. Amendments are not retroactive. No work shall be implemented without an approved QAPP or amendment prior to the start of work. Any activities under this contract that commence prior to the approval of the governing QA document constitute a deficiency and are subject to corrective action as described in section C1 of this QAPP. Any deviation or deficiency from this QAPP which occurs after the execution of this QAPP should be addressed through a Corrective Action Plan (CAP). An Amendment may be a component of a CAP to prevent future recurrence of a deviation. Amendments will be incorporated into the QAPP by way of attachment and distributed to personnel on the distribution list by the San Antonio River Authority Project Manager. Special Project Appendices Projects requiring QAPP appendices will be planned in consultation with the San Antonio River Authority and the TCEQ Project Manager and TCEQ technical staff. Appendices will be written in an abbreviated format and will reference the Basin QAPP where appropriate. Appendices will be approved by the San Antonio River Authority Project Manager, the San Antonio River Authority QAO, the Laboratory (as applicable), and the CRP Project Manager, the CRP Project QA Specialist, the CRP Lead QA Specialist and other TCEQ personnel, as appropriate. Copies of approved QAPP appendices will be distributed by the San Antonio River Authority to project participants before data collection activities commence.
A7 Quality Objectives and Criteria The purpose of routine water quality monitoring is to collect surface water quality data that can be used to characterize water quality conditions, identify significant long-term water quality trends, support water quality standards development, support the permitting process, and conduct water quality assessments in accordance with TCEQ’s Guidance for Assessing and Reporting Surface Water Quality in Texas, August 2012 or most recent version (https://www.tceq.texas.gov/assets/public/waterquality/swqm/assess/12twqi/2012_guidance.pdf). These water quality data, and data collected by other organizations (e.g., USGS, TCEQ, etc.), will be
San Antonio River Authority QAPP Page 21 Last revised on August 21, 2015 finalfy1617crp qapp_sara-08212015.pdf
subsequently reconciled for use and assessed by the TCEQ. Systematic watershed monitoring is defined as sampling that is planned for a short duration (1 to 2 years), and is designed to; screen waters that would not normally be included in the routine monitoring program, investigate areas of potential concern, and investigate possible sources of water quality impairments or concerns. Due to the limitations regarding these data (e.g., not temporally representative, limited number of samples, biological sampling does not meet the specimen vouchering requirements), the data will be used to determine whether any locations have values exceeding the TCEQ’s water quality criteria and/or screening levels (or in some cases values elevated above normal). The San Antonio River Authority will use this information to determine future monitoring priorities. These water quality data and data collected by other organizations (e.g., USGS, TCEQ, etc.), will be subsequently reconciled for use and assessed by the TCEQ. The objective of 24 hour sampling is to determine if the designated Aquatic Life Use subcategories are being met for a stream site. Since the lowest dissolved oxygen levels usually occurs during the night and early morning (before daybreak) collecting the dissolved oxygen values during this time is the only way to determine if the Aquatic Life Use dissolved oxygen minimum criteria is being met. Conductivity, pH and temperature are also collected with the 24 hour dissolved oxygen and may assist in the interpretation of results. Biological sampling (nekton and benthic macroinvertebrates) in conjunction with habitat assessments are used as a holistic approach to determine the health of the stream. Areas where water quality is good, with good habitats, should have diverse and abundant biological communities. Areas where water quality is poor should have biological communities that show this (pollution tolerant species only, little bio diversity, the presences of hybrids and diseased organisms). The purpose of biological sampling is to detect water quality pollutants that are not directly being tested for by the laboratory and field staff. The measurement performance specifications to support the project purpose for a minimum data set are specified in Appendix A: Table A7.1 – A7.11 and in the text following.
Ambient Water Reporting Limits (AWRLs) The AWRL establishes the reporting specification at or below which data for a parameter must be reported to be compared with freshwater screening criteria. The AWRLs specified in Appendix A Table A7.1 are the program-defined reporting specifications for each analyte and yield data acceptable for the TCEQ’s water quality assessment. A full listing of AWRLs can be found at http://www.tceq.state.tx.us/assets/public/waterquality/crp/QA/awrlmaster.pdf. The limit of quantitation (LOQ) is the minimum level, concentration, or quantity of a target variable (e.g., target analyte) that can be reported with a specified degree of confidence. Analytical results shall be reported down to the laboratory’s LOQ (i.e., the laboratory’s LOQ for a given parameter is its reporting limit). The following requirements must be met in order to report results to the CRP:
San Antonio River Authority QAPP Page 22 Last revised on August 21, 2015 finalfy1617crp qapp_sara-08212015.pdf
• The laboratory’s LOQ for each analyte must be at or below the AWRL as a matter of routine practice
• The laboratory must demonstrate its ability to quantitate at its LOQ for each analyte by running an LOQ check sample for each analytical batch of CRP samples analyzed.
• Control limits for LOQ check samples are found in Appendix A. Laboratory Measurement Quality Control Requirements and Acceptability Criteria are provided in Section B5
Precision Precision is the degree to which a set of observations or measurements of the same property, obtained under similar conditions, conform to themselves. It is a measure of agreement among replicate measurements of the same property, under prescribed similar conditions, and is an indication of random error. Laboratory precision is assessed by comparing replicate analyses of laboratory control samples (LCS) in the sample matrix (e.g. deionized water, sand, commercially available tissue) or sample/duplicate pairs in the case of bacterial analysis. Precision results are compared against measurement performance specifications and used during evaluation of analytical performance. Program-defined measurement performance specifications for precision are defined in Appendix A.
Bias Bias is a statistical measurement of correctness and includes multiple components of systematic error. A measurement is considered unbiased when the value reported does not differ from the true value. Bias is determined through the analysis of LCS and LOQ Check Samples prepared with verified and known amounts of all target analytes in the sample matrix (e.g. deionized water, sand, commercially available tissue) and by calculating percent recovery. Results are compared against measurement performance specifications and used during evaluation of analytical performance. Program-defined measurement performance specifications for bias are specified in Appendix A.
Representativeness Site selection, the appropriate sampling regime, the sampling of all pertinent media according to TCEQ SOPs, and use of only approved analytical methods will assure that the measurement data represents the conditions at the site. Routine data collected under CRP for water quality assessment are considered to be spatially and temporally representative of routine water quality conditions. Water Quality data are collected on a routine frequency and are separated by approximately even time intervals. At a minimum, samples are collected over at least two seasons (to include inter-seasonal variation) and over two years (to include inter-year variation) and include some data collected during an index period (March 15- October 15). Although data may be collected during varying regimes of weather and flow, the data sets will not be biased toward unusual conditions of flow, runoff, or season. The goal for meeting total representation of the water body will be tempered by the potential funding for complete representativeness.
Comparability Confidence in the comparability of routine data sets for this project and for water quality
San Antonio River Authority QAPP Page 23 Last revised on August 21, 2015 finalfy1617crp qapp_sara-08212015.pdf
assessments is based on the commitment of project staff to use only approved sampling and analysis methods and QA/QC protocols in accordance with quality system requirements and as described in this QAPP and in TCEQ SOPs. Comparability is also guaranteed by reporting data in standard units, by using accepted rules for rounding figures, and by reporting data in a standard format as specified in the Data Management Plan Section B10.
Completeness The completeness of the data is basically a relationship of how much of the data are available for use compared to the total potential data. Ideally, 100% of the data should be available. However, the possibility of unavailable data due to accidents, insufficient sample volume, broken or lost samples, etc. is to be expected. Therefore, it will be a general goal of the project(s) that 90% data completion is achieved.
A8 Special Training/Certification Before new field personnel independently conduct field work they are trained by experienced Watershed Monitoring Staff in proper instrument calibration, field sampling techniques, and field analysis procedures. The SARA QA officer (or designee) will document the successful field demonstration. The SARA QA Officer (or designee) will retain documentation of training and the successful field demonstration in the employee’s personnel file (or other designated location, and will be available during monitoring systems audits. The requirements for Global Positioning System (GPS) certification are located in Section B10, Data Management. Contractors and subcontractors must ensure that laboratories analyzing samples under this QAPP meet the requirements contained in section The NELAC Institute (TNI) Volume 1 Module 2, Section 4.5.5 (concerning Subcontracting of Environmental Tests).
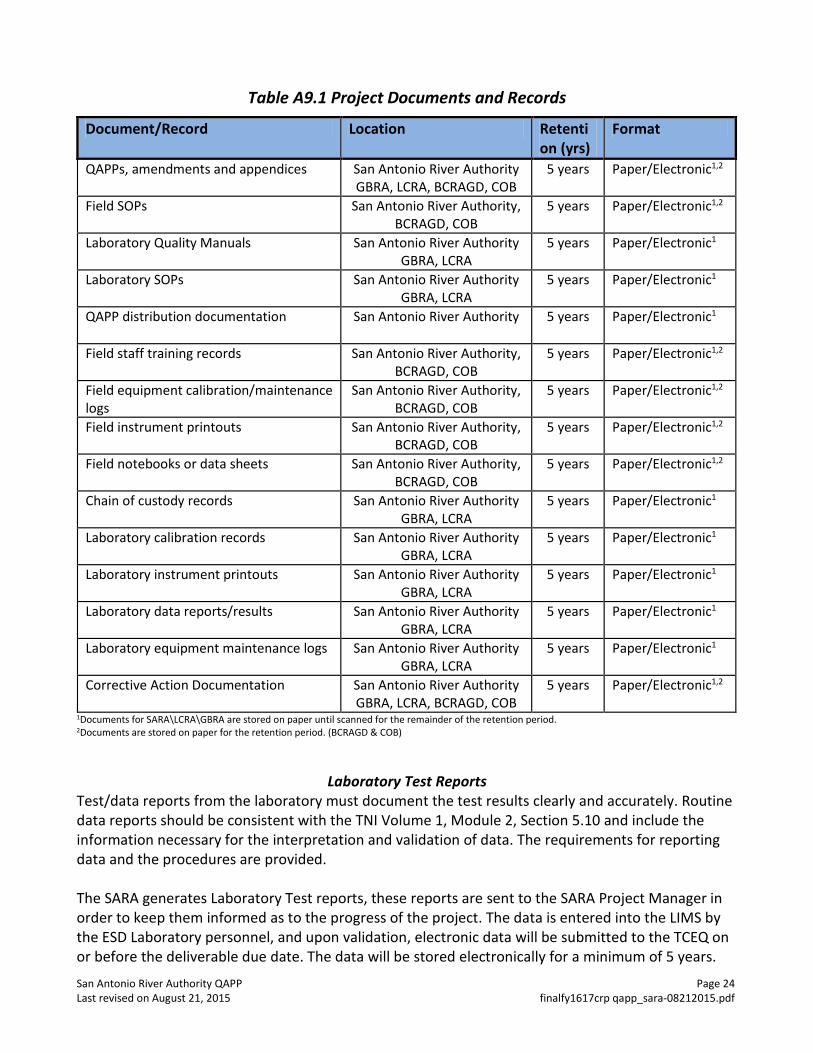
A9 Documents and Records The documents and records that describe, specify, report, or certify activities are listed. The list below is limited to documents and records that may be requested for review during a monitoring systems audit. Add other types of project documents and records as appropriate.
San Antonio River Authority QAPP Page 24 Last revised on August 21, 2015 finalfy1617crp qapp_sara-08212015.pdf
Table A9.1 Project Documents and Records
Document/Record Location Retention (yrs)
Format
QAPPs, amendments and appendices San Antonio River Authority GBRA, LCRA, BCRAGD, COB
5 years Paper/Electronic1,2
Field SOPs San Antonio River Authority, BCRAGD, COB
5 years
Paper/Electronic1,2
Laboratory Quality Manuals San Antonio River Authority GBRA, LCRA
5 years Paper/Electronic1
Laboratory SOPs San Antonio River Authority GBRA, LCRA
5 years Paper/Electronic1
QAPP distribution documentation San Antonio River Authority 5 years
Paper/Electronic1
Field staff training records San Antonio River Authority, BCRAGD, COB
5 years Paper/Electronic1,2
Field equipment calibration/maintenance logs
San Antonio River Authority, BCRAGD, COB
5 years Paper/Electronic1,2
Field instrument printouts San Antonio River Authority, BCRAGD, COB
5 years Paper/Electronic1,2
Field notebooks or data sheets San Antonio River Authority, BCRAGD, COB
5 years Paper/Electronic1,2
Chain of custody records San Antonio River Authority GBRA, LCRA
5 years Paper/Electronic1
Laboratory calibration records San Antonio River Authority GBRA, LCRA
5 years Paper/Electronic1
Laboratory instrument printouts San Antonio River Authority GBRA, LCRA
5 years Paper/Electronic1
Laboratory data reports/results San Antonio River Authority GBRA, LCRA
5 years Paper/Electronic1
Laboratory equipment maintenance logs San Antonio River Authority GBRA, LCRA
5 years Paper/Electronic1
Corrective Action Documentation San Antonio River Authority GBRA, LCRA, BCRAGD, COB
5 years Paper/Electronic1,2
1Documents for SARA\LCRA\GBRA are stored on paper until scanned for the remainder of the retention period. 2Documents are stored on paper for the retention period. (BCRAGD & COB)
Laboratory Test Reports
Test/data reports from the laboratory must document the test results clearly and accurately. Routine data reports should be consistent with the TNI Volume 1, Module 2, Section 5.10 and include the information necessary for the interpretation and validation of data. The requirements for reporting data and the procedures are provided. The SARA generates Laboratory Test reports, these reports are sent to the SARA Project Manager in order to keep them informed as to the progress of the project. The data is entered into the LIMS by the ESD Laboratory personnel, and upon validation, electronic data will be submitted to the TCEQ on or before the deliverable due date. The data will be stored electronically for a minimum of 5 years.
San Antonio River Authority QAPP Page 25 Last revised on August 21, 2015 finalfy1617crp qapp_sara-08212015.pdf
Analysis conducted by GBRA or LCRA will be reported to the SARA –REL through an analytical report that complies with the NELAP requirements listed below. The results are then entered into the SARA LIMS system and identified as being analyzed by the appropriate laboratory. In the event that an analytical test report is requested as part of a Quality Systems audit an analytical test report may be generated. Test/data reports from the laboratory document the test results clearly and accurately. Routine data reports are consistent with the NELAP standards (Section 5.5.10) and include the information necessary for the interpretation and validation of data. The information provided in an analytical test report whether hard copy or electronic includes the following:
• title • name and address of the laboratory, and the phone number and name of a contact
person; • unique identification of the test report, date and time stamp at the bottom of the report,
on each page and a pagination system that ensures that each page is recognized as part of the test report and a clear identification of the end of the report, such as 3 of 10;
• name and address of the client if applicable; • identification of the test method used; • unambiguous identification of the sample(s), including the client identification code; • date of sample receipt when it is critical to the validity and application of the results, date
and time of sample collection, dates the tests were performed, the time of sample preparation and analysis if the required holding time for either activity is less than or equal to 72 hours;
• test results with failures identified, units of measurement, an indication of whether results are calculated on a dry weight or wet weight basis.
• the name, function, and signature or an equivalent electronic identification of the person authorizing the test report, and the date of issue;
• statement to the effect that the results relate only to the samples; • a statement that the report shall not be reproduced except in full without written
approval of the laboratory; • Certification that the results are in compliance with the NELAP Standards if accredited to
be in compliance or provide reasons and/or justification if they do not comply.
Electronic Data Data will be submitted electronically to the TCEQ in the Event/Result file format described in the most current version of the DMRG, which can be found at (http://www.tceq.state.tx.us/compliance/monitoring/water/quality/data/wdma/dmrg_index.html). A completed Data Review Checklist and Data Summary (see Appendix E) will be submitted with each data submittal.
San Antonio River Authority QAPP Page 26 Last revised on August 21, 2015 finalfy1617crp qapp_sara-08212015.pdf
B1 Sampling Process Design See Appendix B for sampling process design information and monitoring tables associated with data collected under this QAPP.
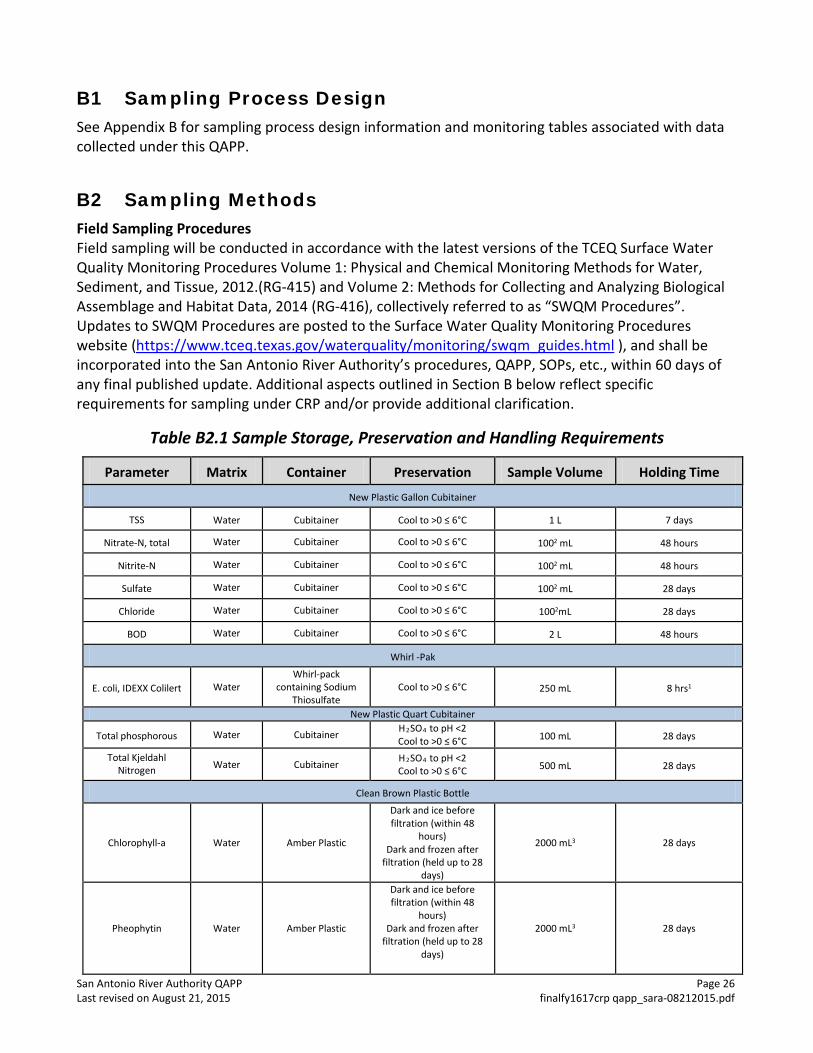
B2 Sampling Methods Field Sampling Procedures Field sampling will be conducted in accordance with the latest versions of the TCEQ Surface Water Quality Monitoring Procedures Volume 1: Physical and Chemical Monitoring Methods for Water, Sediment, and Tissue, 2012.(RG-415) and Volume 2: Methods for Collecting and Analyzing Biological Assemblage and Habitat Data, 2014 (RG-416), collectively referred to as “SWQM Procedures”. Updates to SWQM Procedures are posted to the Surface Water Quality Monitoring Procedures website (https://www.tceq.texas.gov/waterquality/monitoring/swqm_guides.html ), and shall be incorporated into the San Antonio River Authority’s procedures, QAPP, SOPs, etc., within 60 days of any final published update. Additional aspects outlined in Section B below reflect specific requirements for sampling under CRP and/or provide additional clarification.
Table B2.1 Sample Storage, Preservation and Handling Requirements
Parameter Matrix Container Preservation Sample Volume Holding Time New Plastic Gallon Cubitainer
TSS Water Cubitainer Cool to >0 ≤ 6°C 1 L 7 days
Nitrate-N, total Water Cubitainer Cool to >0 ≤ 6°C 1002 mL 48 hours
Nitrite-N Water Cubitainer Cool to >0 ≤ 6°C 1002 mL 48 hours
Sulfate Water Cubitainer Cool to >0 ≤ 6°C 1002 mL 28 days
Chloride Water Cubitainer Cool to >0 ≤ 6°C 1002mL 28 days
BOD Water Cubitainer Cool to >0 ≤ 6°C 2 L 48 hours
Whirl -Pak
E. coli, IDEXX Colilert Water Whirl-pack
containing Sodium Thiosulfate
Cool to >0 ≤ 6°C 250 mL 8 hrs1
New Plastic Quart Cubitainer
Total phosphorous Water Cubitainer H2SO4 to pH <2 Cool to >0 ≤ 6°C 100 mL 28 days
Total Kjeldahl Nitrogen Water Cubitainer H2SO4 to pH <2
Cool to >0 ≤ 6°C 500 mL 28 days
Clean Brown Plastic Bottle
Chlorophyll-a Water Amber Plastic
Dark and ice before filtration (within 48
hours) Dark and frozen after
filtration (held up to 28 days)
2000 mL3 28 days
Pheophytin Water Amber Plastic
Dark and ice before filtration (within 48
hours) Dark and frozen after
filtration (held up to 28 days)
2000 mL3 28 days
San Antonio River Authority QAPP Page 27 Last revised on August 21, 2015 finalfy1617crp qapp_sara-08212015.pdf
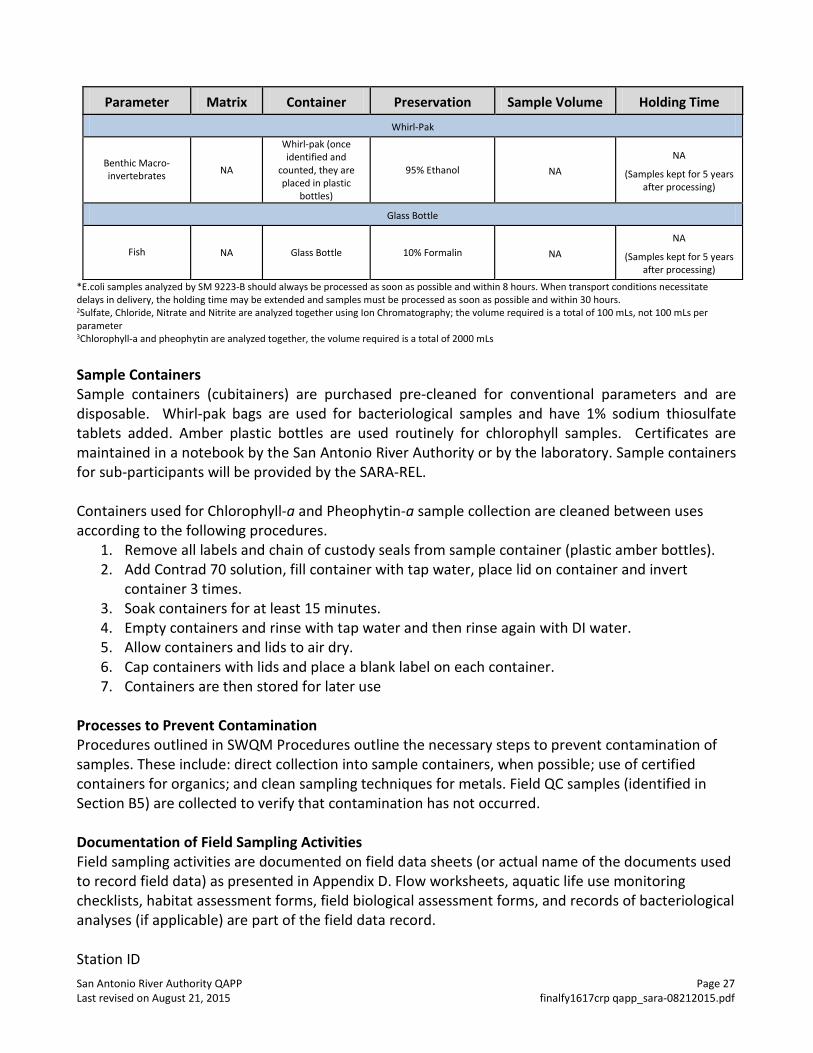
Parameter Matrix Container Preservation Sample Volume Holding Time Whirl-Pak
Benthic Macro-invertebrates NA
Whirl-pak (once identified and
counted, they are placed in plastic
bottles)
95% Ethanol NA NA
(Samples kept for 5 years after processing)
Glass Bottle
Fish NA Glass Bottle 10% Formalin NA NA
(Samples kept for 5 years after processing)
*E.coli samples analyzed by SM 9223-B should always be processed as soon as possible and within 8 hours. When transport conditions necessitate delays in delivery, the holding time may be extended and samples must be processed as soon as possible and within 30 hours. 2Sulfate, Chloride, Nitrate and Nitrite are analyzed together using Ion Chromatography; the volume required is a total of 100 mLs, not 100 mLs per parameter 3Chlorophyll-a and pheophytin are analyzed together, the volume required is a total of 2000 mLs
Sample Containers Sample containers (cubitainers) are purchased pre-cleaned for conventional parameters and are disposable. Whirl-pak bags are used for bacteriological samples and have 1% sodium thiosulfate tablets added. Amber plastic bottles are used routinely for chlorophyll samples. Certificates are maintained in a notebook by the San Antonio River Authority or by the laboratory. Sample containers for sub-participants will be provided by the SARA-REL. Containers used for Chlorophyll-a and Pheophytin-a sample collection are cleaned between uses according to the following procedures.
1. Remove all labels and chain of custody seals from sample container (plastic amber bottles). 2. Add Contrad 70 solution, fill container with tap water, place lid on container and invert
container 3 times. 3. Soak containers for at least 15 minutes. 4. Empty containers and rinse with tap water and then rinse again with DI water. 5. Allow containers and lids to air dry. 6. Cap containers with lids and place a blank label on each container. 7. Containers are then stored for later use
Processes to Prevent Contamination Procedures outlined in SWQM Procedures outline the necessary steps to prevent contamination of samples. These include: direct collection into sample containers, when possible; use of certified containers for organics; and clean sampling techniques for metals. Field QC samples (identified in Section B5) are collected to verify that contamination has not occurred. Documentation of Field Sampling Activities Field sampling activities are documented on field data sheets (or actual name of the documents used to record field data) as presented in Appendix D. Flow worksheets, aquatic life use monitoring checklists, habitat assessment forms, field biological assessment forms, and records of bacteriological analyses (if applicable) are part of the field data record. Station ID
San Antonio River Authority QAPP Page 28 Last revised on August 21, 2015 finalfy1617crp qapp_sara-08212015.pdf
Sampling Date Location Sampling Depth Sampling Time Sample Collector’s name and signature Values for all field parameters Notes containing detailed observational data not captured by field parameters, including; Water appearance Weather Biological activity Recreational activity Unusual odors Pertinent observations related to water quality or stream uses Watershed or instream activities Specific sample information Missing parameters Recording Data For the purposes of this section and subsequent sections, all field and laboratory personnel follow the basic rules for recording information as documented below: • Write legibly, in indelible ink • Changes are made by crossing out original entries with a single line strike-out, entering the
changes, and initialing and dating the corrections. • Close-out incomplete pages with an initialed and dated diagonal line. Sampling Method Requirements or Sampling Process Design Deficiencies, and Corrective Action Examples of sampling method requirements or sample design deficiencies include but are not limited to such things as inadequate sample volume due to spillage or container leaks, failure to preserve samples appropriately, contamination of a sample bottle during collection, storage temperature and holding time exceedance, sampling at the wrong site, etc. Any deviations from the QAPP, SWQM Procedures, or appropriate sampling procedures may invalidate data, and require documented corrective action. Corrective action may include for samples to be discarded and re-collected. It is the responsibility of the San Antonio River Authority Project Manager, in consultation with the San Antonio River Authority QAO, to ensure that the actions and resolutions to the problems are documented and that records are maintained in accordance with this QAPP. In addition, these actions and resolutions will be conveyed to the CRP Project Manager both verbally and in writing in the project progress reports and by completion of a CAP. The definition of and process for handling deficiencies and corrective action are defined in Section C1.
San Antonio River Authority QAPP Page 29 Last revised on August 21, 2015 finalfy1617crp qapp_sara-08212015.pdf
B3 Sample Handling and Custody Sample Tracking Proper sample handling and custody procedures ensure the custody and integrity of samples beginning at the time of sampling and continuing through transport, sample receipt, preparation, and analysis. A sample is in custody if it is in actual physical possession or in a secured area that is restricted to authorized SARA personnel. The Chain of Custody (COC) form is a record that documents the possession of the samples from the time of collection to receipt in the laboratory. The following information concerning the sample is recorded on the COC form (See Appendix E). The following list of items matches the COC form in Appendix E. All COC forms to be used in the project should be included in Appendix E for the TCEQ’s review. Date and time of collection Site identification Sample matrix Number of containers Preservative used Was the sample filtered Analyses required Name of collector Custody transfer signatures and dates and time of transfer Bill of lading, if applicable Sample Labeling Samples from the field are labeled on the container, or on a label; with an indelible marker. Label information includes: Site identification Date and time of collection Preservative added, if applicable Indication of field-filtration for metals, as applicable Sample type (i.e., analyses) to be performed Sample Handling Water quality samples (conventional and bacteriological parameters) are collected according to procedures identified in TCEQ’s SOP, V1 - TCEQ Surface Water Quality Monitoring Procedures, Volume 1: Physical and Chemical Monitoring Methods, 2012. The field data sheet is filled out in the field when the sample is collected and the results of field parameters are posted on this sheet. This sheet also acts as the chain of custody for this sample and flow data collected. Samples requiring analysis that require acid preservation are collected in containers prepared for acid preserved sample collection prior to departing for the days sample collection. These containers are prepared by dispensing 2 mL of acid in the container at the beginning of the day. A Chain – of – Custody (COC) seal displaying the collector’s initials and date is affixed to the sample container and lid, the
San Antonio River Authority QAPP Page 30 Last revised on August 21, 2015 finalfy1617crp qapp_sara-08212015.pdf
sample container is labeled with a permanent water proof marker directly on the container and placed in an ice chest where they are covered with ice. Biological samples are collected according to TCEQ SOP, V2 - TCEQ Surface Water Quality Monitoring Procedures, Volume 2: Methods for Collecting and Analyzing Biological Community and Habitat Data, 2014. The Nekton voucher specimens and Benthic Macroinvertebrates are preserved in the field and placed in the ice chest for protection. The samples are transported in a SARA vehicle to the laboratory. Upon arrival at the laboratory, all samples and paperwork are relinquished to the sample custodian. The sample custodian accepts the sample, checking for any abnormalities in the sample (i.e. leakers, missing or torn COC seals, etc.) and notes any abnormalities at log in. The sample custodian also checks and documents the temperature of the samples using an infrared thermometer, and that all acid preserved samples are below 2 S.U. pH. Paperwork is examined for completeness and the sample custodian accepts the sample and documentation by signing the chain of custody (field data sheet) and also posting the date and time of acceptance. The sample custodian enters the sample information into the laboratory’s information management system and prints out one set of labels. Each sample container brought in, gets a label with a unique identification number. The water quality samples are then either given directly to an analyst, preparing to analyze the sample(s) immediately, or placed in a refrigerator in a secured (access is controlled through the use of programmed access cards) portion of the laboratory. The biological samples are returned to field staff for further processing, preservation and identification. Laboratory staff run backlog reports to identify samples that need to be analyzed and identify when sample hold time elapses. In the event that samples are outsourced to LCRA or GBRA the SARA Laboratory Services Coordinator will prepare the samples to be sent to the appropriate laboratory. A COC will be prepared to document the chain-of-custody of the sample(s) and the analysis that is requested.
San Antonio River Authority QAPP Page 31 Last revised on August 21, 2015 finalfy1617crp qapp_sara-08212015.pdf
Sample Tracking Procedure Deficiencies and Corrective Action All deficiencies associated with COC procedures, as described in this QAPP, are immediately reported to the San Antonio River Authority Project Manager. These include such items as delays in transfer resulting in holding time violations; violations of sample preservation requirements; incomplete documentation, including signatures; possible tampering of samples; broken or spilled samples, etc. The San Antonio River Authority Project Manager in consultation with the San Antonio River Authority QAO will determine if the procedural violation may have compromised the validity of the resulting data. Any failures that have reasonable potential to compromise data validity will invalidate data and the sampling event should be repeated. The resolution of the situation will be reported to the TCEQ CRP Project Manager in the project progress report. CAPs will be prepared by the Lead Organization QAO and submitted to TCEQ CRP Project Manager along with project progress report. The definition of and process for handling deficiencies and corrective action are defined in Section C1.
B4 Analytical Methods The analytical methods, associated matrices, and performing laboratories are listed in Appendix A. The authority for analysis methodologies under CRP is derived from the 30 Tex. Admin. Code ch. 307, in that data generally are generated for comparison to those standards and/or criteria. The Standards state “Procedures for laboratory analysis must be in accordance with the most recently published edition of the book entitled Standard Methods for the Examination of Water and Wastewater, the TCEQ Surface Water Quality Monitoring Procedures as amended, 40 CFR 136, or other reliable procedures acceptable to the TCEQ, and in accordance with chapter 25 of this title.” Laboratories that produce analytical data under this QAPP must be NELAP accredited in accordance with 30 TAC Chapter 25, Copies of laboratory QMs and SOPs are available for review by the TCEQ. Standards Traceability All standards used in the field and laboratory are traceable to certified reference materials. Standards preparation is fully documented and maintained in a standards log book. Each documentation includes information concerning the standard identification, starting materials, including concentration, amount used and lot number; date prepared, expiration date and preparer’s initials/signature. The reagent bottle is labeled in a way that will trace the reagent back to preparation. Analytical Method Deficiencies and Corrective Actions Deficiencies in field and laboratory measurement systems involve, but are not limited to such things as instrument malfunctions, failures in calibration, blank contamination, quality control samples outside QAPP defined limits, etc. In many cases, the field technician or lab analyst will be able to correct the problem. If the problem is resolvable by the field technician or lab analyst, then they will document the problem on the field data sheet or laboratory record and complete the analysis. If the problem is not resolvable, then it is conveyed to the San Antonio River Authority Laboratory Supervisor, who will make the determination and notify the San Antonio River Authority QAO. If the analytical system failure may compromise the sample results, the resulting data will not be reported to the TCEQ. The nature and disposition of the problem is reported on the data report which is sent
San Antonio River Authority QAPP Page 32 Last revised on August 21, 2015 finalfy1617crp qapp_sara-08212015.pdf
to the San Antonio River Authority Manager. The Lead Organization Project Manager will include this information in the CAP and submit with the Progress Report which is sent to the TCEQ CRP Project Manager. The definition of and process for handling deficiencies and corrective action are defined in Section C1. The TCEQ has determined that analyses associated with the qualifier codes (e.g., “holding time exceedance”, “sample received unpreserved”, “estimated value”) may have unacceptable measurement uncertainty associated with them. This will immediately disqualify analyses from submittal to SWQMIS. Therefore, data with these types of problems should not be reported to the TCEQ. Additionally, any data collected or analyzed by means other than those stated in the QAPP, or data suspect for any reason should not be submitted for loading and storage in SWQMIS. However, when data is lost, its absence will be described in the data summary report submitted with the corresponding data set, and a corrective action plan (as described in section C1) may be necessary.
B5 Quality Control Sampling Quality Control Requirements and Acceptability Criteria The minimum field QC requirements, and program-specific laboratory QC requirements, are outlined in SWQM Procedures. Specific requirements are outlined below. Field QC sample results are submitted with the laboratory data report (see Section A9.). Laboratory Measurement Quality Control Requirements and Acceptability Criteria Batch A batch is defined as environmental samples that are prepared and/or analyzed together with the same process and personnel, using the same lot(s) of reagents. A preparation batch is composed of one to 20 environmental samples of the same NELAP-defined matrix, meeting the above mentioned criteria and with a maximum time between the start of processing of the first and last sample in the batch to be 25 hours. An analytical batch is composed of prepared environmental samples (extract, digestates, or concentrates) which are analyzed together as a group. An analytical batch can include prepared samples originating from various environmental matrices and can exceed 20 samples. Method Specific QC requirements QC samples, other than those specified later this section, are run (e.g., sample duplicates, surrogates, internal standards, continuing calibration samples, interference check samples, positive control, negative control, and media blank) as specified in the methods and in SWQM Procedures. The requirements for these samples, their acceptance criteria or instructions for establishing criteria, and corrective actions are method-specific. Detailed laboratory QC requirements and corrective action procedures are contained within the individual laboratory quality manuals (QMs). The minimum requirements that all participants abide by are stated below. Comparison Counting For routine bacteriological samples, repeat counts on one or more positive samples are required, at
San Antonio River Authority QAPP Page 33 Last revised on August 21, 2015 finalfy1617crp qapp_sara-08212015.pdf
least monthly. If possible, compare counts with an analyst who also performs the analysis. Replicate counts by the same analyst should agree within 5 percent, and those between analysts should agree within 10 percent. Record the results. Limit of Quantitation (LOQ) The laboratory will analyze a calibration standard (if applicable) at the LOQ published in Appendix A, Table A7, on each day calibrations are performed. In addition, an LOQ check sample will be analyzed with each analytical batch. Calibrations including the standard at the LOQ listed in Appendix A Table A7.1-A7.9 will meet the calibration requirements of the analytical method or corrective action will be implemented. LOQ Check Sample An LOQ check sample consists of a sample matrix (e.g., deionized water, sand, commercially available tissue) free from the analytes of interest spiked with verified known amounts of analytes or a material containing known and verified amounts of analytes. It is used to establish intra-laboratory bias to assess the performance of the measurement system at the lower limits of analysis. The LOQ check sample is spiked into the sample matrix at a level less than or near the LOQ published in Appendix A, Table A7, for each analyte for each analytical batch of CRP samples run. If it is determined that samples have exceeded the high range of the calibration curve, samples should be diluted or run on another curve. For samples run on batches with calibration curves that do not include the LOQ published in Appendix A, A7.1-A7.9, a check sample will be run at the low end of the calibration curve. The LOQ check sample is carried through the complete preparation and analytical process. LOQ Check Samples are run at a rate of one per analytical batch. The percent recovery of the LOQ check sample is calculated using the following equation in which %R is percent recovery, SR is the sample result, and SA is the reference concentration for the check sample:
%𝑅𝑅 = 𝑆𝑆𝑅𝑅 𝑆𝑆𝐴𝐴� × 100
Measurement performance specifications are used to determine the acceptability of LOQ Check Sample analyses as specified in Appendix A Table A7.1-A7.9. Laboratory Control Sample (LCS) An LCS consists of a sample matrix (e.g., deionized water, sand, commercially available tissue) free from the analytes of interest spiked with verified known amounts of analytes or a material containing known and verified amounts of analytes. It is used to establish intra-laboratory bias to assess the performance of the measurement system. The LCS is spiked into the sample matrix at a level less than or near the midpoint of the calibration for each analyte. In cases of test methods with very long lists of analytes, LCSs are prepared with all the target analytes and not just a representative number, except in cases of organic analytes with multipeak responses. The LCS is carried through the complete preparation and analytical process. LCSs are run at a rate of
San Antonio River Authority QAPP Page 34 Last revised on August 21, 2015 finalfy1617crp qapp_sara-08212015.pdf
one per preparation batch. Results of LCSs are calculated by percent recovery (%R), which is defined as 100 times the measured concentration, divided by the true concentration of the spiked sample. The following formula is used to calculate percent recovery, where %R is percent recovery; SR is the measured result; and SA is the true result:
%𝑅𝑅 = 𝑆𝑆𝑅𝑅 𝑆𝑆𝐴𝐴� × 100
Measurement performance specifications are used to determine the acceptability of LCS analyses as specified in Appendix A Table A7.1-A7.9. Laboratory Duplicates A laboratory duplicate is an aliquot taken from the same container as an original sample under laboratory conditions and processed and analyzed independently. A laboratory duplicate is prepared in the laboratory by splitting aliquots of an LCS. Both samples are carried through the entire preparation and analytical process. Laboratory duplicates are used to assess precision and are performed at a rate of one per preparation batch. For most parameters except bacteria, precision is evaluated using the relative percent difference (RPD) between duplicate LCS results as defined by 100 times the difference (range) of each duplicate set, divided by the average value (mean) of the set. For duplicate results, X1 and X2, the RPD is calculated from the following equation:
𝑅𝑅𝑅𝑅𝑅𝑅 = |𝑋𝑋1 − 𝑋𝑋2|
�𝑋𝑋1 + 𝑋𝑋22 �
× 100
For bacteriological parameters, precision is evaluated using the results from laboratory duplicates. Bacteriological duplicates are collected on a 10% frequency (or once per sampling run, whichever is more frequent). These duplicates will be collected in sufficient volume for analysis of the sample and its laboratory duplicate from the same container. The base-10 logarithms of the result from the original sample and the result from its duplicate will be calculated. The absolute value of the difference between the two logarithms will be calculated, and that difference will be compared to the precision criterion in Appendix A, Table A7.1-A7.9. If the difference in logarithms is greater than the precision criterion, the data are not acceptable for use under this project and will not be reported to TCEQ. Results from all samples associated with that failed duplicate (usually a maximum of 10 samples) will be considered to have excessive analytical variability and will be qualified as not meeting project QC requirements. The precision criterion in Appendix A Table A7.1-A7.9 for bacteriological duplicates applies only to samples/sample duplicates with concentrations > 10 MPN. Field splits will not be collected for
San Antonio River Authority QAPP Page 35 Last revised on August 21, 2015 finalfy1617crp qapp_sara-08212015.pdf
bacteriological analyses. Matrix spike (MS) – Matrix spikes are prepared by adding a known quantity of target analyte to a specified amount of matrix sample for which an independent estimate of target analyte concentration is available. Matrix spikes indicate the effect of the sample on the precision and accuracy of the results generated using the selected method. The frequency of matrix spikes is specified by the analytical method, or a minimum of one per preparation batch, whichever is greater. To the extent possible, matrix spikes prepared and analyzed over the course of the project should be performed on samples from different sites. The components to be spiked shall be as specified by the mandated analytical method. The results from matrix spikes are primarily designed to assess the validity of analytical results in a given matrix, and are expressed as percent recovery (%R). The percent recovery of the matrix spike is calculated using the following equation, where %R is percent recovery, SSR is the concentration measured in the matrix spike, SR is the concentration in the parent sample, and SA is the concentration of analyte that was added:
%𝑅𝑅 = 𝑆𝑆𝑆𝑆𝑅𝑅 − 𝑆𝑆𝑅𝑅
𝑆𝑆𝐴𝐴× 100
Matrix spike recoveries are compared to the same acceptance criteria established for the associated LCS recoveries, rather than the matrix spike recoveries published in the mandated test method. The EPA 1993 methods (i.e. ammonia-nitrogen, ion chromatography, TKN) that establish matrix spike recovery acceptance criteria are based on recoveries from drinking water that has very low interferences and variability and do not represent the matrices sampled in the CRP. If the matrix spike results are outside laboratory-established criteria, there will be a review of all other associated quality control data in that batch. If all of quality control data in the associated batch passes, it will be the decision of the laboratory QAO or San Antonio River Authority Project Manager to report the data for the analyte that failed in the parent sample to TCEQ or to determine that the result from the parent sample associated with that failed matrix spike is considered to have excessive analytical variability and does not meet project QC requirements. Depending on the similarities in composition of the samples in the batch, the San Antonio River Authority may consider excluding all of the results in the batch related to the analyte that failed recovery. Method blank A method blank is a sample of matrix similar to the batch of associated samples (when available) that is free from the analytes of interest and is processed simultaneously with and under the same conditions as the samples through all steps of the analytical procedures, and in which no target analytes or interferences are present at concentrations that impact the analytical results for sample analyses. The method blanks are performed at a rate of once per preparation batch. The method blank is used to document contamination from the analytical process. The analysis of method blanks should yield values less than the LOQ. For very high-level analyses, the blank value should be less
San Antonio River Authority QAPP Page 36 Last revised on August 21, 2015 finalfy1617crp qapp_sara-08212015.pdf
than 5% of the lowest value of the batch, or corrective action will be implemented. Samples associated with a contaminated blank shall be evaluated as to the best corrective action for the samples (e.g. reprocessing, data qualifying codes). In all cases the corrective action must be documented. The method blank shall be analyzed at a minimum of one per preparation batch. In those instances for which no separate preparation method is used (e.g., VOA) the batch shall be defined as environmental samples that are analyzed together with the same method and personnel, using the same lots of reagents, not to exceed the analysis of 20 environmental samples. Quality Control or Acceptability Requirements Deficiencies and Corrective Actions Sampling QC excursions are evaluated by the Lead Organization Project Manager, in consultation with the Lead Organization QAO. In that differences in sample results are used to assess the entire sampling process, including environmental variability, the arbitrary rejection of results based on pre-determined limits is not practical. Therefore, the professional judgment of the San Antonio River Authority Project Manager and QAO will be relied upon in evaluating results. Rejecting sample results based on wide variability is a possibility. Field blanks for trace elements and trace organics are scrutinized very closely. Field blank values exceeding the acceptability criteria will automatically invalidate the sample. Notations of blank contamination are noted in the quarterly report and the final QC Report. Equipment blanks for metals analysis are also scrutinized very closely. Laboratory measurement quality control failures are evaluated by the laboratory staff. The disposition of such failures and the nature and disposition of the problem is reported to the San Antonio River Authority Laboratory QAO. The Laboratory QAO will discuss with the San Antonio River Authority Project Manager. If applicable, the San Antonio River Authority Project Manager will include this information in the CAP and submit with the Progress Report which is sent to the TCEQ CRP Project Manager. The definition of and process for handling deficiencies and corrective action are defined in Section C1.
B6 Instrument/Equipment Testing, Inspection, and Maintenance All sampling equipment testing and maintenance requirements are detailed in the SWQM Procedures. Sampling equipment is inspected and tested upon receipt and is assured appropriate for use. Equipment records are kept on all field equipment and a supply of critical spare parts is maintained. All laboratory tools, gauges, instrument, and equipment testing and maintenance requirements are contained within laboratory QM(s). Testing and maintenance records are maintained and are available for inspection by the TCEQ. Instruments requiring daily or in-use testing include, but are not limited to, water baths, ovens, autoclaves, incubators, refrigerators and laboratory pure water.
San Antonio River Authority QAPP Page 37 Last revised on August 21, 2015 finalfy1617crp qapp_sara-08212015.pdf
B7 Instrument Calibration and Frequency Field equipment calibration requirements are contained in the SWQM Procedures. Post-calibration error limits and the disposition resulting from error are adhered to. Data collected from field instruments that do not meet the post-calibration error limits specified in the SWQM Procedures will not be submitted for inclusion into SWQMIS. Detailed laboratory calibrations are contained within the QM(s).
B8 Inspection/Acceptance of Supplies and Consumables Inspection and acceptance of supplies and consumables is done by the analyst/technician ordering the supplies. SARA has found that the best person to determine if the supplies are acceptable for use in the laboratory or field is the individual responsible for the analysis.
B9 Acquired Data Non-directly measured data, secondary data, or acquired data involves the use of data collected under another project, and collected with a different intended use than this project. The acquired data still meets the quality requirements of this project, and is defined below. The following data source(s) will be used for this project: USGS gage station data will be used throughout this project to aid in determining gage height and flow. Rigorous QA checks are completed on gage data by the USGS and the data are approved by the USGS and permanently stored at the USGS. This data will be submitted to the TCEQ under parameter code 00061 Flow, Instantaneous or parameter code 74069 Flow Estimate depending on the proximity of the monitoring station to the USGS gage station.
B10 Data Management Data Management Process Figure B10.1 is a flow chart identifying the flow of the data at SARA from collection to sending the information to the TCEQ. Although the flow chart may not identify it, at any point in the review of data, the reviewer can send the data back up to the prior level for additional work, or documentation. Field measurements and data collections are performed according to SWQM Procedures Manuals (RG-415 and RG-416). Analytical data from back-up laboratories is entered in to the SARA LIMS and the laboratory that performed the analysis is identified on the analytical reports. Analytical results are reviewed prior to validation. Analytical reports from back-up laboratories are scanned and filed according to the schedule in Table A9.1
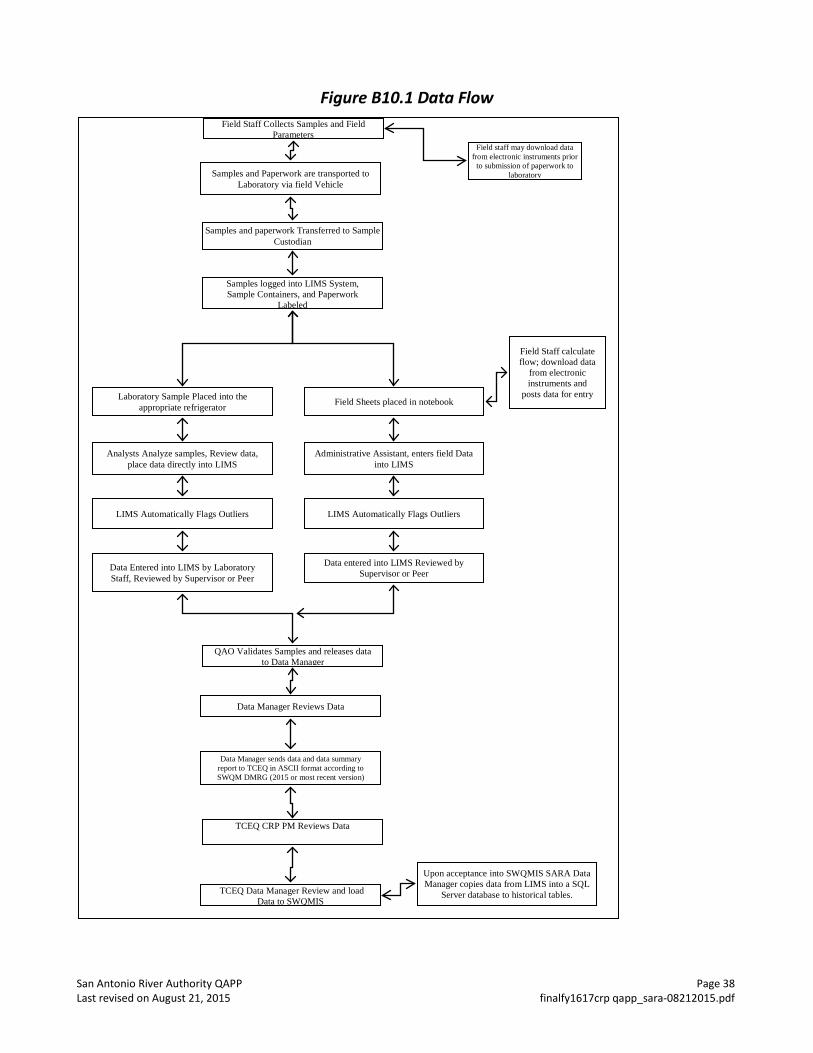
San Antonio River Authority QAPP Page 38 Last revised on August 21, 2015 finalfy1617crp qapp_sara-08212015.pdf
Figure B10.1 Data Flow
Field Staff Collects Samples and Field Parameters
Samples and Paperwork are transported to Laboratory via field Vehicle
Samples and paperwork Transferred to Sample Custodian
Samples logged into LIMS System, Sample Containers, and Paperwork
Labeled
Laboratory Sample Placed into the appropriate refrigerator Field Sheets placed in notebook
Field Staff calculate flow; download data
from electronic instruments and
posts data for entry
Analysts Analyze samples, Review data, place data directly into LIMS
Administrative Assistant, enters field Data into LIMS
LIMS Automatically Flags Outliers LIMS Automatically Flags Outliers
Data Entered into LIMS by Laboratory Staff, Reviewed by Supervisor or Peer
Data entered into LIMS Reviewed by Supervisor or Peer
QAO Validates Samples and releases data to Data Manager
Data Manager Reviews Data
Data Manager sends data and data summary report to TCEQ in ASCII format according to SWQM DMRG (2015 or most recent version)
TCEQ CRP PM Reviews Data
TCEQ Data Manager Review and load Data to SWQMIS
Upon acceptance into SWQMIS SARA Data Manager copies data from LIMS into a SQL
Server database to historical tables.
Field staff may download data from electronic instruments prior
to submission of paperwork to laboratory
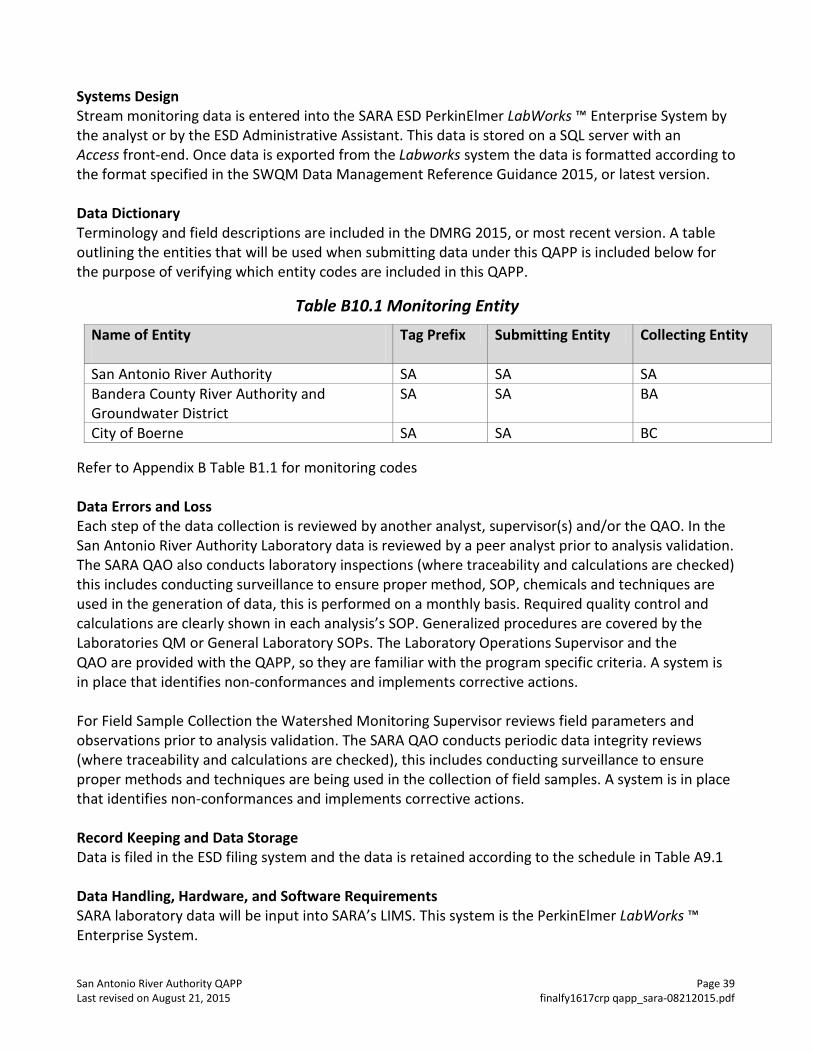
San Antonio River Authority QAPP Page 39 Last revised on August 21, 2015 finalfy1617crp qapp_sara-08212015.pdf
Systems Design Stream monitoring data is entered into the SARA ESD PerkinElmer LabWorks ™ Enterprise System by the analyst or by the ESD Administrative Assistant. This data is stored on a SQL server with an Access front-end. Once data is exported from the Labworks system the data is formatted according to the format specified in the SWQM Data Management Reference Guidance 2015, or latest version. Data Dictionary Terminology and field descriptions are included in the DMRG 2015, or most recent version. A table outlining the entities that will be used when submitting data under this QAPP is included below for the purpose of verifying which entity codes are included in this QAPP.
Table B10.1 Monitoring Entity Name of Entity
Tag Prefix Submitting Entity Collecting Entity
San Antonio River Authority SA SA SA Bandera County River Authority and Groundwater District
SA SA BA
City of Boerne SA SA BC Refer to Appendix B Table B1.1 for monitoring codes Data Errors and Loss Each step of the data collection is reviewed by another analyst, supervisor(s) and/or the QAO. In the San Antonio River Authority Laboratory data is reviewed by a peer analyst prior to analysis validation. The SARA QAO also conducts laboratory inspections (where traceability and calculations are checked) this includes conducting surveillance to ensure proper method, SOP, chemicals and techniques are used in the generation of data, this is performed on a monthly basis. Required quality control and calculations are clearly shown in each analysis’s SOP. Generalized procedures are covered by the Laboratories QM or General Laboratory SOPs. The Laboratory Operations Supervisor and the QAO are provided with the QAPP, so they are familiar with the program specific criteria. A system is in place that identifies non-conformances and implements corrective actions. For Field Sample Collection the Watershed Monitoring Supervisor reviews field parameters and observations prior to analysis validation. The SARA QAO conducts periodic data integrity reviews (where traceability and calculations are checked), this includes conducting surveillance to ensure proper methods and techniques are being used in the collection of field samples. A system is in place that identifies non-conformances and implements corrective actions. Record Keeping and Data Storage Data is filed in the ESD filing system and the data is retained according to the schedule in Table A9.1 Data Handling, Hardware, and Software Requirements SARA laboratory data will be input into SARA’s LIMS. This system is the PerkinElmer LabWorks ™ Enterprise System.
San Antonio River Authority QAPP Page 40 Last revised on August 21, 2015 finalfy1617crp qapp_sara-08212015.pdf
The SARA LIMS relies heavily on Microsoft SQL databases and Excel spreadsheets. The actual data is housed in a SQL server with an Access front end. Once the data is ready to be submitted to TCEQ for upload in to SWQMIS the data is formatted according to the format specified in the SWQM Data Management Reference Guide, 2015, or most recent version. See Migration/Transfer/Conversion section for specifics on how data is formatted for TCEQ SWQMIS requirements. Information Resource Management Requirements The Data Manager is familiar with the TCEQ’s data management reference guide, and follows the processes described in the document. The work of the Data Manager is reviewed by the SARA QAO, SARA Environmental Systems information Specialist, TCEQ Project Manager and may be audited by the TCEQ as part of the field audit. The TCEQ uses the TCEQ CRP Program Data Review Checklist. If deficiencies or non-conformances are identified in the audit, the condition is addressed and a corrective action memo outlining the steps taken is sent to the SARA Project Manager for their approval. Data will be managed in accordance with the DMRG 2015 or most recent version, and applicable San Antonio River Authority information resource management policies. GPS equipment may be used as a component of the information required by the Station Location (SLOC) request process for creating the certified positional data that will ultimately be entered into SWQMIS database. Positional data obtained by CRP grantees using a GPS will follow the TCEQ’s OPP 8.11 and 8.12 policy regarding the collection and management of positional data. All positional data entered into SWQMIS will be collected by a GPS certified individual with an agency approved GPS device to ensure that the agency receives reliable and accurate positional data. Certification can be obtained in any of three ways: completing a TCEQ training class, completing a suitable training class offered by an outside vendor, or by providing documentation of sufficient GPS expertise and experience. Contractors must agree to adhere to relevant TCEQ policies when entering GPS-collected data. In lieu of entering certified GPS coordinates, positional data may be acquired with a GPS and verified with photo interpolation using a certified source, such as Google Earth or Google Maps. The verified coordinates and map interface can then be used to develop a new SLOC. Quality Assurance Quality Control – See Section D of this QAPP Migration/Transfer/Conversion Data collected under this QAPP is entered in the SARA Laboratory Information Management System (LIMS) and will be identified with a unique tag id. Views have been created and will be run, using a Microsoft Access front-end (Access project or .adp), to capture required data from LIMS. Automated data checks will be performed on the views using a
San Antonio River Authority QAPP Page 41 Last revised on August 21, 2015 finalfy1617crp qapp_sara-08212015.pdf
SQL Server Enterprise Manager script created by the Information Technology (IT) Department. Data is exported, in the required pipe delimited format as detailed in the SWQM Data Management Reference Guide, 2015, or latest revision, using a Microsoft SQL Server Data Transformation (DTS) Package also created by the SARA IT Department. Upon acceptance of a data deliverable, by the TCEQ SWQMIS database system, the Data Manager staff or the IT Department will copy out the data from the LIMS using scripts and a DTS package to similarly formatted historical tables. Historical tables can be viewed and queried on by the Data Manager for internal and external use. Upon request, the related sections of the data dictionary will be sent with the data.
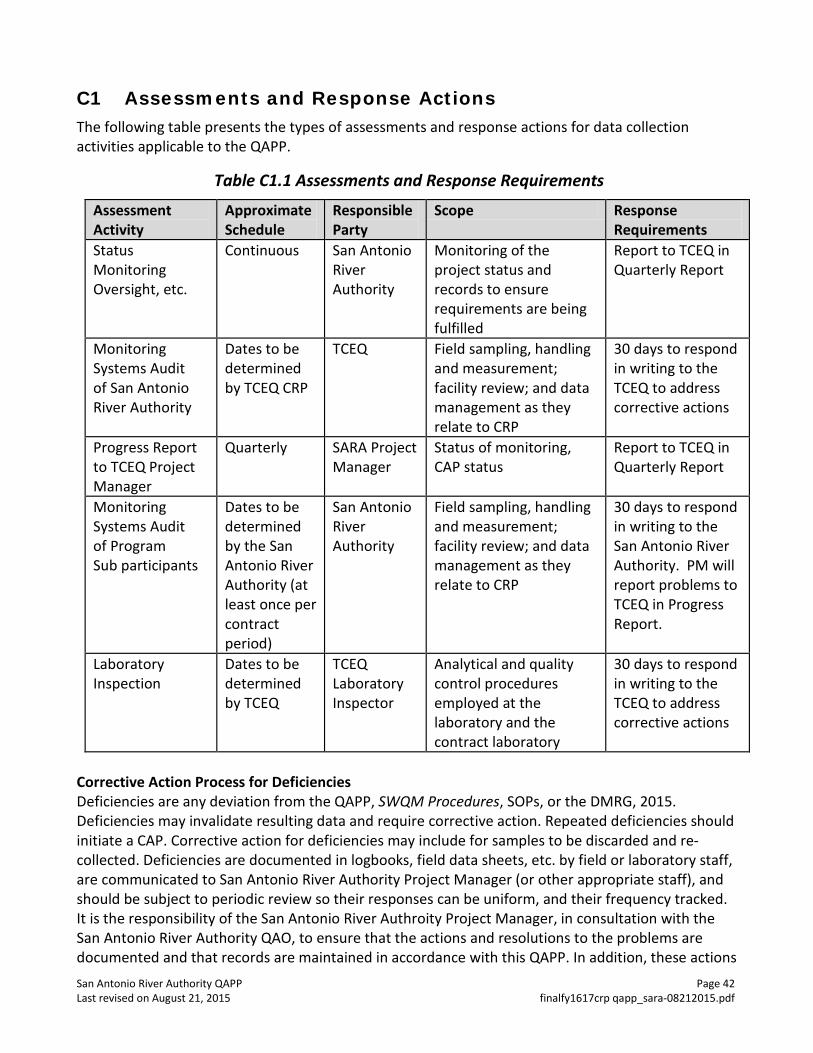
San Antonio River Authority QAPP Page 42 Last revised on August 21, 2015 finalfy1617crp qapp_sara-08212015.pdf
C1 Assessments and Response Actions The following table presents the types of assessments and response actions for data collection activities applicable to the QAPP.
Table C1.1 Assessments and Response Requirements
Assessment Activity
Approximate Schedule
Responsible Party
Scope Response Requirements
Status Monitoring Oversight, etc.
Continuous San Antonio River Authority
Monitoring of the project status and records to ensure requirements are being fulfilled
Report to TCEQ in Quarterly Report
Monitoring Systems Audit of San Antonio River Authority
Dates to be determined by TCEQ CRP
TCEQ Field sampling, handling and measurement; facility review; and data management as they relate to CRP
30 days to respond in writing to the TCEQ to address corrective actions
Progress Report to TCEQ Project Manager
Quarterly SARA Project Manager
Status of monitoring, CAP status
Report to TCEQ in Quarterly Report
Monitoring Systems Audit of Program Sub participants
Dates to be determined by the San Antonio River Authority (at least once per contract period)
San Antonio River Authority
Field sampling, handling and measurement; facility review; and data management as they relate to CRP
30 days to respond in writing to the San Antonio River Authority. PM will report problems to TCEQ in Progress Report.
Laboratory Inspection
Dates to be determined by TCEQ
TCEQ Laboratory Inspector
Analytical and quality control procedures employed at the laboratory and the contract laboratory
30 days to respond in writing to the TCEQ to address corrective actions
Corrective Action Process for Deficiencies Deficiencies are any deviation from the QAPP, SWQM Procedures, SOPs, or the DMRG, 2015. Deficiencies may invalidate resulting data and require corrective action. Repeated deficiencies should initiate a CAP. Corrective action for deficiencies may include for samples to be discarded and re-collected. Deficiencies are documented in logbooks, field data sheets, etc. by field or laboratory staff, are communicated to San Antonio River Authority Project Manager (or other appropriate staff), and should be subject to periodic review so their responses can be uniform, and their frequency tracked. It is the responsibility of the San Antonio River Authroity Project Manager, in consultation with the San Antonio River Authority QAO, to ensure that the actions and resolutions to the problems are documented and that records are maintained in accordance with this QAPP. In addition, these actions
San Antonio River Authority QAPP Page 43 Last revised on August 21, 2015 finalfy1617crp qapp_sara-08212015.pdf
and resolutions will be conveyed to the CRP Project Manager both verbally and in writing in the project progress reports and by completion of a CAP. SARA documents deficiencies through the use of an electronic notification system which automatically notifies pertinent SARA staff of the incident (Non-Conformance Reporting System). The SARA QAO then investigates and determines what type of action is needed in consultation with the San Antonio River Authority Project Manager. Corrective Action plans will be submitted to the SARA Project Manager along with the Non-Conformance report for inclusion with the progress report. Corrective Action CAPs should: • Identify the problem, nonconformity, or undesirable situation • Identify immediate remedial actions if possible • Identify the underlying cause(s) of the problem • Identify whether the problem is likely to recur, or occur in other areas • Evaluate the need for corrective action • Use problem-solving techniques to verify causes, determine solution, and develop an action plan • Identify personnel responsible for action • Establish timelines and provide a schedule • Document the corrective action To facilitate the process a flow chart has been developed (see figure C1.1: Corrective Action Process for Deficiencies). This will be used as a guide by the SARA QAO in addressing issues that may affect data quality. The San Antonio River Authority’s ESD Non-conformance Reporting (NCR) System incorporates determination of the root cause of a non-conformance as well as how the incident is handled and how it can be prevented in the future. The ESD NCR system documents all of these steps including the follow-up monitoring performed by the SARA QAO. The NCR reports will be forwarded to the SARA Project Manager, as necessary.
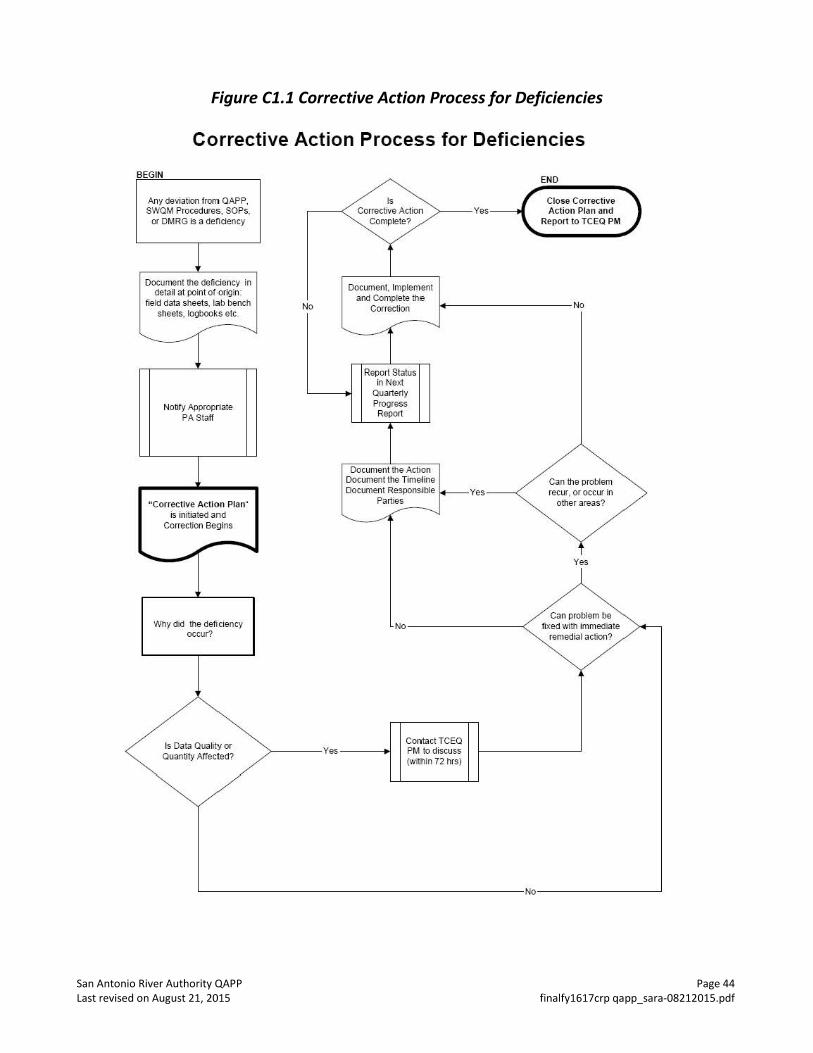
San Antonio River Authority QAPP Page 44 Last revised on August 21, 2015 finalfy1617crp qapp_sara-08212015.pdf
Figure C1.1 Corrective Action Process for Deficiencies
Corrective Action Process for Deficiencies
BEGIN
Any deviation from QAPP, SWOM Procedures , SOPs,
or DMRG is a deficiency
Document the deficiency in detail at point of oQrigin:
field data sheets, lab bench sheets, logl>ooks etc.
Notify Appropriate PAStaff
"Corrective Action Plan" is inijiated and
Correction Begins
Why did the deficiency occur?
Is Data Qualijy or Quantity Affected?
END
Close Corrective Action Plan and
Report to TCEQ PM
No
Document, Implement and Complete the
Correction ~------------------No
Report Status in Next Quarte~y
Progress Report
Document the Action Document the Timeline
Yes Can the problem recur. or occur in
other areas?
Yes
Can problem be No fixed with immediate
COiltact TCEQ >-----Yes PM to discuss
(witl1in 72 hrs)
remedial action?
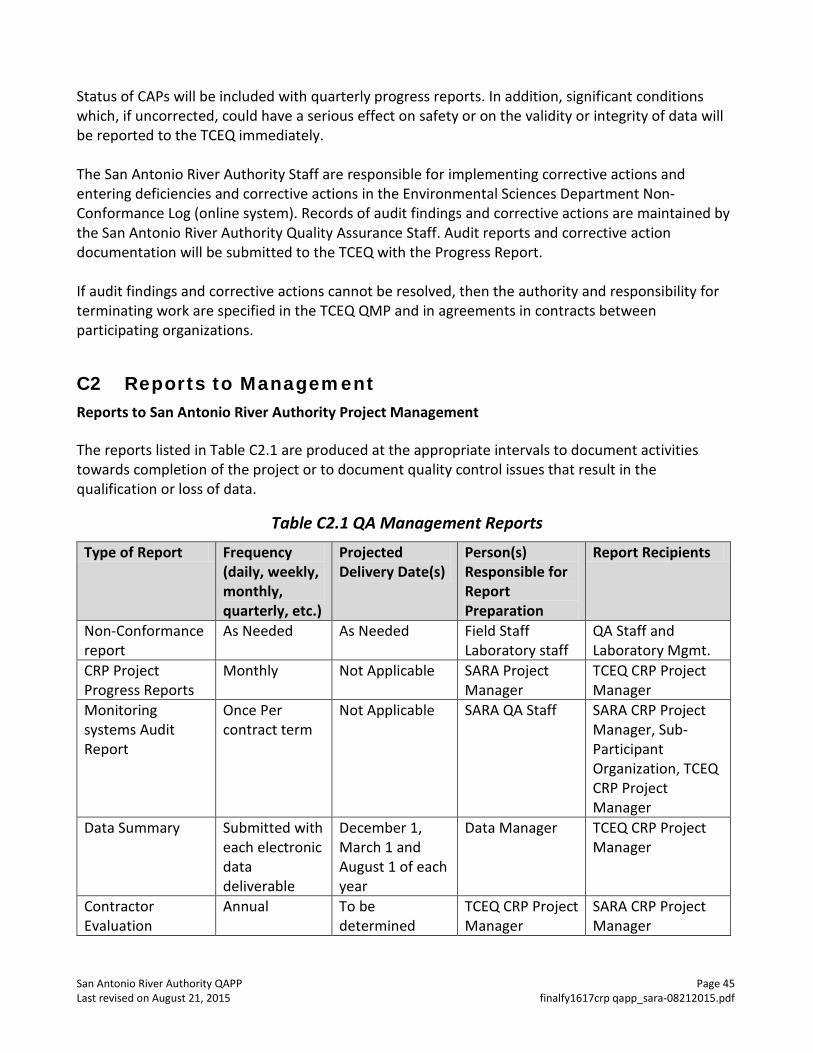
San Antonio River Authority QAPP Page 45 Last revised on August 21, 2015 finalfy1617crp qapp_sara-08212015.pdf
Status of CAPs will be included with quarterly progress reports. In addition, significant conditions which, if uncorrected, could have a serious effect on safety or on the validity or integrity of data will be reported to the TCEQ immediately. The San Antonio River Authority Staff are responsible for implementing corrective actions and entering deficiencies and corrective actions in the Environmental Sciences Department Non-Conformance Log (online system). Records of audit findings and corrective actions are maintained by the San Antonio River Authority Quality Assurance Staff. Audit reports and corrective action documentation will be submitted to the TCEQ with the Progress Report. If audit findings and corrective actions cannot be resolved, then the authority and responsibility for terminating work are specified in the TCEQ QMP and in agreements in contracts between participating organizations.
C2 Reports to Management Reports to San Antonio River Authority Project Management The reports listed in Table C2.1 are produced at the appropriate intervals to document activities towards completion of the project or to document quality control issues that result in the qualification or loss of data.
Table C2.1 QA Management Reports
Type of Report Frequency (daily, weekly, monthly, quarterly, etc.)
Projected Delivery Date(s)
Person(s) Responsible for Report Preparation
Report Recipients
Non-Conformance report
As Needed As Needed Field Staff Laboratory staff
QA Staff and Laboratory Mgmt.
CRP Project Progress Reports
Monthly Not Applicable SARA Project Manager
TCEQ CRP Project Manager
Monitoring systems Audit Report
Once Per contract term
Not Applicable SARA QA Staff SARA CRP Project Manager, Sub-Participant Organization, TCEQ CRP Project Manager
Data Summary Submitted with each electronic data deliverable
December 1, March 1 and August 1 of each year
Data Manager TCEQ CRP Project Manager
Contractor Evaluation
Annual To be determined
TCEQ CRP Project Manager
SARA CRP Project Manager
San Antonio River Authority QAPP Page 46 Last revised on August 21, 2015 finalfy1617crp qapp_sara-08212015.pdf
Reports by SARA All reports detailed in this section are completed by SARA staff and either submitted to SARA QA Staff or SARA CRP Project Manager as appropriate. Non Conformance Reports – Are submitted electronically to track non-conformances with samples collection and laboratory analyses. SARA QA Staff investigate and determine the proper course of action to take. Issues that require corrective action to address loss of data Reports to TCEQ Project Management All reports detailed in this section are contract deliverables and are transferred to the TCEQ in accordance with contract requirements. Progress Report - Summarizes the San Antonio River Authority’s activities for each task; reports monitoring status, problems, delays, and status of corrective actions; and outlines the status of each task’s deliverables. Monitoring Systems Audit Report and Response - Following any audit performed by the San Antonio River Authority, a report of findings, recommendations and response is sent to the TCEQ in the quarterly progress report. Data Summary – Contains basic identifying information about the data set and comments regarding inconsistencies and errors identified during data verification and validation steps or problems with data collection efforts (e.g. Deficiencies). Reports by TCEQ Project Management Contractor Evaluation - The San Antonio River Authority participates in a Contractor Evaluation by the TCEQ annually for compliance with administrative and programmatic standards. Results of the evaluation are submitted to the TCEQ Financial Administration Division, Procurement and Contracts Section.
San Antonio River Authority QAPP Page 47 Last revised on August 21, 2015 finalfy1617crp qapp_sara-08212015.pdf
D1 Data Review, Verification, and Validation All field and laboratory data will be reviewed and verified for integrity and continuity, reasonableness, and conformance to project requirements, and then validated against the project objectives and measurement performance specifications which are listed in Section A7. Only those data which are supported by appropriate quality control data and meet the measurement performance specifications defined for this project will be considered acceptable, and will be reported to the TCEQ for entry into SWQMIS.
D2 Verification and Validation Methods All field and laboratory data will be reviewed, verified and validated to ensure they conform to project specifications and meet the conditions of end use as described in Section A7 of this document. Data review, verification, and validation will be performed using self-assessments and peer and management review as appropriate to the project task. The data review tasks to be performed by field and laboratory staff is listed in the first two columns of Table D2.1, respectively. Potential errors are identified by examination of documentation and by manual, examination of corollary or unreasonable data, or computer-assisted. If a question arises or an error is identified, the manager of the task responsible for generating the data is contacted to resolve the issue. Issues which can be corrected are corrected and documented. If an issue cannot be corrected, the task manager consults with the higher level project management to establish the appropriate course of action, or the data associated with the issue are rejected and not reported to the TCEQ for storage in SWQMIS. Field and laboratory reviews, verifications, and validations are documented. After the field and laboratory data are reviewed, another level of review is performed once the data are combined into a data set. This review step as specified in Table D2.1 is performed by the San Antonio River Authority Data Manager and QAO. Data review, verification, and validation tasks to be performed on the data set include, but are not limited to, the confirmation of laboratory and field data review, evaluation of field QC results, additional evaluation of anomalies and outliers, analysis of sampling and analytical gaps, and confirmation that all parameters and sampling sites are included in the QAPP. The Data Review Checklist (See Appendix E) covers three main types of review: data format and structure, data quality review, and documentation review. The Data Review Checklist is transferred with the water quality data submitted to the TCEQ to ensure that the review process is being performed. Another element of the data validation process is consideration of any findings identified during the monitoring systems audit conducted by the TCEQ CRP Lead Quality Assurance Specialist. Any issues requiring corrective action must be addressed, and the potential impact of these issues on previously collected data will be assessed. After the data are reviewed and documented, the San Antonio River Authority Project Manager validates that the data meet the data quality objectives of the project and are suitable for reporting to TCEQ.
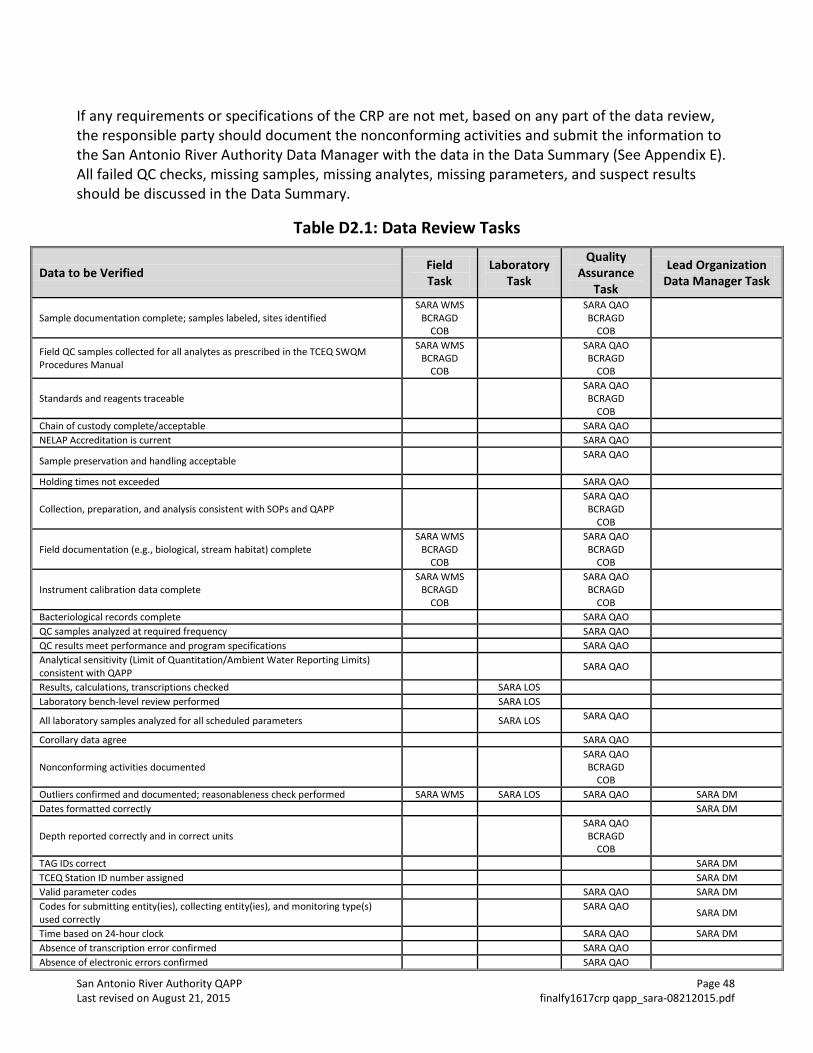
San Antonio River Authority QAPP Page 48 Last revised on August 21, 2015 finalfy1617crp qapp_sara-08212015.pdf
If any requirements or specifications of the CRP are not met, based on any part of the data review, the responsible party should document the nonconforming activities and submit the information to the San Antonio River Authority Data Manager with the data in the Data Summary (See Appendix E). All failed QC checks, missing samples, missing analytes, missing parameters, and suspect results should be discussed in the Data Summary.
Table D2.1: Data Review Tasks
Data to be Verified Field Task
Laboratory Task
Quality Assurance
Task
Lead Organization Data Manager Task
Sample documentation complete; samples labeled, sites identified SARA WMS
BCRAGD COB
SARA QAO BCRAGD
COB
Field QC samples collected for all analytes as prescribed in the TCEQ SWQM Procedures Manual
SARA WMS BCRAGD
COB
SARA QAO BCRAGD
COB
Standards and reagents traceable SARA QAO BCRAGD
COB
Chain of custody complete/acceptable SARA QAO NELAP Accreditation is current SARA QAO
Sample preservation and handling acceptable SARA QAO
Holding times not exceeded SARA QAO
Collection, preparation, and analysis consistent with SOPs and QAPP SARA QAO BCRAGD
COB
Field documentation (e.g., biological, stream habitat) complete SARA WMS
BCRAGD COB
SARA QAO BCRAGD
COB
Instrument calibration data complete SARA WMS
BCRAGD COB
SARA QAO BCRAGD
COB
Bacteriological records complete SARA QAO QC samples analyzed at required frequency SARA QAO QC results meet performance and program specifications SARA QAO Analytical sensitivity (Limit of Quantitation/Ambient Water Reporting Limits) consistent with QAPP SARA QAO
Results, calculations, transcriptions checked SARA LOS Laboratory bench-level review performed SARA LOS
All laboratory samples analyzed for all scheduled parameters SARA LOS SARA QAO
Corollary data agree SARA QAO
Nonconforming activities documented SARA QAO BCRAGD
COB
Outliers confirmed and documented; reasonableness check performed SARA WMS SARA LOS SARA QAO SARA DM Dates formatted correctly SARA DM
Depth reported correctly and in correct units SARA QAO BCRAGD
COB
TAG IDs correct SARA DM TCEQ Station ID number assigned SARA DM Valid parameter codes SARA QAO SARA DM Codes for submitting entity(ies), collecting entity(ies), and monitoring type(s) used correctly SARA QAO
SARA DM
Time based on 24-hour clock SARA QAO SARA DM Absence of transcription error confirmed SARA QAO Absence of electronic errors confirmed SARA QAO
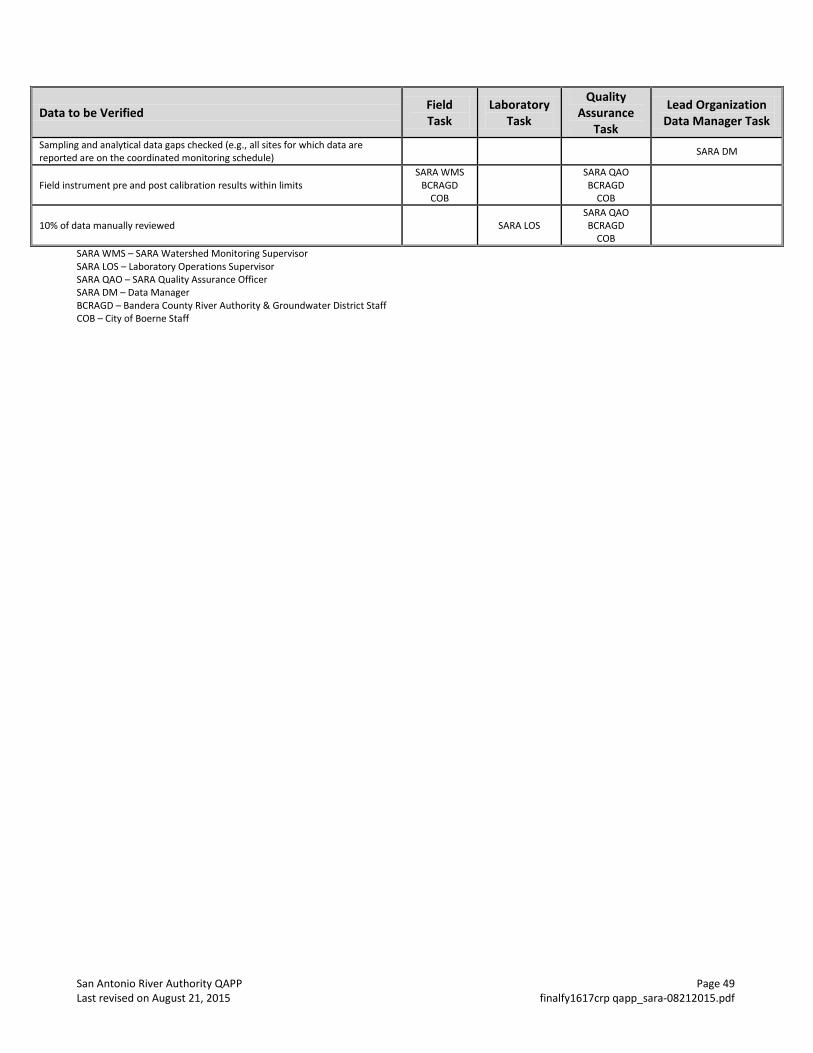
San Antonio River Authority QAPP Page 49 Last revised on August 21, 2015 finalfy1617crp qapp_sara-08212015.pdf
Data to be Verified Field Task
Laboratory Task
Quality Assurance
Task
Lead Organization Data Manager Task
Sampling and analytical data gaps checked (e.g., all sites for which data are reported are on the coordinated monitoring schedule) SARA DM
Field instrument pre and post calibration results within limits SARA WMS
BCRAGD COB
SARA QAO BCRAGD
COB
10% of data manually reviewed SARA LOS SARA QAO BCRAGD
COB
SARA WMS – SARA Watershed Monitoring Supervisor SARA LOS – Laboratory Operations Supervisor SARA QAO – SARA Quality Assurance Officer SARA DM – Data Manager BCRAGD – Bandera County River Authority & Groundwater District Staff COB – City of Boerne Staff
San Antonio River Authority QAPP Page 50 Last revised on August 21, 2015 finalfy1617crp qapp_sara-08212015.pdf
D3 Reconciliation with User Requirements Data produced in this project, and data collected by other organizations (e.g., USGS, TCEQ, etc.), will be analyzed and reconciled with project data quality requirements. Data meeting project requirements will be used by the TCEQ for the Texas Water Quality Integrated Report in accordance with TCEQ’s Guidance for Assessing and Reporting Surface Water Quality in Texas, August 2012 or most recent version, and for TMDL development, water quality standards development, and permit decisions, as appropriate. Data which do not meet requirements will not be submitted to SWQMIS nor will be considered appropriate for any of the uses noted above.
San Antonio River Authority QAPP Page 51 Last revised on August 21, 2015 finalfy1617crp qapp_sara-08212015.pdf
Appendix A: Measurement Performance Specifications (Table A7.1)
San Antonio River Authority QAPP Page 52 Last revised on August 21, 2015 finalfy1617crp qapp_sara-08212015.pdf
Measurement performance specifications define the data quality needed to satisfy project objectives. To this end, measurement performance specifications are qualitative and quantitative statements that: • clarify the intended use of the data • define the type of data needed to support the end use • identify the conditions under which the data should be collected Appendix A of the QAPP addresses measurement performance specifications, including: • analytical methodologies • AWRLs • limits of quantitation • bias limits for LCSs • precision limits for LCSDs • completeness goals • qualitative statements regarding representativeness and comparability The items identified above need to be considered for each type of monitoring activity. The CRP emphasizes that data should be collected to address multiple objectives, if possible, thereby maximizing the expenditure of resources. Caution should be applied when attempting to collect data for multiple purposes because measurement performance specifications may vary according to the purpose. For example, limits of quantitation may differ for data used to assess standards attainment and for trend analysis. When planning projects, first priority should be given to the main use of the project data and the data quality needed to support that use, then secondary goals should be considered. Table A7.1 should be modified to reflect actual parameters, methods, etc. employed by the San Antonio River Authority and its participants. Alternative methods than those listed in the following table may be used. Procedures for laboratory analysis must be in accordance with the most recently published edition of Standard Methods for the Examination of Water and Wastewater, 40 CFR 136, or otherwise approved independently. Only data collected that have a valid TCEQ parameter code assigned in Table A7.1 are stored in SWQMIS. Any parameters listed in Table A7.1 that do not have a valid TCEQ parameter code assigned will not be stored in SWQMIS. Tables A7.1-A7.9 - Measurement Performance Specifications
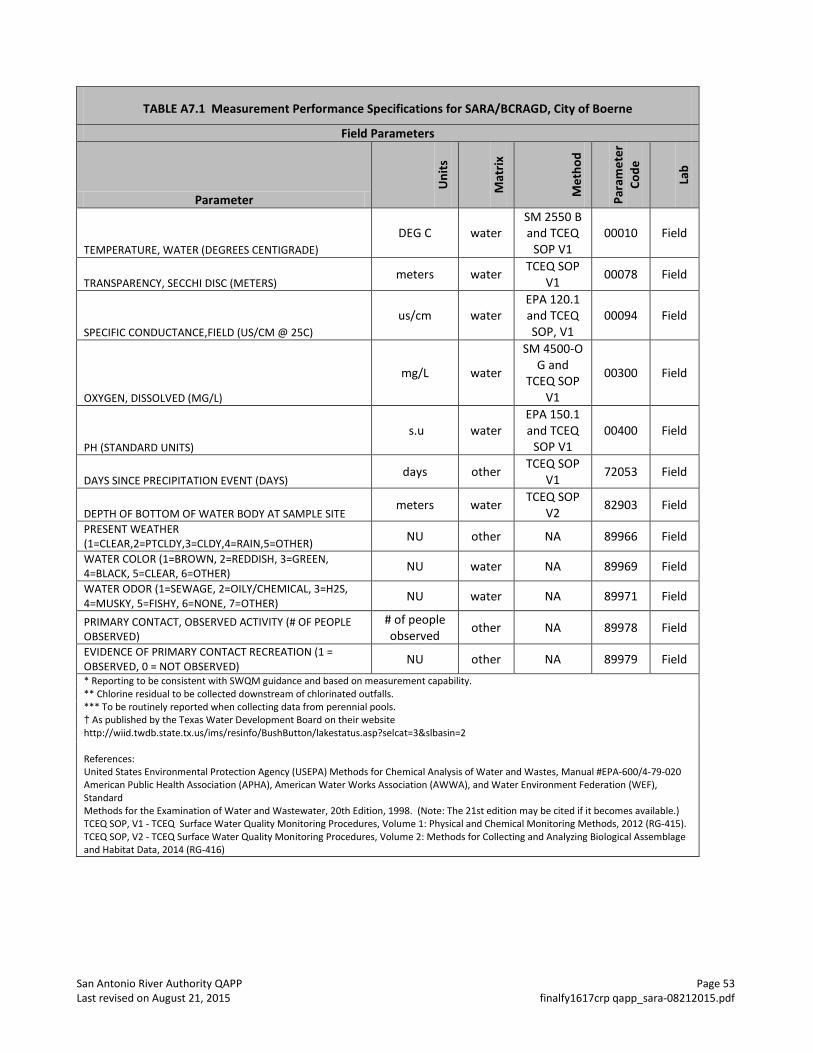
San Antonio River Authority QAPP Page 53 Last revised on August 21, 2015 finalfy1617crp qapp_sara-08212015.pdf
TABLE A7.1 Measurement Performance Specifications for SARA/BCRAGD, City of Boerne
Field Parameters
Parameter
Uni
ts
Mat
rix
Met
hod
Para
met
er
Code
Lab
TEMPERATURE, WATER (DEGREES CENTIGRADE) DEG C water
SM 2550 B and TCEQ
SOP V1 00010 Field
TRANSPARENCY, SECCHI DISC (METERS) meters water TCEQ SOP
V1 00078 Field
SPECIFIC CONDUCTANCE,FIELD (US/CM @ 25C) us/cm water
EPA 120.1 and TCEQ SOP, V1
00094 Field
OXYGEN, DISSOLVED (MG/L)
mg/L water
SM 4500-O G and
TCEQ SOP V1
00300 Field
PH (STANDARD UNITS) s.u water
EPA 150.1 and TCEQ
SOP V1 00400 Field
DAYS SINCE PRECIPITATION EVENT (DAYS) days other TCEQ SOP
V1 72053 Field
DEPTH OF BOTTOM OF WATER BODY AT SAMPLE SITE meters water TCEQ SOP
V2 82903 Field
PRESENT WEATHER (1=CLEAR,2=PTCLDY,3=CLDY,4=RAIN,5=OTHER) NU other NA 89966 Field
WATER COLOR (1=BROWN, 2=REDDISH, 3=GREEN, 4=BLACK, 5=CLEAR, 6=OTHER) NU water NA 89969 Field
WATER ODOR (1=SEWAGE, 2=OILY/CHEMICAL, 3=H2S, 4=MUSKY, 5=FISHY, 6=NONE, 7=OTHER) NU water NA 89971 Field
PRIMARY CONTACT, OBSERVED ACTIVITY (# OF PEOPLE OBSERVED)
# of people observed other NA 89978 Field
EVIDENCE OF PRIMARY CONTACT RECREATION (1 = OBSERVED, 0 = NOT OBSERVED) NU other NA 89979 Field * Reporting to be consistent with SWQM guidance and based on measurement capability. ** Chlorine residual to be collected downstream of chlorinated outfalls. *** To be routinely reported when collecting data from perennial pools. † As published by the Texas Water Development Board on their website http://wiid.twdb.state.tx.us/ims/resinfo/BushButton/lakestatus.asp?selcat=3&slbasin=2 References: United States Environmental Protection Agency (USEPA) Methods for Chemical Analysis of Water and Wastes, Manual #EPA-600/4-79-020 American Public Health Association (APHA), American Water Works Association (AWWA), and Water Environment Federation (WEF), Standard Methods for the Examination of Water and Wastewater, 20th Edition, 1998. (Note: The 21st edition may be cited if it becomes available.) TCEQ SOP, V1 - TCEQ Surface Water Quality Monitoring Procedures, Volume 1: Physical and Chemical Monitoring Methods, 2012 (RG-415). TCEQ SOP, V2 - TCEQ Surface Water Quality Monitoring Procedures, Volume 2: Methods for Collecting and Analyzing Biological Assemblage and Habitat Data, 2014 (RG-416)
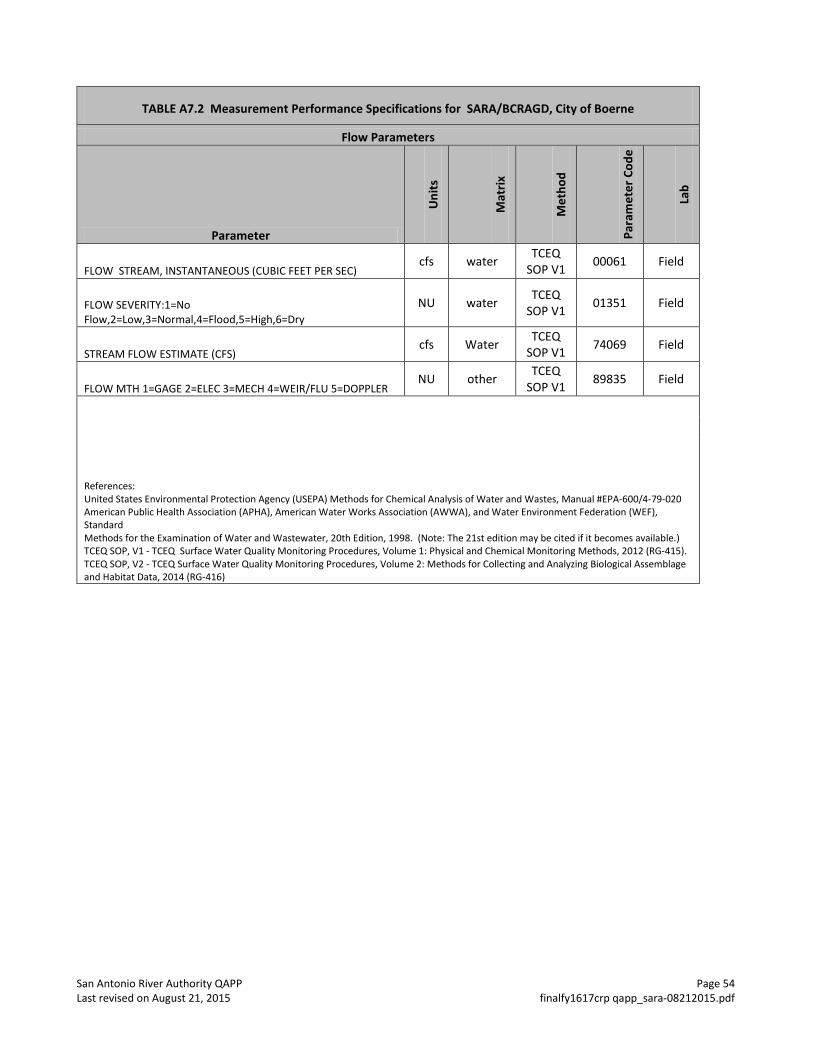
San Antonio River Authority QAPP Page 54 Last revised on August 21, 2015 finalfy1617crp qapp_sara-08212015.pdf
TABLE A7.2 Measurement Performance Specifications for SARA/BCRAGD, City of Boerne
Flow Parameters
Parameter
Uni
ts
Mat
rix
Met
hod
Para
met
er C
ode
Lab
FLOW STREAM, INSTANTANEOUS (CUBIC FEET PER SEC) cfs water TCEQ
SOP V1 00061 Field
FLOW SEVERITY:1=No Flow,2=Low,3=Normal,4=Flood,5=High,6=Dry
NU water TCEQ SOP V1 01351 Field
STREAM FLOW ESTIMATE (CFS) cfs Water TCEQ
SOP V1 74069 Field
FLOW MTH 1=GAGE 2=ELEC 3=MECH 4=WEIR/FLU 5=DOPPLER NU other TCEQ
SOP V1 89835 Field
References: United States Environmental Protection Agency (USEPA) Methods for Chemical Analysis of Water and Wastes, Manual #EPA-600/4-79-020 American Public Health Association (APHA), American Water Works Association (AWWA), and Water Environment Federation (WEF), Standard Methods for the Examination of Water and Wastewater, 20th Edition, 1998. (Note: The 21st edition may be cited if it becomes available.) TCEQ SOP, V1 - TCEQ Surface Water Quality Monitoring Procedures, Volume 1: Physical and Chemical Monitoring Methods, 2012 (RG-415). TCEQ SOP, V2 - TCEQ Surface Water Quality Monitoring Procedures, Volume 2: Methods for Collecting and Analyzing Biological Assemblage and Habitat Data, 2014 (RG-416)
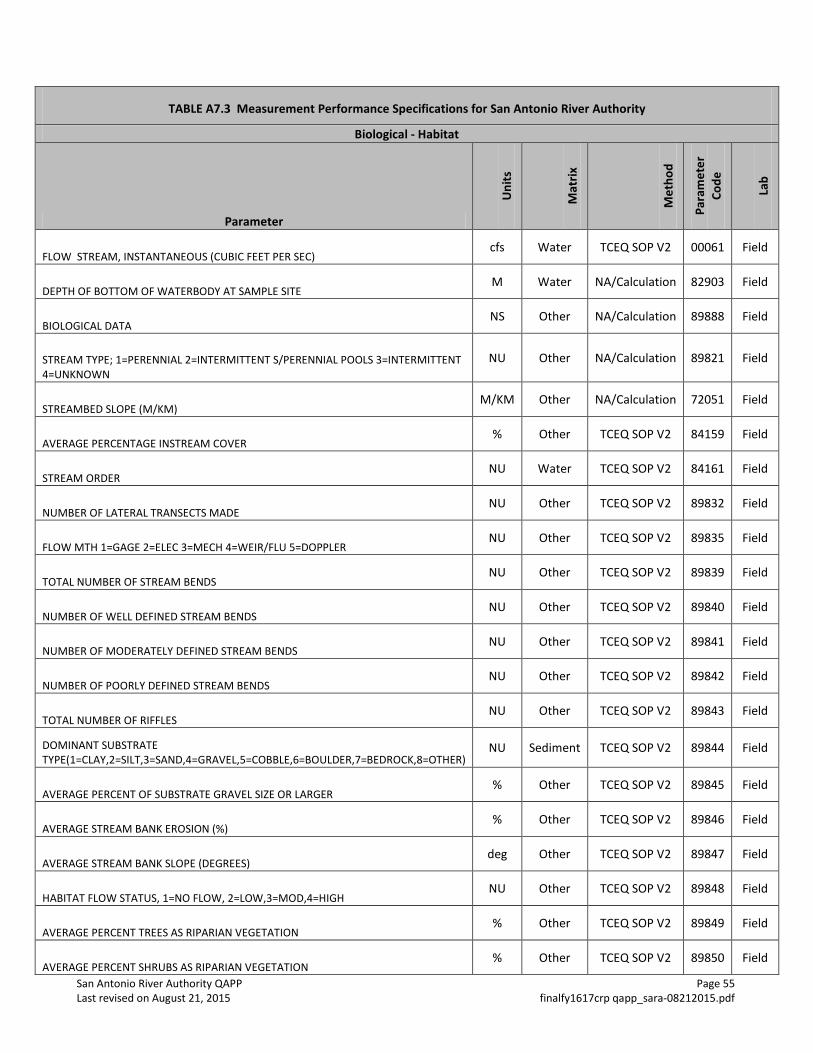
San Antonio River Authority QAPP Page 55 Last revised on August 21, 2015 finalfy1617crp qapp_sara-08212015.pdf
TABLE A7.3 Measurement Performance Specifications for San Antonio River Authority
Biological - Habitat
Parameter
Uni
ts
Mat
rix
Met
hod
Para
met
er
Code
Lab
FLOW STREAM, INSTANTANEOUS (CUBIC FEET PER SEC) cfs Water TCEQ SOP V2 00061 Field
DEPTH OF BOTTOM OF WATERBODY AT SAMPLE SITE M Water NA/Calculation 82903 Field
BIOLOGICAL DATA NS Other NA/Calculation 89888 Field
STREAM TYPE; 1=PERENNIAL 2=INTERMITTENT S/PERENNIAL POOLS 3=INTERMITTENT 4=UNKNOWN
NU Other NA/Calculation 89821 Field
STREAMBED SLOPE (M/KM) M/KM Other NA/Calculation 72051 Field
AVERAGE PERCENTAGE INSTREAM COVER % Other TCEQ SOP V2 84159 Field
STREAM ORDER NU Water TCEQ SOP V2 84161 Field
NUMBER OF LATERAL TRANSECTS MADE NU Other TCEQ SOP V2 89832 Field
FLOW MTH 1=GAGE 2=ELEC 3=MECH 4=WEIR/FLU 5=DOPPLER NU Other TCEQ SOP V2 89835 Field
TOTAL NUMBER OF STREAM BENDS NU Other TCEQ SOP V2 89839 Field
NUMBER OF WELL DEFINED STREAM BENDS NU Other TCEQ SOP V2 89840 Field
NUMBER OF MODERATELY DEFINED STREAM BENDS NU Other TCEQ SOP V2 89841 Field
NUMBER OF POORLY DEFINED STREAM BENDS NU Other TCEQ SOP V2 89842 Field
TOTAL NUMBER OF RIFFLES NU Other TCEQ SOP V2 89843 Field
DOMINANT SUBSTRATE TYPE(1=CLAY,2=SILT,3=SAND,4=GRAVEL,5=COBBLE,6=BOULDER,7=BEDROCK,8=OTHER)
NU Sediment TCEQ SOP V2 89844 Field
AVERAGE PERCENT OF SUBSTRATE GRAVEL SIZE OR LARGER % Other TCEQ SOP V2 89845 Field
AVERAGE STREAM BANK EROSION (%) % Other TCEQ SOP V2 89846 Field
AVERAGE STREAM BANK SLOPE (DEGREES) deg Other TCEQ SOP V2 89847 Field
HABITAT FLOW STATUS, 1=NO FLOW, 2=LOW,3=MOD,4=HIGH NU Other TCEQ SOP V2 89848 Field
AVERAGE PERCENT TREES AS RIPARIAN VEGETATION % Other TCEQ SOP V2 89849 Field
AVERAGE PERCENT SHRUBS AS RIPARIAN VEGETATION % Other TCEQ SOP V2 89850 Field
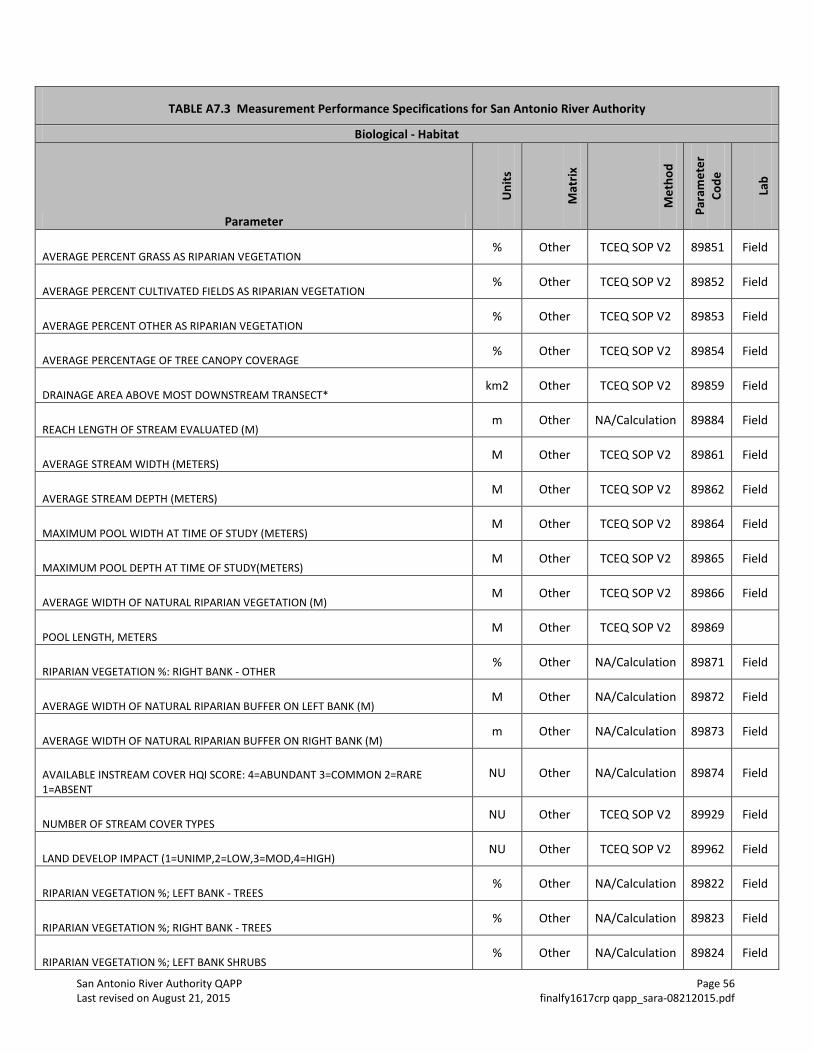
San Antonio River Authority QAPP Page 56 Last revised on August 21, 2015 finalfy1617crp qapp_sara-08212015.pdf
TABLE A7.3 Measurement Performance Specifications for San Antonio River Authority
Biological - Habitat
Parameter
Uni
ts
Mat
rix
Met
hod
Para
met
er
Code
Lab
AVERAGE PERCENT GRASS AS RIPARIAN VEGETATION % Other TCEQ SOP V2 89851 Field
AVERAGE PERCENT CULTIVATED FIELDS AS RIPARIAN VEGETATION % Other TCEQ SOP V2 89852 Field
AVERAGE PERCENT OTHER AS RIPARIAN VEGETATION % Other TCEQ SOP V2 89853 Field
AVERAGE PERCENTAGE OF TREE CANOPY COVERAGE % Other TCEQ SOP V2 89854 Field
DRAINAGE AREA ABOVE MOST DOWNSTREAM TRANSECT* km2 Other TCEQ SOP V2 89859 Field
REACH LENGTH OF STREAM EVALUATED (M) m Other NA/Calculation 89884 Field
AVERAGE STREAM WIDTH (METERS) M Other TCEQ SOP V2 89861 Field
AVERAGE STREAM DEPTH (METERS) M Other TCEQ SOP V2 89862 Field
MAXIMUM POOL WIDTH AT TIME OF STUDY (METERS) M Other TCEQ SOP V2 89864 Field
MAXIMUM POOL DEPTH AT TIME OF STUDY(METERS) M Other TCEQ SOP V2 89865 Field
AVERAGE WIDTH OF NATURAL RIPARIAN VEGETATION (M) M Other TCEQ SOP V2 89866 Field
POOL LENGTH, METERS M Other TCEQ SOP V2 89869
RIPARIAN VEGETATION %: RIGHT BANK - OTHER % Other NA/Calculation 89871 Field
AVERAGE WIDTH OF NATURAL RIPARIAN BUFFER ON LEFT BANK (M) M Other NA/Calculation 89872 Field
AVERAGE WIDTH OF NATURAL RIPARIAN BUFFER ON RIGHT BANK (M) m Other NA/Calculation 89873 Field
AVAILABLE INSTREAM COVER HQI SCORE: 4=ABUNDANT 3=COMMON 2=RARE 1=ABSENT
NU Other NA/Calculation 89874 Field
NUMBER OF STREAM COVER TYPES NU Other TCEQ SOP V2 89929 Field
LAND DEVELOP IMPACT (1=UNIMP,2=LOW,3=MOD,4=HIGH) NU Other TCEQ SOP V2 89962 Field
RIPARIAN VEGETATION %; LEFT BANK - TREES % Other NA/Calculation 89822 Field
RIPARIAN VEGETATION %; RIGHT BANK - TREES % Other NA/Calculation 89823 Field
RIPARIAN VEGETATION %; LEFT BANK SHRUBS % Other NA/Calculation 89824 Field
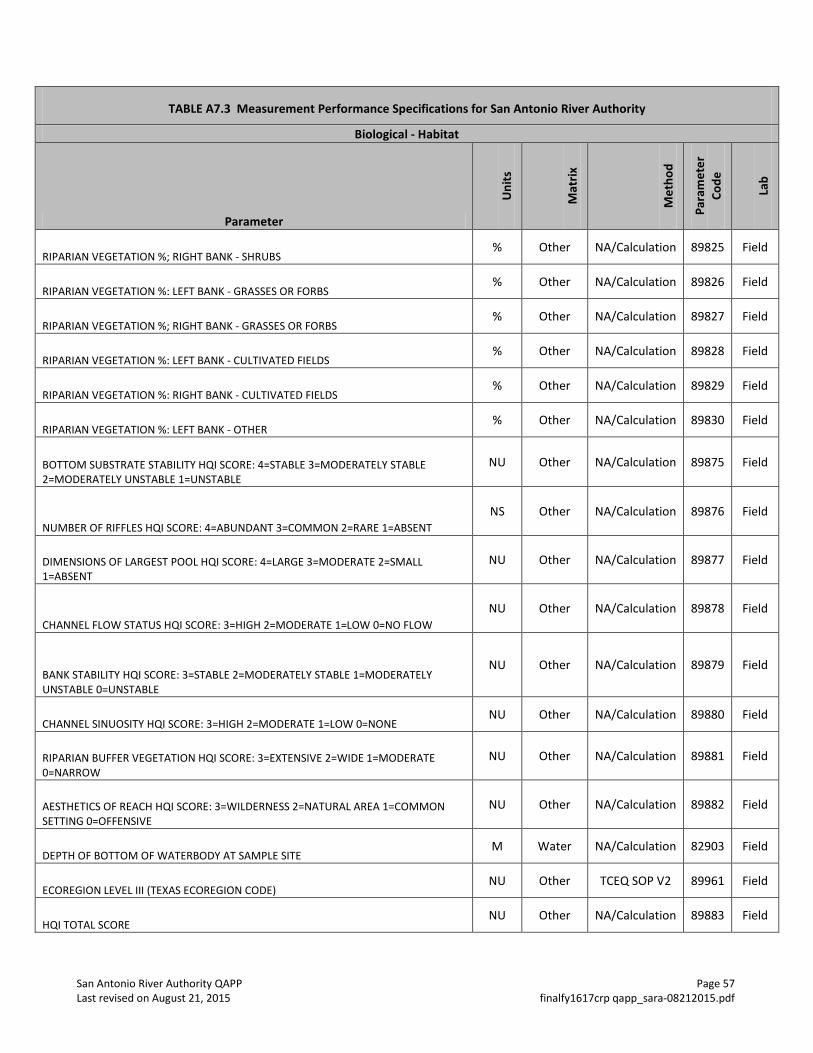
San Antonio River Authority QAPP Page 57 Last revised on August 21, 2015 finalfy1617crp qapp_sara-08212015.pdf
TABLE A7.3 Measurement Performance Specifications for San Antonio River Authority
Biological - Habitat
Parameter
Uni
ts
Mat
rix
Met
hod
Para
met
er
Code
Lab
RIPARIAN VEGETATION %; RIGHT BANK - SHRUBS % Other NA/Calculation 89825 Field
RIPARIAN VEGETATION %: LEFT BANK - GRASSES OR FORBS % Other NA/Calculation 89826 Field
RIPARIAN VEGETATION %; RIGHT BANK - GRASSES OR FORBS % Other NA/Calculation 89827 Field
RIPARIAN VEGETATION %: LEFT BANK - CULTIVATED FIELDS % Other NA/Calculation 89828 Field
RIPARIAN VEGETATION %: RIGHT BANK - CULTIVATED FIELDS % Other NA/Calculation 89829 Field
RIPARIAN VEGETATION %: LEFT BANK - OTHER % Other NA/Calculation 89830 Field
BOTTOM SUBSTRATE STABILITY HQI SCORE: 4=STABLE 3=MODERATELY STABLE 2=MODERATELY UNSTABLE 1=UNSTABLE
NU Other NA/Calculation 89875 Field
NUMBER OF RIFFLES HQI SCORE: 4=ABUNDANT 3=COMMON 2=RARE 1=ABSENT NS Other NA/Calculation 89876 Field
DIMENSIONS OF LARGEST POOL HQI SCORE: 4=LARGE 3=MODERATE 2=SMALL 1=ABSENT
NU Other NA/Calculation 89877 Field
CHANNEL FLOW STATUS HQI SCORE: 3=HIGH 2=MODERATE 1=LOW 0=NO FLOW NU Other NA/Calculation 89878 Field
BANK STABILITY HQI SCORE: 3=STABLE 2=MODERATELY STABLE 1=MODERATELY UNSTABLE 0=UNSTABLE
NU Other NA/Calculation 89879 Field
CHANNEL SINUOSITY HQI SCORE: 3=HIGH 2=MODERATE 1=LOW 0=NONE NU Other NA/Calculation 89880 Field
RIPARIAN BUFFER VEGETATION HQI SCORE: 3=EXTENSIVE 2=WIDE 1=MODERATE 0=NARROW
NU Other NA/Calculation 89881 Field
AESTHETICS OF REACH HQI SCORE: 3=WILDERNESS 2=NATURAL AREA 1=COMMON SETTING 0=OFFENSIVE
NU Other NA/Calculation 89882 Field
DEPTH OF BOTTOM OF WATERBODY AT SAMPLE SITE M Water NA/Calculation 82903 Field
ECOREGION LEVEL III (TEXAS ECOREGION CODE) NU Other TCEQ SOP V2 89961 Field
HQI TOTAL SCORE NU Other NA/Calculation 89883 Field
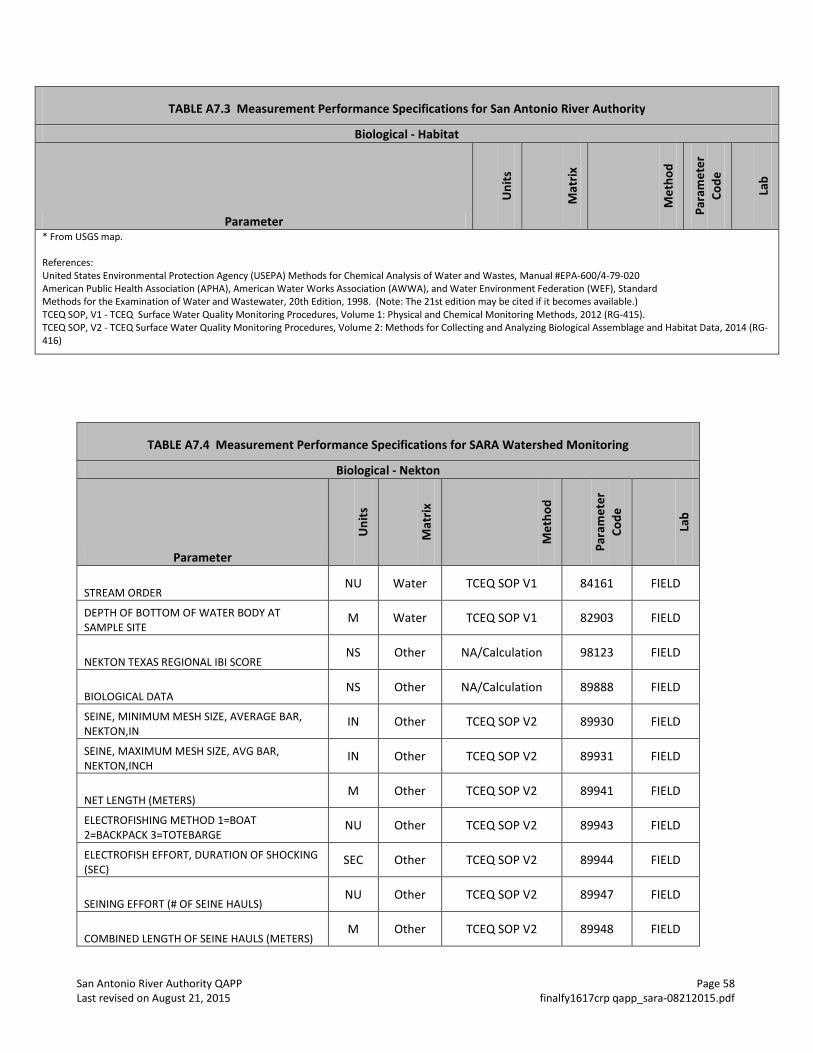
San Antonio River Authority QAPP Page 58 Last revised on August 21, 2015 finalfy1617crp qapp_sara-08212015.pdf
TABLE A7.3 Measurement Performance Specifications for San Antonio River Authority
Biological - Habitat
Parameter
Uni
ts
Mat
rix
Met
hod
Para
met
er
Code
Lab
* From USGS map. References: United States Environmental Protection Agency (USEPA) Methods for Chemical Analysis of Water and Wastes, Manual #EPA-600/4-79-020 American Public Health Association (APHA), American Water Works Association (AWWA), and Water Environment Federation (WEF), Standard Methods for the Examination of Water and Wastewater, 20th Edition, 1998. (Note: The 21st edition may be cited if it becomes available.) TCEQ SOP, V1 - TCEQ Surface Water Quality Monitoring Procedures, Volume 1: Physical and Chemical Monitoring Methods, 2012 (RG-415). TCEQ SOP, V2 - TCEQ Surface Water Quality Monitoring Procedures, Volume 2: Methods for Collecting and Analyzing Biological Assemblage and Habitat Data, 2014 (RG-416)
TABLE A7.4 Measurement Performance Specifications for SARA Watershed Monitoring
Biological - Nekton
Parameter
Uni
ts
Mat
rix
Met
hod
Para
met
er
Code
Lab
STREAM ORDER NU Water TCEQ SOP V1 84161 FIELD
DEPTH OF BOTTOM OF WATER BODY AT SAMPLE SITE
M Water TCEQ SOP V1 82903 FIELD
NEKTON TEXAS REGIONAL IBI SCORE NS Other NA/Calculation 98123 FIELD
BIOLOGICAL DATA NS Other NA/Calculation 89888 FIELD
SEINE, MINIMUM MESH SIZE, AVERAGE BAR, NEKTON,IN
IN Other TCEQ SOP V2 89930 FIELD
SEINE, MAXIMUM MESH SIZE, AVG BAR, NEKTON,INCH
IN Other TCEQ SOP V2 89931 FIELD
NET LENGTH (METERS) M Other TCEQ SOP V2 89941 FIELD
ELECTROFISHING METHOD 1=BOAT 2=BACKPACK 3=TOTEBARGE
NU Other TCEQ SOP V2 89943 FIELD
ELECTROFISH EFFORT, DURATION OF SHOCKING (SEC)
SEC Other TCEQ SOP V2 89944 FIELD
SEINING EFFORT (# OF SEINE HAULS) NU Other TCEQ SOP V2 89947 FIELD
COMBINED LENGTH OF SEINE HAULS (METERS) M Other TCEQ SOP V2 89948 FIELD
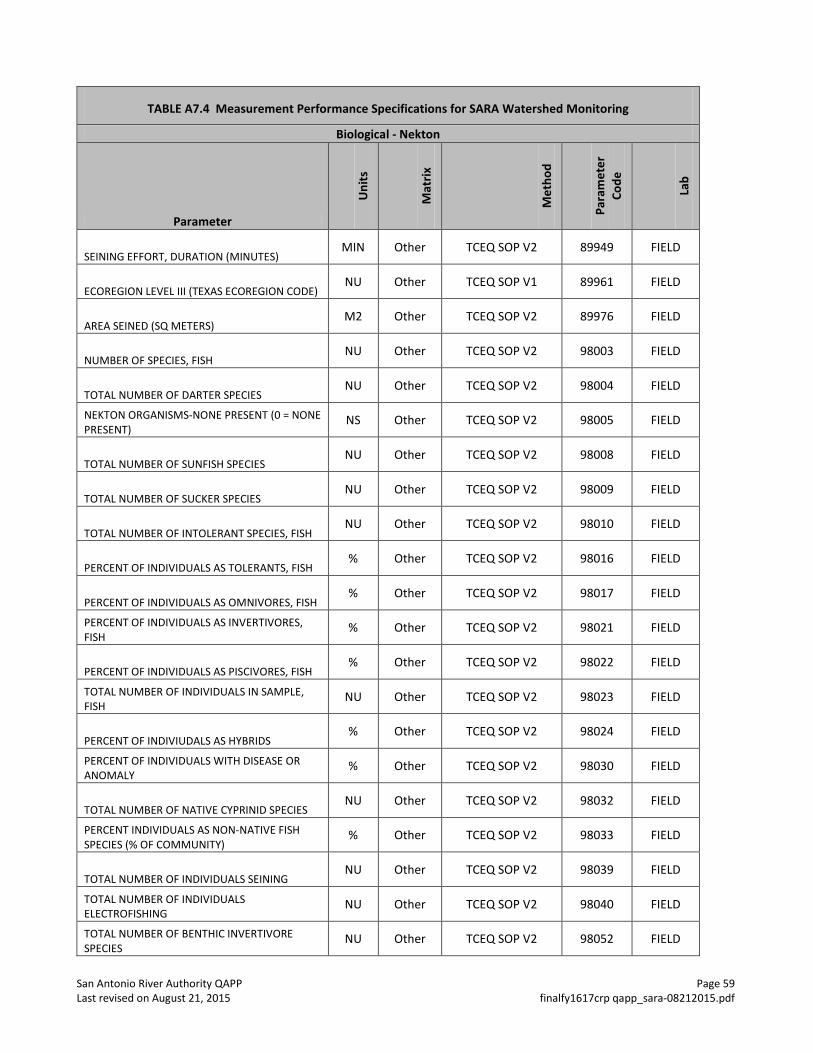
San Antonio River Authority QAPP Page 59 Last revised on August 21, 2015 finalfy1617crp qapp_sara-08212015.pdf
TABLE A7.4 Measurement Performance Specifications for SARA Watershed Monitoring
Biological - Nekton
Parameter
Uni
ts
Mat
rix
Met
hod
Para
met
er
Code
Lab
SEINING EFFORT, DURATION (MINUTES) MIN Other TCEQ SOP V2 89949 FIELD
ECOREGION LEVEL III (TEXAS ECOREGION CODE) NU Other TCEQ SOP V1 89961 FIELD
AREA SEINED (SQ METERS) M2 Other TCEQ SOP V2 89976 FIELD
NUMBER OF SPECIES, FISH NU Other TCEQ SOP V2 98003 FIELD
TOTAL NUMBER OF DARTER SPECIES NU Other TCEQ SOP V2 98004 FIELD
NEKTON ORGANISMS-NONE PRESENT (0 = NONE PRESENT)
NS Other TCEQ SOP V2 98005 FIELD
TOTAL NUMBER OF SUNFISH SPECIES NU Other TCEQ SOP V2 98008 FIELD
TOTAL NUMBER OF SUCKER SPECIES NU Other TCEQ SOP V2 98009 FIELD
TOTAL NUMBER OF INTOLERANT SPECIES, FISH NU Other TCEQ SOP V2 98010 FIELD
PERCENT OF INDIVIDUALS AS TOLERANTS, FISH % Other TCEQ SOP V2 98016 FIELD
PERCENT OF INDIVIDUALS AS OMNIVORES, FISH % Other TCEQ SOP V2 98017 FIELD
PERCENT OF INDIVIDUALS AS INVERTIVORES, FISH
% Other TCEQ SOP V2 98021 FIELD
PERCENT OF INDIVIDUALS AS PISCIVORES, FISH % Other TCEQ SOP V2 98022 FIELD
TOTAL NUMBER OF INDIVIDUALS IN SAMPLE, FISH
NU Other TCEQ SOP V2 98023 FIELD
PERCENT OF INDIVIUDALS AS HYBRIDS % Other TCEQ SOP V2 98024 FIELD
PERCENT OF INDIVIDUALS WITH DISEASE OR ANOMALY
% Other TCEQ SOP V2 98030 FIELD
TOTAL NUMBER OF NATIVE CYPRINID SPECIES NU Other TCEQ SOP V2 98032 FIELD
PERCENT INDIVIDUALS AS NON-NATIVE FISH SPECIES (% OF COMMUNITY)
% Other TCEQ SOP V2 98033 FIELD
TOTAL NUMBER OF INDIVIDUALS SEINING NU Other TCEQ SOP V2 98039 FIELD
TOTAL NUMBER OF INDIVIDUALS ELECTROFISHING
NU Other TCEQ SOP V2 98040 FIELD
TOTAL NUMBER OF BENTHIC INVERTIVORE SPECIES
NU Other TCEQ SOP V2 98052 FIELD
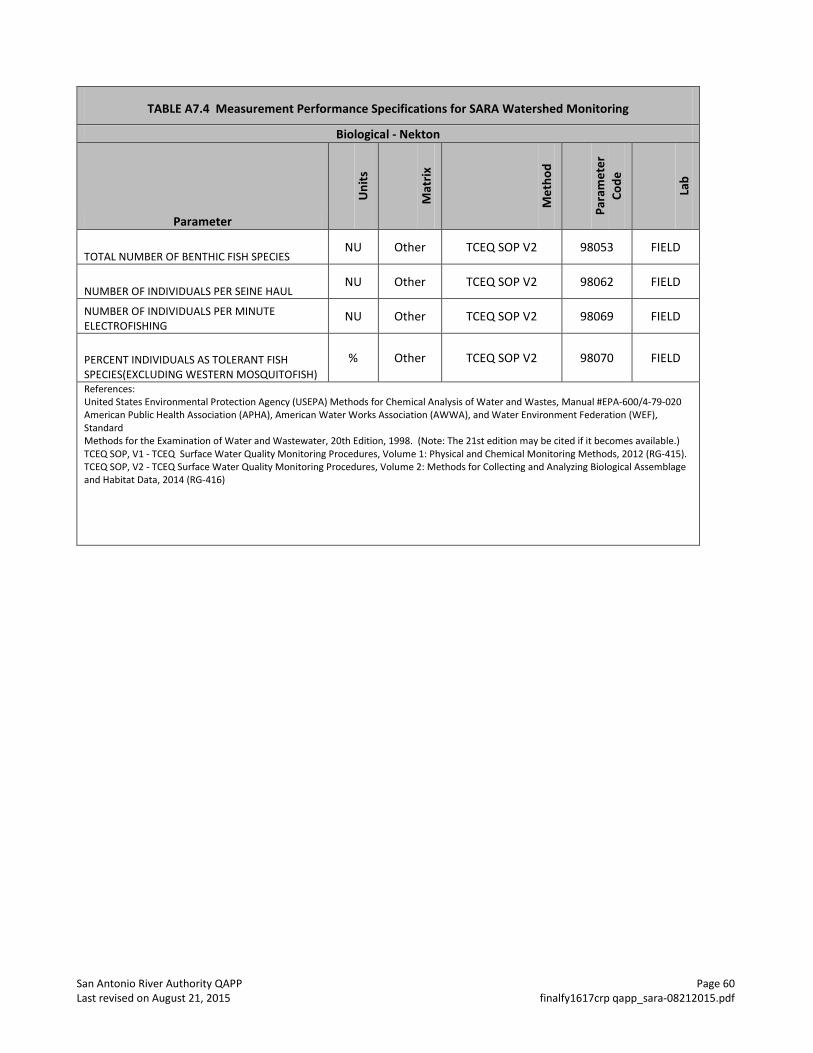
San Antonio River Authority QAPP Page 60 Last revised on August 21, 2015 finalfy1617crp qapp_sara-08212015.pdf
TABLE A7.4 Measurement Performance Specifications for SARA Watershed Monitoring
Biological - Nekton
Parameter
Uni
ts
Mat
rix
Met
hod
Para
met
er
Code
Lab
TOTAL NUMBER OF BENTHIC FISH SPECIES NU Other TCEQ SOP V2 98053 FIELD
NUMBER OF INDIVIDUALS PER SEINE HAUL NU Other TCEQ SOP V2 98062 FIELD
NUMBER OF INDIVIDUALS PER MINUTE ELECTROFISHING
NU Other TCEQ SOP V2 98069 FIELD
PERCENT INDIVIDUALS AS TOLERANT FISH SPECIES(EXCLUDING WESTERN MOSQUITOFISH)
% Other TCEQ SOP V2 98070 FIELD
References: United States Environmental Protection Agency (USEPA) Methods for Chemical Analysis of Water and Wastes, Manual #EPA-600/4-79-020 American Public Health Association (APHA), American Water Works Association (AWWA), and Water Environment Federation (WEF), Standard Methods for the Examination of Water and Wastewater, 20th Edition, 1998. (Note: The 21st edition may be cited if it becomes available.) TCEQ SOP, V1 - TCEQ Surface Water Quality Monitoring Procedures, Volume 1: Physical and Chemical Monitoring Methods, 2012 (RG-415). TCEQ SOP, V2 - TCEQ Surface Water Quality Monitoring Procedures, Volume 2: Methods for Collecting and Analyzing Biological Assemblage and Habitat Data, 2014 (RG-416)
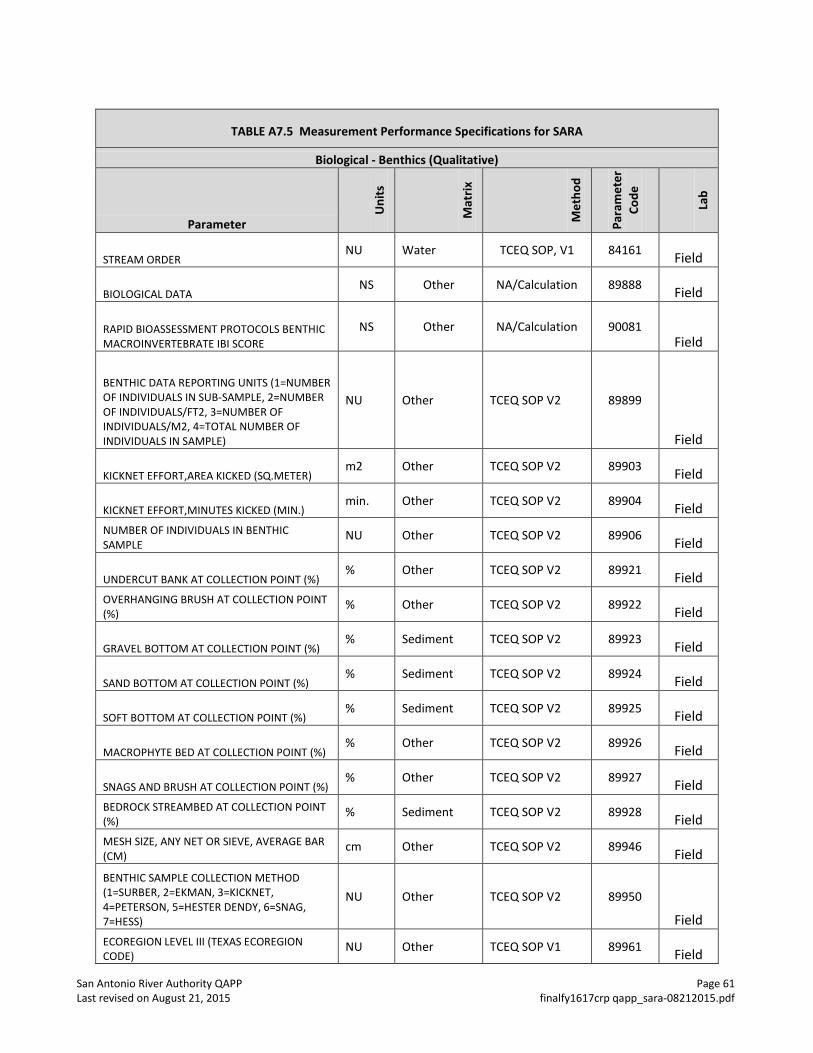
San Antonio River Authority QAPP Page 61 Last revised on August 21, 2015 finalfy1617crp qapp_sara-08212015.pdf
TABLE A7.5 Measurement Performance Specifications for SARA
Biological - Benthics (Qualitative)
Parameter
Uni
ts
Mat
rix
Met
hod
Para
met
er
Code
Lab
STREAM ORDER NU Water TCEQ SOP, V1 84161 Field
BIOLOGICAL DATA NS Other NA/Calculation 89888 Field
RAPID BIOASSESSMENT PROTOCOLS BENTHIC MACROINVERTEBRATE IBI SCORE
NS Other NA/Calculation 90081 Field
BENTHIC DATA REPORTING UNITS (1=NUMBER OF INDIVIDUALS IN SUB-SAMPLE, 2=NUMBER OF INDIVIDUALS/FT2, 3=NUMBER OF INDIVIDUALS/M2, 4=TOTAL NUMBER OF INDIVIDUALS IN SAMPLE)
NU Other TCEQ SOP V2 89899
Field
KICKNET EFFORT,AREA KICKED (SQ.METER) m2 Other TCEQ SOP V2 89903 Field
KICKNET EFFORT,MINUTES KICKED (MIN.) min. Other TCEQ SOP V2 89904 Field
NUMBER OF INDIVIDUALS IN BENTHIC SAMPLE
NU Other TCEQ SOP V2 89906 Field
UNDERCUT BANK AT COLLECTION POINT (%) % Other TCEQ SOP V2 89921 Field
OVERHANGING BRUSH AT COLLECTION POINT (%)
% Other TCEQ SOP V2 89922 Field
GRAVEL BOTTOM AT COLLECTION POINT (%) % Sediment TCEQ SOP V2 89923 Field
SAND BOTTOM AT COLLECTION POINT (%) % Sediment TCEQ SOP V2 89924 Field
SOFT BOTTOM AT COLLECTION POINT (%) % Sediment TCEQ SOP V2 89925 Field
MACROPHYTE BED AT COLLECTION POINT (%) % Other TCEQ SOP V2 89926 Field
SNAGS AND BRUSH AT COLLECTION POINT (%) % Other TCEQ SOP V2 89927 Field
BEDROCK STREAMBED AT COLLECTION POINT (%)
% Sediment TCEQ SOP V2 89928 Field MESH SIZE, ANY NET OR SIEVE, AVERAGE BAR (CM)
cm Other TCEQ SOP V2 89946 Field BENTHIC SAMPLE COLLECTION METHOD (1=SURBER, 2=EKMAN, 3=KICKNET, 4=PETERSON, 5=HESTER DENDY, 6=SNAG, 7=HESS)
NU Other TCEQ SOP V2 89950
Field ECOREGION LEVEL III (TEXAS ECOREGION CODE)
NU Other TCEQ SOP V1 89961 Field
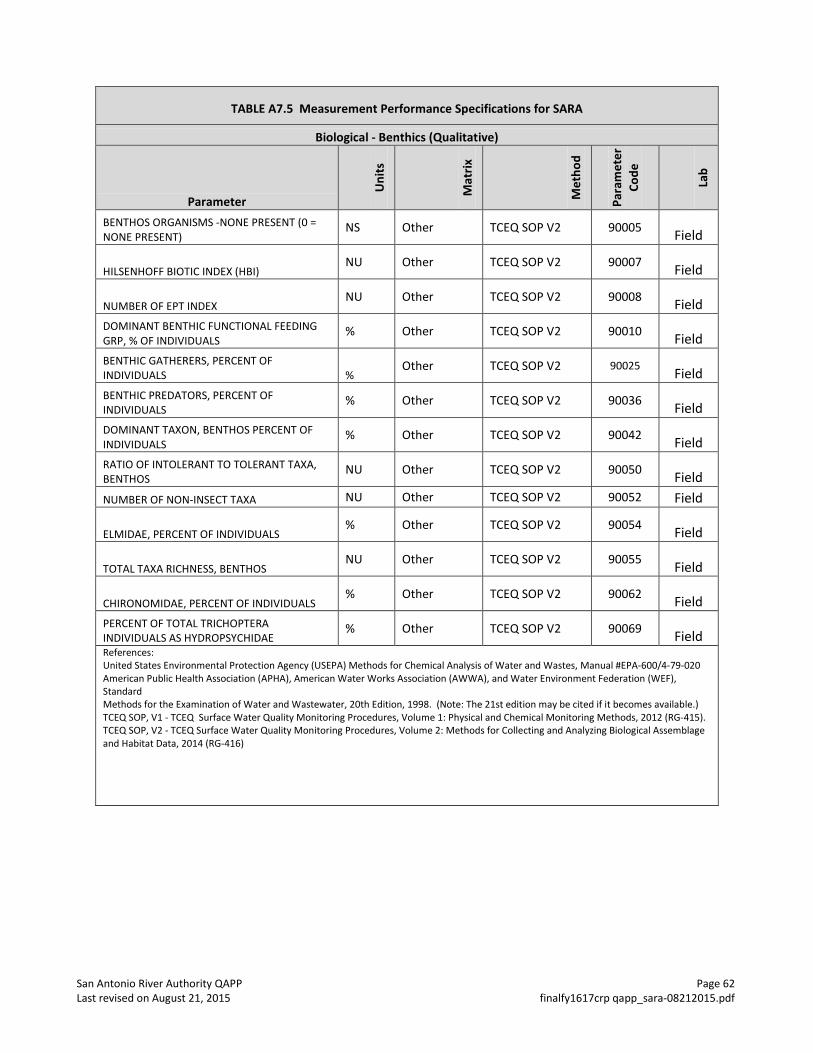
San Antonio River Authority QAPP Page 62 Last revised on August 21, 2015 finalfy1617crp qapp_sara-08212015.pdf
TABLE A7.5 Measurement Performance Specifications for SARA
Biological - Benthics (Qualitative)
Parameter
Uni
ts
Mat
rix
Met
hod
Para
met
er
Code
Lab
BENTHOS ORGANISMS -NONE PRESENT (0 = NONE PRESENT)
NS Other TCEQ SOP V2 90005 Field
HILSENHOFF BIOTIC INDEX (HBI) NU Other TCEQ SOP V2 90007 Field
NUMBER OF EPT INDEX NU Other TCEQ SOP V2 90008 Field
DOMINANT BENTHIC FUNCTIONAL FEEDING GRP, % OF INDIVIDUALS
% Other TCEQ SOP V2 90010 Field BENTHIC GATHERERS, PERCENT OF INDIVIDUALS %
Other TCEQ SOP V2 90025 Field BENTHIC PREDATORS, PERCENT OF INDIVIDUALS
% Other TCEQ SOP V2 90036 Field DOMINANT TAXON, BENTHOS PERCENT OF INDIVIDUALS
% Other TCEQ SOP V2 90042 Field RATIO OF INTOLERANT TO TOLERANT TAXA, BENTHOS
NU Other TCEQ SOP V2 90050 Field NUMBER OF NON-INSECT TAXA NU Other TCEQ SOP V2 90052 Field
ELMIDAE, PERCENT OF INDIVIDUALS % Other TCEQ SOP V2 90054 Field
TOTAL TAXA RICHNESS, BENTHOS NU Other TCEQ SOP V2 90055 Field
CHIRONOMIDAE, PERCENT OF INDIVIDUALS % Other TCEQ SOP V2 90062 Field
PERCENT OF TOTAL TRICHOPTERA INDIVIDUALS AS HYDROPSYCHIDAE
% Other TCEQ SOP V2 90069 Field References: United States Environmental Protection Agency (USEPA) Methods for Chemical Analysis of Water and Wastes, Manual #EPA-600/4-79-020 American Public Health Association (APHA), American Water Works Association (AWWA), and Water Environment Federation (WEF), Standard Methods for the Examination of Water and Wastewater, 20th Edition, 1998. (Note: The 21st edition may be cited if it becomes available.) TCEQ SOP, V1 - TCEQ Surface Water Quality Monitoring Procedures, Volume 1: Physical and Chemical Monitoring Methods, 2012 (RG-415). TCEQ SOP, V2 - TCEQ Surface Water Quality Monitoring Procedures, Volume 2: Methods for Collecting and Analyzing Biological Assemblage and Habitat Data, 2014 (RG-416)
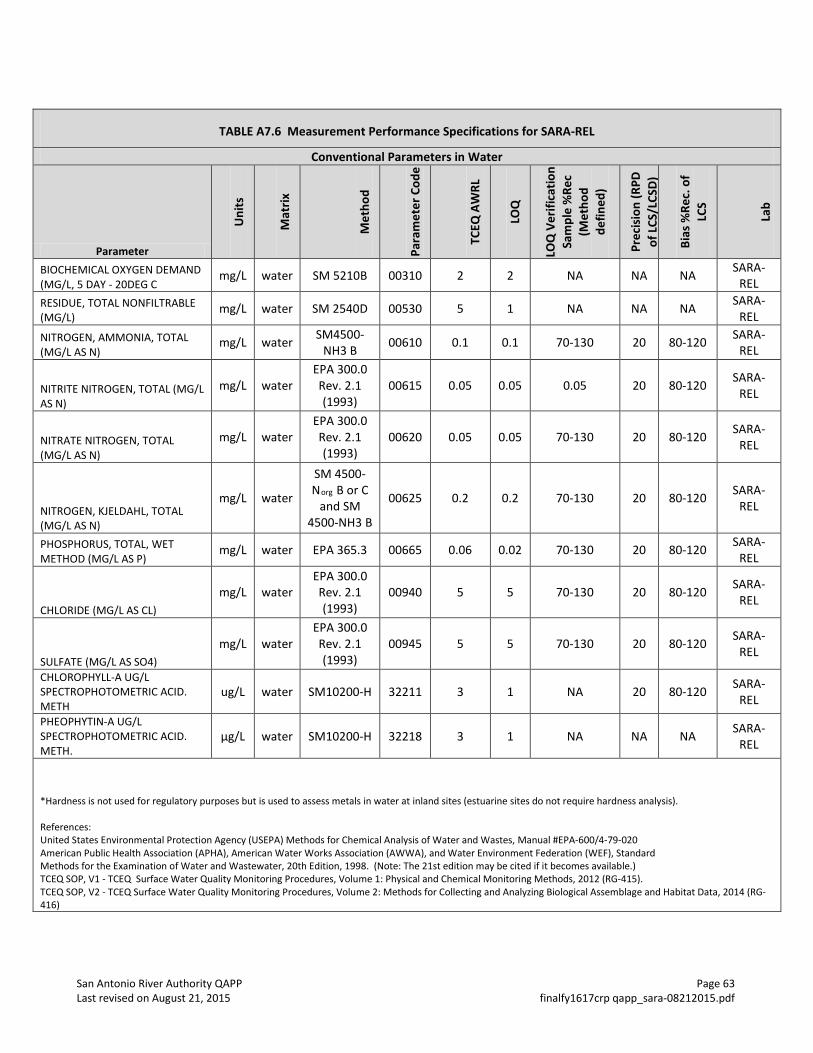
San Antonio River Authority QAPP Page 63 Last revised on August 21, 2015 finalfy1617crp qapp_sara-08212015.pdf
TABLE A7.6 Measurement Performance Specifications for SARA-REL
Conventional Parameters in Water
Parameter U
nits
Mat
rix
Met
hod
Para
met
er C
ode
TCEQ
AW
RL
LOQ
LOQ
Ver
ifica
tion
Sam
ple
%Re
c (M
etho
d de
fined
)
Prec
isio
n (R
PD
of L
CS/L
CSD)
Bias
%Re
c. o
f LC
S
Lab
BIOCHEMICAL OXYGEN DEMAND (MG/L, 5 DAY - 20DEG C
mg/L water SM 5210B 00310 2 2 NA NA NA SARA-REL
RESIDUE, TOTAL NONFILTRABLE (MG/L)
mg/L water SM 2540D 00530 5 1 NA NA NA SARA-REL
NITROGEN, AMMONIA, TOTAL (MG/L AS N)
mg/L water SM4500-NH3 B 00610 0.1 0.1 70-130 20 80-120 SARA-
REL
NITRITE NITROGEN, TOTAL (MG/L AS N)
mg/L water EPA 300.0 Rev. 2.1 (1993)
00615 0.05 0.05 0.05 20 80-120 SARA-REL
NITRATE NITROGEN, TOTAL (MG/L AS N)
mg/L water EPA 300.0 Rev. 2.1 (1993)
00620 0.05 0.05 70-130 20 80-120 SARA-REL
NITROGEN, KJELDAHL, TOTAL (MG/L AS N)
mg/L water
SM 4500-Norg B or C
and SM 4500-NH3 B
00625 0.2 0.2 70-130 20 80-120 SARA-REL
PHOSPHORUS, TOTAL, WET METHOD (MG/L AS P)
mg/L water EPA 365.3 00665 0.06 0.02 70-130 20 80-120 SARA-REL
CHLORIDE (MG/L AS CL) mg/L water
EPA 300.0 Rev. 2.1 (1993)
00940 5 5 70-130 20 80-120 SARA-REL
SULFATE (MG/L AS SO4) mg/L water
EPA 300.0 Rev. 2.1 (1993)
00945 5 5 70-130 20 80-120 SARA-REL
CHLOROPHYLL-A UG/L SPECTROPHOTOMETRIC ACID. METH
ug/L water SM10200-H 32211 3 1 NA 20 80-120 SARA-REL
PHEOPHYTIN-A UG/L SPECTROPHOTOMETRIC ACID. METH.
μg/L water SM10200-H 32218 3 1 NA NA NA SARA-REL
*Hardness is not used for regulatory purposes but is used to assess metals in water at inland sites (estuarine sites do not require hardness analysis). References: United States Environmental Protection Agency (USEPA) Methods for Chemical Analysis of Water and Wastes, Manual #EPA-600/4-79-020 American Public Health Association (APHA), American Water Works Association (AWWA), and Water Environment Federation (WEF), Standard Methods for the Examination of Water and Wastewater, 20th Edition, 1998. (Note: The 21st edition may be cited if it becomes available.) TCEQ SOP, V1 - TCEQ Surface Water Quality Monitoring Procedures, Volume 1: Physical and Chemical Monitoring Methods, 2012 (RG-415). TCEQ SOP, V2 - TCEQ Surface Water Quality Monitoring Procedures, Volume 2: Methods for Collecting and Analyzing Biological Assemblage and Habitat Data, 2014 (RG-416)
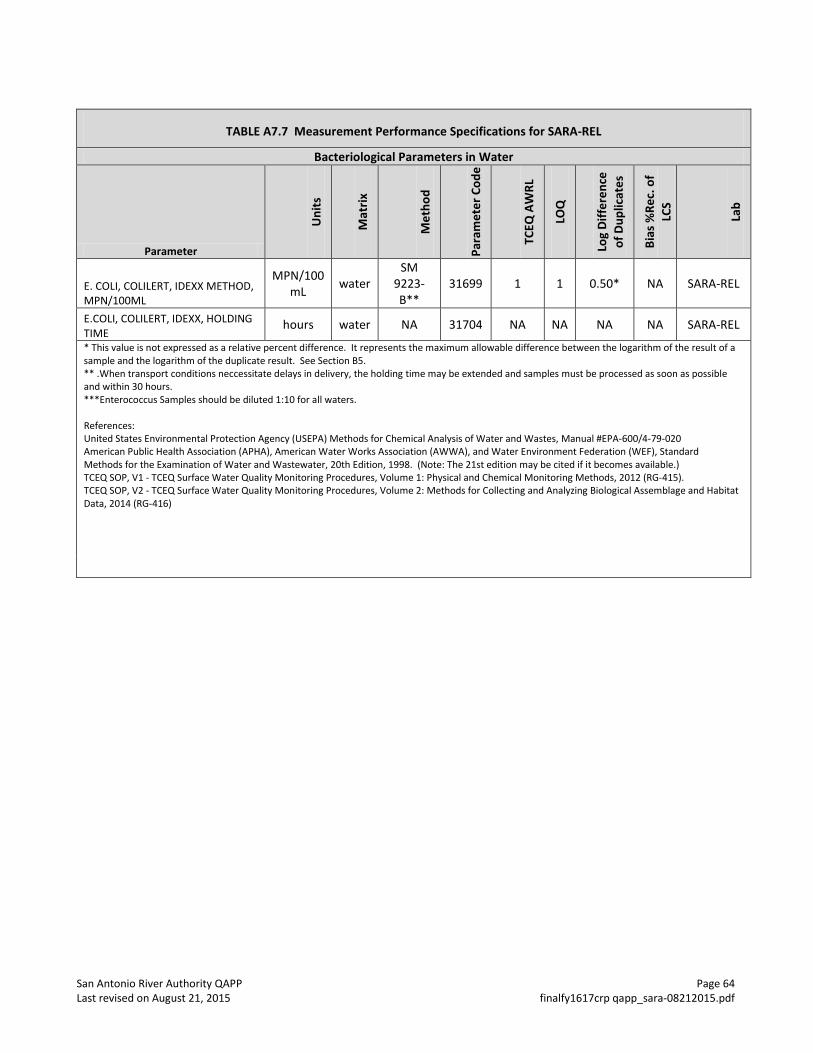
San Antonio River Authority QAPP Page 64 Last revised on August 21, 2015 finalfy1617crp qapp_sara-08212015.pdf
TABLE A7.7 Measurement Performance Specifications for SARA-REL
Bacteriological Parameters in Water
Parameter
Uni
ts
Mat
rix
Met
hod
Para
met
er C
ode
TCEQ
AW
RL
LOQ
Log
Diffe
renc
e of
Dup
licat
es
Bias
%Re
c. o
f LC
S
Lab
E. COLI, COLILERT, IDEXX METHOD, MPN/100ML
MPN/100 mL water
SM 9223-B**
31699 1 1 0.50* NA SARA-REL
E.COLI, COLILERT, IDEXX, HOLDING TIME
hours water NA 31704 NA NA NA NA SARA-REL
* This value is not expressed as a relative percent difference. It represents the maximum allowable difference between the logarithm of the result of a sample and the logarithm of the duplicate result. See Section B5. ** .When transport conditions neccessitate delays in delivery, the holding time may be extended and samples must be processed as soon as possible and within 30 hours. ***Enterococcus Samples should be diluted 1:10 for all waters. References: United States Environmental Protection Agency (USEPA) Methods for Chemical Analysis of Water and Wastes, Manual #EPA-600/4-79-020 American Public Health Association (APHA), American Water Works Association (AWWA), and Water Environment Federation (WEF), Standard Methods for the Examination of Water and Wastewater, 20th Edition, 1998. (Note: The 21st edition may be cited if it becomes available.) TCEQ SOP, V1 - TCEQ Surface Water Quality Monitoring Procedures, Volume 1: Physical and Chemical Monitoring Methods, 2012 (RG-415). TCEQ SOP, V2 - TCEQ Surface Water Quality Monitoring Procedures, Volume 2: Methods for Collecting and Analyzing Biological Assemblage and Habitat Data, 2014 (RG-416)
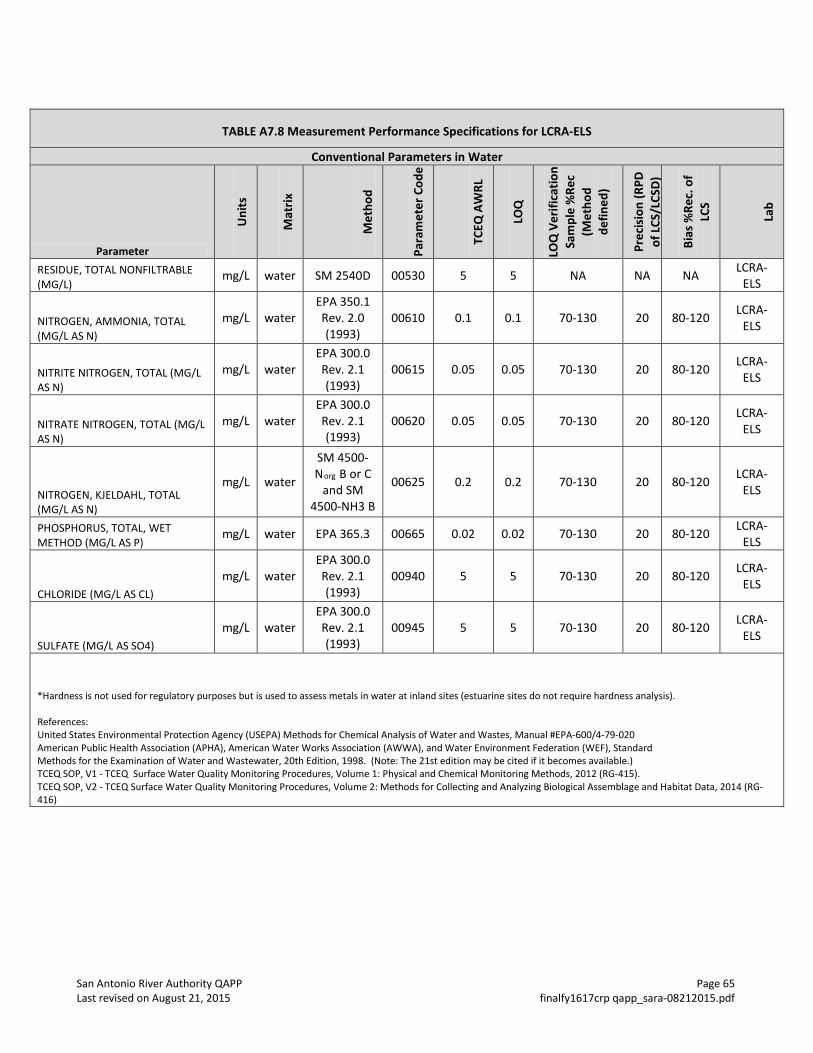
San Antonio River Authority QAPP Page 65 Last revised on August 21, 2015 finalfy1617crp qapp_sara-08212015.pdf
TABLE A7.8 Measurement Performance Specifications for LCRA-ELS
Conventional Parameters in Water
Parameter U
nits
Mat
rix
Met
hod
Para
met
er C
ode
TCEQ
AW
RL
LOQ
LOQ
Ver
ifica
tion
Sam
ple
%Re
c (M
etho
d de
fined
)
Prec
isio
n (R
PD
of L
CS/L
CSD)
Bias
%Re
c. o
f LC
S
Lab
RESIDUE, TOTAL NONFILTRABLE (MG/L)
mg/L water SM 2540D 00530 5 5 NA NA NA LCRA-ELS
NITROGEN, AMMONIA, TOTAL (MG/L AS N)
mg/L water EPA 350.1 Rev. 2.0 (1993)
00610 0.1 0.1 70-130 20 80-120 LCRA-ELS
NITRITE NITROGEN, TOTAL (MG/L AS N)
mg/L water EPA 300.0 Rev. 2.1 (1993)
00615 0.05 0.05 70-130 20 80-120 LCRA-ELS
NITRATE NITROGEN, TOTAL (MG/L AS N)
mg/L water EPA 300.0 Rev. 2.1 (1993)
00620 0.05 0.05 70-130 20 80-120 LCRA-ELS
NITROGEN, KJELDAHL, TOTAL (MG/L AS N)
mg/L water
SM 4500-Norg B or C
and SM 4500-NH3 B
00625 0.2 0.2 70-130 20 80-120 LCRA-ELS
PHOSPHORUS, TOTAL, WET METHOD (MG/L AS P)
mg/L water EPA 365.3 00665 0.02 0.02 70-130 20 80-120 LCRA-ELS
CHLORIDE (MG/L AS CL) mg/L water
EPA 300.0 Rev. 2.1 (1993)
00940 5 5 70-130 20 80-120 LCRA-ELS
SULFATE (MG/L AS SO4) mg/L water
EPA 300.0 Rev. 2.1 (1993)
00945 5 5 70-130 20 80-120 LCRA-ELS
*Hardness is not used for regulatory purposes but is used to assess metals in water at inland sites (estuarine sites do not require hardness analysis). References: United States Environmental Protection Agency (USEPA) Methods for Chemical Analysis of Water and Wastes, Manual #EPA-600/4-79-020 American Public Health Association (APHA), American Water Works Association (AWWA), and Water Environment Federation (WEF), Standard Methods for the Examination of Water and Wastewater, 20th Edition, 1998. (Note: The 21st edition may be cited if it becomes available.) TCEQ SOP, V1 - TCEQ Surface Water Quality Monitoring Procedures, Volume 1: Physical and Chemical Monitoring Methods, 2012 (RG-415). TCEQ SOP, V2 - TCEQ Surface Water Quality Monitoring Procedures, Volume 2: Methods for Collecting and Analyzing Biological Assemblage and Habitat Data, 2014 (RG-416)
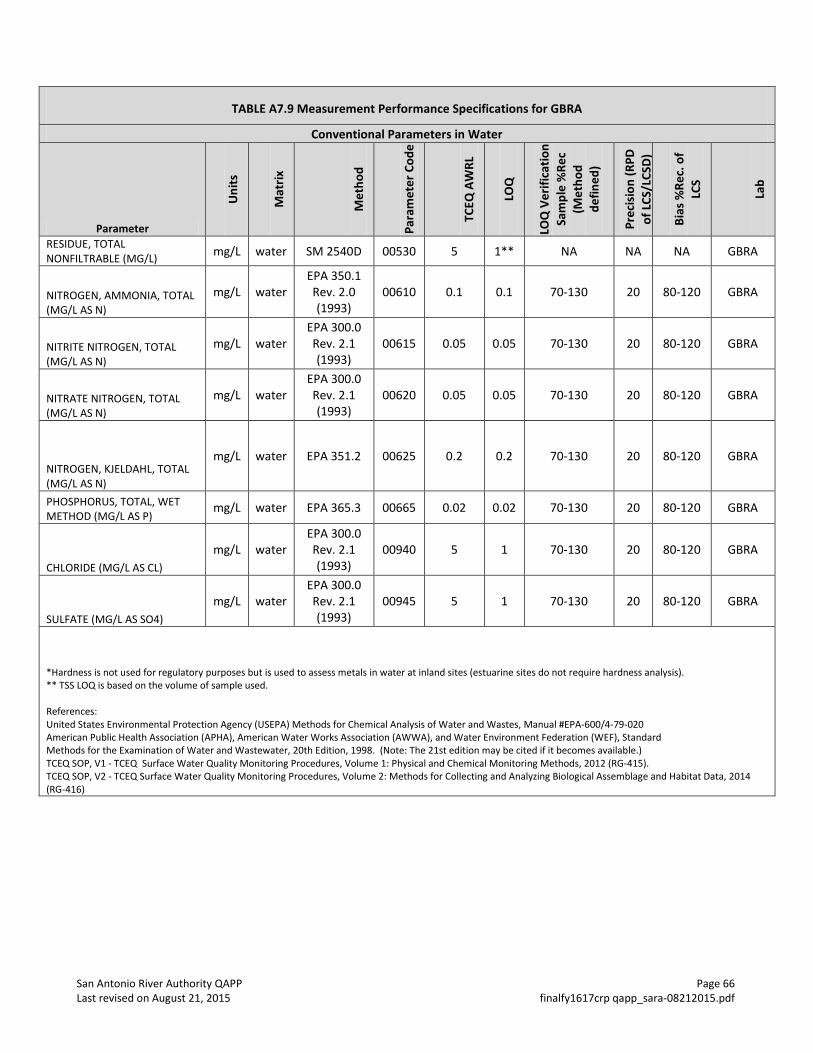
San Antonio River Authority QAPP Page 66 Last revised on August 21, 2015 finalfy1617crp qapp_sara-08212015.pdf
TABLE A7.9 Measurement Performance Specifications for GBRA
Conventional Parameters in Water
Parameter U
nits
Mat
rix
Met
hod
Para
met
er C
ode
TCEQ
AW
RL
LOQ
LOQ
Ver
ifica
tion
Sam
ple
%Re
c (M
etho
d de
fined
)
Prec
isio
n (R
PD
of L
CS/L
CSD)
Bias
%Re
c. o
f LC
S
Lab
RESIDUE, TOTAL NONFILTRABLE (MG/L) mg/L water SM 2540D 00530 5 1** NA NA NA GBRA
NITROGEN, AMMONIA, TOTAL (MG/L AS N)
mg/L water EPA 350.1 Rev. 2.0 (1993)
00610 0.1 0.1 70-130 20 80-120 GBRA
NITRITE NITROGEN, TOTAL (MG/L AS N)
mg/L water EPA 300.0 Rev. 2.1 (1993)
00615 0.05 0.05 70-130 20 80-120 GBRA
NITRATE NITROGEN, TOTAL (MG/L AS N)
mg/L water EPA 300.0 Rev. 2.1 (1993)
00620 0.05 0.05 70-130 20 80-120 GBRA
NITROGEN, KJELDAHL, TOTAL (MG/L AS N)
mg/L water EPA 351.2 00625 0.2 0.2 70-130 20 80-120 GBRA
PHOSPHORUS, TOTAL, WET METHOD (MG/L AS P)
mg/L water EPA 365.3 00665 0.02 0.02 70-130 20 80-120 GBRA
CHLORIDE (MG/L AS CL) mg/L water
EPA 300.0 Rev. 2.1 (1993)
00940 5 1 70-130 20 80-120 GBRA
SULFATE (MG/L AS SO4) mg/L water
EPA 300.0 Rev. 2.1 (1993)
00945 5 1 70-130 20 80-120 GBRA
*Hardness is not used for regulatory purposes but is used to assess metals in water at inland sites (estuarine sites do not require hardness analysis). ** TSS LOQ is based on the volume of sample used. References: United States Environmental Protection Agency (USEPA) Methods for Chemical Analysis of Water and Wastes, Manual #EPA-600/4-79-020 American Public Health Association (APHA), American Water Works Association (AWWA), and Water Environment Federation (WEF), Standard Methods for the Examination of Water and Wastewater, 20th Edition, 1998. (Note: The 21st edition may be cited if it becomes available.) TCEQ SOP, V1 - TCEQ Surface Water Quality Monitoring Procedures, Volume 1: Physical and Chemical Monitoring Methods, 2012 (RG-415). TCEQ SOP, V2 - TCEQ Surface Water Quality Monitoring Procedures, Volume 2: Methods for Collecting and Analyzing Biological Assemblage and Habitat Data, 2014 (RG-416)
San Antonio River Authority QAPP Page 67 Last revised on August 21, 2015 finalfy1617crp qapp_sara-08212015.pdf
Appendix B: Task 3 Work Plan & Sampling Process Design and Monitoring Schedule (Plan)
San Antonio River Authority QAPP Page 68 Last revised on August 21, 2015 finalfy1617crp qapp_sara-08212015.pdf
TASK 3: WATER QUALITY MONITORING
Objectives: Water quality monitoring will focus on collecting information to characterize water quality in a variety of locations and conditions. These efforts will include a combination of:
• planning and coordinating basin-wide monitoring; • routine, regularly-scheduled monitoring to collect long-term information and support statewide
assessment of water quality; • systematic, regularly-scheduled short-term monitoring to screen water bodies for issues;
Task Description: SARA personnel will conduct a basin water quality monitoring program according to the QAPP approved by TCEQ. All monitoring procedures and methods will follow the guidelines prescribed in SARA’s QAPP, which will reference the TCEQ Surface Water Quality Monitoring (SWQM) Procedures, Volume 1: Physical and Chemical Monitoring Methods (RG-415) and the TCEQ SWQM Procedures, Volume 2: Methods for Collecting and Analyzing Biological Assemblage and Habitat Data (RG-416). Monitoring Description - Additional details concerning the monitoring activities conducted by SARA are specifically outlined in the Grantee Basin-wide QAPP. The actual number of monitoring sites and frequency of collection is dependent on the outcome of the Coordinated Monitoring Meeting for FY2016. In general, the SARA will monitor a minimum of Tweny-three CRP sites under this agreement. Routine and Systematic Sites will be monitored a minimum of six times per year and the surface water samples will be analyzed for field, conventional, bacteria, and flow parameters. Sixteen water quality sites will have habitat, nekton, and flow sampling collected. Sixteen CRP sites will have 24-hour diel measurements collected, utilizing multi-parameter data sondes, at least once per year during the critical and index periods. In FY 2017, SARA will monitor at a similar level of effort as in FY 2016. The actual number of sites, location, frequency, and parameters collected will be based on priorities identified at the Steering Committee (a component of SARA Environmental Advisory Committee (EAC)) and Coordinated Monitoring meetings and included in the amended Appendix B schedule of the QAPP. Coordinated Monitoring Meeting - SARA will hold an annual coordinated monitoring meeting as described in the CRP Guidance. Qualified monitoring organizations will be invited to attend the working meeting in which monitoring needs and purposes will be discussed segment by segment and station by station. Information from participants and stakeholders will be used to select stations and parameters that will enhance overall water quality monitoring coverage, eliminate duplication of effort, and address basin priorities. A summary of the changes to the monitoring schedule will be provided to the participants within two weeks of the meeting. The changes to the monitoring schedule will be entered into the statewide database on the Internet (http://cms.lcra.org) and communicated to meeting attendees. Changes to monitoring schedules that occur during the course of the year will be entered into the statewide database on the Internet and communicated to meeting attendees. Progress Report - Each Progress Report will include all types of monitoring and indicate the number of sampling events and the types of monitoring conducted in the quarter. Special Studies - There are no special studies planned for FY6/17. In the event such a study is undertaken, the status reports of each special study will describe activities during the quarter. The status reports will be submitted along with the Progress Report. To help keep the public and basin stakeholders informed, SARA’s
San Antonio River Authority QAPP Page 69 Last revised on August 21, 2015 finalfy1617crp qapp_sara-08212015.pdf
website will be updated in a timely manner to include key elements of Special Studies’ Reports or Summaries (e.g., status reports, executive summary, maps, data analysis. Deliverables and Dues Dates: September 1, 2015 through August 31, 2016
A. Conduct water quality monitoring, summarize activities, and submit with Progress Report - December 15, 2015; March 15 and June 15, 2016
B. Coordinated Monitoring Meeting - between March 15 and April 30, 2016 C. Coordinated Monitoring Meeting Summary of Changes - within 2 weeks of the meeting D. Email notification that Coordinated Monitoring Schedule updates are complete - May 31, 2016
September 1, 2016 through August 31, 2017
A. Conduct water quality monitoring, summarize activities, and submit with Progress Report - September 15 and December 15, 2016; March 15 and June 15 and August 31, 2017
B. Coordinated Monitoring Meeting - between March 15 and April 30, 2017 C. Coordinated Monitoring Meeting Summary of Changes – within 2 weeks of the meeting D. Email notification that Coordinated Monitoring Schedule updates are complete - May 31, 2017
Clean Rivers Monitoring 1. Routine Monitoring – Traditional monitoring designed to identify general water quality in the basin and detect trends. It is not designed to target areas of concern, environmental conditions or events. Data will be submitted to the TCEQ SWQMIS database. 2. Biased seasonal sampling – Monitoring targeted toward a certain time of year. Nekton, Benthic Macro-Invertebrates, Habitat Assessments and 24 Hour DO sampling will be done under this type of monitoring. Data will be submitted to the TCEQ SWQMIS database SARA Stream Monitoring Program
1. Routine Monitoring – traditional monitoring designed to identify general water quality in the basin and detect trends. It is not designed to target areas of concerns, environmental conditions or events. Data will be submitted to TCEQ’s SWQMIS.
2. USAR Synoptic Monitoring – routine monitoring to be collected at designated locations simultaneously each week.
San Antonio River Authority QAPP Page 70 Last revised on August 21, 2015 finalfy1617crp qapp_sara-08212015.pdf
Sample Design Rationale FY 2016 The sample design is based on the legislative intent of CRP. Under the legislation, the Basin Planning Agencies have been tasked with providing data to characterize water quality conditions in support of the Texas Water Quality Integrated Report, and to identify significant long-term water quality trends. Based on Steering Committee input, achievable water quality objectives and priorities and the identification of water quality issues are used to develop work plans which are in accord with available resources. As part of the Steering Committee process, the San Antonio River Authority coordinates closely with the TCEQ and other participants to ensure a comprehensive water monitoring strategy within the watershed. Site Selection Criteria This data collection effort involves monitoring routine water quality, using procedures that are consistent with the TCEQ SWQM program, for the purpose of data entry into the SWQMIS database maintained by the TCEQ. To this end, some general guidelines are followed when selecting sampling sites, as basically outlined below, and discussed thoroughly in SWQM Procedures. Overall consideration is given to accessibility and safety. All monitoring activities have been developed in coordination with the CRP Steering Committee and with the TCEQ. The site selection criteria set forth here may not apply to all programs. The site selection criteria specified are those the TCEQ would like considered in order to produce data which is complementary to that collected by the state and which can be used in assessments, etc. Other criteria may be considered and should be described. 1. Locate stream sites so that samples can be safely collected from the centroid of flow. Centroid is
defined as the midpoint of that portion of stream width which contains 50 percent of the total flow. If few sites are available for a stream segment, choose one that would best represent the water body, and not an unusual condition or contaminant source. Avoid backwater areas or eddies when selecting a stream site.
2. At a minimum for reservoirs, locate sites near the dam (reservoirs) and in the major arms. Larger reservoirs might also include stations in the middle and upper (riverine) areas. Select sites that best represent the water body by avoiding coves and back water areas. A single monitoring site is considered representative of 25 percent of the total reservoir acres, but not more than 5,120 acres.
3. Routine monitoring sites are selected to maximize stream coverage or basin coverage. Very long segments may require more stations. As a rule of thumb, stream segments between 25 and 50 miles long require two stations, and longer than 50 miles require three or more depending on the existence of areas with significantly different sources of contamination or potential water quality concerns. Major hydrological features, such as the confluence of a major tributary or an instream dam, may also limit the spatial extent of an assessment based on one station.
4. Because historical water quality data can be very useful in assessing use attainment or impairment, it may be best to use sites that are on current or past monitoring schedules.
5. All classified segments (including reservoirs) should have at least one routine monitoring site that adequately characterizes the water body, and should be coordinated with the TCEQ or other qualified monitoring entities reporting routine data to TCEQ.
6. Routine monitoring sites may be selected to bracket sources of pollution, influence of tributaries, changes in land uses, and hydrological modifications.
San Antonio River Authority QAPP Page 71 Last revised on August 21, 2015 finalfy1617crp qapp_sara-08212015.pdf
7. Sites should be accessible. When possible, stream sites should have a USGS or IBWC stream flow gauge. If not, it should be possible to conduct flow measurement during routine visits.
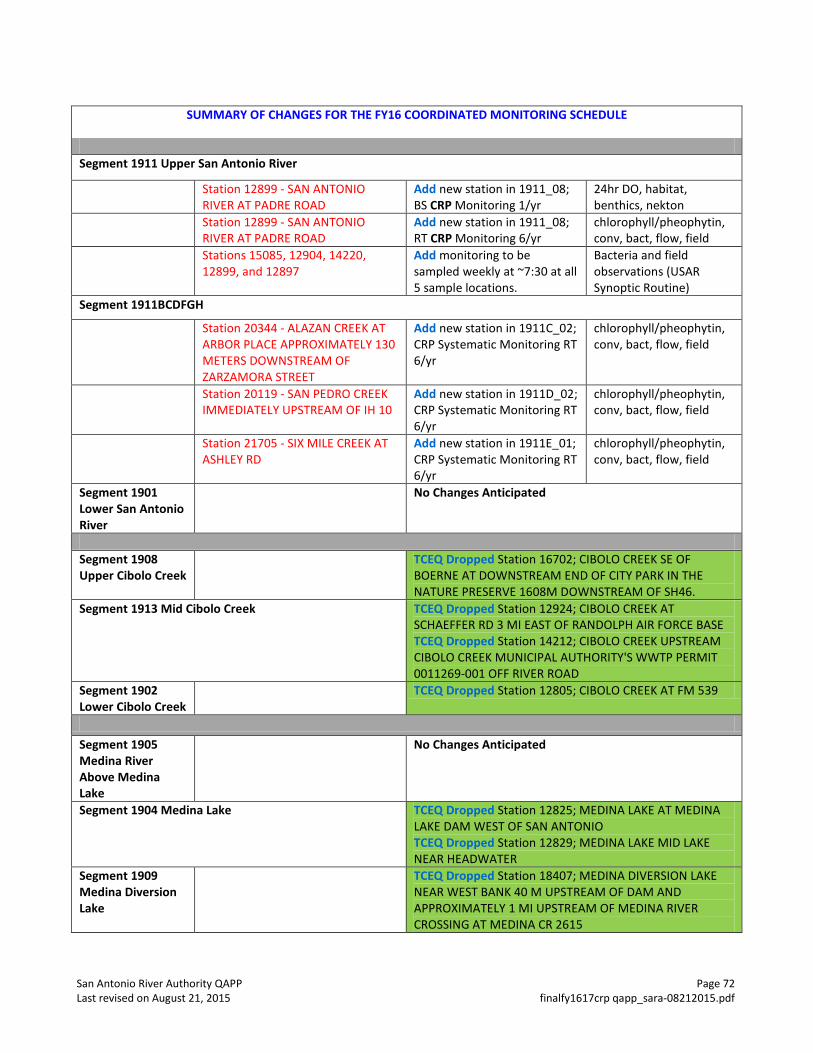
San Antonio River Authority QAPP Page 72 Last revised on August 21, 2015 finalfy1617crp qapp_sara-08212015.pdf
SUMMARY OF CHANGES FOR THE FY16 COORDINATED MONITORING SCHEDULE
Segment 1911 Upper San Antonio River
Station 12899 - SAN ANTONIO RIVER AT PADRE ROAD
Add new station in 1911_08; BS CRP Monitoring 1/yr
24hr DO, habitat, benthics, nekton
Station 12899 - SAN ANTONIO RIVER AT PADRE ROAD
Add new station in 1911_08; RT CRP Monitoring 6/yr
chlorophyll/pheophytin, conv, bact, flow, field
Stations 15085, 12904, 14220, 12899, and 12897
Add monitoring to be sampled weekly at ~7:30 at all 5 sample locations.
Bacteria and field observations (USAR Synoptic Routine)
Segment 1911BCDFGH
Station 20344 - ALAZAN CREEK AT ARBOR PLACE APPROXIMATELY 130 METERS DOWNSTREAM OF ZARZAMORA STREET
Add new station in 1911C_02; CRP Systematic Monitoring RT 6/yr
chlorophyll/pheophytin, conv, bact, flow, field
Station 20119 - SAN PEDRO CREEK IMMEDIATELY UPSTREAM OF IH 10
Add new station in 1911D_02; CRP Systematic Monitoring RT 6/yr
chlorophyll/pheophytin, conv, bact, flow, field
Station 21705 - SIX MILE CREEK AT ASHLEY RD
Add new station in 1911E_01; CRP Systematic Monitoring RT 6/yr
chlorophyll/pheophytin, conv, bact, flow, field
Segment 1901 Lower San Antonio River
No Changes Anticipated
Segment 1908 Upper Cibolo Creek
TCEQ Dropped Station 16702; CIBOLO CREEK SE OF BOERNE AT DOWNSTREAM END OF CITY PARK IN THE NATURE PRESERVE 1608M DOWNSTREAM OF SH46.
Segment 1913 Mid Cibolo Creek TCEQ Dropped Station 12924; CIBOLO CREEK AT SCHAEFFER RD 3 MI EAST OF RANDOLPH AIR FORCE BASE TCEQ Dropped Station 14212; CIBOLO CREEK UPSTREAM CIBOLO CREEK MUNICIPAL AUTHORITY'S WWTP PERMIT 0011269-001 OFF RIVER ROAD
Segment 1902 Lower Cibolo Creek
TCEQ Dropped Station 12805; CIBOLO CREEK AT FM 539
Segment 1905 Medina River Above Medina Lake
No Changes Anticipated
Segment 1904 Medina Lake TCEQ Dropped Station 12825; MEDINA LAKE AT MEDINA LAKE DAM WEST OF SAN ANTONIO TCEQ Dropped Station 12829; MEDINA LAKE MID LAKE NEAR HEADWATER
Segment 1909 Medina Diversion Lake
TCEQ Dropped Station 18407; MEDINA DIVERSION LAKE NEAR WEST BANK 40 M UPSTREAM OF DAM AND APPROXIMATELY 1 MI UPSTREAM OF MEDINA RIVER CROSSING AT MEDINA CR 2615
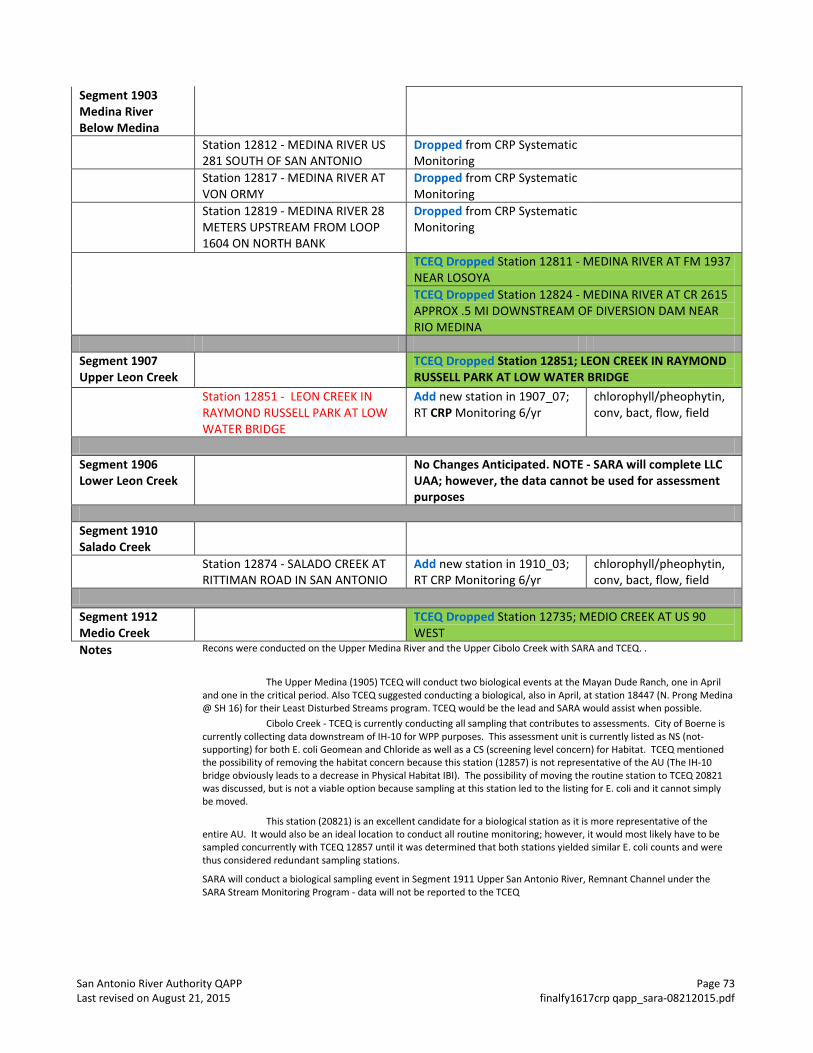
San Antonio River Authority QAPP Page 73 Last revised on August 21, 2015 finalfy1617crp qapp_sara-08212015.pdf
Segment 1903 Medina River Below Medina
Station 12812 - MEDINA RIVER US 281 SOUTH OF SAN ANTONIO
Dropped from CRP Systematic Monitoring
Station 12817 - MEDINA RIVER AT VON ORMY
Dropped from CRP Systematic Monitoring
Station 12819 - MEDINA RIVER 28 METERS UPSTREAM FROM LOOP 1604 ON NORTH BANK
Dropped from CRP Systematic Monitoring
TCEQ Dropped Station 12811 - MEDINA RIVER AT FM 1937 NEAR LOSOYA
TCEQ Dropped Station 12824 - MEDINA RIVER AT CR 2615 APPROX .5 MI DOWNSTREAM OF DIVERSION DAM NEAR RIO MEDINA
Segment 1907 Upper Leon Creek
TCEQ Dropped Station 12851; LEON CREEK IN RAYMOND RUSSELL PARK AT LOW WATER BRIDGE
Station 12851 - LEON CREEK IN RAYMOND RUSSELL PARK AT LOW WATER BRIDGE
Add new station in 1907_07; RT CRP Monitoring 6/yr
chlorophyll/pheophytin, conv, bact, flow, field
Segment 1906 Lower Leon Creek
No Changes Anticipated. NOTE - SARA will complete LLC UAA; however, the data cannot be used for assessment purposes
Segment 1910 Salado Creek
Station 12874 - SALADO CREEK AT RITTIMAN ROAD IN SAN ANTONIO
Add new station in 1910_03; RT CRP Monitoring 6/yr
chlorophyll/pheophytin, conv, bact, flow, field
Segment 1912 Medio Creek
TCEQ Dropped Station 12735; MEDIO CREEK AT US 90 WEST
Notes Recons were conducted on the Upper Medina River and the Upper Cibolo Creek with SARA and TCEQ. .
The Upper Medina (1905) TCEQ will conduct two biological events at the Mayan Dude Ranch, one in April and one in the critical period. Also TCEQ suggested conducting a biological, also in April, at station 18447 (N. Prong Medina @ SH 16) for their Least Disturbed Streams program. TCEQ would be the lead and SARA would assist when possible.
Cibolo Creek - TCEQ is currently conducting all sampling that contributes to assessments. City of Boerne is currently collecting data downstream of IH-10 for WPP purposes. This assessment unit is currently listed as NS (not-supporting) for both E. coli Geomean and Chloride as well as a CS (screening level concern) for Habitat. TCEQ mentioned the possibility of removing the habitat concern because this station (12857) is not representative of the AU (The IH-10 bridge obviously leads to a decrease in Physical Habitat IBI). The possibility of moving the routine station to TCEQ 20821 was discussed, but is not a viable option because sampling at this station led to the listing for E. coli and it cannot simply be moved.
This station (20821) is an excellent candidate for a biological station as it is more representative of the entire AU. It would also be an ideal location to conduct all routine monitoring; however, it would most likely have to be sampled concurrently with TCEQ 12857 until it was determined that both stations yielded similar E. coli counts and were thus considered redundant sampling stations.
SARA will conduct a biological sampling event in Segment 1911 Upper San Antonio River, Remnant Channel under the SARA Stream Monitoring Program - data will not be reported to the TCEQ
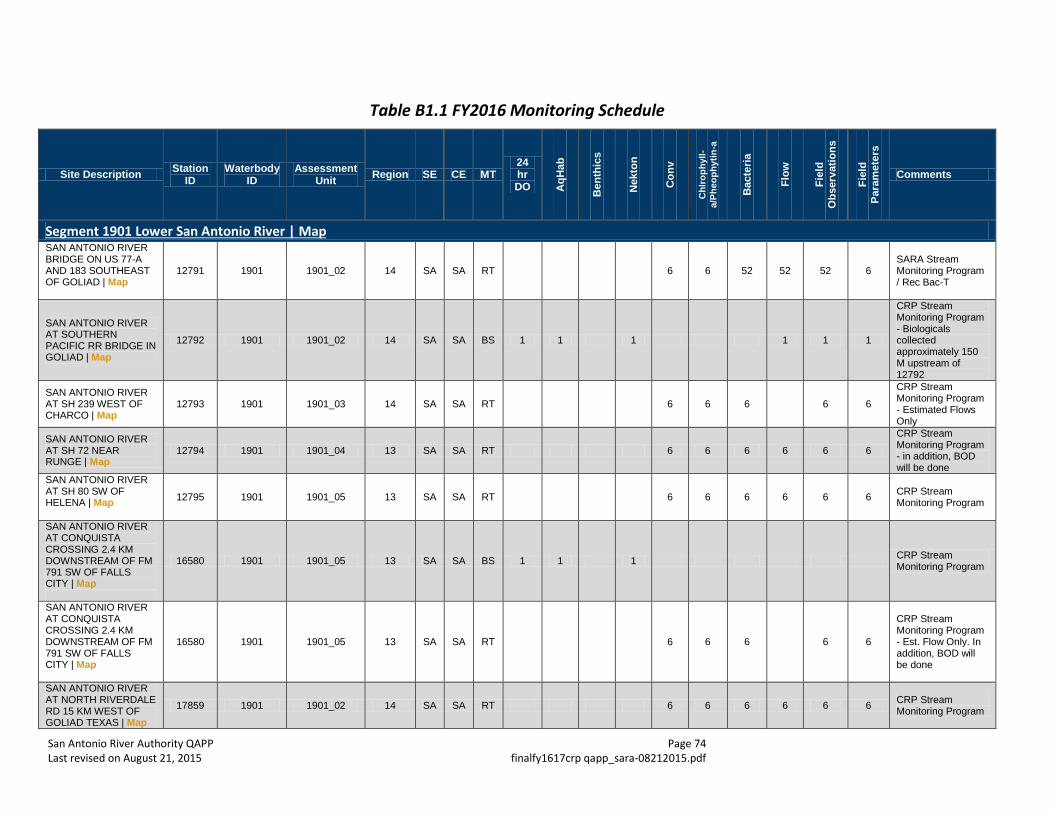
San Antonio River Authority QAPP Page 74 Last revised on August 21, 2015 finalfy1617crp qapp_sara-08212015.pdf
Table B1.1 FY2016 Monitoring Schedule
Site Description Station ID
Waterbody ID
Assessment Unit Region SE CE MT
24 hr DO A
qHab
Ben
thic
s
Nek
ton
Con
v
Chl
roph
yll-
a/Ph
eoph
ytin
-a
Bac
teria
Flow
Fiel
d O
bser
vatio
ns
Fiel
d Pa
ram
eter
s
Comments
Segment 1901 Lower San Antonio River | Map
SAN ANTONIO RIVER BRIDGE ON US 77-A AND 183 SOUTHEAST OF GOLIAD | Map
12791 1901 1901_02 14 SA SA RT 6 6 52 52 52 6 SARA Stream Monitoring Program / Rec Bac-T
SAN ANTONIO RIVER AT SOUTHERN PACIFIC RR BRIDGE IN GOLIAD | Map
12792 1901 1901_02 14 SA SA BS 1 1 1 1 1 1
CRP Stream Monitoring Program - Biologicals collected approximately 150 M upstream of 12792
SAN ANTONIO RIVER AT SH 239 WEST OF CHARCO | Map
12793 1901 1901_03 14 SA SA RT 6 6 6 6 6
CRP Stream Monitoring Program - Estimated Flows Only
SAN ANTONIO RIVER AT SH 72 NEAR RUNGE | Map
12794 1901 1901_04 13 SA SA RT 6 6 6 6 6 6
CRP Stream Monitoring Program - in addition, BOD will be done
SAN ANTONIO RIVER AT SH 80 SW OF HELENA | Map
12795 1901 1901_05 13 SA SA RT 6 6 6 6 6 6 CRP Stream Monitoring Program
SAN ANTONIO RIVER AT CONQUISTA CROSSING 2.4 KM DOWNSTREAM OF FM 791 SW OF FALLS CITY | Map
16580 1901 1901_05 13 SA SA BS 1 1 1 CRP Stream Monitoring Program
SAN ANTONIO RIVER AT CONQUISTA CROSSING 2.4 KM DOWNSTREAM OF FM 791 SW OF FALLS CITY | Map
16580 1901 1901_05 13 SA SA RT 6 6 6 6 6
CRP Stream Monitoring Program - Est. Flow Only. In addition, BOD will be done
SAN ANTONIO RIVER AT NORTH RIVERDALE RD 15 KM WEST OF GOLIAD TEXAS | Map
17859 1901 1901_02 14 SA SA RT 6 6 6 6 6 6 CRP Stream Monitoring Program
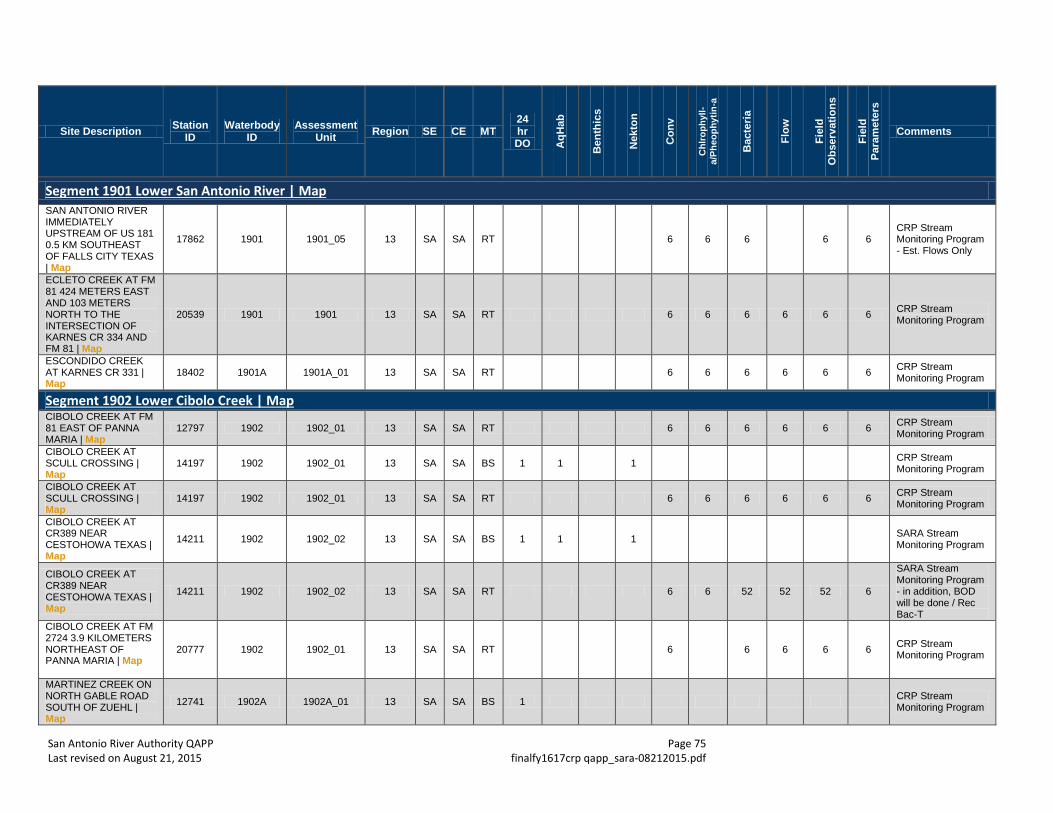
San Antonio River Authority QAPP Page 75 Last revised on August 21, 2015 finalfy1617crp qapp_sara-08212015.pdf
Site Description Station ID
Waterbody ID
Assessment Unit Region SE CE MT
24 hr DO A
qHab
Ben
thic
s
Nek
ton
Con
v
Chl
roph
yll-
a/Ph
eoph
ytin
-a
Bac
teria
Flow
Fiel
d O
bser
vatio
ns
Fiel
d Pa
ram
eter
s
Comments
Segment 1901 Lower San Antonio River | Map
SAN ANTONIO RIVER IMMEDIATELY UPSTREAM OF US 181 0.5 KM SOUTHEAST OF FALLS CITY TEXAS | Map
17862 1901 1901_05 13 SA SA RT 6 6 6 6 6 CRP Stream Monitoring Program - Est. Flows Only
ECLETO CREEK AT FM 81 424 METERS EAST AND 103 METERS NORTH TO THE INTERSECTION OF KARNES CR 334 AND FM 81 | Map
20539 1901 1901 13 SA SA RT 6 6 6 6 6 6 CRP Stream Monitoring Program
ESCONDIDO CREEK AT KARNES CR 331 | Map
18402 1901A 1901A_01 13 SA SA RT 6 6 6 6 6 6 CRP Stream Monitoring Program
Segment 1902 Lower Cibolo Creek | Map
CIBOLO CREEK AT FM 81 EAST OF PANNA MARIA | Map
12797 1902 1902_01 13 SA SA RT 6 6 6 6 6 6 CRP Stream Monitoring Program
CIBOLO CREEK AT SCULL CROSSING | Map
14197 1902 1902_01 13 SA SA BS 1 1 1 CRP Stream Monitoring Program
CIBOLO CREEK AT SCULL CROSSING | Map
14197 1902 1902_01 13 SA SA RT 6 6 6 6 6 6 CRP Stream Monitoring Program
CIBOLO CREEK AT CR389 NEAR CESTOHOWA TEXAS | Map
14211 1902 1902_02 13 SA SA BS 1 1 1 SARA Stream Monitoring Program
CIBOLO CREEK AT CR389 NEAR CESTOHOWA TEXAS | Map
14211 1902 1902_02 13 SA SA RT 6 6 52 52 52 6
SARA Stream Monitoring Program - in addition, BOD will be done / Rec Bac-T
CIBOLO CREEK AT FM 2724 3.9 KILOMETERS NORTHEAST OF PANNA MARIA | Map
20777 1902 1902_01 13 SA SA RT 6 6 6 6 6 CRP Stream Monitoring Program
MARTINEZ CREEK ON NORTH GABLE ROAD SOUTH OF ZUEHL | Map
12741 1902A 1902A_01 13 SA SA BS 1 CRP Stream Monitoring Program
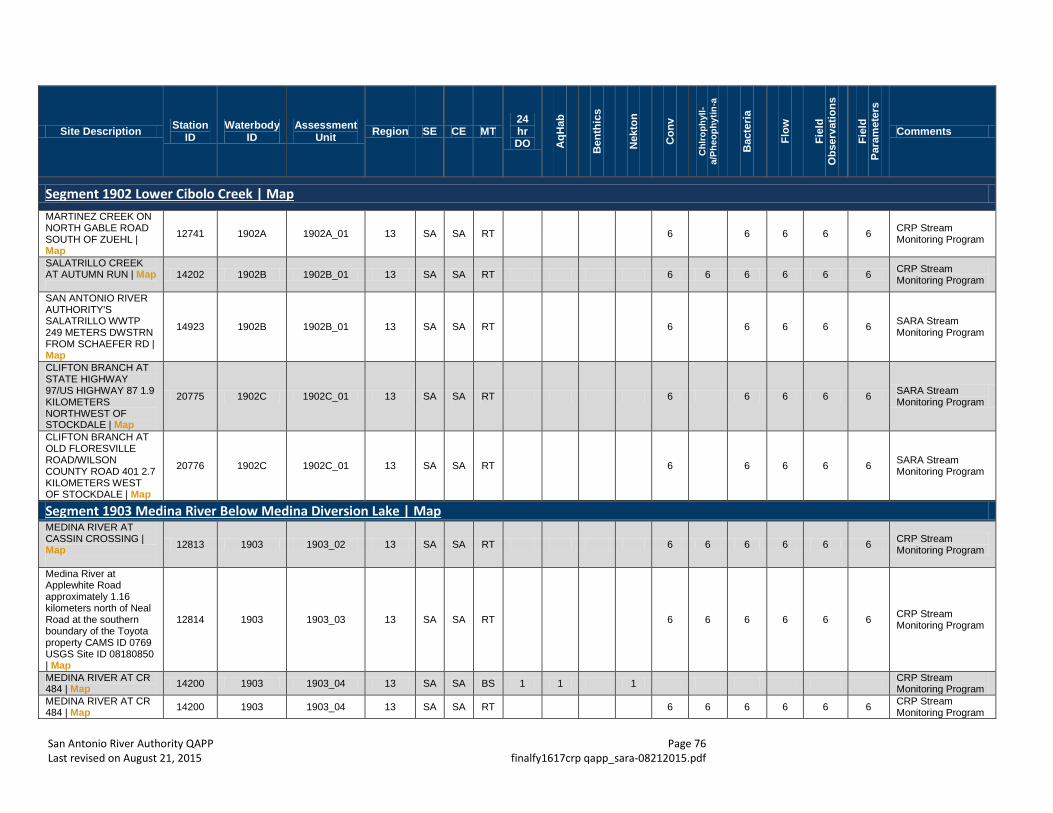
San Antonio River Authority QAPP Page 76 Last revised on August 21, 2015 finalfy1617crp qapp_sara-08212015.pdf
Site Description Station ID
Waterbody ID
Assessment Unit Region SE CE MT
24 hr DO A
qHab
Ben
thic
s
Nek
ton
Con
v
Chl
roph
yll-
a/Ph
eoph
ytin
-a
Bac
teria
Flow
Fiel
d O
bser
vatio
ns
Fiel
d Pa
ram
eter
s
Comments
Segment 1902 Lower Cibolo Creek | Map
MARTINEZ CREEK ON NORTH GABLE ROAD SOUTH OF ZUEHL | Map
12741 1902A 1902A_01 13 SA SA RT 6 6 6 6 6 CRP Stream Monitoring Program
SALATRILLO CREEK AT AUTUMN RUN | Map
14202 1902B 1902B_01 13 SA SA RT 6 6 6 6 6 6 CRP Stream Monitoring Program
SAN ANTONIO RIVER AUTHORITY'S SALATRILLO WWTP 249 METERS DWSTRN FROM SCHAEFER RD | Map
14923 1902B 1902B_01 13 SA SA RT 6 6 6 6 6 SARA Stream Monitoring Program
CLIFTON BRANCH AT STATE HIGHWAY 97/US HIGHWAY 87 1.9 KILOMETERS NORTHWEST OF STOCKDALE | Map
20775 1902C 1902C_01 13 SA SA RT 6 6 6 6 6 SARA Stream Monitoring Program
CLIFTON BRANCH AT OLD FLORESVILLE ROAD/WILSON COUNTY ROAD 401 2.7 KILOMETERS WEST OF STOCKDALE | Map
20776 1902C 1902C_01 13 SA SA RT 6 6 6 6 6 SARA Stream Monitoring Program
Segment 1903 Medina River Below Medina Diversion Lake | Map
MEDINA RIVER AT CASSIN CROSSING | Map
12813 1903 1903_02 13 SA SA RT 6 6 6 6 6 6 CRP Stream Monitoring Program
Medina River at Applewhite Road approximately 1.16 kilometers north of Neal Road at the southern boundary of the Toyota property CAMS ID 0769 USGS Site ID 08180850 | Map
12814 1903 1903_03 13 SA SA RT 6 6 6 6 6 6 CRP Stream Monitoring Program
MEDINA RIVER AT CR 484 | Map 14200 1903 1903_04 13 SA SA BS 1 1 1 CRP Stream
Monitoring Program MEDINA RIVER AT CR 484 | Map 14200 1903 1903_04 13 SA SA RT 6 6 6 6 6 6 CRP Stream
Monitoring Program
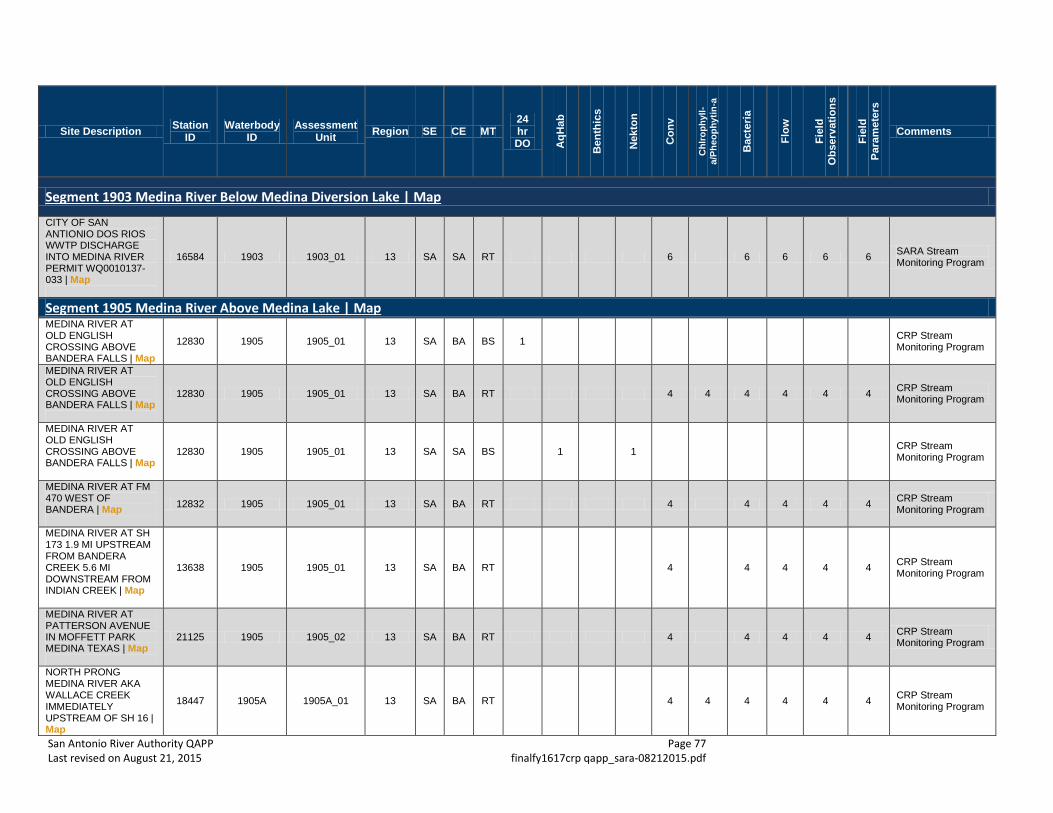
San Antonio River Authority QAPP Page 77 Last revised on August 21, 2015 finalfy1617crp qapp_sara-08212015.pdf
Site Description Station ID
Waterbody ID
Assessment Unit Region SE CE MT
24 hr DO A
qHab
Ben
thic
s
Nek
ton
Con
v
Chl
roph
yll-
a/Ph
eoph
ytin
-a
Bac
teria
Flow
Fiel
d O
bser
vatio
ns
Fiel
d Pa
ram
eter
s
Comments
Segment 1903 Medina River Below Medina Diversion Lake | Map
CITY OF SAN ANTIONIO DOS RIOS WWTP DISCHARGE INTO MEDINA RIVER PERMIT WQ0010137-033 | Map
16584 1903 1903_01 13 SA SA RT 6 6 6 6 6 SARA Stream Monitoring Program
Segment 1905 Medina River Above Medina Lake | Map
MEDINA RIVER AT OLD ENGLISH CROSSING ABOVE BANDERA FALLS | Map
12830 1905 1905_01 13 SA BA BS 1 CRP Stream Monitoring Program
MEDINA RIVER AT OLD ENGLISH CROSSING ABOVE BANDERA FALLS | Map
12830 1905 1905_01 13 SA BA RT 4 4 4 4 4 4 CRP Stream Monitoring Program
MEDINA RIVER AT OLD ENGLISH CROSSING ABOVE BANDERA FALLS | Map
12830 1905 1905_01 13 SA SA BS 1 1 CRP Stream Monitoring Program
MEDINA RIVER AT FM 470 WEST OF BANDERA | Map
12832 1905 1905_01 13 SA BA RT 4 4 4 4 4 CRP Stream Monitoring Program
MEDINA RIVER AT SH 173 1.9 MI UPSTREAM FROM BANDERA CREEK 5.6 MI DOWNSTREAM FROM INDIAN CREEK | Map
13638 1905 1905_01 13 SA BA RT 4 4 4 4 4 CRP Stream Monitoring Program
MEDINA RIVER AT PATTERSON AVENUE IN MOFFETT PARK MEDINA TEXAS | Map
21125 1905 1905_02 13 SA BA RT 4 4 4 4 4 CRP Stream Monitoring Program
NORTH PRONG MEDINA RIVER AKA WALLACE CREEK IMMEDIATELY UPSTREAM OF SH 16 | Map
18447 1905A 1905A_01 13 SA BA RT 4 4 4 4 4 4 CRP Stream Monitoring Program
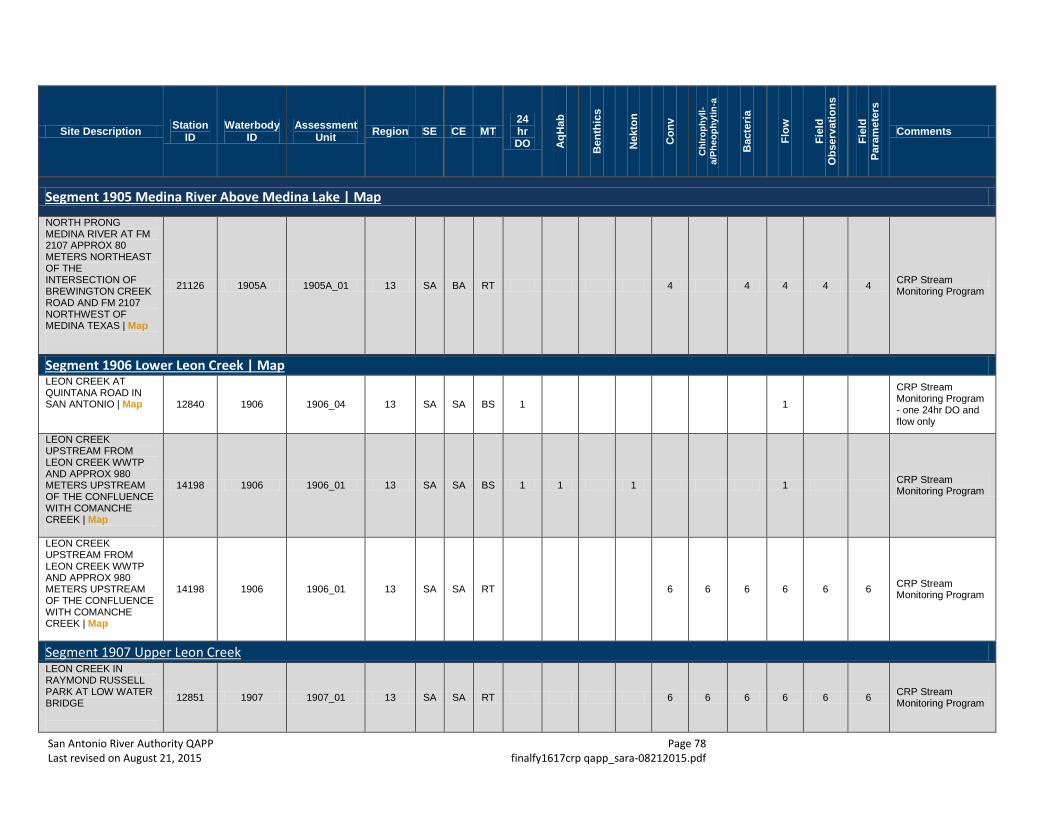
San Antonio River Authority QAPP Page 78 Last revised on August 21, 2015 finalfy1617crp qapp_sara-08212015.pdf
Site Description Station ID
Waterbody ID
Assessment Unit Region SE CE MT
24 hr DO A
qHab
Ben
thic
s
Nek
ton
Con
v
Chl
roph
yll-
a/Ph
eoph
ytin
-a
Bac
teria
Flow
Fiel
d O
bser
vatio
ns
Fiel
d Pa
ram
eter
s
Comments
Segment 1905 Medina River Above Medina Lake | Map
NORTH PRONG MEDINA RIVER AT FM 2107 APPROX 80 METERS NORTHEAST OF THE INTERSECTION OF BREWINGTON CREEK ROAD AND FM 2107 NORTHWEST OF MEDINA TEXAS | Map
21126 1905A 1905A_01 13 SA BA RT 4 4 4 4 4 CRP Stream Monitoring Program
Segment 1906 Lower Leon Creek | Map
LEON CREEK AT QUINTANA ROAD IN SAN ANTONIO | Map
12840 1906 1906_04 13 SA SA BS 1 1
CRP Stream Monitoring Program - one 24hr DO and flow only
LEON CREEK UPSTREAM FROM LEON CREEK WWTP AND APPROX 980 METERS UPSTREAM OF THE CONFLUENCE WITH COMANCHE CREEK | Map
14198 1906 1906_01 13 SA SA BS 1 1 1 1 CRP Stream Monitoring Program
LEON CREEK UPSTREAM FROM LEON CREEK WWTP AND APPROX 980 METERS UPSTREAM OF THE CONFLUENCE WITH COMANCHE CREEK | Map
14198 1906 1906_01 13 SA SA RT 6 6 6 6 6 6 CRP Stream Monitoring Program
Segment 1907 Upper Leon Creek LEON CREEK IN RAYMOND RUSSELL PARK AT LOW WATER BRIDGE
12851 1907 1907_01 13 SA SA RT 6 6 6 6 6 6 CRP Stream Monitoring Program
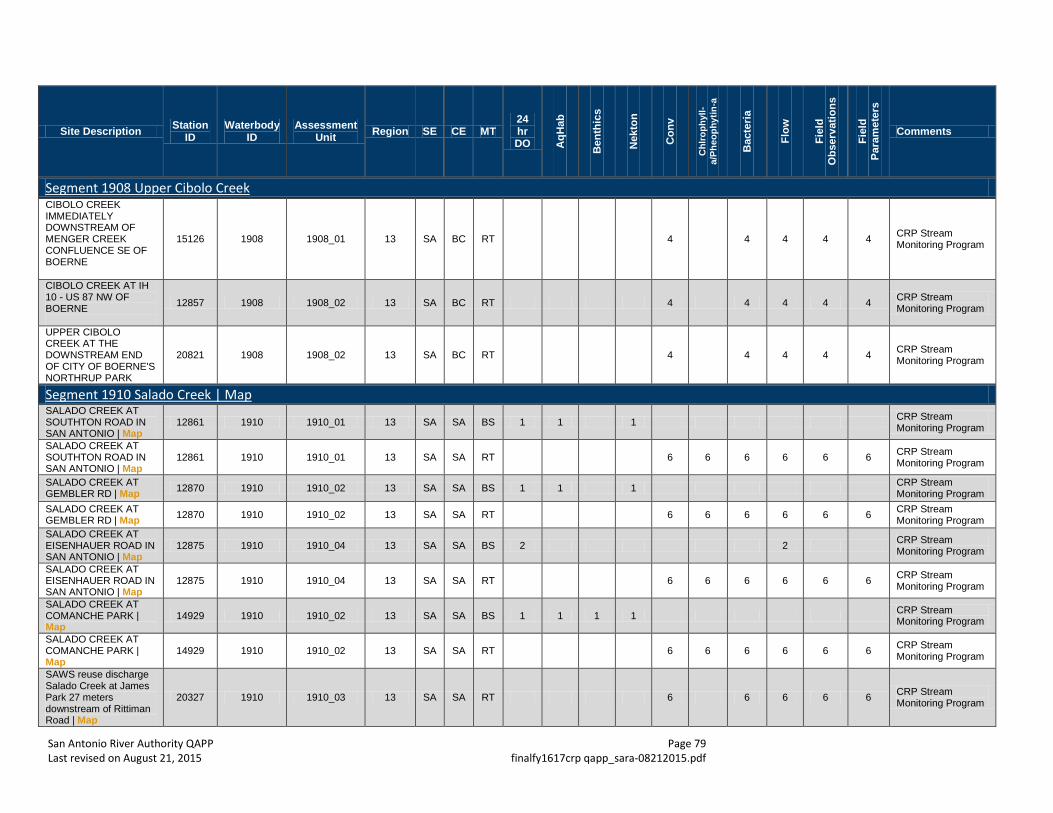
San Antonio River Authority QAPP Page 79 Last revised on August 21, 2015 finalfy1617crp qapp_sara-08212015.pdf
Site Description Station ID
Waterbody ID
Assessment Unit Region SE CE MT
24 hr DO A
qHab
Ben
thic
s
Nek
ton
Con
v
Chl
roph
yll-
a/Ph
eoph
ytin
-a
Bac
teria
Flow
Fiel
d O
bser
vatio
ns
Fiel
d Pa
ram
eter
s
Comments
Segment 1908 Upper Cibolo Creek CIBOLO CREEK IMMEDIATELY DOWNSTREAM OF MENGER CREEK CONFLUENCE SE OF BOERNE
15126 1908 1908_01 13 SA BC RT 4 4 4 4 4 CRP Stream Monitoring Program
CIBOLO CREEK AT IH 10 - US 87 NW OF BOERNE
12857 1908 1908_02 13 SA BC RT 4 4 4 4 4 CRP Stream Monitoring Program
UPPER CIBOLO CREEK AT THE DOWNSTREAM END OF CITY OF BOERNE'S NORTHRUP PARK
20821 1908 1908_02 13 SA BC RT 4 4 4 4 4 CRP Stream Monitoring Program
Segment 1910 Salado Creek | Map
SALADO CREEK AT SOUTHTON ROAD IN SAN ANTONIO | Map
12861 1910 1910_01 13 SA SA BS 1 1 1 CRP Stream Monitoring Program
SALADO CREEK AT SOUTHTON ROAD IN SAN ANTONIO | Map
12861 1910 1910_01 13 SA SA RT 6 6 6 6 6 6 CRP Stream Monitoring Program
SALADO CREEK AT GEMBLER RD | Map 12870 1910 1910_02 13 SA SA BS 1 1 1 CRP Stream
Monitoring Program SALADO CREEK AT GEMBLER RD | Map 12870 1910 1910_02 13 SA SA RT 6 6 6 6 6 6 CRP Stream
Monitoring Program SALADO CREEK AT EISENHAUER ROAD IN SAN ANTONIO | Map
12875 1910 1910_04 13 SA SA BS 2 2 CRP Stream Monitoring Program
SALADO CREEK AT EISENHAUER ROAD IN SAN ANTONIO | Map
12875 1910 1910_04 13 SA SA RT 6 6 6 6 6 6 CRP Stream Monitoring Program
SALADO CREEK AT COMANCHE PARK | Map
14929 1910 1910_02 13 SA SA BS 1 1 1 1 CRP Stream Monitoring Program
SALADO CREEK AT COMANCHE PARK | Map
14929 1910 1910_02 13 SA SA RT 6 6 6 6 6 6 CRP Stream Monitoring Program
SAWS reuse discharge Salado Creek at James Park 27 meters downstream of Rittiman Road | Map
20327 1910 1910_03 13 SA SA RT 6 6 6 6 6 CRP Stream Monitoring Program
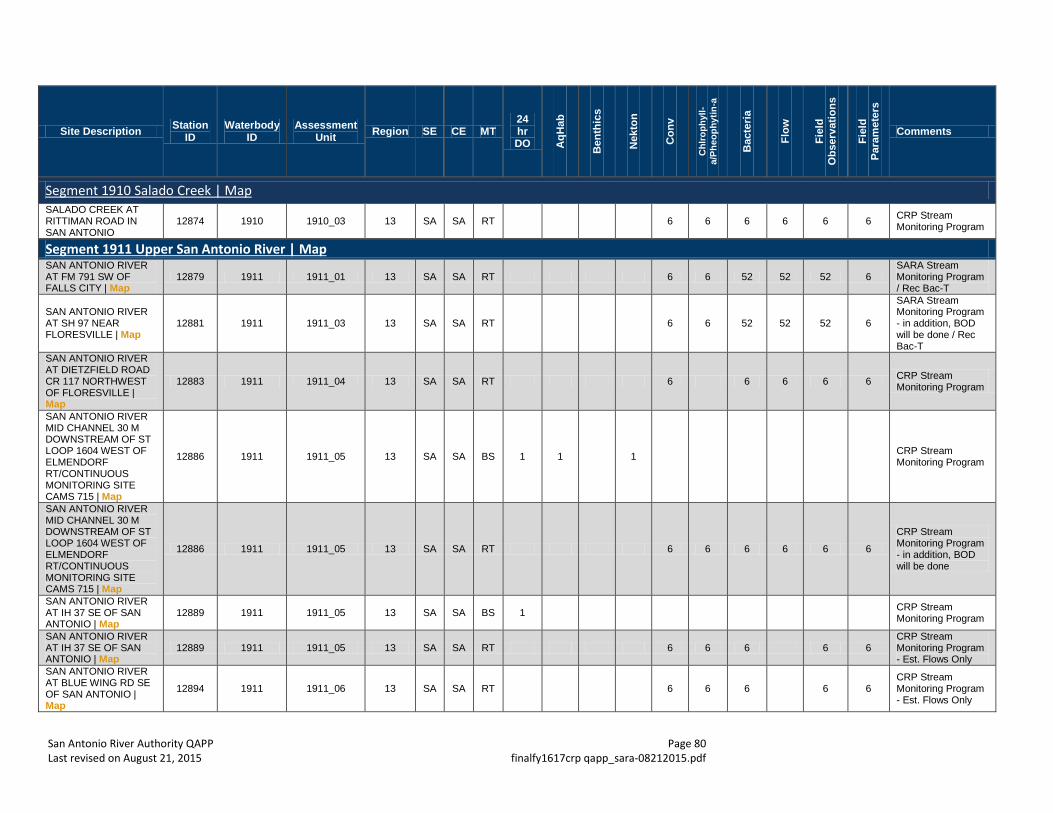
San Antonio River Authority QAPP Page 80 Last revised on August 21, 2015 finalfy1617crp qapp_sara-08212015.pdf
Site Description Station ID
Waterbody ID
Assessment Unit Region SE CE MT
24 hr DO A
qHab
Ben
thic
s
Nek
ton
Con
v
Chl
roph
yll-
a/Ph
eoph
ytin
-a
Bac
teria
Flow
Fiel
d O
bser
vatio
ns
Fiel
d Pa
ram
eter
s
Comments
Segment 1910 Salado Creek | Map
SALADO CREEK AT RITTIMAN ROAD IN SAN ANTONIO
12874 1910 1910_03 13 SA SA RT 6 6 6 6 6 6 CRP Stream Monitoring Program
Segment 1911 Upper San Antonio River | Map
SAN ANTONIO RIVER AT FM 791 SW OF FALLS CITY | Map
12879 1911 1911_01 13 SA SA RT 6 6 52 52 52 6 SARA Stream Monitoring Program / Rec Bac-T
SAN ANTONIO RIVER AT SH 97 NEAR FLORESVILLE | Map
12881 1911 1911_03 13 SA SA RT 6 6 52 52 52 6
SARA Stream Monitoring Program - in addition, BOD will be done / Rec Bac-T
SAN ANTONIO RIVER AT DIETZFIELD ROAD CR 117 NORTHWEST OF FLORESVILLE | Map
12883 1911 1911_04 13 SA SA RT 6 6 6 6 6 CRP Stream Monitoring Program
SAN ANTONIO RIVER MID CHANNEL 30 M DOWNSTREAM OF ST LOOP 1604 WEST OF ELMENDORF RT/CONTINUOUS MONITORING SITE CAMS 715 | Map
12886 1911 1911_05 13 SA SA BS 1 1 1 CRP Stream Monitoring Program
SAN ANTONIO RIVER MID CHANNEL 30 M DOWNSTREAM OF ST LOOP 1604 WEST OF ELMENDORF RT/CONTINUOUS MONITORING SITE CAMS 715 | Map
12886 1911 1911_05 13 SA SA RT 6 6 6 6 6 6
CRP Stream Monitoring Program - in addition, BOD will be done
SAN ANTONIO RIVER AT IH 37 SE OF SAN ANTONIO | Map
12889 1911 1911_05 13 SA SA BS 1 CRP Stream Monitoring Program
SAN ANTONIO RIVER AT IH 37 SE OF SAN ANTONIO | Map
12889 1911 1911_05 13 SA SA RT 6 6 6 6 6 CRP Stream Monitoring Program - Est. Flows Only
SAN ANTONIO RIVER AT BLUE WING RD SE OF SAN ANTONIO | Map
12894 1911 1911_06 13 SA SA RT 6 6 6 6 6 CRP Stream Monitoring Program - Est. Flows Only
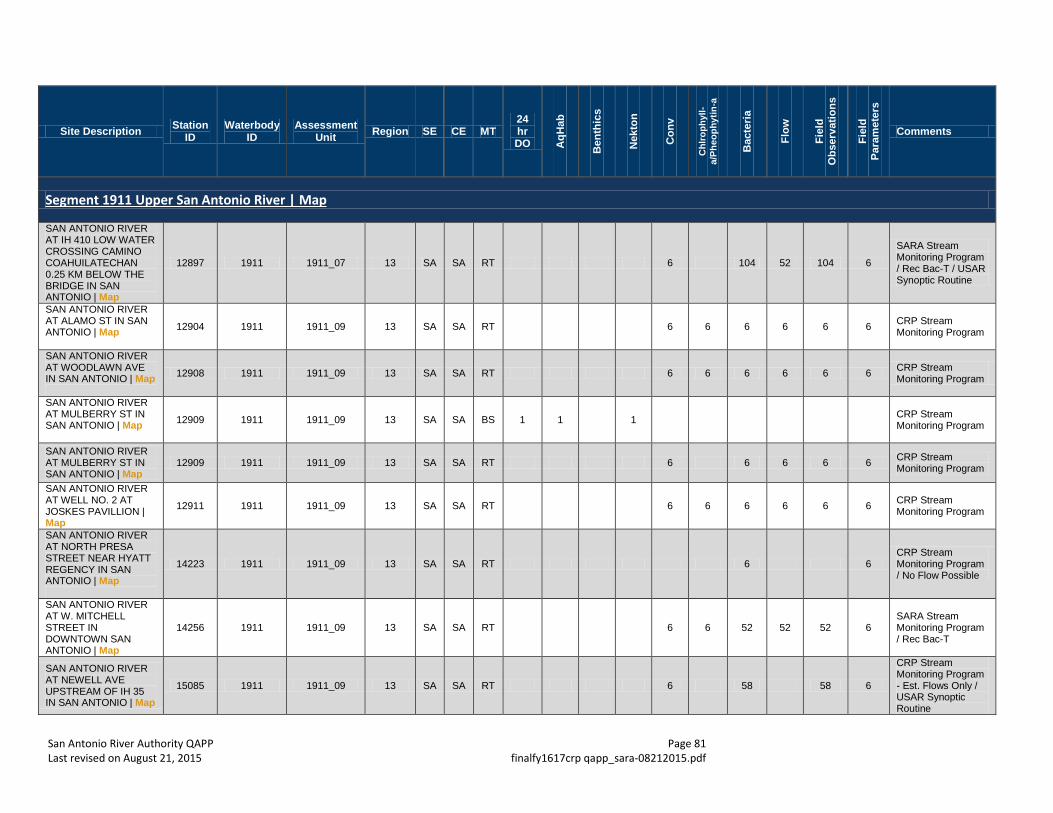
San Antonio River Authority QAPP Page 81 Last revised on August 21, 2015 finalfy1617crp qapp_sara-08212015.pdf
Site Description Station ID
Waterbody ID
Assessment Unit Region SE CE MT
24 hr DO A
qHab
Ben
thic
s
Nek
ton
Con
v
Chl
roph
yll-
a/Ph
eoph
ytin
-a
Bac
teria
Flow
Fiel
d O
bser
vatio
ns
Fiel
d Pa
ram
eter
s
Comments
Segment 1911 Upper San Antonio River | Map
SAN ANTONIO RIVER AT IH 410 LOW WATER CROSSING CAMINO COAHUILATECHAN 0.25 KM BELOW THE BRIDGE IN SAN ANTONIO | Map
12897 1911 1911_07 13 SA SA RT 6 104 52 104 6
SARA Stream Monitoring Program / Rec Bac-T / USAR Synoptic Routine
SAN ANTONIO RIVER AT ALAMO ST IN SAN ANTONIO | Map
12904 1911 1911_09 13 SA SA RT 6 6 6 6 6 6 CRP Stream Monitoring Program
SAN ANTONIO RIVER AT WOODLAWN AVE IN SAN ANTONIO | Map
12908 1911 1911_09 13 SA SA RT 6 6 6 6 6 6 CRP Stream Monitoring Program
SAN ANTONIO RIVER AT MULBERRY ST IN SAN ANTONIO | Map
12909 1911 1911_09 13 SA SA BS 1 1 1 CRP Stream Monitoring Program
SAN ANTONIO RIVER AT MULBERRY ST IN SAN ANTONIO | Map
12909 1911 1911_09 13 SA SA RT 6 6 6 6 6 CRP Stream Monitoring Program
SAN ANTONIO RIVER AT WELL NO. 2 AT JOSKES PAVILLION | Map
12911 1911 1911_09 13 SA SA RT 6 6 6 6 6 6 CRP Stream Monitoring Program
SAN ANTONIO RIVER AT NORTH PRESA STREET NEAR HYATT REGENCY IN SAN ANTONIO | Map
14223 1911 1911_09 13 SA SA RT 6 6 CRP Stream Monitoring Program / No Flow Possible
SAN ANTONIO RIVER AT W. MITCHELL STREET IN DOWNTOWN SAN ANTONIO | Map
14256 1911 1911_09 13 SA SA RT 6 6 52 52 52 6 SARA Stream Monitoring Program / Rec Bac-T
SAN ANTONIO RIVER AT NEWELL AVE UPSTREAM OF IH 35 IN SAN ANTONIO | Map
15085 1911 1911_09 13 SA SA RT 6 58 58 6
CRP Stream Monitoring Program - Est. Flows Only / USAR Synoptic Routine
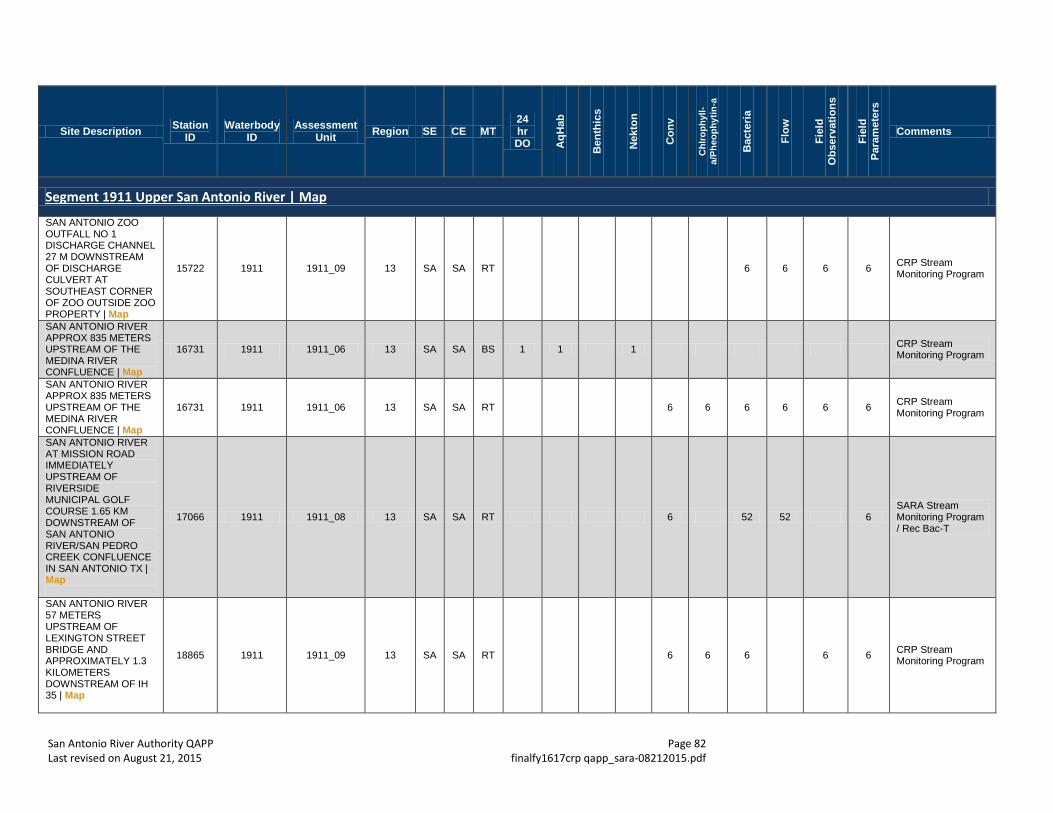
San Antonio River Authority QAPP Page 82 Last revised on August 21, 2015 finalfy1617crp qapp_sara-08212015.pdf
Site Description Station ID
Waterbody ID
Assessment Unit Region SE CE MT
24 hr DO A
qHab
Ben
thic
s
Nek
ton
Con
v
Chl
roph
yll-
a/Ph
eoph
ytin
-a
Bac
teria
Flow
Fiel
d O
bser
vatio
ns
Fiel
d Pa
ram
eter
s
Comments
Segment 1911 Upper San Antonio River | Map
SAN ANTONIO ZOO OUTFALL NO 1 DISCHARGE CHANNEL 27 M DOWNSTREAM OF DISCHARGE CULVERT AT SOUTHEAST CORNER OF ZOO OUTSIDE ZOO PROPERTY | Map
15722 1911 1911_09 13 SA SA RT 6 6 6 6 CRP Stream Monitoring Program
SAN ANTONIO RIVER APPROX 835 METERS UPSTREAM OF THE MEDINA RIVER CONFLUENCE | Map
16731 1911 1911_06 13 SA SA BS 1 1 1 CRP Stream Monitoring Program
SAN ANTONIO RIVER APPROX 835 METERS UPSTREAM OF THE MEDINA RIVER CONFLUENCE | Map
16731 1911 1911_06 13 SA SA RT 6 6 6 6 6 6 CRP Stream Monitoring Program
SAN ANTONIO RIVER AT MISSION ROAD IMMEDIATELY UPSTREAM OF RIVERSIDE MUNICIPAL GOLF COURSE 1.65 KM DOWNSTREAM OF SAN ANTONIO RIVER/SAN PEDRO CREEK CONFLUENCE IN SAN ANTONIO TX | Map
17066 1911 1911_08 13 SA SA RT 6 52 52 6 SARA Stream Monitoring Program / Rec Bac-T
SAN ANTONIO RIVER 57 METERS UPSTREAM OF LEXINGTON STREET BRIDGE AND APPROXIMATELY 1.3 KILOMETERS DOWNSTREAM OF IH 35 | Map
18865 1911 1911_09 13 SA SA RT 6 6 6 6 6 CRP Stream Monitoring Program
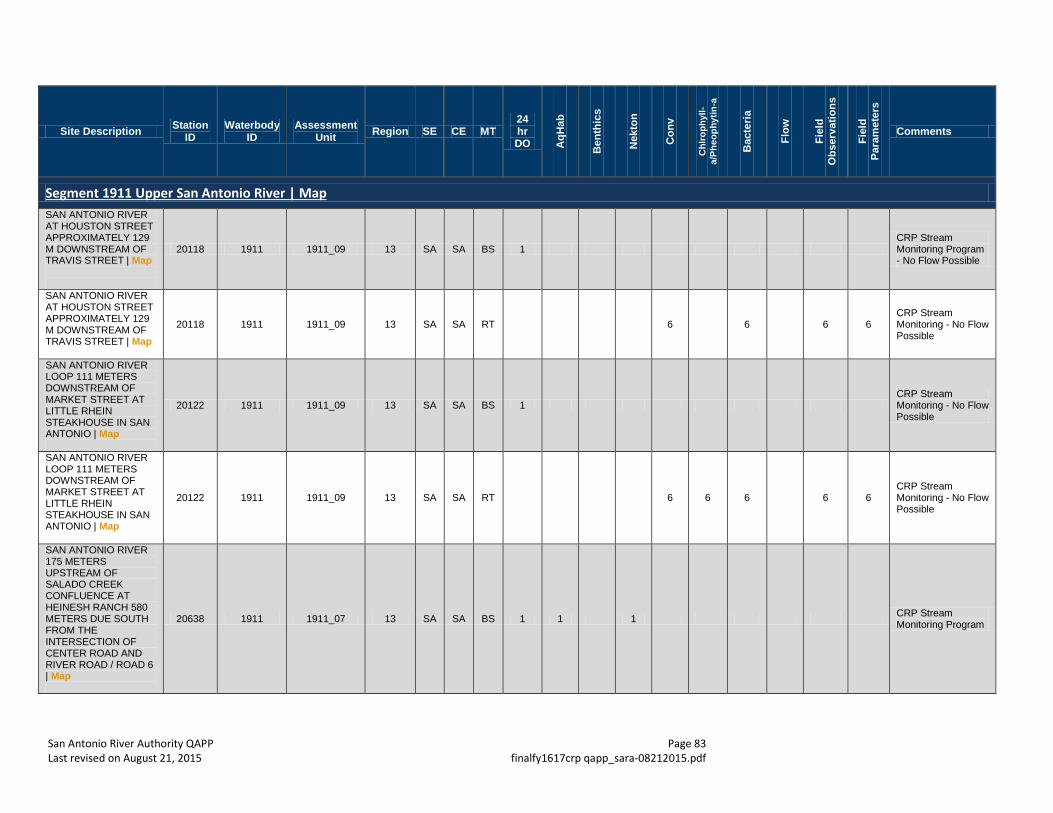
San Antonio River Authority QAPP Page 83 Last revised on August 21, 2015 finalfy1617crp qapp_sara-08212015.pdf
Site Description Station ID
Waterbody ID
Assessment Unit Region SE CE MT
24 hr DO A
qHab
Ben
thic
s
Nek
ton
Con
v
Chl
roph
yll-
a/Ph
eoph
ytin
-a
Bac
teria
Flow
Fiel
d O
bser
vatio
ns
Fiel
d Pa
ram
eter
s
Comments
Segment 1911 Upper San Antonio River | Map
SAN ANTONIO RIVER AT HOUSTON STREET APPROXIMATELY 129 M DOWNSTREAM OF TRAVIS STREET | Map
20118 1911 1911_09 13 SA SA BS 1 CRP Stream Monitoring Program - No Flow Possible
SAN ANTONIO RIVER AT HOUSTON STREET APPROXIMATELY 129 M DOWNSTREAM OF TRAVIS STREET | Map
20118 1911 1911_09 13 SA SA RT 6 6 6 6 CRP Stream Monitoring - No Flow Possible
SAN ANTONIO RIVER LOOP 111 METERS DOWNSTREAM OF MARKET STREET AT LITTLE RHEIN STEAKHOUSE IN SAN ANTONIO | Map
20122 1911 1911_09 13 SA SA BS 1 CRP Stream Monitoring - No Flow Possible
SAN ANTONIO RIVER LOOP 111 METERS DOWNSTREAM OF MARKET STREET AT LITTLE RHEIN STEAKHOUSE IN SAN ANTONIO | Map
20122 1911 1911_09 13 SA SA RT 6 6 6 6 6 CRP Stream Monitoring - No Flow Possible
SAN ANTONIO RIVER 175 METERS UPSTREAM OF SALADO CREEK CONFLUENCE AT HEINESH RANCH 580 METERS DUE SOUTH FROM THE INTERSECTION OF CENTER ROAD AND RIVER ROAD / ROAD 6 | Map
20638 1911 1911_07 13 SA SA BS 1 1 1 CRP Stream Monitoring Program
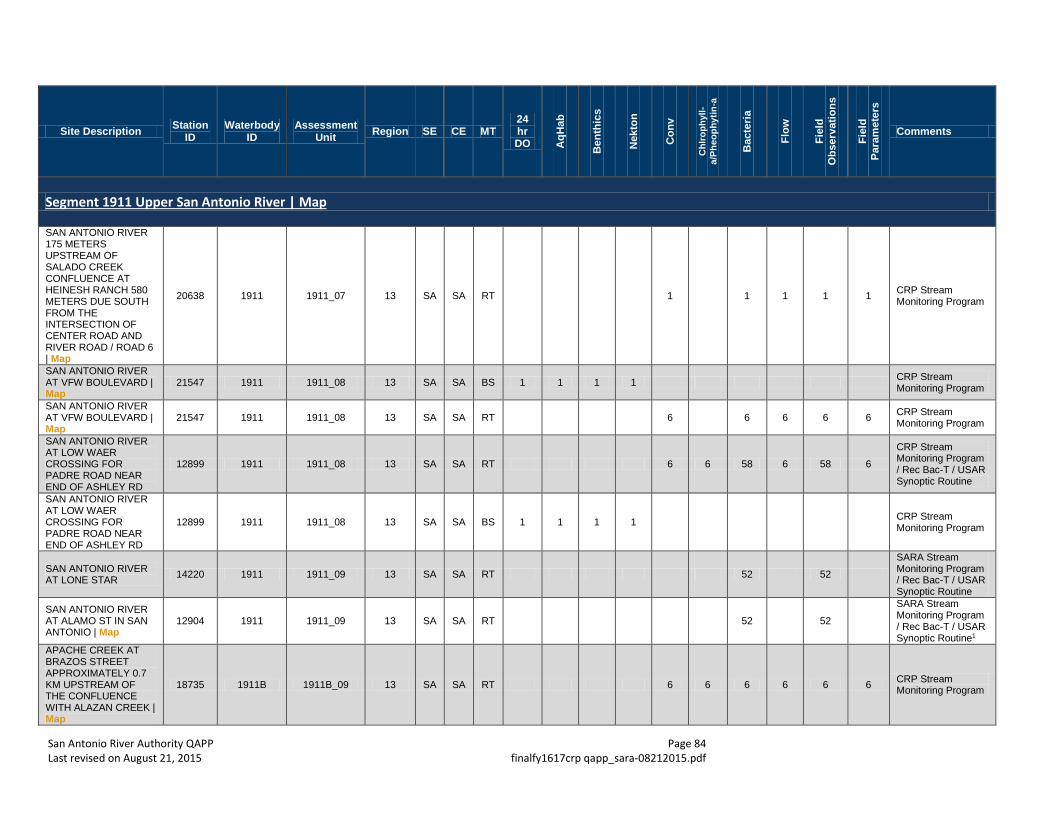
San Antonio River Authority QAPP Page 84 Last revised on August 21, 2015 finalfy1617crp qapp_sara-08212015.pdf
Site Description Station ID
Waterbody ID
Assessment Unit Region SE CE MT
24 hr DO A
qHab
Ben
thic
s
Nek
ton
Con
v
Chl
roph
yll-
a/Ph
eoph
ytin
-a
Bac
teria
Flow
Fiel
d O
bser
vatio
ns
Fiel
d Pa
ram
eter
s
Comments
Segment 1911 Upper San Antonio River | Map
SAN ANTONIO RIVER 175 METERS UPSTREAM OF SALADO CREEK CONFLUENCE AT HEINESH RANCH 580 METERS DUE SOUTH FROM THE INTERSECTION OF CENTER ROAD AND RIVER ROAD / ROAD 6 | Map
20638 1911 1911_07 13 SA SA RT 1 1 1 1 1 CRP Stream Monitoring Program
SAN ANTONIO RIVER AT VFW BOULEVARD | Map
21547 1911 1911_08 13 SA SA BS 1 1 1 1 CRP Stream Monitoring Program
SAN ANTONIO RIVER AT VFW BOULEVARD | Map
21547 1911 1911_08 13 SA SA RT 6 6 6 6 6 CRP Stream Monitoring Program
SAN ANTONIO RIVER AT LOW WAER CROSSING FOR PADRE ROAD NEAR END OF ASHLEY RD
12899 1911 1911_08 13 SA SA RT 6 6 58 6 58 6
CRP Stream Monitoring Program / Rec Bac-T / USAR Synoptic Routine
SAN ANTONIO RIVER AT LOW WAER CROSSING FOR PADRE ROAD NEAR END OF ASHLEY RD
12899 1911 1911_08 13 SA SA BS 1 1 1 1 CRP Stream Monitoring Program
SAN ANTONIO RIVER AT LONE STAR 14220 1911 1911_09 13 SA SA RT 52 52
SARA Stream Monitoring Program / Rec Bac-T / USAR Synoptic Routine
SAN ANTONIO RIVER AT ALAMO ST IN SAN ANTONIO | Map
12904 1911 1911_09 13 SA SA RT 52 52
SARA Stream Monitoring Program / Rec Bac-T / USAR Synoptic Routine1
APACHE CREEK AT BRAZOS STREET APPROXIMATELY 0.7 KM UPSTREAM OF THE CONFLUENCE WITH ALAZAN CREEK | Map
18735 1911B 1911B_09 13 SA SA RT 6 6 6 6 6 6 CRP Stream Monitoring Program
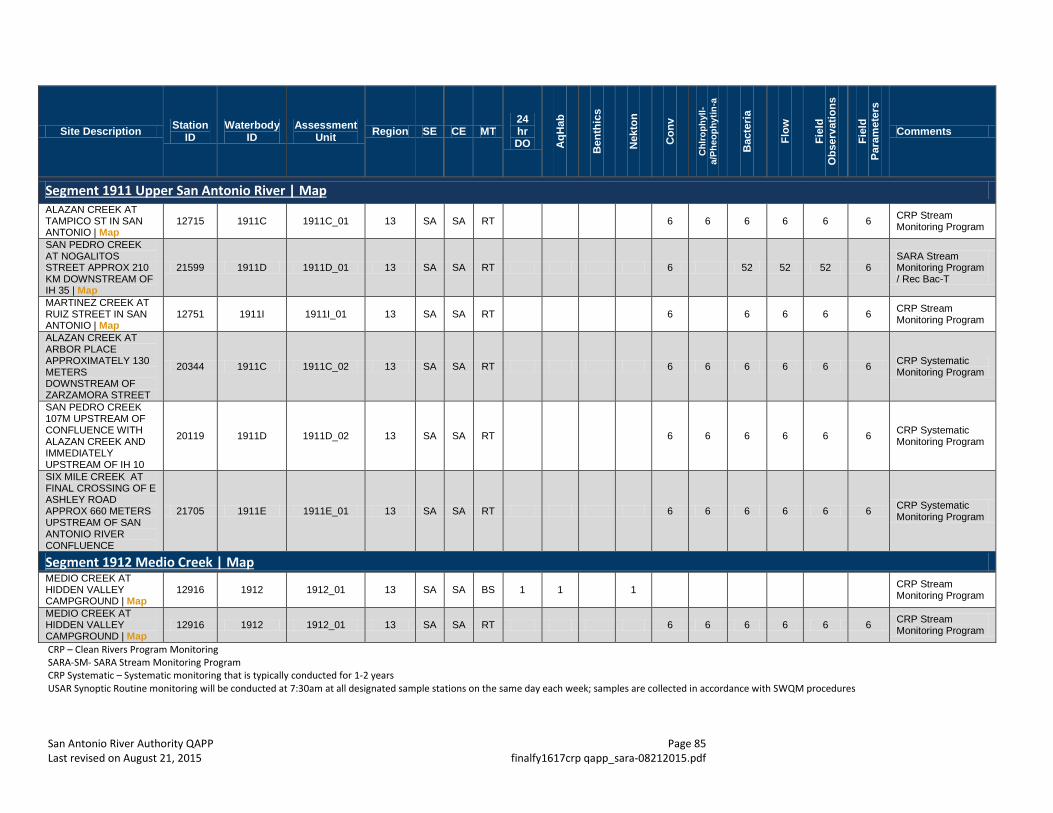
San Antonio River Authority QAPP Page 85 Last revised on August 21, 2015 finalfy1617crp qapp_sara-08212015.pdf
Site Description Station ID
Waterbody ID
Assessment Unit Region SE CE MT
24 hr DO A
qHab
Ben
thic
s
Nek
ton
Con
v
Chl
roph
yll-
a/Ph
eoph
ytin
-a
Bac
teria
Flow
Fiel
d O
bser
vatio
ns
Fiel
d Pa
ram
eter
s
Comments
Segment 1911 Upper San Antonio River | Map
ALAZAN CREEK AT TAMPICO ST IN SAN ANTONIO | Map
12715 1911C 1911C_01 13 SA SA RT 6 6 6 6 6 6 CRP Stream Monitoring Program
SAN PEDRO CREEK AT NOGALITOS STREET APPROX 210 KM DOWNSTREAM OF IH 35 | Map
21599 1911D 1911D_01 13 SA SA RT 6 52 52 52 6 SARA Stream Monitoring Program / Rec Bac-T
MARTINEZ CREEK AT RUIZ STREET IN SAN ANTONIO | Map
12751 1911I 1911I_01 13 SA SA RT 6 6 6 6 6 CRP Stream Monitoring Program
ALAZAN CREEK AT ARBOR PLACE APPROXIMATELY 130 METERS DOWNSTREAM OF ZARZAMORA STREET
20344 1911C 1911C_02 13 SA SA RT 6 6 6 6 6 6 CRP Systematic Monitoring Program
SAN PEDRO CREEK 107M UPSTREAM OF CONFLUENCE WITH ALAZAN CREEK AND IMMEDIATELY UPSTREAM OF IH 10
20119 1911D 1911D_02 13 SA SA RT 6 6 6 6 6 6 CRP Systematic Monitoring Program
SIX MILE CREEK AT FINAL CROSSING OF E ASHLEY ROAD APPROX 660 METERS UPSTREAM OF SAN ANTONIO RIVER CONFLUENCE
21705 1911E 1911E_01 13 SA SA RT 6 6 6 6 6 6 CRP Systematic Monitoring Program
Segment 1912 Medio Creek | Map
MEDIO CREEK AT HIDDEN VALLEY CAMPGROUND | Map
12916 1912 1912_01 13 SA SA BS 1 1 1 CRP Stream Monitoring Program
MEDIO CREEK AT HIDDEN VALLEY CAMPGROUND | Map
12916 1912 1912_01 13 SA SA RT 6 6 6 6 6 6 CRP Stream Monitoring Program
CRP – Clean Rivers Program Monitoring SARA-SM- SARA Stream Monitoring Program CRP Systematic – Systematic monitoring that is typically conducted for 1-2 years USAR Synoptic Routine monitoring will be conducted at 7:30am at all designated sample stations on the same day each week; samples are collected in accordance with SWQM procedures
San Antonio River Authority QAPP Page 86 Last revised on August 21, 2015 finalfy1617crp qapp_sara-08212015.pdf
Monitoring Sites for FY 2016 Critical vs. non-critical measurements All data taken for CRP and entered into SWQMIS are considered critical.
Appendix C: Station Location Maps
San Antonio River Authority QAPP Page 87 Last revised on August 21, 2015 finalfy1617crp qapp_sara-08212015.pdf
Station Location Maps Maps of stations monitored by the San Antonio River Authority are provided on the next page. The map was generated by the San Antonio River Authority. This product is for informational purposes and may not have been prepared for or be suitable for legal, engineering, or surveying purposes. It does not represent an on-the-ground survey and represents only the approximate relative location of property boundaries. For more information concerning this map, contact the Michelle Garza at 210-302-4242.
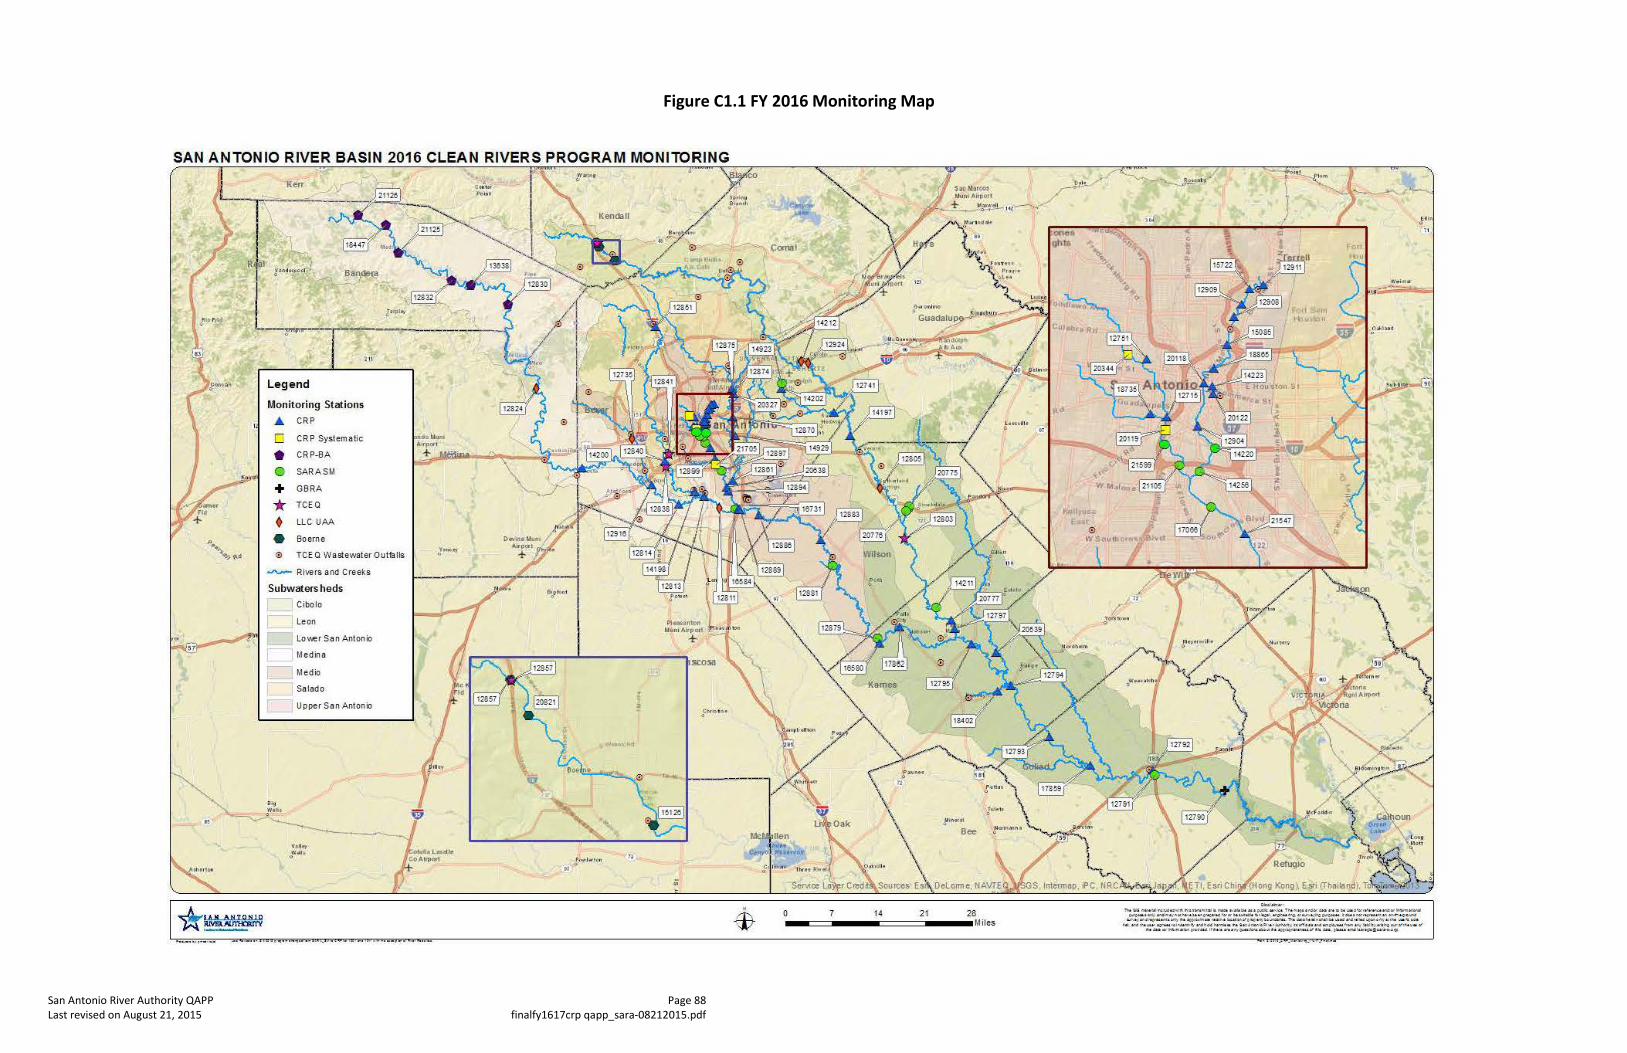
San Antonio River Authority QAPP Page 88 Last revised on August 21, 2015 finalfy1617crp qapp_sara-08212015.pdf
Figure C1.1 FY 2016 Monitoring Map
A e•,.,. ·~ ~d
_.L~~ ~~-.. -
Legend
Monitoring Stations
~ CRP
C CRP Systematic
• CRP-BA
0 SARA SM
+ GBRA
* TCEQ
• LLC UAA
• Boern e
0 TCE 0 Wastewater Outfa lls
....,..__ Rivers and Creeks
Subwaters heds
CJ cibolo
CJ Leon
Medio
CJ sa lado
CJ Upper Sa n Antonio
:~~"'
. $
0 28 --==-----===::::11---Miles
7 14 21 elo.<l-:
n-..~ '""' """' "".w '""'t'.f'jn..-.,.,,,.:.,_.,.,. .. .. , (<.OIII< ""'~• f"" '" 00:''"".,. 4o:o ... o,.l•-•·•.,.....-.,....,.._.,. .. __ _..., ~· ..... · - .. *'~ .. -·~oo .... ~-· ...... 1 ..... _ , , "'>01, ... ~.,..,. ........... ~~ ... ........... ""<" .. _""_.., .. ,;4 ....,~ • ...,~...,... ..... ...... .... >((<"'O<ii'' .. _.,4 b< .. .., OI'C C(•""' UI.I"4at!M. ~ ...... ~ .. --~ ..... ! .. ,..04...-.df'OI\wl~·--· lfli'O _ ,. , ...
,.,_ .,.4 ,~ .. ..,., ..,.._,,.,.._".""'"""',._• .... ~ ... u.-.~o::.o .. r~toq'!~ .,. ... 4...,t'O\ _ _ .,...w~· ...,\O'(I .... · <>"II' .. :.•</ ""~""""'""""O'W <II4 1!N<o .... o"fi(lo'M:""' - '"""'«""C<W-.o<l'11!1""" ~_. .....,,....,"'*' ~'"'......,C>
San Antonio River Authority QAPP Page 89 Last revised on August 21, 2015 finalfy1617crp qapp_sara-08212015.pdf
Appendix D: Field Data Sheets/Chain of Custody Forms
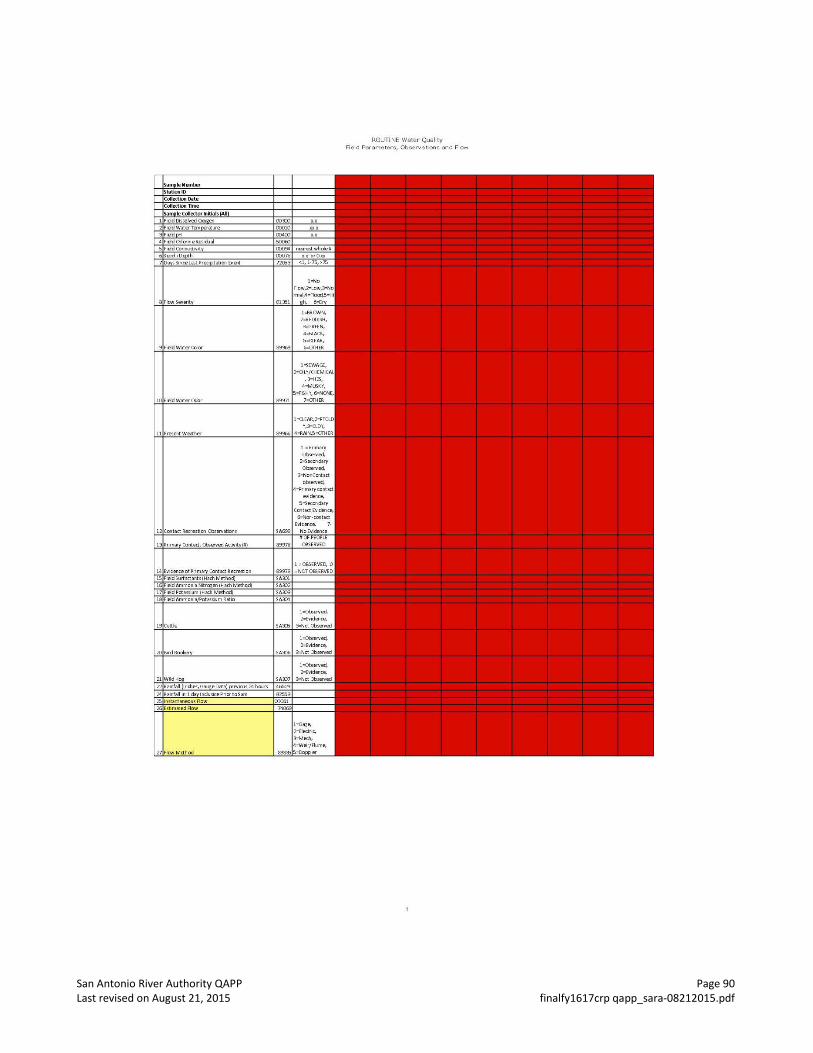
San Antonio River Authority QAPP Page 90 Last revised on August 21, 2015 finalfy1617crp qapp_sara-08212015.pdf
ROUTINE Water Quality Reid Parameter!:, Ob!:ervatlon!: and Flow
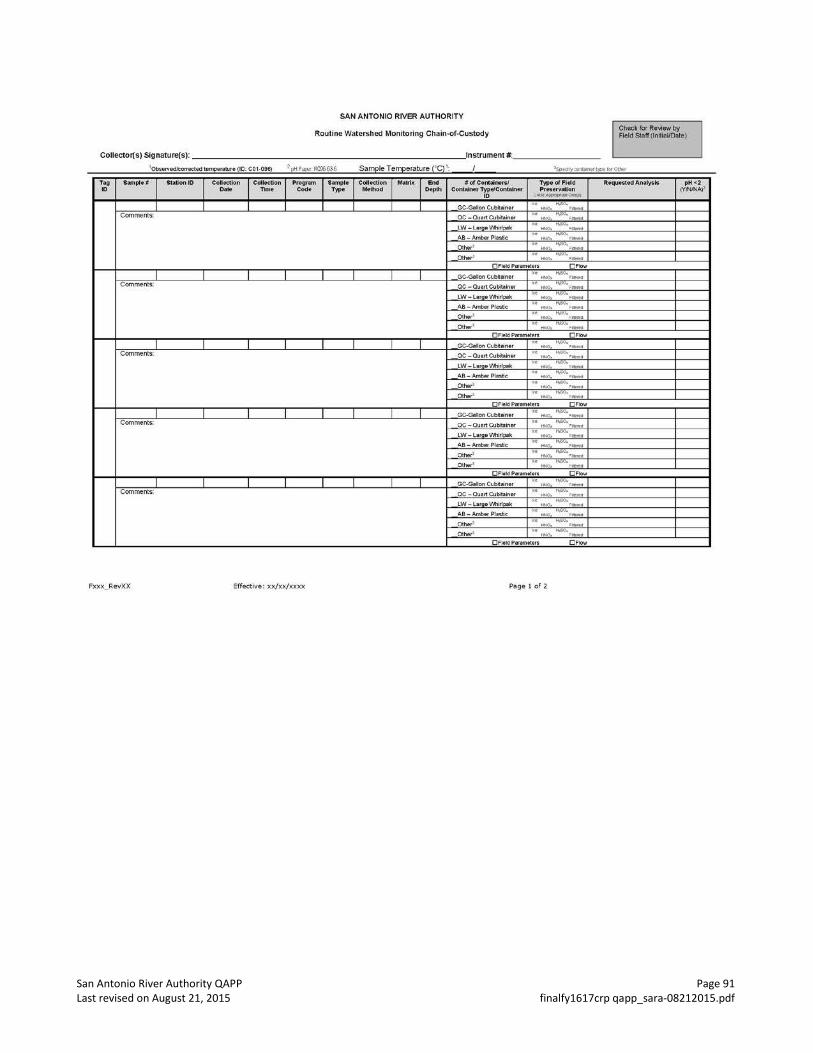
San Antonio River Authority QAPP Page 91 Last revised on August 21, 2015 finalfy1617crp qapp_sara-08212015.pdf
SAN ANTONIO RIVER AUTHORITY
Routine Watershed Monitoring Chain-of-Custody
Collector(s) Signature(s): ---------------------------Instrument#. ________ _
Tag ID
10bserY~ouected l w!J)!fetuut (10 C01 096) ')pH Pd)::l RCC663G Sample Temperature ("C) 1:
Sampl• 1 I Station 10 I Coll.c.1ion I Collection I ...._ I Swnple l Col.a.lon , .....,, I""' Date nme CoCk Type MelhOd Deplh
I I I I I I I I Comments-.
I I I I I I I I Comments:
Comments:
Comments:
comments:
Fxxx_RevXX Ef fective : xx/xx/xxxx
#ol ContalintrsJ Coni~ TypdCOI'ItaiMr
ID
OC - O.nut Cubitainer
I.W - lllr WhiriMk
A8-~Pias6c
OtherS
()the~
c;c..oe1on CtJbi.Sner
OC - 0...1rt Cubltalnet
l W - large Whirlpek
GC.Gaton Cubbiner
OC - Outrt Cubit•iner
lW - brge WhiriPii!lk
AB- Amblw Pl~tslic
Other!
Other'
l'ypt'otFitld Preservation
(,.1C:WI~Dunt(SJ
GC-Galon Cubhiner Ice ~o. ".:>0. r~
lW -Laroe Whlrlpek ce ~0, "- r~~~MCI A8-~Piasli c: ce ~0. H,:>o.r~
OC-O..•rtCubitainar 1 .. 0, ~~~ ,~~~
AS- Alr6ar Phtslic: <.., ~o H.OO. r-.c~
Page l of 2
Check for Re\fiew by Field Staff (Initial/Date)
pH<2 (YJNINAl'
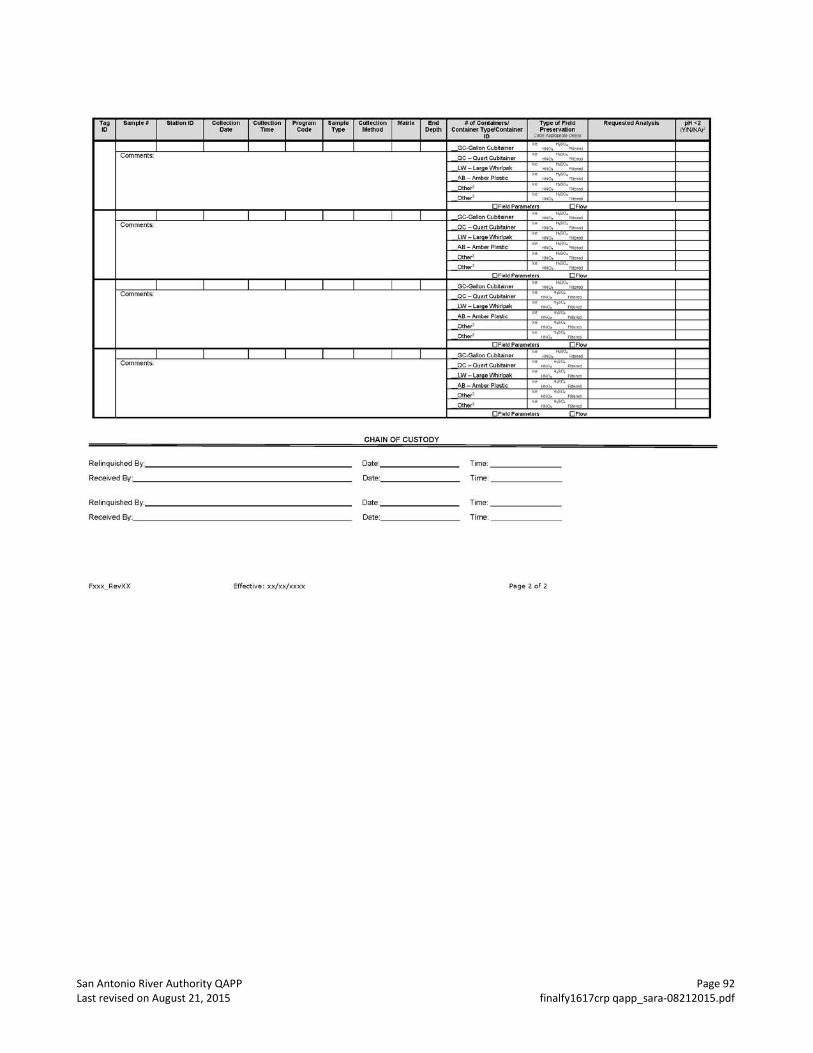
San Antonio River Authority QAPP Page 92 Last revised on August 21, 2015 finalfy1617crp qapp_sara-08212015.pdf
Tag 10
sample 1 I staoon 10 I COIIecuon I COllection I Prognm I Sample I COiecuon I Mall1x I """ Date Time Codt TYPe MelhOCI Oepd'l
ti OfCOfllalnerSI Conl- lYI>etC..-..r
10
Type Of fldd Preservauon
Octe~aQnt(s)
GC-Get on CubiS ner Comments: OC - Ouert Cubiteine.-
lW - b rge WhiriPtk
AB - Amba Ple~lic I(C I!NO 11~1'1t!>re0
Othorl
Field ParM'Itters FlOw
GC-Gaton Ct.tbhiner Comments: 0C - Quart Cubitainer
LW - Laroe Whirl~k
AB - Ambel Plastic H.SO. "ltr'fl'd
O Fidd Por-.elen OFJow
Comments· oc -o .. uut Cubitainer
LW-t.rqe Whirl~k
AO - Atnbef Pln lic
Other'
Othorl
OField ParM'Ieltrs O Fbw
GC.C')IIIf on Cubhin~tr Comments: OC - Ouart Cubitainer
lW-h roe Whirlpak
AB - Ambel Plastic ~o+~o. "•'it\ RI"H1"t
Ooher' w ..,o, ; '"' "'""
CHAIN OF CUSTODY
Relinquished By: ___________________ _ Date: _______ _ Time: ______ _ R~edBy:. ___________________________________ _ Oat@:. _______ _ Ti m@: ______ _
Relinquished By: ___________________ _ Date: ___________ _ Time: ______ _
Received By:. __________________ _ Date:. ______ _ Time: ______ _
Fxxx_RevXX Ef fective : xx/xx/xx xx Page 2 o f 2
Requesa~ AnalySts pH<2 (YJN/NA)'
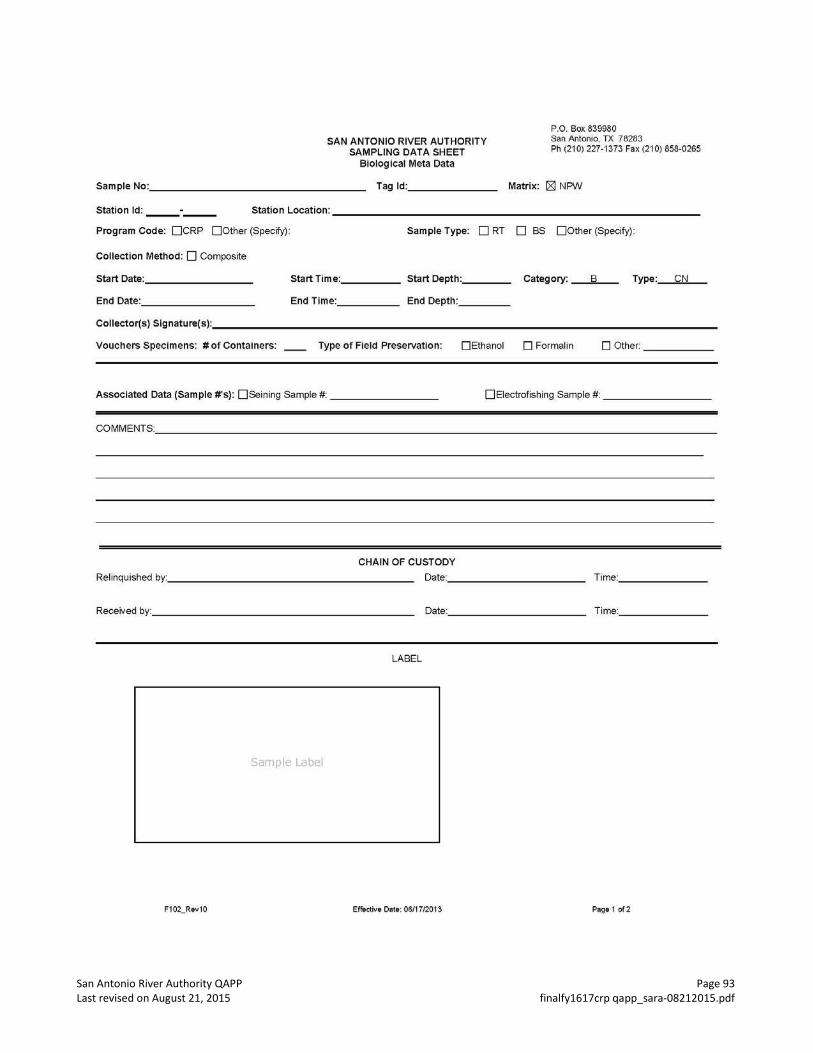
San Antonio River Authority QAPP Page 93 Last revised on August 21, 2015 finalfy1617crp qapp_sara-08212015.pdf
SAN ANTONIO RIVER AUTHORITY SAMPLING DATA SHEET
Biological Meta Data
P.O. Box 839980 San Antonio, TX 7 8283 Ph (210) 227-1373 Fax (210) 858-0265
Sample No: ________________ _ Tag ld: ______ _ Matrix: ~ NPVV
Station ld: _____ _ Station Location:-----------------------------
Program Code: OCRP OOther (Specify): Sample Type: 0 RT 0 BS 00ther (Specify) :
Collection Method: 0 Composite
Start Date: _______ _ Start Time:. ____ _ Start Depth:. ___ _ Category: __ B...__ Type: CN
End Date: ________ _ End Time: ____ _ End Depth: ___ _
Collector(s) Signature(s): _______________________________________ _
Vouchers Specimens: #of Containers: __ Type of Field Preservation: OEthanol 0 Formalin 0 Other ____ _
Associated Data (Sample #'s): 0Seining Sample#: ________ _ 0Eiectrofishing Sample#:---------
COMMENTS: _______________________________________ _
CHAIN OF CUSTODY Relinquished by __________________ _ Date: __________ _ Time: ______ _
Received by: ____________________ _ Date: __________ _ Time: ______ _
LABEL
Sample Label
F102_Rov10 Eft'octivo Dato: 06/17/2013 Pago 1 of2
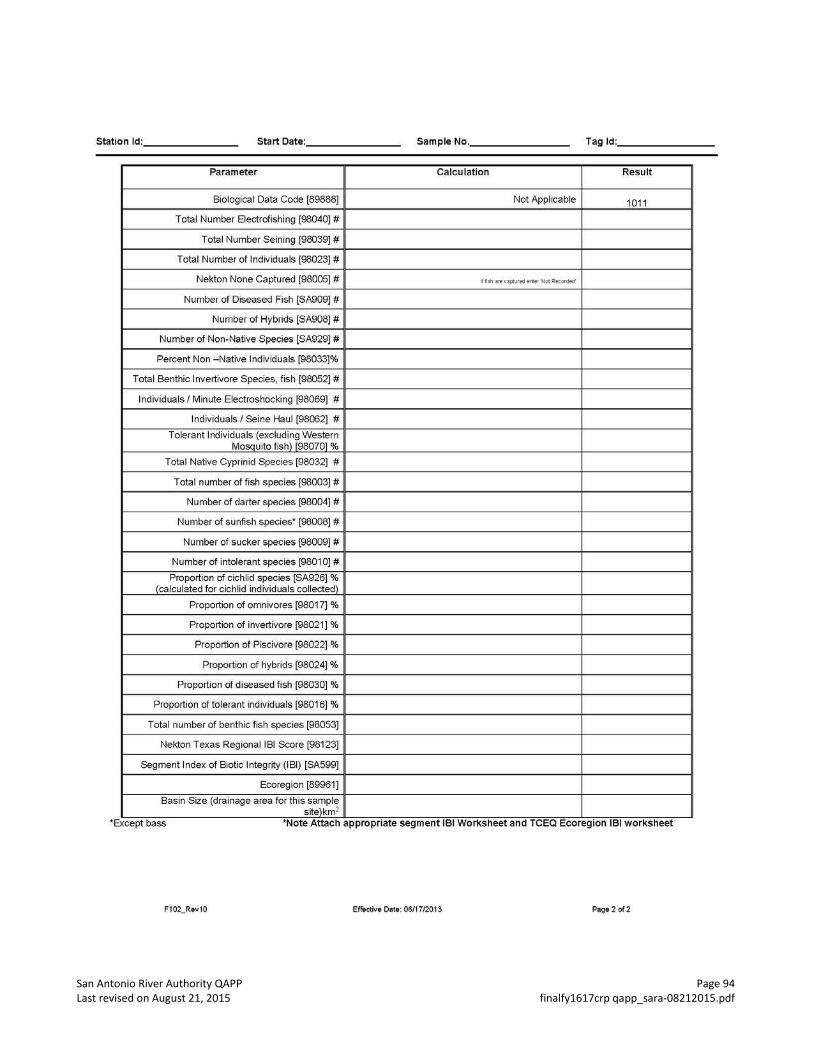
San Antonio River Authority QAPP Page 94 Last revised on August 21, 2015 finalfy1617crp qapp_sara-08212015.pdf
Station ld: _______ _ Start Date: _______ _ Sample No .. _______ _ Tag ld: ______ _
Parameter Calculation Result
Biological Data Code [89888) Not Applicable 1011
Total Number Electrofishing [98040) #
Total Number Seining [98039) #
Total Number of Indiv iduals [98023) #
Nekton None Captured [98005) # It fist! are Capl,lreQ ener 'N« Rtc«deQ'
Number of Diseased Fish [SA909) #
Number of Hybrids [SA908) #
Number of Non-Native Species [SA929) #
Percent Non -Native Individuals [98033)%
Total Benthic lnvertivore Species, fish [98052] #
Individuals/ Minute Electroshocking [98069) #
Indiv iduals I Seine Haul [98062) #
Tolerant Individuals (excluding Western MoSQuito fish) [980701 o/o
Total Native Cyprinid Species [98032) #
Total number of fish species [98003) #
Number of darter species [98004) #
Number of sunfish species• [98008) #
Number of sucker species [98009) #
Number of intolerant species [9801 0) #
Proportion of cichlid species [SA926) o/o (calculated for cichlid individuals collected)
Proportion of omnivores [98017] %
Proportion of invertivore [98021) %
Proportion of Piscivore [98022] %
Proportion of hybrids [98024] o/o
Proportion of diseased fish [98030) o/o
Proportion of tolerant individuals [98016) o/o
Total number of benthic fish species [98053)
Nekton Texas Regionai iBI Soore [98123)
Segment Index of Biotic Integrity (IBI) [SA599)
Ecoregion [89961)
Basin Size (drainage area for this sample site)km1
•Except bass •Note Attach appropnate segment IBI Worksheet and TCEQ Ecoreg1on IBI worksheet
F102_Rov10 Effective Dato: 06/17/2013 Pago2 of2
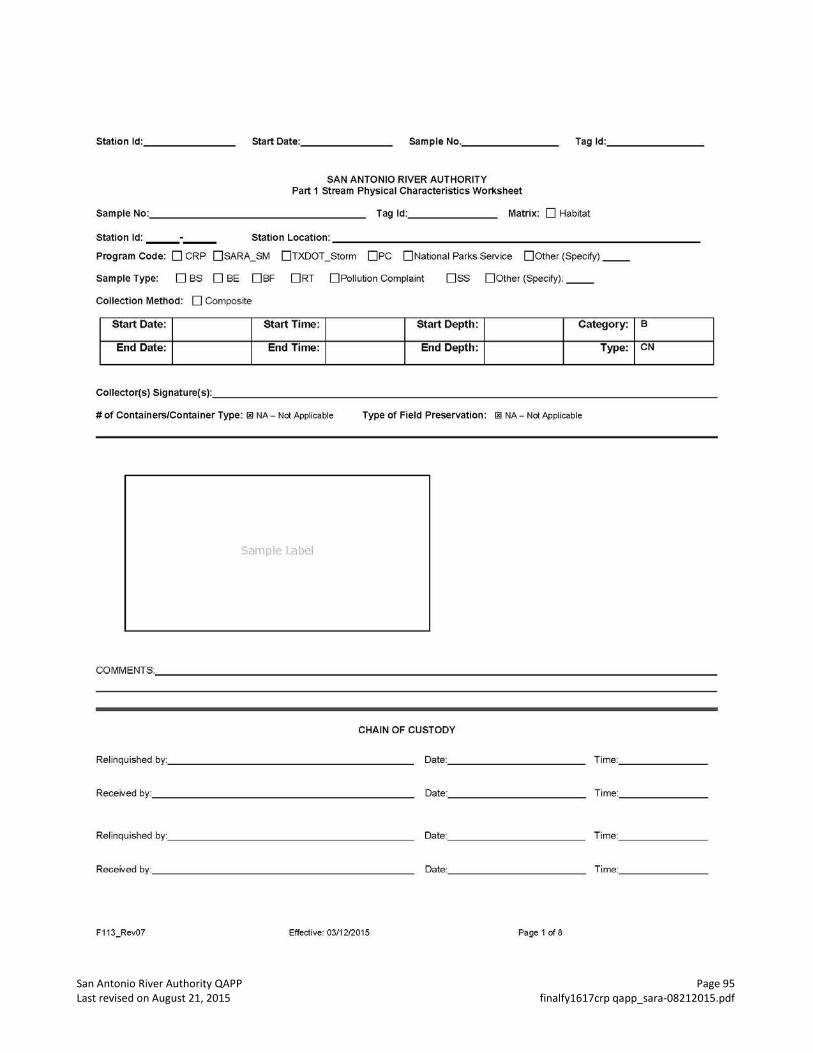
San Antonio River Authority QAPP Page 95 Last revised on August 21, 2015 finalfy1617crp qapp_sara-08212015.pdf
Station ld: ______ _ Start Date: ______ _ Sample No. _______ _ Tag ld: ______ _
SAN ANTONIO RIVER AUTHORITY Part 1 Stream Physical Characteristics Worksheet
Sample No: _______________ _ Tag ld: _____ _ Matrix: 0 Habitat
Station ld: _____ _ Station Location:-----------------------------
Program Code: 0 CRP 0SARA_SM OTXDOT_Storm OPe 0National Parks Service 00ther (Specify) __
Sample Type: 0 BS 0 BE 0 BF 0RT 0Pollution Complaint D SS DOther (Specify): __
Collection Method: D Composite
Start Date: Start Time: Start Depth : Category: B
End Date: End Time: End Depth : Type: CN
Collector(s)Signature(s): _____________________________________ _
#of Containers/Container Type: li!l NA - Not Applicable Type of Field Preservation: li!l NA - Not Applicable
Sample Label
COMMENTS: _______________________________________ _
CHAIN OF CUSTODY
Rel inquished by: Date: Time:
Received by: Date: Time:
Relinquished by: Date: Time:
Received by: Date: Time:
F113_Rev07 Effective: 03/1212015 Page 1 of 8
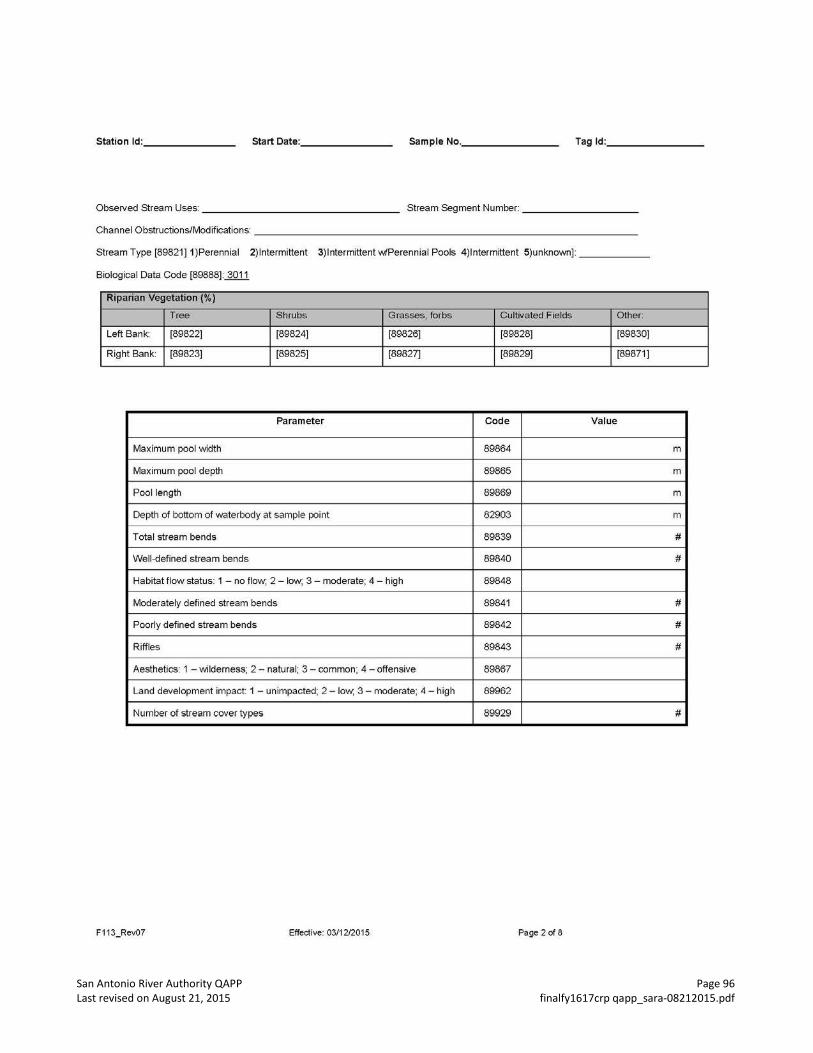
San Antonio River Authority QAPP Page 96 Last revised on August 21, 2015 finalfy1617crp qapp_sara-08212015.pdf
Station ld: ______ _ Start Date: ______ _ Sample No. _______ _ Tag ld: ______ _
ObseNed Stream Uses: --------------- Stream Segment Number: ---------
Channel Obstructions/Modifications:------------------------------
Stream Type [89821) 1)Perennial 2)1ntermittent 3)1ntermittent wfPerennial Pools 4)1ntermittent 5)unknown]: _____ _
Biological Data Code [89888]: 3011
Riparian Vegetation(%)
Tree Shrubs Grasses, forbs Cultivated Fields Other:
Left Bank: [89822] [89824) [89826) [89828) [89830)
Right Bank [89823) [89825] [89827] [89829) [89871)
Parameter Code Value
Maximum pool width 89864 m
Maximum pool depth 89865 m
Pool length 89869 m
Depth of bottom of waterbody at sample point 82903 m
Total stream bends 89839 #
Well-defined stream bends 89840 #
Habitat flow status: 1 - no flow; 2 - low; 3 - moderate; 4 - high 89848
Moderately defined stream bends 89841 #
Poorly defined stream bends 89842 #
Riffles 89843 #
Aesthetics: 1 -wilderness; 2- natural; 3- common; 4- offensive 89867
Land development impact: 1 - unimpacted; 2 - low; 3- moderate; 4 - high 89962
Number of stream cover types 89929 #
F113_Rev07 Effective: 03/1212015 Page 2 of 8
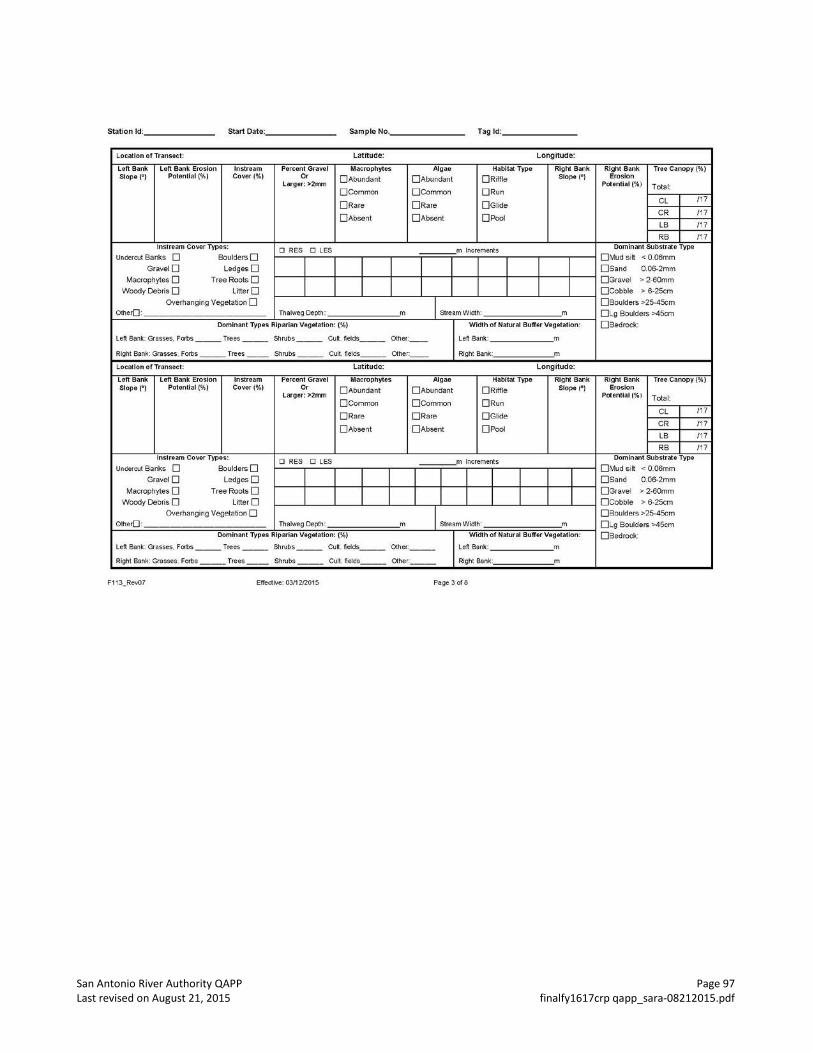
San Antonio River Authority QAPP Page 97 Last revised on August 21, 2015 finalfy1617crp qapp_sara-08212015.pdf
Station ld: ______ _ Start Date:. ______ _ Sample No. _______ _ Tag ld: ______ _
Location of Tr-ans.ecl: Latnude: Longllude:
Left Bank left Bank Erosion In stream Percent Gravel Macrophytes Algae Habilat Type Righi Bank Righi Bank Tree Canopy ~%) Slope(•) Potential !'AI Cover (0,\) Or 0Abundant 0Abundant 0 Rilfle Slope (•) Erosion
larger: >2mm Potential(%) Tolal: Oeommon Ocommon 0 Run
0Rare 0Rare 0Giide CL 117
0Absent 0Absent OPool CR 117
LB 117
RB /17 lns1ream Cover Types;
0 RES 0 LES m Increments Dominant Substrate Type
UnderOJt Banks 0 Boulders O 0'-tld sr~ < 0.06mm
GraveiO ledgesO O sand O.CJ6.2mm
M"crophytes 0 TreeRoolsO OGrovel >2·60mm
Woody Debris 0 LitterO 0Cobble > 6·25cm
OVerhanging Vegetation 0 I sueam Width:
0Boulders ~25-45cm Other(]: Thalweg Depth: m m 0Lg Boulders >45cm
Dominant Types Riparian Vegetation: (%) Width of Natural Buffer Vegel-atlon: 0Bedrodc
Len Bank: Grasses. Forbs ___ Trees ___ Shrubs --- Cult. letds ___ Other: -- Len: Banlc: m
Right Bank: Grasses. Foms Trees Shrubs Cult nelds other. Right Ban!C: m
Location of Transoet: Lat~ude: Longitude:
Len. Bank Len Bank Erosion lnstream Perc-ent Gravel Macrophytes Algae Habilat Type Righi Bank Righl Bank Tree Canopy t%) Slope(•) Potential I'M Covor (0,\) Or 0Abundant 0 Abundanl 0Riffle Slope ('} Erosion
Larger: >2mm Potential I'M Total: Oeommon Ocommon 0 Run
OR are OR are OGiide CL 117
0Absenl 0 Absent 0 Pool CR 117
LB 117
RB 117 lnstrtam Cover Types:
0 RES OLES ____ m Increments Dominant Substrae Type
Undercut Banks 0 BouldersO
I I I I I O""'d si~ < 0 .06mm
GraveiO ledgesO OSand O.CJ6.2mm
Macrophytes 0 T reto Roots 0 I I I I I 0Gravel > 2·60rnrn Woody Debris 0 Litter O 0Cobble > 6·25cm
OVerhanging Vegetation 0 I StreamWidth:
OBoulders >25-45cm Other(]: Thalweg Depth: m m 0Lg Boulders >45cm
Dominant Typts Riparian Vtgetatlon: (%) Width of Natural Bufftr Vtgtt-atlon: OBedrocl<: Left Bank: Grasses Forbs ---Trees --- Shrubs --- Cuk. ldds ___ Other: --- Left Sari<: m
Right Bank: Qus~es. forts Trees Shrubs Cull fields Other. Right Sank: m
Flt3_R..07 Effe<tive: 03J1212015 Pege3of3
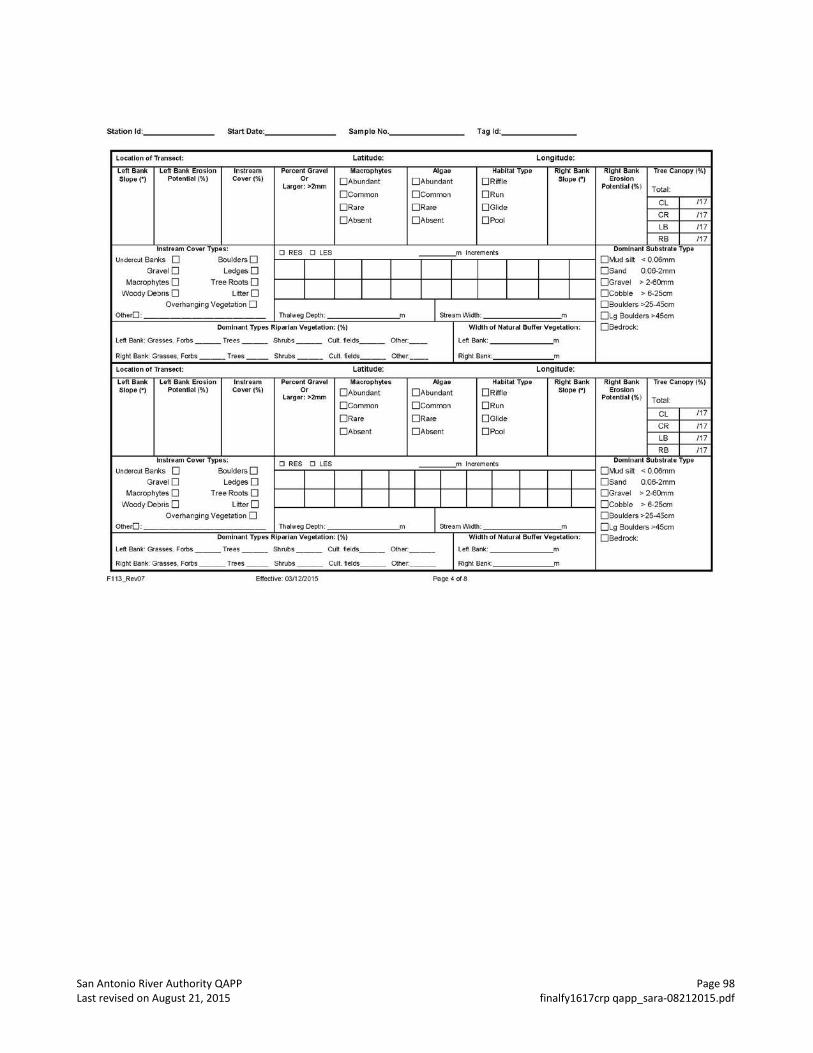
San Antonio River Authority QAPP Page 98 Last revised on August 21, 2015 finalfy1617crp qapp_sara-08212015.pdf
Station ld: ______ _ Start Date: ______ _ Sample No .. _______ _ Tag ld: ______ _
Location of Transect: Latitude: Longitude:
Left Bank Left Bank Erosion lnstream Percent Gravel Macrophytes AJoae Habllat Type Right Bank Right Bank Tree Canopy (%) Slope(') Potential (%) Cover (%) Or 0Abundant 0Abundant O Riffle Slope (•) Erosion
Larger: >2mm Potential ('14) Total: Ocommon 0Common 0 Run
0 Rare 0 Rare 0Giide CL 117
0 Absent 0Absent O Pool CR 117
LB 117
RB / 17 lnstrtam Cover Types:
0 RES 0 LES m Increments Oomlnanl SUb strait Type
Undcfcut Banks 0 BouldcrsO 0Mud si~ < 0.06mm
Gravel 0 Ledges 0 O S.nd 0.06-2mm
Mac<Ophytes 0 Tree Roots 0 0 Gravel >2·60mm
Woody Oebns 0 Lltler O O Cobble > 6-25an
Overhanging Vegetation 0 I Stream Wiclh:
0 Boulders >25-4Scm
OlllerO : Thalweg Depth: m m 0Lg Boulders >45an
Dominant Types Riparian Vegetation: (%) Width of Natural Buffer Vegetation: 0 Bedrook:
Left Bank: Grasses, Fabs ___ Trees ___ Shrub s --- Cui . fields --- Other: __ left Bank: m
Right Sank: Grasses. Forbs Trees Shrubs Cutt. l efds Other: Right Sank: m
Location of Transecl: Latitude: Longitude:
Left Bank left Bank Erosion lnstream Percent Gravel Macrophytes AJgae Habitat Type Right Bank Rl!til Bank Tree Canopy (%) Slope(•) Potendat (%) Cover (%) Or 0 Abundant 0Abundant 0 Riffle Slope t~l Erosion
larger: >2mm Potential(%) Total: O Common OCommon O Run
0Rare 0Rare 0 Giide CL 117
0Absent 0Absent O Pool CR 117
LB / 17
RB / 17 lnstream Cover Types: 0 RES 0 LES m Increments Oomlnanl SUbslrale Type
Undercut Banks 0 Boulders O
I I I I I I 0Mudsi~ <-0.06mm
Gravel 0 Ledges 0 O S.nd 0.06-2mm
Maaophytes 0 Tree Roots 0 I I I I I I O Gravel > 2-60mm
Woody Debris 0 Litter O 0 Cobble ~ 6-25an
Overhanging Vegetation 0 I Stream Wi<lh:
0 Boulders >25-4Scm
OlllerO : Thelweg Depth: m m 0Lg Boulders >45an Oominal'll Typus Riparian Vegeta tion: (%) Width or NatUI'al Buffer Vegtttalion: 0 Bedrock:
Left Bank: G'asses, Forbs ___ Trees ___ Shrubs ___ Cui fields ___ Other· ___ Lefl Sank: m
Right Sank: Grasses. Fabs Trees Shrubs Cult. lefds Qher: Right Bank: m
F113_Rev07 Elle<tive: 0311212015 Pege4 of 3
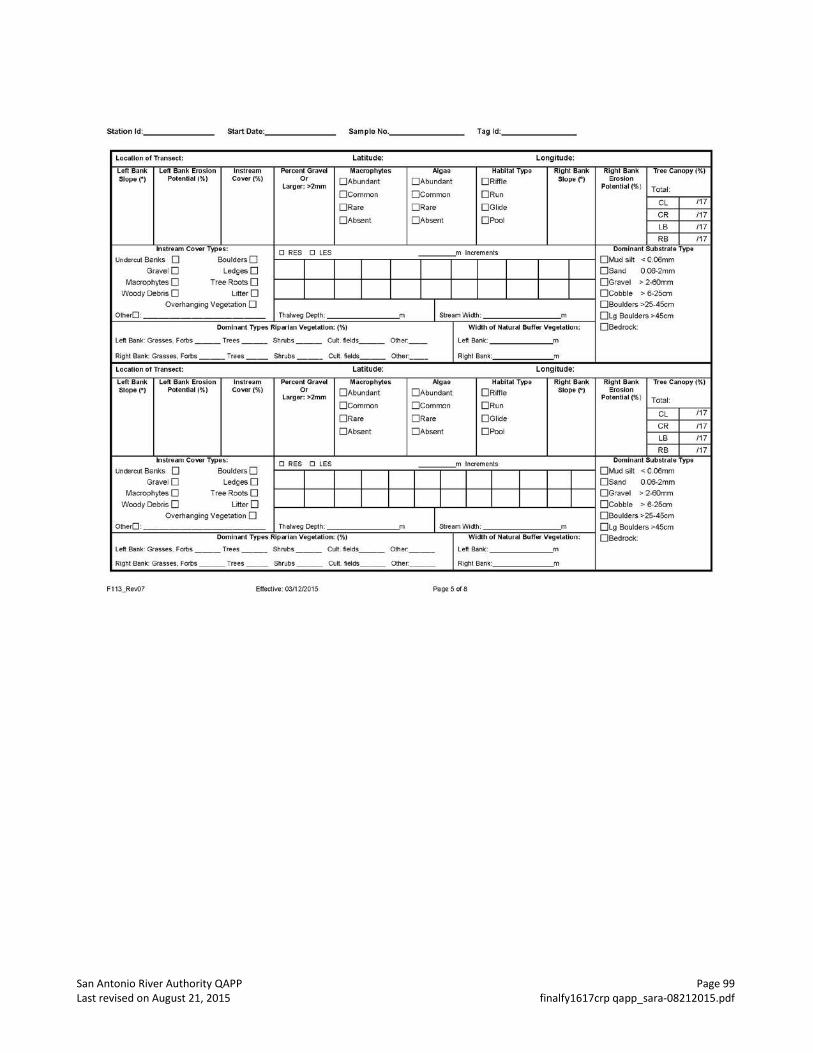
San Antonio River Authority QAPP Page 99 Last revised on August 21, 2015 finalfy1617crp qapp_sara-08212015.pdf
Station ld: ______ _ Start Date: ______ _ Sample No .. _______ _ Tag ld: ______ _
Loeallon of Transect: Latitude: Longitude:
Left Bank Len Bank Erosion lnstream Percent Gravel Macrophytes Algae Habitat Type Right Bank Right Bank Tree Canopy (0.4) Slope(' ) PotenUal I'M Cover 1'.11 Or 0Abundant 0 Abundanl O Riffle Slope(' ) Erosion
l arger: >2mm Potential(%) Total: 0 Common Ocommon 0 Run
0Rare 0 Rare 0 Giide CL /17
0 Absenl OAbse<1l OPool CR /17
LB /17
RB /17 lnstream Cowr Types:
0 RES 0 LES m Increments Dominant Substratc;a Typt
Undercut Bari<.s 0 Bouldcrs O 0Mud si~ < 0 .06mm
Gravei O LedgesO OSand 0.06·2mm
Macrophytes 0 Tree Roots O 0Gravel > 2·60mm
Woody Debns 0 LrtterO 0Cobble > 6-25cm
Overhanging Vegetation 0 I Stream Width:
0 Boulders >25-45cm
OtherO: Thalweg Depth: m m 0Lg Boulders >45cm
Dominant Types Riparian VegetaUon: (%) Width of Natural Buffer V egetation: 0Bedrock:
l eft Bank: Grasses. Forbs ___ Trees ___ Shrubs --- Cult. fields ___ other: -- left Ban!c:: m
Right Bank: Glasses. Forbs Trees Shrubs C'lll fields Other. Right Bonk: m
Localion or Transecl: Latitude: Longitude:
Left Bank Left Bank Erosion lnstream Percent Gravel Macrophytes Algae Habitat Type Righi Bank Right Bank Tree Canopy ('It) Slope(• ) Potential ('It) Cover (%) Or 0 Abundant 0 Abundant 0 Riffle Slope(') Erosion
Larger: >2mm Potential(%) Total: O Common O Common ORun
0 Rare 0Rare 0Giide CL /17
0 Absent OAbsent OPool CR /17
LB /17
RB /17 lnstrearn Cover Types: 0 RES 0 LES m Increments
Dominant Substrate Type
Undercut Banks 0 Boulders O
I I I I I 0Mud si~ < 0 .06mm
Gravei O LedgesO osand 0.06·2mm
Macrophytes 0 TreeRooiSO I I I I I OGravel >2-60mm
Woody Debris 0 LitterO 0 Cobble "' S-25cm
Overhang ing Vegetation 0 I Stream Width:
0Boulders >25-45cm
OtherO: Thalweg Depth: m m 0Lg Boulders >45cm Dominant Types Riparian Vegetalion: ('4) Width or Nalutal Buffer V egeta tion: 0Bedrocl<:
Left Bank· Gr3sses. Fcrbs ___ Trees ___ Shrubs ___ Cult fields ___ Olfler· ___ Left 88n1c m
Right Bank: Grasses. Focbs Trees Shrubs Cull telds Other: Right Bonk: m
F113_Rev07 Elle<tive: 0311212015 Page5 of 3
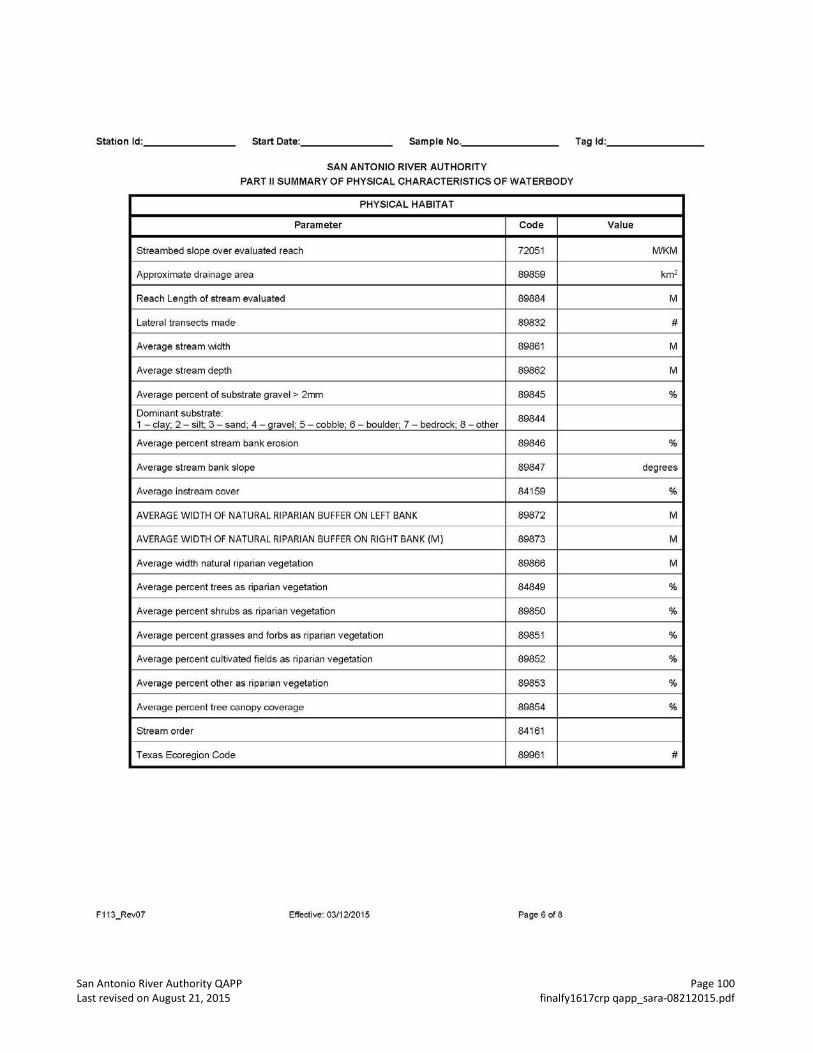
San Antonio River Authority QAPP Page 100 Last revised on August 21, 2015 finalfy1617crp qapp_sara-08212015.pdf
Station ld: ______ _ Start Date: ______ _ Sample No. _______ _ Tag ld: ______ _
SAN ANTONIO RIVER AUTHORITY
PART II SUMMARY OF PHYSICAL CHARACTERISTICS OF WATERBODY
PHYSICAL HABITAT
Parameter Code Value
Streambed slope over evaluated reach 72051 M/KM
Approximate drainage area 89859 km2
Reach Length of stream evaluated 89884 M
Lateral transects made 89832 #
Average stream width 89861 M
Average stream depth 89862 M
Average percent of substrate gravel > 2mm 89845 %
Dominant substrate: 89844 1 -clay; 2- silt; 3- sand; 4 - gravel; 5- cobble; 6- boulder; 7- bedrock; 8 - other
Average percent stream bank e rosion 89846 %
Average stream bank slope 89847 degrees
Average instream cover 84159 %
AVERAGE WIDTH OF NATURAL RIPARIAN BUFFER ON LEFT BANK 89872 M
AVERAGE WIDTH OF NATURAL RIPARIAN BUFFER ON RIGHT BANK (M) 89873 M
Average width natural riparian vegetation 89866 M
Average percent trees as riparian vegetation 84849 %
Average percent shrubs as riparian vegetation 89850 %
Average percent grasses and !orbs as riparian vegetation 89851 %
Average percent cultivated fields as riparian vegetation 89852 %
Average percent other as riparian vegetation 89853 %
Average percent tree canopy coverage 89854 %
Stream order 84161
Texas Ecoregion Code 89961 #
F113_Rev07 Effective: 03/1212015 Page 6 of 8
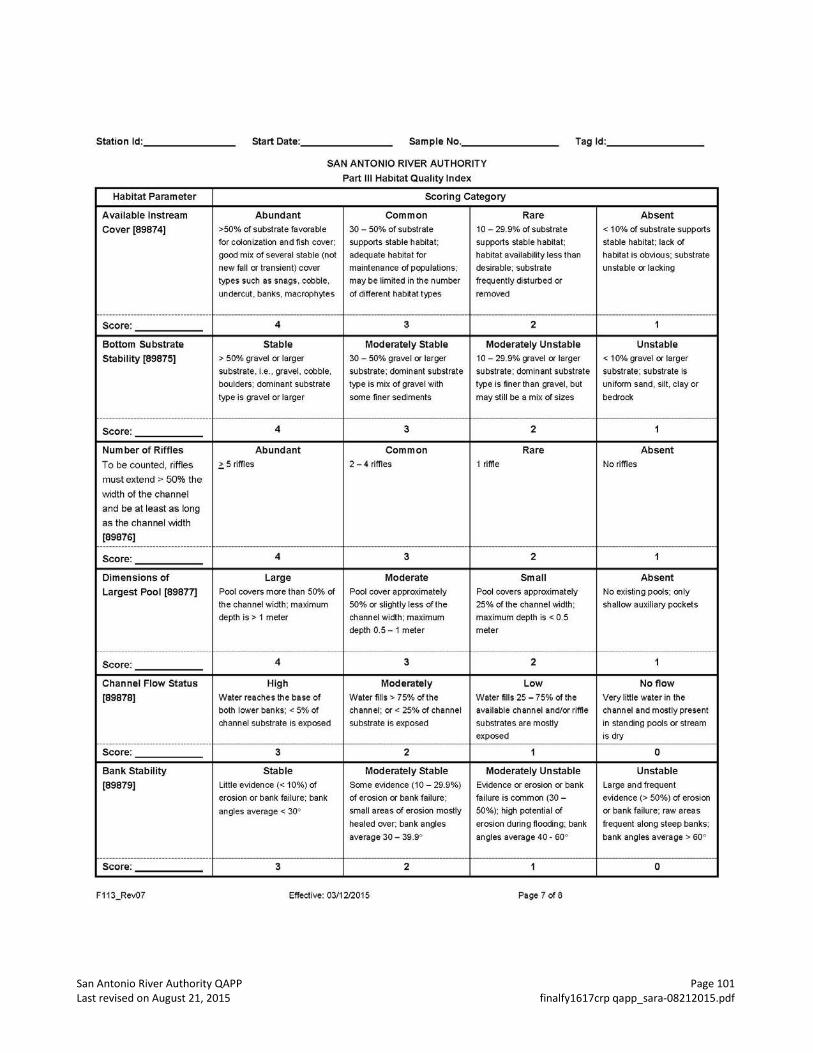
San Antonio River Authority QAPP Page 101 Last revised on August 21, 2015 finalfy1617crp qapp_sara-08212015.pdf
Station ld: ______ _ Start Date: ______ _ Sample No. _______ _ Tag ld: ______ _
Habitat Parameter
Available lnstream
Cover [89874)
.................................... Score:
Bottom Substrate
stability [89875)
------------------------------------Score:
Number of Riffles
To be counted. riffles
must extend > 50% the
width of the channel
and be at least as long
as the channel width
[89876] ···································-Score:
Dimensions of
Largest Pool [89877]
------------------------------------Score:
Channel Flow Status
[89878]
............................................................. Score:
Bank Stability
[89879]
---------------------------------··-Score:
F113_Rev07
SAN ANTONIO RIVER AUTHORITY
Part Ill Habitat Quality Index
SCoring Category
Abundant Common Rare
>50% of substrate favorable 30 - 50% of substrate 10- 29.9% of substrate
for cdonization and fish cover; supports stable habita t; supports stable habitat;
good mix of several stable (not adequate habitat for habit at availability tess than
new fall or transient) cover maintenance of populations: desirable: substrate
types such as snags. cobble. may be limited in the number frequently disturbed or
undercut, banks, macrophytes of different hab~at types removed
--------------------------- --------------------------- ------------------------4 3 2
Stable Moderately Stable Moderately Unstable
> 50% gravel or larger 30 - 50% gravel or larger 10 - 29.9% gravel or larger
substrate. i.e . . gravel. cobble. substrate: dominant substrate substrate: dominant substrate
boulders; dominant substrate type is mix of gravel with type is finer than gravel, but
type is gravel or Ia rger some finer sediments may still be a mix of sizes
---------------------- -------------------- -------------------4 3 2
Abundant Common Rare
2:.5 riffles 2-4 riffles 1 riffle
--------------------------- -------------------------- -------------------------4 3 2
Large Moderate Small
Pool covers more than 50% of Pool cover approximately Pool covers approximately
the channel width; maximum 50% or slightly less of the 25% of the channel width;
depth is> 1 meter channel width; maximum maximum depth is < 0.5
depth 0.5- 1 meter meter
--------------------- r------------------- -------------------4 3 2
High Moderately Low
Water reaches the base of Water fills> 75% of the Water fills 25 - 75% of the
both lower banks; < 5% of channel; or< 25% of channel available channel and/or riffle
channel substrate is exPosed substrate is exposed substrates are mostly
exposed
3 2 1
Stable Moderately Stable Moderately Unstable
Little evidence(< 10%) of Some evidence (10- 29.9%) Evidence or erosion or bank
erosion or bank failure: bank of erosion or bank failure: failure is common (30 -
angles average < 30° small areas of erosion mostly 50%); high pdential of
healed over: bank angles erosion during flooding: bank
average 30 - 39 .9" angles average 40- 60°
--------------------- 1-------------------- --------------------3 2 1
Effective: 03/1212015 Page 7 of 8
Absent
< 10% of substrate supports
stable habitat; tack of
habitat is obvious; substrate
unstable or lacking
-----------------------1
Unstable
< 10% gravel or larger
substrate : substrate is
uniform sand, silt, clay or
bedrock
-------------------1
Absent
No riffles
---------------------1
Absent
No existing pods; only
shallow auxiliary pockets
-----------------1
No flow
Very little water in the
channel and mostly present
in standing pools or stream
is dry -----------0
Unstable
Large and frequent
evidence(> 50%) of erosion
or bank failure; raw areas
frequent along steep banks:
bank angles average > 60°
------------------0
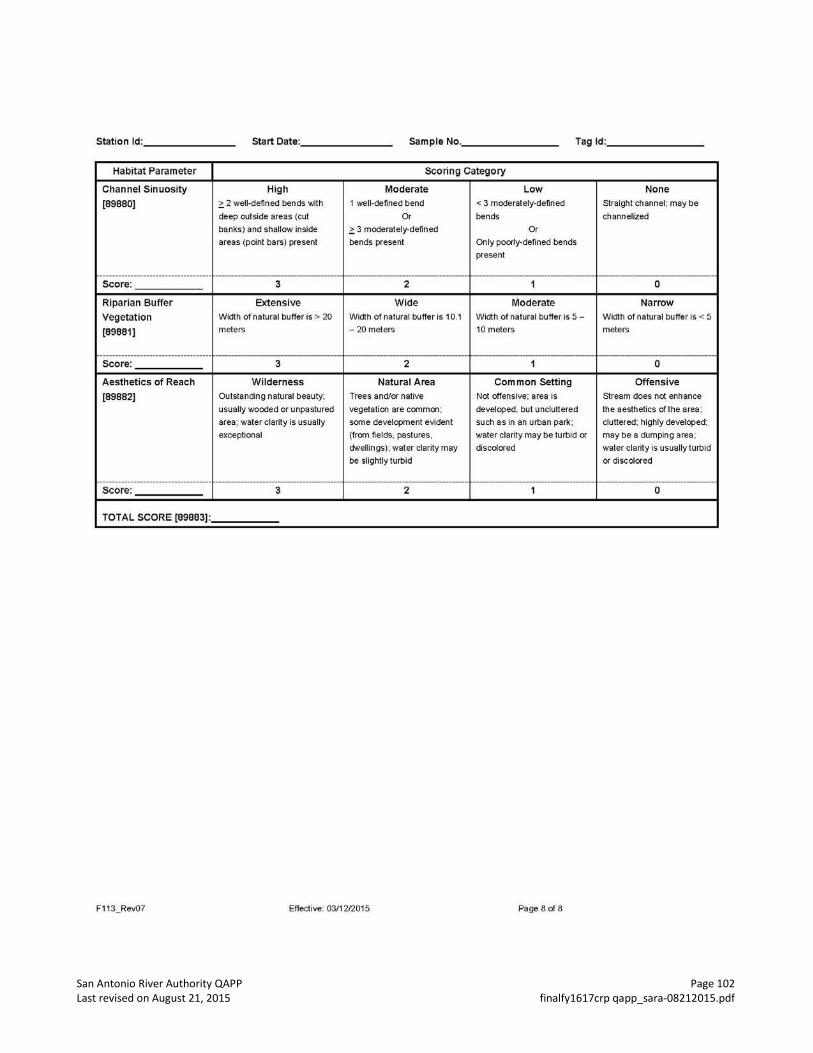
San Antonio River Authority QAPP Page 102 Last revised on August 21, 2015 finalfy1617crp qapp_sara-08212015.pdf
Station ld: ______ _ Start Date: ______ _ Sample No. _______ _ Tag ld: ______ _
Habitat Parameter Scoring Category
Channel Sinuosity High Moderate Low None
[89880] ~ 2 well-defined bends with 1 well-defined bend < 3 moderately-defined straight channel; may be
deep outside areas (cut Or bends channelized
banks) and shallow inside ~ 3 moderately-defined Or
areas (point bars) present bends present On ly poorly-defined bends
present
···································- --------------------------- -------------------------- ------------------------- ---------------------Score: 3 2 1 0
Riparian Buffer Extensive Wide Moderate Narrow
Vegetation Width of natural buffer is> 20 Width of natural buffer is 10.1 Wid1h of natural buffer is 5- Wid1h of natural buffer is < 5
[89881] meters -20 meters 10 meters meters
------------------------------------ ------------------------- ----------------------- ------------------------ ----------------------Score: 3 2 1 0
Aesthetics of Reach Wilderness Natural Area Common Setting Offensive
[89882] Outstanding natural beauty; Trees and/or native Not offensive; area is Stream does not enhance
usually wooded or unpastured vegetation are common; developed, but uncluttered the aesthetics ofthe area;
area; water clarity is usually some development evident such as in an urban park; cluttered; highly developed;
exceptional (from fields, pastures, water clarity may be turbid or may be a dumping area ;
dwellings); water clarity may discolored water clarity is usually turbid
be slightly turbid or discolored
------------------------------------ ------------------------- --------------------- --------------------- ---------------------Score: 3 2 1 0
TOTAL SCORE [89883]:
F113_ReV07 Effective: 03/1212015 Page 8 of 8
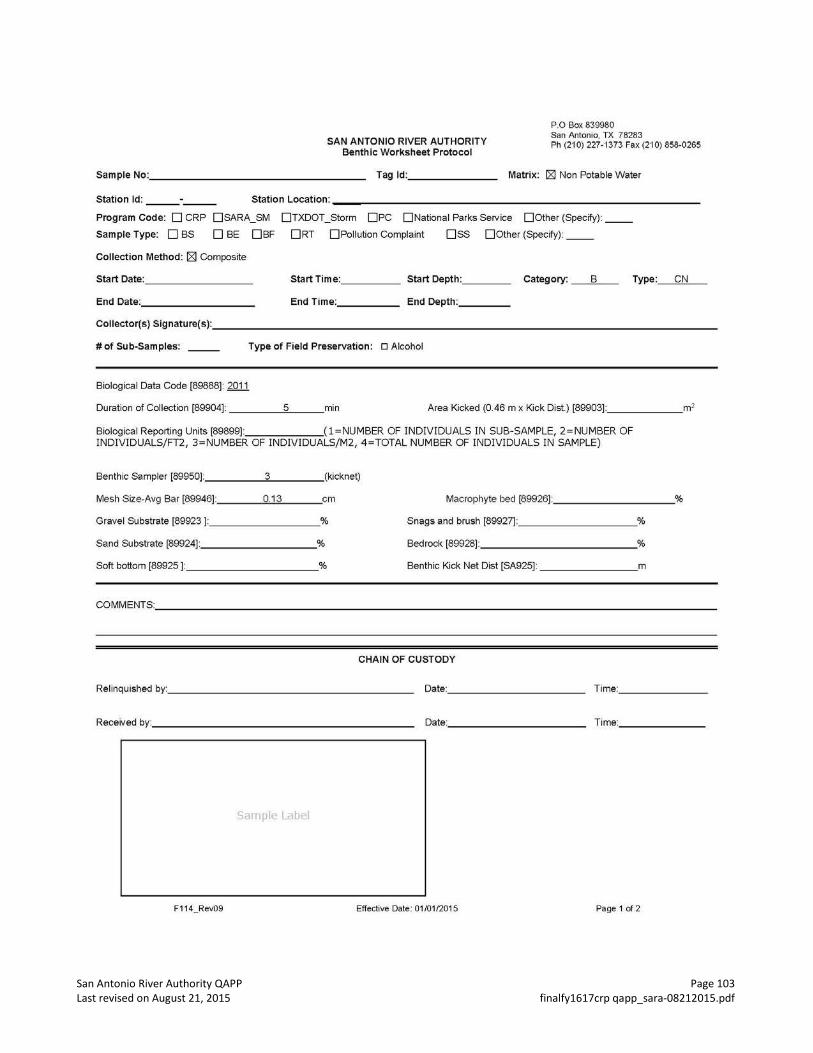
San Antonio River Authority QAPP Page 103 Last revised on August 21, 2015 finalfy1617crp qapp_sara-08212015.pdf
SAN ANTONIO RIVER AUTHORITY Benthic Worksheet Protocol
P.O Box 839980 San Antonio, TX 78283 Ph (210) 227-1373 Fax (21 0) 858-0265
sample No: _______________ _ Tag ld: _____ _ Matrix: [8] Non Potable Water
Station ld: _____ _ Station Location:----------------------------
Program Code: 0 CRP 0SARA_SM 0TXDOT_Storm 0PC 0National Parks Service 00ther (Specify): __
Sample Type: D BS D BE O BF ORT 0Pollution Complaint OSS OOther (Specify): __
Collection Method: [8] Composite
Start Date: _______ _ Start Time: _____ Start Depth: ___ _ Category: __ B"'--- Type: CN
End Date: ________ _ End Time: ____ _ End Depth: ___ _
Collector(s)Signature(s): _____________________________________ _
#of Sub-Samples: __ Type of Field Preservation: o Alcohol
Biological Data Code (89888]: 2011
Duration of Collection [89904]: ____ ::,5 ___ min Area Kicked (0.46 m x Kick Dist.) [89903]: ______ m2
Biological Reporting Units [89899]: (l=NUMBER OF INDIVIDUALS IN SUB-SAMPLE, 2=NUMBER OF INDIVIDUALS/FT2, 3=NUMBER OF INDIVIDUALS/M2, 4=TOTAL NUMBER OF INDI VIDUALS IN SAMPLE)
3 Benthic Sampler [89950]: ____ ....::::.... ___ _ (kicknet)
Mesh Size-Avg Bar [89946]: ___ _,:,:;~---' 0.13 em Macrophy1e bed [89926]: _________ %
% Gravel Substrate [89923]: _______ _ Snags and brush [89927]: _ ________ %
% Sand Substrate [89924] ________ _ Bedrock [89928]: _ ___________ %
% Soft bottom [89925]: _________ _ Benthic Kick Net Dist [SA925]: _ ______ .m
COMMENTS:----------------------------------------
CHAIN OF CUSTODY
Relinquished by: _________________ _ Date: _________ _ Time: ______ _
Recewedby: ___________________ _ Date: _________ _ Time: ______ _
Sample Label
F114_Rev09 Effective Date : 01/01/2015 Page 1 of 2
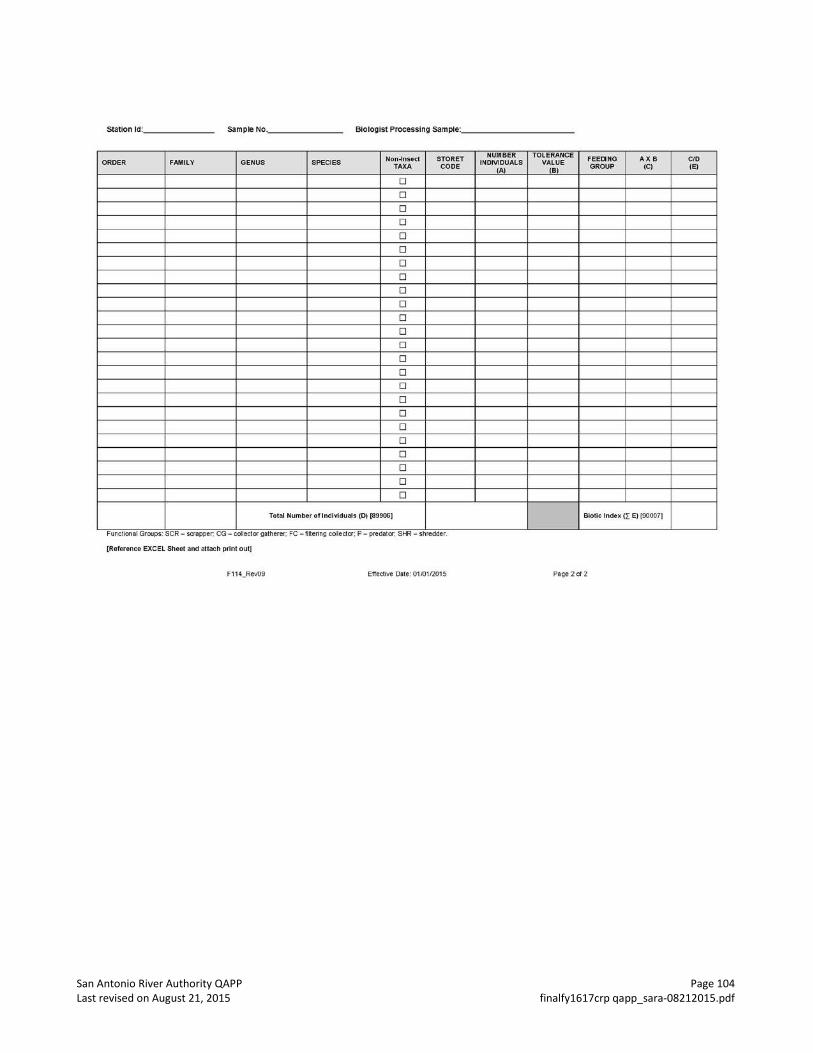
San Antonio River Authority QAPP Page 104 Last revised on August 21, 2015 finalfy1617crp qapp_sara-08212015.pdf
Station ld: ______ _ sample No .. ______ _ Biologist Processing sample: __________ _
Non-lns.ecl STORET ORDER FAMILY GENUS SPECIES TAXA CODE
0
0
0
0
0
0
0
0
0
0
0
0
0
0
0
0
0
0
0
0
0
0
0
0
Total Number of Individuals (D) (89906)
- - - - -Functional Groops. SCR scrapper, CG collectorg:atherer. FC filtenng cdlecta, P predata, SHR shredder.
[Reference EXCEL Sheet and aHach prinl out)
F114_Revo9 Effe<trve Dale: 01101/2015
NUMBER TOLERANCE fEEOING AXB INDIVIDUALS VALUE (A) (8)
GROUP (C)
Blotle Index IL E) (900071
Page 2of 2
C/D (E)
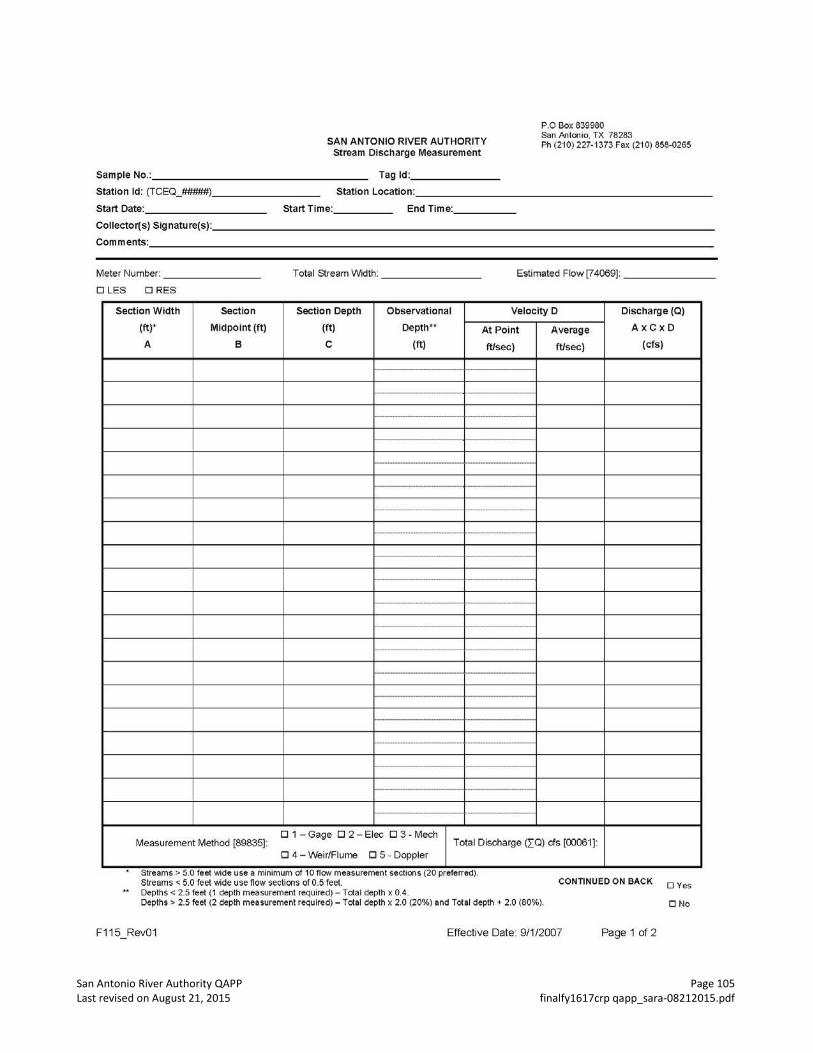
San Antonio River Authority QAPP Page 105 Last revised on August 21, 2015 finalfy1617crp qapp_sara-08212015.pdf
P.O Box 839980 San Antonio, TX 78283
SAN ANTONIO RIVER AUTHORITY Stream Discharge Measurement
Ph (210) 227-1373 Fax (21 0) 858-0265
sample No.: ________________ _ Tag ld: _____ _
Station ld: (TCEQ_#####). _______ _ Station Location: _______________________ _
Start Date: ________ _ Start Time: ____ _ End Time: ____ _
Collector(s) Signature(s): _____________________________________ _ Comments: ___________________________________________________________________________________________ _
Meter Number: _______ _ Total Stream Width: _______ _ Estimated Flow [74069]: ______ _
D LES ORES
Section Width section Section Depth Observational Velocity D Discharge (Q)
(ft)• Midpoint (ft) (ft) Depth .. At Point Average AxCxD
A B c (ft) ft/sec) ft/sec) (cfs)
-----------------
-------
r--
-------
---
---------------
---------------
--------------
--------------
---------------
--
Measurement Method [89835]: 0 1-Gage 0 2-Eiec 03- Mech
Total Discharge (2:0) cfs [00061]: 0 4-Weir/Flume 0 5- Doppler
Streams> 5.0 feet Wide use a mtmmum of 10 now measurement secttons (20 preferred). Streams < 5.0 feet wide use now sections of 0 .5 feet. CONTINUED ON BACK DYes Depths< 2.5 feet (1 depth measurement required)- Tota l depth x 0.4. Depths> 2.5 feet (2 depth measurement required)- Total depth x 2.0 (20%) and Total depth + 2.0 (80%). DNo
F115 Rev01 Effective Date: 9/1/2007 Page 1 of 2
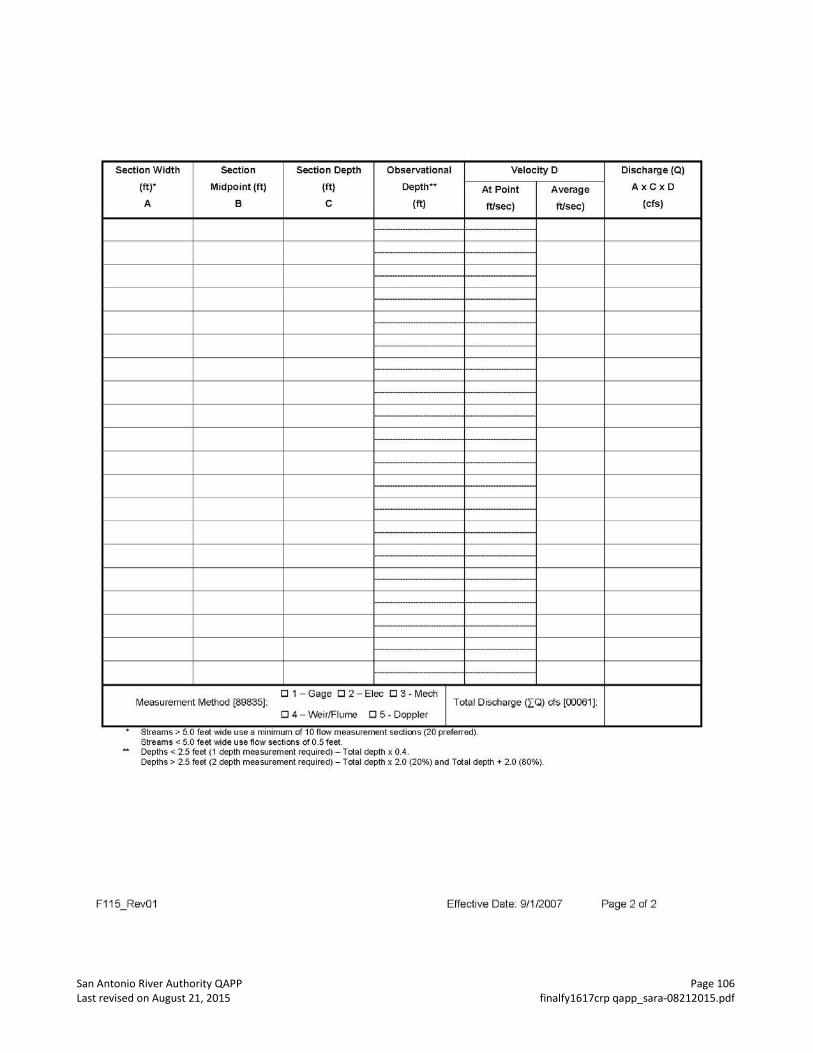
San Antonio River Authority QAPP Page 106 Last revised on August 21, 2015 finalfy1617crp qapp_sara-08212015.pdf
Section Width Section Section Depth Observational Velocity D
.
(ft)* Midpoint (ft) (ft) Depth** At Point Average
A B c (ft) ft/sec) ft/sec)
r---------- -
r-----------
--
--
------- ---
-------------
-------------
-- ---
-- ---
r-·
Measurement Method [89835): 0 1 -Gage 0 2- Elec 0 3 - Mech
Total Discharge (IQ) cfs [00061): 0 4-Weir/Flume 0 5- Doppler
Streams > 5.0 feet Wide use a mommum of 10 flow measurement sectoons (20 preferred) . Streams < 5.0 feet wide use ftow sections of 0 .5 feet. Depths < 2.5 feet (1 depth measurement required) - Total depth x 0.4. Depths > 2.5 feet (2 depth measurement required)- Total depth x 2.0 (20%) and Total depth + 2.0 (80%).
F115 Rev01 Effective Date: 9/1/2007
Discharge (Q)
AxCxD
(cfs)
Page 2 of 2
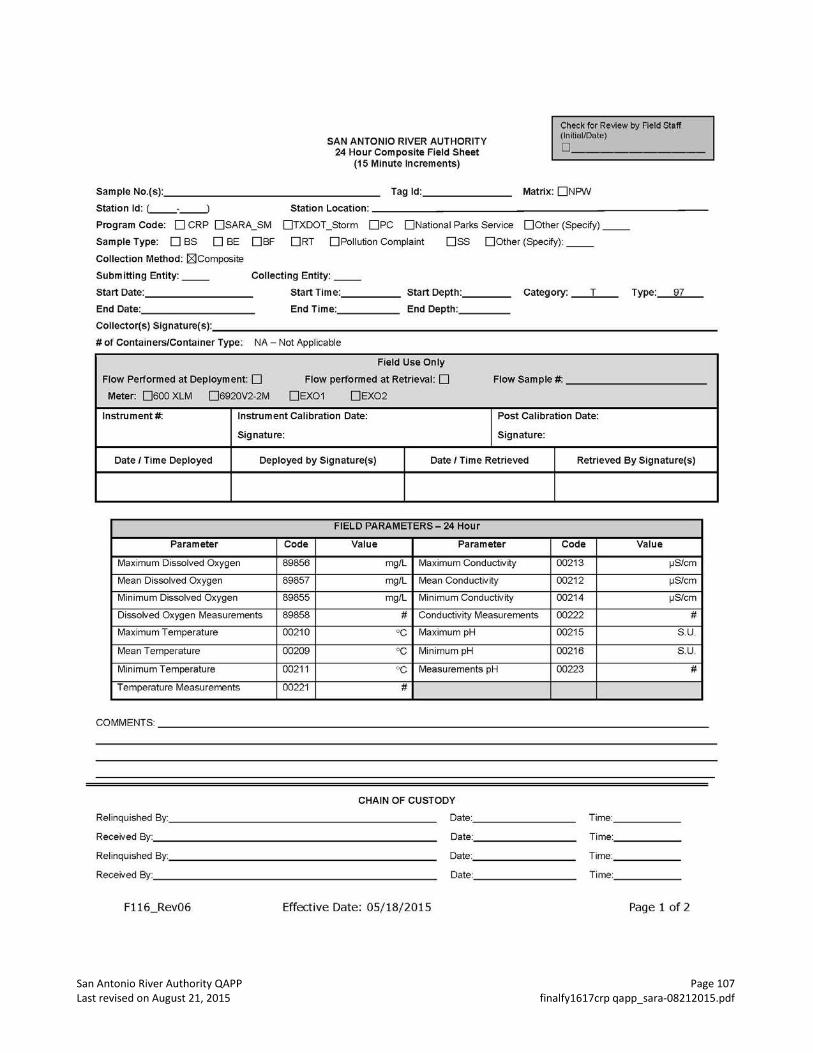
San Antonio River Authority QAPP Page 107 Last revised on August 21, 2015 finalfy1617crp qapp_sara-08212015.pdf
SAN ANTONIO RIVER AUTHORITY 24 Hour Composite Field Sheet
(15 Minute Increments)
Sample No.(s): ______________ _ Tag ld: _____ _
Check for Review by Field staff (lniliai/Date)
0
Matrix: O NPVV
Station ld: (_-_)
Program Code: 0 CRP 0SARA_SM
Sample Type: 0 BS 0 BE 0 BF
Collection Method: ~Composite
Station Location:------ ------ -------------
OTXDOT _Storm OPC 0National Parks Service 00ther (Specify) __
ORT 0Pollution Complaint O SS 00ther (Specify): __
Submitting Entity: __ Collecting Entity: __
Start Date: _______ _ Start Time:. ____ _ Start Depth:. ___ _ Category: __ T,___ Type: 97 End Date: ________ _ End Time: ____ _ End Depth: ___ _
Collector(s)Signature(s): _____________________________________ _
#of Containers/Container Type: NA - Not Applicable
Field Use Only
Flow Performed at Deployment: 0 Flow perfonned at Retrieval: 0 Flow Sample#.
Meter: 0600 XLM 06920V2-2M 0EX0 1 0EX02
Instrument#: Instrument Calibration Date: Post Calibration Date:
Signature: Signature:
Date I Time Deployed Deployed by Signature(s) Date I Time Retrieved Retrieved By Signature(s)
FIELD PARAMETERS- 24 Hour
Parameter Code Value Parameter Code Value
Maximum Dissolved Oxygen 89856 mg/L Maximum Conductivity 00213 j.JS/cm
Mean Dissolved Oxygen 89857 mg/L Mean Conductivity 00212 j.JS/cm
Minimum Dissolved Oxygen 89855 mg/L Minimum Conductivity 00214 j.JS/cm
Dissolved Oxygen Measurements 89858 # Conductivity Measurements 00222 #
Maximum Temperature 00210 oc Maximum pH 00215 S.U.
Mean Temperature 00209 oc Minimum pH 00216 S.U.
Minimum Temperature 0021 1 oc Measurements pH 00223 #
Temperature Measurements 00221 #
COMMENTS:-----------------------------------------
CHAIN OF CUSTODY
Rel inquished By: ____________________ _ Date: _______ _ Time: ____ _
Received By: _____________________ _ Date: _______ _ Time: ____ _
Relinquished By ____________________ _ Date: _______ _ Time: ____ _
Received By: _____________________ _ Date: _______ _ Time: ____ _
F116_Rev06 Effective Date: 05/18/2015 Page 1 of 2
San Antonio River Authority QAPP Page 108 Last revised on August 21, 2015 finalfy1617crp qapp_sara-08212015.pdf
LABELS
Sample Label
F116_Rev06 Effective Date: 05/18/2015 Page 2 of 2
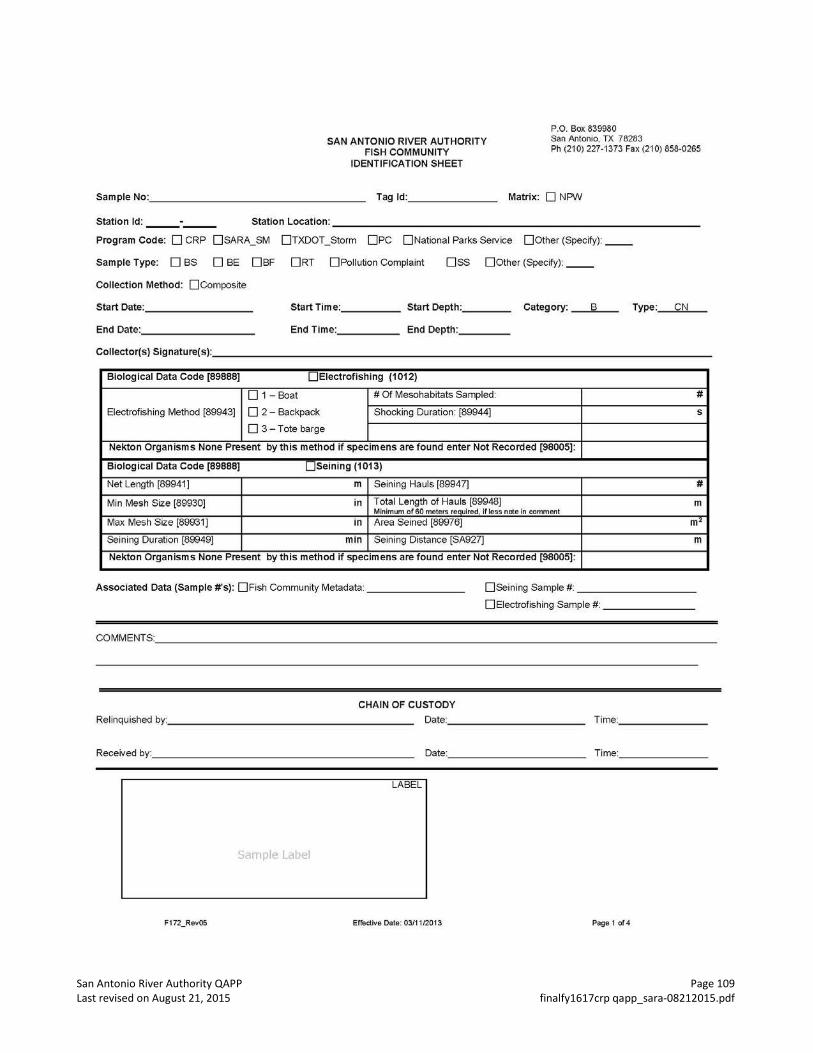
San Antonio River Authority QAPP Page 109 Last revised on August 21, 2015 finalfy1617crp qapp_sara-08212015.pdf
P.O. Box 839980 San Antonio, TX 7 8283 SAN ANTONIO RIVER AUTHORITY
FISH COMMUNITY IDENTIFICATION SHEET
Ph (21 0) 227-1373 Fax (210) 858-0265
Sample No:. ________________ _ Tag ld: ______ _ Matrix: 0 NPW
Station ld: _____ _ Station Location:-----------------------------
Program Code: D CRP OSARA_SM D TXDOT_Storm OPC DNational Parks Service 00ther (Specify): __
Sample Type: 0 BS 0 BE 0BF 0RT 0Pollution Complaint DSS DOther (Specify) : __
Collection Method: 0Composite
start Date: _______ _ Start Time:. _____ Start Depth:. ___ _ Category: __ B!:I....._ Type: CN
End Date: ________ _ End Time: ____ _ End Depth: ___ _
Collector(s)Signature(s): ____________________________________ _
Biological Data Code [89888] DEiectrofishing (1012)
D 1 -Boat #Of Mesohabitats Sampled: #
Electrofishing Method [89943) D 2 - Backpack Shocking Duration [89944) s
D 3- Tote barge
Nekton Organisms None Present by this method if specimens are found enter Not Recorded [98005]:
Biological Data Code [89888] D Seining (1013)
Net Length [89941) m Seining Hauls [89947) #
Min Mesh Size [89930) in Total Length of Hauls [89948) m Minimum of 60 meters re:quired, if less note in comment
Max Mesh Size [89931) in Area Seined [89976) m2
Seining Duration [89949) min Seining Distance [SA927] m
Nekton Organisms None Present by this method if specimens are found enter Not Recorded [98005):
Associated Data (Sample #'s): 0Fish Community Metadata _______ _ 0Seining Sample#:--------
DEiectrofishing Sample#:-------
COMMENTS: _____________________________________________________________________________ _
CHAIN OF CUSTODY Relinquished by __________________ _ Date: __________ _ Time: ______ _
Received by: ____________________ _ Date: __________ _ Time: ______ _
LABEL
Samp1e Lc1bel
F172_Rev05 EfFective Date: 03/1112013 Paget ol4
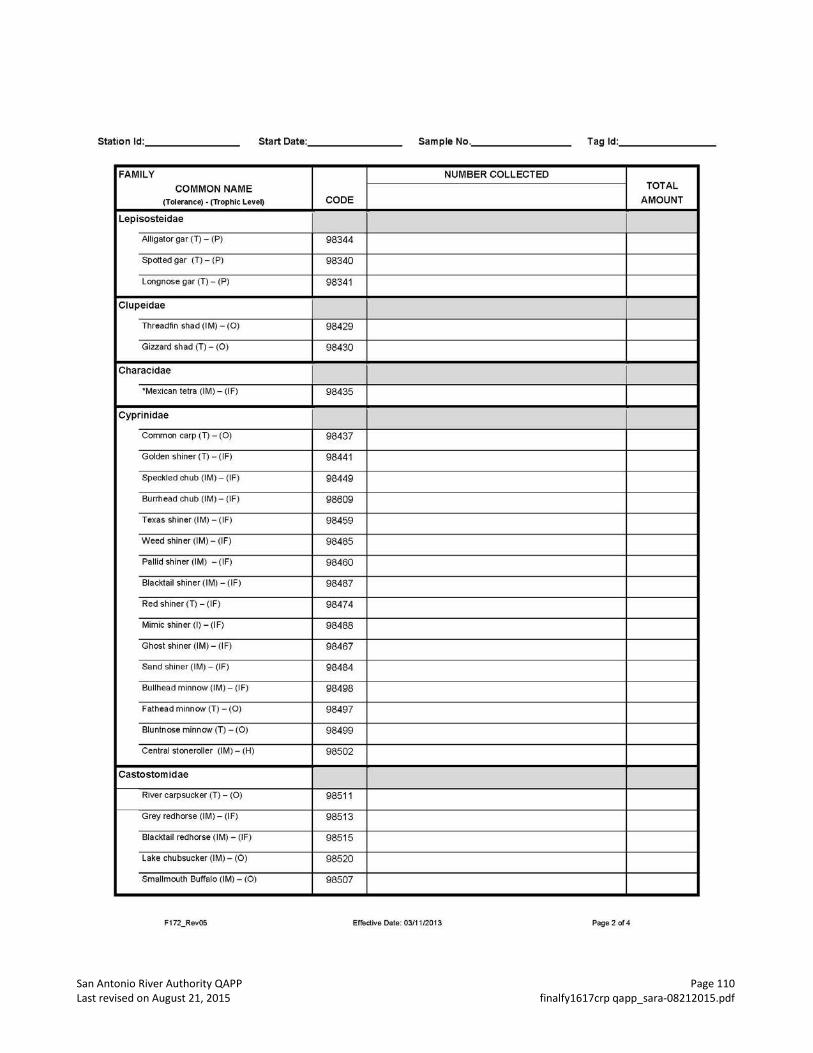
San Antonio River Authority QAPP Page 110 Last revised on August 21, 2015 finalfy1617crp qapp_sara-08212015.pdf
Station ld: _______ _ Start Date: _______ _ Sample No .. _______ _ Tag ld: ______ _
FAMILY NUMBER COLLECTED
COMMON NAME TOTAL
(Tolerance)· (Trophic Level) CODE AMOUNT
Lepisosteidae
Alligator gar (T) - (P) 98344
Spotted gar (T) - (P) 98340
Longnose gar (T) - (P) 98341
Clupeidae
Threadfin shad (IM) - (0 ) 98429
Gizzard shad (T) - (0 ) 98430
Characidae
*Mexican tetra (1M) - (I F) 98435
Cyprinidae
Common carp (T) - (0 ) 98437
Golden shiner (T) - ( IF) 98441
Speckled chub (IM) - (IF) 98449
Burmead chub (IM) - (IF) 98609
Texas shiner (IM)- (IF) 98459
Weed shiner (IM) - (IF) 98485
Pallid shiner (1M) - ( IF) 98460
Blacktail shiner (IM)- (IF) 98487
Red shiner (T) - (I F) 98474
Mimic shiner (I) - (IF) 98488
Ghost shiner (1M) - (IF) 98467
Sand shiner (1M) - (IF) 98484
Bullhead minnow (IM) - (IF) 98498
Fathead minnow (T) - (0 ) 98497
Bluntnose minnow (T) - (0) 98499
Central stoneroller (IM)- (H) 98502
Castostomidae
River carpsucker (T) - (0) 98511
Grey redhorse (IM)- (IF) 98513
Blacktail redhorse (1M) - (IF) 98515
Lake chubsucker (IM) - (0 ) 98520
Smallmouth Buffalo (IM) - (0 ) 98507
F172_Rev05 EIF9ctive Date: 03/1112013 Page 2 ol4
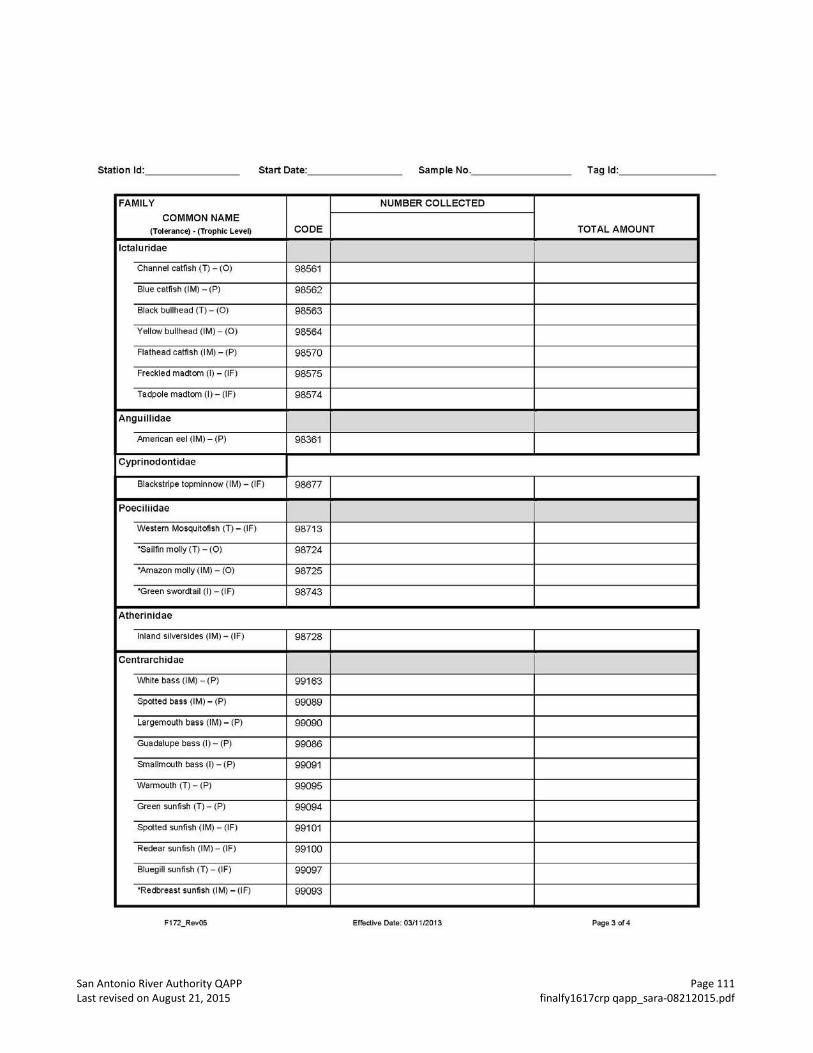
San Antonio River Authority QAPP Page 111 Last revised on August 21, 2015 finalfy1617crp qapp_sara-08212015.pdf
Station ld: _______ _ Start Date: _______ _ Sample No .. _______ _ Tag ld: ______ _
FAMILY NUMBER COLLECTED
COMMON NAME (Tolerance) · (Trophic LeveQ CODE TOTAL AMOUNT
lctaluridae
Channel catfish (T) - (0 ) 98561
Blue catfish (IM) - (P) 98562
Black bullhead (T) - (0) 98563
Yellow bullhead (IM) - (0 ) 98564
Flathead catfish (I M) - (P) 98570
Freckled madlom (I) - (IF) 98575
Tadpole madtom (I) - (IF) 98574
Anguillidae
American eel (IM)- (P) 98361
Cypr inodontidae
Blackstripe topminnow (1M) - (IF) 98677
Poeciliid ae
West em Mosqu ~ofish (T) - (IF) 98713
'Sailfin molly (T) - (0) 98724
'Amazon molly (1M) - (0) 98725
'Green swordtail (I) - (IF) 98743
Ather in idae
Inland silversides (IM) - (IF) 98728
Centrarch idae
White bass (IM) - (P) 99163
Spotted bass (IM) - (P) 99089
Largemouth bass (IM) - (P) 99090
Guadalupe bass (I) - (P) 99086
Srnallmoulh bass (I) - (P) 99091
Warmoulh (T) - (P) 99095
Green sunfish (T) - (P) 99094
Spotted sunfish (1M) - (IF) 99101
Redear sunfish (IM) - (IF) 99100
Bluegill sunfish (T) - (I F) 99097
' Redbreast sunfish (IM) - (IF) 99093
F172_Rev05 EfFective Date: 03/1112013 Page 3 ol4
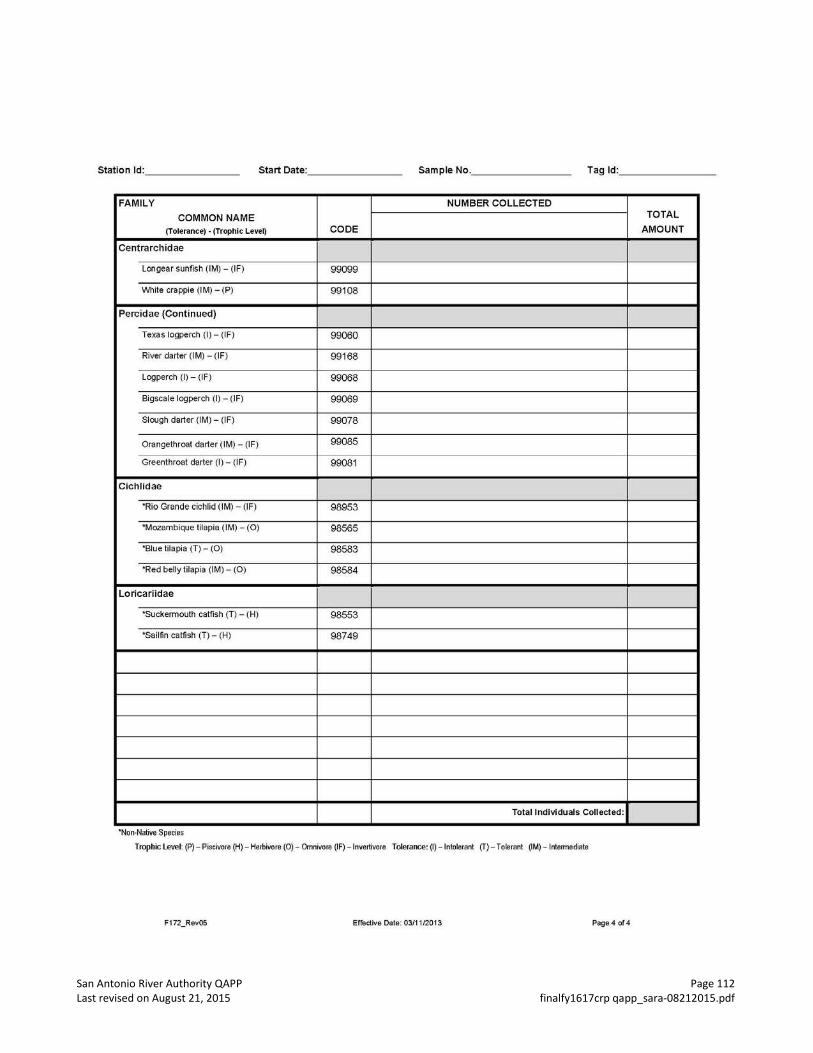
San Antonio River Authority QAPP Page 112 Last revised on August 21, 2015 finalfy1617crp qapp_sara-08212015.pdf
Station ld: _______ _ Start Date: _______ _ Sample No .. _______ _ Tag ld: ______ _
FAMILY NUMBER COLLECTED
COMMON NAME TOTAL
(Tolerance)- (Trophic Level) CODE AMOUNT
Centrarchidae
Lon gear sunfish (IM) - (IF) 99099
While crappie (I M) - (P) 99108
Percidae (Continued)
Texas logperch (I) - (IF) 99060
River darter (IM) - (IF) 99168
Logperch (I) - (IF) 99068
Bigscale logperch (I) - (IF) 99069
Slough darter (IM) - (IF) 99078
Orangethroat darter (1M) - (IF) 99085
Greenthroat darter (I) - (IF) 99081
Cichlidae
'Rio Grande cichlid (1M) - (IF) 98953
'Mozambique tilapia (1M) - (0) 98565
'Blue tilapia (T)- (0) 98583
'Red belly tilapia (1M)- (0 ) 98584
Loricariidae
'Suckermouth catfish (T) - (H) 98553
'Sailfin catfish (T) - (H) 98749
Total Individuals Collected:
'Non-Nat1ve Spec1es
Trophic Level: (P)-Piscivore (H)- Herbivore (0) - Omnivore (IF) - lnvertivore Toleranoe: (I) - Intolerant (T)- Tolell!nt (IM) - lntennediate
F172_Rev05 EfFective Date: 03/1112013 Page4 ol4
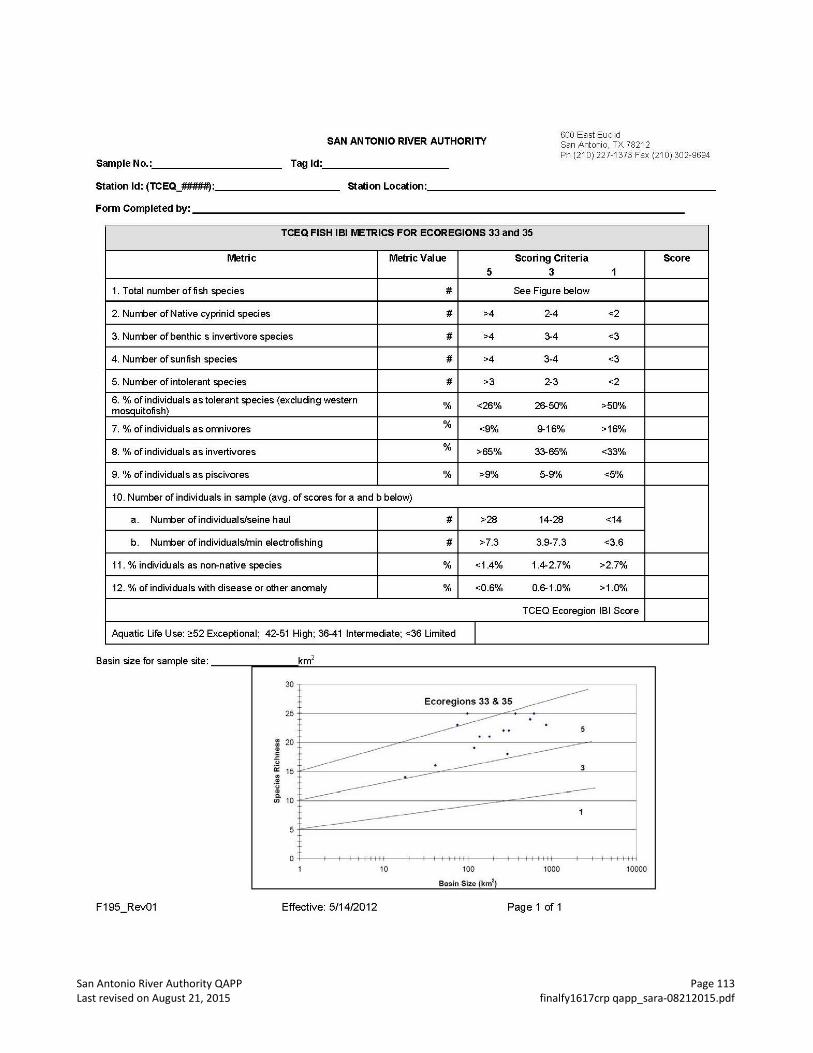
San Antonio River Authority QAPP Page 113 Last revised on August 21, 2015 finalfy1617crp qapp_sara-08212015.pdf
SAN ANTONIO RIVER AUTHORITY 600 East Euclid San Antonio, TX 78212
Sample No.:. _________ _ Tag ld: ________ _ Ph (21 0) 227-1373 Fax (21 0) 302-9694
Station ld: (TCEQ_#####): ________ _ station Location: _______________________ _
FormCompl~edby: ____________________________________ _
TCEQ FISH IBIIVETRICS FOR ECOREGIONS 33 and 35
Metric M~ricValue Scoring Criteria Score 5 3 1
1. Total number offish species # See Figure below
2. Number of Native cyprinid species # >4 2-4 <2
3. Number of benthic s invertivore species # >4 :>4 <3
4. Number of sunfish species # >4 3-4 <3
5. Number of intolerant species # >3 2-3 <2
6. %of individuals as tolerant species (excluding western % <26% 26-50% >50% mosquitofish)
7.% of individuals as omnivores % <9% 9-16% >16%
8. %of individuals as invertivores % >65% 3:>65% <33%
9. %of individuals as piscivores % >9% 5-9% <5%
10. Number of individuals in sample (avg. of scores for a and b below)
a. Number of individuals/seine haul # >28 14-28 <14
b. Number of individuals/min electrofishing # >7.3 3.9-7.3 <3.6
11. %individuals as non-native species % <1.4% 1.4-2.7% >2.7%
12. %of individuals with disease or other anomaly % <0.6% 0.6-1.0% >1.0%
TCEQ Ecoregion 181 Score
Aquatic Life Use: <::52 Exceptional; 42-51 High; 36-41 Intermediate; <36 Limited I Basin size for sample site: ___ .,... ___ ..:;k::.;m.:.2 ___________________________ __,
10 100 1000 10000
Basin Size (km2)
F195_Rev01 Effective: 5/14/2012 Page 1 of 1
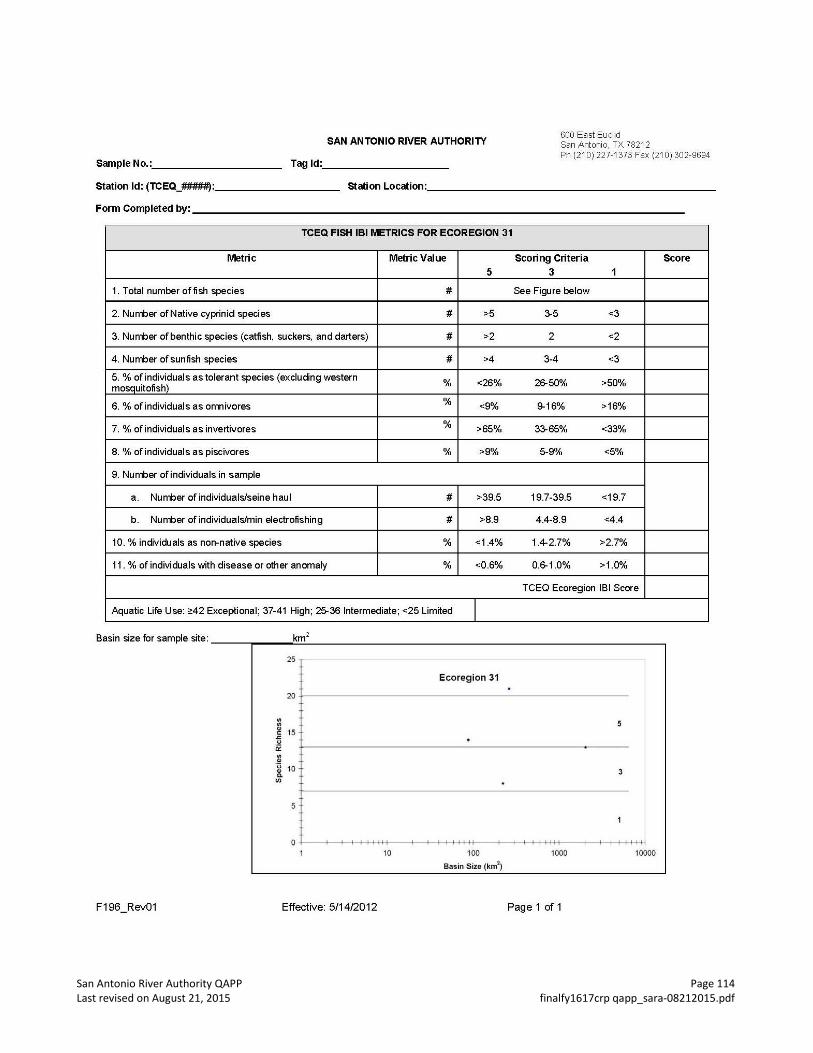
San Antonio River Authority QAPP Page 114 Last revised on August 21, 2015 finalfy1617crp qapp_sara-08212015.pdf
SAN ANTONIO RIVER AUTHORITY 600 East Euclid San Antonio, TX 78212
Sample No.:. _________ _ Tag ld: ________ _ Ph (21 0) 227-1373 Fax (21 0) 302-9694
Station ld: (TCEQ_#####): ________ _ station Location: _______________________ _
FormCompl~edby: ____________________________________ _
TCEQ FISH IBI METRICS FOR ECOREGION 31
Metric M~ricValue Scoring Criteria Score 5 3 1
1. Total number offish species # See Figure below
2. Number of Native cyprinid species # >5 ~5 <3
3. Number of benthic species (catfish, suckers, and darters) # >2 2 <2
4. Number of sunfish species # >4 3-4 <3
5. %of individuals as tolerant species (excluding western % <26% 26-50% >50% mosquitofish)
6. %of individuals as omnivores % <9% 9-16% >16%
7.% of individuals as invertivores % >65% 3~65% <33%
8. %of individuals as piscivores % >9% 5-9% <5%
9. Number of individuals in sample
a. Number of individuals/seine haul # >39.5 19.7-39.5 <19.7
b. Number of individuals/min electrofishing # >8.9 4.4-8.9 <4.4
10. %individuals as non-native species % <1.4% 1.4-2.7% >2.7%
11. %of individuals with disease or other anomaly % <0.6% 0.6-1.0% >1.0%
TCEQ Ecoregion IBI Score
Aquatic Life Use: 0::42 Exceptional; 37-41 High; 25-36 Intermediate; <25 Limited I Basin size for sample site: ----.----::k~m~
2
------------------------------,
F196_Rev01
25
Ecoregion 31
20 +---------------------------
.. .. :g 15 .t: ,I!
"' ~ -~ 10
"' 5
Effective: 5/14/2012
10 100 1000
Basin Size (km2)
Page 1 of 1
10000
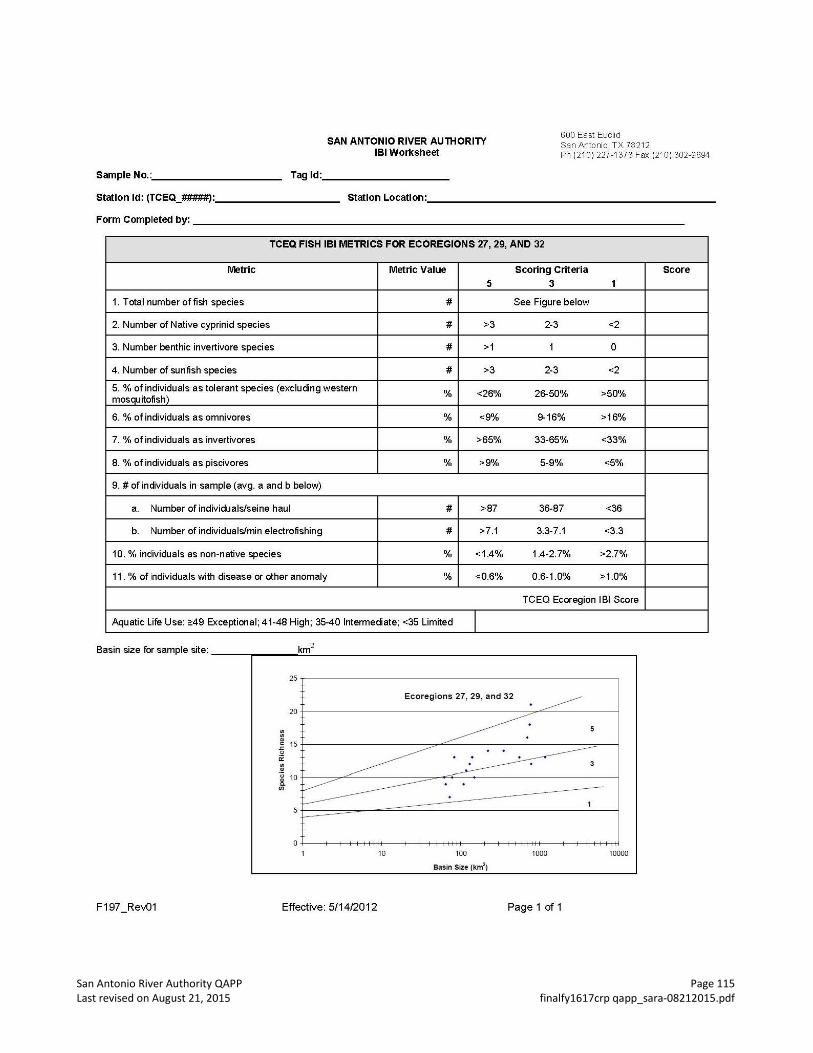
San Antonio River Authority QAPP Page 115 Last revised on August 21, 2015 finalfy1617crp qapp_sara-08212015.pdf
600 East Euclid San Anton1o, TX 78212 SAN ANTONIO RIVER AUTHORITY
IBI Worksheet Ph (210) 227-1 373 Fax (2' 0) 302-9694
Sample No.:. _________ _ Tag ld: ________ _
Station ld: (TCEQ_#####): ________ _ Station Location=------------------------
Form Completed by:---------------------------------------
TCEQ FISH IBI METRICS FOR ECOREGIONS 27, 29, AND 32
Metric Metric Value Scoring Criteria
5 3 1
1. Total number of fish species # See Figure below
2. Number of Native cyprinid species # >3 2-3 <2
3. Number benthic invertivore species # >1 1 0
4. Number of sunfish species # >3 2-3 <2
5.% of individuals as tolerant species (excluding western % <26% 26-50% >50%
mosquitofish)
6.% of individuals as omnivores % <9% 9-16% >16%
7.% of individuals as invertivores % >65% 33-65% <33%
8.% of individuals as piscivores % >9% 5-9% <5%
9. #of individuals in sample (avg. a and b below)
a. Number of individualsfseine haul # >87 36-87 <36
b. Number of individualsfmin electrofishing # >7.1 3.3-7.1 <3.3
10.% individuals as non-native species % <1.4% 1.4-2.7% >2.7%
11 . % of individuals with disease or other anomaly % <0.6% 0.6-1.0% >1.0%
TCEQ Ecoregion IBI Score
Aquatic life Use: ~49 Exceptional; 41-48 High; 35-40 Intermediate; <35 Limited I Basin size for sample site: ----r---..::k::.:m.:..2
__________________________ ,
F197 _Rev01
25,---------------------------------------------------,
Ecoregions 27, 29, and 32
"' "' " ~ 15 +-------------------~~~---------------------=~~
0:: "' " -~ 10 +---~~~--------~~--~--~--------------------~ en
10 100 1000 10000
Basin Size (km2)
Effective: 5/1412012 Page 1 of 1
Score
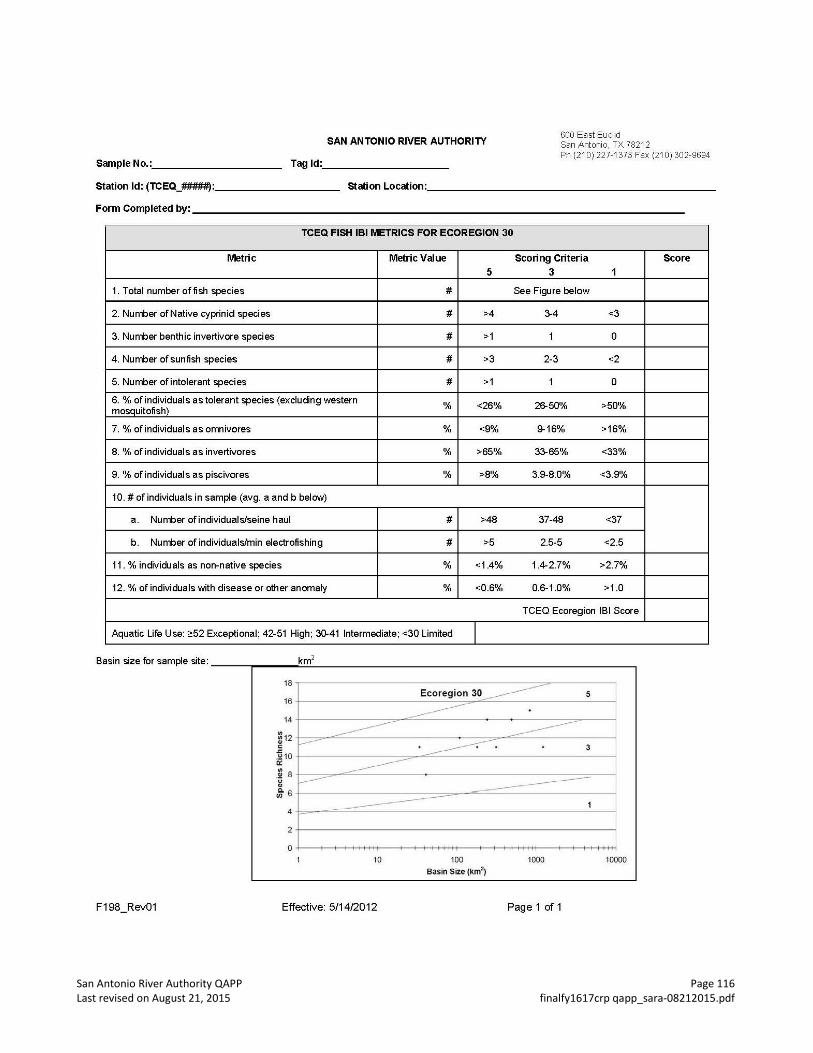
San Antonio River Authority QAPP Page 116 Last revised on August 21, 2015 finalfy1617crp qapp_sara-08212015.pdf
SAN ANTONIO RIVER AUTHORITY 600 East Euclid San Antonio, TX 78212
Sample No.:. _________ _ Tag ld: ________ _ Ph (21 0) 227-1373 Fax (21 0) 302-9694
Station ld: (TCEQ_#####): ________ _ station Location: _______________________ _
FormCompl~edby: ____________________________________ _
TCEQ FISH IBI METRICS FOR ECOREGION 30
Metric M~ricValue Scoring Criteria Score 5 3 1
1. Total number offish species # See Figure below
2. Number of Native cyprinid species # >4 ~4 <3
3. Number benthic invertivore species # >1 1 0
4. Number of sunfish species # >3 2-3 <2
5. Number of intolerant species # >1 1 0
6. %of individuals as tolerant species (excluding western % <26% 26-50% >50% mosquitofish)
7.% of individuals as omnivores % <9% 9-16% >16%
8. %of individuals as invertivores % >65% 3~65% <33%
9. %of individuals as piscivores % >8% 3.9-8.0% <3.9%
10. #of individuals in sample (avg. a and b below)
a. Number of individuals/seine haul # >48 37-48 <37
b. Number of individuals/min electrofishing # >5 2.5-5 <2.5
11. %individuals as non-native species % <1.4% 1.4-2.7% >2.7%
12. %of individuals with disease or other anomaly % <0.6% 0.6-1.0% >1.0
TCEQ Ecoregion 181 Score
Aquatic Life Use: <::52 Exceptional; 42-51 High; 30.41 Intermediate; <30 Limited I Basin size for sample site: ___ .,... ___ ..:;k::.;m.:.2 __________________________ ...,
18 Ecoregion 30 -------- 5
----------------- --------16
14
!---"" ____---; . 3
------f..---- ------------ 1 4
2
0
10 100 1000 10000
Basin SiZe (km2)
F198_Rev01 Effective: 5/14/2012 Page 1 of 1
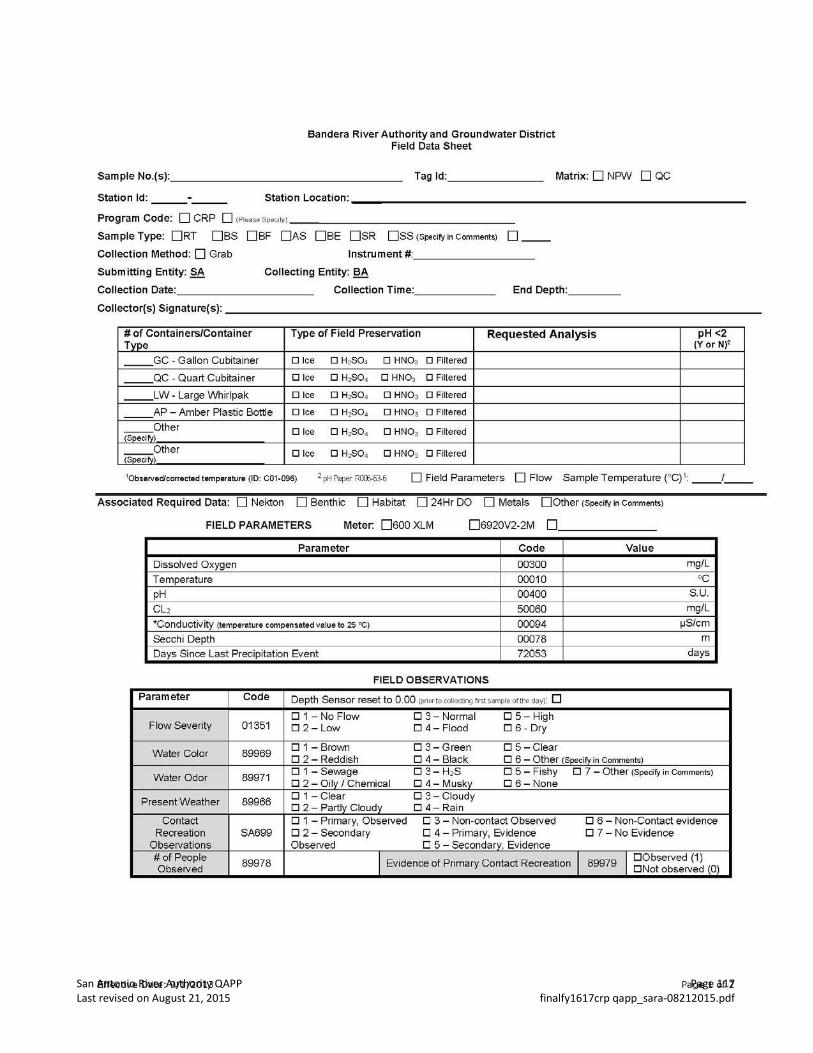
San Antonio River Authority QAPP Page 117 Last revised on August 21, 2015 finalfy1617crp qapp_sara-08212015.pdf
Bandera River Authority and Groundwater District Field Data Sheet
Sample No.(s): _______________ _ Tag ld: ______ _ Matrix: 0 NPW 0 QC
Station ld: _____ _ Station Location:------------------------------
Program Code: 0 CRP 0 <PieaseSpecofy) ________________ _
SampleType: ORT OBS OBF OAS OBE OSR O SS (SpecifyinComments) o __ Instrument#: ________ _ Collection Method: D Grab
Submitting Entity: SA Collecting Entity: BA
Collection Date: _________ _ Collection Time: _____ _ End Depth: ___ _
Collector(s) Signature(s): --------------------------------------
#of Containers/Container Type of Field Preservation Requested Analysis pH <2 Type (Y or N)Z
GC- Gallon Cubitainer o Ice o H2so. 0 HNOs o Filtered
__ QC- Quart Cubitainer o Ice o H~o. 0 HN03 0 Filtered
LW- Large Whirlpak o Ice o H~o. 0 HN03 o Filtered
AP - Amber Plastic Bottle o Ice -- o H~o. 0 HN03 o Filtered
Other o Ice o H~o. 0 HN03 0 Filtered (SpecifY> Other o Ice OH~O. 0 HN03 0 Filtered (SpecifY>
'Observed/corrected templ!fature (10: COt-096) 2 pH Paper R!Xl>-63-6 0 Field Parameters 0 Flow Sample Temperature (0 C)1 __ t __
Associated Required Data: 0 Nekton D Benthic 0 Habitat D 24Hr DO D Metals 00ther (Specify in comments)
FIELD PARAMETERS Meter. 0600 XLM 06920V2-2M D
Parameter Code Value
Dissolved Oxygen 00300 mg/L
Temperature 00010 oc ..E!i_ 00400 S.U .
5 oo6o ----::-
CL2 mg/L
*Conductivity (temperature compensated value to 25 •c) 00094 JJS/cm
Secchi Depth 00078 m
Days Since Last Precipitation Event 72053 days
FIELD OBSERVATIONS
Parameter Code Depth Sensor reset to 0.00 (prior to collecting first s ample of tho day): D 01- No Flow 0 3-Normal 0 5- High
Flow Severity 01351 02-Low 0 4- Flood 0 6- Dry
Water Color 89969 01- Brown 0 3-Green 0 5-Ciear 0 2- Reddish 0 4- Black 0 6 - Other (Specify in Comments)
Water Odor 89971 01- SeVJage 0 3- H2S 0 5- Fishy 0 7 - Other (Specify in Comments) CJ 2- Oily I Chemical CJ 4- Musky CJ 6- None
Present Weather 89966 01- Clear 0 3-Cioudy CJ 2- Partly Cloudy CJ 4- Rain
Contact 0 1 - Primary, Observed 0 3- Non-oontact Observed 0 6 - Non-Contact evidence Recreation SA699 0 2 - Secondary 0 4- Primary, Evidence 0 7 - No Evidence
Observations Observed 0 5- Secondary, Evidence #of People 89978 I Evidence of Primary Contact Recreation I 89979 I g~~;~~s~~~1 (O) Observed
Effective Date : 9/1/2013 Page 1 of 2
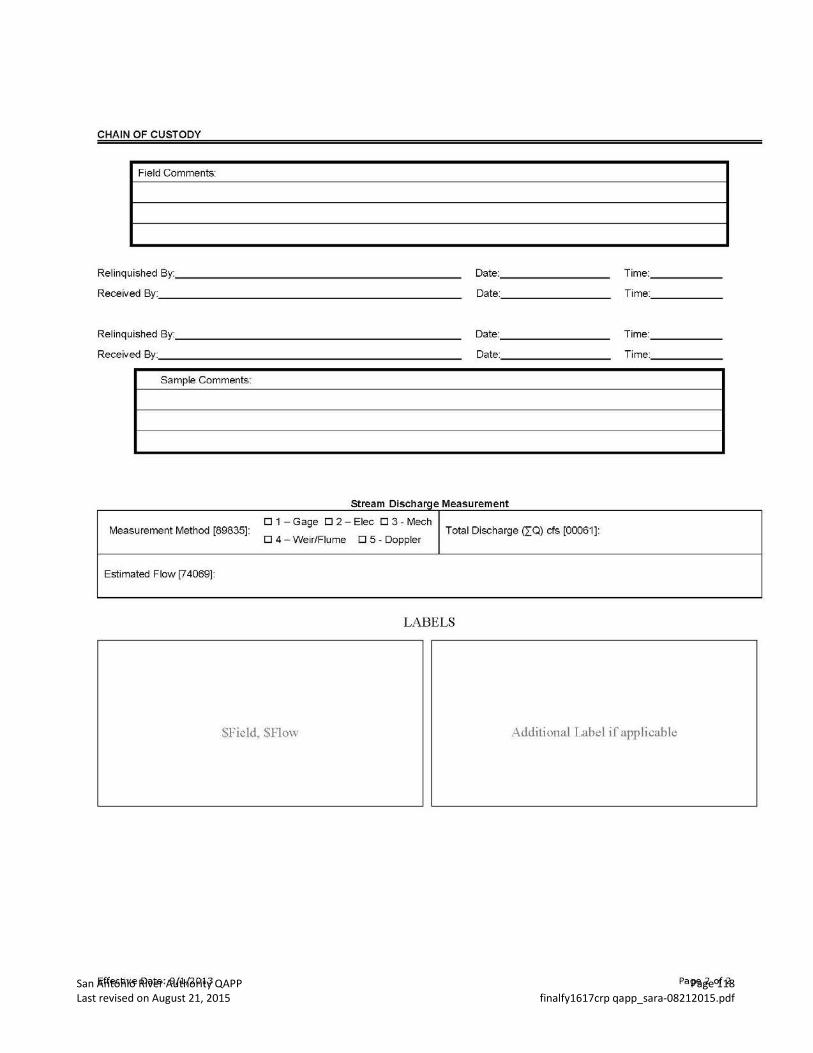
San Antonio River Authority QAPP Page 118 Last revised on August 21, 2015 finalfy1617crp qapp_sara-08212015.pdf
CHAIN OF CUSTODY
Field Comments:
Rel inquished By: ___________________ _ Date: _______ _ Time: ____ _
Received By: _____________________ _ Date: _______ _ Time: ____ _
Rel inquished By:. ____________________ _ Date: _______ _ Time: ____ _
Received By: _____________________ _ Date: _______ _ Time: ____ _
Sample Comments:
St ream o· h 1sc arge M easuremen
Measurement Method [89835]: CJ 1 -Gage CJ 2- Elec CJ 3- Mech
Total Discharge (l:Q) cfs [00061 ]: CJ 4- Weir/F lume CJ 5 - Doppler
Estimated Flow [74069]:
LABELS
$Field, $Flow Additional Label irapplicable
Effective Date: 9/1/2013 Page 2 of 2
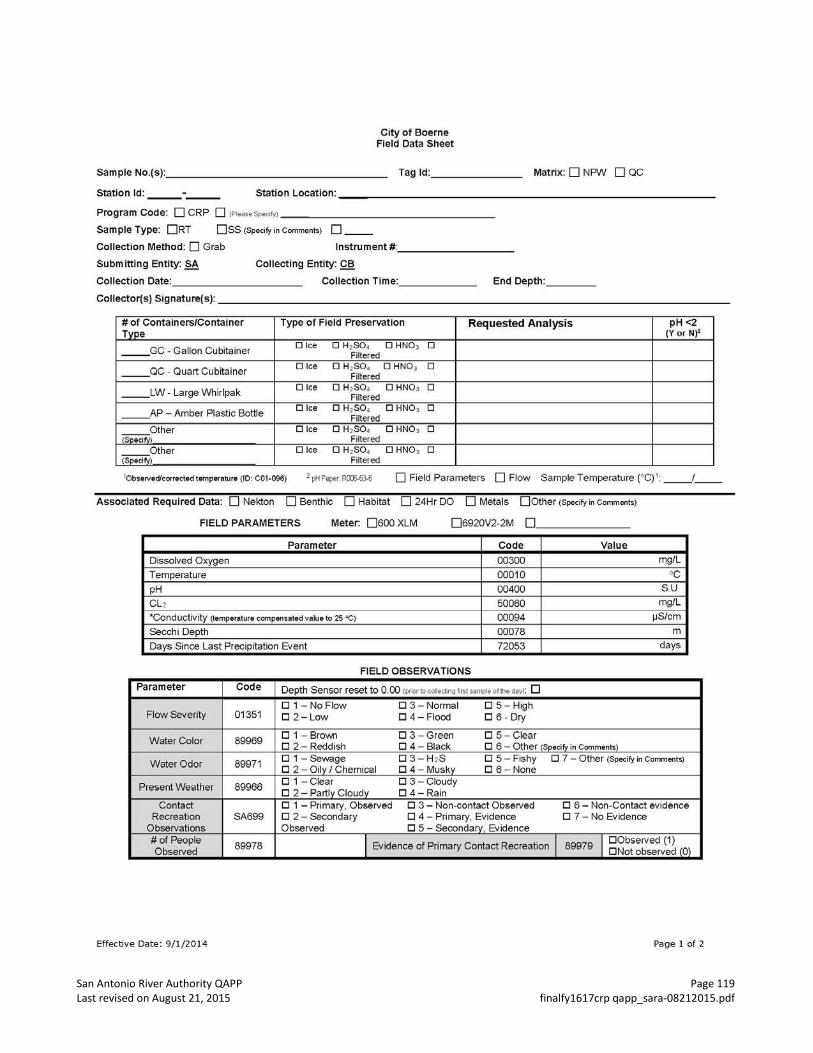
San Antonio River Authority QAPP Page 119 Last revised on August 21, 2015 finalfy1617crp qapp_sara-08212015.pdf
City of Boerne Field Data Sheet
Sample No.(s): _______________ _ Tag ld: ______ _ Matrix: 0 NP\1\f 0 QC
Station ld: _____ _ Station Location:------------------------------
Program Code: 0 CRP 0 (Pttasespoaryl ________________ _
SampleType: ORT OSS (Speeify inComments) 0 __ Collection Method: 0 Grab
Submitting Entity: SA
Instrument# ________ _
Collecting Entity: CB
Collection Date: _________ _ Collection Time: _____ _ End Depth: ___ _
Collector(s) Signature(s): --------------------------------------
#of Containers/Container Type of Field Preservation Requested Analysis pH <2 Type (Y or N)2
__ GC- Gallon Cubitainer 0 lee o H,so. 0 HN03 0 Filtered
__ QC - Quart Cubitainer o Ice o H,so. 0 HNO, 0
Filtered
__ LW- Large Whirlpak o Ice o H, so. 0 HN03 0 Filtered
__ AP- Amber Plastic Bottle 0 Ice o H2so. O HN03 0 Filtered
Other 0 Ice o H, so. 0 HN03 0 (speeii\il Filtered
Other o Ice o H,so. 0 HN03 0 (SpecTiYJ Filtered
10bservedfcorrected tempe<ature (10: C01·096) 2 pH Paper. ROOS-63-6 0 Field Parameters 0 Flow Sample Temperature (0 C) 1: __ / __
Associated Required Data: 0 Nekton 0 Benthic 0 Habitat 0 24Hr DO 0 Metals OOther (Specify in comments)
FIELD PARAMETERS Meter: 0600 XLM 06920V2 2M 0 -
Parameter Code Value
Dissolved Oxygen 00300 mg/L
Temperature 00010 •c pH 00400 S.U.
CL2 50060 mg/L
•conductiv ity (temperature compensated value to 25 "C) 00094 ~S/cm
Secchi Depth 00078 m
Days Since Last Precipitation Event 72053 days
FIELD OBSERVATIONS
Parameter Code Depth Sensor reset to 0.00 (pnor toccleetJng~rst sampteotlhedayl: 0 0 1 - No Flow 0 3 -Normal 0 5-High
Flow Severity 01351 0 2-Low 0 4-Fiood 0 6- Dry
WaterColor 89969 0 1- Brown 0 3 -Green 0 5-Ciear 0 2- Reddish 0 4-Biack 0 6 - Other (Specif,o in Comments)
Water Odor 89971 0 1-Sewage 0 3-H2S 0 5- Fishy 0 7 - Other (Specify in Comments)
0 2- Oily I Chemical 0 4- Musky 0 6- None
Present Weather 89966 0 1-Ciear 0 3-Cioudy 0 2 - Partly Cloudy 0 4-Rain
Contact 0 1 - Primary, Observed 0 3- Non-contact Observed 0 6 - Non-Contact evidence Recreation SA699 0 2 -Secondary 0 4 - Primary, Evidence 0 7 - No Evidence
Observations Observed 0 5- Secondary, Ev idence #of People
89978 I Evidence of Primary Contact Recreation I 89979 I ~~~:~;S:~v~~ (O) Observed
Effective Date: 9/1/2014 Page 1 of 2
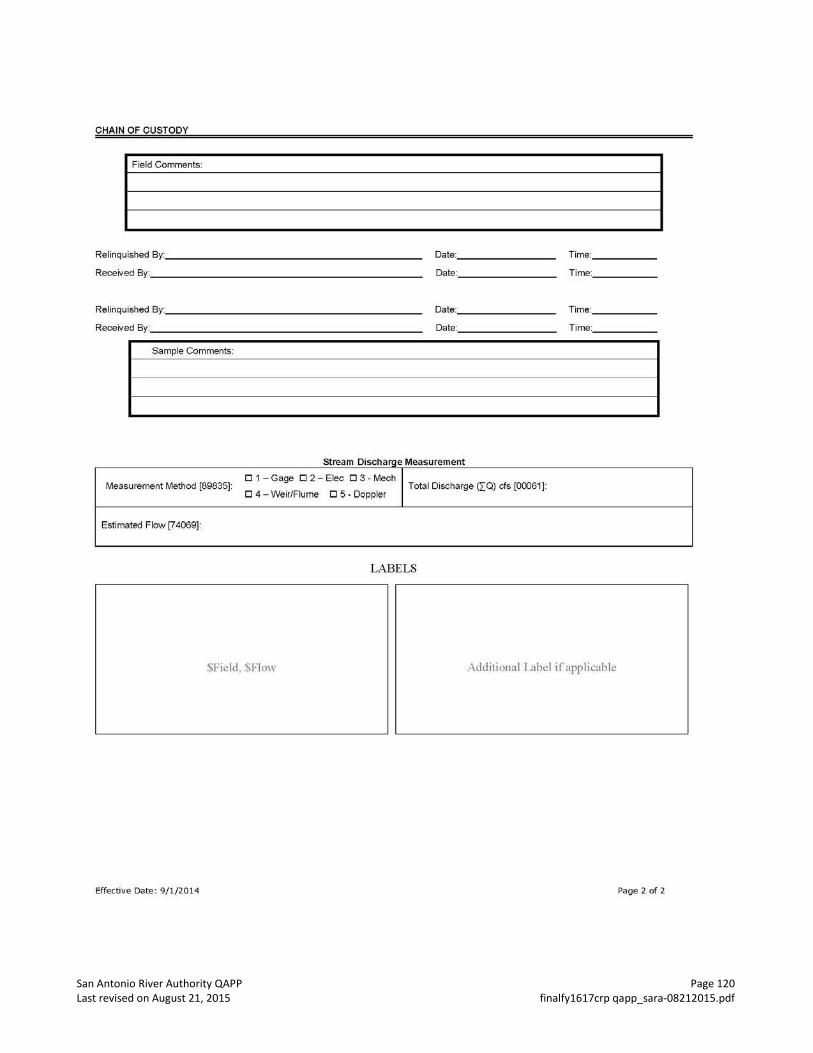
San Antonio River Authority QAPP Page 120 Last revised on August 21, 2015 finalfy1617crp qapp_sara-08212015.pdf
CHAIN OF CUSTODY
Relinquished By: ____________________ _ Date: Time:
Received By: ______________________ _ Date: Time:
Relinquished By: ____________________ _ Date: Time:
Received By: ______________________ _ Date: Time:
Sample Comments:
stream Discharge Measurement
D 1 -Gage D 2 - Elec D 3 - Mech Measurement Method [89835):
D 4 - Weir/Flume D 5- Doppler Total Discharge (l:Q) cfs [00061]:
Estimated Flow [74069]:
LABELS
$Field, $Flow Additional L1bel if applicable
Effective Date: 9/1/2014 Page 2 of 2
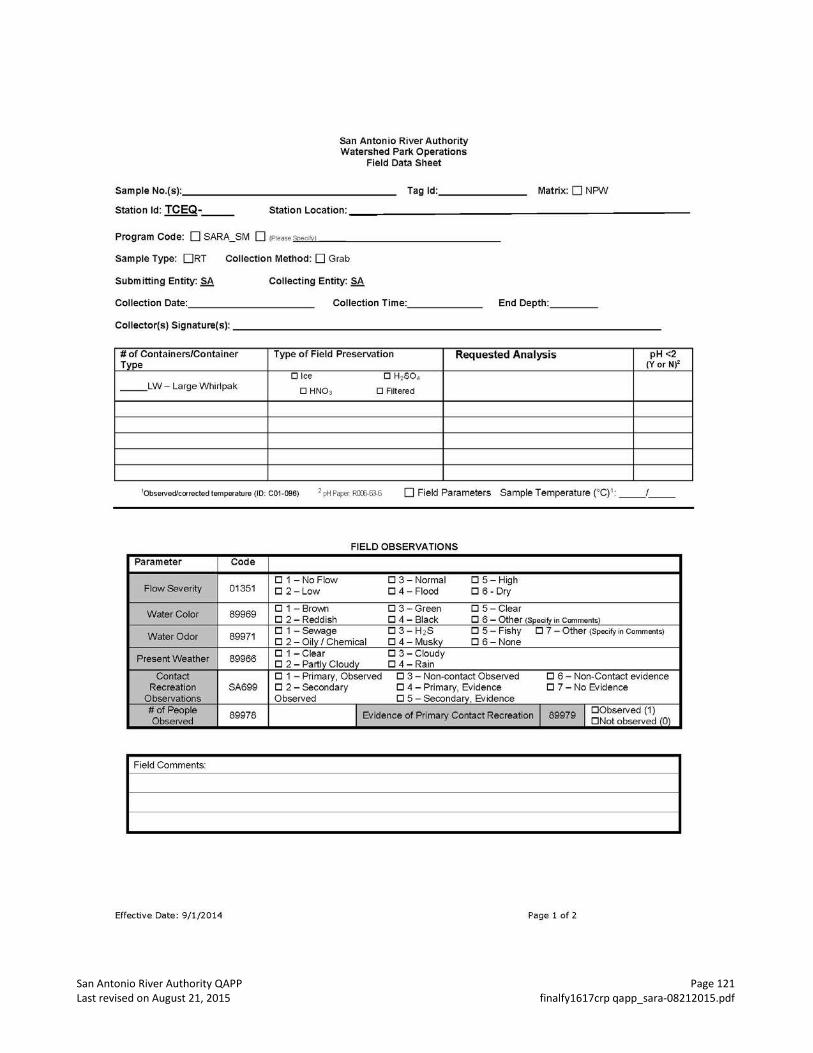
San Antonio River Authority QAPP Page 121 Last revised on August 21, 2015 finalfy1617crp qapp_sara-08212015.pdf
San Antonio River Authority Watershed Park Operations
Field Data Sheet
Sample No.(s): _______________ _ Tag ld: ______ _ Matrix: 0NPW
Station ld: TCEQ-__ Station Location: __________________________ _
Program Code: 0 SARA_SM 0 !Piease :lls :::.a= ---------------
Sample Type: ORT Collection Method: 0 Grab
Submitting Entity: SA Collecting Entity: SA
Col lection Date: __________ _ Collection Time:, _____ _ End Depth: ___ _
Collector(s) Signature(s): ----------------------------------
#of Containers/Container Type of Field Preservation Requested Analysis pH <.2 Type (Y or N)2
0 Ice o H,so. __ LW- Large Whirlpak
0 HNOs 0 Filtered
10bservedlcorrected temperature (10: COI-096) 1 pH Peper ROOXG-6 0 Field Parameters Sample Temperature (0C)1: __ / __
FIELD OBSERVATIONS
Parameter Code
0 1 -NoFiow 0 3-Normal 0 5- High Flow Severity 01351 0 2-Low 0 4- Flood 0 6 ·Dry
WaterColor 89969 0 1 - Brown 0 3-Green 0 5-Ciear 0 2- Reddish 0 4- Black 0 6 - Other (Specify in Comments)
Water Odor 89971 0 1 -Sewage 0 3-H2S 0 5- Fishy 0 7 - Other (Spotil"y in Comments)
0 2 - Oily I Chemical 0 4- Musky 0 6- None
Present Weather 89966 0 1 -Ciear 0 3-Cioudy 0 2- Partly Cloudy 0 4- Rain
Contact 0 1 -Primary, Observed 0 3 - Non-contact Observed 0 6 - Non-Contact evidence Recreation SA699 0 2- Secondary 0 4 - Primary, Evidence 0 7 - No Evidence
Observations Observed 0 5- Secondary, Evidence #of People
89978 I Evidence of Primary Contact Recreation I 89979 I g~~~~~!~~~ (O) Observed
Effective Date: 9/1/2014 Page 1 of 2
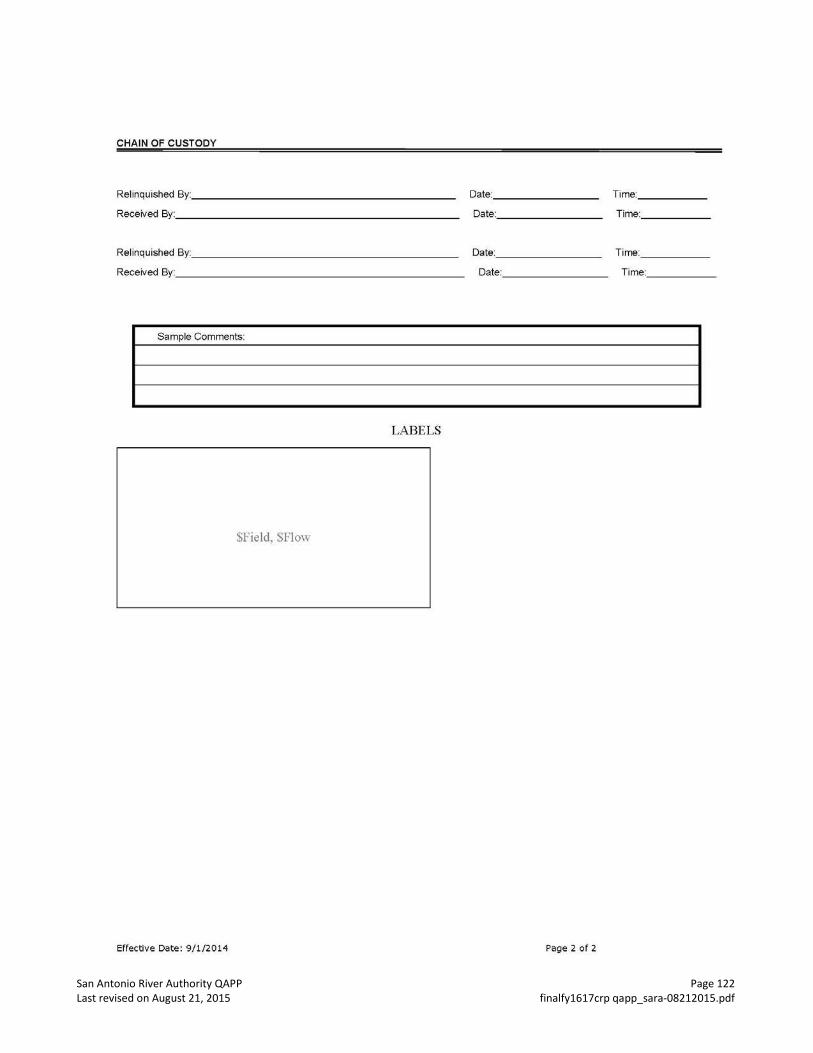
San Antonio River Authority QAPP Page 122 Last revised on August 21, 2015 finalfy1617crp qapp_sara-08212015.pdf
CHAIN OF CUSTODY
Relinquished By: Date: Time:
Received By: Date: Time:
Relinquished By: Date: Time:
Received By: Date: T ime:
Sample Comments:
LABELS
$Field, $flow
Effective Date: 9/1/2014 Page 2 of 2
San Antonio River Authority QAPP Page 123 Last revised on August 21, 2015 finalfy1617crp qapp_sara-08212015.pdf
Appendix E: Data Review Checklist and Summary Shells
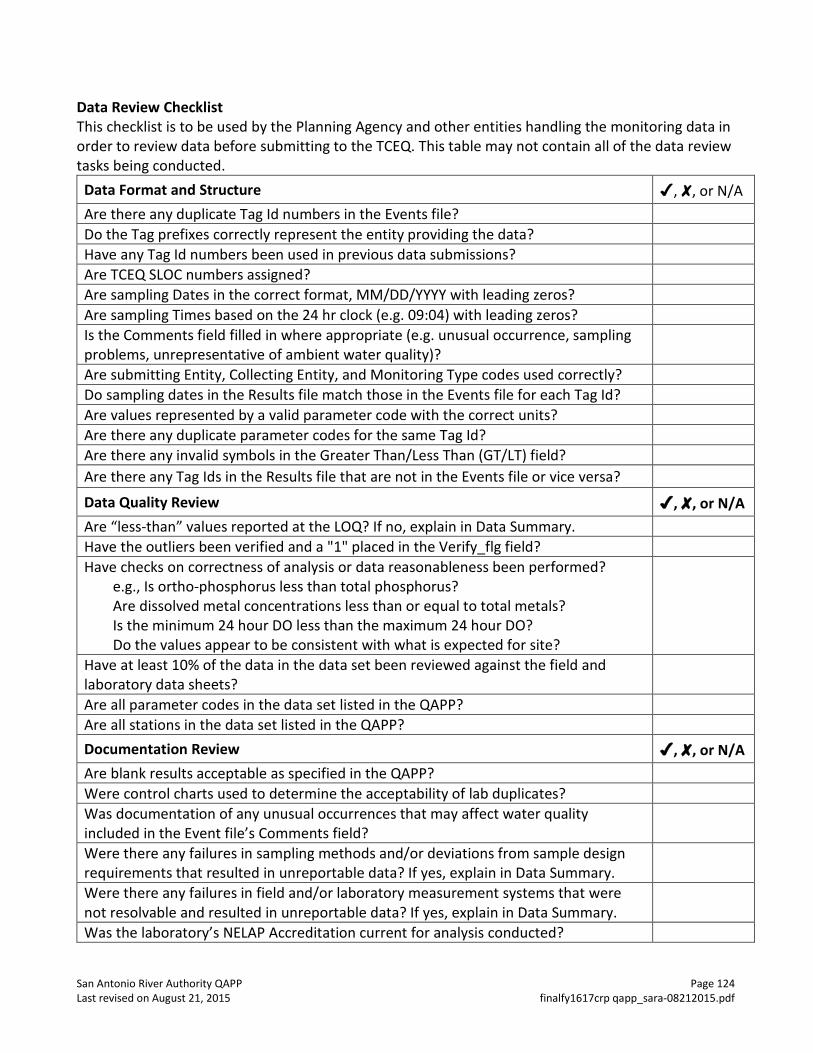
San Antonio River Authority QAPP Page 124 Last revised on August 21, 2015 finalfy1617crp qapp_sara-08212015.pdf
Data Review Checklist This checklist is to be used by the Planning Agency and other entities handling the monitoring data in order to review data before submitting to the TCEQ. This table may not contain all of the data review tasks being conducted.
Data Format and Structure ✔, ✘, or N/A Are there any duplicate Tag Id numbers in the Events file? Do the Tag prefixes correctly represent the entity providing the data? Have any Tag Id numbers been used in previous data submissions? Are TCEQ SLOC numbers assigned? Are sampling Dates in the correct format, MM/DD/YYYY with leading zeros? Are sampling Times based on the 24 hr clock (e.g. 09:04) with leading zeros? Is the Comments field filled in where appropriate (e.g. unusual occurrence, sampling problems, unrepresentative of ambient water quality)?
Are submitting Entity, Collecting Entity, and Monitoring Type codes used correctly? Do sampling dates in the Results file match those in the Events file for each Tag Id? Are values represented by a valid parameter code with the correct units? Are there any duplicate parameter codes for the same Tag Id? Are there any invalid symbols in the Greater Than/Less Than (GT/LT) field? Are there any Tag Ids in the Results file that are not in the Events file or vice versa?
Data Quality Review ✔, ✘, or N/A Are “less-than” values reported at the LOQ? If no, explain in Data Summary. Have the outliers been verified and a "1" placed in the Verify_flg field? Have checks on correctness of analysis or data reasonableness been performed?
e.g., Is ortho-phosphorus less than total phosphorus? Are dissolved metal concentrations less than or equal to total metals? Is the minimum 24 hour DO less than the maximum 24 hour DO? Do the values appear to be consistent with what is expected for site?
Have at least 10% of the data in the data set been reviewed against the field and laboratory data sheets?
Are all parameter codes in the data set listed in the QAPP? Are all stations in the data set listed in the QAPP? Documentation Review ✔, ✘, or N/A Are blank results acceptable as specified in the QAPP? Were control charts used to determine the acceptability of lab duplicates? Was documentation of any unusual occurrences that may affect water quality included in the Event file’s Comments field?
Were there any failures in sampling methods and/or deviations from sample design requirements that resulted in unreportable data? If yes, explain in Data Summary.
Were there any failures in field and/or laboratory measurement systems that were not resolvable and resulted in unreportable data? If yes, explain in Data Summary.
Was the laboratory’s NELAP Accreditation current for analysis conducted?
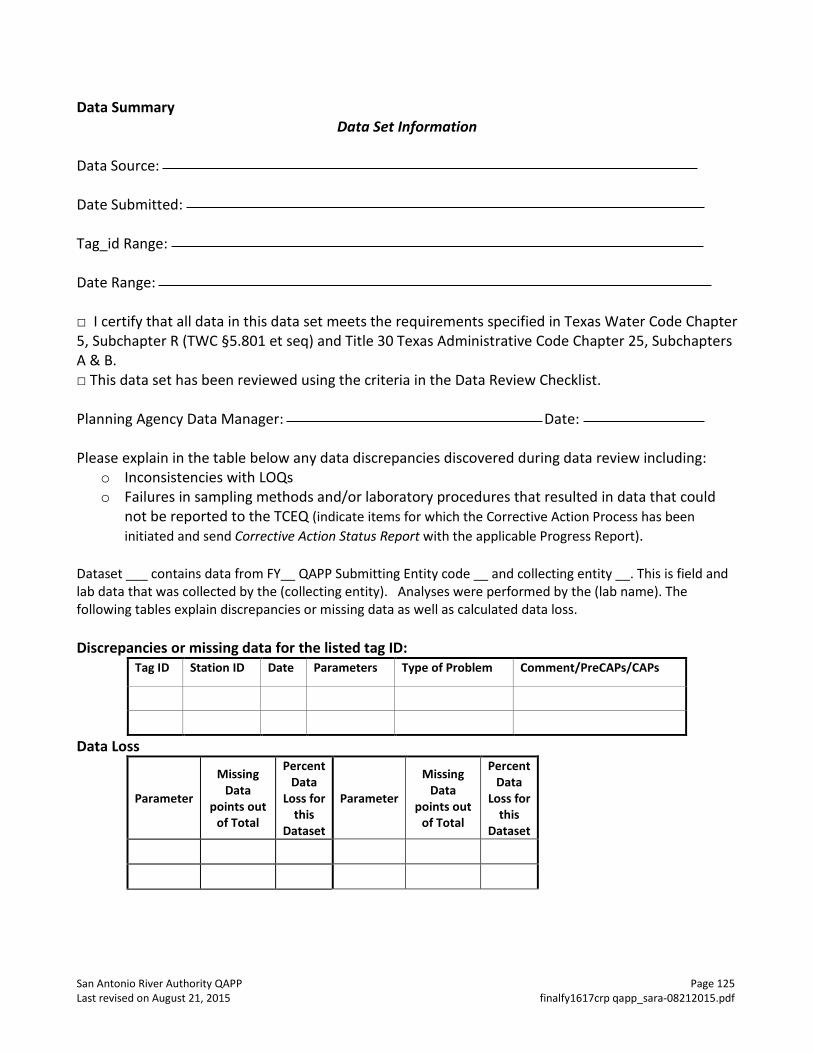
San Antonio River Authority QAPP Page 125 Last revised on August 21, 2015 finalfy1617crp qapp_sara-08212015.pdf
Data Summary Data Set Information
Data Source: Date Submitted: Tag_id Range: Date Range: □ I certify that all data in this data set meets the requirements specified in Texas Water Code Chapter 5, Subchapter R (TWC §5.801 et seq) and Title 30 Texas Administrative Code Chapter 25, Subchapters A & B. □ This data set has been reviewed using the criteria in the Data Review Checklist. Planning Agency Data Manager: Date: Please explain in the table below any data discrepancies discovered during data review including:
o Inconsistencies with LOQs o Failures in sampling methods and/or laboratory procedures that resulted in data that could
not be reported to the TCEQ (indicate items for which the Corrective Action Process has been initiated and send Corrective Action Status Report with the applicable Progress Report).
Dataset ___ contains data from FY__ QAPP Submitting Entity code __ and collecting entity __. This is field and lab data that was collected by the (collecting entity). Analyses were performed by the (lab name). The following tables explain discrepancies or missing data as well as calculated data loss.
Discrepancies or missing data for the listed tag ID:
Tag ID Station ID Date Parameters Type of Problem Comment/PreCAPs/CAPs
Data Loss
Parameter
Missing Data
points out of Total
Percent Data
Loss for this
Dataset
Parameter
Missing Data
points out of Total
Percent Data
Loss for this
Dataset