sediment conditions in the san antonio river basin .... department of the interior u.s. geological...
TRANSCRIPT

U.S. Department of the InteriorU.S. Geological Survey
Fact Sheet 2015–3043June 2015
Sediment Conditions in the San Antonio River Basin Downstream From San Antonio, Texas, 2000–13Introduction
Sediment plays an important role in the ecological health of rivers and estuaries and consequently is an important issue for water-resource managers. To better understand sediment characteristics in the San Antonio River Basin, the U.S. Geological Survey (USGS), in cooperation with the San Antonio River Authority (SARA), completed a two-part study in the San Antonio River Basin downstream from San Antonio, Texas (fig. 1), to (1) collect and analyze sediment data to characterize sediment conditions and (2) develop and calibrate a watershed model to simulate hydrologic conditions and suspended-sediment loads during 2000–12.
Sediment Data Collection and AnalysisDuring January 2011 through May 2013, the USGS
collected data on suspended sediment, bedload sediment, sediment particle-size distribution, and turbidity for a range of hydrologic conditions at selected sampling sites in the San Antonio River Basin. These data were combined with available historical (1966–2004) sediment data collected at the same
sampling sites for analysis. The results of the sampling and analysis are described in USGS Scientific Investigations Report 2014–5048 (Crow and others, 2014).
Hydrologic and Sediment ModelingUSGS streamflow and sediment data were used to help
calibrate a watershed model to simulate hydrologic conditions and suspended-sediment loads during 2000–12. The model was used to estimate sources of suspended-sediment loads and can be used to estimate suspended-sediment conditions at the outlet of any selected model segments in the study area. The model development, calibration, and simulation results are described in USGS Scientific Investigations Report 2014–5182 (Banta and Ockerman, 2014).
Sediment Data Collection Methods Sediment transport in streams generally can be categorized
as suspended-sediment transport (sediment transported within the water column) and bedload-sediment transport (sediment transported along the bottom of the streambed). During 2011–13, sediment samples were collected at 10 sites for the analysis of suspended-sediment concentration and particle-size distribution.
C
C
C
C
CC
C
CC
CC
08185000
08181800
08185065
08185100
08185500
08186000
08186500
08188500
08188570
08183200
08183500
97°00'
97°30'
98°00'29°30'
29°00'
28°30'
BEE COUNTY
LIVE OAK
COUNTY
BEXAR COUNTY
ATASCOSA COUNTY
VIC
TO
RIA
C
OU
NT
Y
DEWITT
COUNTYWILSON COUNTY
KARNES COUNTY
GONZALES
COUNTY
GUADALUPE COUNTY
COMAL
COUNTY
GOLIAD
COUNTY
REFUGIO
COUNTY
Poth
Falls City
Floresville
SutherlandSprings
Stockdale
Nixon
Cibolo
SanAntonio
Goliad
McFaddin
Kenedy
RungeKarnes
City
Yorktown
Saint Hedwig
Elmendorf
Selma
La Vernia
Manahuilla
Ecleto Creek
San Antonio
Martinez
Calaveras Lake
Guadalupe R iver
Medina
Cibolo Creek
San AntonioRiver
CabezaCreek
River
GuadalupeBay
Hynes Bay San AntonioBay
Cibolo Creek
San Antonio River
San Antonio River
Creek
Creek
Rive r
EXPLANATION
Study areaU.S. Geological Survey streamflow-gaging station and station number
C 08181800
Base modified from U.S. Geological Survey 1:100,000-scale digital dataUniversal Transverse Mercator, zone 14North American Datum of 1983
Modified from Banta and Ockerman, 2014
0 10 15 20 MILES5
0 10 15 20 KILOMETERS5
T E X A S
San AntonioRiver Basin GULF OF
MEXICO
Study area
Figure 1. The study area, the San Antonio River Basin downstream from San Antonio, Texas, consists of 2,150 square miles and encompasses parts of Bexar, Comal, Guadalupe, Wilson, Karnes, DeWitt, Goliad, Victoria, and Refugio Counties. In addition to the San Antonio River, major streams in the study area include Cibolo and Ecleto Creeks. The San Antonio River in the study area extends about 190 river miles (mi) from Elmendorf, Tex., to the downstream boundary. From the upstream boundary of the study area near Selma, Tex., Cibolo Creek extends about 75 river mi downstream to its confluence with the San Antonio River in Karnes County. Ecleto Creek extends about 55 river mi from northern Wilson County to its confluence with the San Antonio River in Karnes County.
ISSN 2327-6916 (print) ISSN 2327-6932 (online)http://dx.doi.org/10.3133/fs20153043

In addition, samples of bedload sediment were collected at six sites for the analysis of bedload mass and particle-size distribution (Crow and others, 2014). Figures 2, 3, and 4 show sediment samplers used in the study. A combination of 67 suspended-sediment samples and 22 bedload-sediment samples were collected over a variety of hydrologic conditions with stream discharge rates ranging from 1.9 to 10,600 cubic feet per second. Collecting stream discharge data at the same time as suspended-sediment concentration data allowed for calculations of suspended-sediment discharge, or load, in tons per day. The suspended-sediment samples were collected by following standard USGS methods (Edwards and Glysson, 1999).
Sediment Load CharacterizationResults from the data that were collected indicated that
bedload sediment is a small percentage of total sediment load because most of the sediment in the study area is fine-grain material (silt and clay-size particles) that tends to remain in suspension. For example, at the sampling site at the San Antonio River near Elmendorf, Tex. (station 08181800, fig. 1), bedload sediment accounted for only about 0.2 percent of the total sediment (by weight) in the samples collected during 2011–12.
Figure 2. At each sampling site, suspended-sediment samples were collected at a minimum of 10 equal-width increments across the stream by using samplers designed to allow water to enter the sampler with no change in velocity or direction, a method referred to as “isokinetic sampling.” When stream depths were shallow enough to be waded, samples were collected by using a US DH–81 1-liter bottle sampler (Davis, 2005) attached to a wading rod.
Figure 3. When stream depths were too deep to be waded, suspended-sediment samples were collected from a bridge or a boat by using a US DH–2 1-liter collapsible bag sampler (Davis, 2005) attached to a reel and crane system.
One of the goals of collecting the suspended-sediment data was to characterize suspended-sediment concentrations and loads for a range of streamflow conditions at selected locations in the study area. Suspended-sediment loads estimated from regression equations that relate measured suspended-sediment concentrations to daily streamflow provided a means to estimate continuous (daily) values of suspended-sediment loads at selected locations in the study area. All available data (historical and 2011–12 data) were included in the regression analyses (fig. 5). For five sampling locations where sufficient suspended-sediment sample data were available to develop these relations (San Antonio River near Elmendorf, Tex.; San Antonio River near Falls City, Tex.; Cibolo Creek near Falls City, Tex.; Ecleto Creek near Runge, Tex.; and San Antonio River
Figure 4. Bedload-sediment samples were collected with a sampler such as the BL–84 (Davis, 2005), which is designed to collect bedload sediment as it rests on the streambed. Bedload samplers were deployed by a wading rod, a bridge crane, or a boat-deployed reel.
Streamflow, in cubic feet per second1 10 100 1,000 10,000 100,000
1
10
100
1,000
10,000
100,000
Susp
ende
d-se
dim
ent c
once
ntra
tion,
in m
illig
ram
s pe
r lite
r
R2 = 0.42SSC = 0.46 x Q0.949
EXPLANATIONRelation between suspended-sediment concentration (SSC) and streamflow (Q)—Dotted where suspended sediment no longer increases with increasing streamflow1974–94 historical sample data2011–12 sample dataCoefficient of determination for the log-transformed regression equation, where suspended sediment increases with increasing streamflow
R2
Figure 5. Relation between suspended-sediment concentration and streamflow at U.S. Geological Survey streamflow-gaging station at the San Antonio River at Goliad, Texas (modified from Crow and others, 2014, fig. 5E).
at Goliad, Tex.), daily time series of suspended-sediment loads were estimated to compare with model-simulated loads at the same locations. Crow and others (2014) and Banta and Ockerman (2014) give additional information on the development of the regression equations and use of the equations and estimated time-series data for model calibration.
Simulation Modeling ApproachHydrologic conditions (streamflow, evapotranspiration, and
groundwater recharge) and suspended-sediment concentrations and loads were simulated by using the Hydrological Simulation Program—FORTRAN (HSPF) model (Bicknell and others, 2001). The HSPF model is one of the most comprehensive watershed modeling programs because it can simulate a variety of stream and watershed conditions with reasonable accuracy and enables flexibility in adjusting the model to simulate alternative conditions or scenarios (Donigian and others, 1995). The HSPF model provides time-series data simulating water movement (runoff from land surfaces, infiltration of water through soil layers, flow in stream channels) and sediment concentrations and loads associated with the water movement at any selected location in the watershed. Time-series outputs (figs. 6 and 7) from HSPF
Year
2006 2007 2008 2009 2010 2011 2012 201310
100
1,000
10,000
100,000
Daily
mea
n st
ream
flow
,in
cub
ic fe
et p
er s
econ
d
MeasuredSimulated
EXPLANATION
Figure 6. Measured and simulated daily mean streamflow at U.S. Geological Survey streamflow-gaging station at the San Antonio River at Goliad, Texas, 2006–12 (modified from Banta and Ockerman, 2014, fig. 12A).
Year2006 2007 2008 2009 2010 2011 2012 20131
10
100
1,000
10,000
100,000
1,000,000
Daily
mea
n su
spen
ded-
sedi
men
t loa
d,in
tons
per
day
EstimatedSimulated
EXPLANATION
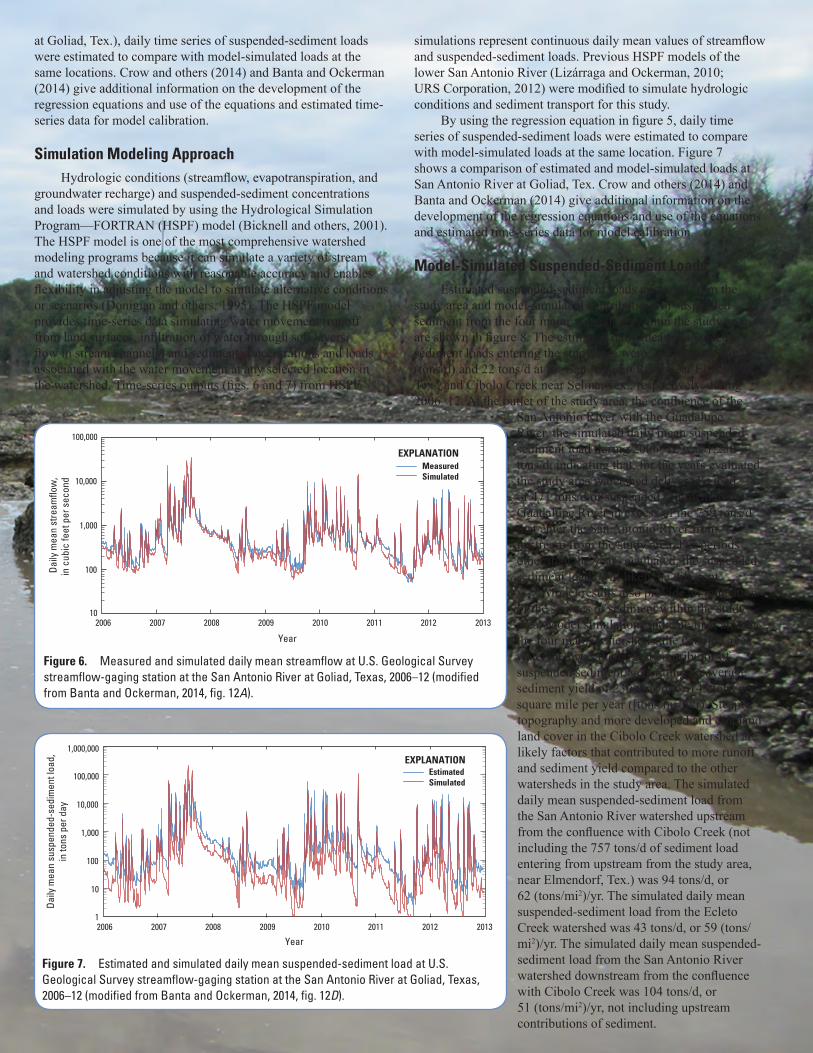
Figure 7. Estimated and simulated daily mean suspended-sediment load at U.S. Geological Survey streamflow-gaging station at the San Antonio River at Goliad, Texas, 2006–12 (modified from Banta and Ockerman, 2014, fig. 12D).
simulations represent continuous daily mean values of streamflow and suspended-sediment loads. Previous HSPF models of the lower San Antonio River (Lizárraga and Ockerman, 2010; URS Corporation, 2012) were modified to simulate hydrologic conditions and sediment transport for this study.
By using the regression equation in figure 5, daily time series of suspended-sediment loads were estimated to compare with model-simulated loads at the same location. Figure 7 shows a comparison of estimated and model-simulated loads at San Antonio River at Goliad, Tex. Crow and others (2014) and Banta and Ockerman (2014) give additional information on the development of the regression equations and use of the equations and estimated time-series data for model calibration.
Model-Simulated Suspended-Sediment Loads Estimated suspended-sediment loads upstream from the
study area and model-simulated contributions of suspended sediment from the four major watersheds within the study area are shown in figure 8. The estimated daily mean suspended-sediment loads entering the study area were 737 tons per day (tons/d) and 22 tons/d at the San Antonio River near Elmendorf, Tex., and Cibolo Creek near Selma, Tex., respectively, during 2006–12. At the outlet of the study area, the confluence of the
San Antonio River with the Guadalupe River, the simulated daily mean suspended-sediment load during 2006–12 was 1,230 tons/d, indicating that, for the years evaluated, the study area watershed delivered a load of 471 tons/d of suspended sediment to the Guadalupe River in excess of the 759 tons/d that enter the San Antonio River from upstream from the study area. For periods other than the years evaluated, the suspended-sediment loads will likely be different.
Model results also provide an indication of the sources of sediment within the study area. Model simulations indicate that, among the four major watersheds, the Cibolo Creek watershed was the largest contributor of suspended sediment, generating an average sediment yield of 230 tons/d, or 145 tons per square mile per year ([tons/mi2]/yr). Steeper topography and more developed and cropland land cover in the Cibolo Creek watershed are likely factors that contributed to more runoff and sediment yield compared to the other watersheds in the study area. The simulated daily mean suspended-sediment load from the San Antonio River watershed upstream from the confluence with Cibolo Creek (not including the 757 tons/d of sediment load entering from upstream from the study area, near Elmendorf, Tex.) was 94 tons/d, or 62 (tons/mi2)/yr. The simulated daily mean suspended-sediment load from the Ecleto Creek watershed was 43 tons/d, or 59 (tons/mi2)/yr. The simulated daily mean suspended-sediment load from the San Antonio River watershed downstream from the confluence with Cibolo Creek was 104 tons/d, or 51 (tons/mi2)/yr, not including upstream contributions of sediment.

C
C
C
C
CC
C
CC
CC
08185000
08181800
08185065
08185100
08185500
08186000
08186500
08188500
08188570
08183200
08183500
97°00'
97°30'
98°00'29°30'
29°00'
28°30'
BEE COUNTY
LIVE OAK
COUNTY
BEXAR COUNTY
ATASCOSA COUNTY
VIC
TO
RIA
C
OU
NT
Y
DEWITT
COUNTYWILSON COUNTY
KARNES COUNTY
GONZALES
COUNTY
GUADALUPE COUNTY
COMAL
COUNTY
GOLIAD
COUNTY
REFUGIO
COUNTY
Poth
Falls City
Floresville
SutherlandSprings
Stockdale
Nixon
Cibolo
SanAntonio
Goliad
McFaddin
Kenedy
RungeKarnes
City
Yorktown
Saint Hedwig
Elmendorf
Selma
Manahuilla
Ecleto Creek
San Antonio
Martinez
Calaveras Lake
Guadalupe R iver
Medina
Cibolo Creek
San AntonioRiver
CabezaCreek
River
GuadalupeBay
Hynes Bay San AntonioBay
Cibolo Creek
San Antonio River
San Antonio River
Creek
Creek
Rive r
EXPLANATION
Model watershed of San Antonio River Basin downstream from San Antonio, Texas San Antonio River upstream from Cibolo Creek Cibolo Creek Ecleto Creek San Antonio River downstream from Cibolo CreekSuspended-sediment load entering or exiting the study areaStudy area boundaryU.S. Geological Survey streamflow-gaging station and station number
C08181800
Base modified from U.S. Geological Survey 1:100,000-scale digital dataUniversal Transverse Mercator, zone 14North American Datum of 1983
Modified from Banta and Ockerman, 2014
0 10 15 20 MILES5
0 10 15 20 KILOMETERS5
Estimated suspended sedimententering study area from
upstream at Cibolo Creek atSelma, Texas, 22 tons per day
Estimated suspended sedimententering study area from
upstream at San Antonio Rivernear Elmendorf, Texas,
737 tons per day
Simulated suspended sediment generatedin San Antonio River watershed upstream
from Cibolo Creek, 94 tons per day,or 62 tons per square mile per year
Simulated suspended sediment generatedin San Antonio River watershed downstream
from Cibolo Creek, 104 tons per day,or 51 tons per square mile per year
Simulated suspended sediment generatedin Cibolo Creek watershed, 230 tons per day,
or 145 tons per square mile per year
Simulated suspended sediment generatedin Ecleto Creek watershed, 43 tons per day,
or 59 tons per square mile per year
Estimated suspended sediment exitingSan Antonio River at confluence withGuadalupe River, 1,230 tons per day
Figure 8. Average daily suspended-sediment loads entering, exiting, and generated within the San Antonio River Basin downstream from San Antonio, Texas, 2006–12.
References
Banta, J.R., and Ockerman, D.J., 2014, Simulation of hydrologic conditions and suspended-sediment loads in the San Antonio River Basin downstream from San Antonio, Texas, 2000–12: U.S. Geological Survey Scientific Investigations Report 2014–5182, 46 p., accessed May 18, 2015, at http://dx.doi.org/10.3133/sir20145182.
Bicknell, B.R., Imhoff, J.C., Kittle, J.L., Jr., Donigian, A.S., and Johanson, R.C., 2001, Hydrological Simulation Program—FORTRAN, user’s manual for version 12: Research Triangle Park, N.C., U.S. Environmental Protection Agency, National Exposure Research Laboratory, Office of Research and Development, 843 p.
Crow, C.L., Banta, J.R., and Opsahl, S.P., 2014, Sediment characteristics in the San Antonio River Basin downstream from San Antonio, Texas, and at a site on the Guadalupe River downstream from the San Antonio River Basin, 1966–2013: U.S. Geological Survey Scientific Investigations Report 2014–5048, 33 p., accessed May 18, 2015, at http://dx.doi.org/10.3133/sir20145048.
Davis, B.E., 2005, A guide to the proper selection and use of federally approved sediment and water-quality samplers: Vicksburg, Miss., U.S. Geological Survey Open File Report 2005–1087, 20 p.
Donigian, A.S., Jr., Bicknell, B.R., and Imhoff, J.C., 1995, Hydrological Simulation Program—FORTRAN (HSPF), in Singh, V.P., ed., Computer models of watershed hydrology: Highlands Ranch, Colo., Water Resources Publications, p. 395–442.
Edwards, T.K., and Glysson, G.D., 1999, Field methods for measurement of fluvial sediment: U.S. Geological Survey Techniques of Water-Resource Investigations, book 3, chap. C2 (rev.), 89 p. [Also available at http://pubs.usgs.gov/twri/twri3-c2/.]
Lizárraga, J.S., and Ockerman, D.J., 2010, Simulation of streamflow, evapotranspiration, and groundwater recharge in the lower San Antonio River watershed, south-central Texas, 2000–2007: U.S. Geological Survey Scientific Investigations Report 2010–5027, 41 p.
URS Corporation, 2012, Lower San Antonio River watershed HSPF model calibration: URS Corporation, 54 p.
—Darwin J. Ockerman, J. Ryan Banta, Cassi L. Crow, and Stephen P. Opsahl
For additional information contact:
Director, Texas Water Science Center U.S. Geological Survey 1505 Ferguson Lane Austin, Texas 78754–4501 http://tx.usgs.gov/
Publishing support provided byLafayette Publishing Service Center