pv - a disruptive technology
TRANSCRIPT
How renewables will change electricity markets
IEA PVPS Workshop @ EUPVSEC 2012
“Assigning a fair price to photovoltaic electricity “
Frankfurt, Thursday, September 27, 2012
AN UNPRECEDENTED CHALLENGE FOR THE ELECTRICITY SYSTEM
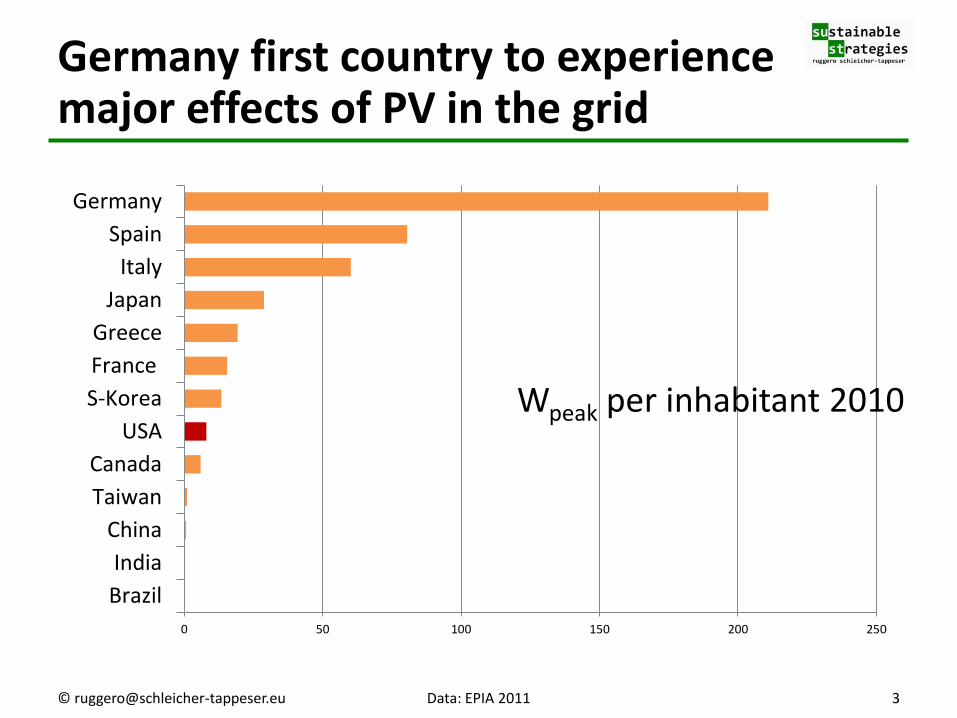
Germany first country to experience major effects of PV in the grid
0 50 100 150 200 250
Brazil
India
China
Taiwan
Canada
USA
S-Korea
France
Greece
Japan
Italy
Spain
Germany
Wpeak per inhabitant 2010
© [email protected] 3 Data: EPIA 2011
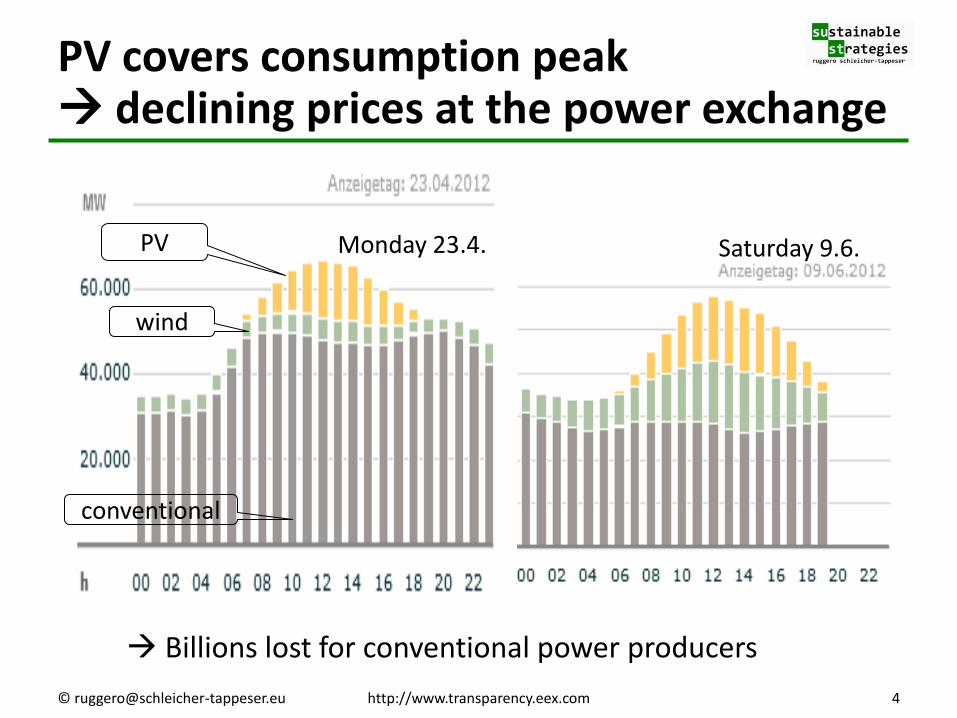
PV covers consumption peak declining prices at the power exchange
PV
wind
conventional
Monday 23.4. Saturday 9.6.
© [email protected] 4 http://www.transparency.eex.com
Billions lost for conventional power producers

1. Fluctuating power generation: Power generation directly depends on changing natural input
Forecasting production is a challenge
Flexible compensation needed
2. No marginal costs: Wind and solar power need no fuel
Dispatch priority
3. Distributed generation: Photovoltaics and onshore wind: essentially distributed
“Distribution” grid changes role
Captive power generation: Prosumers emerge as new actors
The three key challenges of solar and wind power
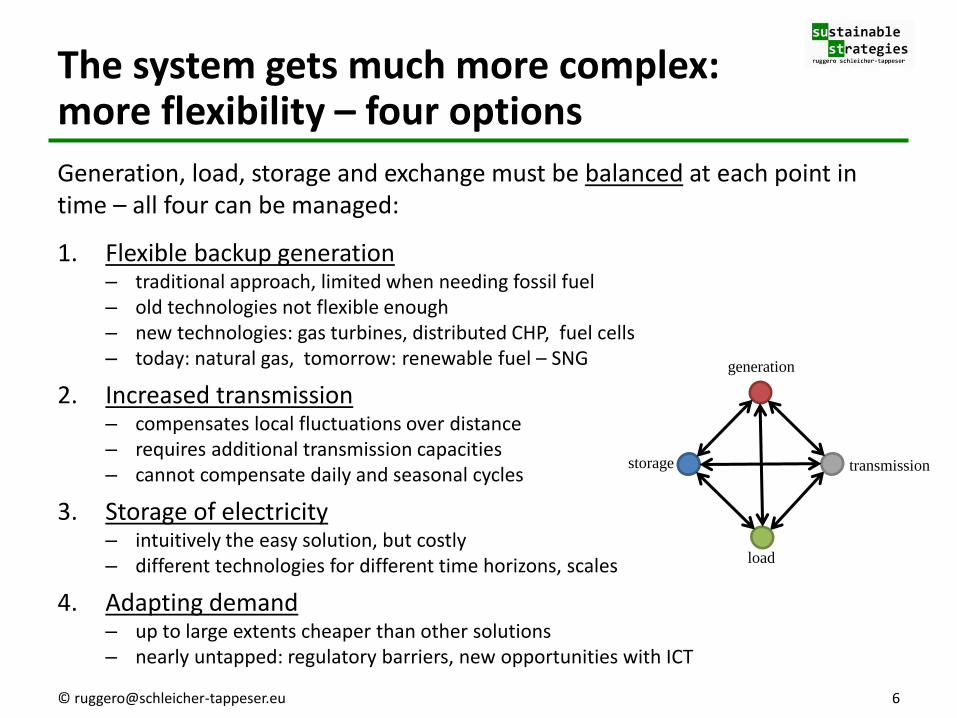
Generation, load, storage and exchange must be balanced at each point in time – all four can be managed:
1. Flexible backup generation – traditional approach, limited when needing fossil fuel – old technologies not flexible enough – new technologies: gas turbines, distributed CHP, fuel cells – today: natural gas, tomorrow: renewable fuel – SNG
2. Increased transmission – compensates local fluctuations over distance – requires additional transmission capacities – cannot compensate daily and seasonal cycles
3. Storage of electricity – intuitively the easy solution, but costly – different technologies for different time horizons, scales
4. Adapting demand – up to large extents cheaper than other solutions – nearly untapped: regulatory barriers, new opportunities with ICT
The system gets much more complex: more flexibility – four options
generation
load
storage transmission
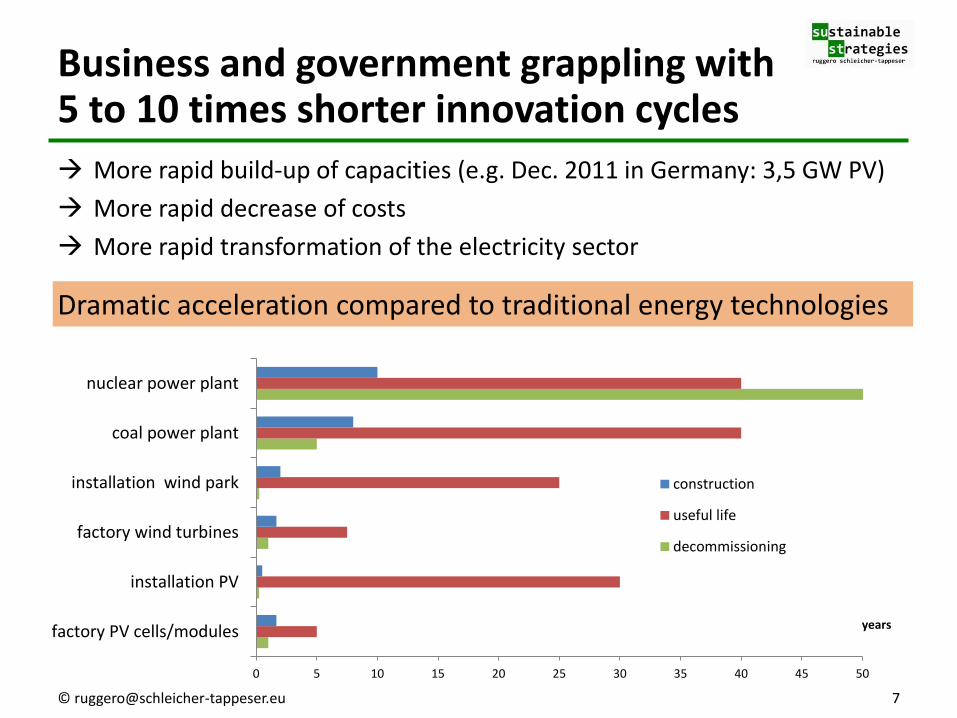
0 5 10 15 20 25 30 35 40 45 50
factory PV cells/modules
installation PV
factory wind turbines
installation wind park
coal power plant
nuclear power plant
years
construction
useful life
decommissioning
Business and government grappling with 5 to 10 times shorter innovation cycles
More rapid build-up of capacities (e.g. Dec. 2011 in Germany: 3,5 GW PV)
More rapid decrease of costs
More rapid transformation of the electricity sector
Dramatic acceleration compared to traditional energy technologies
PHOTOVOLTAICS – A DISRUPTIVE TECHNOLOGY

PV is a Semiconductor technology: Direct transformation of sunlight into electricity
sunlight
several layers of semiconductors variety of different technologies: • crystalline silicon c-Si (ingot-wafer) • thin-film technologies • organic … • ….
DC direct current inverter AC alternate current
_ +
~
• no moving parts • no maintenance • no fuel • high cost reduction
potential
semiconductors
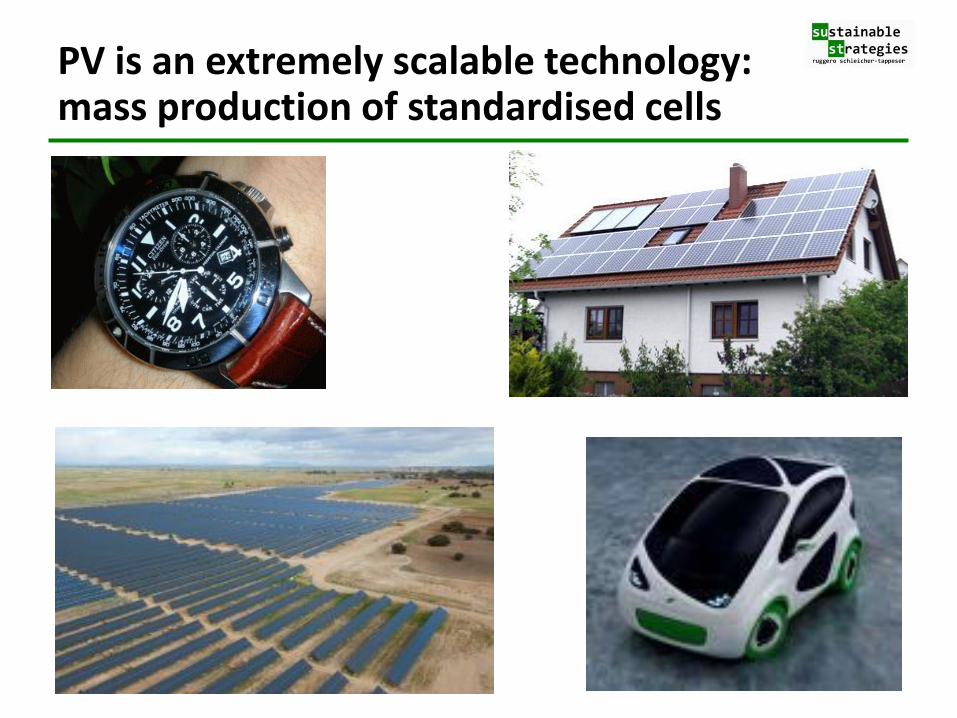
PV is an extremely scalable technology: mass production of standardised cells
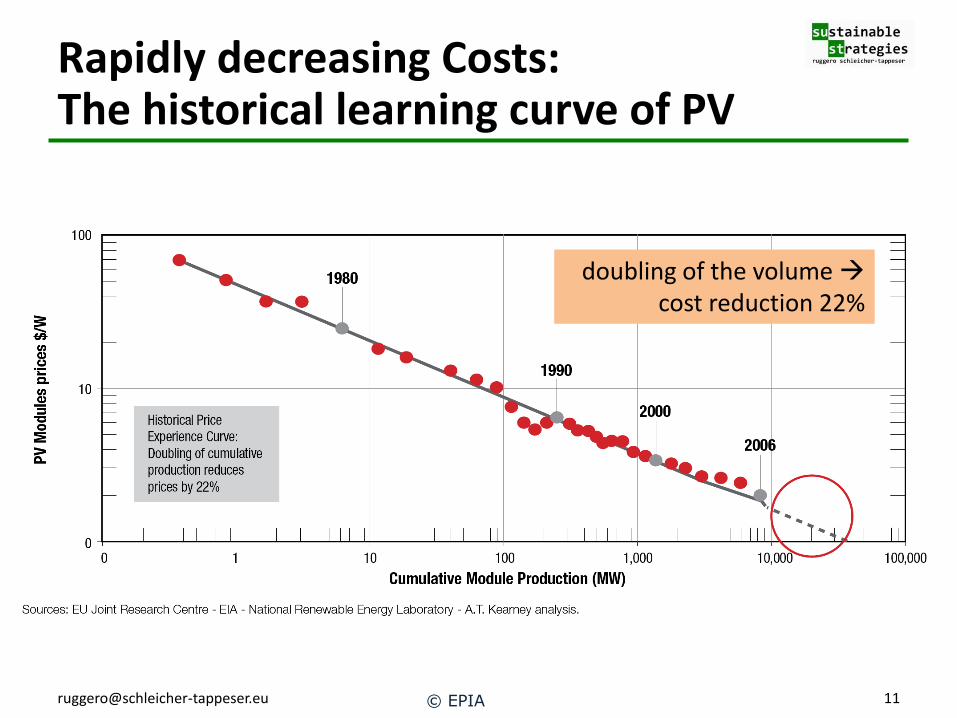
Rapidly decreasing Costs: The historical learning curve of PV
© EPIA
doubling of the volume cost reduction 22%

Innovations in PV development: large variety guarantees further cost reductions
Carrying materials, module design Concentrators, tracker systems BIPV: integration in buildings, construction elements in appliances, in vehicles Free space, traffic areas, roofing
Cells
electrical integration
mechanical integration
Storage technologies (stationary, mobile, off-grid, grid)
Intelligent inverters System design Hybrid systems, mini-grids Grid concepts, grid steering Regulation, markets
Silicon, improvement c-Si cells Thin film:
Si, CIGS, CdS, …
Multi-junction, concentrator cells Organic cells Dye sensitised cells …
Higher efficiency Lower production costs New application fields INTEGRATION
© [email protected] 12

Heavy PV module price drop since 2010: - 45% in 12 months
-23% -32% -19%
Chinese
Japanese
European
Crystalline modules
Chinese modules
EUR
[email protected] © sologico 13
The Causes: • New scale of efficient production • Overcapacities worldwide • Determined strategy of Chinese manufacturers
The Consequences: • Solar PV power starts being competitive • European and American manufacturers struggle
with serious difficulties
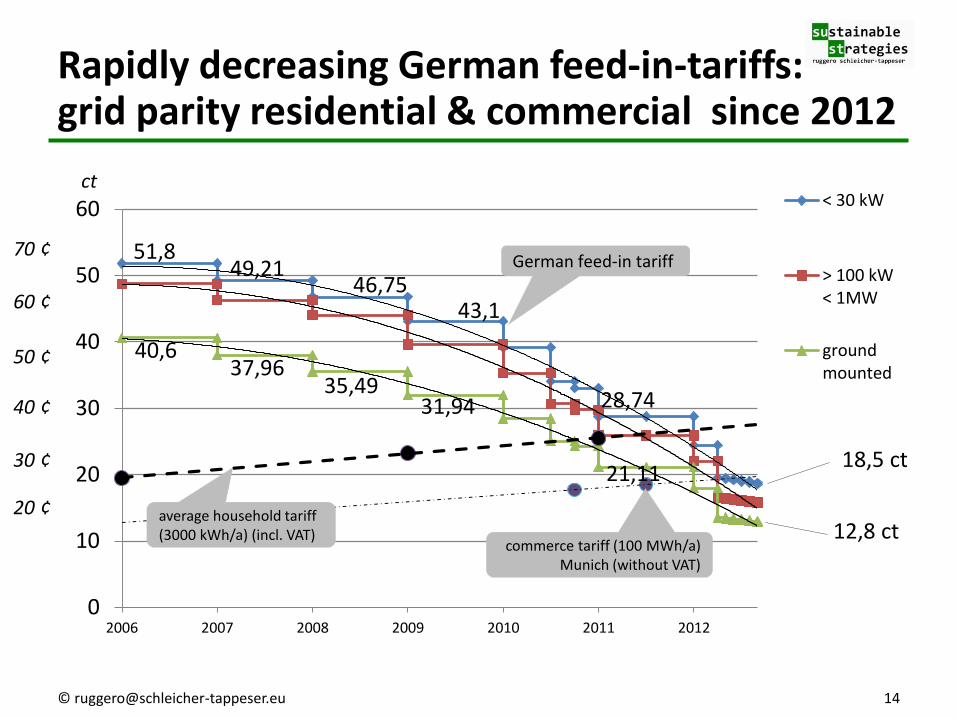
Rapidly decreasing German feed-in-tariffs: grid parity residential & commercial since 2012
14
51,8 49,21
46,75 43,1
28,74
40,6 37,96
35,49 31,94
21,11
0
10
20
30
40
50
60
2006 2007 2008 2009 2010 2011 2012
< 30 kW
> 100 kW< 1MW
groundmounted
German feed-in tariff 70 ¢
60 ¢
50 ¢
40 ¢
30 ¢
20 ¢
ct
average household tariff (3000 kWh/a) (incl. VAT)
commerce tariff (100 MWh/a) Munich (without VAT)
18,5 ct
12,8 ct

CAPTIVE POWER GENERATION CHANGES THE GAME
15
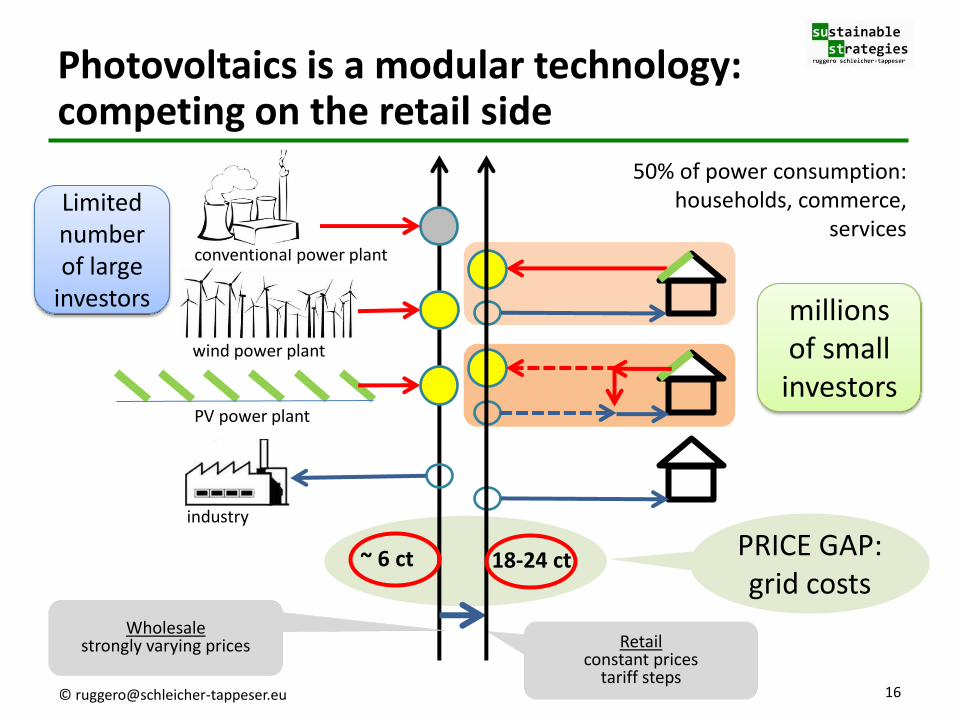
Photovoltaics is a modular technology: competing on the retail side
16 © [email protected]
conventional power plant
PV power plant
~ 6 ct
Wholesale strongly varying prices
wind power plant
industry
Retail constant prices
tariff steps
18-24 ct
50% of power consumption: households, commerce,
services Limited number of large
investors millions of small investors
PRICE GAP: grid costs
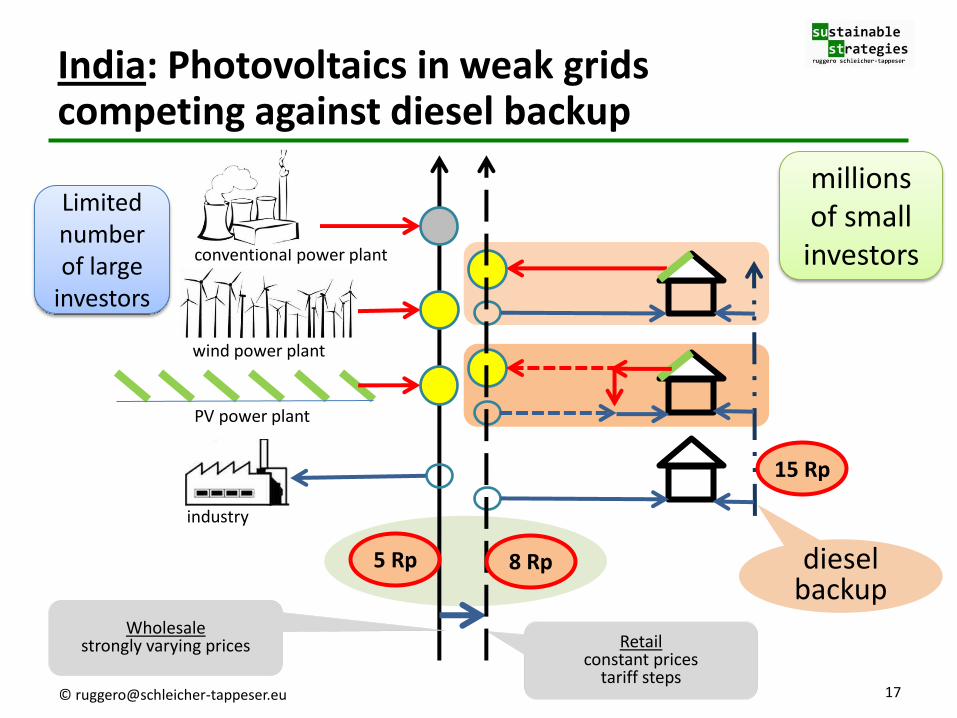
India: Photovoltaics in weak grids competing against diesel backup
17 © [email protected]
conventional power plant
PV power plant
Wholesale strongly varying prices
5 Rp
wind power plant
industry
Retail constant prices
tariff steps
Limited number of large
investors
millions of small investors
diesel backup
8 Rp
15 Rp

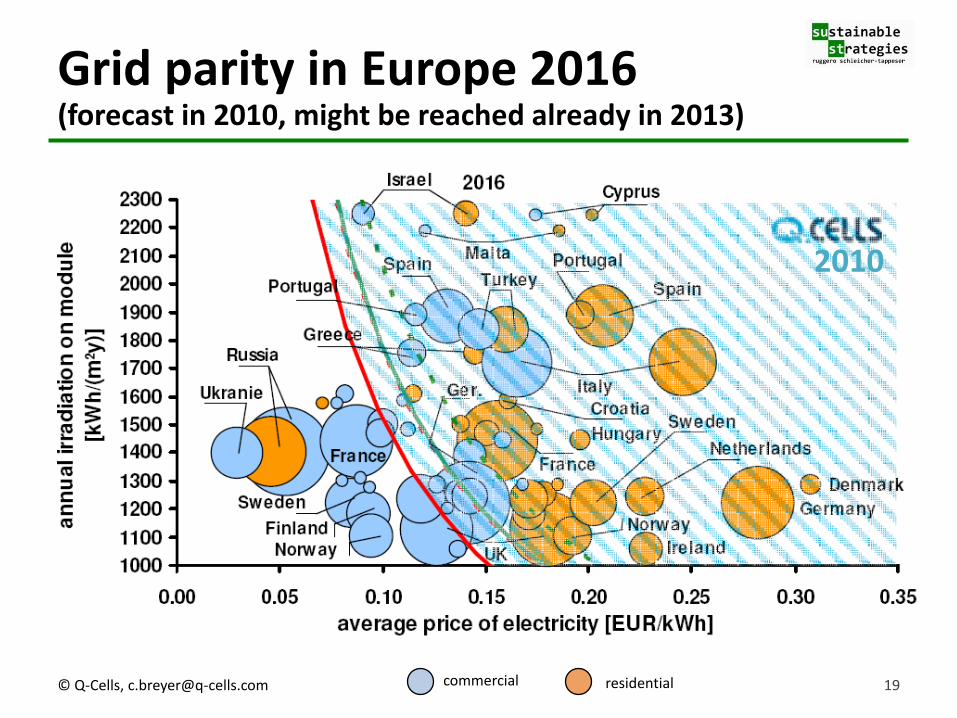
Grid parity in Europe 2016 (forecast in 2010, might be reached already in 2013)
commercial residential
2010
© Q-Cells, [email protected] 19
-
5
10
15
20
25
30
2012 2013 2014 2015 2016
grid house(incl. VAT)
grid trade(excl. VAT)
PV house
PV trade
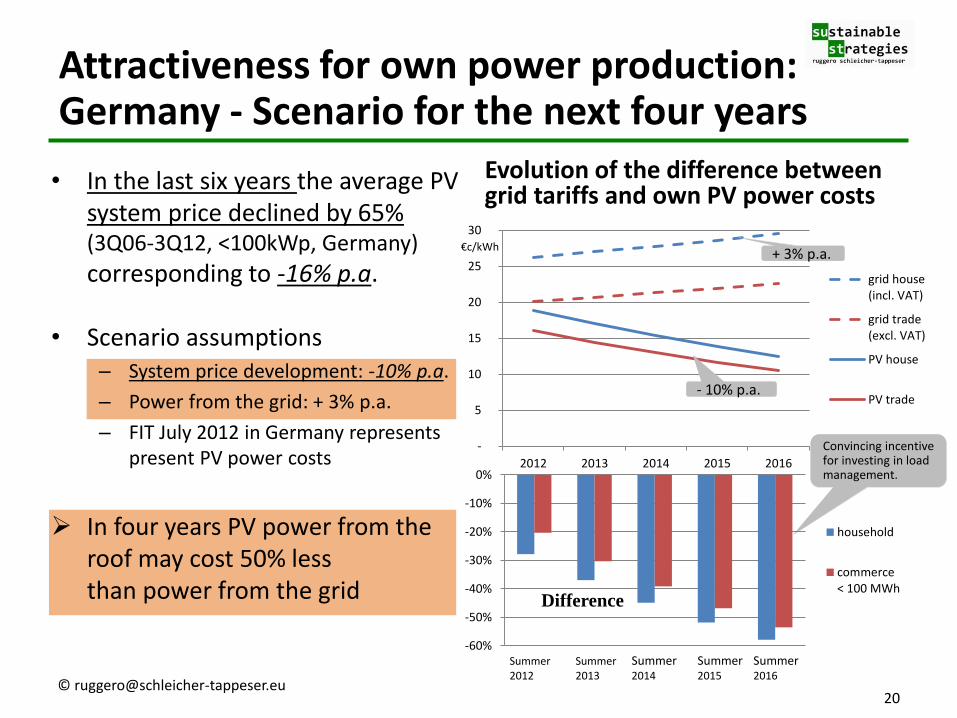
• In the last six years the average PV system price declined by 65% (3Q06-3Q12, <100kWp, Germany)
corresponding to -16% p.a.
• Scenario assumptions – System price development: -10% p.a.
– Power from the grid: + 3% p.a.
– FIT July 2012 in Germany represents present PV power costs
In four years PV power from the roof may cost 50% less than power from the grid
Attractiveness for own power production: Germany - Scenario for the next four years
Evolution of the difference between grid tariffs and own PV power costs
+ 3% p.a.
- 10% p.a.
€c/kWh
Difference
Convincing incentive for investing in load management.
20
-60%
-50%
-40%
-30%
-20%
-10%
0%
household
commerce< 100 MWh
Summer Summer Summer Summer Summer 2012 2013 2014 2015 2016

2%
8%
25%
13% 21%
31%
Image: Geosol
data: BNetzA 2010
Germany: The lions share of the installed capacity is on roofs
< 5 kW
5 – 10 kW
10 – 40 kW
40 – 100 kW 100 kW – 1 MW
> 1 MW Installations 2011
New installed capacity 2011: 48% < 100 kW
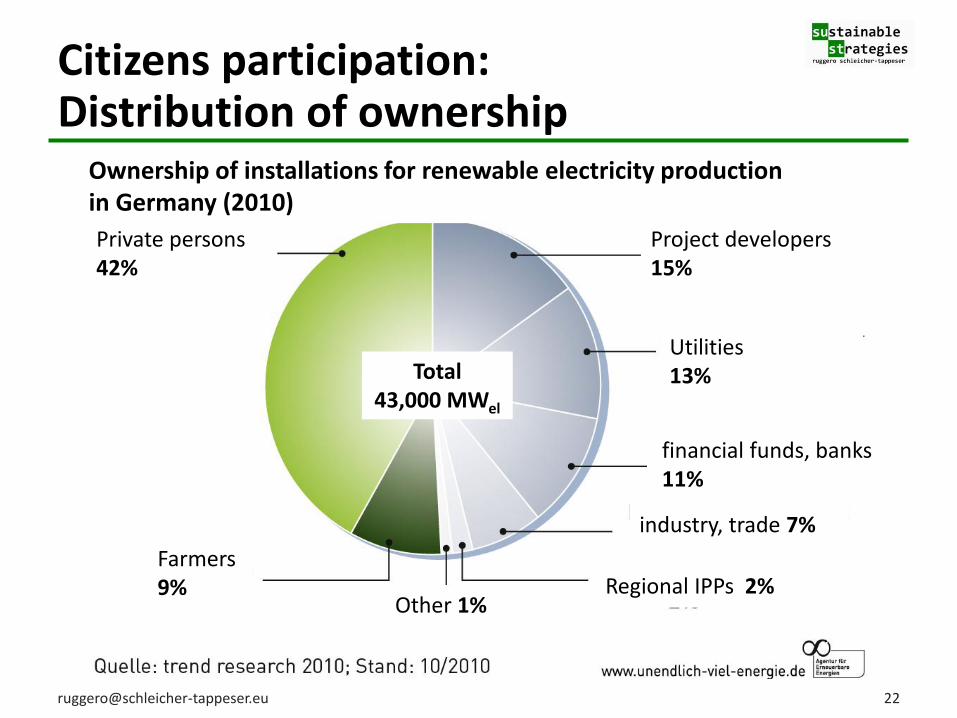
Citizens participation: Distribution of ownership
Ownership of installations for renewable electricity production in Germany (2010)
Private persons 42%
Project developers 15%
Utilities 13%
financial funds, banks 11%
industry, trade 7%
Regional IPPs 2% Farmers 9%
Other 1%
Total 43,000 MWel
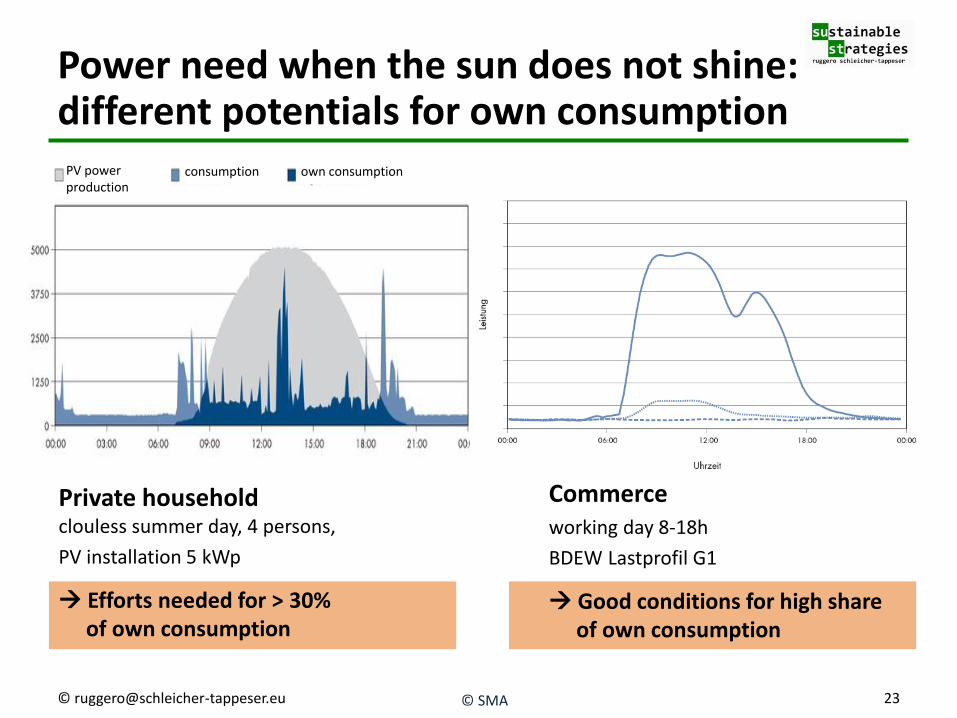
Power need when the sun does not shine: different potentials for own consumption
Private household clouless summer day, 4 persons,
PV installation 5 kWp
Efforts needed for > 30% of own consumption
Commerce working day 8-18h
BDEW Lastprofil G1
Good conditions for high share of own consumption
PV power production
consumption own consumption
© SMA © [email protected] 23
THE EMERGENCE OF BOTTOM-UP FLEXIBILITY
24
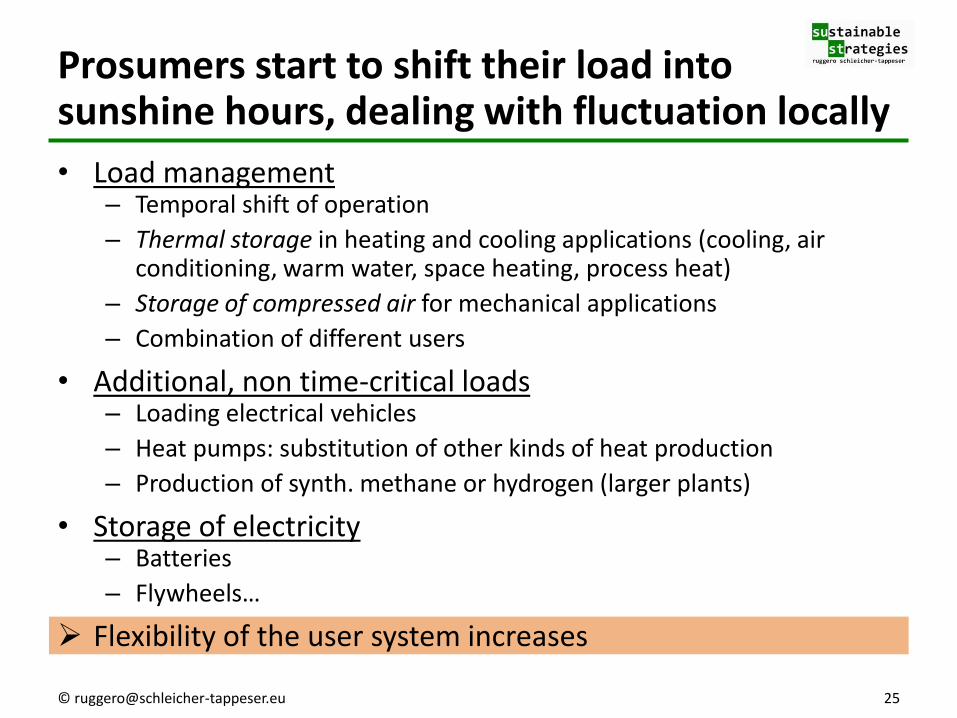
Prosumers start to shift their load into sunshine hours, dealing with fluctuation locally
• Load management – Temporal shift of operation
– Thermal storage in heating and cooling applications (cooling, air conditioning, warm water, space heating, process heat)
– Storage of compressed air for mechanical applications
– Combination of different users
• Additional, non time-critical loads – Loading electrical vehicles
– Heat pumps: substitution of other kinds of heat production
– Production of synth. methane or hydrogen (larger plants)
• Storage of electricity – Batteries
– Flywheels…
Flexibility of the user system increases
© [email protected] 25

Prosumer
Utility
Creating flexibility at the bottom of the system lower costs, higher efficiency
Electricity production
Electricity delivered
Transfor-mation
losses
heat
light
compr. air
ICT
heat
mech. drive
production sale storage by user
energy use
© [email protected] 26
Conventional system
Prosumer
Utility
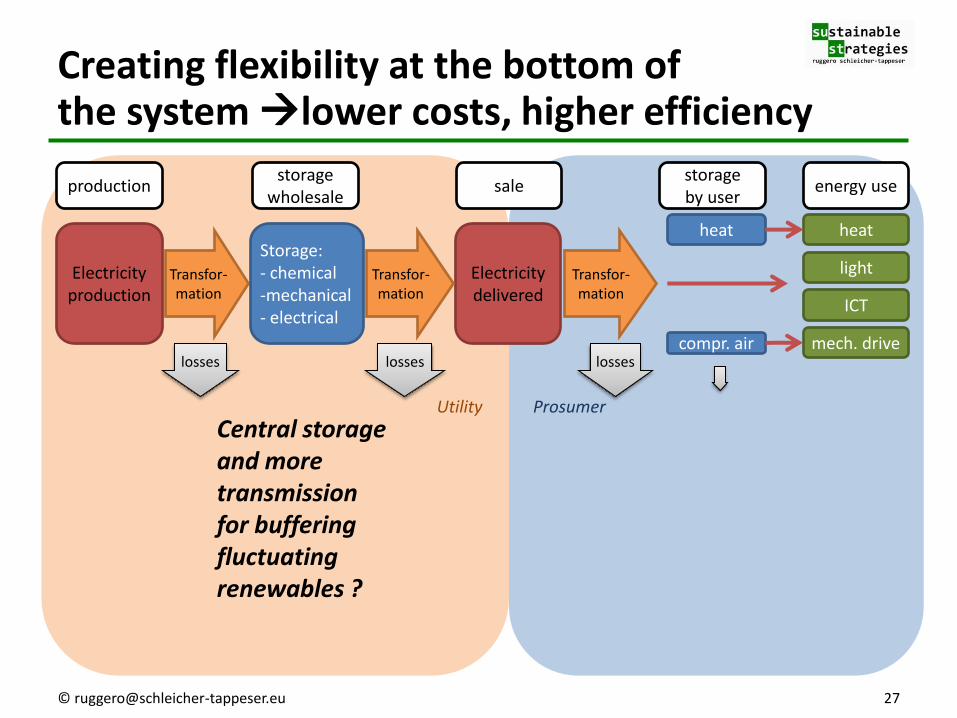
Creating flexibility at the bottom of the system lower costs, higher efficiency
Electricity production
Transfor-mation
losses
Storage: - chemical -mechanical - electrical
Electricity delivered
Transfor-mation
losses
Transfor-mation
losses
heat
light
compr. air
ICT
heat
mech. drive
production storage
wholesale sale
storage by user
energy use
© [email protected] 27
Central storage and more transmission for buffering fluctuating renewables ?
Prosumer
Utility
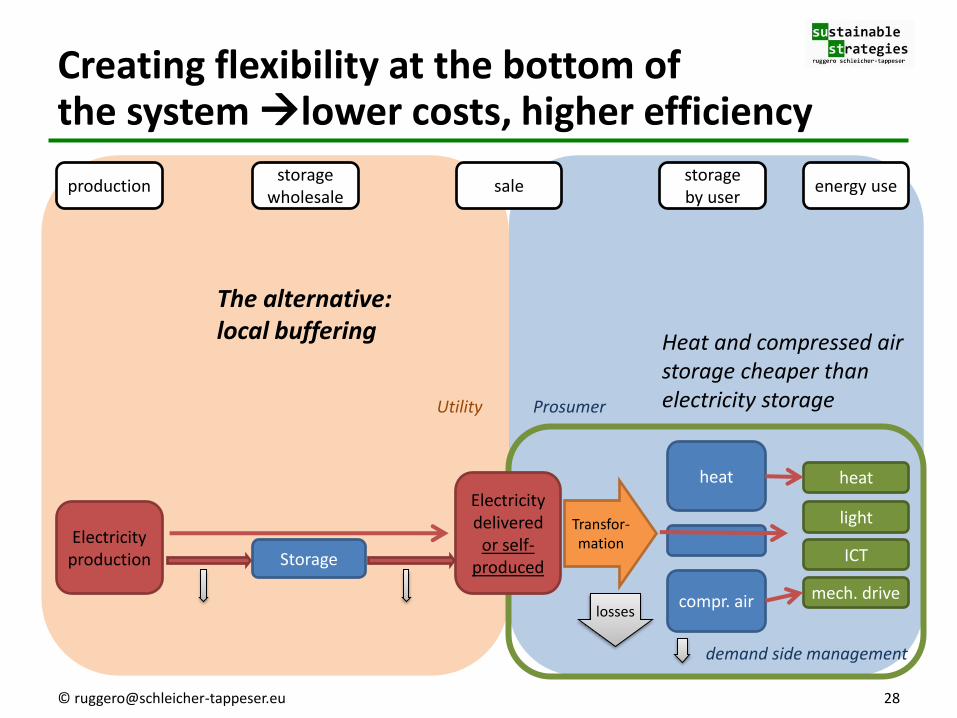
Creating flexibility at the bottom of the system lower costs, higher efficiency
Electricity production
Transfor-mation
losses
heat
light
compr. air
ICT
heat
mech. drive
Storage
demand side management
Electricity delivered
or self-produced
© [email protected] 28
The alternative: local buffering Heat and compressed air
storage cheaper than electricity storage
production storage
wholesale sale
storage by user
energy use

Prosumer
Utility
Creating flexibility at the bottom of the system lower costs, higher efficiency
production storage
wholesale sale
storage by user
energy use
Electricity production
Transfor-mation
losses
heat
light
ICT
heat
mech. drive
Storage
demand side management
Electricity delivered
or self-produced
© [email protected] 29
Heat & fuel markets
compr. air
Including the whole heat supply into the system Additional non time-critical loads
heat pump
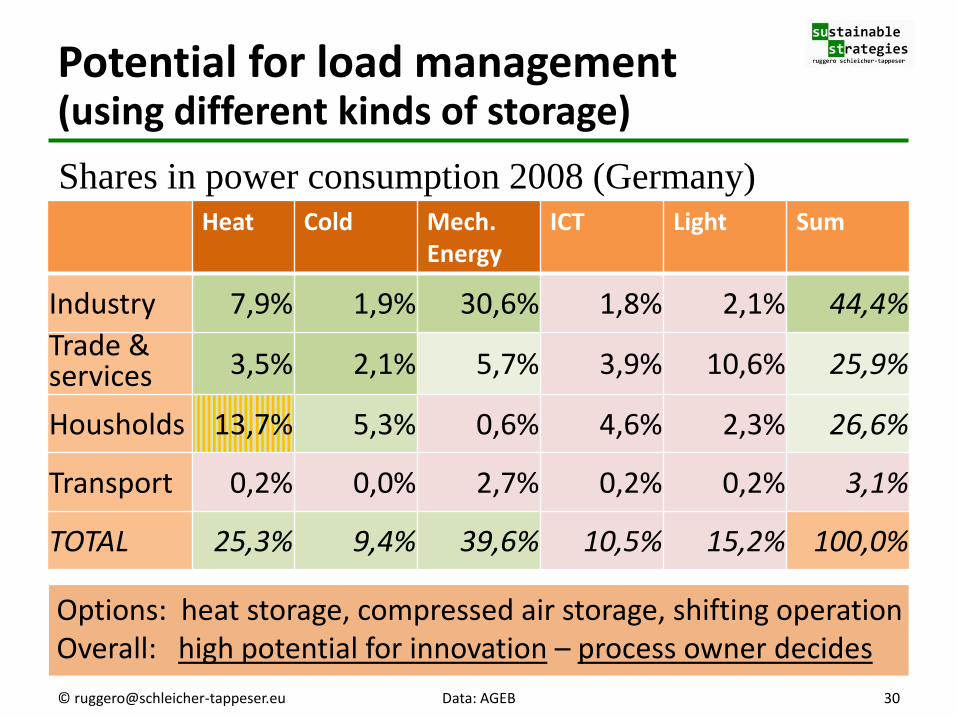
Options: heat storage, compressed air storage, shifting operation Overall: high potential for innovation – process owner decides
Potential for load management (using different kinds of storage)
Heat Cold Mech. Energy
ICT Light Sum
Industry 7,9% 1,9% 30,6% 1,8% 2,1% 44,4%
Trade & services 3,5% 2,1% 5,7% 3,9% 10,6% 25,9%
Housholds 13,7% 5,3% 0,6% 4,6% 2,3% 26,6%
Transport 0,2% 0,0% 2,7% 0,2% 0,2% 3,1%
TOTAL 25,3% 9,4% 39,6% 10,5% 15,2% 100,0%
Shares in power consumption 2008 (Germany)
30 © [email protected] Data: AGEB

A new innovation wave: power management technologies
• Until now missing incentives for load management, smart homes, buildings ... neglected opportunities – ICT technologies exist, no large-scale diffusion, missing
standards, large companies awaiting 12-digit turnovers
– New storage technologies emerging
– Coupling with heat market not developed, heat storage options neglected
– No priority in the design of production processes, process owners not motivated
Huge neglected development potential
• In two years cheap local PV gives strong incentives for private action innovation wave
© [email protected] 31

The coming boom: captive power generation
Attractive investments even without incentives
Timeline in Germany:
• In one/two years: PV power for own consumption in commerce and services
• In two/three years: Supplementary investments for increasing the share of own consumption
PV growth independent from incentives
Boom in power management technologies
© [email protected] 32
• Dealing with high upfront costs
• Structuring of risks
• Segmentation of markets
• Distribution of roles
• Development of step by step approaches
Where will we see them first at large scale?
• in Germany?
• in Italy?
• in Spain?
• in Turkey?
• in India?
Still missing but slowly emerging: appropriate business models
© [email protected] 33

TOWARDS A NEW CONTROL LOGIC OF THE ELECTRICITY SYSTEM
34

Traditional Large power plants fossil and nuclear
• Production follows demand: base / middle / peak load
• Load management only with large consumers
• Central control
Supply 100% REN Integrated optimisation of the whole system
• Fluctuating production with wind and sun dominates
• Load management, storage
• Complexity requires optimisation on several levels
Captive power production Optimisation on the consumption level
• Optimisation subsystem • Partial buffering of fluctuations
at the local level • Facilitation of optimisation at
higher levels
Captive PV Power can support the change of the control logic of the electricity system…
production
load storage
grid Contribution
Transformation Transformation
production
load storage
transport
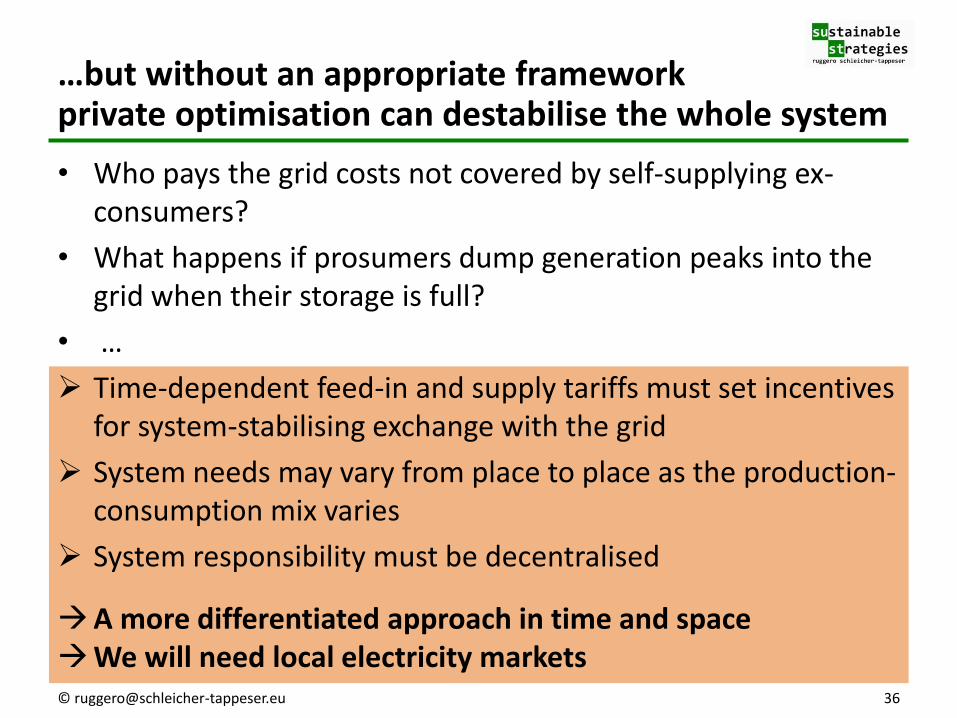
• Who pays the grid costs not covered by self-supplying ex-consumers?
• What happens if prosumers dump generation peaks into the grid when their storage is full?
• …
Time-dependent feed-in and supply tariffs must set incentives for system-stabilising exchange with the grid
System needs may vary from place to place as the production-consumption mix varies
System responsibility must be decentralised
A more differentiated approach in time and space We will need local electricity markets
…but without an appropriate framework private optimisation can destabilise the whole system
© [email protected] 36
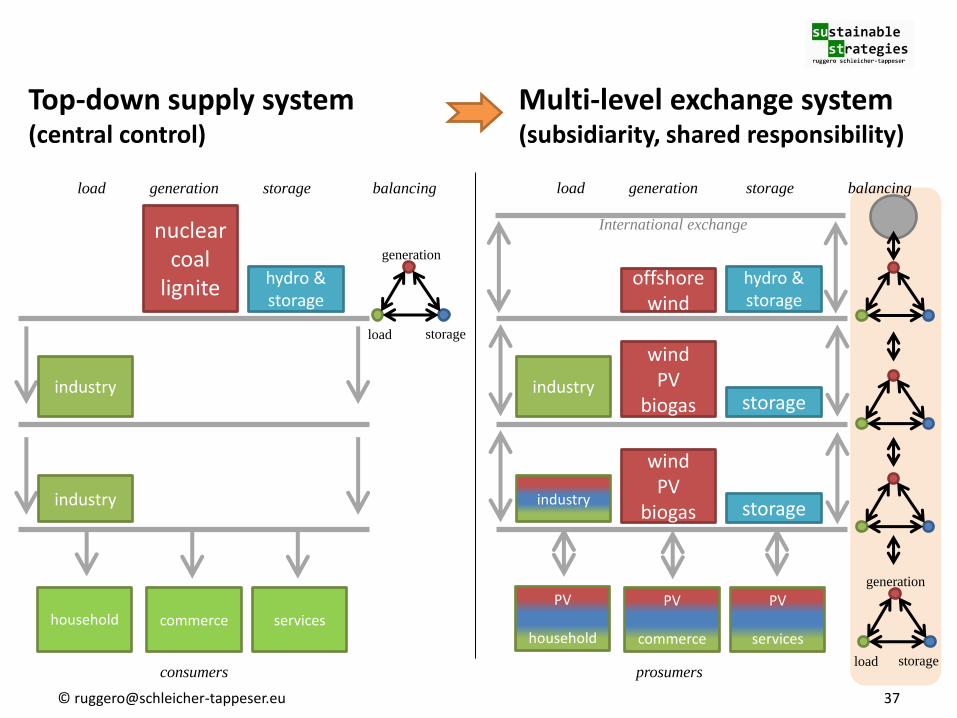
generation
load storage
nuclear coal
lignite hydro & storage
offshore wind
hydro & storage
wind PV
biogas storage industry
wind PV
biogas storage industry
industry
industry
PV
household
PV
commerce
PV
services household commerce services
load generation storage balancing
generation
load storage
consumers prosumers
International exchange
load generation storage balancing
Top-down supply system (central control)
Multi-level exchange system (subsidiarity, shared responsibility)
© [email protected] 37
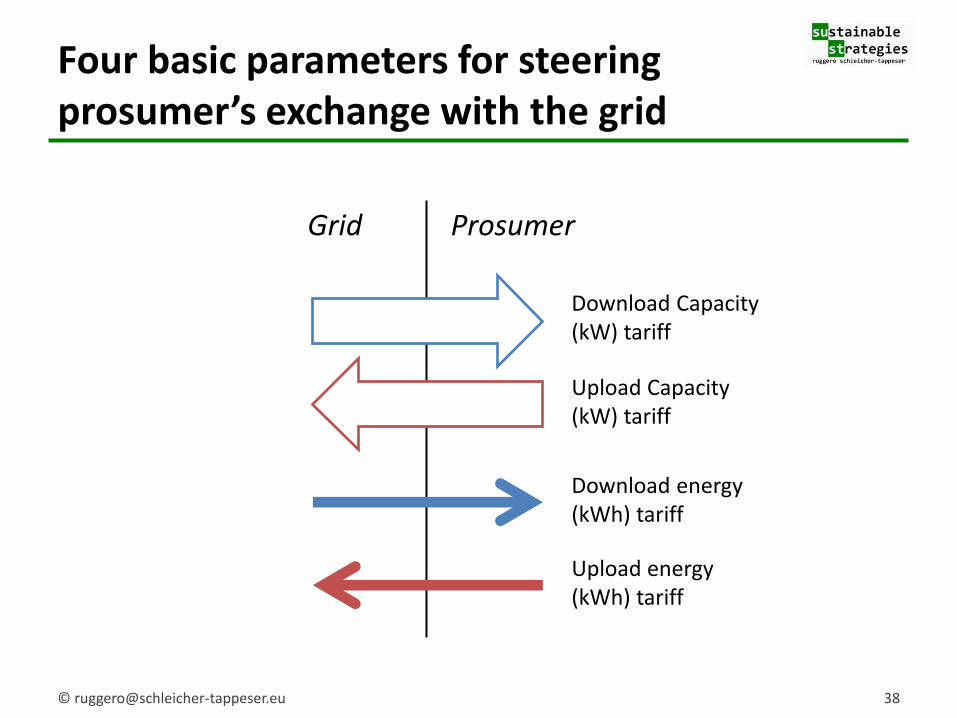
Four basic parameters for steering prosumer’s exchange with the grid
38 © [email protected]
Grid Prosumer
Download Capacity (kW) tariff
Upload Capacity (kW) tariff
Download energy (kWh) tariff
Upload energy (kWh) tariff
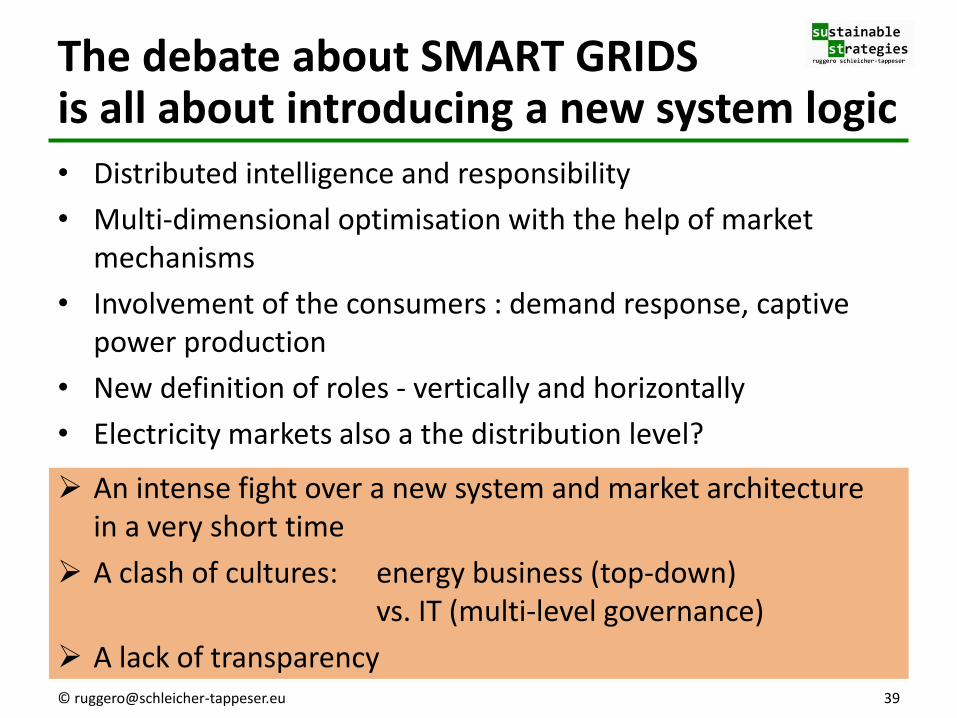
• Distributed intelligence and responsibility
• Multi-dimensional optimisation with the help of market mechanisms
• Involvement of the consumers : demand response, captive power production
• New definition of roles - vertically and horizontally
• Electricity markets also a the distribution level?
An intense fight over a new system and market architecture in a very short time
A clash of cultures: energy business (top-down) vs. IT (multi-level governance)
A lack of transparency
The debate about SMART GRIDS is all about introducing a new system logic
© [email protected] 39
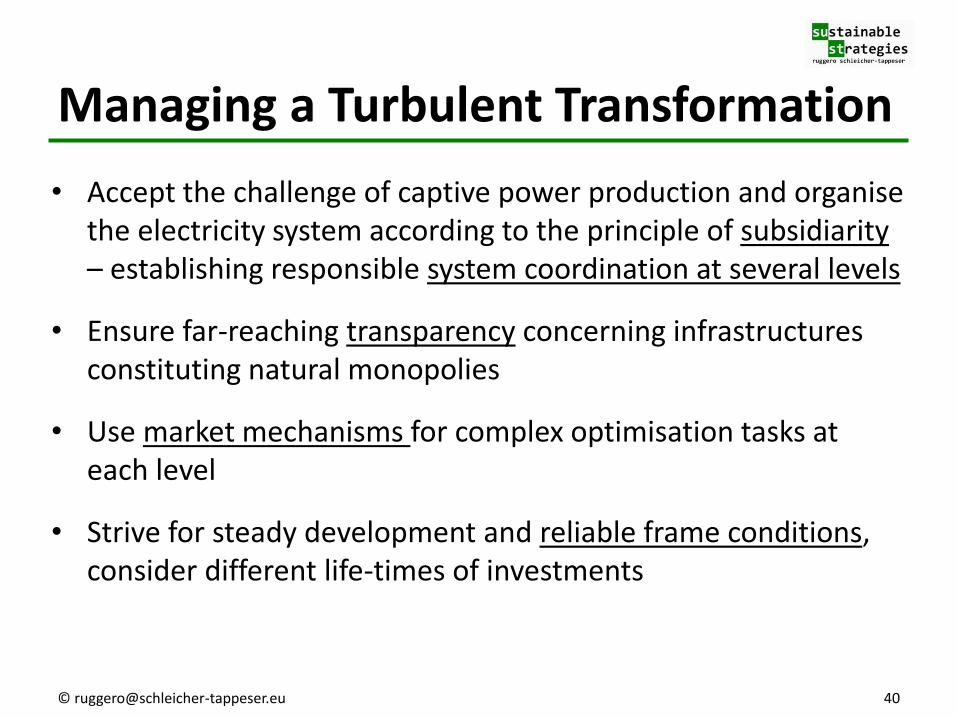
Managing a Turbulent Transformation
• Accept the challenge of captive power production and organise the electricity system according to the principle of subsidiarity – establishing responsible system coordination at several levels
• Ensure far-reaching transparency concerning infrastructures constituting natural monopolies
• Use market mechanisms for complex optimisation tasks at each level
• Strive for steady development and reliable frame conditions, consider different life-times of investments
© [email protected] 40
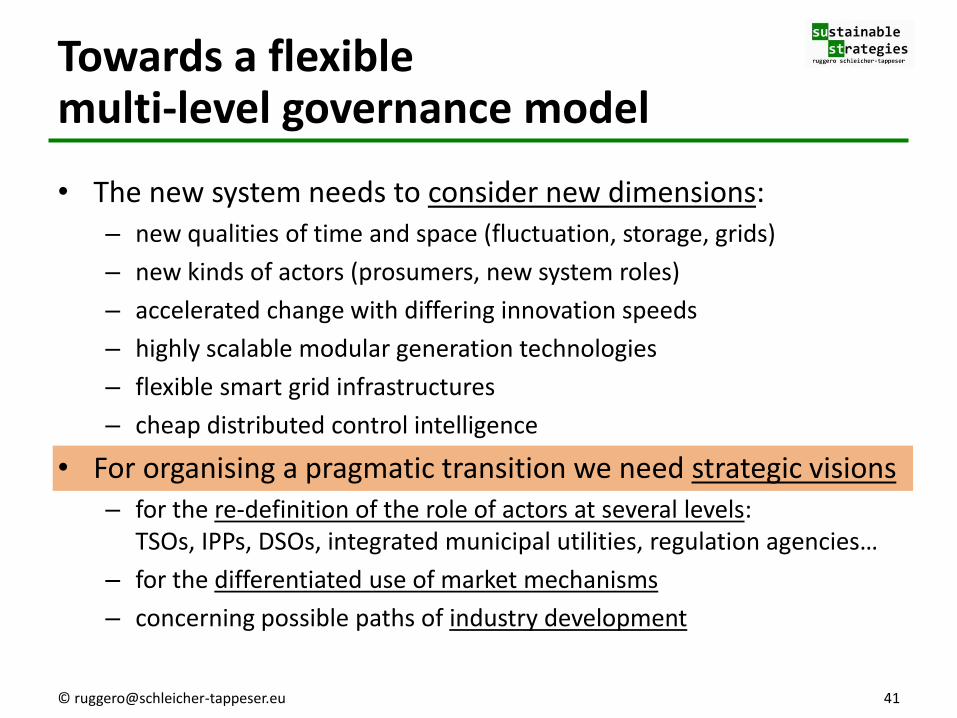
Towards a flexible multi-level governance model
• The new system needs to consider new dimensions: – new qualities of time and space (fluctuation, storage, grids)
– new kinds of actors (prosumers, new system roles)
– accelerated change with differing innovation speeds
– highly scalable modular generation technologies
– flexible smart grid infrastructures
– cheap distributed control intelligence
• For organising a pragmatic transition we need strategic visions – for the re-definition of the role of actors at several levels:
TSOs, IPPs, DSOs, integrated municipal utilities, regulation agencies…
– for the differentiated use of market mechanisms
– concerning possible paths of industry development
© [email protected] 41

42 © [email protected]
THANK YOU FOR YOUR ATTENTION
You will find this presentation and more on my website
www.sustainablestrategies.eu
Ruggero Schleicher-Tappeser
See article: “How renewables will change electricity markets in the next five years”
Energy Policy 2012: http://bit.ly/L27haO