pulverized coal oxycombustion power plants - pulverized%20coal... · boiler & fgd: b&w bop:...
TRANSCRIPT
Pulverized Coal OxycombustionPower Plants
Final Results
Revised August 2008Original Publication Date: August 2007
Jared Ciferno
2
This presentation was prepared as an account of work sponsored by an agency of the United States Government. Neither the United States Government nor any agency thereof, nor any of their employees, makes any warranty, express or implied, or assumes any legal liability or responsibility for the accuracy, completeness, or usefulness of any information, apparatus, product, or process disclosed, or represents that its use would not infringe privately owned rights. Reference therein to any specific commercial product, process, or service by trade name, trademark, manufacturer, or otherwise does not necessarily constitute or imply its endorsement, recommendation, or favoring by the United States Government or any agency thereof. The views and opinions of authors expressed therein do not necessarily state or reflect those of the United States Government or any agency thereof.
Disclaimer
3
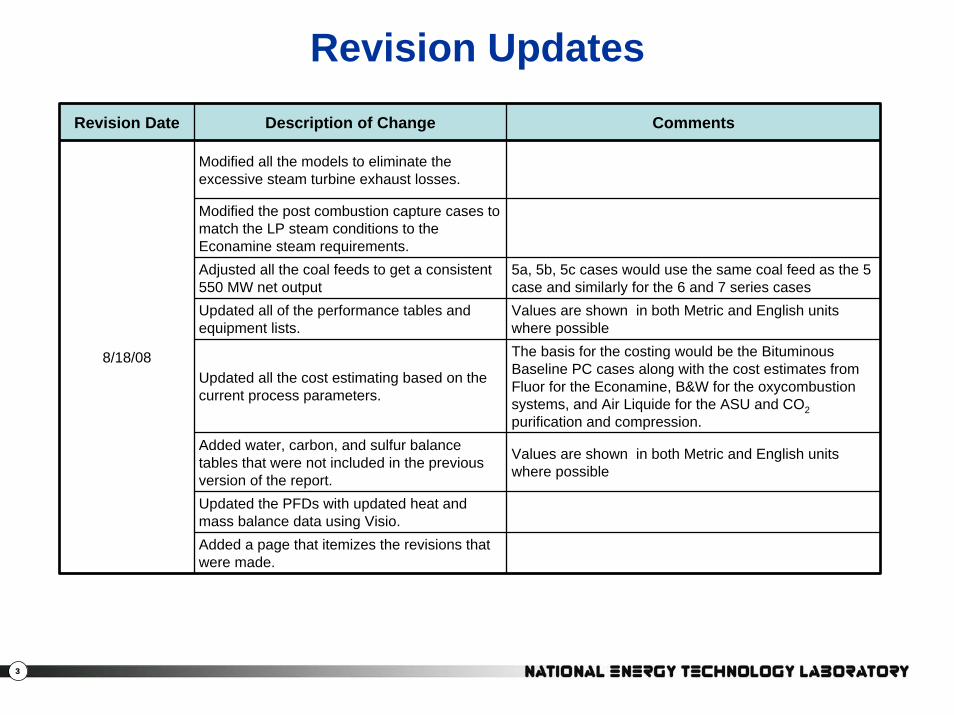
Revision UpdatesRevision Date Description of Change Comments
Modified all the models to eliminate the excessive steam turbine exhaust losses.
Modified the post combustion capture cases to match the LP steam conditions to the Econamine steam requirements.Adjusted all the coal feeds to get a consistent 550 MW net output
5a, 5b, 5c cases would use the same coal feed as the 5 case and similarly for the 6 and 7 series cases
Updated all of the performance tables and equipment lists.
Values are shown in both Metric and English units where possible
Updated all the cost estimating based on the current process parameters.
The basis for the costing would be the Bituminous Baseline PC cases along with the cost estimates from Fluor for the Econamine, B&W for the oxycombustion systems, and Air Liquide for the ASU and CO2purification and compression.
Added water, carbon, and sulfur balance tables that were not included in the previous version of the report.
Values are shown in both Metric and English units where possible
Updated the PFDs with updated heat and mass balance data using Visio.Added a page that itemizes the revisions that were made.
8/18/08

4
Goals and Objectives
• Determine cost and performance estimates of new pulverized coal oxycombustion power plants– Technologies deployed in 2012 and 2020
• Assess the technical and economic feasibility of co-sequestration with CO2, SOx and NOx
• Assess the integration of developmental processes such as novel O2 membrane technologies
Exploring feasibility of a non-gasification based system in a carbon constrained world
Exploring feasibility of a non-gasification based system in a carbon constrained world
5
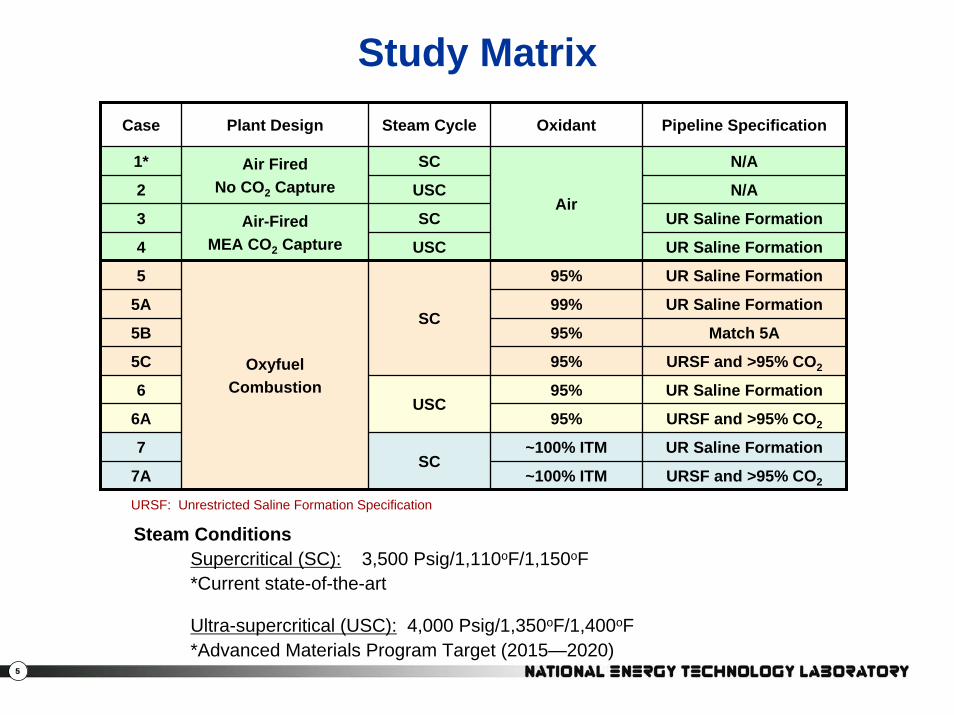
Study MatrixCase Plant Design Steam Cycle Oxidant Pipeline Specification
N/A
N/A
UR Saline Formation
UR Saline Formation
UR Saline Formation
UR Saline Formation
Match 5A
URSF and >95% CO2
UR Saline Formation
URSF and >95% CO2
UR Saline Formation
URSF and >95% CO2
Air FiredNo CO2 Capture
Air-FiredMEA CO2 Capture
OxyfuelCombustion
1* SC
2 USC
3 SC
4 USC
5 95%
5A 99%
5B 95%
5C 95%
6 95%
6AUSC
95%
7 ~100% ITM
7ASC
~100% ITM
SC
Air
Steam ConditionsSupercritical (SC): 3,500 Psig/1,110oF/1,150oF*Current state-of-the-art
Ultra-supercritical (USC): 4,000 Psig/1,350oF/1,400oF*Advanced Materials Program Target (2015—2020)
URSF: Unrestricted Saline Formation Specification
6
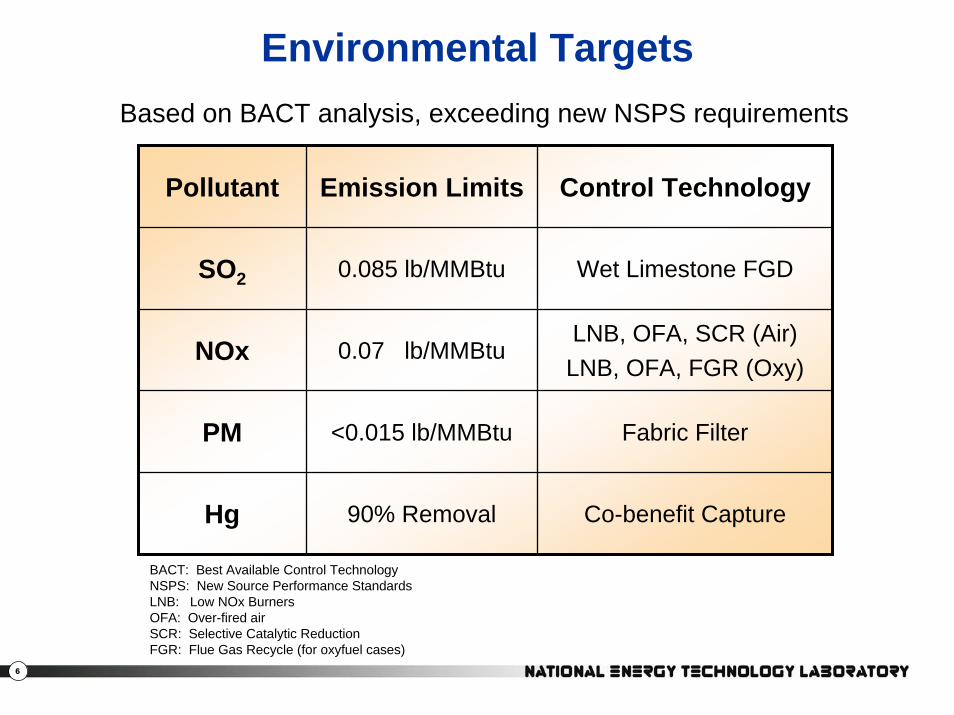
Environmental Targets
Pollutant Emission Limits Control Technology
SO2 0.085 lb/MMBtu
0.07 lb/MMBtu
<0.015 lb/MMBtu
90% Removal
Wet Limestone FGD
NOxLNB, OFA, SCR (Air)LNB, OFA, FGR (Oxy)
PM Fabric Filter
Hg Co-benefit Capture
BACT: Best Available Control TechnologyNSPS: New Source Performance StandardsLNB: Low NOx BurnersOFA: Over-fired airSCR: Selective Catalytic ReductionFGR: Flue Gas Recycle (for oxyfuel cases)
Based on BACT analysis, exceeding new NSPS requirements
7
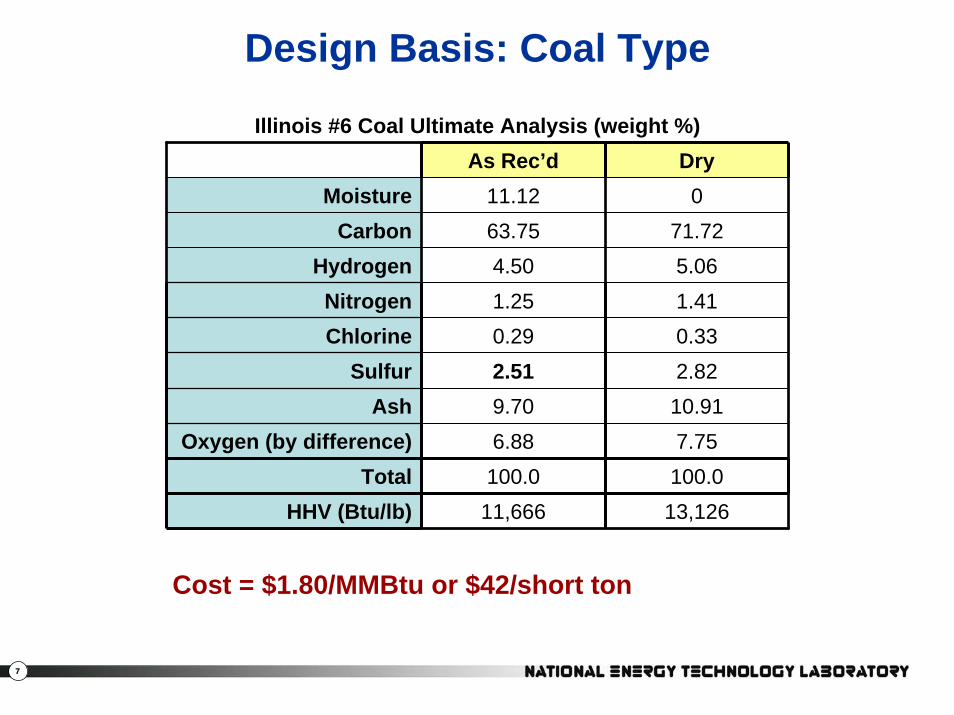
Design Basis: Coal Type
Illinois #6 Coal Ultimate Analysis (weight %)As Rec’d Dry
Moisture 11.12 071.725.061.41
Chlorine 0.29 0.33Sulfur 2.51 2.82
Ash 9.70 10.91Oxygen (by difference) 6.88 7.75
Total 100.0 100.0HHV (Btu/lb) 11,666 13,126
Carbon 63.75Hydrogen 4.50Nitrogen 1.25
Cost = $1.80/MMBtu or $42/short ton
8
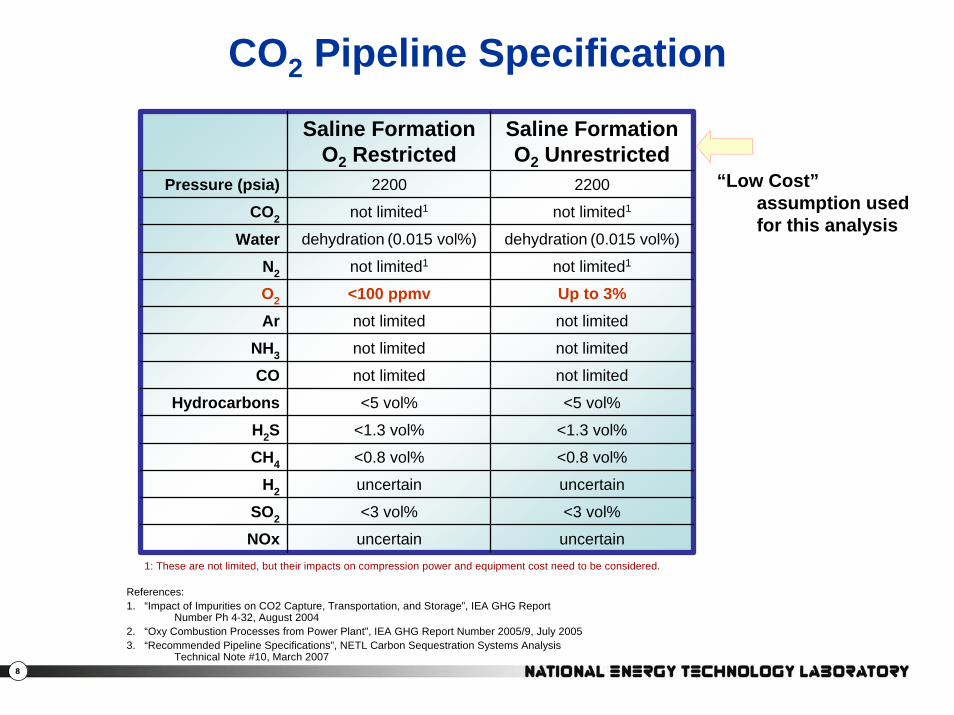
CO2 Pipeline Specification
Saline FormationO2 Restricted
Saline FormationO2 Unrestricted
Pressure (psia) 2200 2200
not limited1
dehydration (0.015 vol%)
not limited1
Up to 3%not limited
not limited
not limited
<5 vol%
<1.3 vol%
<0.8 vol%
uncertain
<3 vol%
uncertain
CO2 not limited1
Water dehydration (0.015 vol%)
N2 not limited1
O2 <100 ppmvAr not limited
NH3 not limited
CO not limited
Hydrocarbons <5 vol%
H2S <1.3 vol%
CH4 <0.8 vol%
H2 uncertain
SO2 <3 vol%
NOx uncertain1: These are not limited, but their impacts on compression power and equipment cost need to be considered.
References:1. “Impact of Impurities on CO2 Capture, Transportation, and Storage”, IEA GHG Report
Number Ph 4-32, August 20042. “Oxy Combustion Processes from Power Plant”, IEA GHG Report Number 2005/9, July 20053. “Recommended Pipeline Specifications”, NETL Carbon Sequestration Systems Analysis
Technical Note #10, March 2007
“Low Cost”assumption used for this analysis
9
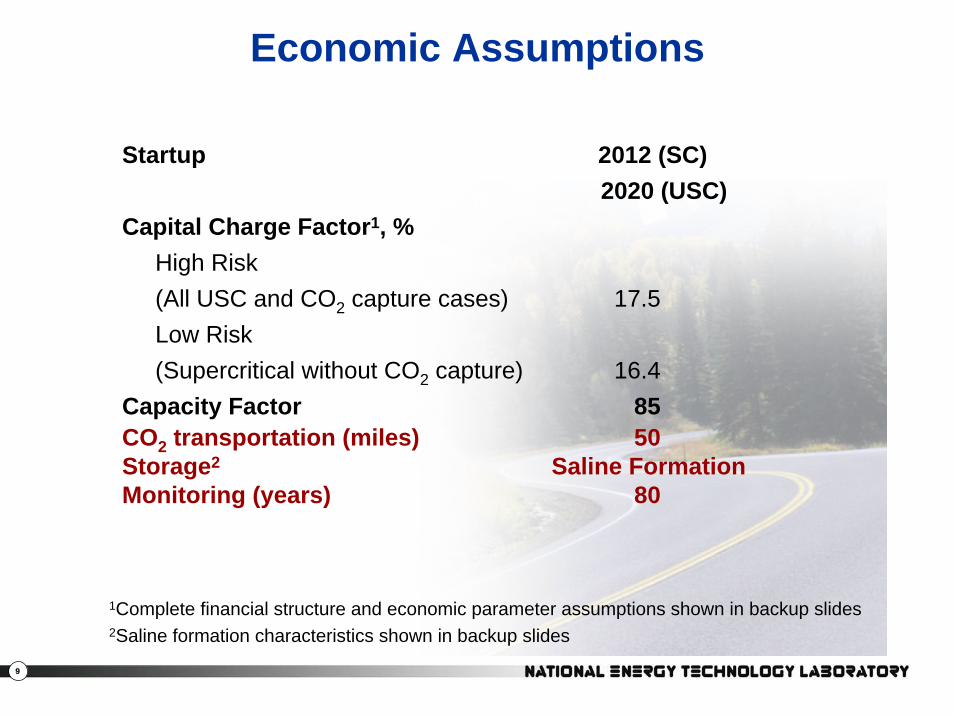
Economic Assumptions
Startup 2012 (SC)2020 (USC)
Capital Charge Factor1, % High Risk (All USC and CO2 capture cases) 17.5Low Risk(Supercritical without CO2 capture) 16.4
Capacity Factor 85CO2 transportation (miles) 50Storage2 Saline FormationMonitoring (years) 80
1Complete financial structure and economic parameter assumptions shown in backup slides2Saline formation characteristics shown in backup slides
10
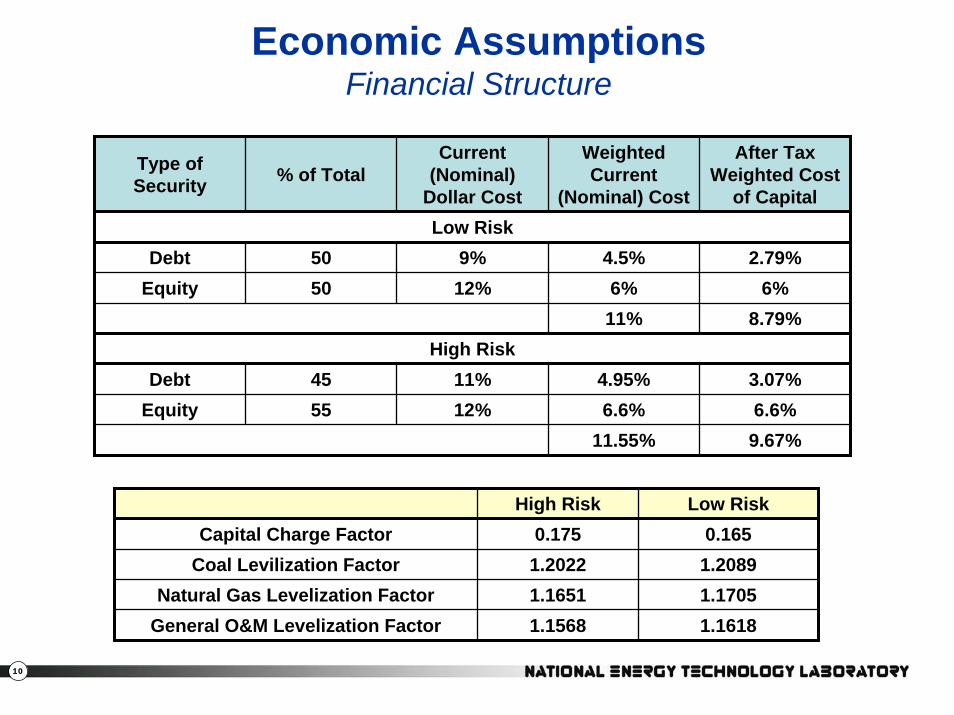
Economic AssumptionsFinancial Structure
Type of Security % of Total
Current (Nominal)
Dollar Cost
Weighted Current
(Nominal) Cost
After Tax Weighted Cost
of CapitalLow Risk
Debt 50 9% 4.5% 2.79%Equity 50 12% 6% 6%
11% 8.79%High Risk
Debt 45 11% 4.95% 3.07%Equity 55 12% 6.6% 6.6%
11.55% 9.67%
1.16181.1568General O&M Levelization Factor1.17051.1651Natural Gas Levelization Factor1.20891.2022Coal Levilization Factor0.1650.175Capital Charge Factor
Low RiskHigh Risk
11
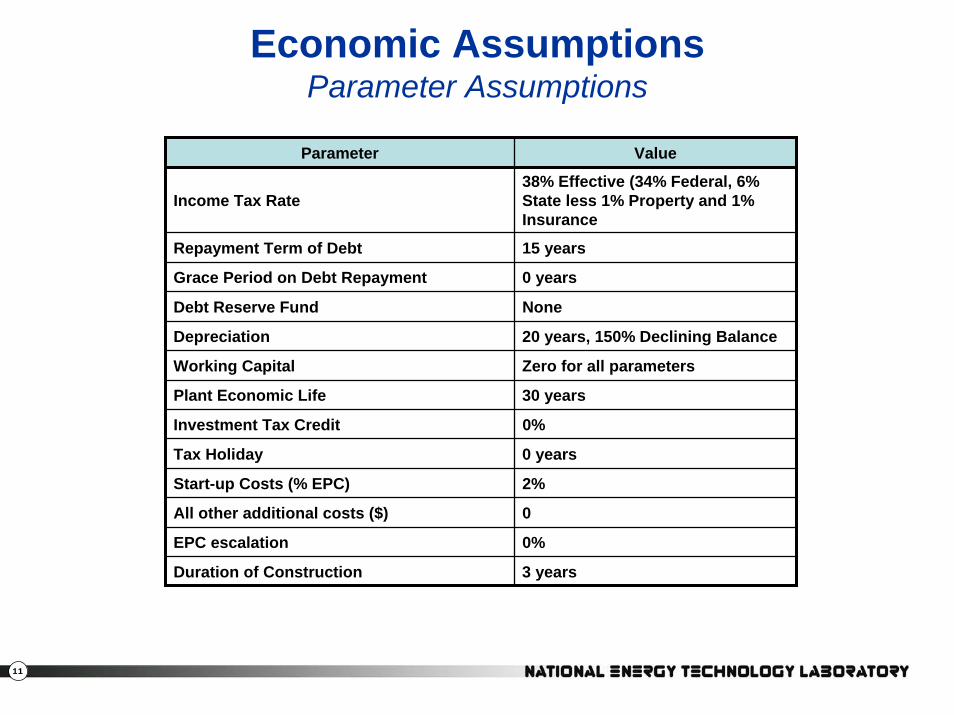
Economic AssumptionsParameter Assumptions
Parameter Value
Income Tax Rate38% Effective (34% Federal, 6% State less 1% Property and 1% Insurance
Repayment Term of Debt 15 years
Grace Period on Debt Repayment 0 years
Debt Reserve Fund None
Depreciation 20 years, 150% Declining Balance
Working Capital Zero for all parameters
Plant Economic Life 30 years
Investment Tax Credit 0%
Tax Holiday 0 years
Start-up Costs (% EPC) 2%
All other additional costs ($) 0
EPC escalation 0%
Duration of Construction 3 years

12
CO2 Mitigation Costs
CO2 Avoided(COEcapture – COEbase)
(Emissionsbase – Emissionscapture)
CO2 Captured(COEcapture – COEbase)
(CO2 Removed)0 0.2 0.4 0.6 0.8 1
CapturePlant
ReferencePlant
tonne CO2/kWh
CO2 Avoided
CO2 Captured
13
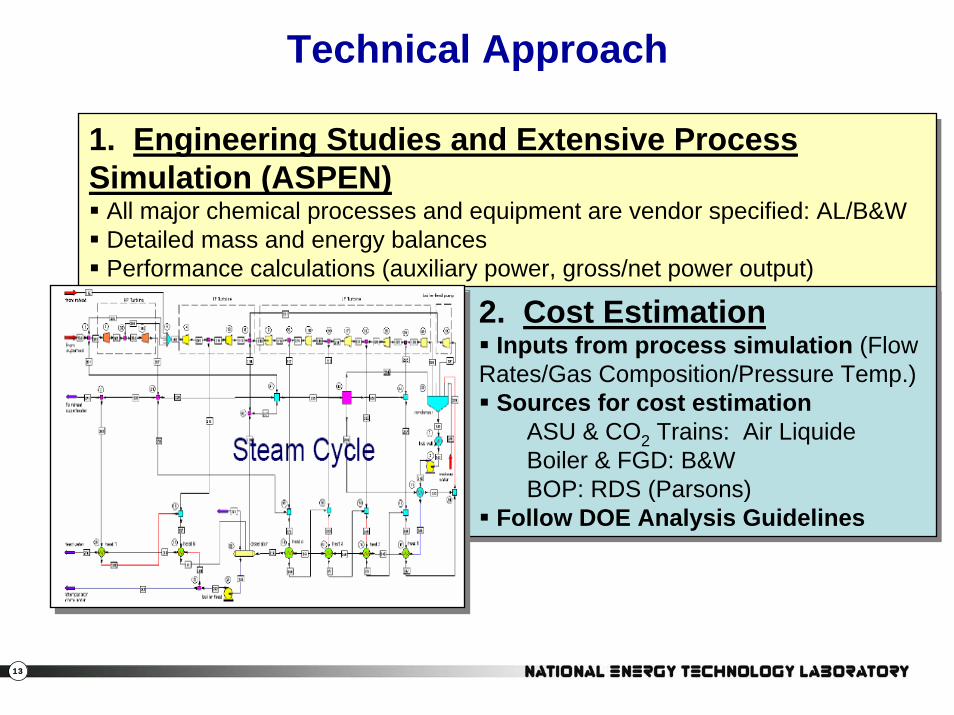
Technical Approach
1. Engineering Studies and Extensive Process Simulation (ASPEN)
All major chemical processes and equipment are vendor specified: AL/B&W Detailed mass and energy balancesPerformance calculations (auxiliary power, gross/net power output)
1. Engineering Studies and Extensive Process Simulation (ASPEN)
All major chemical processes and equipment are vendor specified: AL/B&W Detailed mass and energy balancesPerformance calculations (auxiliary power, gross/net power output)
2. Cost EstimationInputs from process simulation (Flow
Rates/Gas Composition/Pressure Temp.)Sources for cost estimation
ASU & CO2 Trains: Air LiquideBoiler & FGD: B&WBOP: RDS (Parsons)
Follow DOE Analysis Guidelines
2. Cost EstimationInputs from process simulation (Flow
Rates/Gas Composition/Pressure Temp.)Sources for cost estimation
ASU & CO2 Trains: Air LiquideBoiler & FGD: B&WBOP: RDS (Parsons)
Follow DOE Analysis Guidelines
14
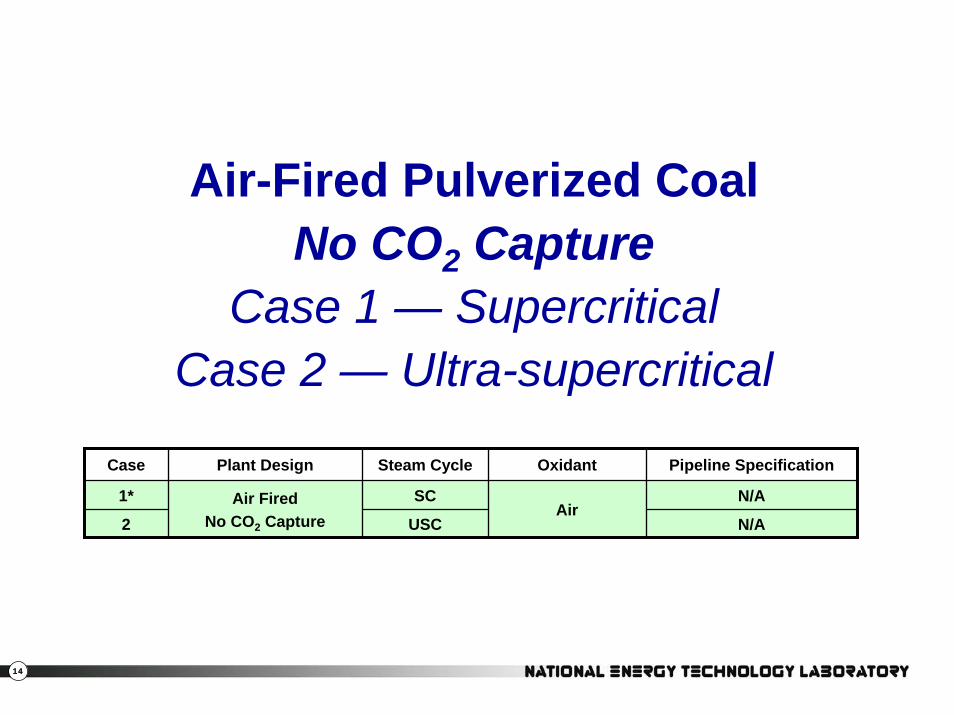
Air-Fired Pulverized CoalNo CO2 Capture
Case 1 — SupercriticalCase 2 — Ultra-supercritical
Case Plant Design Steam Cycle Oxidant Pipeline Specification
N/A
N/AAir Fired
No CO2 Capture1* SC
2 USCAir
15
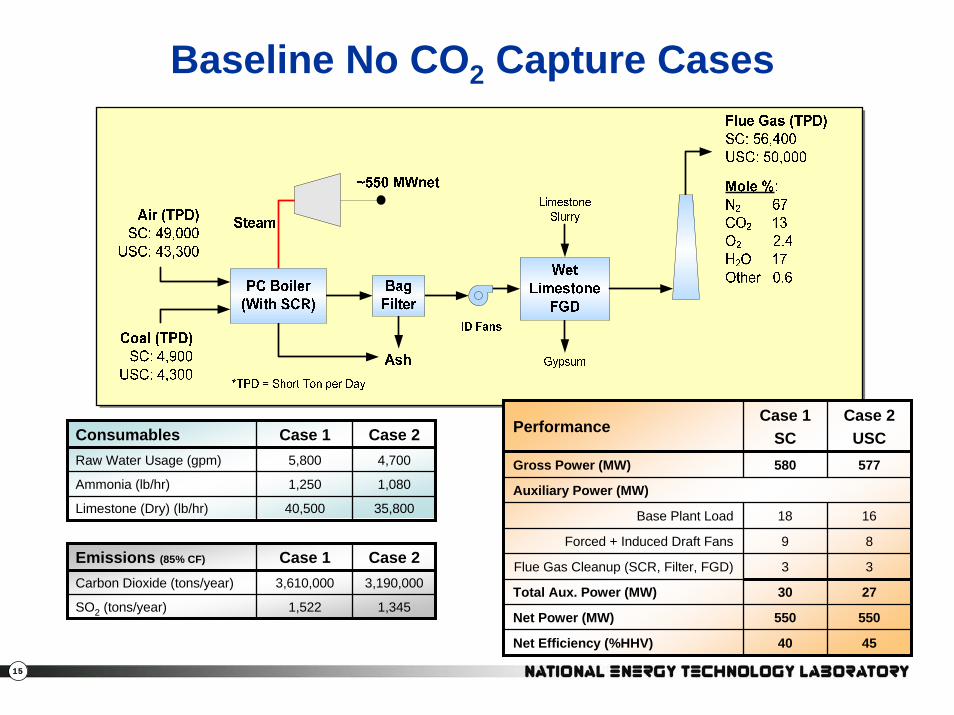
Baseline No CO2 Capture Cases
PerformanceCase 1
SCCase 2USC
Gross Power (MW) 580 577
Auxiliary Power (MW)
Base Plant Load 18 16
8
3
27
550
45
Total Aux. Power (MW) 30
Forced + Induced Draft Fans 9
Flue Gas Cleanup (SCR, Filter, FGD) 3
Net Power (MW) 550
Net Efficiency (%HHV) 40
35,80040,500Limestone (Dry) (lb/hr)
1,0801,250Ammonia (lb/hr)
4,700
Case 25,800Raw Water Usage (gpm)
Case 1Consumables
1,3451,522SO2 (tons/year)
3,190,000
Case 23,610,000Carbon Dioxide (tons/year)
Case 1Emissions (85% CF)
16
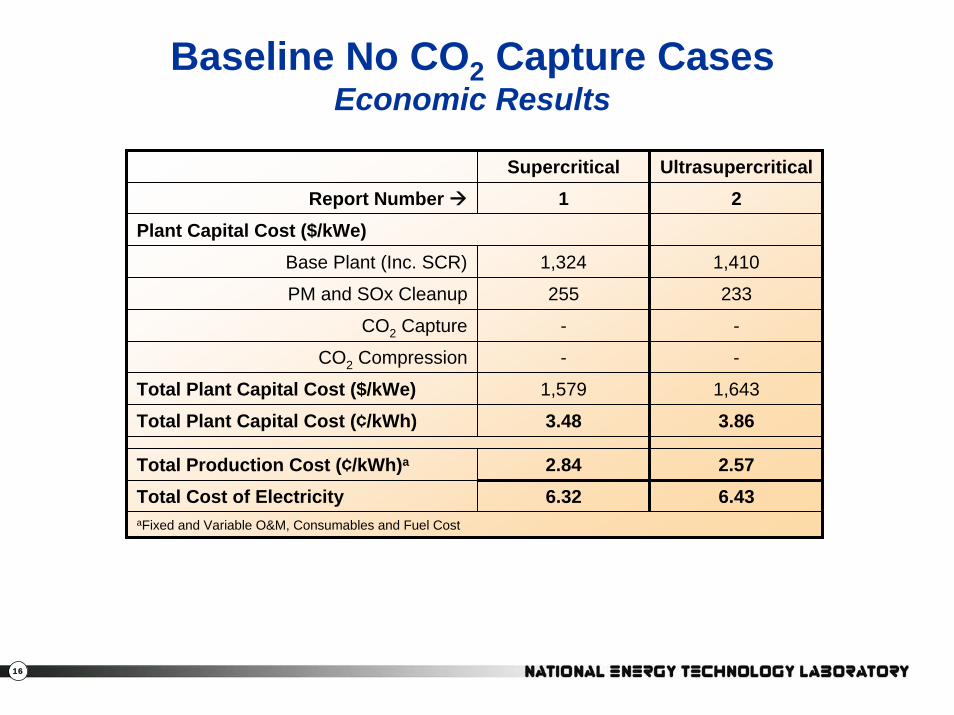
Supercritical UltrasupercriticalReport Number 1 2
Total Plant Capital Cost (¢/kWh) 3.48 3.86
Total Production Cost (¢/kWh)a 2.84 2.57Total Cost of Electricity 6.32 6.43aFixed and Variable O&M, Consumables and Fuel Cost
Plant Capital Cost ($/kWe)Base Plant (Inc. SCR) 1,324 1,410
PM and SOx Cleanup 255 233
-
CO2 Compression - -
1,643
CO2 Capture -
Total Plant Capital Cost ($/kWe) 1,579
Baseline No CO2 Capture CasesEconomic Results
17
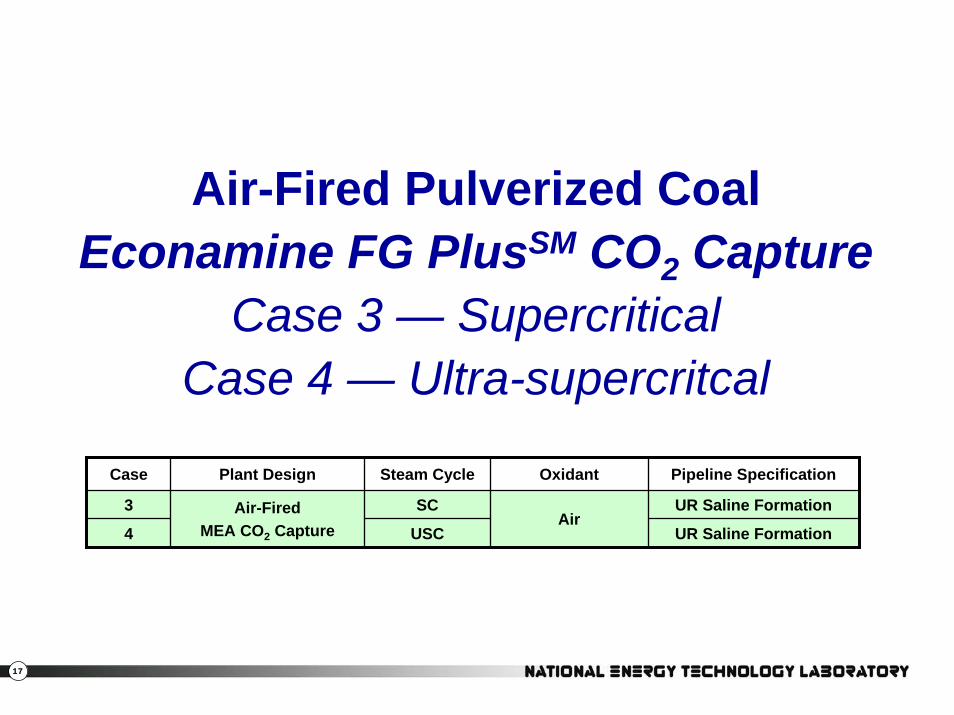
Air-Fired Pulverized CoalEconamine FG PlusSM CO2 Capture
Case 3 — SupercriticalCase 4 — Ultra-supercritcal
Case Plant Design Steam Cycle Oxidant Pipeline Specification
UR Saline Formation
UR Saline FormationAir-Fired
MEA CO2 Capture3 SC
4 USCAir
18
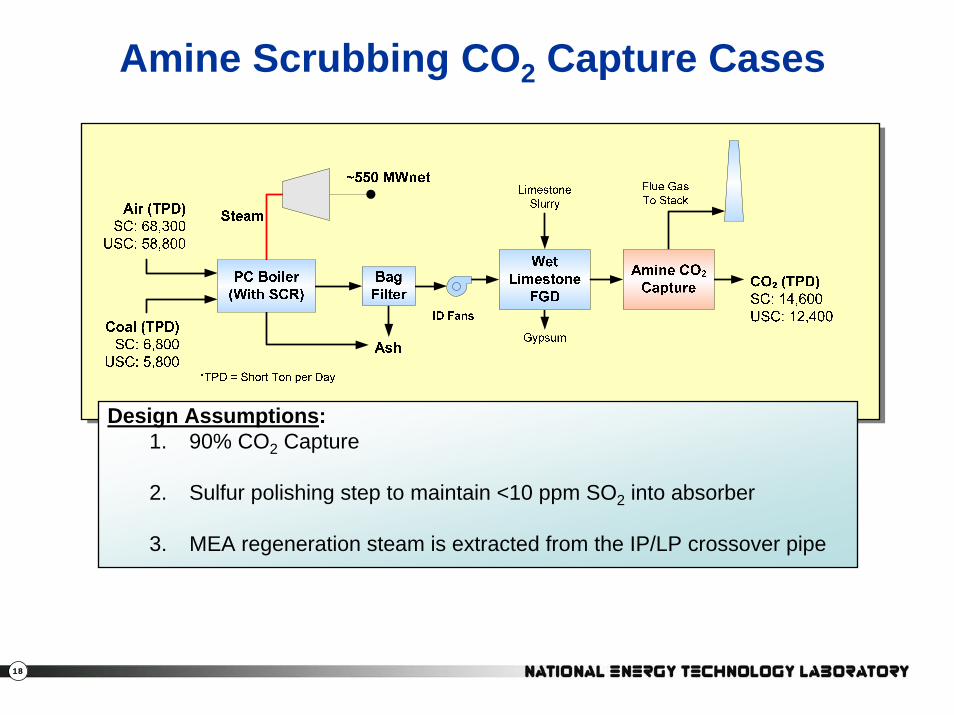
Amine Scrubbing CO2 Capture Cases
Design Assumptions:1. 90% CO2 Capture
2. Sulfur polishing step to maintain <10 ppm SO2 into absorber
3. MEA regeneration steam is extracted from the IP/LP crossover pipe

19
Fluor Econamine FG PlusSM Scrubbing
Absorption (oF) 100’s Reboiler Heat Duty (Btu/lb CO2) 1,550
Auxiliary Power (MW) 19-22Regeneration (oF) 250’s
20
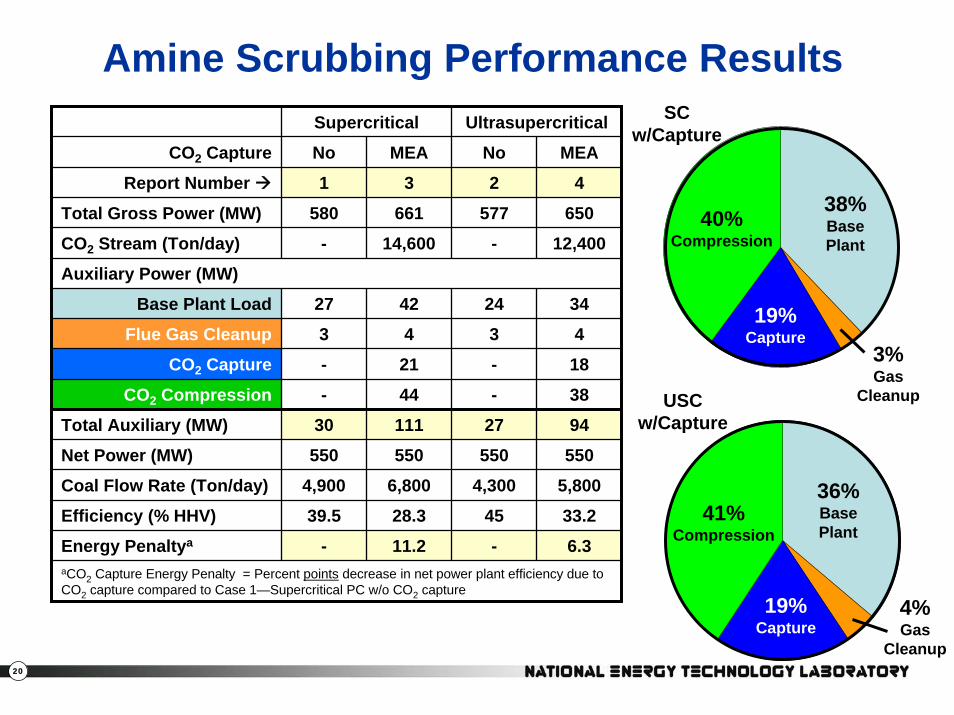
Amine Scrubbing Performance ResultsSupercritical Ultrasupercritical
NoCO2 Capture MEA No MEA
Report Number 1 3 2 4
577
-
24
3
-
-
27
550
4,300
45
-
650
CO2 Stream (Ton/day) - 14,600 12,400
34
4
18
38
94
550
5,800
33.2
6.3aCO2 Capture Energy Penalty = Percent points decrease in net power plant efficiency due to CO2 capture compared to Case 1—Supercritical PC w/o CO2 capture
Total Gross Power (MW) 580 661
Auxiliary Power (MW)
Base Plant Load 27 42
4
21
44
111
550
6,800
28.3
11.2
CO2 Compression -
Net Power (MW) 550
Coal Flow Rate (Ton/day) 4,900
Efficiency (% HHV) 39.5
Flue Gas Cleanup 3
CO2 Capture -
Total Auxiliary (MW) 30
Energy Penaltya -
30%
9%
35%
1%
SC w/Capture
40%Compression
3%Gas
Cleanup
38%BasePlant
19%Capture
30%
35%
1%
USC w/Capture
41%Compression
4%Gas
Cleanup
36%BasePlant
19%Capture
21
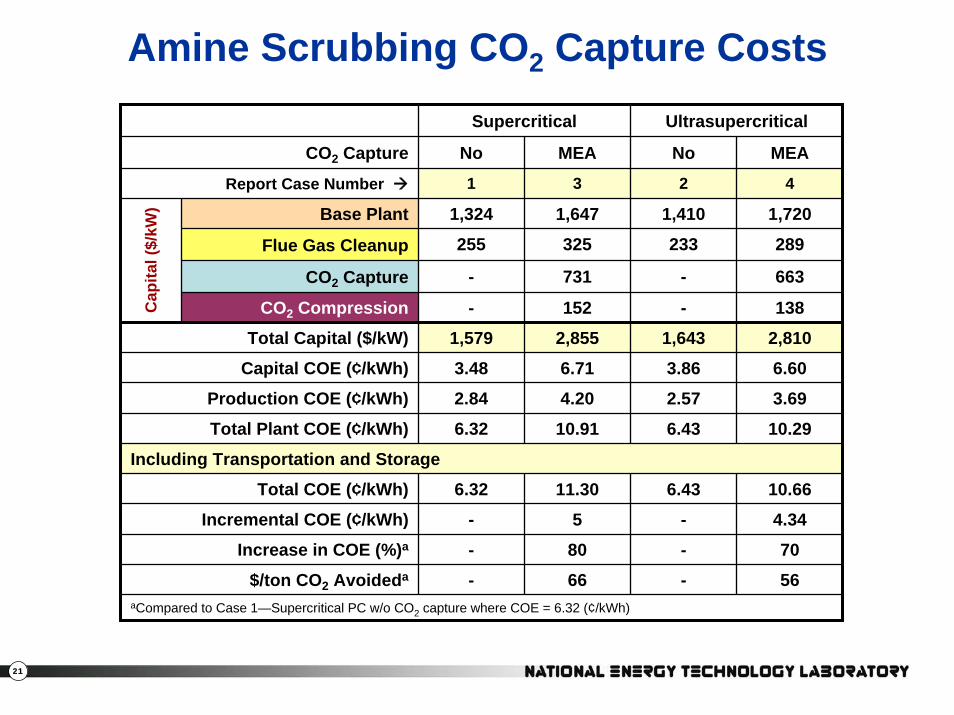
Amine Scrubbing CO2 Capture CostsSupercritical Ultrasupercritical
CO2 Capture No MEA No MEA
Report Case Number 1 3 2 4
Base Plant 1,647
Flue Gas Cleanup 325
CO2 Capture 731
CO2 Compression 152
2,855
6.71
4.20
10.91
Including Transportation and Storage
11.30
5
80
66
1,410
233
-
-
1,643
3.86
2.57
6.43
6.43
-
-
-
1,324 1,720
aCompared to Case 1—Supercritical PC w/o CO2 capture where COE = 6.32 (¢/kWh)
255 289
- 663
- 138
2,810
6.60
3.69
10.29
10.66
4.34
70
56
Total Plant COE (¢/kWh) 6.32
Total COE (¢/kWh) 6.32
Incremental COE (¢/kWh) -
Increase in COE (%)a -
Total Capital ($/kW) 1,579
Capital COE (¢/kWh) 3.48
Production COE (¢/kWh) 2.84
$/ton CO2 Avoideda -
Cap
ital (
$/kW
)
22
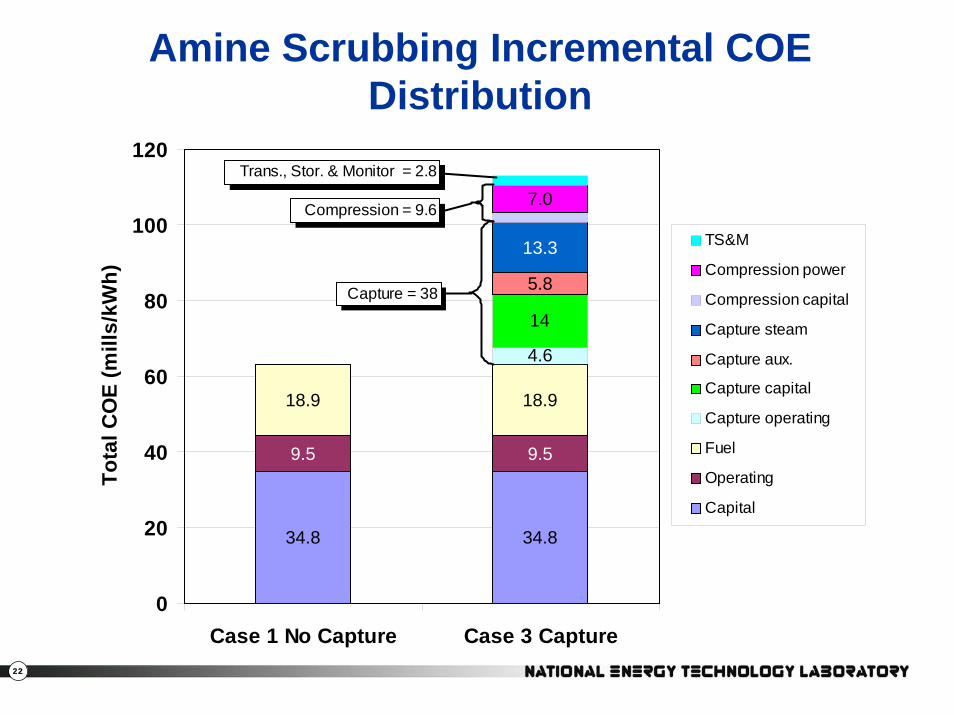
Amine Scrubbing Incremental COE Distribution
34.8 34.8
9.5 9.5
18.9 18.9
4.6
14
5.8
13.3
7.0
0
20
40
60
80
100
120
Case 1 No Capture Case 3 Capture
Tota
l CO
E (m
ills/
kWh)
TS&M
Compression power
Compression capital
Capture steam
Capture aux.
Capture capital
Capture operating
Fuel
Operating
Capital
Capture = 38
Compression = 9.6
Trans., Stor. & Monitor = 2.8
23
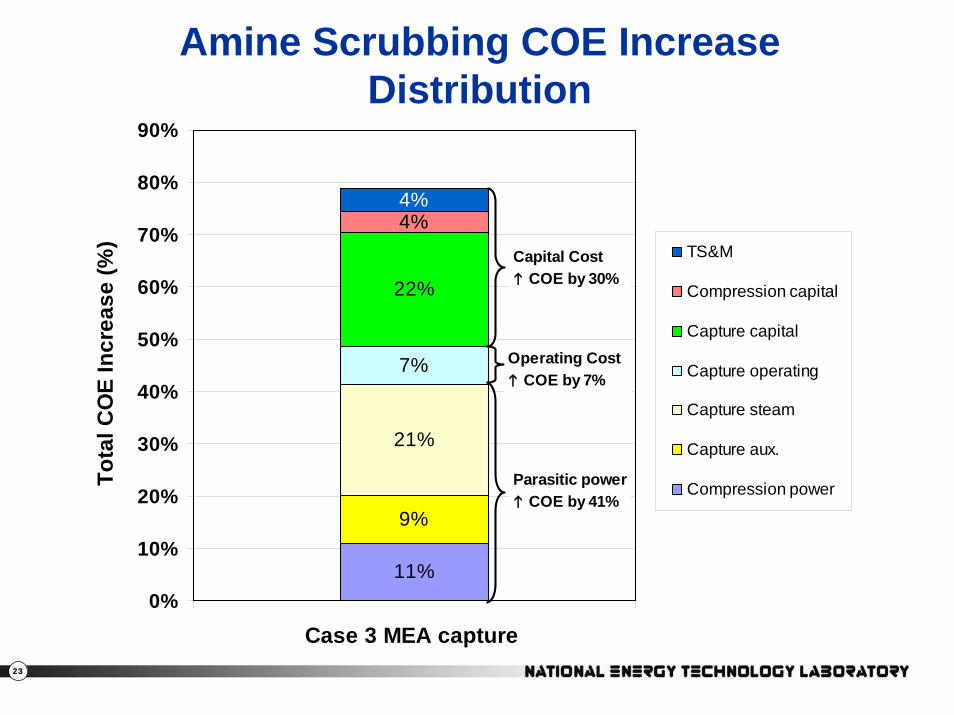
Amine Scrubbing COE Increase Distribution
11%
9%
21%
7%
22%
4%4%
0%
10%
20%
30%
40%
50%
60%
70%
80%
90%
Case 3 MEA capture
Tota
l CO
E In
crea
se (%
) TS&M
Compression capital
Capture capital
Capture operating
Capture steam
Capture aux.
Compression powerParasitic power COE by 41%
Capital Cost COE by 30%
Operating Cost COE by 7%

24
Amine Scrubbing Mitigation Cost Distribution
4.1 6.0
12.5
18.25.2
7.612.0
17.5
2.3
3.4
6.3
9.2
2.5
3.7
0
10
20
30
40
50
60
70
80
Capture Avoided
Miti
gatio
n C
ost (
$/To
n)
TS&M
Compression power
Compression capital
Capture steam
Capture aux.
Capture capital
Capture operating
Total $45/ton CO2
Total =$66/ton CO2
25
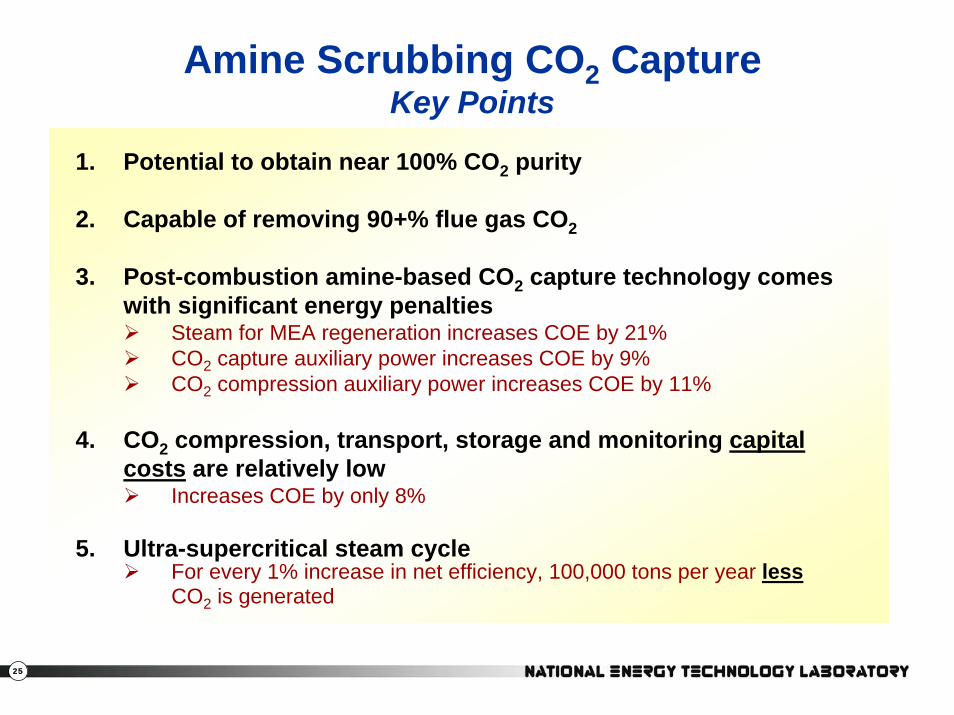
Amine Scrubbing CO2 CaptureKey Points
1. Potential to obtain near 100% CO2 purity
2. Capable of removing 90+% flue gas CO2
3. Post-combustion amine-based CO2 capture technology comes with significant energy penalties
Steam for MEA regeneration increases COE by 21% CO2 capture auxiliary power increases COE by 9%CO2 compression auxiliary power increases COE by 11%
4. CO2 compression, transport, storage and monitoring capital costs are relatively low
Increases COE by only 8%
5. Ultra-supercritical steam cycleFor every 1% increase in net efficiency, 100,000 tons per year lessCO2 is generated
26
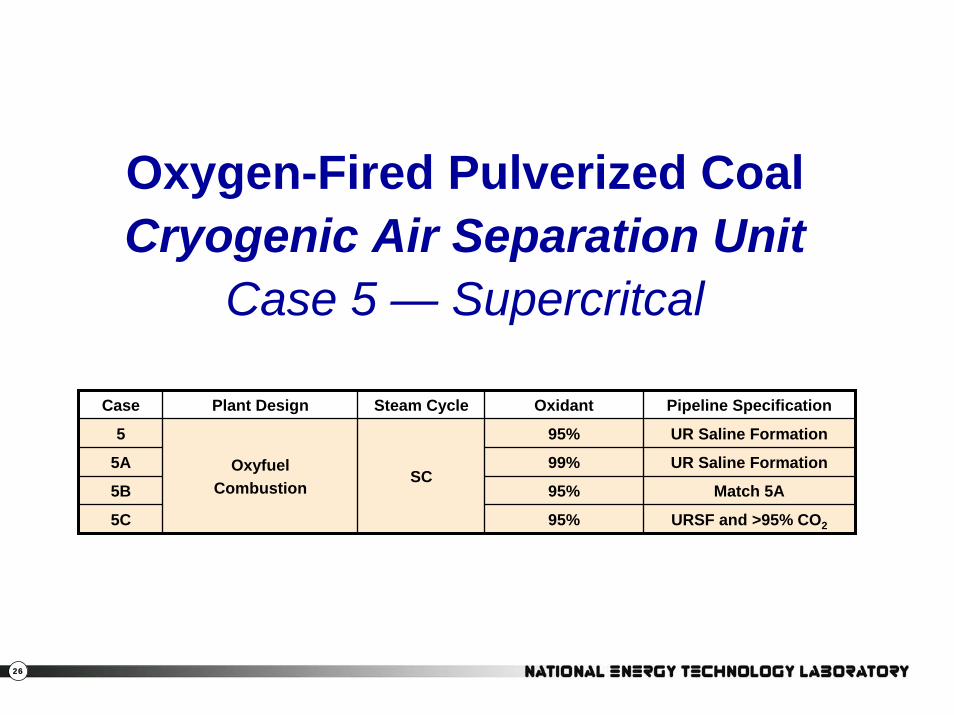
Oxygen-Fired Pulverized CoalCryogenic Air Separation Unit
Case 5 — Supercritcal
Case Plant Design Steam Cycle Oxidant Pipeline Specification
UR Saline Formation
UR Saline Formation
Match 5A
URSF and >95% CO2
OxyfuelCombustion
5 95%
5A 99%
5B 95%
5C 95%
SC
27
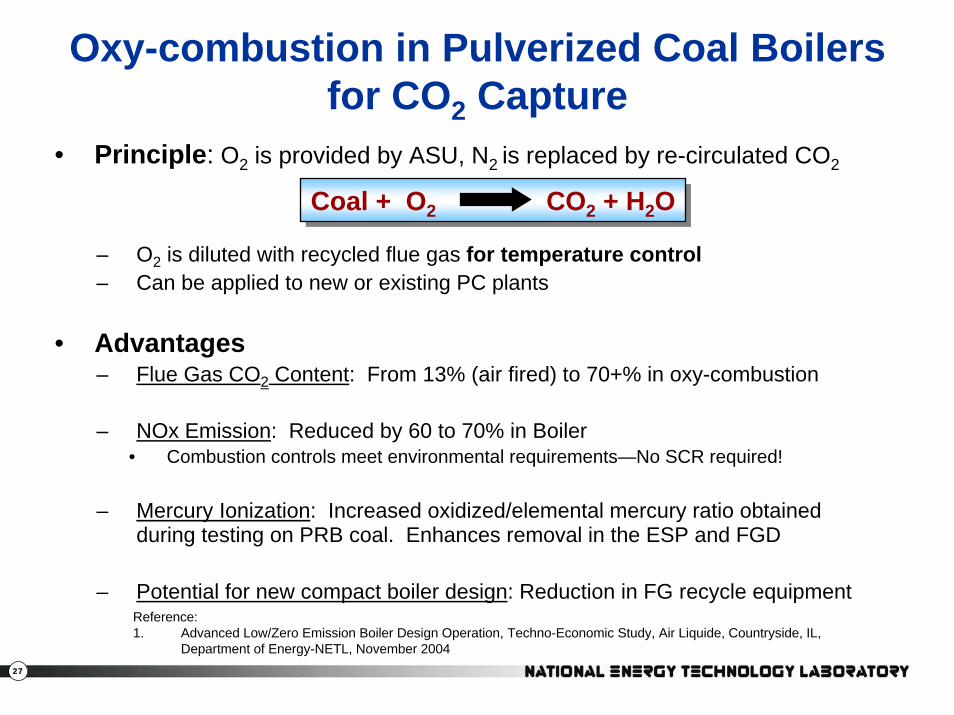
Oxy-combustion in Pulverized Coal Boilers for CO2 Capture
• Principle: O2 is provided by ASU, N2 is replaced by re-circulated CO2
– O2 is diluted with recycled flue gas for temperature control– Can be applied to new or existing PC plants
• Advantages– Flue Gas CO2 Content: From 13% (air fired) to 70+% in oxy-combustion
– NOx Emission: Reduced by 60 to 70% in Boiler• Combustion controls meet environmental requirements—No SCR required!
– Mercury Ionization: Increased oxidized/elemental mercury ratio obtained during testing on PRB coal. Enhances removal in the ESP and FGD
– Potential for new compact boiler design: Reduction in FG recycle equipment
Coal + O2 CO2 + H2OCoal + O2 CO2 + H2O
Reference:1. Advanced Low/Zero Emission Boiler Design Operation, Techno-Economic Study, Air Liquide, Countryside, IL,
Department of Energy-NETL, November 2004

28
Cryogenic ASU Oxyfuel Combustion
Evaluate:1. Impact 95 versus 99% oxygen purity has on the CO2
purification/compression process
2. Minimum CO2 recycle rate
3. Co-sequestration (CO2/NOx/SOx) feasibility
29
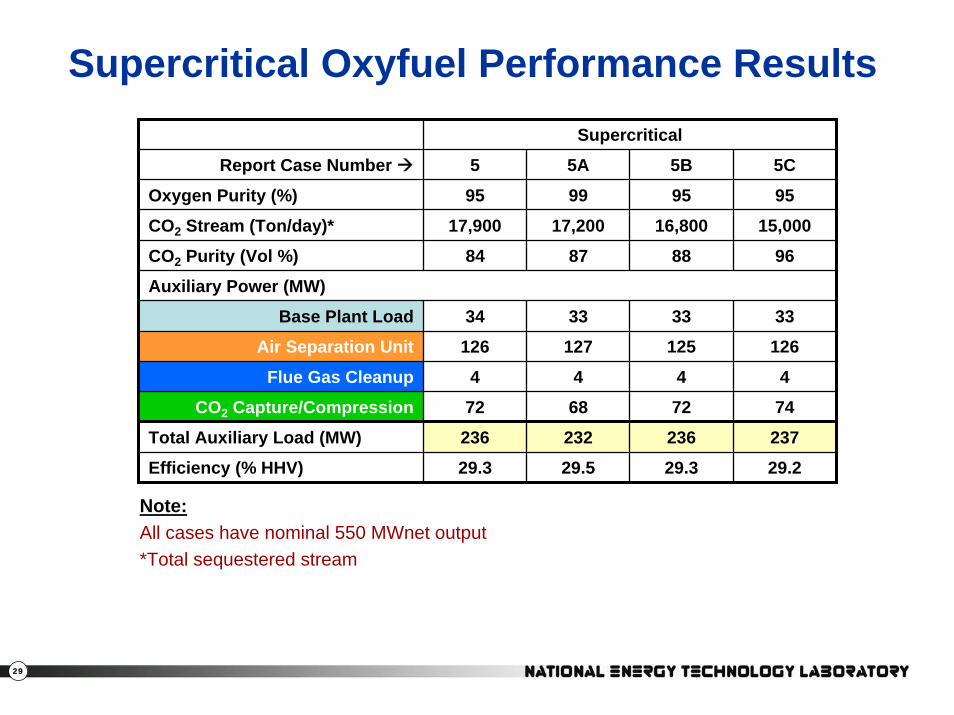
Supercritical Oxyfuel Performance ResultsSupercritical
Report Case Number 5 5A 5B 5C
Oxygen Purity (%) 95 99 95 95
15,000
96
33
126
4
74
237
29.2
16,800
88
33
125
4
72
236
29.3
CO2 Purity (Vol %) 84 87
CO2 Stream (Ton/day)* 17,900 17,200
Auxiliary Power (MW)
Base Plant Load 34 33
127
4
68
232
29.5Efficiency (% HHV) 29.3
Air Separation Unit 126
Flue Gas Cleanup 4
CO2 Capture/Compression 72
Total Auxiliary Load (MW) 236
Note:All cases have nominal 550 MWnet output*Total sequestered stream
30
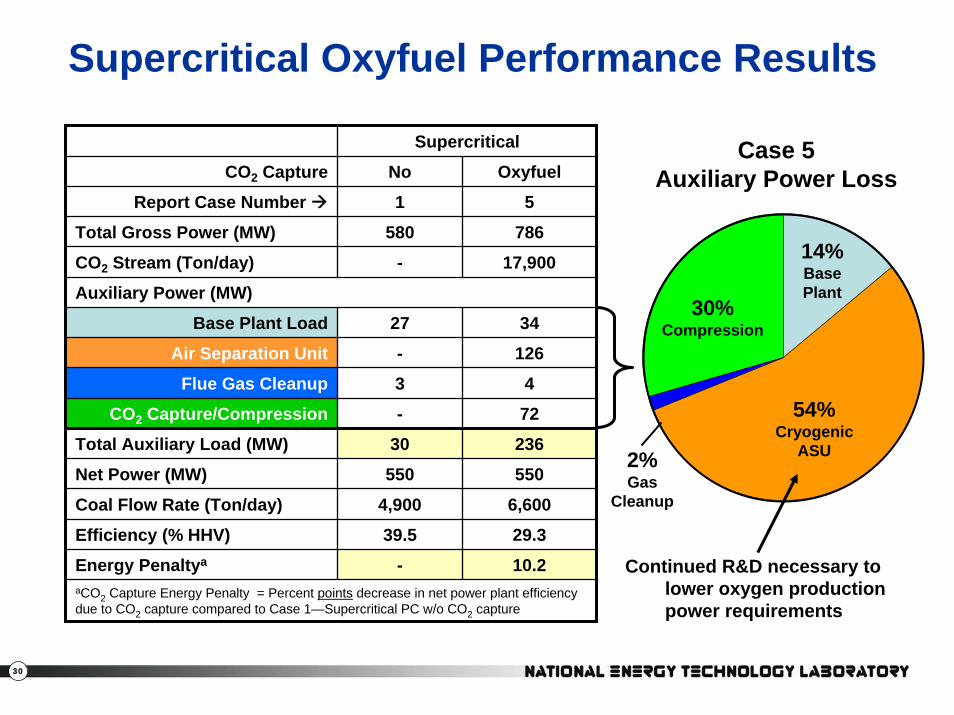
Supercritical Oxyfuel Performance Results
Supercritical
CO2 Capture No Oxyfuel
Report Case Number 1 5
CO2 Stream (Ton/day) - 17,900
aCO2 Capture Energy Penalty = Percent points decrease in net power plant efficiency due to CO2 capture compared to Case 1—Supercritical PC w/o CO2 capture
Total Gross Power (MW) 580 786
Auxiliary Power (MW)
Base Plant Load 27 34
126
4
72
236
550
6,600
29.3
10.2
Net Power (MW) 550
Coal Flow Rate (Ton/day) 4,900
Efficiency (% HHV) 39.5
Air Separation Unit -
Flue Gas Cleanup 3
CO2 Capture/Compression -
Total Auxiliary Load (MW) 30
Energy Penaltya -
30%Compression
2%Gas
Cleanup
14%BasePlant
54%Cryogenic
ASU
Case 5 Auxiliary Power Loss
Continued R&D necessary to lower oxygen production power requirements
31
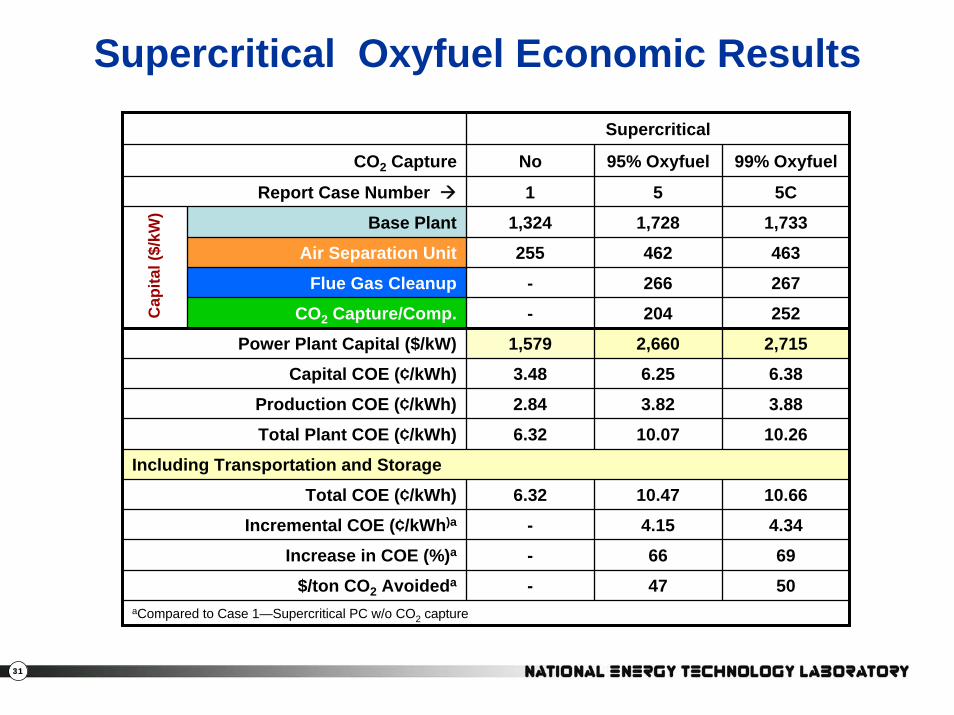
Supercritical Oxyfuel Economic Results Supercritical
CO2 Capture No 95% Oxyfuel 99% Oxyfuel
Report Case Number 1 5 5C
Base Plant
Air Separation Unit
Flue Gas Cleanup
CO2 Capture/Comp.
1,324 1,728 1,733
aCompared to Case 1—Supercritical PC w/o CO2 capture
255 462 463
- 266 267
- 204 252
2,715
6.38
3.88
10.26
10.66
4.34
69
50
Total Plant COE (¢/kWh) 6.32 10.07
Including Transportation and Storage
Total COE (¢/kWh) 6.32 10.47
Incremental COE (¢/kWh)a - 4.15
Increase in COE (%)a - 66
Power Plant Capital ($/kW) 1,579 2,660
Capital COE (¢/kWh) 3.48 6.25
3.82
47
Production COE (¢/kWh) 2.84
$/ton CO2 Avoideda -
Cap
ital (
$/kW
)

32
Oxyfuel Incremental COE Distribution
34.8 34.8
9.5 9.5
18.9 18.9
12.2
14.8
7.92.9
3.6
0
20
40
60
80
100
120
Case 1 No capture Case 5 Oxycombustion
CO
E (m
ills/
kWh)
TS&M
Compress. power
Compress. capital
ASU power
ASU capital
Fuel
Operating
Capital
ASU = 27
Compression = 11.5
Trans. Stor.& Monit. = 2.9
33
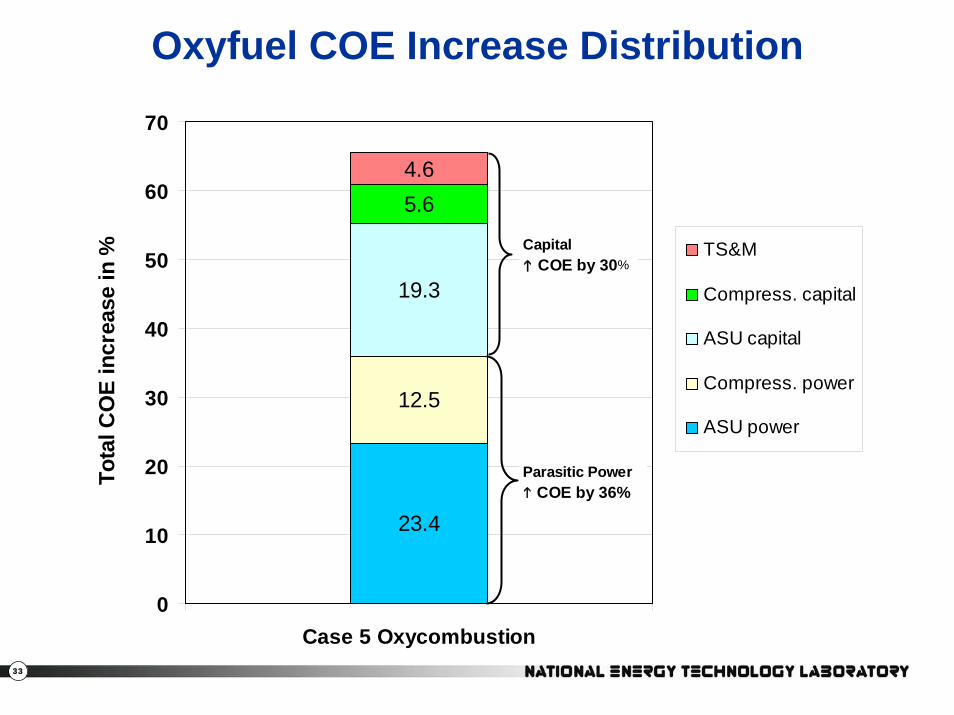
Oxyfuel COE Increase Distribution
23.4
12.5
19.3
5.64.6
0
10
20
30
40
50
60
70
Case 5 Oxycombustion
Tota
l CO
E in
crea
se in
% TS&M
Compress. capital
ASU capital
Compress. power
ASU power
Parasitic Power COE by 36%
Capital COE by 30%
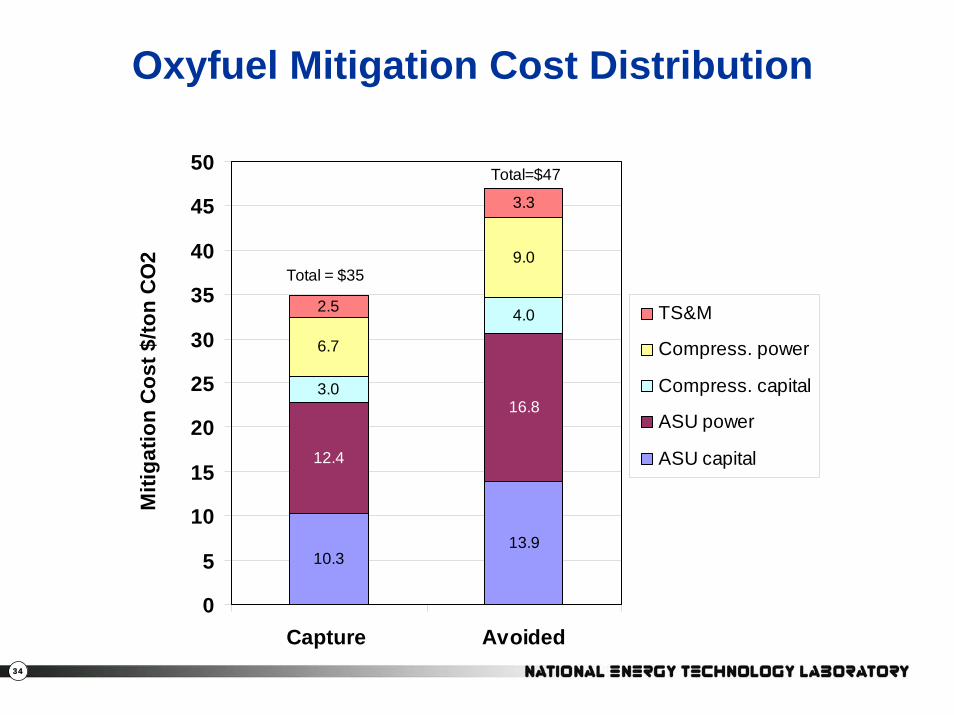
34
Oxyfuel Mitigation Cost Distribution
10.313.9
12.4
16.83.0
4.0
6.7
9.0
2.5
3.3
0
5
10
15
20
25
30
35
40
45
50
Capture Avoided
Miti
gatio
n C
ost $
/ton
CO
2
TS&M
Compress. power
Compress. capital
ASU power
ASU capital
Total = $35
Total=$47
35
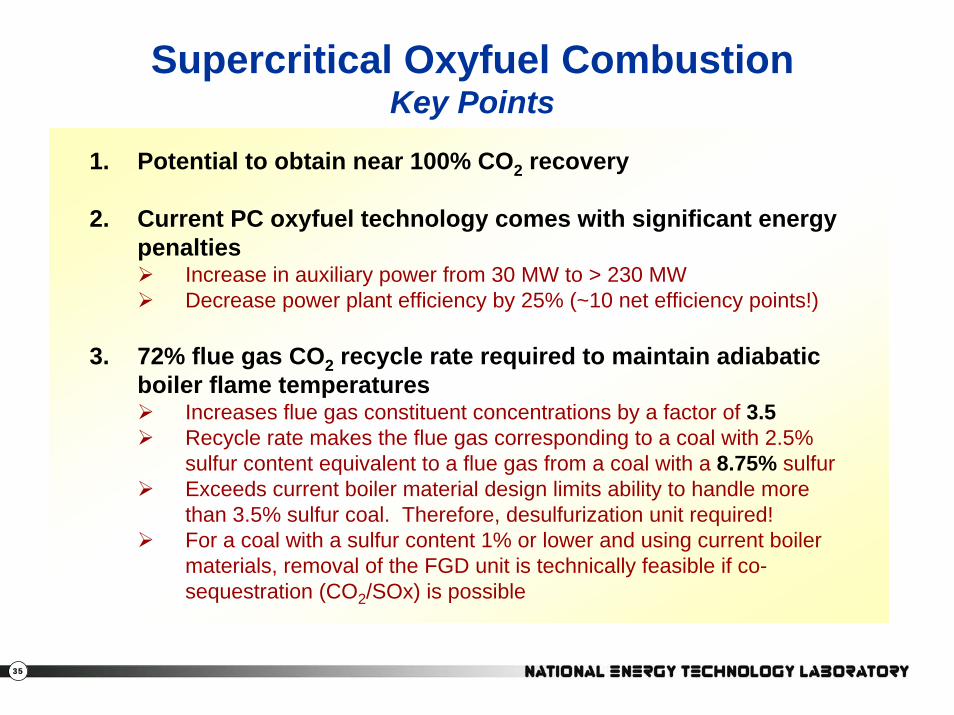
Supercritical Oxyfuel CombustionKey Points
1. Potential to obtain near 100% CO2 recovery
2. Current PC oxyfuel technology comes with significant energy penalties
Increase in auxiliary power from 30 MW to > 230 MWDecrease power plant efficiency by 25% (~10 net efficiency points!)
3. 72% flue gas CO2 recycle rate required to maintain adiabatic boiler flame temperatures
Increases flue gas constituent concentrations by a factor of 3.5Recycle rate makes the flue gas corresponding to a coal with 2.5% sulfur content equivalent to a flue gas from a coal with a 8.75% sulfur Exceeds current boiler material design limits ability to handle more than 3.5% sulfur coal. Therefore, desulfurization unit required!For a coal with a sulfur content 1% or lower and using current boiler materials, removal of the FGD unit is technically feasible if co-sequestration (CO2/SOx) is possible
36
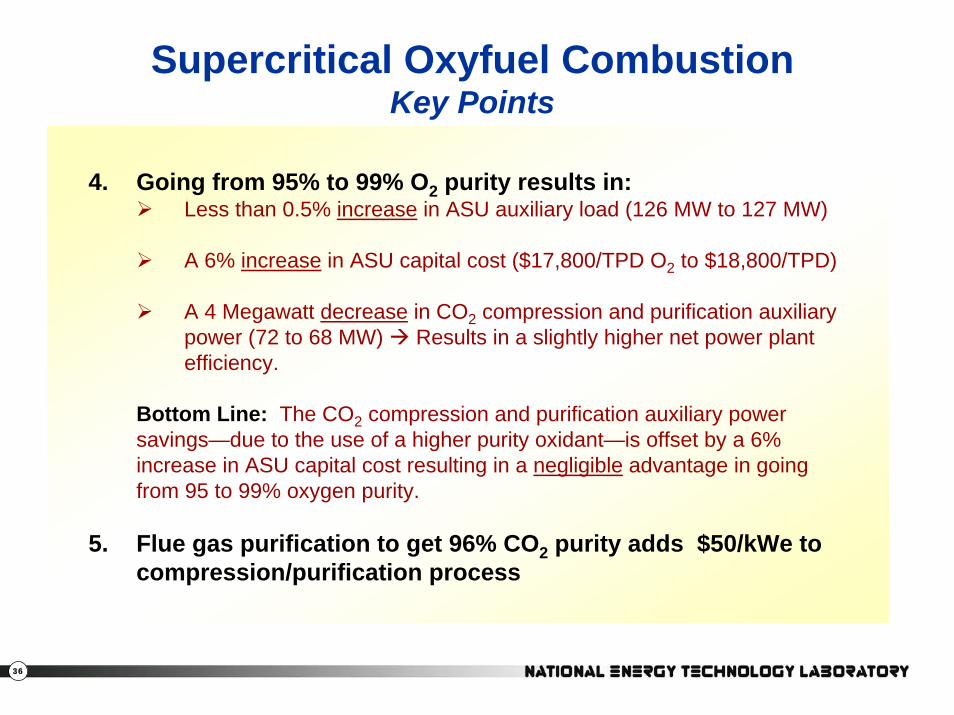
Supercritical Oxyfuel CombustionKey Points
4. Going from 95% to 99% O2 purity results in:Less than 0.5% increase in ASU auxiliary load (126 MW to 127 MW)
A 6% increase in ASU capital cost ($17,800/TPD O2 to $18,800/TPD)
A 4 Megawatt decrease in CO2 compression and purification auxiliary power (72 to 68 MW) Results in a slightly higher net power plant efficiency.
Bottom Line: The CO2 compression and purification auxiliary power savings—due to the use of a higher purity oxidant—is offset by a 6% increase in ASU capital cost resulting in a negligible advantage in going from 95 to 99% oxygen purity.
5. Flue gas purification to get 96% CO2 purity adds $50/kWe to compression/purification process
37
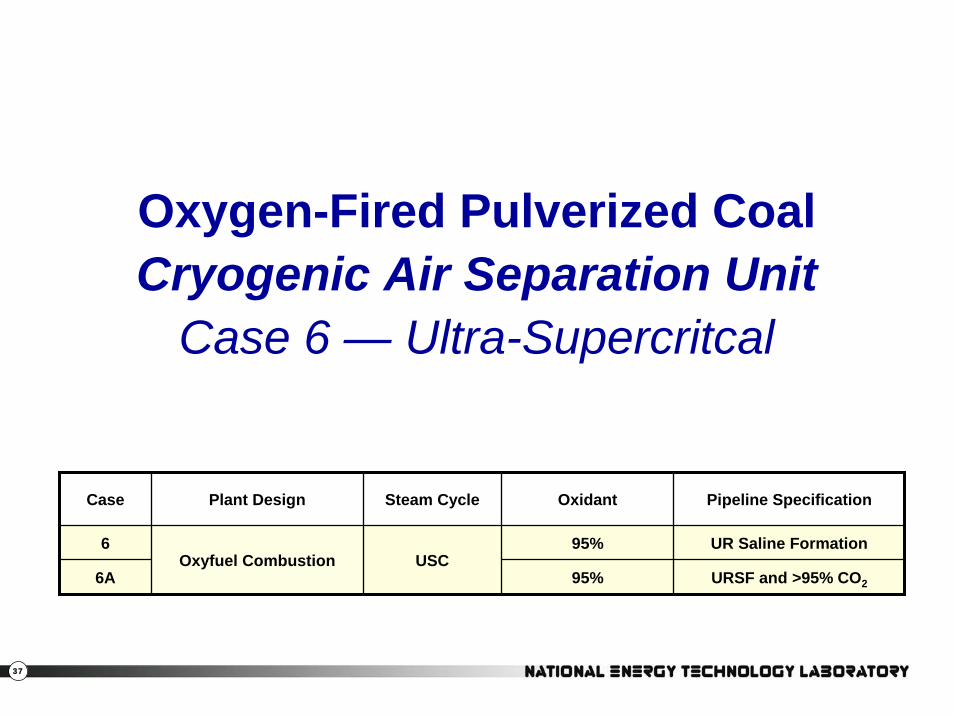
Oxygen-Fired Pulverized CoalCryogenic Air Separation Unit
Case 6 — Ultra-Supercritcal
Case Plant Design Steam Cycle Oxidant Pipeline Specification
UR Saline FormationOxyfuel Combustion
URSF and >95% CO2
6 95%
6AUSC
95%
38
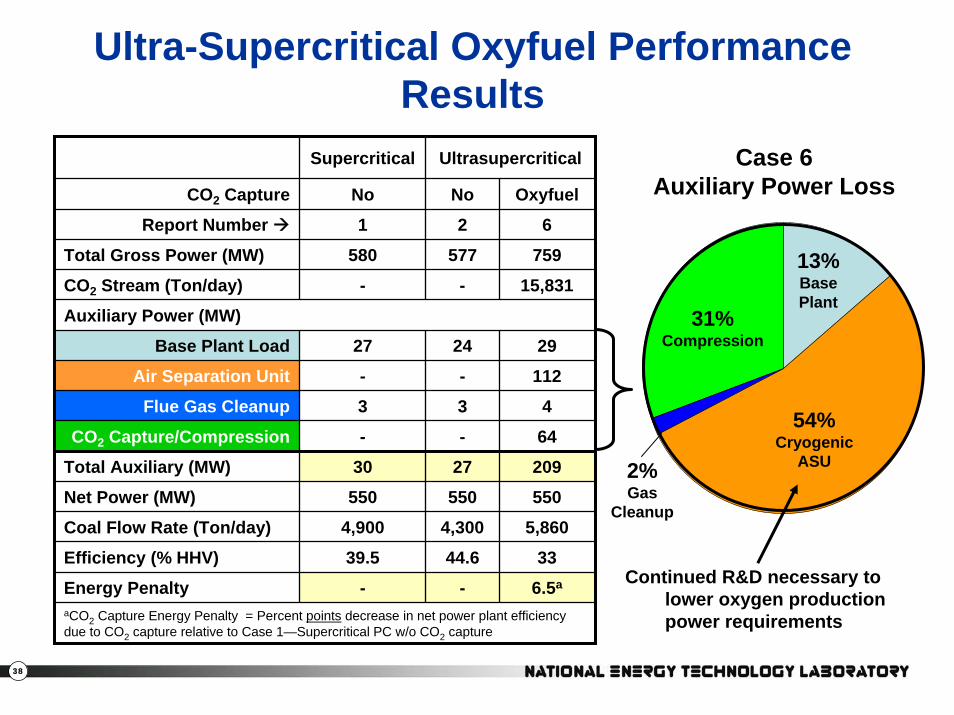
Ultra-Supercritical Oxyfuel Performance Results
Supercritical Ultrasupercritical
CO2 Capture No No Oxyfuel
Report Number 1 2 6
580
-
27
-
3
-
30
550
4,900
39.5
-
CO2 Stream (Ton/day) - 15,831
aCO2 Capture Energy Penalty = Percent points decrease in net power plant efficiency due to CO2 capture relative to Case 1—Supercritical PC w/o CO2 capture
Total Gross Power (MW) 577 759
Auxiliary Power (MW)
Base Plant Load 24 29
112
4
64
209
550
5,860
33
6.5a
Net Power (MW) 550
Coal Flow Rate (Ton/day) 4,300
Efficiency (% HHV) 44.6
Air Separation Unit -
Flue Gas Cleanup 3
CO2 Capture/Compression -
Total Auxiliary (MW) 27
Energy Penalty -
31%Compression
2%Gas
Cleanup
13%BasePlant
54%Cryogenic
ASU
Case 6 Auxiliary Power Loss
Continued R&D necessary to lower oxygen production power requirements
39
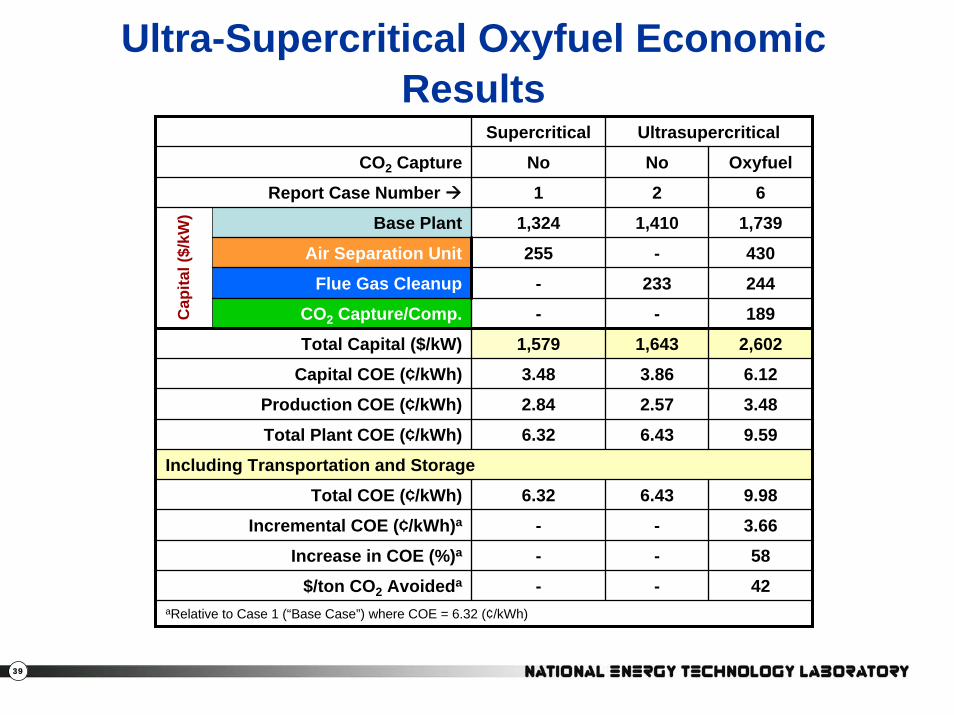
Ultra-Supercritical Oxyfuel Economic Results
Supercritical Ultrasupercritical
CO2 Capture No No Oxyfuel
Report Case Number 1 2 6
Base Plant 1,324 1,410 1,739
Air Separation Unit
Flue Gas Cleanup
CO2 Capture/Comp.
430
244
189
2,602
6.12
3.48
9.59
9.98
3.66
58
42aRelative to Case 1 (“Base Case”) where COE = 6.32 (¢/kWh)
255 -
- 233
- -
Total Plant COE (¢/kWh) 6.32 6.43
Including Transportation and Storage
Total COE (¢/kWh) 6.32 6.43
Incremental COE (¢/kWh)a - -
Increase in COE (%)a - -
Total Capital ($/kW) 1,579 1,643
Capital COE (¢/kWh) 3.48 3.86
2.57
-
Production COE (¢/kWh) 2.84
$/ton CO2 Avoideda -
Cap
ital (
$/kW
)
40
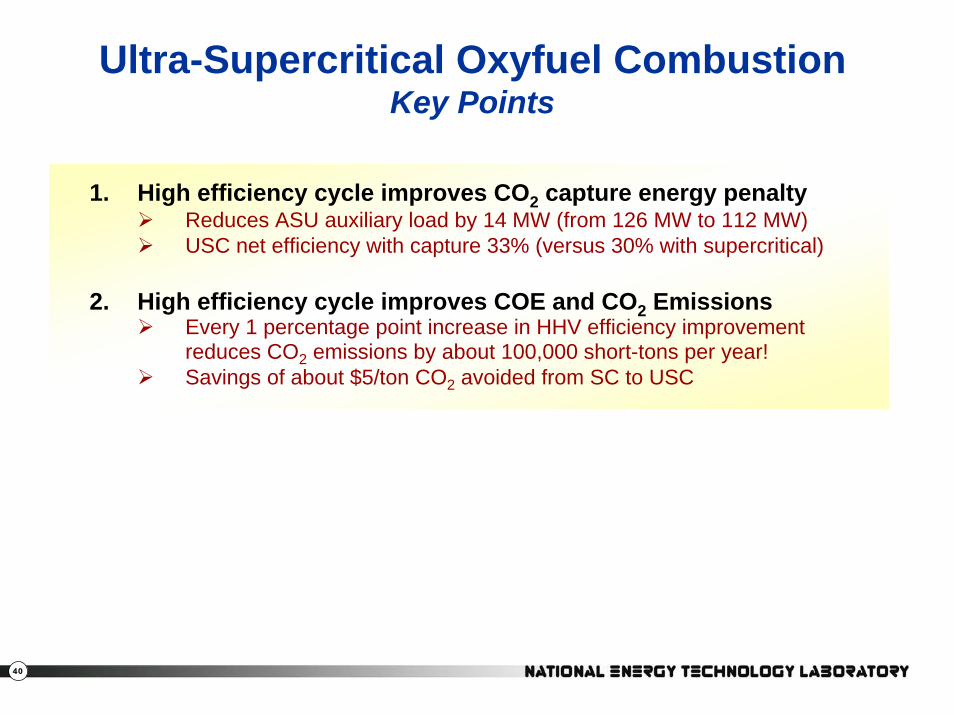
Ultra-Supercritical Oxyfuel CombustionKey Points
1. High efficiency cycle improves CO2 capture energy penaltyReduces ASU auxiliary load by 14 MW (from 126 MW to 112 MW)USC net efficiency with capture 33% (versus 30% with supercritical)
2. High efficiency cycle improves COE and CO2 EmissionsEvery 1 percentage point increase in HHV efficiency improvement reduces CO2 emissions by about 100,000 short-tons per year!Savings of about $5/ton CO2 avoided from SC to USC
41
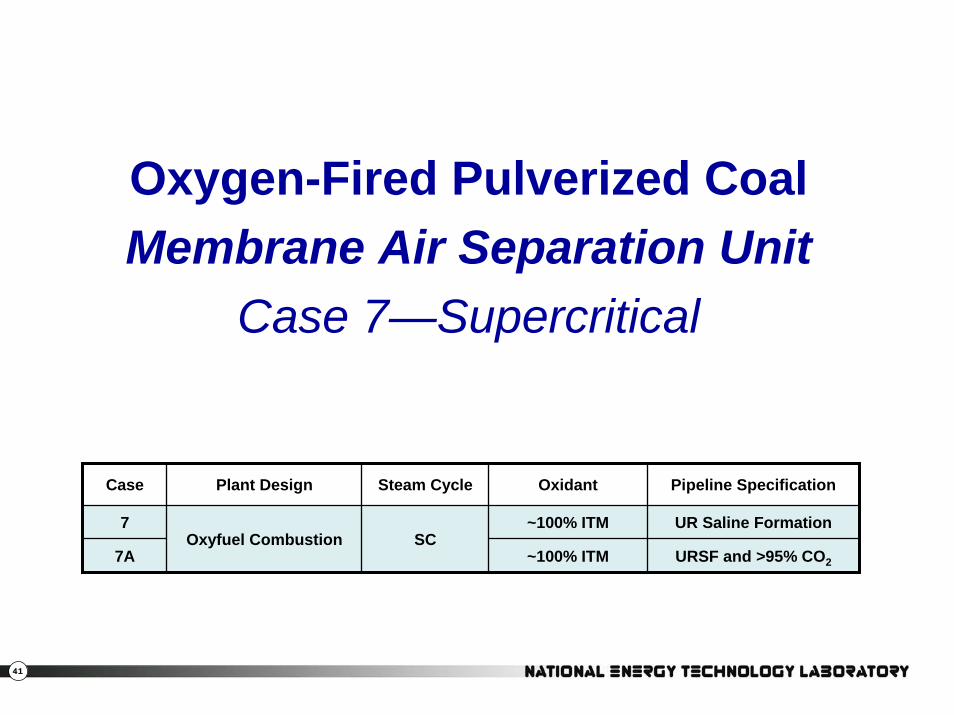
Oxygen-Fired Pulverized CoalMembrane Air Separation Unit
Case 7—Supercritical
Case Plant Design Steam Cycle Oxidant Pipeline Specification
UR Saline FormationOxyfuel Combustion
URSF and >95% CO2
7 ~100% ITM
7ASC
~100% ITM
42
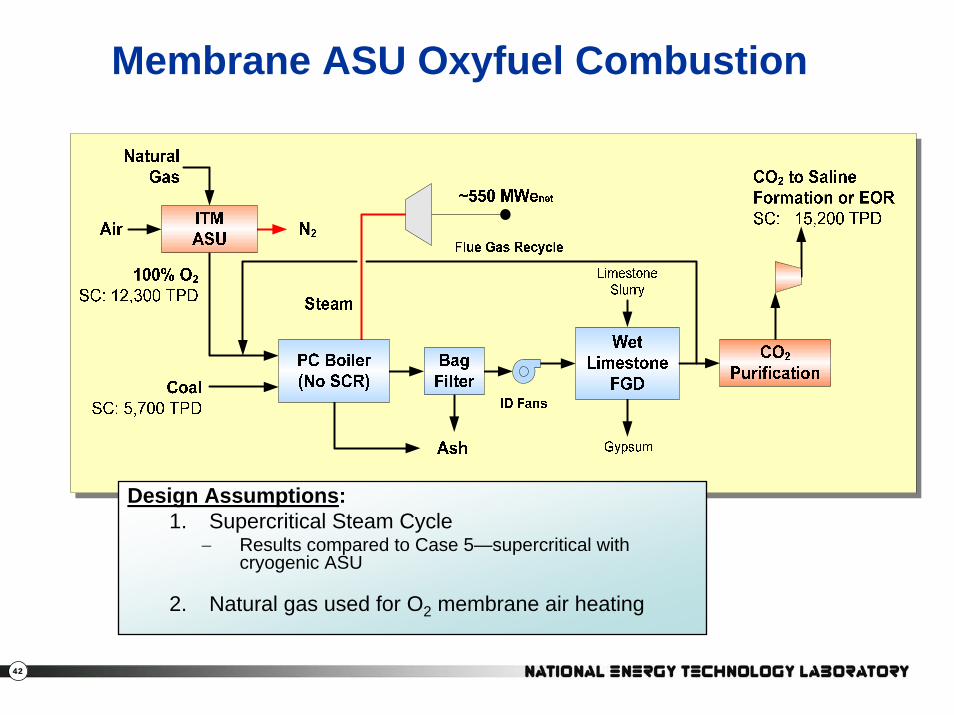
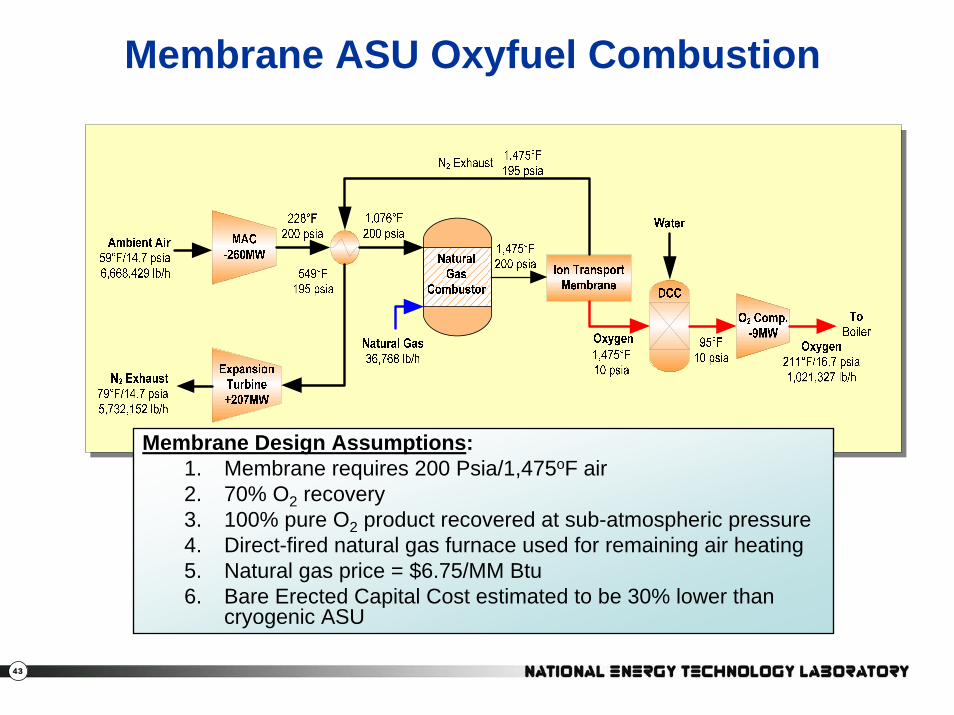
Membrane ASU Oxyfuel Combustion
Design Assumptions:1. Supercritical Steam Cycle
− Results compared to Case 5—supercritical with cryogenic ASU
2. Natural gas used for O2 membrane air heating
43
Membrane ASU Oxyfuel Combustion
Membrane Design Assumptions:1. Membrane requires 200 Psia/1,475oF air2. 70% O2 recovery3. 100% pure O2 product recovered at sub-atmospheric pressure4. Direct-fired natural gas furnace used for remaining air heating5. Natural gas price = $6.75/MM Btu6. Bare Erected Capital Cost estimated to be 30% lower than
cryogenic ASU
44
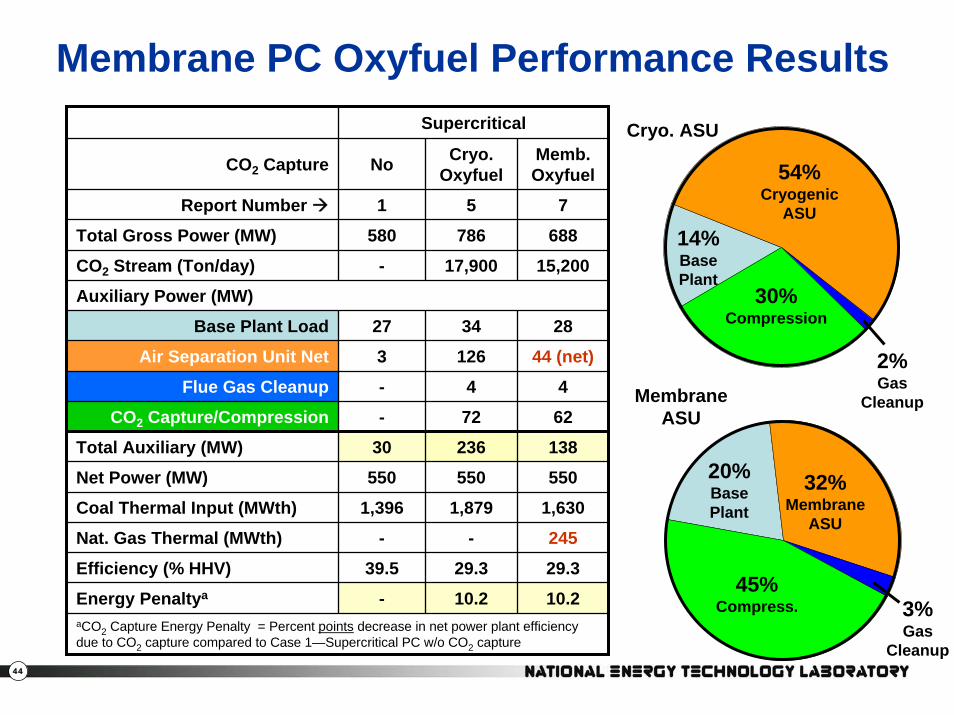
Membrane PC Oxyfuel Performance ResultsSupercritical
CO2 Capture No Cryo. Oxyfuel
Memb. Oxyfuel
Report Number 1 5 7
688
CO2 Stream (Ton/day) - 17,900 15,200
28
44 (net)
4
62
138
550
1,630
Nat. Gas Thermal (MWth) - - 245
29.3
10.2aCO2 Capture Energy Penalty = Percent points decrease in net power plant efficiency due to CO2 capture compared to Case 1—Supercritical PC w/o CO2 capture
Total Gross Power (MW) 580 786
Auxiliary Power (MW)
Base Plant Load 27 34
126
4
72
236
550
1,879
29.3
10.2
CO2 Capture/Compression -
Net Power (MW) 550
Coal Thermal Input (MWth) 1,396
Efficiency (% HHV) 39.5
Air Separation Unit Net 3
Flue Gas Cleanup -
Total Auxiliary (MW) 30
Energy Penaltya -
30%
9%
35%
1%
Cryo. ASU
30%Compression
2%Gas
Cleanup
54%Cryogenic
ASU14%BasePlant
30%
35%
1%
Membrane ASU
32%Membrane
ASU
3%Gas
Cleanup
20%BasePlant
45%Compress.
45
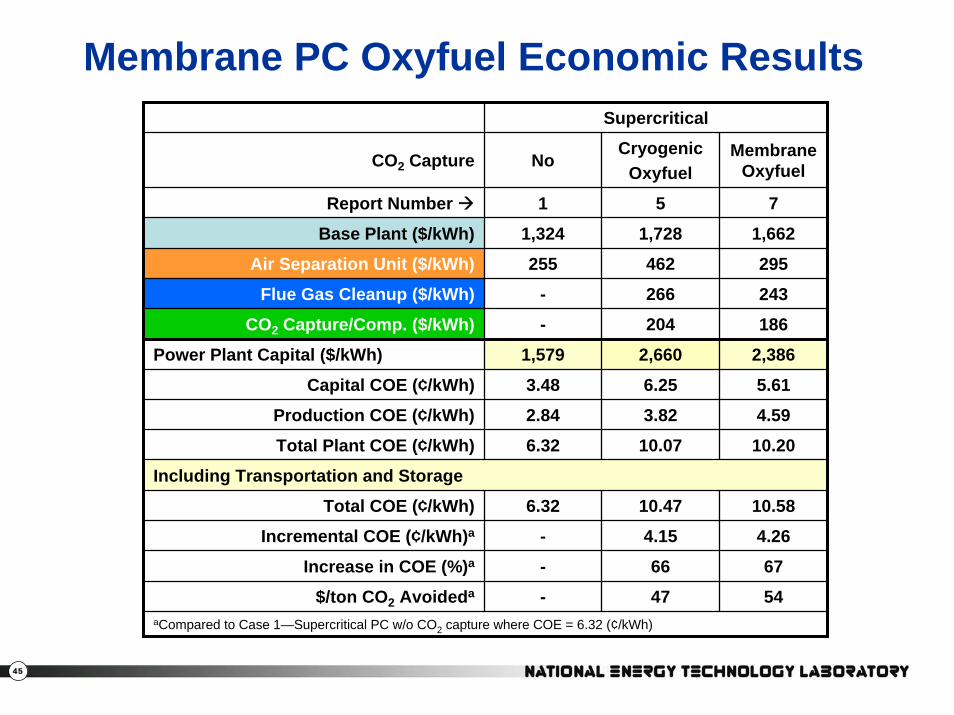
Membrane PC Oxyfuel Economic ResultsSupercritical
CO2 Capture NoCryogenic
OxyfuelMembrane
Oxyfuel
Report Number 1 5
1,728
462
266
204
2,660
6.25
3.82
10.07
10.47
4.15
66
47
7
Base Plant ($/kWh) 1,324 1,662
aCompared to Case 1—Supercritical PC w/o CO2 capture where COE = 6.32 (¢/kWh)
Air Separation Unit ($/kWh) 255 295
Flue Gas Cleanup ($/kWh) - 243
CO2 Capture/Comp. ($/kWh) - 186
Total Plant COE (¢/kWh) 6.32 10.20
Including Transportation and Storage
Total COE (¢/kWh) 6.32 10.58
Incremental COE (¢/kWh)a - 4.26
Increase in COE (%)a - 67
Power Plant Capital ($/kWh) 1,579 2,386
Capital COE (¢/kWh) 3.48 5.61
4.59
54
Production COE (¢/kWh) 2.84
$/ton CO2 Avoideda -
46
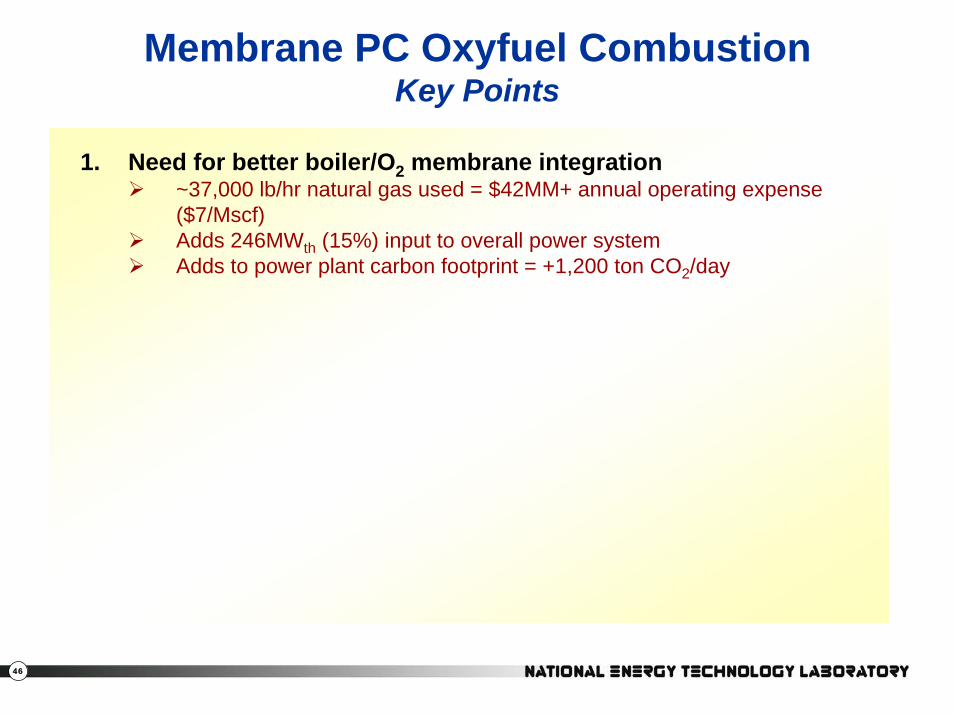
Membrane PC Oxyfuel CombustionKey Points
1. Need for better boiler/O2 membrane integration~37,000 lb/hr natural gas used = $42MM+ annual operating expense($7/Mscf)Adds 246MWth (15%) input to overall power systemAdds to power plant carbon footprint = +1,200 ton CO2/day
47
Results Summary
48
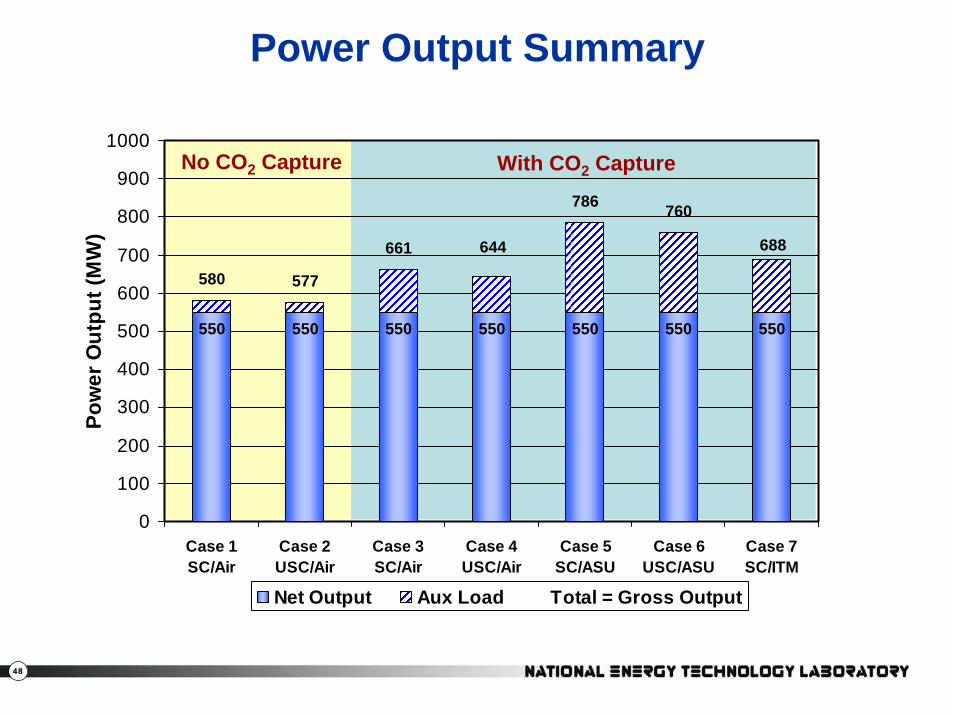
Power Output Summary
No CO2 Capture With CO2 Capture
550 550 550 550 550 550 550
580 577
661
786 760
688644
0
100
200
300
400
500
600
700
800
900
1000
Case 1SC/Air
Case 2USC/Air
Case 3SC/Air
Case 4USC/Air
Case 5SC/ASU
Case 6USC/ASU
Case 7SC/ITM
Pow
er O
utpu
t (M
W)
Net Output Aux Load Total = Gross Output
49
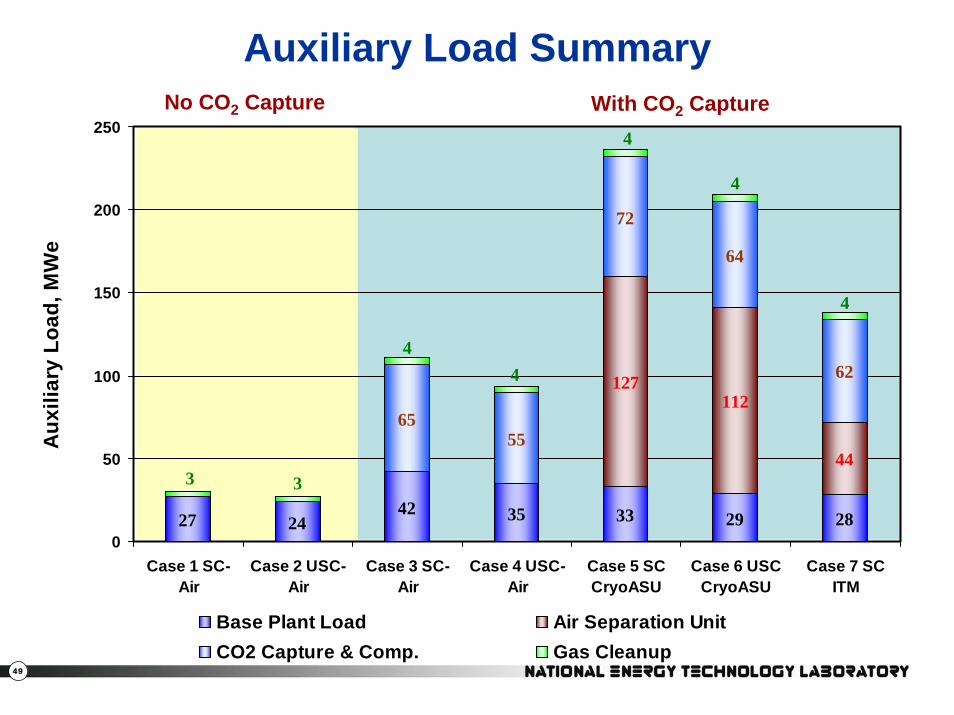
27 2442 35 33 29 28
127112
44
6555
72
64
6244
33
4
4
4
0
50
100
150
200
250
Case 1 SC-Air
Case 2 USC-Air
Case 3 SC-Air
Case 4 USC-Air
Case 5 SCCryoASU
Case 6 USCCryoASU
Case 7 SCITM
Aux
iliar
y Lo
ad, M
We
Base Plant Load Air Separation Unit CO2 Capture & Comp. Gas Cleanup
No CO2 Capture With CO2 Capture
Auxiliary Load Summary
50
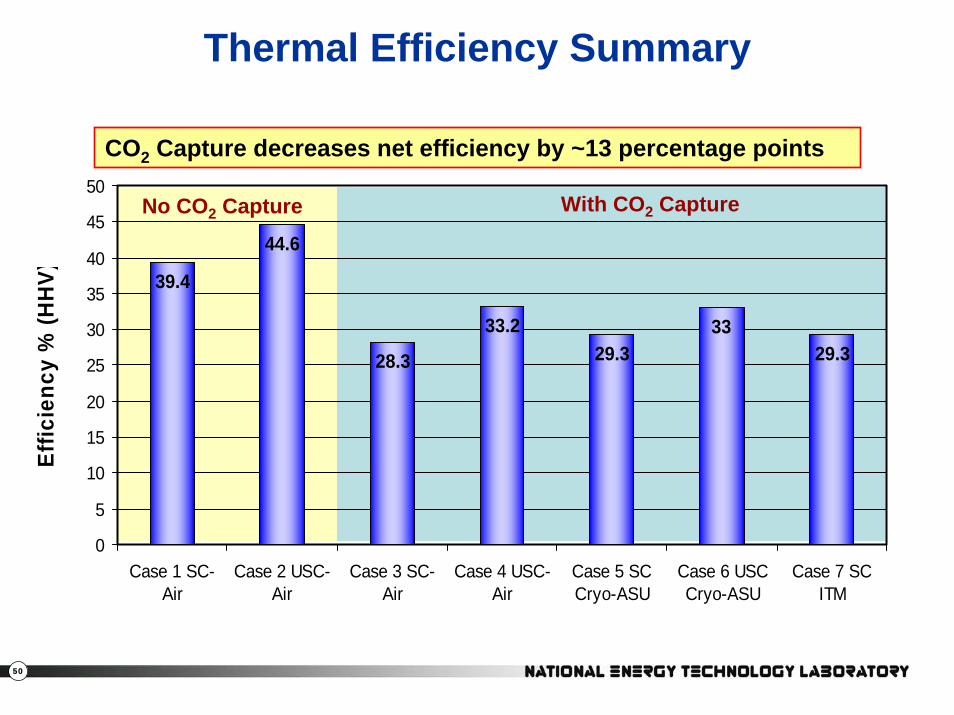
39.4
44.6
28.3
33.229.3
3329.3
0
5
10
15
20
25
30
35
40
45
50
Case 1 SC-Air
Case 2 USC-Air
Case 3 SC-Air
Case 4 USC-Air
Case 5 SCCryo-ASU
Case 6 USCCryo-ASU
Case 7 SCITM
Effic
ienc
y %
(HH
V)
CO2 Capture decreases net efficiency by ~13 percentage points
No CO2 Capture With CO2 Capture
Thermal Efficiency Summary
51
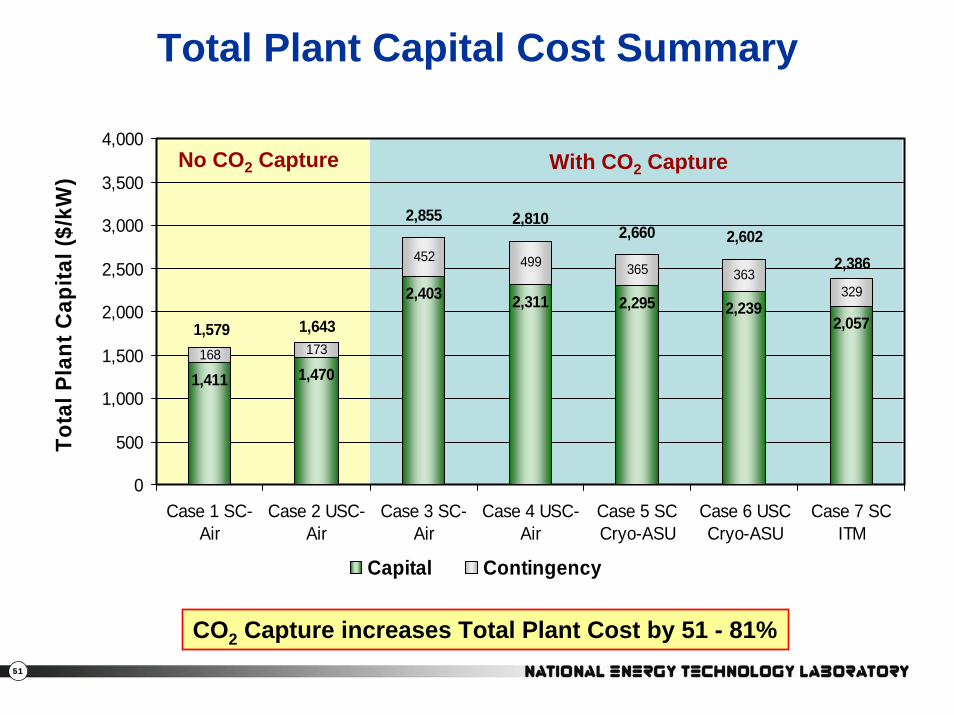
1,411 1,470
2,403 2,311 2,295 2,2392,057
168 173
452 499 365 363329
2,855 2,8102,660 2,602
1,579 1,643
2,386
0
500
1,000
1,500
2,000
2,500
3,000
3,500
4,000
Case 1 SC-Air
Case 2 USC-Air
Case 3 SC-Air
Case 4 USC-Air
Case 5 SCCryo-ASU
Case 6 USCCryo-ASU
Case 7 SCITM
Tota
l Pla
nt C
apita
l ($/
kW)
Capital Contingency
No CO2 Capture With CO2 Capture
Total Plant Capital Cost Summary
CO2 Capture increases Total Plant Cost by 51 - 81%
52
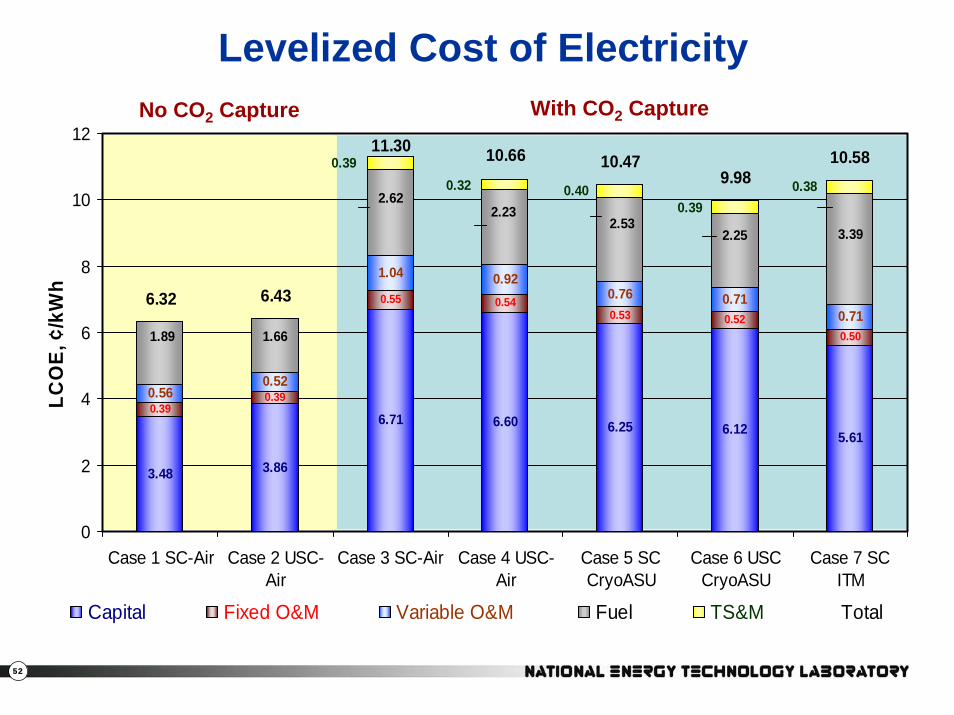
3.48 3.86
6.71 6.60 6.25 6.12 5.61
0.390.39
0.55 0.540.53 0.52
0.50
0.560.52
1.04 0.920.76 0.71
0.71
2.232.62
1.661.89
2.532.25 3.39
0.380.39
0.400.320.39
6.32 6.43
10.66 10.479.98
10.5811.30
0
2
4
6
8
10
12
Case 1 SC-Air Case 2 USC-Air
Case 3 SC-Air Case 4 USC-Air
Case 5 SCCryoASU
Case 6 USCCryoASU
Case 7 SCITM
LCO
E, ¢
/kW
h
Capital Fixed O&M Variable O&M Fuel TS&M Total
Levelized Cost of ElectricityNo CO2 Capture With CO2 Capture
53
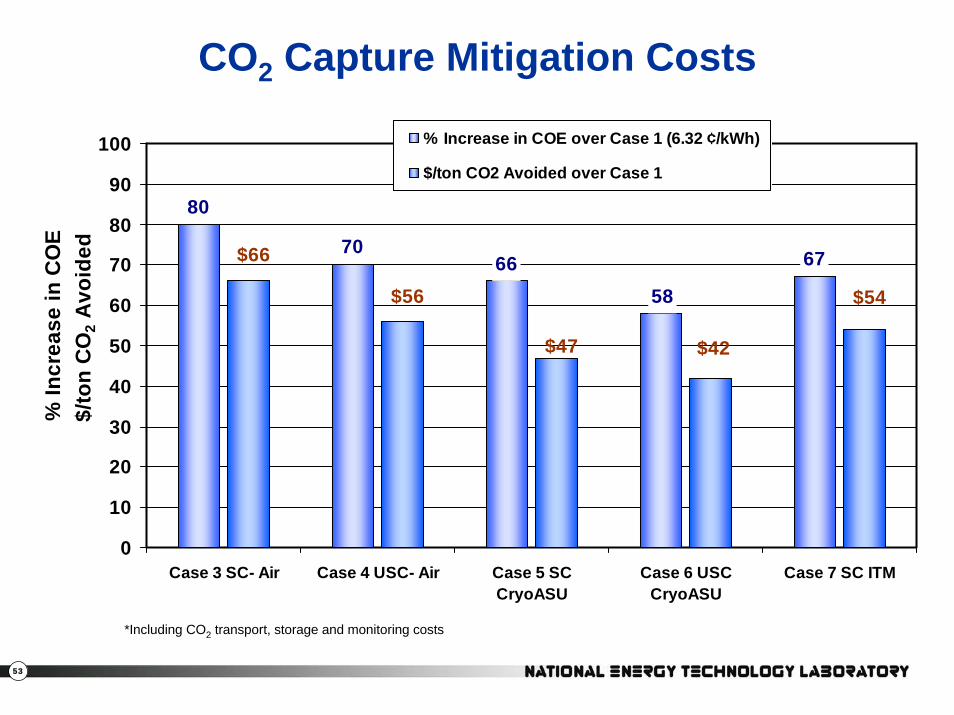
80
70 67
5866
$54
$42$47
$66
$56
0
10
20
30
40
50
60
70
80
90
100
Case 3 SC- Air Case 4 USC- Air Case 5 SCCryoASU
Case 6 USCCryoASU
Case 7 SC ITM
% Increase in COE over Case 1 (6.32 ¢/kWh)
$/ton CO2 Avoided over Case 1
% In
crea
se in
CO
E $/
ton
CO
2 Avo
ided
CO2 Capture Mitigation Costs
*Including CO2 transport, storage and monitoring costs
54
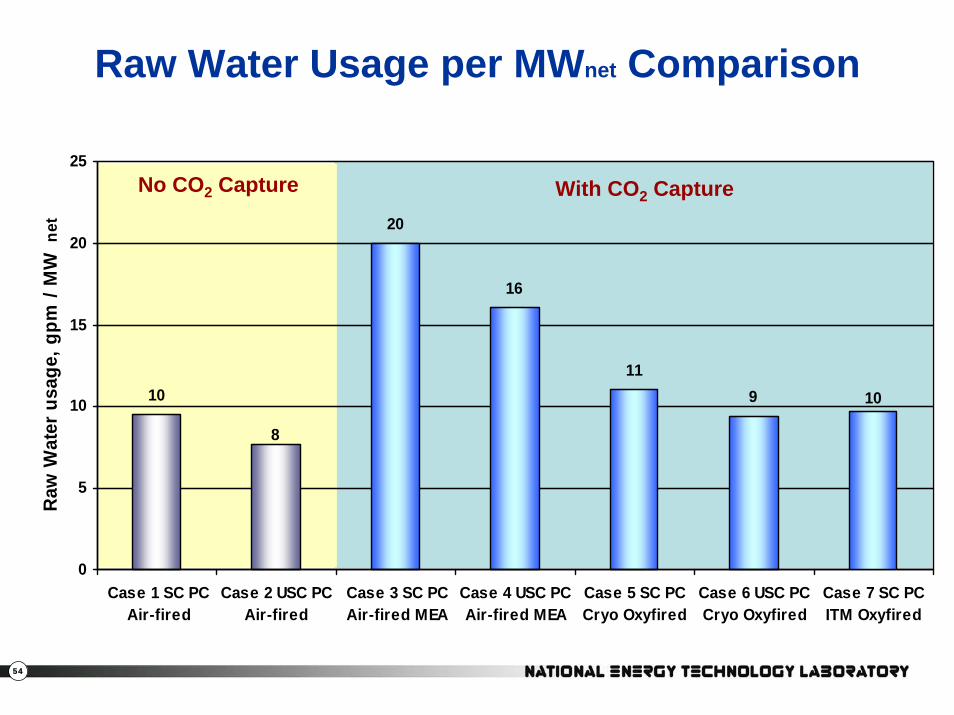
Raw Water Usage per MWnet Comparison
No CO2 Capture With CO2 Capture
10
20
16
119 10
8
0
5
10
15
20
25
Case 1 SC PCAir-fired
Case 2 USC PCAir-fired
Case 3 SC PCAir-fired MEA
Case 4 USC PCAir-fired MEA
Case 5 SC PCCryo Oxyfired
Case 6 USC PCCryo Oxyfired
Case 7 SC PCITM Oxyfired
Raw
Wat
er u
sage
, gpm
/ M
Wne
t
55
NETL Viewpoint
• Most up-to-date performance and costs for PC oxyfuelcombustion available in public literature to date
• Establishes baseline performance and cost estimates for current state of PC oxyfuel combustion technology
• Fossil Energy RD&D aimed at improving performance and cost of clean coal power systems including development of new approaches to capture and sequester greenhouse gases