use of coal drying to reduce water consumed in pulverized ......
TRANSCRIPT
USE OF COAL DRYING TO REDUCE WATER CONSUMED IN PULVERIZED COAL POWER PLANTS
FINAL REPORT
December 2, 2002 to March 31, 2006
by
Edward K. Levy Nenad Sarunac Harun Bilirgen Hugo Caram
Report Issued March, 2006
DOE Award Number DE-FC26-03NT41729
Energy Research Center Lehigh University 117 ATLSS Drive
Bethlehem, PA 18015

ii
DISCLAIMER
“This report was prepared as an account of work sponsored by an agency of the
United States Government. Neither the United States Government nor any agency
thereof, nor any of their employees, makes any warranty, express or implied, or
assumes any legal liability or responsibility for the accuracy, completeness, or
usefulness of any information, apparatus, product, or process disclosed, or represents
that its use would not infringe privately owned rights. Reference herein to any specific
commercial product, process, or service by trade name, trademark, manufacturer, or
otherwise does not necessarily constitute or imply its endorsement, recommendation, or
favoring by the United States Government or any agency thereof. The views and
opinions of authors expressed herein do not necessarily state or reflect those of the
United States Government or any agency thereof.”
iii
ACKNOWLEDGEMENTS
The authors are grateful to Gu Feng, Wei Zhang, and Yao Zheng, for their
assistance in performing the laboratory drying tests and in analyzing and interpreting
the data, and to John Sale and Ursla Levy, who made important contributions to the
economic analysis of coal drying. Finally, we are grateful to Great River Energy for
providing partial financial support for this project.
iv
ABSTRACT
U.S. low rank coals contain relatively large amounts of moisture, with the
moisture content of subbituminous coals typically ranging from 15 to 30 percent and that
for lignites from 25 and 40 percent. High fuel moisture has several adverse impacts on
the operation of a pulverized coal generating unit, for it can result in fuel handling
problems and it affects heat rate, stack emissions and maintenance costs.
Theoretical analyses and coal test burns performed at a lignite fired power plant
show that by reducing the fuel moisture, it is possible to improve boiler performance and
unit heat rate, reduce emissions and reduce water consumption by the evaporative
cooling tower. The economic viability of the approach and the actual impact of the
drying system on water consumption, unit heat rate and stack emissions will depend
critically on the design and operating conditions of the drying system.
The present project evaluated the low temperature drying of high moisture coals
using power plant waste heat to provide the energy required for drying. Coal drying
studies were performed in a laboratory scale fluidized bed dryer to gather data and
develop models on drying kinetics. In addition, analyses were carried out to determine
the relative costs and performance impacts (in terms of heat rate, cooling tower water
consumption and emissions) of drying along with the development of optimized drying
system designs and recommended operating conditions.
v
TABLE OF CONTENTS
Page
INTRODUCTION 1
BACKGROUND 1
PREVIOUS WORK 2
THIS INVESTIGATION 3
EXECUTIVE SUMMARY 7
BACKGROUND 7
RESULTS 7
Effects of Process Parameters and Coal Type on Drying Rate 7
Impacts of Coal Drying on Unit Operations 7
Economic Evaluation 8
Additional Comments 9
PART I – EFFECTS OF PROCESS PARAMETERS AND COAL TYPE ON 10 COAL DRYING RATE
EXPERIMENTAL 10
Test Apparatus 10
Test Procedure 11
Results and Discussion 12
Drying Rate Data 14
Lignite Coal 14
Repeatability and Data Consistency 15
Drying Rates with PRB Coal 19
Effect of Inlet Air Humidity on Drying Rate 21
Theoretical Model of Drying Process 25
Effect of Specific Humidity of Inlet Air on Equilibrium Moisture 26 Curve
Drying Model for Continuously Operating Dryer 30
Comparisons of Drying Model and Pilot Dryer Data 33
PART II – IMPACTS OF COAL DRYING ON UNIT OPERATIONS 39
INTRODUCTION 39
vi
TABLE OF CONTENTS (continued)
Page
ANALYSIS METHODOLOGY AND ASSUMPTIONS 41
Fuel 41
Dryer Design 41
Air Preheater (APH) 41
Fan Power 42
Mill Power 42
Combustion Calculations 43
Energy Balance 45
RESULTS FOR LIGNITE 45
REDUCTION OF COOLING TOWER MAKEUP WATER 51
COMPARISON BETWEEN LIGNITE AND PRB COALS 56
PART III – ECONOMIC EVALUATION 63
INTRODUCTION 63
INSTALLED EQUIPMENT COSTS 63
ANNUAL FIXED AND O&M COSTS 67
Costs Due to Increased Station Service Power 69
FINANCIAL BENEFITS 74
Reduced Fuel Costs 74
Reduced Ash Disposal Costs 74
Avoided Costs of Emissions Control 75
Water Savings 77
Mill Maintenance and Availability 78
TOTAL FINANCIAL BENEFITS DUE TO COAL DRYING 79
COMPARISON OF COSTS AND BENEFITS 82
CONCLUSIONS 84
Effects of Process Parameters and Coal Type on Coal Drying Rate 84
Impacts of Coal Drying on Unit Operations 85
Economic Evaluation 87
vii
TABLE OF CONTENTS (continued)
Page
Additional Comments 89
REFERENCES 90
NOMENCLATURE 91
viii
LIST OF FIGURES Figure Page 1 Schematic of Plant Layout, Showing Air Heater and Coal 2 Dryer
2 The Effects of Coal Moisture on Cooling Tower Makeup Water 3
3 Improvement in Net Unit Heat Rate Versus Reduction in Coal 4 Moisture Content
4 Project Schedule 6
5 Sketch of Experimental Bed Setup 10
6 Size Distribution of the Coal 13
7 Moisture Content Versus Time 14
8 Relationship Between Γ and y 15
9 Drying Rate Versus Velocity – Repeatability Tests 15
10 Mass Balance Check 17
11 Drying Rate as a Function of Superficial Air Velocity and Particle Size 17
12 Effect of Bed and Inlet Air Temperature on Drying Rate 18
13 Equilibrium Relative Humidity of Air Versus Moisture Content of 19 Lignite
14 Moisture Content Versus Time – PRB Coal 20
15 Drying Rate Versus Velocity – PRB Coal 20
16 Comparison of Drying Curves for Lignite and PRB Coals for a 66°C 21 Drying Temperature
17 Γ Versus Tlog (φ) – Equilibrium Coal Moisture 22
18 Coal Moisture Content Versus Time – PRB 22
19 Bed Temperature Versus Time – PRB 23
20 Relative Humidity Versus Time – PRB 23
21 Drying Rate Versus Inlet Humidity – PRB 24
22 Drying Rate Versus Inlet Humidity – Lignite 24
23 Sketch of Dryer Model 26
24 Lignite Drying Curve for Test 36 – Comparison Between Theory 27 and Experiment
ix
LIST OF FIGURES (continued) Figure Page 25 Exit Air Temperature for Test 36 – Comparison Between Theory and 27 Experiment
26 Exit Air Specific Humidity for Test 36 – Comparison Between Theory 28 Experiment
27 Exit Air Relative Humidity for Test 36 – Comparison Between Theory 28 and Experiment
28 Equilibrium Moisture Curve for Lignite Based on Data Obtained with 29 Low Inlet Air Specific Humidity
29 Effect of Inlet Air Specific Humidity on Equilibrium Moisture Curve 29
30 Effect of Inlet Air Specific Humidity on Equilibrium Moisture Data 30 Data for PRB Coal
31 Sketch of Continuous Flow Dryer 31
32 Axial Variation of Coal Moisture Content for Test #23. (At ξ=1, 33 '=0.15 from simulation and 0.18 from experiment.)
33 Axial Variation of Bed Temperature and Exit Air Temperature for 34 Test #23. (Average Exit Air Temperature = 38°C from Simulation
and 37°C from Experiment.)
34 Axial Variation of Exit Air Specific Humidity for Test #23. (Average 34 Exit Air Specific Humidity = 0.027 from Simulation and 0.027 from
Experiment.)
35 Axial Variation of Exit Air Relative Humidity for Test #23. 35 (Average Exit Air Relative Humidity = 0.67 from Simulation
and 0.67 from Experiment.)
36 Comparison of Predicted Versus Measured Values – Change 36 in Coal Moisture, (Γ1 - Γ2).
37 Comparison of Predicted Versus Measured Values – Average Outlet 37 Specific Humidity
38 Comparison of Predicted Versus Measured Values – Average Bed 37 Temperature and Exit Air Temperature
39 Comparison of Predicted Versus Measured Values – Average 38 Outlet Relative Humidity
40 Basic Power Plant Configuration Used in Study 40
x
LIST OF FIGURES (continued) Figure Page 41 Sketch of Continuous Flow Dryer 42
42a Effect of Lignite Feed Moisture on Gross Pulverizer Power 44 (kWhr/ton). Adapted from Data by Ellman et al. (Reference 7).
42b Effect of Lignite Feed Moisture on Relative Pulverizer Power 44 (kWhr/ton).
43 Flue Gas Temperature Entering ID Fan. 46
44 Flue Gas Flow Rate at ID Fan Inlet. 46
45 Boiler Efficiency. 47
46 FD Fan Power. 48
47 ID Fan Power. 49
48 Fluidizing Air Fan Power. 49
49 Mill Power. 50
50 Station Service Power. 50
51 Net Unit Heat Rate. 51
52 Flue Gas Temperature Entering ID Fan. 52
53 Rate of Heat Removal From Hot Circulating Cooling Water. 52
54 Ratio of Heat Rejected by Cooling Tower to Heat Rejected by Steam 54 Condenser.
55 Reduction in Cooling Tower Water Evaporation Loss. 54
56 Variation of Cooling Tower Water Evaporation Rate with Season of 55 Year.
57 Effect of Time of Year on Cooling Tower Evaporation Rate. CCW 55 Drying System.
58 Effect of Coal Product Moisture and Time of Year on Reduction 56 of Cooling Tower Makeup Water. CCW Drying System.
59 Effect of Coal Moisture Content and Coal Type on Mass Ratio 57 of Flue Gas to Coal Flow Rates
60 Effect of Coal Moisture and Coal Type on Boiler Efficiency. 58 CCW/FG Drying System.
61 Effect of Coal Moisture and Coal Type on Net Unit Heat Rate. 59 CCW/FG Drying System.
xi
LIST OF FIGURES (continued) Figure Page 62 Effect of Coal Moisture and Coal Type on Flue Gas Flow Rate 60 at ID Fan Inlet and Flow Rate of Inlet Combustion Air. CCW/FG Drying System.
63 Effect of Coal Moisture and Coal Type on Flue Gas Temperature 60 at ID Fan Inlet. CCW/FG Drying System.
64 Effect of Coal Moisture and Coal Type on FD Fan Power. 61 CCW/FG Drying System.
65 Effect of Coal Moisture and Coal Type on ID Fan Power. 61 CCW/FG Drying System.
66 Effect of Coal Moisture and Coal Type on Coal Feed Rate . 62 CCW/FG Drying System.
67 Effect of Coal Moisture and Coal Type on Mill Power. 62
68 Estimated Installed Equipment Costs for CCW/FG Drying 65 System at Four Product Moisture Levels.
69 Total Installed Equipment Cost for CCW/FG Drying System as a 65 Function of Coal Product Moisture.
70 Installed Capital Costs for Major Drying System Components. 66 CCW Drying System.
71 Comparison of Installed Capital Costs as a Function of Reduction 67 in Fuel Moisture (2005 U.S. Dollars).
72a Effect of Lignite Feed Moisture on Gross Pulverizer Power 70 (kWhr/ton). Adapted from Data by Ellman et al. (Reference 7).
72b Effect of Lignite Feed Moisture on Relative Pulverizer Power 70 (kWhr/ton).
73 Total Annual Costs – CCW/FG System 73
74 Total Annual Costs – CCW System 73
75 Gross Annual Savings – CCW/FG System. 81
76 Gross Annual Savings – CCW System. 81
77 Comparison of Annual Costs and Benefits – CCW/FG System. 82
78 Return on Investment for 7.5 Percent Annual Interest and Mean Cost 83 Savings Scenario – CCW/FG System.
79 Comparison of Annual Costs and Benefits – CCW System 84
xii
LIST OF TABLES Table Page 1 Procedure for Drying Tests 12
2 Comparison of Predicted and Measured Performance for Tests 4, 36 20, 23 and 30
3 Drying Systems Analyzed 41
4 Ultimate Analyses – Comparison of Lignite and PRB Coals 57
5 Component Equipment and Installation Costs for CCW/FG 64 Drying System with 28.9 Percent Lignite Product Moisture
6 CCW/FG System – Capital and Operating and Maintenance Costs 68
7 CCW System – Capital and Operating and Maintenance Costs 68
8 Incremental Cost of Station Service Power – CCW/FG System 71
9 Incremental Cost of Station Service Power – CCW System 71
10 Total Annual Cost – CCW/FG System 72
11 Total Annual Cost – CCW System 72
12 Annual Ash Disposal and Fuel Savings (CCW/FG System) 75
13 Annual Ash Disposal and Fuel Savings (CCW System) 75
14 Annual Full-Load Baseline Emissions 76
15 Unit Costs of Emissions 76
16 Avoided Costs of Emissions Control (CCW/FG System) 76
17 Avoided Costs of Emissions Control – CCW System 77
18 Annual Water Savings – CCW/FG System 77
19 Annual Water Savings – CCW System 77
20 Annual Mill Maintenance Savings – Both CCW and CCW/FG Systems 79
21 Mill Maintenance Savings – Lost Power Generation – Both CCW and 79 CCW/FG Systems
22 Summary of Annual Savings – CCW/FG System 80
23 Summary of Annual Savings – CCW System 80
24 Effects of Lignite Drying on Changes in Key Plant Performance 86 Parameters with a 20 Percent Product Moisture
1
INTRODUCTION
BACKGROUND
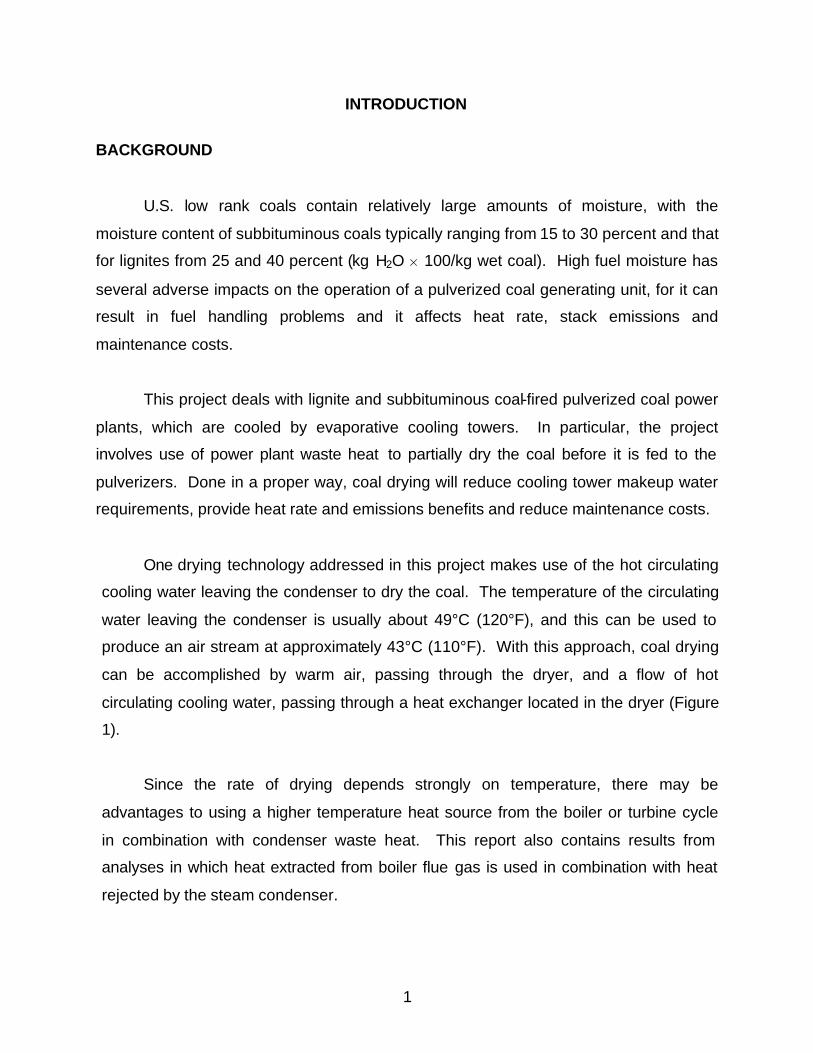
U.S. low rank coals contain relatively large amounts of moisture, with the
moisture content of subbituminous coals typically ranging from 15 to 30 percent and that
for lignites from 25 and 40 percent (kg H2O H 100/kg wet coal). High fuel moisture has
several adverse impacts on the operation of a pulverized coal generating unit, for it can
result in fuel handling problems and it affects heat rate, stack emissions and
maintenance costs.
This project deals with lignite and subbituminous coal-fired pulverized coal power
plants, which are cooled by evaporative cooling towers. In particular, the project
involves use of power plant waste heat to partially dry the coal before it is fed to the
pulverizers. Done in a proper way, coal drying will reduce cooling tower makeup water
requirements, provide heat rate and emissions benefits and reduce maintenance costs.
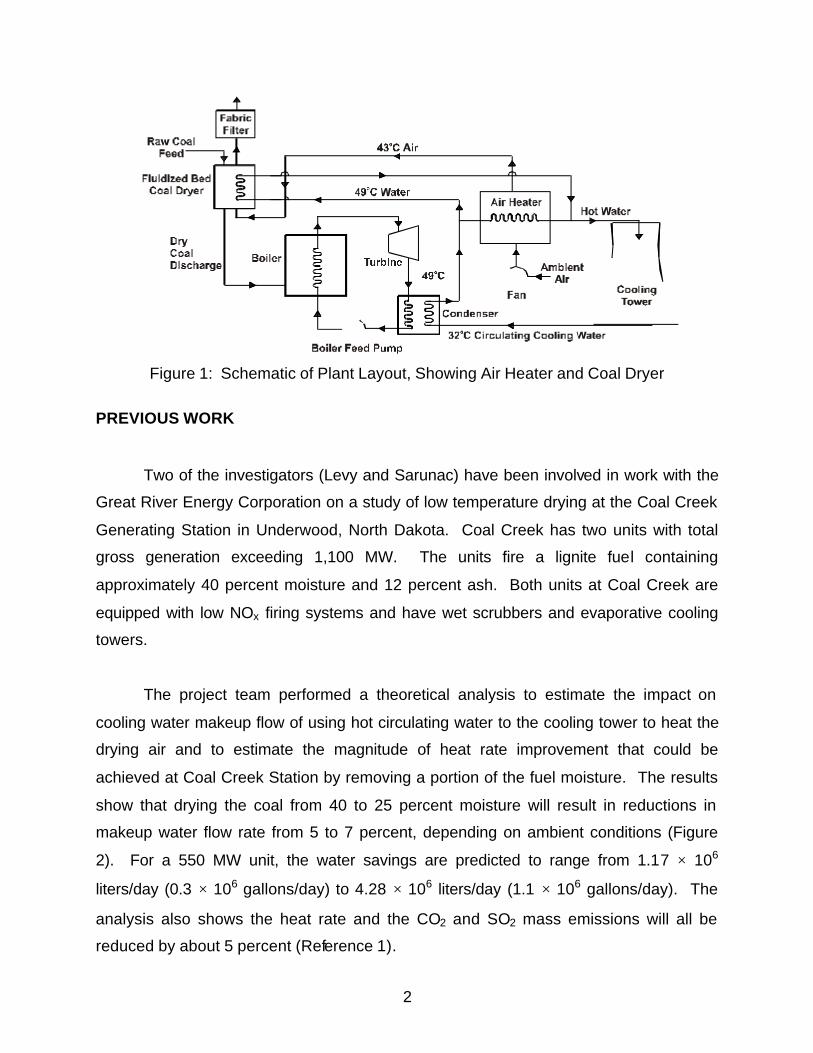
One drying technology addressed in this project makes use of the hot circulating
cooling water leaving the condenser to dry the coal. The temperature of the circulating
water leaving the condenser is usually about 49°C (120°F), and this can be used to
produce an air stream at approximately 43°C (110°F). With this approach, coal drying
can be accomplished by warm air, passing through the dryer, and a flow of hot
circulating cooling water, passing through a heat exchanger located in the dryer (Figure
1).
Since the rate of drying depends strongly on temperature, there may be
advantages to using a higher temperature heat source from the boiler or turbine cycle
in combination with condenser waste heat. This report also contains results from
analyses in which heat extracted from boiler flue gas is used in combination with heat
rejected by the steam condenser.
2
Figure 1: Schematic of Plant Layout, Showing Air Heater and Coal Dryer
PREVIOUS WORK
Two of the investigators (Levy and Sarunac) have been involved in work with the
Great River Energy Corporation on a study of low temperature drying at the Coal Creek
Generating Station in Underwood, North Dakota. Coal Creek has two units with total
gross generation exceeding 1,100 MW. The units fire a lignite fuel containing
approximately 40 percent moisture and 12 percent ash. Both units at Coal Creek are
equipped with low NOx firing systems and have wet scrubbers and evaporative cooling
towers.
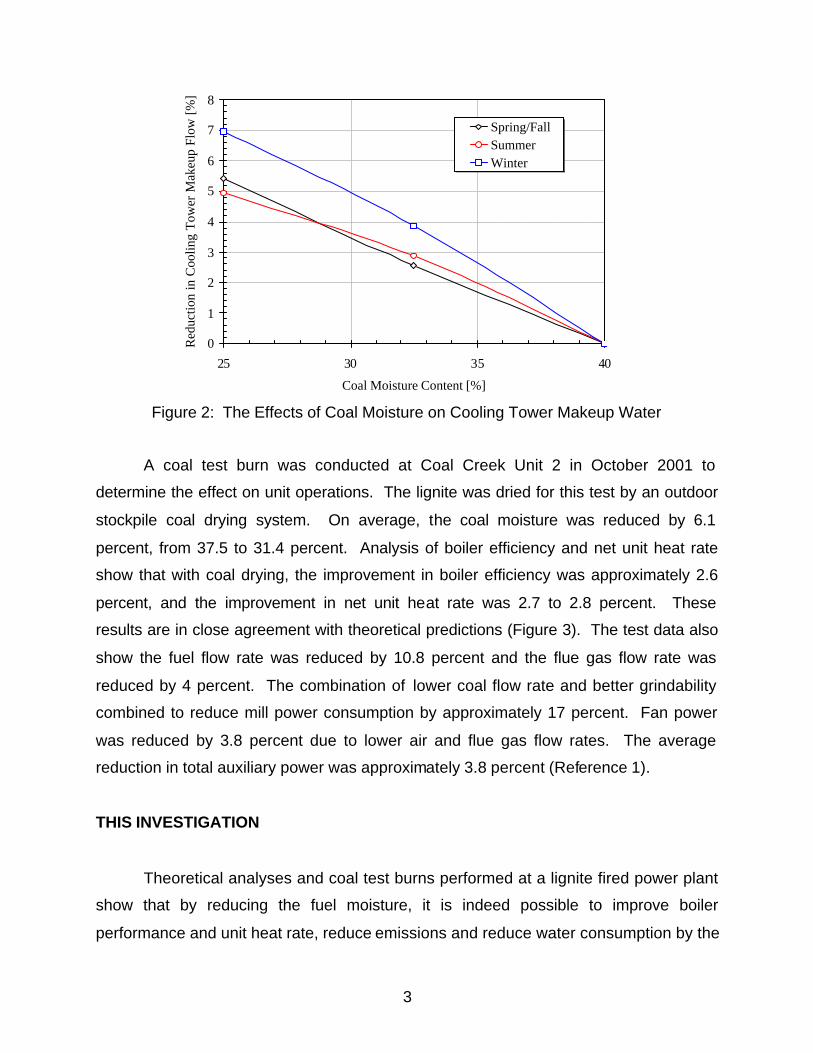
The project team performed a theoretical analysis to estimate the impact on
cooling water makeup flow of using hot circulating water to the cooling tower to heat the
drying air and to estimate the magnitude of heat rate improvement that could be
achieved at Coal Creek Station by removing a portion of the fuel moisture. The results
show that drying the coal from 40 to 25 percent moisture will result in reductions in
makeup water flow rate from 5 to 7 percent, depending on ambient conditions (Figure
2). For a 550 MW unit, the water savings are predicted to range from 1.17 × 10⁶
liters/day (0.3 × 10⁶ gallons/day) to 4.28 × 10⁶ liters/day (1.1 × 10⁶ gallons/day). The
analysis also shows the heat rate and the CO2 and SO2 mass emissions will all be
reduced by about 5 percent (Reference 1).
3
0
1
2
3
4
5
6
7
8
25 30 35 40
Coal Moisture Content [%]
Red
uctio
n in
Coo
ling
Tow
er M
akeu
p Fl
ow [%
]
Spring/FallSummerWinter
Figure 2: The Effects of Coal Moisture on Cooling Tower Makeup Water
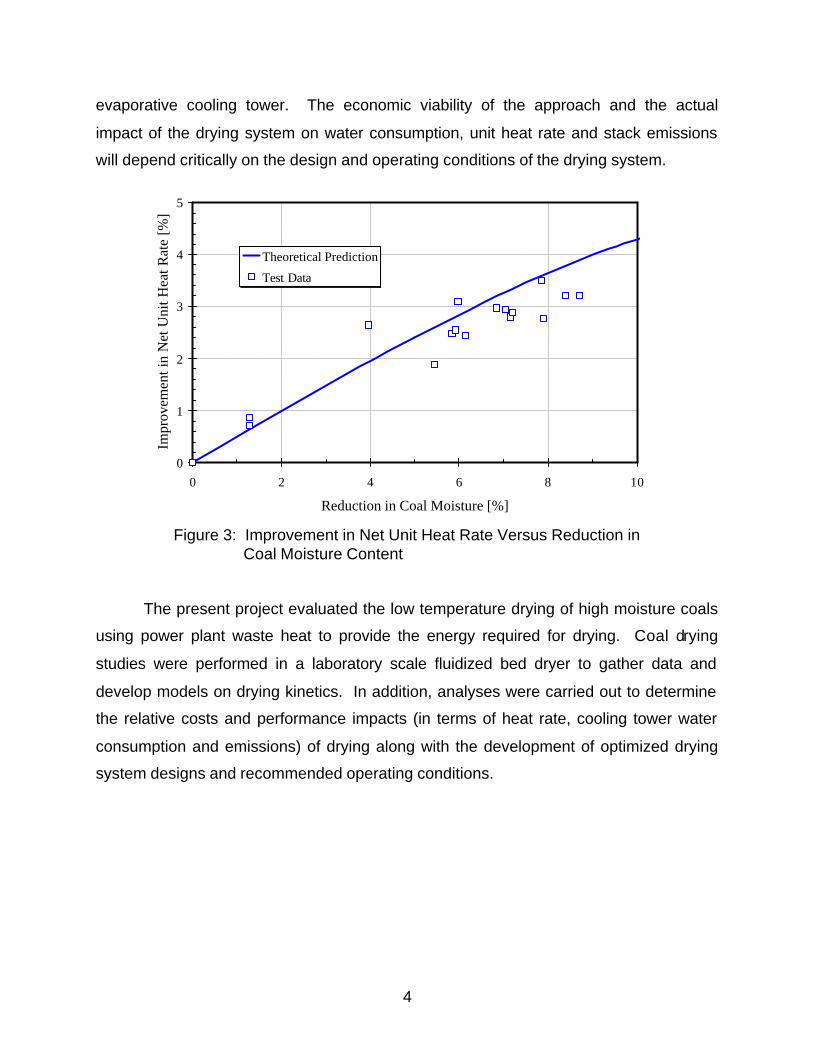
A coal test burn was conducted at Coal Creek Unit 2 in October 2001 to
determine the effect on unit operations. The lignite was dried for this test by an outdoor
stockpile coal drying system. On average, the coal moisture was reduced by 6.1
percent, from 37.5 to 31.4 percent. Analysis of boiler efficiency and net unit heat rate
show that with coal drying, the improvement in boiler efficiency was approximately 2.6
percent, and the improvement in net unit heat rate was 2.7 to 2.8 percent. These
results are in close agreement with theoretical predictions (Figure 3). The test data also
show the fuel flow rate was reduced by 10.8 percent and the flue gas flow rate was
reduced by 4 percent. The combination of lower coal flow rate and better grindability
combined to reduce mill power consumption by approximately 17 percent. Fan power
was reduced by 3.8 percent due to lower air and flue gas flow rates. The average
reduction in total auxiliary power was approximately 3.8 percent (Reference 1).
THIS INVESTIGATION
Theoretical analyses and coal test burns performed at a lignite fired power plant
show that by reducing the fuel moisture, it is indeed possible to improve boiler
performance and unit heat rate, reduce emissions and reduce water consumption by the
4
0
1
2
3
4
5
0 2 4 6 8 10
Reduction in Coal Moisture [%]
Impr
ovem
ent i
n N
et U
nit H
eat R
ate
[%]
Theoretical Prediction
Test Data
evaporative cooling tower. The economic viability of the approach and the actual
impact of the drying system on water consumption, unit heat rate and stack emissions
will depend critically on the design and operating conditions of the drying system.
Figure 3: Improvement in Net Unit Heat Rate Versus Reduction in Coal Moisture Content
The present project evaluated the low temperature drying of high moisture coals
using power plant waste heat to provide the energy required for drying. Coal drying
studies were performed in a laboratory scale fluidized bed dryer to gather data and
develop models on drying kinetics. In addition, analyses were carried out to determine
the relative costs and performance impacts (in terms of heat rate, cooling tower water
consumption and emissions) of drying along with the development of optimized drying
system designs and recommended operating conditions.
5
The project was carried out in five tasks:
Task 1: Fabricate and Instrument Equipment A laboratory scale fluidized bed drying system was designed, fabricated and
instrumented in this task.
Task 2: Perform Drying Experiments Experiments were carried out with lignite and PRB coals, while varying particle
size distribution, superficial air velocity, in-bed heat flux, and inlet air temperature and
specific humidity.
Task 3: Develop Drying Models and Compare to Experimental Data
A first principal drying model was developed for batch drying of coal and the
results of the model were compared to the laboratory data. In addition, a second
theoretical model, suitable for use with a continuously operating dryer, was developed
and results were generated on dryer performance for various operating conditions.
Task 4: Drying System Design Using the kinetic data and models from Tasks 2 and 3, fluidized bed drying
systems were designed for full size coal-fired power plants. Auxiliary equipment such
as fans, heat exchangers, dust collection systems and coal crushers were sized, and
installed capital and operating costs were estimated.
Task 5: Analysis of Impacts on Unit Performance and Comparisons of Costs and Benefits of Drying Analyses were performed to estimate the effects of dryer operation on cooling
tower makeup water, unit heat rate, auxiliary power, and stack emissions. The costs
6
and benefits of drying were estimated as functions of the reduction in coal moisture
content.
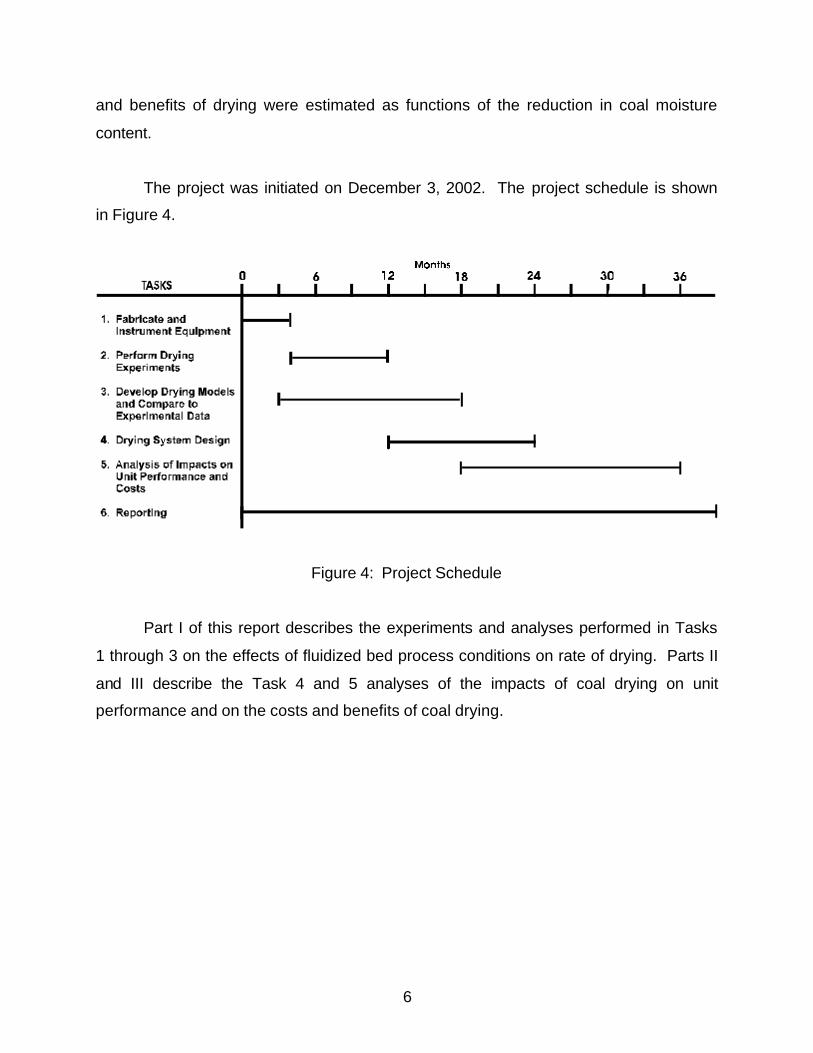
The project was initiated on December 3, 2002. The project schedule is shown
in Figure 4.
Figure 4: Project Schedule
Part I of this report describes the experiments and analyses performed in Tasks
1 through 3 on the effects of fluidized bed process conditions on rate of drying. Parts II
and III describe the Task 4 and 5 analyses of the impacts of coal drying on unit
performance and on the costs and benefits of coal drying.
7
EXECUTIVE SUMMARY BACKGROUND U.S. low rank coals contain relatively large amounts of moisture, with the moisture content of subbituminous coals typically ranging from 15 to 30 percent and that for lignites from 25 to 40 percent. High fuel moisture has several adverse impacts on the operation of a pulverized coal generating unit, for it can result in fuel handling problems and it affects heat rate, stack emissions and maintenance costs.
The present project evaluated the low temperature drying of high moisture coals using power plant waste heat to provide the energy required for drying. Coal drying studies were performed to gather data and develop models on drying kinetics. In addition, analyses were carried out to determine the relative costs and performance impacts of coal drying along with the development of optimized drying system designs and recommended operating conditions.
RESULTS Effects of Process Parameters and Coal Type on Drying Rate
Laboratory scale fluidized bed coal drying experiments were performed with a
North Dakota lignite and a Powder River Basin coal. The two coals exhibited similar drying characteristics, with a constant rate of drying at the beginning of the drying process, followed by a decreasing rate of drying as the coal moisture content was reduced to lower levels. The rate of drying during the constant rate period increased with superficial air velocity, inlet air temperature and in-bed heat flux and decreased with increasing levels of inlet air specific humidity. Comparisons between drying rates for lignite and PRB coals at the same process conditions show lignite dries slightly more rapidly than PRB coal. Theoretical drying models were developed for both batch and continuously operating fluidized bed drying processes, and these were found to give good agreement with laboratory and pilot plant drying data. Impacts of Coal Drying on Unit Operations
The second part of the project involved the design of drying systems for lignite
and PRB coal-fired power plants and analysis of the effects of drying system operation on cooling tower makeup water, unit heat rate, auxiliary power and stack emissions. Two drying system designs were analyzed. One, referred to in this report by the acronym, CCW, relies on waste heat extracted from the hot circulating water leaving the condenser for fluidized bed coal drying. The second type of drying system uses a combination of condenser waste heat and heat extracted from boiler flue gas to attain higher drying temperatures than are possible from condenser waste heat alone. This is referred to in this report by the acronym, CCW/FG.
8
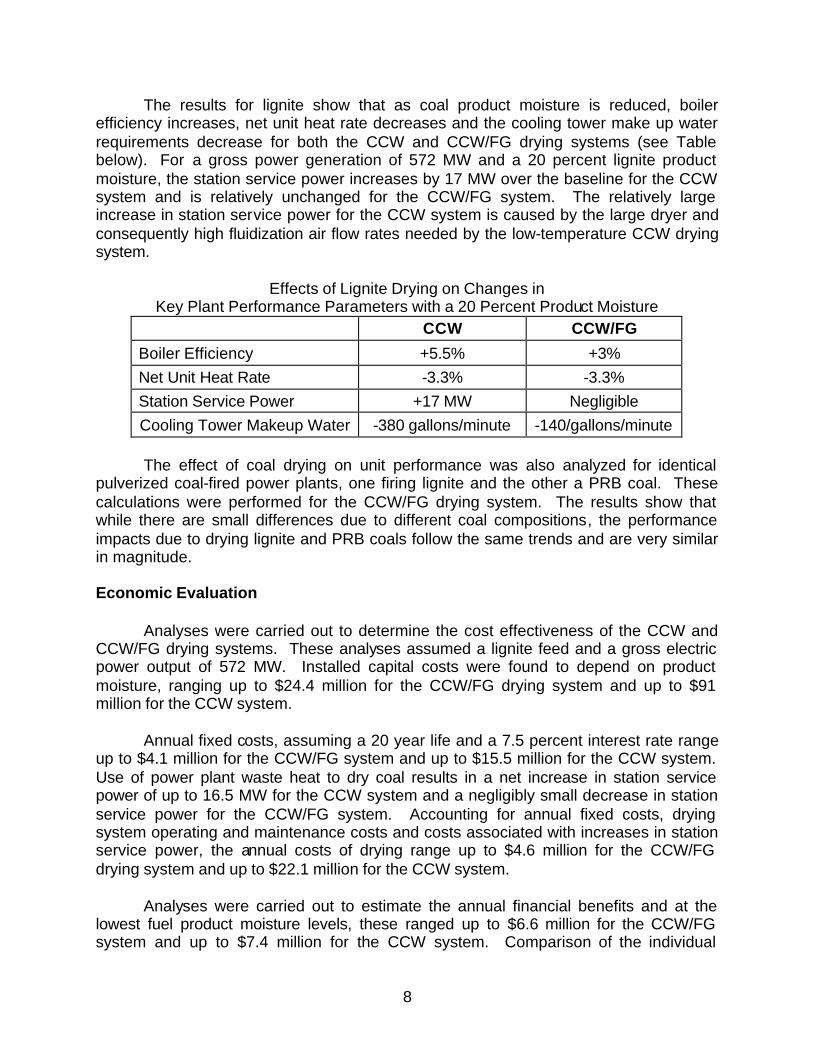
The results for lignite show that as coal product moisture is reduced, boiler efficiency increases, net unit heat rate decreases and the cooling tower make up water requirements decrease for both the CCW and CCW/FG drying systems (see Table below). For a gross power generation of 572 MW and a 20 percent lignite product moisture, the station service power increases by 17 MW over the baseline for the CCW system and is relatively unchanged for the CCW/FG system. The relatively large increase in station service power for the CCW system is caused by the large dryer and consequently high fluidization air flow rates needed by the low-temperature CCW drying system.
Effects of Lignite Drying on Changes in Key Plant Performance Parameters with a 20 Percent Product Moisture
CCW CCW/FG
Boiler Efficiency +5.5% +3% Net Unit Heat Rate -3.3% -3.3% Station Service Power +17 MW Negligible Cooling Tower Makeup Water -380 gallons/minute -140/gallons/minute
The effect of coal drying on unit performance was also analyzed for identical pulverized coal-fired power plants, one firing lignite and the other a PRB coal. These calculations were performed for the CCW/FG drying system. The results show that while there are small differences due to different coal compositions, the performance impacts due to drying lignite and PRB coals follow the same trends and are very similar in magnitude. Economic Evaluation Analyses were carried out to determine the cost effectiveness of the CCW and CCW/FG drying systems. These analyses assumed a lignite feed and a gross electric power output of 572 MW. Installed capital costs were found to depend on product moisture, ranging up to $24.4 million for the CCW/FG drying system and up to $91 million for the CCW system. Annual fixed costs, assuming a 20 year life and a 7.5 percent interest rate range up to $4.1 million for the CCW/FG system and up to $15.5 million for the CCW system. Use of power plant waste heat to dry coal results in a net increase in station service power of up to 16.5 MW for the CCW system and a negligibly small decrease in station service power for the CCW/FG system. Accounting for annual fixed costs, drying system operating and maintenance costs and costs associated with increases in station service power, the annual costs of drying range up to $4.6 million for the CCW/FG drying system and up to $22.1 million for the CCW system. Analyses were carried out to estimate the annual financial benefits and at the lowest fuel product moisture levels, these ranged up to $6.6 million for the CCW/FG system and up to $7.4 million for the CCW system. Comparison of the individual
9
parameters affected by drying shows the most important savings are the fuel savings and the avoided costs due to reduction of SO2 and CO2 emissions. Less important, but still significant, are savings due to avoided costs of Hg and NOx emission control, reduced costs of mill maintenance, a decrease in lost generation due to unscheduled mill outages, reduced costs of ash disposal, and reduced use of makeup water for power plant cooling.
A comparison of costs and benefits for the CCW/FG system show that for this particular drying system and the hypothetical coal-fired generation unit which has been analyzed, the cost effectiveness of the technology increases as the coal product moisture decreases. For an annual interest rate of 7.5% and the mean cost savings scenario, the break even point is at 16 percent coal moisture reduction, with the return on investment increasing linearly to 20.9 percent at 19 percent coal moisture reduction. In contrast, the analysis shows that due to relatively high capital costs and high station service power costs for the CCW system, the return on investment for the CCW system is negative for all moisture levels. The annual fixed costs and dryer operating costs (including station service power) for the CCW system range up to $22 million while the annual gross benefits range up to $7 million. Additional Comments
The results from this project suggest that using power plant waste heat to dry
high-moisture fuels is both technically and economically feasible. The laboratory drying tests showed that coal moisture can be reduced to less than one-half of that in the raw coal with coal residence times in the dryer small enough to be economic. Rates of drying for lignite and PRB coals were found to be of roughly the same magnitude, with slightly higher drying rates for lignite.
The cost effectiveness of drying is heavily dependent on drying temperature, with a drying system which uses a combination of heat extracted from boiler flue gas and from the steam condenser providing a significant return on investment. While the low-temperature CCW drying system, which relies exclusively on thermal energy from the steam condenser, results in significantly greater reduction in cooling tower makeup water, its relatively high installed capital costs and costs of increased station service power make this option unattractive from a financial point of view.
The benefits and costs of coal drying will depend heavily on site-specific factors, and detailed analyses would be needed to determine the most cost effective design for a particular application. All of the analyses performed here are for retrofit applications. However, a comparable study should be performed for new plant designs. Potential savings from matching the boiler design and mill, fan, ESP and scrubber capacities to a lower as-fired fuel moisture may very well lead to substantial additional reductions in installed equipment costs.
10
PART I – EFFECTS OF PROCESS PARAMETERS AND COAL TYPE ON COAL DRYING RATE
EXPERIMENTAL
Test Apparatus
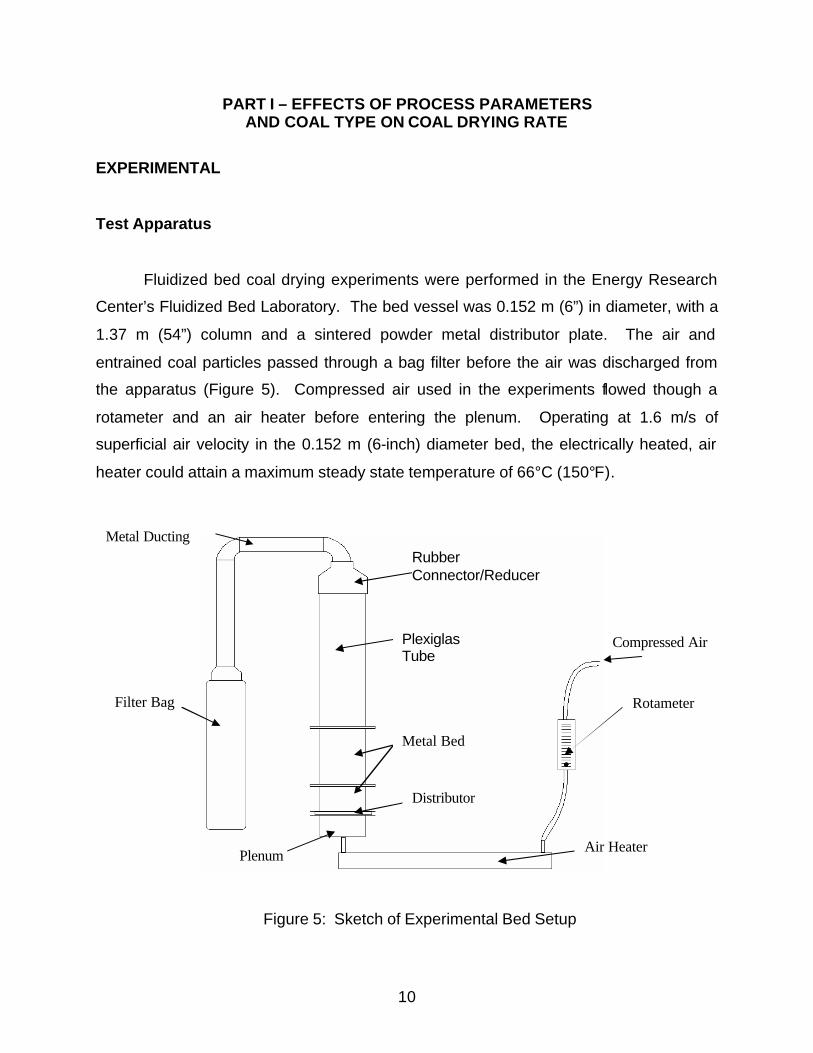
Fluidized bed coal drying experiments were performed in the Energy Research
Center’s Fluidized Bed Laboratory. The bed vessel was 0.152 m (6”) in diameter, with a
1.37 m (54”) column and a sintered powder metal distributor plate. The air and
entrained coal particles passed through a bag filter before the air was discharged from
the apparatus (Figure 5). Compressed air used in the experiments flowed though a
rotameter and an air heater before entering the plenum. Operating at 1.6 m/s of
superficial air velocity in the 0.152 m (6-inch) diameter bed, the electrically heated, air
heater could attain a maximum steady state temperature of 66°C (150°F).
Figure 5: Sketch of Experimental Bed Setup
Rubber Connector/Reducer
Plexiglas Tube
Metal Bed
Distributor
Air Heater
Rotameter
Compressed Air
Metal Ducting
Filter Bag
Plenum
11
Thermocouples inserted through the bed wall were used to measure vertical
distribution of bed temperature. A horizontal bundle of eighteen 12.7 mm (½”) diameter
electric heating elements were used to provide in-bed heating. The heaters were
located in the region from 51 mm (2”) to 304.8 mm (12”) above the distributor and were
instrumented with thermocouples to indicate heater surface temperature. By controlling
power to the heaters, the heater surface temperature could be operated in a range from
38°C (100°) to 65.6°C (150°F). At a given heater surface temperature, total heat flux to
the bed could be reduced from the maximum by disconnecting selected heaters from
the power supply.
Some experiments were performed in which the specific humidity of the inlet air
to the fluidized bed was increased above ambient levels. In these experiments, the inlet
air flowed through a steam humidifier before entering the inlet plenum of the bed.
Test Procedure
Batch bed drying tests were performed to determine the effects of coal particle
size, superficial air velocity, inlet air and heater surface temperatures and specific
humidity of inlet air on rate of drying. Small samples of the coal were removed from the
bed at selected intervals during the drying tests and coal moisture was measured. This
was determined by drying samples of the coal in crucibles in an oven at 110°C for 5 to 6
hours, and weighing the samples before and after drying. The complete test procedure
used in these experiments is described in Table 1.
12
Table 1
Procedure for Drying Tests
1. With no coal in bed, turn on compressor, set air flow to desired value, turn on air preheater and allow system to reach steady-state at desired temperature. Measure inlet relative humidity and dry bulb temperature of air.
2. Once air is at steady-state, turn off air preheater and air flow, load coal into bed, turn on all heaters and air flow to appropriate values, start stopwatch, and record pressure of inlet air from pressure gauge above rotameter.
3. Begin recording temperatures after 5 minutes, collect small samples of coal from bed, measure wet and dry bulb temperatures at exit of bed, record values for temperature readings at each assigned thermocouple, adjust voltage regulators for the heaters so that surface temperatures remain steady at appropriate values, and repeat this procedure for each time interval on data sheet.
4. At end of test, shut off heaters but keep air flow on to cool the heaters, detach filter bag, load coal samples into crucibles, place crucibles into oven, set to 100°C, and leave for 5-6 hours or overnight, remove remaining coal from the bed and weigh it.
5. Analyze results.
Results and Discussion
The experiments were carried out with two coals, a North Dakota lignite and a
subbituminous coal from the Powder River Basin (PRB). The as-received moisture
content of the lignite varied slightly from sample-to-sample, usually ranging from 54 to
58 percent and the PRB coal had a moisture content of approximately 37 percent (both
expressed as mass of moisture/mass dry fuel). During the first minute or two of each
test, fines were elutriated from the bed. The drying rate presented here is based on the
dry coal which remained in the bed after elutriation had occurred and after coal samples
had been removed for analysis.
The drying tests were performed with inlet air and heater surface temperatures
up to 66°C, with superficial air velocities ranging from 0.9 to 1.7 m/s and with settled
bed depths of 0.39 m. Superficial air velocity U0 is defined here as A
mair
ρ
&
13
0
5
10
15
20
25
30
35
40
45
0<dp
<104
104<d
p<211
211<d
p<353
353<
dp<5
00
500<
dp<8
91
891<
dp<1
191
1191
<dp<
1410
1410
<dp<
2819
2819
<dp<
4730
Particle Size (µm)
Mas
s F
ract
ion
(%)
where A = Bed Cross Sectional Area Without Tube Bundle
ρ = Density of Air at Standard Temperature and Pressure
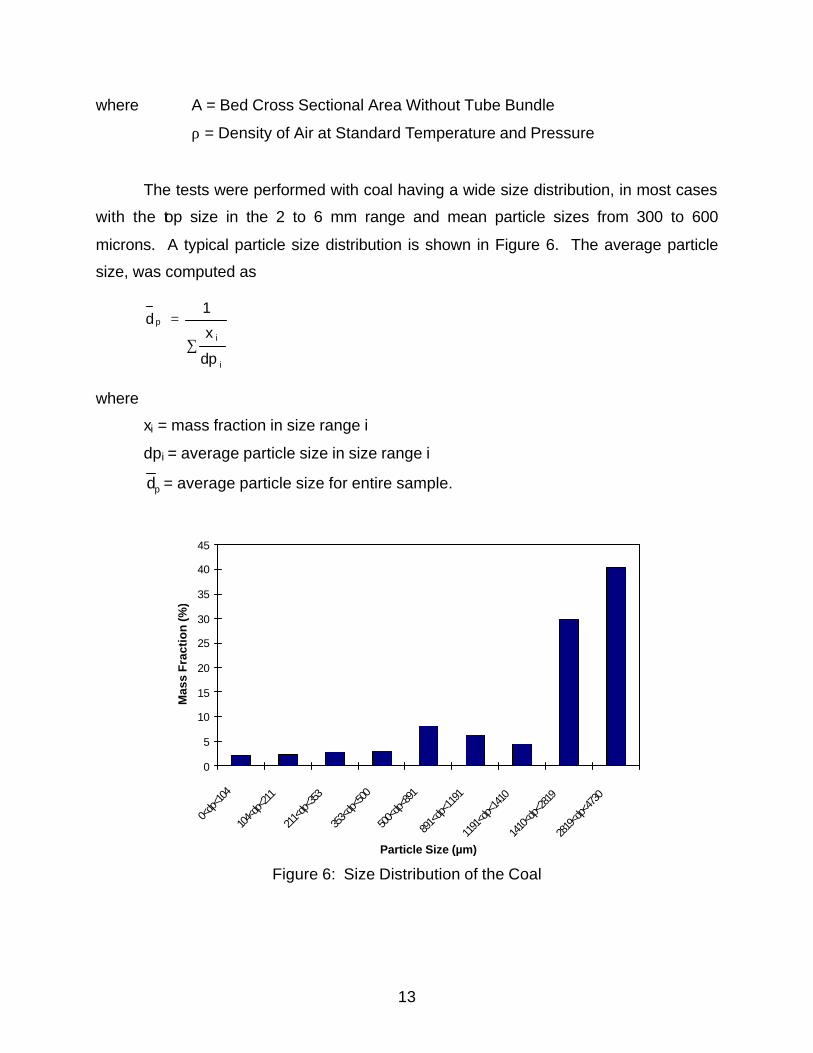
The tests were performed with coal having a wide size distribution, in most cases
with the top size in the 2 to 6 mm range and mean particle sizes from 300 to 600
microns. A typical particle size distribution is shown in Figure 6. The average particle
size, was computed as
where
xi = mass fraction in size range i
dpi = average particle size in size range i
pd = average particle size for entire sample.
Figure 6: Size Distribution of the Coal
i
i
p
dp
x
1d
∑
=
14
Moisture Content Versus Time
0
0.1
0.2
0.3
0.4
0.5
0.6
0.7
0 20 40 60 80 100 120 140
Time (min)
Mo
istu
re C
on
ten
t (k
g w
t/kg
dry
co
al)
L34
L35
L36
L37
L38
L39
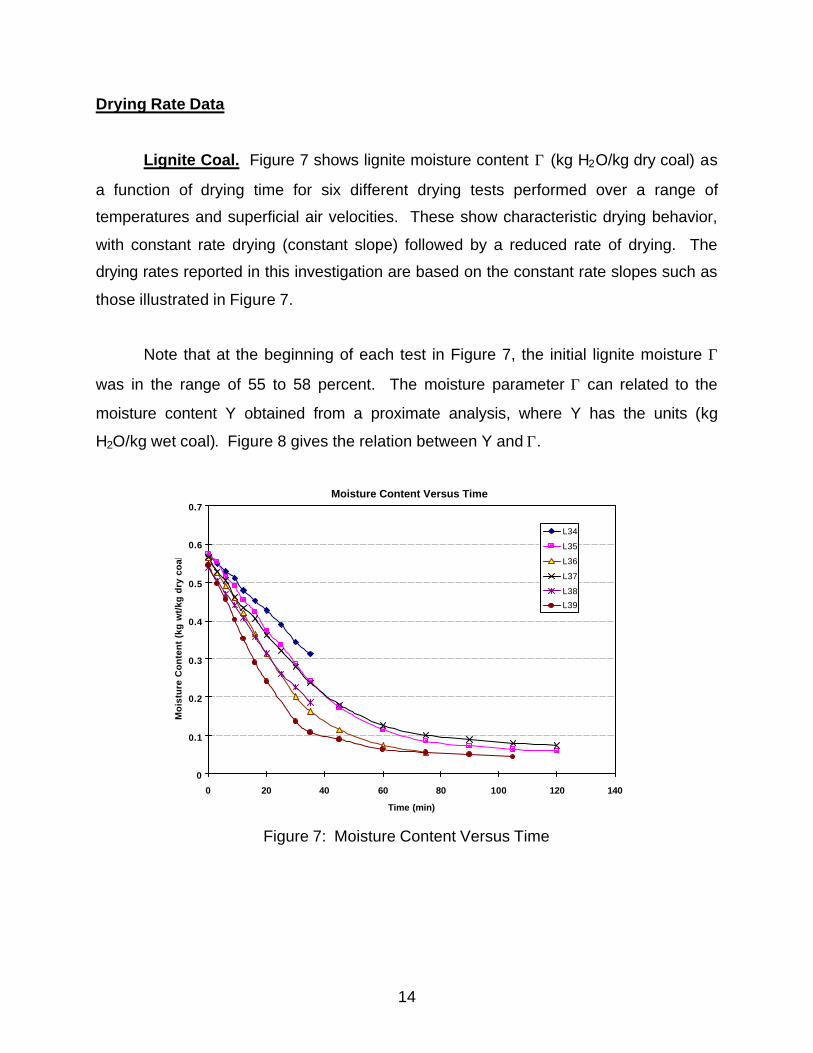
Drying Rate Data
Lignite Coal. Figure 7 shows lignite moisture content Γ (kg H2O/kg dry coal) as
a function of drying time for six different drying tests performed over a range of
temperatures and superficial air velocities. These show characteristic drying behavior,
with constant rate drying (constant slope) followed by a reduced rate of drying. The
drying rates reported in this investigation are based on the constant rate slopes such as
those illustrated in Figure 7.
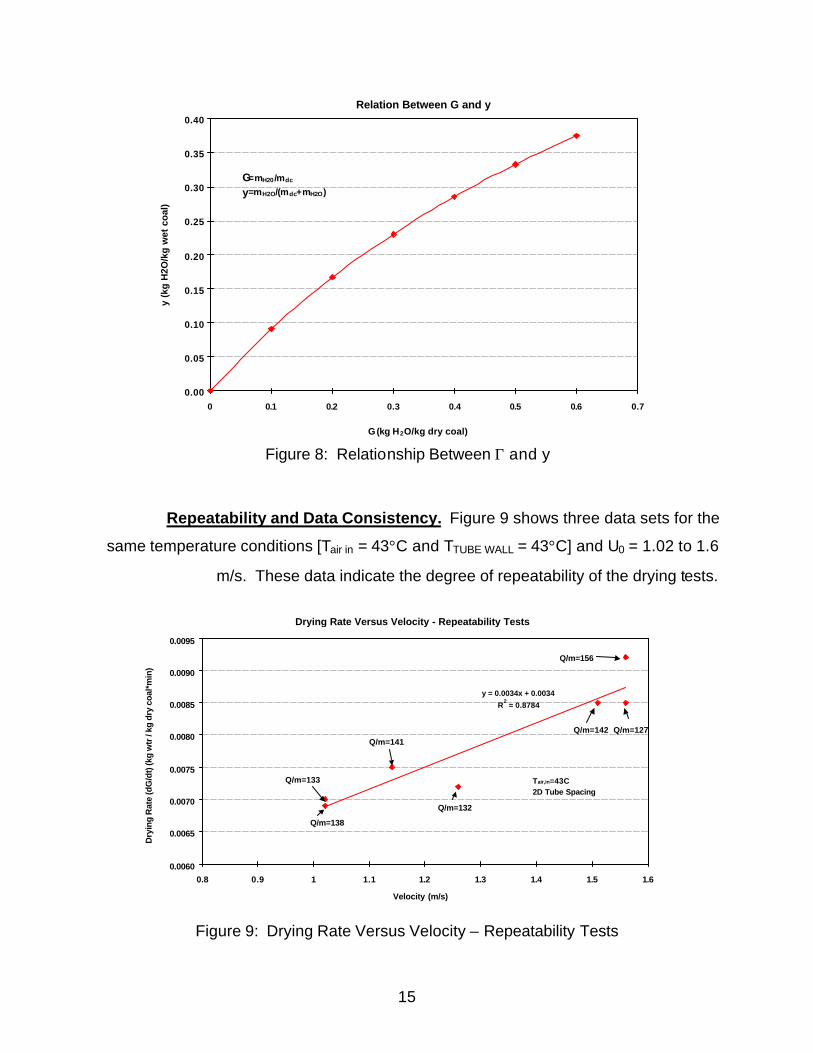
Note that at the beginning of each test in Figure 7, the initial lignite moisture Γ
was in the range of 55 to 58 percent. The moisture parameter Γ can related to the
moisture content Y obtained from a proximate analysis, where Y has the units (kg
H2O/kg wet coal). Figure 8 gives the relation between Y and Γ.
Figure 7: Moisture Content Versus Time
15
Relation Between G and y
0.00
0.05
0.10
0.15
0.20
0.25
0.30
0.35
0.40
0 0.1 0.2 0.3 0.4 0.5 0.6 0.7
G (kg H2O/kg dry coal)
y (k
g H
2O/k
g w
et c
oal
)G=mH20 /mdc
y=mH2O/(mdc+mH2O)
Drying Rate Versus Velocity - Repeatability Tests
y = 0.0034x + 0.0034
R2 = 0.8784
0.0060
0.0065
0.0070
0.0075
0.0080
0.0085
0.0090
0.0095
0.8 0.9 1 1.1 1.2 1.3 1.4 1.5 1.6
Velocity (m/s)
Dry
ing
Rat
e (d
G/d
t) (k
g w
tr /
kg d
ry c
oal*
min
)
Q/m=138
Q/m=132
Q/m=142
Q/m=133
Q/m=141Q/m=127
Q/m=156
Tair,in=43C2D Tube Spacing
Figure 8: Relationship Between Γ and y
Repeatability and Data Consistency. Figure 9 shows three data sets for the
same temperature conditions [Tair in = 43°C and TTUBE WALL = 43°C] and U0 = 1.02 to 1.6
m/s. These data indicate the degree of repeatability of the drying tests.
Figure 9: Drying Rate Versus Velocity – Repeatability Tests
16
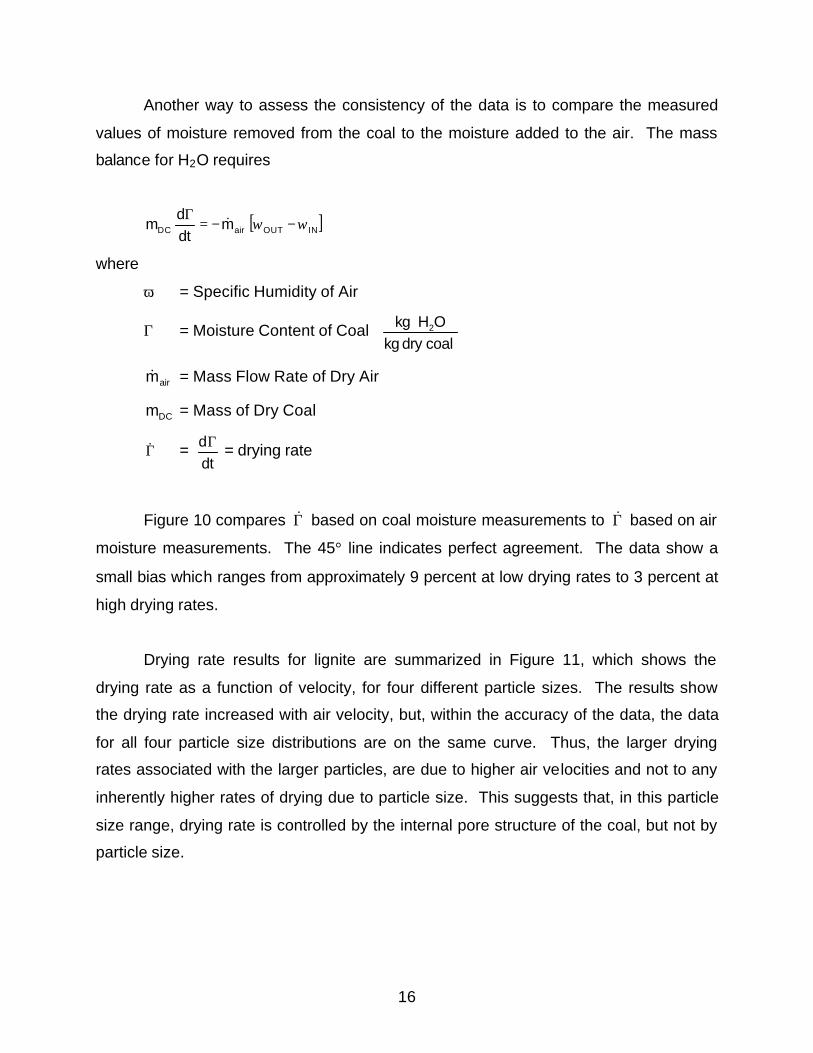
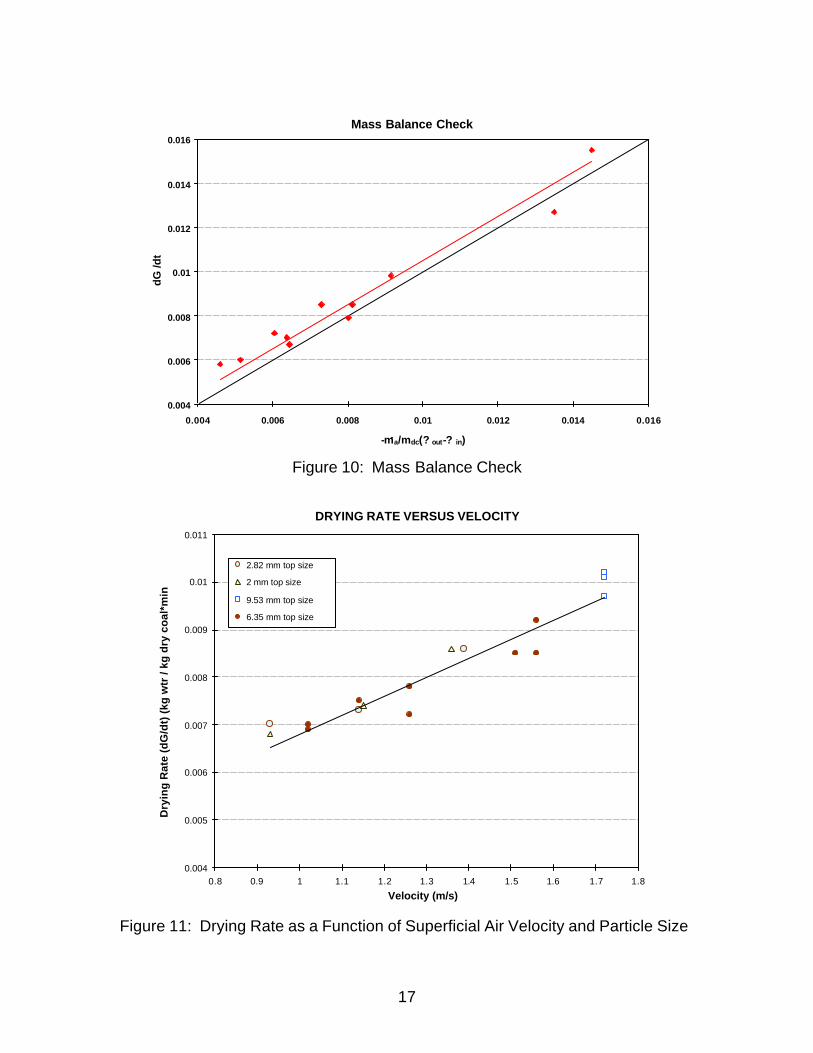
Another way to assess the consistency of the data is to compare the measured
values of moisture removed from the coal to the moisture added to the air. The mass
balance for H2O requires
[ ]INOUTairDC m dtd
m ωω −−=Γ &
where
ω = Specific Humidity of Air
Γ = Moisture Content of Coal
coaldry kg
OH kg 2
airm& = Mass Flow Rate of Dry Air
DCm = Mass of Dry Coal
Γ& = dtdΓ = drying rate
Figure 10 compares Γ& based on coal moisture measurements to Γ& based on air
moisture measurements. The 45° line indicates perfect agreement. The data show a
small bias which ranges from approximately 9 percent at low drying rates to 3 percent at
high drying rates.
Drying rate results for lignite are summarized in Figure 11, which shows the
drying rate as a function of velocity, for four different particle sizes. The results show
the drying rate increased with air velocity, but, within the accuracy of the data, the data
for all four particle size distributions are on the same curve. Thus, the larger drying
rates associated with the larger particles, are due to higher air velocities and not to any
inherently higher rates of drying due to particle size. This suggests that, in this particle
size range, drying rate is controlled by the internal pore structure of the coal, but not by
particle size.
17
Mass Balance Check
0.004
0.006
0.008
0.01
0.012
0.014
0.016
0.004 0.006 0.008 0.01 0.012 0.014 0.016
-ma/mdc(? out-? in)
dG /d
t
DRYING RATE VERSUS VELOCITY
0.004
0.005
0.006
0.007
0.008
0.009
0.01
0.011
0.8 0.9 1 1.1 1.2 1.3 1.4 1.5 1.6 1.7 1.8
Velocity (m/s)
Dry
ing
Rat
e (d
G/d
t) (
kg w
tr /
kg d
ry c
oal
*min
)
2.82 mm top size
2 mm top size
9.53 mm top size
6.35 mm top size
Figure 10: Mass Balance Check
Figure 11: Drying Rate as a Function of Superficial Air Velocity and Particle Size
18
DRYING RATE VERSUS TEMPERATURE
0
0.002
0.004
0.006
0.008
0.01
0.012
0.014
0.016
0.018
30 35 40 45 50 55 60 65 70
Temperature (°C)
Dry
ing
Rat
e (k
g/(
kg d
ry c
oal
*min
)) Lignite
PRB Coal U0 = 1.55m/s
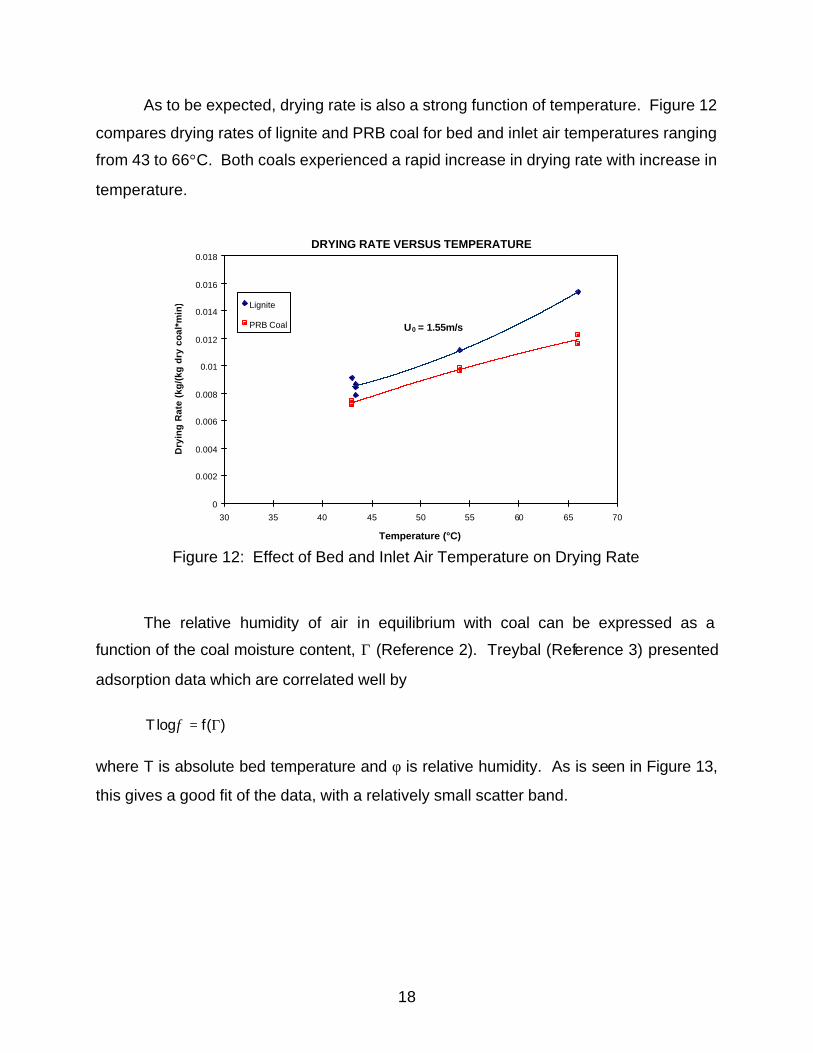
As to be expected, drying rate is also a strong function of temperature. Figure 12
compares drying rates of lignite and PRB coal for bed and inlet air temperatures ranging
from 43 to 66°C. Both coals experienced a rapid increase in drying rate with increase in
temperature.
Figure 12: Effect of Bed and Inlet Air Temperature on Drying Rate
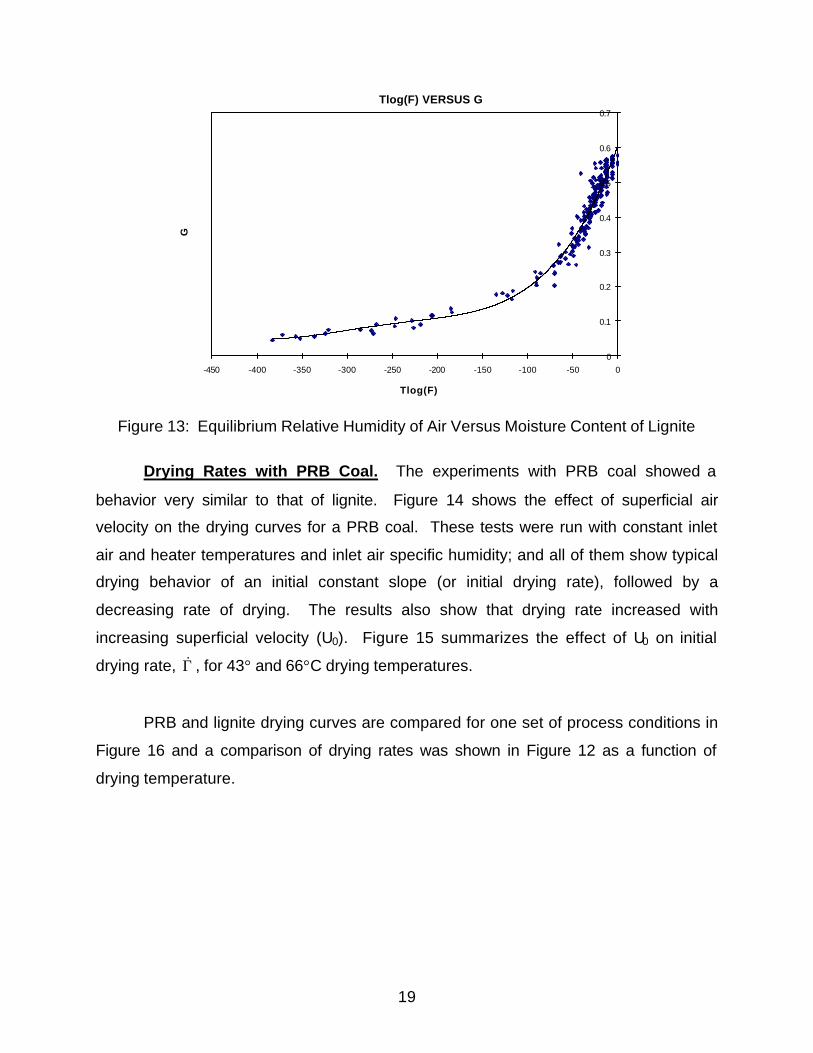
The relative humidity of air in equilibrium with coal can be expressed as a
function of the coal moisture content, Γ (Reference 2). Treybal (Reference 3) presented
adsorption data which are correlated well by
where T is absolute bed temperature and φ is relative humidity. As is seen in Figure 13,
this gives a good fit of the data, with a relatively small scatter band.
)(flogT Γ=φ
19
Tlog(F) VERSUS G
0
0.1
0.2
0.3
0.4
0.5
0.6
0.7
-450 -400 -350 -300 -250 -200 -150 -100 -50 0
Tlog(F)
G
Figure 13: Equilibrium Relative Humidity of Air Versus Moisture Content of Lignite
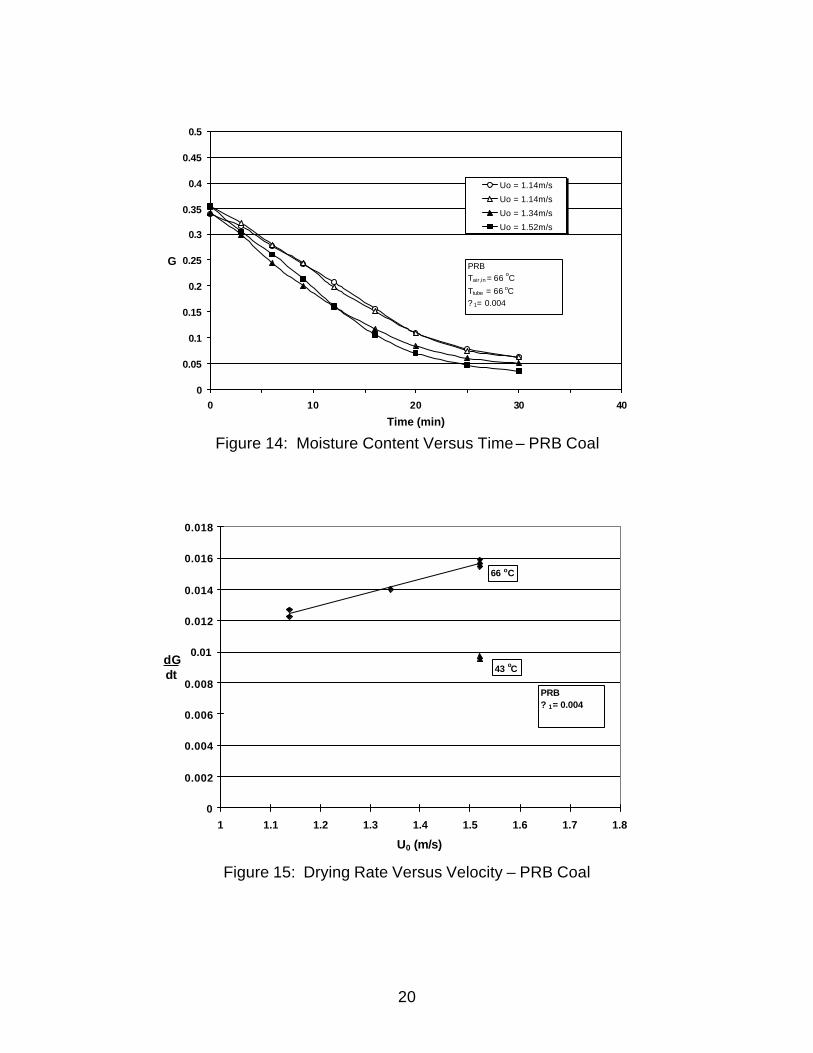
Drying Rates with PRB Coal. The experiments with PRB coal showed a
behavior very similar to that of lignite. Figure 14 shows the effect of superficial air
velocity on the drying curves for a PRB coal. These tests were run with constant inlet
air and heater temperatures and inlet air specific humidity; and all of them show typical
drying behavior of an initial constant slope (or initial drying rate), followed by a
decreasing rate of drying. The results also show that drying rate increased with
increasing superficial velocity (U0). Figure 15 summarizes the effect of U0 on initial
drying rate, Γ& , for 43° and 66°C drying temperatures.
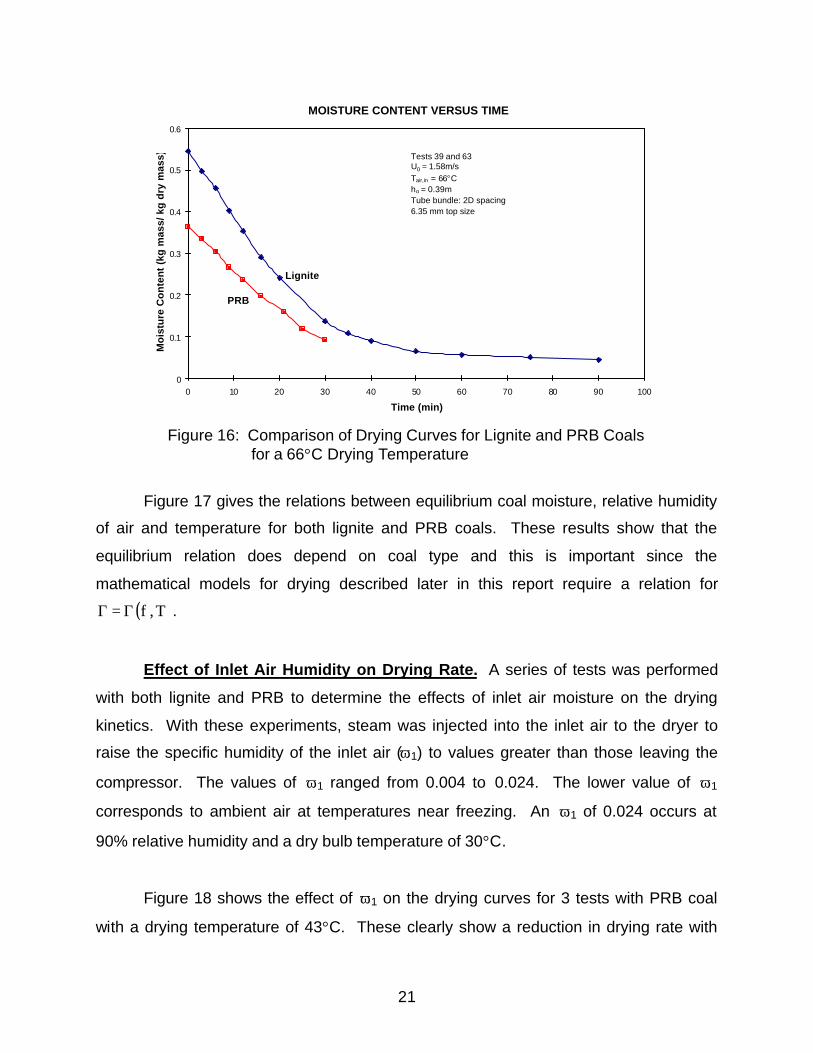
PRB and lignite drying curves are compared for one set of process conditions in
Figure 16 and a comparison of drying rates was shown in Figure 12 as a function of
drying temperature.
20
0
0.05
0.1
0.15
0.2
0.25
0.3
0.35
0.4
0.45
0.5
0 10 20 30 40
Time (min)
G
Uo = 1.14m/s
Uo = 1.14m/s
Uo = 1.34m/s
Uo = 1.52m/s
PRBTair,in = 66 oC
Ttube = 66 oC? 1= 0.004
0
0.002
0.004
0.006
0.008
0.01
0.012
0.014
0.016
0.018
1 1.1 1.2 1.3 1.4 1.5 1.6 1.7 1.8
U0 (m/s)
dGdt
66 oC
43 oC
PRB? 1= 0.004
Figure 14: Moisture Content Versus Time – PRB Coal
Figure 15: Drying Rate Versus Velocity – PRB Coal
21
MOISTURE CONTENT VERSUS TIME
0
0.1
0.2
0.3
0.4
0.5
0.6
0 10 20 30 40 50 60 70 80 90 100
Time (min)
Mo
istu
re C
on
ten
t (k
g m
ass/
kg
dry
mas
s) Tests 39 and 63U0 = 1.58m/sTair,in = 66°Cho = 0.39mTube bundle: 2D spacing6.35 mm top size
Lignite
PRB
Figure 16: Comparison of Drying Curves for Lignite and PRB Coals for a 66°C Drying Temperature
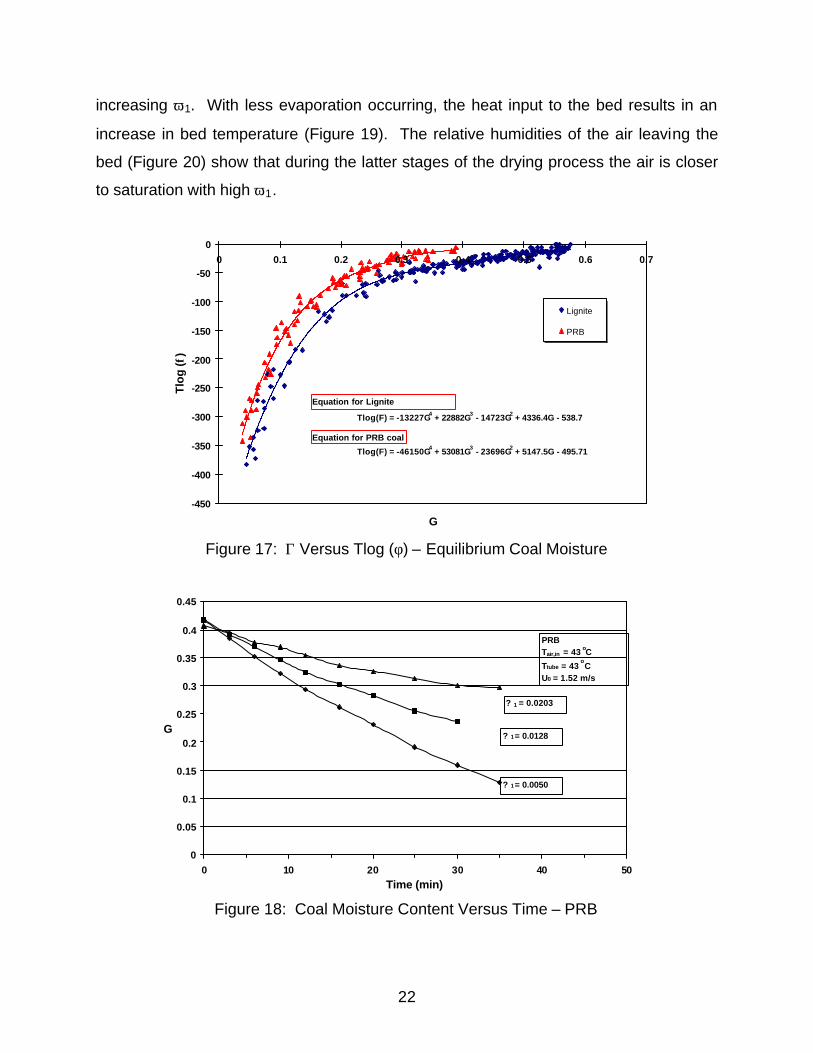
Figure 17 gives the relations between equilibrium coal moisture, relative humidity
of air and temperature for both lignite and PRB coals. These results show that the
equilibrium relation does depend on coal type and this is important since the
mathematical models for drying described later in this report require a relation for
( )T,f Γ=Γ .
Effect of Inlet Air Humidity on Drying Rate. A series of tests was performed
with both lignite and PRB to determine the effects of inlet air moisture on the drying
kinetics. With these experiments, steam was injected into the inlet air to the dryer to
raise the specific humidity of the inlet air (ω1) to values greater than those leaving the
compressor. The values of ω1 ranged from 0.004 to 0.024. The lower value of ω1
corresponds to ambient air at temperatures near freezing. An ω1 of 0.024 occurs at
90% relative humidity and a dry bulb temperature of 30°C.
Figure 18 shows the effect of ω1 on the drying curves for 3 tests with PRB coal
with a drying temperature of 43°C. These clearly show a reduction in drying rate with
22
Tlog(F) = -13227G4 + 22882G3 - 14723G2 + 4336.4G - 538.7
Tlog(F) = -46150G4 + 53081G3 - 23696G2 + 5147.5G - 495.71
-450
-400
-350
-300
-250
-200
-150
-100
-50
00 0.1 0.2 0.3 0.4 0.5 0.6 0.7
G
Tlo
g (φ
)
Lignite
PRB
Equation for Lignite
Equation for PRB coal
0
0.05
0.1
0.15
0.2
0.25
0.3
0.35
0.4
0.45
0 10 20 30 40 50Time (min)
G
? 1 = 0.0203
? 1 = 0.0128
? 1 = 0.0050
PRBTair,in = 43 oC
Ttube = 43 oC
U0 = 1.52 m/s
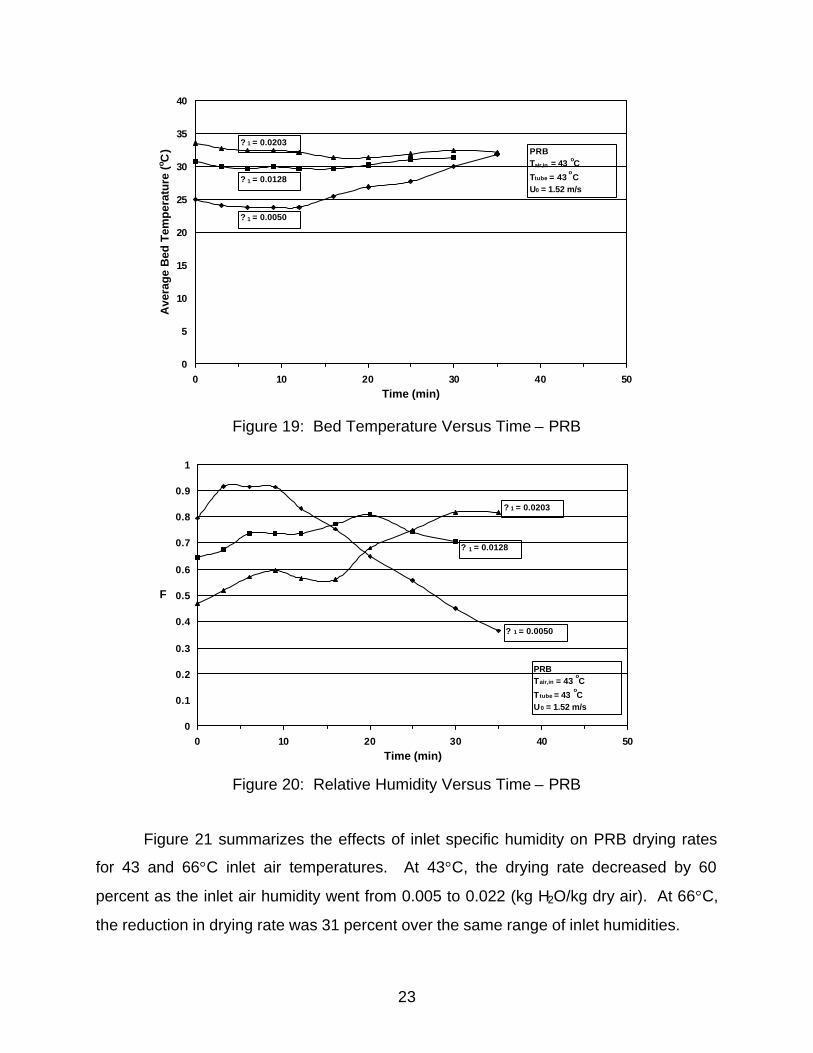
increasing ω1. With less evaporation occurring, the heat input to the bed results in an
increase in bed temperature (Figure 19). The relative humidities of the air leaving the
bed (Figure 20) show that during the latter stages of the drying process the air is closer
to saturation with high ω1.
Figure 17: Γ Versus Tlog (φ) – Equilibrium Coal Moisture
Figure 18: Coal Moisture Content Versus Time – PRB
23
0
5
10
15
20
25
30
35
40
0 10 20 30 40 50Time (min)
Ave
rag
e B
ed T
emp
erat
ure
(o C
)
? 1 = 0.0203
? 1 = 0.0128
? 1 = 0.0050
PRBTair,in = 43 oC
Ttube = 43 oC
U0 = 1.52 m/s
0
0.1
0.2
0.3
0.4
0.5
0.6
0.7
0.8
0.9
1
0 10 20 30 40 50Time (min)
F
? 1 = 0.0203
? 1 = 0.0128
? 1 = 0.0050
PRBTair,in = 43
oC
T tube = 43 oC
U0 = 1.52 m/s
Figure 19: Bed Temperature Versus Time – PRB
Figure 20: Relative Humidity Versus Time – PRB
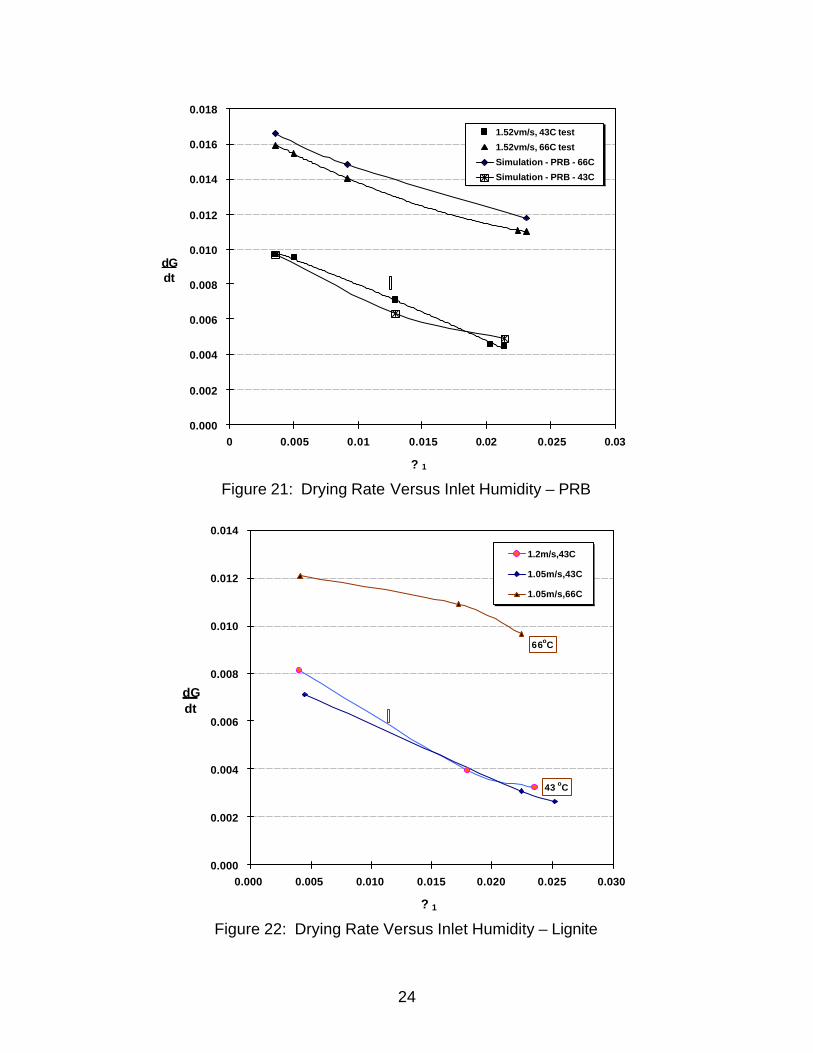
Figure 21 summarizes the effects of inlet specific humidity on PRB drying rates
for 43 and 66°C inlet air temperatures. At 43°C, the drying rate decreased by 60
percent as the inlet air humidity went from 0.005 to 0.022 (kg H2O/kg dry air). At 66°C,
the reduction in drying rate was 31 percent over the same range of inlet humidities.
24
0.000
0.002
0.004
0.006
0.008
0.010
0.012
0.014
0.016
0.018
0 0.005 0.01 0.015 0.02 0.025 0.03
? 1
dGdt
1.52vm/s, 43C test
1.52vm/s, 66C test
Simulation - PRB - 66C
Simulation - PRB - 43C
0.000
0.002
0.004
0.006
0.008
0.010
0.012
0.014
0.000 0.005 0.010 0.015 0.020 0.025 0.030
? 1
dGdt
1.2m/s,43C
1.05m/s,43C
1.05m/s,66C
66oC
43 oC
Figure 21: Drying Rate Versus Inlet Humidity – PRB
Figure 22: Drying Rate Versus Inlet Humidity – Lignite
25
Figure 22 shows lignite drying behavior with variations in inlet air humidity and
drying temperature. Similarly to the PRB, lignite dries more rapidly with lower ω1, and
the effects of inlet air moisture on drying rate are more pronounced at lower drying
temperatures.
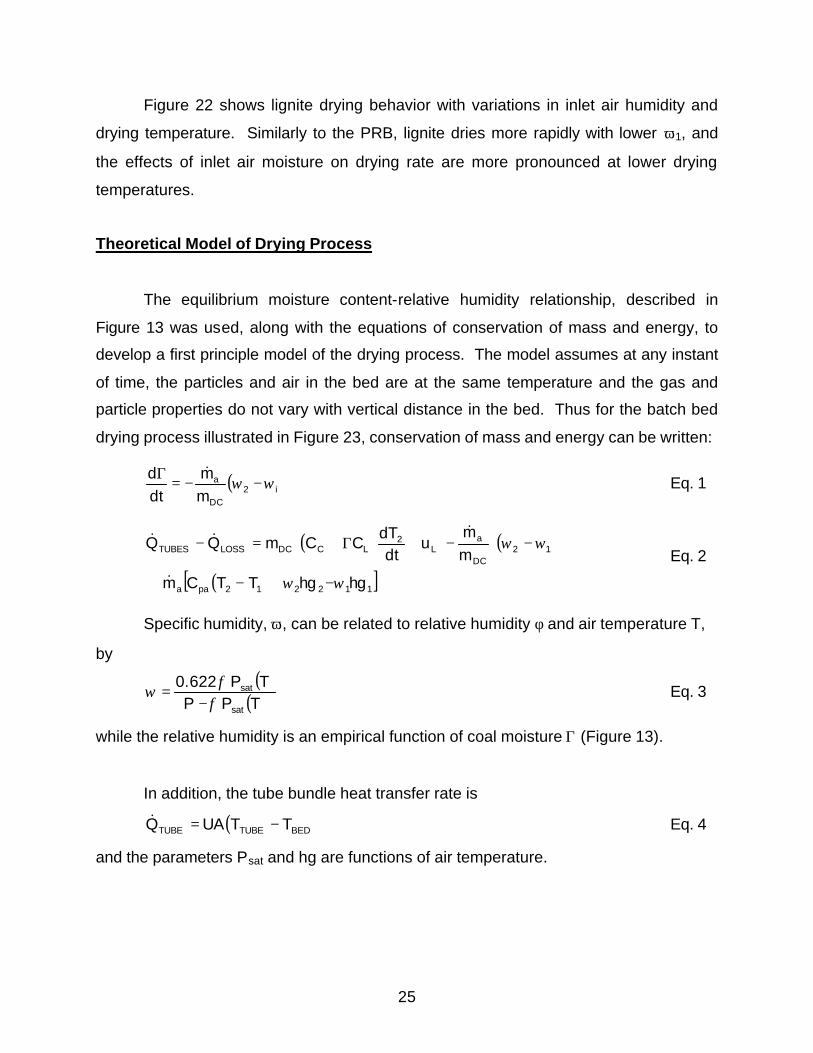
Theoretical Model of Drying Process
The equilibrium moisture content-relative humidity relationship, described in
Figure 13 was used, along with the equations of conservation of mass and energy, to
develop a first principle model of the drying process. The model assumes at any instant
of time, the particles and air in the bed are at the same temperature and the gas and
particle properties do not vary with vertical distance in the bed. Thus for the batch bed
drying process illustrated in Figure 23, conservation of mass and energy can be written:
( )i2DC
a
mm
dtd
ωω −−=Γ &
Eq. 1
( ) ( )
( )[ ]112212paa
12DC
aL
2LCDCLOSSTUBES
hghgTTCm
mm
udt
dTCCmQQ
ωω
ωω
−+−+
−
−+Γ+=−
&
&&&
Eq. 2
Specific humidity, ω, can be related to relative humidity φ and air temperature T,
by
( )( )TPP
TP622.0
sat
sat
φφ
ω−
= Eq. 3
while the relative humidity is an empirical function of coal moisture Γ (Figure 13).
In addition, the tube bundle heat transfer rate is
( )BEDTUBETUBE TTUAQ −=& Eq. 4
and the parameters Psat and hg are functions of air temperature.
26
Air
Air
2
1
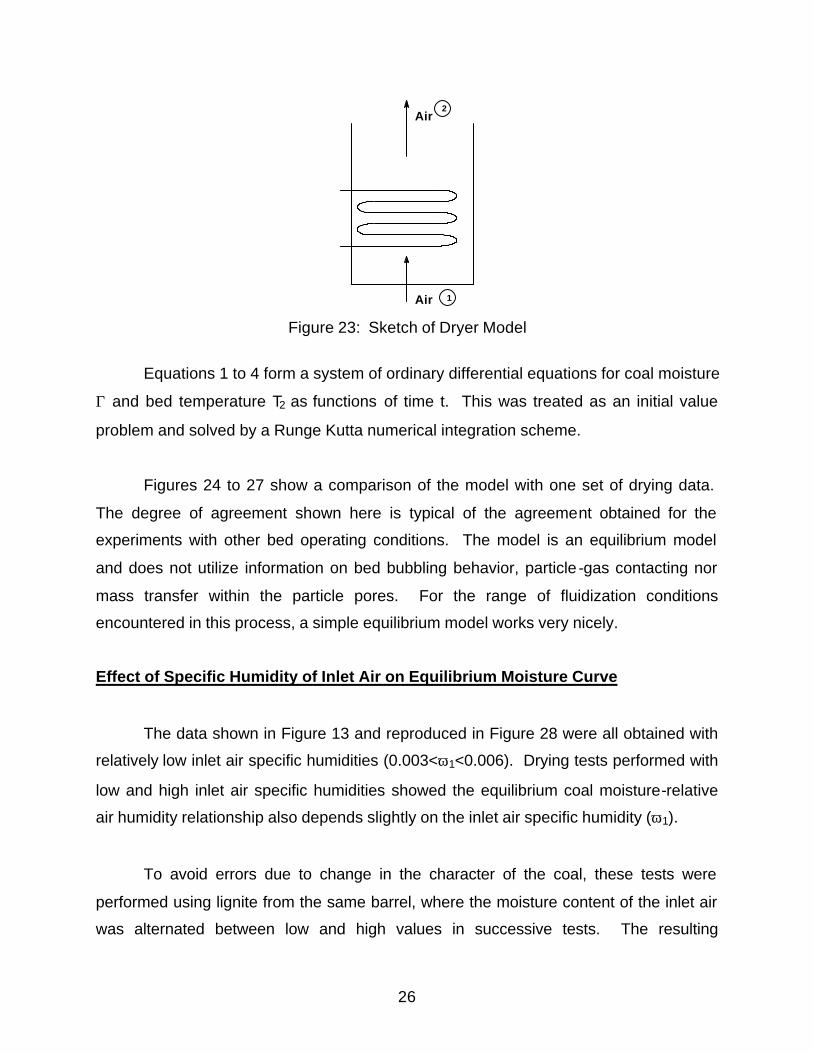
Figure 23: Sketch of Dryer Model
Equations 1 to 4 form a system of ordinary differential equations for coal moisture
Γ and bed temperature T2 as functions of time t. This was treated as an initial value
problem and solved by a Runge Kutta numerical integration scheme.
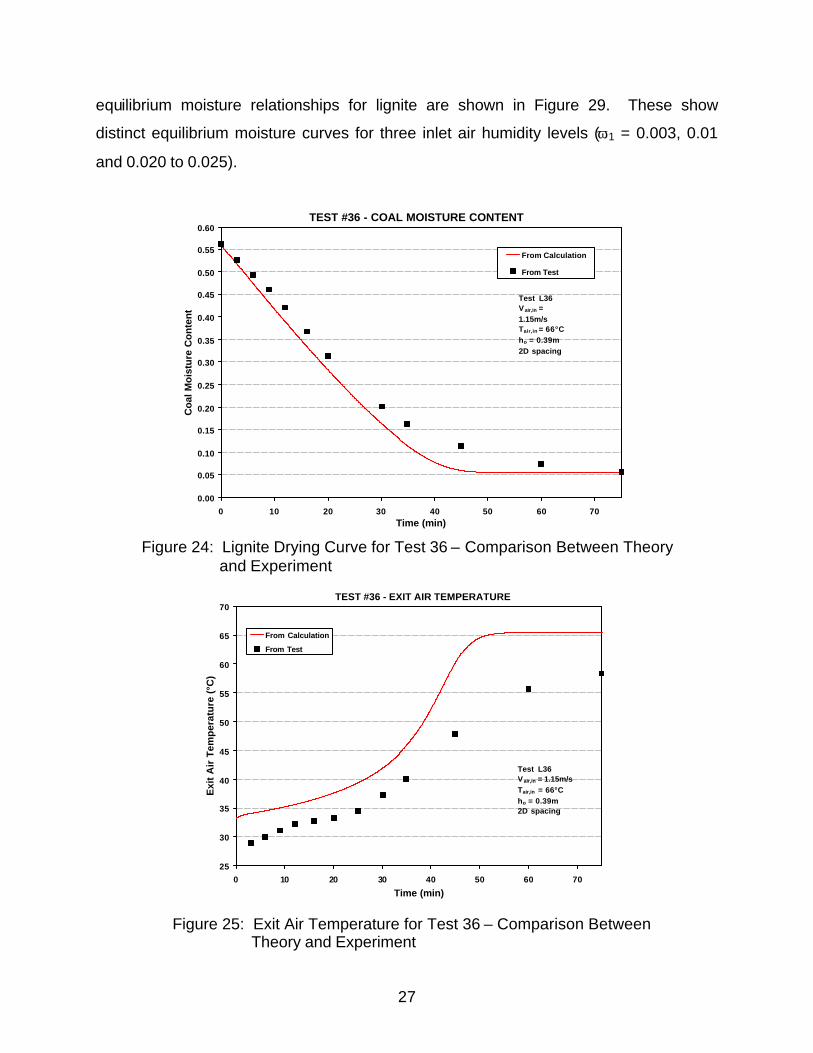
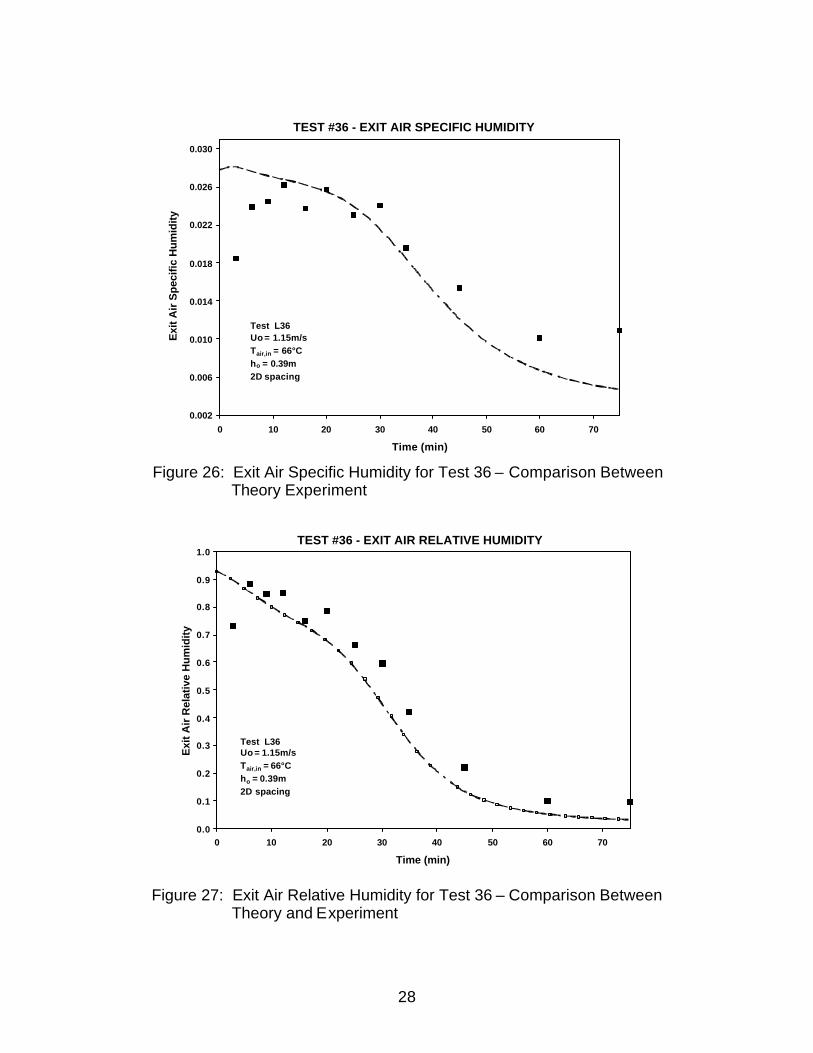
Figures 24 to 27 show a comparison of the model with one set of drying data.
The degree of agreement shown here is typical of the agreement obtained for the
experiments with other bed operating conditions. The model is an equilibrium model
and does not utilize information on bed bubbling behavior, particle -gas contacting nor
mass transfer within the particle pores. For the range of fluidization conditions
encountered in this process, a simple equilibrium model works very nicely.
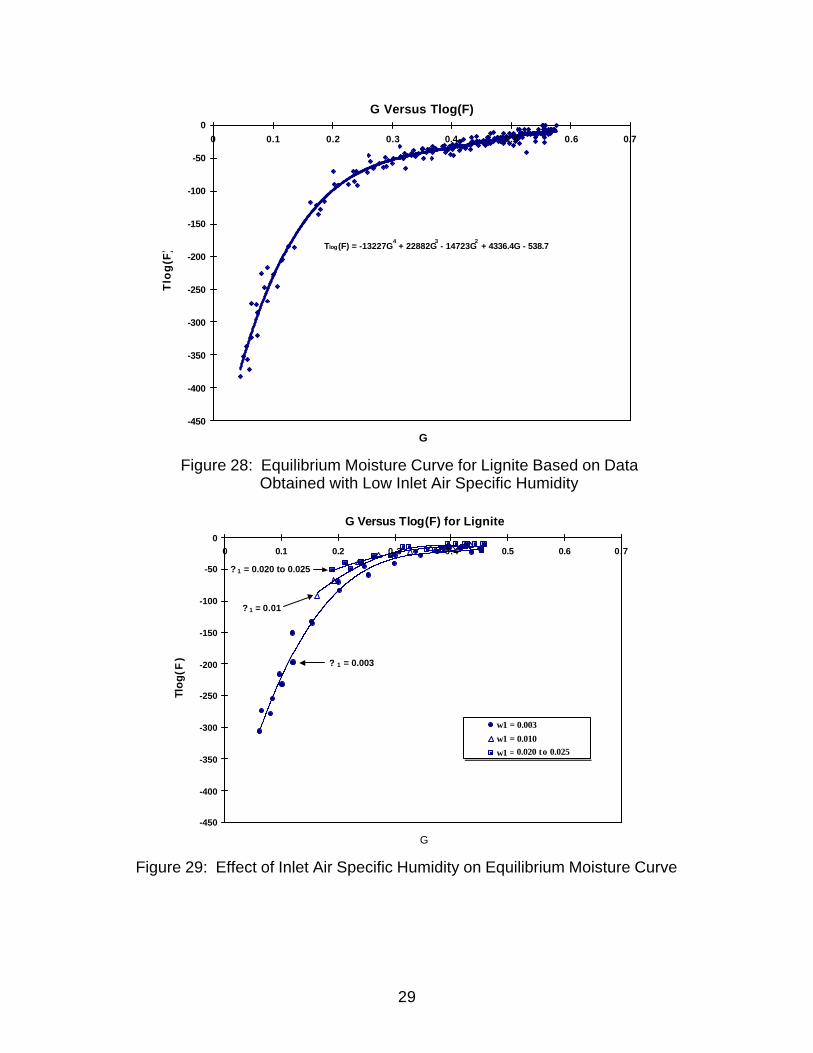
Effect of Specific Humidity of Inlet Air on Equilibrium Moisture Curve
The data shown in Figure 13 and reproduced in Figure 28 were all obtained with
relatively low inlet air specific humidities (0.003<ω1<0.006). Drying tests performed with
low and high inlet air specific humidities showed the equilibrium coal moisture-relative
air humidity relationship also depends slightly on the inlet air specific humidity (ω1).
To avoid errors due to change in the character of the coal, these tests were
performed using lignite from the same barrel, where the moisture content of the inlet air
was alternated between low and high values in successive tests. The resulting
27
TEST #36 - EXIT AIR TEMPERATURE
25
30
35
40
45
50
55
60
65
70
0 10 20 30 40 50 60 70
Time (min)
Exi
t A
ir T
emp
erat
ure
(°C
)
From Calculation
From Test
Test L36Vair,in = 1.15m/sTair,in = 66°Cho = 0.39m2D spacing
TEST #36 - COAL MOISTURE CONTENT
0.00
0.05
0.10
0.15
0.20
0.25
0.30
0.35
0.40
0.45
0.50
0.55
0.60
0 10 20 30 40 50 60 70Time (min)
Co
al M
ois
ture
Co
nte
nt
From Calculation
From Test
Test L36Vair,in = 1.15m/sTair,in = 66°Cho = 0.39m2D spacing
equilibrium moisture relationships for lignite are shown in Figure 29. These show
distinct equilibrium moisture curves for three inlet air humidity levels (ω1 = 0.003, 0.01
and 0.020 to 0.025).
Figure 24: Lignite Drying Curve for Test 36 – Comparison Between Theory and Experiment
Figure 25: Exit Air Temperature for Test 36 – Comparison Between Theory and Experiment
28
TEST #36 - EXIT AIR SPECIFIC HUMIDITY
0.002
0.006
0.010
0.014
0.018
0.022
0.026
0.030
0 10 20 30 40 50 60 70
Time (min)
Exi
t A
ir S
pec
ific
Hu
mid
ity
Test L36Uo = 1.15m/sTair,in = 66°Cho = 0.39m2D spacing
TEST #36 - EXIT AIR RELATIVE HUMIDITY
0.0
0.1
0.2
0.3
0.4
0.5
0.6
0.7
0.8
0.9
1.0
0 10 20 30 40 50 60 70
Time (min)
Exi
t A
ir R
elat
ive
Hu
mid
ity
Test L36Uo = 1.15m/sTair,in = 66°Cho = 0.39m2D spacing
Figure 26: Exit Air Specific Humidity for Test 36 – Comparison Between Theory Experiment
Figure 27: Exit Air Relative Humidity for Test 36 – Comparison Between Theory and Experiment
29
G Versus Tlog(F)
Tlog(F) = -13227G4 + 22882G
3 - 14723G
2 + 4336.4G - 538.7
-450
-400
-350
-300
-250
-200
-150
-100
-50
00 0.1 0.2 0.3 0.4 0.5 0.6 0.7
G
Tlo
g(F
)
G Versus Tlog(F) for Lignite
-450
-400
-350
-300
-250
-200
-150
-100
-50
00 0.1 0.2 0.3 0.4 0.5 0.6 0.7
G
Tlo
g(F
)
ω1 = 0.003
ω1 = 0.010
ω1 = 0.020 − 0.025
? 1 = 0.01
? 1 = 0.003
? 1 = 0.020 to 0.025
0.020 το 0.025
Figure 28: Equilibrium Moisture Curve for Lignite Based on Data Obtained with Low Inlet Air Specific Humidity
Figure 29: Effect of Inlet Air Specific Humidity on Equilibrium Moisture Curve
30
G Versus Tlog(F) for PRB Coal
-350
-300
-250
-200
-150
-100
-50
00 0.05 0.1 0.15 0.2 0.25 0.3 0.35 0.4 0.45
G
Tlo
g(F
)
0.0230.021
0.0090.004
Inlet Moisture, ω1
Calculations using the drying model were then performed to determine the effect
of the choice of equilibrium moisture model on predicted values of Γ, φ, T and ω2.
The conclusion from these analyses for lignite is that the choice of equilibrium
moisture model does not significantly affect the computed values of coal moisture, exit
air temperature or specific humidity, but it does affect computed exit air relative
humidity. For best prediction accuracy for φ, it is thus recommended that equilibrium
moisture data be used which has approximately the same inlet air specific humidity as
the conditions to be modeled.
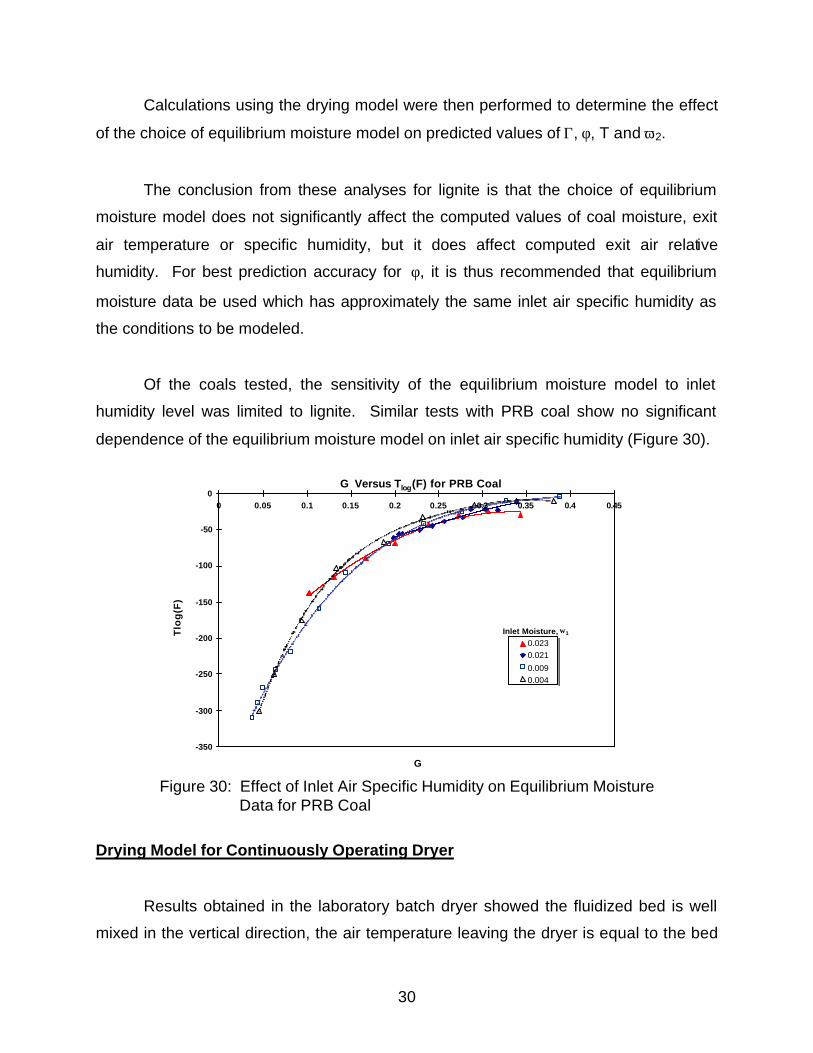
Of the coals tested, the sensitivity of the equilibrium moisture model to inlet
humidity level was limited to lignite. Similar tests with PRB coal show no significant
dependence of the equilibrium moisture model on inlet air specific humidity (Figure 30).
Figure 30: Effect of Inlet Air Specific Humidity on Equilibrium Moisture Data for PRB Coal
Drying Model for Continuously Operating Dryer
Results obtained in the laboratory batch dryer showed the fluidized bed is well
mixed in the vertical direction, the air temperature leaving the dryer is equal to the bed
31
temperature, and coal drying rate can be accurately predicted using a system of
differential equations involving conservation of mass and energy along with an empirical
expression relating equilibrium coal moisture to bed temperature and relative humidity
of the air leaving the bed. This same approach was used to derive a system of
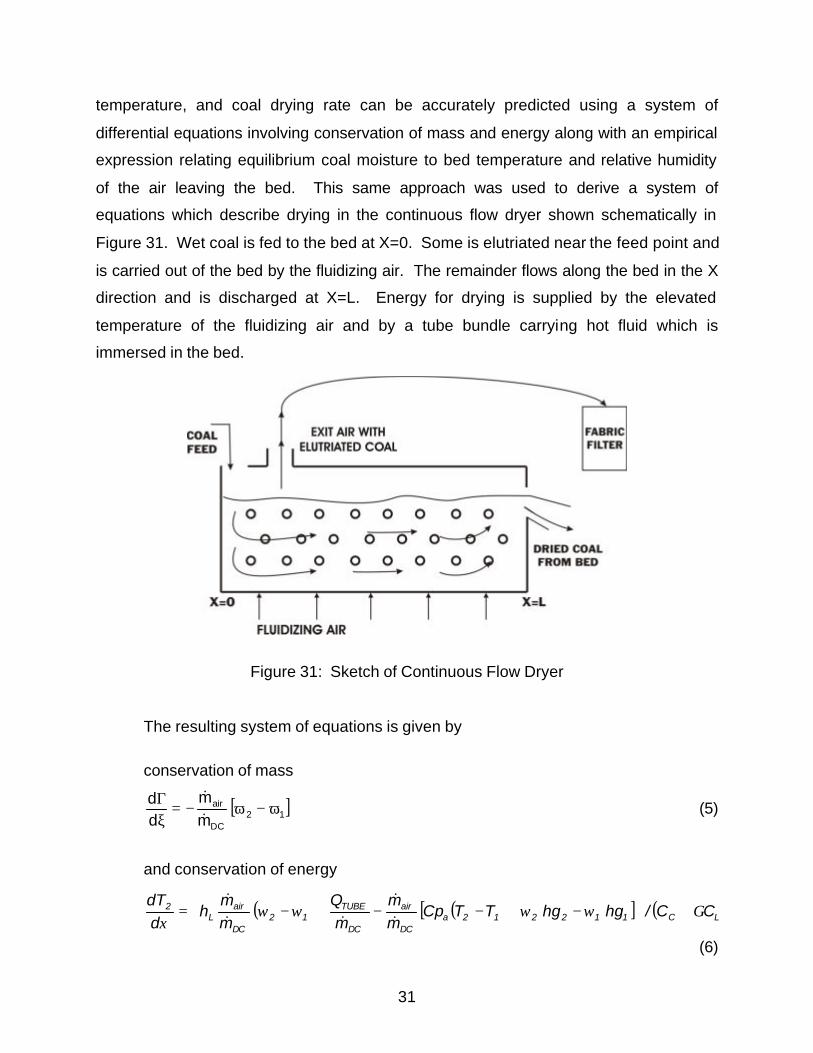
equations which describe drying in the continuous flow dryer shown schematically in
Figure 31. Wet coal is fed to the bed at X=0. Some is elutriated near the feed point and
is carried out of the bed by the fluidizing air. The remainder flows along the bed in the X
direction and is discharged at X=L. Energy for drying is supplied by the elevated
temperature of the fluidizing air and by a tube bundle carrying hot fluid which is
immersed in the bed.
Figure 31: Sketch of Continuous Flow Dryer
The resulting system of equations is given by
conservation of mass
[ ]12DC
air mm
dd
ω−ω−=ξΓ
&&
(5)
and conservation of energy
( ) ( )[ ] ( )LC112212aDC
air
DC
TUBE12
DC
airL
2 CC/hg hg TTCpmm
mQ
mm
hddT
Γωωωωξ
+
−+−−+−=&&
&&&
(6)
32
where ξ = L/X
L = Length of Bed
X = Horizontal Distance from Inlet of Bed
DCm& = Mass Flow Rate of Dry Coal
airm& = Mass Flow Rate of Dry Air
' = Coal Moisture Content on Dry Basis [ ]coal dry kg / OH kg 2
ω = Specific Humidity
QTUBE = Rate of In-Bed Heat Transfer
T1 = Inlet Temperature of Air
T2 = Bed Temperature and Exit Air Temperature
φ = Relative Humidity of Air Leaving Bed
Cpa; Cc; CL = Specific Heats
hL = Enthalpy of Liquid H2O
hg = Enthalpy of Saturated Vapor
subscript 1 = Air or Coal Entering Bed
subscript 2 = Air or Coal Leaving Bed
The relation between coal moisture and temperature and relative humidity of air
leaving the bed ( )φ=Γ logTf 2 is given graphically in Figure 17 for North Dakota lignite
and PRB coals.
Equations 5 and 6 show that for given values of inlet coal temperature and
moisture level and inlet air temperature and relative humidity, the solutions to the
equations depend on DC
air
mm&&
and DC
TUBE
mQ
&.
The term DC
TUBE
mQ
& can also be written
DCavgToDC
TUBE m /T AUm
Q &&
∆×=
33
Test #23 - Coal Moisture Content
0.00
0.05
0.10
0.15
0.20
0.25
0.30
0.35
0.40
0.45
0.50
0.55
0.60
0.65
0.70
0.00 0.10 0.20 0.30 0.40 0.50 0.60 0.70 0.80 0.90 1.00
?
Coa
l Moi
stur
e C
onte
nt (
Dry
Bas
is)
Inlet Specific Humidity = 0.0036 kg/kgInlet Air Temperature = 72°CFlow Rate of Air = 182 Kg/minFlow Rate of Coal = 14 Kg/min Initial Moisture Content = 0.464 Average Heater Temperature= 75°CQtubes = 71902 Watts
Simulation Γ2 = 0.15Measured Γ2 = 0.18
ξ
where Uo = Overall Heat Transfer Coefficient
AT = Tube Surface Area
∆Tavg = Mean Temperature Difference Between In-Bed Coil and Bed
Comparisons of Drying Model and Pilot Dryer Data
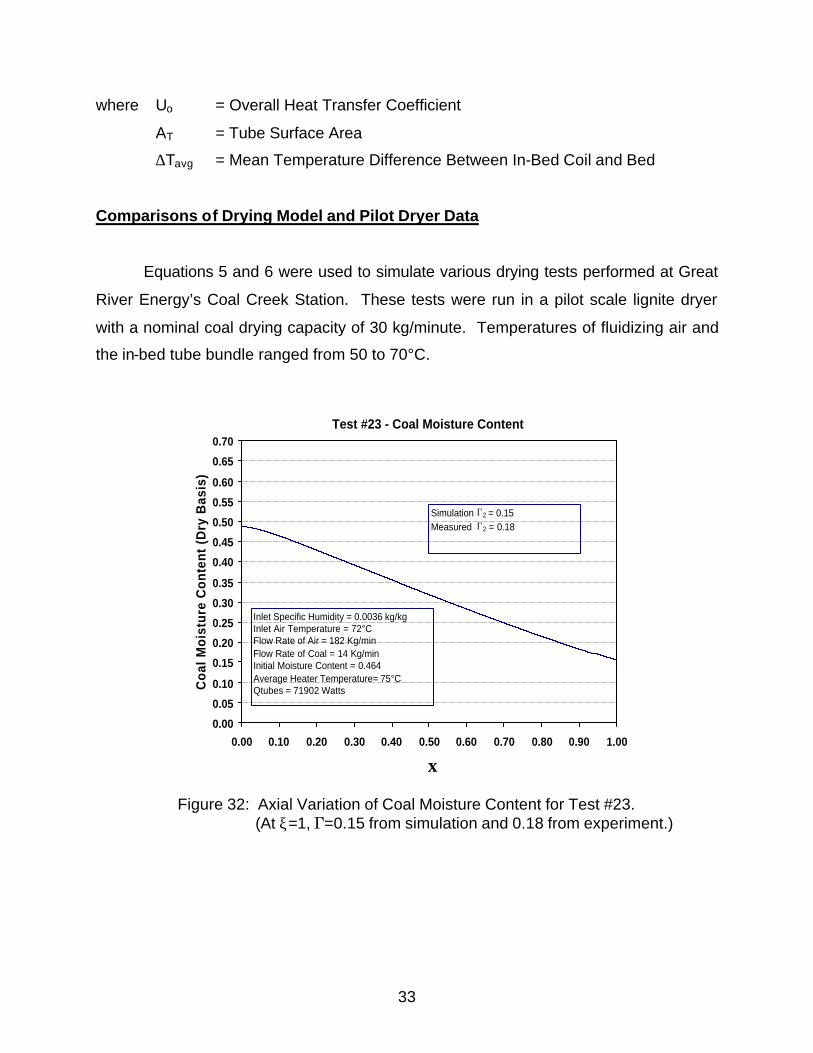
Equations 5 and 6 were used to simulate various drying tests performed at Great
River Energy’s Coal Creek Station. These tests were run in a pilot scale lignite dryer
with a nominal coal drying capacity of 30 kg/minute. Temperatures of fluidizing air and
the in-bed tube bundle ranged from 50 to 70°C.
Figure 32: Axial Variation of Coal Moisture Content for Test #23. (At ξ=1, '=0.15 from simulation and 0.18 from experiment.)
34
Test #23 - Exit Air Temperature
0
5
10
15
20
25
30
35
40
45
50
0.00 0.10 0.20 0.30 0.40 0.50 0.60 0.70 0.80 0.90 1.00
?
Exi
t A
ir T
empe
ratu
re (
°C)
Inlet Specific Humidity = 0.0036 kg/kgInlet Air Temperature = 72°CFlow Rate of Air = 182 Kg/minFlow Rate of Coal = 14 Kg/min Initial Moisture Content = 0.464 Average Heater Temperature = 75°CQtubes = 71902 Watts
Simulation Tavg = 38°CMeasured Tavg = 37°C
ξ
Test #23 - Exit Air Specific Humidity
0.000
0.005
0.010
0.015
0.020
0.025
0.030
0.035
0.040
0.045
0.050
0.00 0.10 0.20 0.30 0.40 0.50 0.60 0.70 0.80 0.90 1.00
?
Exi
t A
ir S
pec
ific
Hu
mid
ity
Inlet Specific Humidity = 0.0036 kg/kgInlet Air Temperature = 72°CFlow Rate of Air = 182 Kg/minFlow Rate of Coal = 14 Kg/min Initial Moisture Content = 0.464 Average Heater Temperature = 75°CQtubes = 71902 Watts
Simulation ?avg = 0.027Measured ?avg = 0.027
ξ
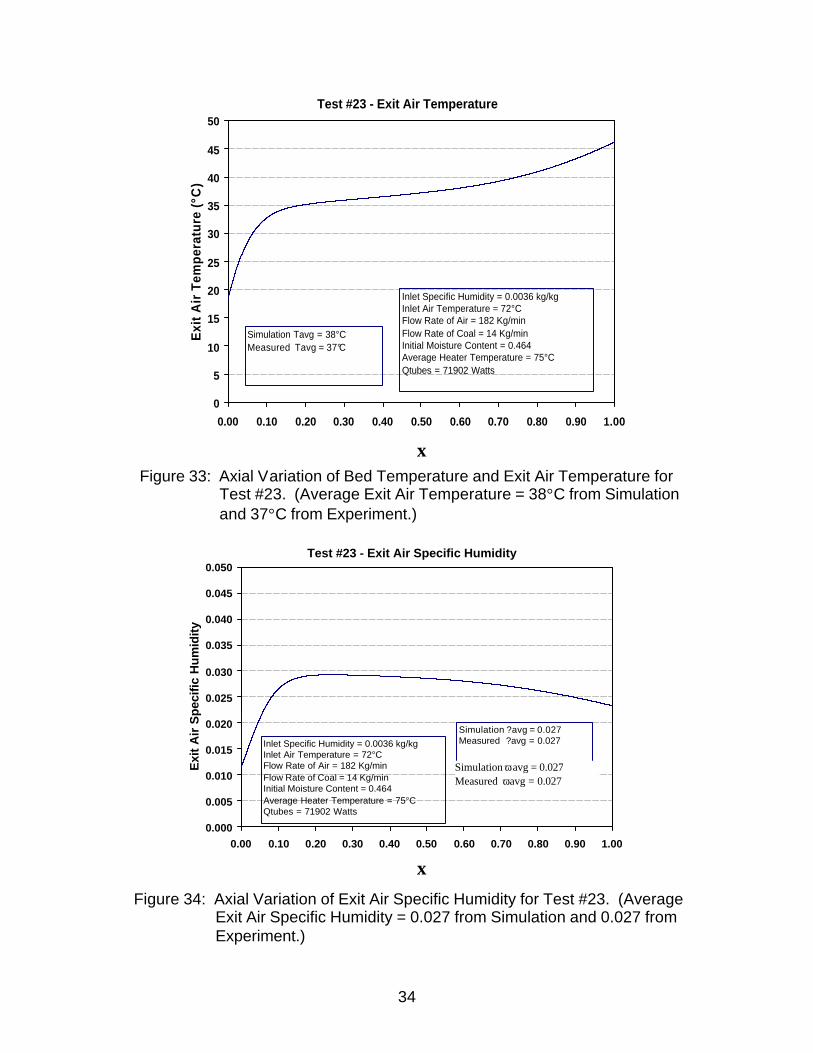
Figure 33: Axial Variation of Bed Temperature and Exit Air Temperature for
Test #23. (Average Exit Air Temperature = 38°C from Simulation and 37°C from Experiment.)
Figure 34: Axial Variation of Exit Air Specific Humidity for Test #23. (Average Exit Air Specific Humidity = 0.027 from Simulation and 0.027 from Experiment.)
Simulation ωavg = 0.027 Measured ωavg = 0.027
35
Test #23 - Exit Air Relative Humidity
0.0
0.1
0.2
0.3
0.4
0.5
0.6
0.7
0.8
0.9
1.0
0.00 0.10 0.20 0.30 0.40 0.50 0.60 0.70 0.80 0.90 1.00
?
Exi
t A
ir R
elat
ive
Hum
idit
y
Inlet Specific Humidity = 0.0036 kg/kgInlet Air Temperature = 72°CFlow Rate of Air = 182 Kg/minFlow Rate of Coal = 14 Kg/min Initial Moisture Content = 0.464 Average Heater Temperature = 75°CQtubes = 71902 Watts
Simulation F avg = 0.67Measured F avg = 0.67
ξ
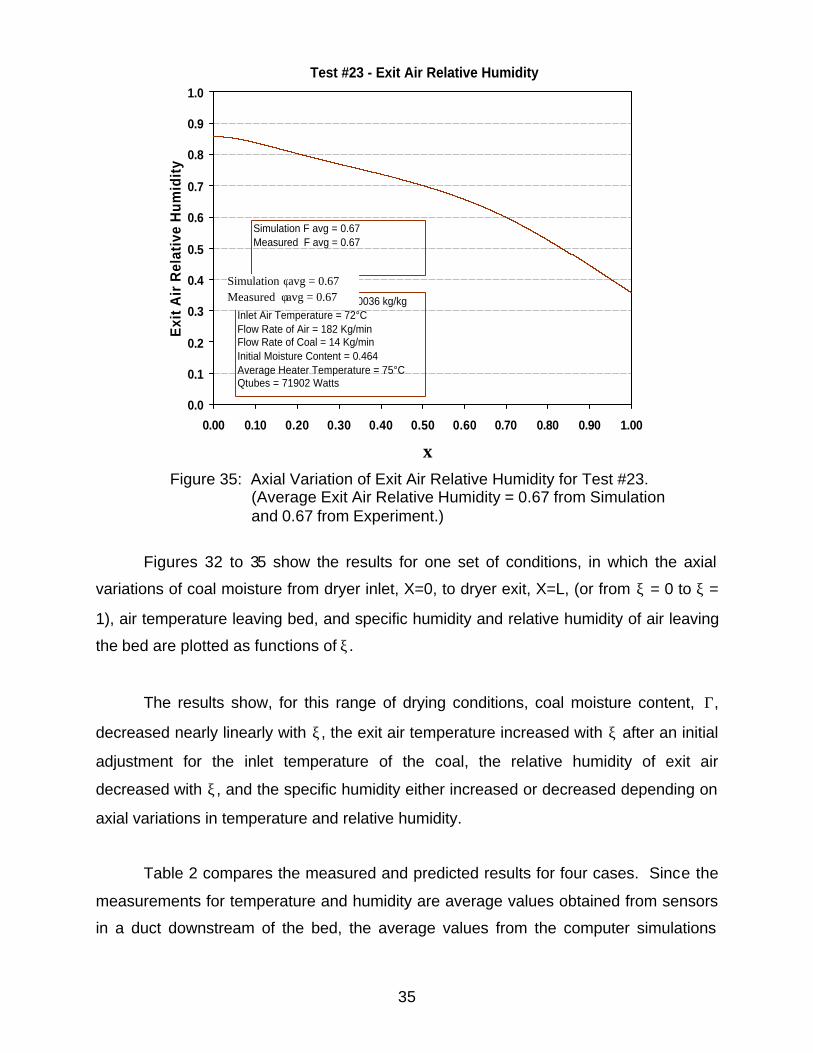
Figure 35: Axial Variation of Exit Air Relative Humidity for Test #23.
(Average Exit Air Relative Humidity = 0.67 from Simulation and 0.67 from Experiment.)
Figures 32 to 35 show the results for one set of conditions, in which the axial
variations of coal moisture from dryer inlet, X=0, to dryer exit, X=L, (or from ξ = 0 to ξ =
1), air temperature leaving bed, and specific humidity and relative humidity of air leaving
the bed are plotted as functions of ξ.
The results show, for this range of drying conditions, coal moisture content, Γ,
decreased nearly linearly with ξ, the exit air temperature increased with ξ after an initial
adjustment for the inlet temperature of the coal, the relative humidity of exit air
decreased with ξ, and the specific humidity either increased or decreased depending on
axial variations in temperature and relative humidity.
Table 2 compares the measured and predicted results for four cases. Since the
measurements for temperature and humidity are average values obtained from sensors
in a duct downstream of the bed, the average values from the computer simulations
Simulation φavg = 0.67 Measured φavg = 0.67
36
COMPARISON OF Γ1-Γ2
0.00
0.05
0.10
0.15
0.20
0.25
0.30
0.35
0.40
0.00 0.05 0.10 0.15 0.20 0.25 0.30 0.35 0.40
Test Result (kg/kg dry coal)
Sim
ula
tio
n R
esu
lt (k
g/k
g d
ry c
oal
)
were obtained by integrating air temperature and specific humidity from ξ = 0 to ξ = 1.
The computed average values of relative humidity, φ, were obtained from the computed
average values of Tair and ω, using a psychrometric chart.
Table 2
Comparison of Predicted and Measured Performance for Tests 4, 20, 23 and 30
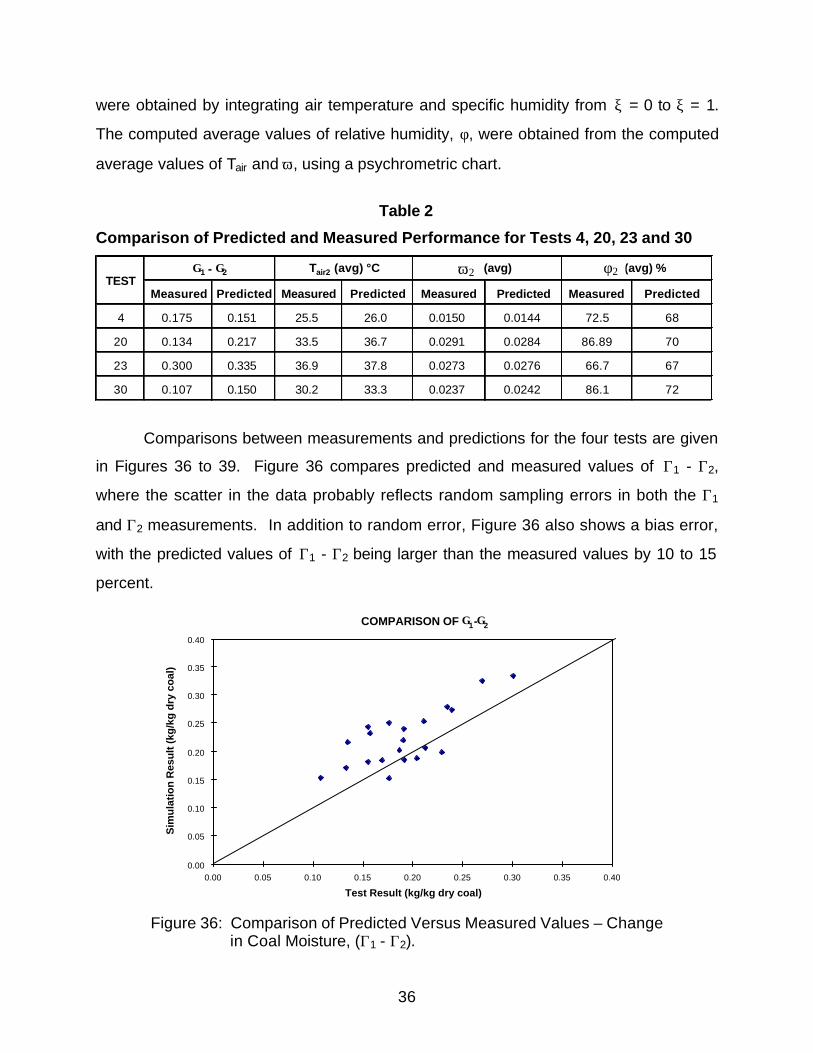
Comparisons between measurements and predictions for the four tests are given
in Figures 36 to 39. Figure 36 compares predicted and measured values of Γ1 - Γ2,
where the scatter in the data probably reflects random sampling errors in both the Γ1
and Γ2 measurements. In addition to random error, Figure 36 also shows a bias error,
with the predicted values of Γ1 - Γ2 being larger than the measured values by 10 to 15
percent.
Figure 36: Comparison of Predicted Versus Measured Values – Change in Coal Moisture, (Γ1 - Γ2).
Measured Predicted Measured Predicted Measured Predicted Measured Predicted
4 0.175 0.151 25.5 26.0 0.0150 0.0144 72.5 68
20 0.134 0.217 33.5 36.7 0.0291 0.0284 86.89 70
23 0.300 0.335 36.9 37.8 0.0273 0.0276 66.7 67
30 0.107 0.150 30.2 33.3 0.0237 0.0242 86.1 72
F 2 (avg) %Γ1 - Γ2TEST
Tair2 (avg) °C ? 2 (avg)ω2 φ2
37
Comparison of Average Bed Temperature
0
5
10
15
20
25
30
35
40
0 5 10 15 20 25 30 35 40
Test Result (°C)
Sim
ula
tio
n R
esu
lt (
°C)
COMPARISON OF OUTLET SPECIFIC HUMIDITY
0.0000
0.0050
0.0100
0.0150
0.0200
0.0250
0.0300
0.0350
0.0000 0.0050 0.0100 0.0150 0.0200 0.0250 0.0300 0.0350
Test Result (kg/kg dry air)
Sim
ula
tion
Res
ult
(kg
/kg
dry
air
)
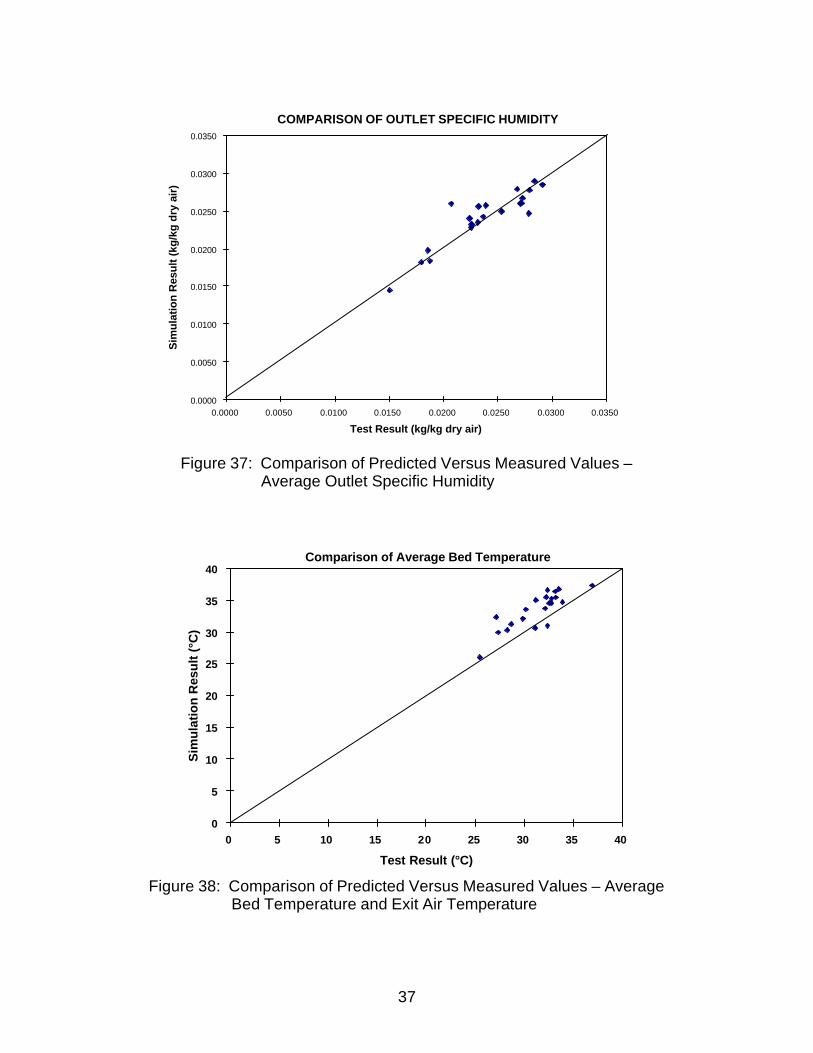
Figure 37: Comparison of Predicted Versus Measured Values – Average Outlet Specific Humidity
Figure 38: Comparison of Predicted Versus Measured Values – Average Bed Temperature and Exit Air Temperature
38
COMPARISON OF OUTLET RELATIVE HUMIDITY
0
10
20
30
40
50
60
70
80
90
100
0 10 20 30 40 50 60 70 80 90 100
Test Result (%)
Sim
ulat
ion
Res
ult (
%)
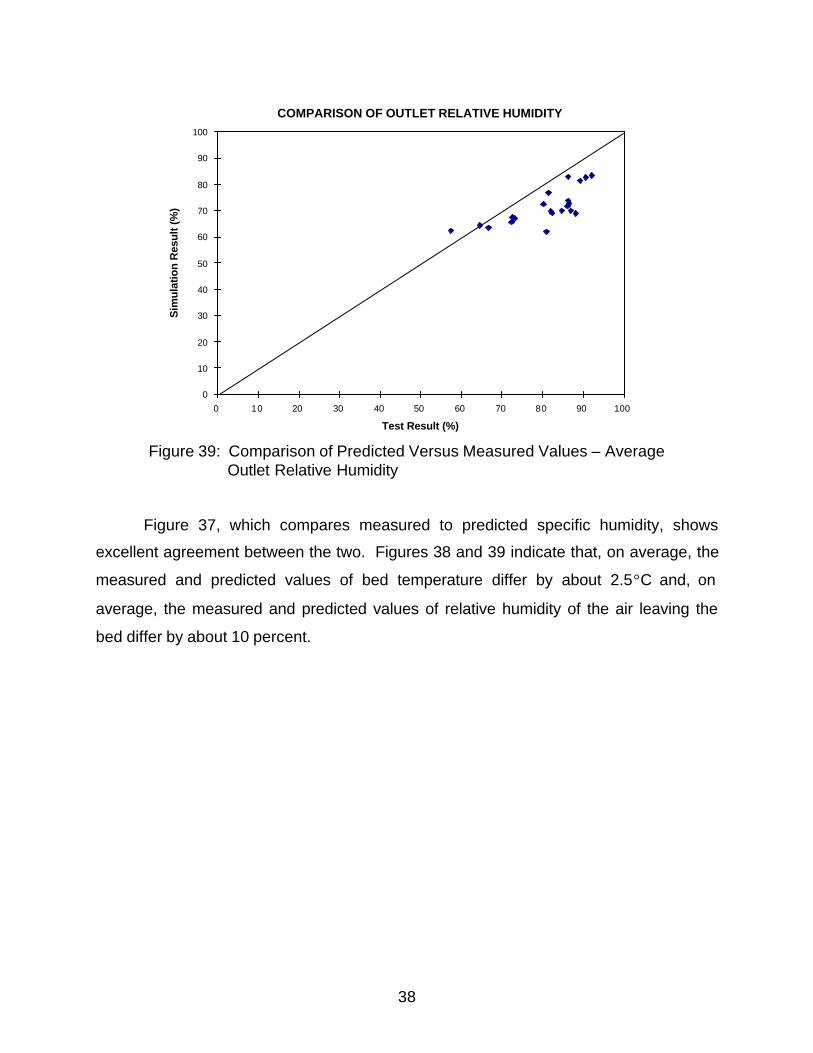
Figure 39: Comparison of Predicted Versus Measured Values – Average Outlet Relative Humidity
Figure 37, which compares measured to predicted specific humidity, shows
excellent agreement between the two. Figures 38 and 39 indicate that, on average, the
measured and predicted values of bed temperature differ by about 2.5°C and, on
average, the measured and predicted values of relative humidity of the air leaving the
bed differ by about 10 percent.
39
PART II – IMPACTS OF COAL DRYING ON UNIT OPERATIONS
INTRODUCTION
The second part of the project involved the design of drying systems for lignite
and PRB coal-fired power plants and analysis of the effects of drying system operation
on cooling tower makeup water, unit heat rate, auxiliary power and stack emissions.
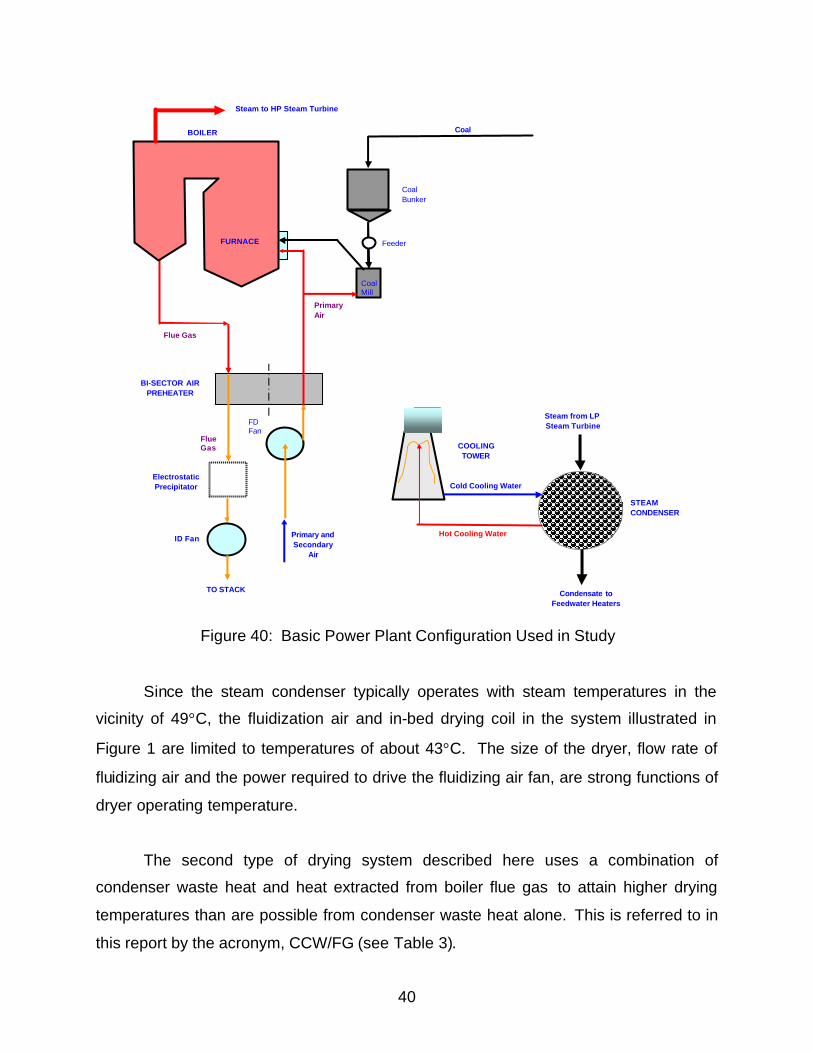
Figure 40 shows the basic power plant configuration which was used in this
study. The boiler is a balanced draft boiler with both forced draft (FD) and induced draft
(ID) fans. A bi-sector type air preheater transfers thermal energy from the hot flue gas
leaving the economizer to the relatively low temperature air leaving the FD fans. Waste
heat from the steam condenser is carried by hot circulating water to an evaporative
cooling tower, with cold circulating water being returned to the condenser.
Two drying system designs are described in this report. One, referred to in this
report by the acronym, CCW, relies on waste heat extracted from the hot circulating
water leaving the condenser for drying. This drying scheme, which is similar to that
which was shown in Figure 1, involves fluidized bed dryers, where waste heat from the
steam condenser is used to preheat the fluidization air and provide additional heat for
drying using in-bed heat exchangers. Coal is fed to the dryers and is then transported
with reduced moisture to the pulverizers before being conveyed to the burners by
transport air. After leaving a dryer, the fluidization air must pass through a baghouse to
remove elutriated coal particles. Besides the fan for the fluidization air, other equipment
requiring station service power includes the coal crushers, pulverizers, and forced draft
and induced draft fans.
40
Hot Cooling Water
Cold Cooling Water
COOLINGTOWER
BI-SECTOR AIR PREHEATER
PrimaryAir
Primary and Secondary
Air
FD Fan
Coal Mill
Coal
Flue Gas
Flue Gas
FURNACE
BOILER
Feeder
CoalBunker
Steam from LPSteam Turbine
Steam to HP Steam Turbine
Condensate toFeedwater Heaters
STEAMCONDENSER
ElectrostaticPrecipitator
ID Fan
TO STACK
Figure 40: Basic Power Plant Configuration Used in Study
Since the steam condenser typically operates with steam temperatures in the
vicinity of 49°C, the fluidization air and in-bed drying coil in the system illustrated in
Figure 1 are limited to temperatures of about 43°C. The size of the dryer, flow rate of
fluidizing air and the power required to drive the fluidizing air fan, are strong functions of
dryer operating temperature.
The second type of drying system described here uses a combination of
condenser waste heat and heat extracted from boiler flue gas to attain higher drying
temperatures than are possible from condenser waste heat alone. This is referred to in
this report by the acronym, CCW/FG (see Table 3).
41
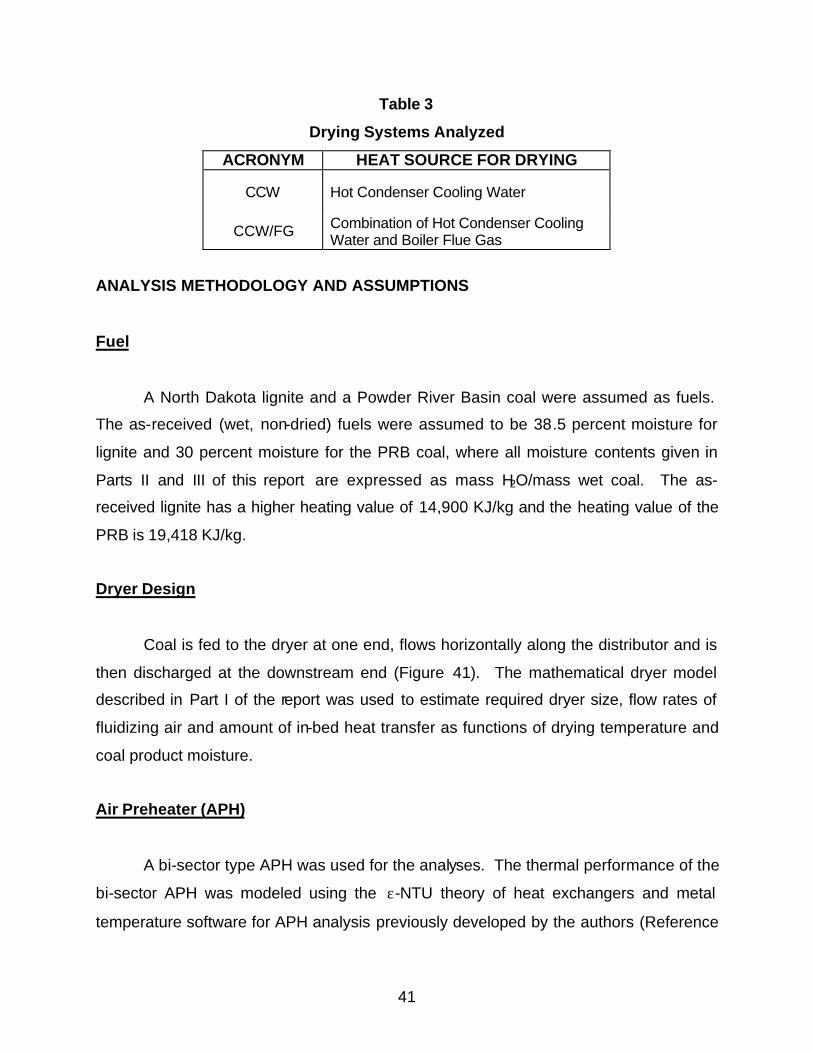
Table 3
Drying Systems Analyzed
ACRONYM HEAT SOURCE FOR DRYING
CCW Hot Condenser Cooling Water
CCW/FG Combination of Hot Condenser Cooling Water and Boiler Flue Gas
ANALYSIS METHODOLOGY AND ASSUMPTIONS
Fuel
A North Dakota lignite and a Powder River Basin coal were assumed as fuels.
The as-received (wet, non-dried) fuels were assumed to be 38.5 percent moisture for
lignite and 30 percent moisture for the PRB coal, where all moisture contents given in
Parts II and III of this report are expressed as mass H2O/mass wet coal. The as-
received lignite has a higher heating value of 14,900 KJ/kg and the heating value of the
PRB is 19,418 KJ/kg.
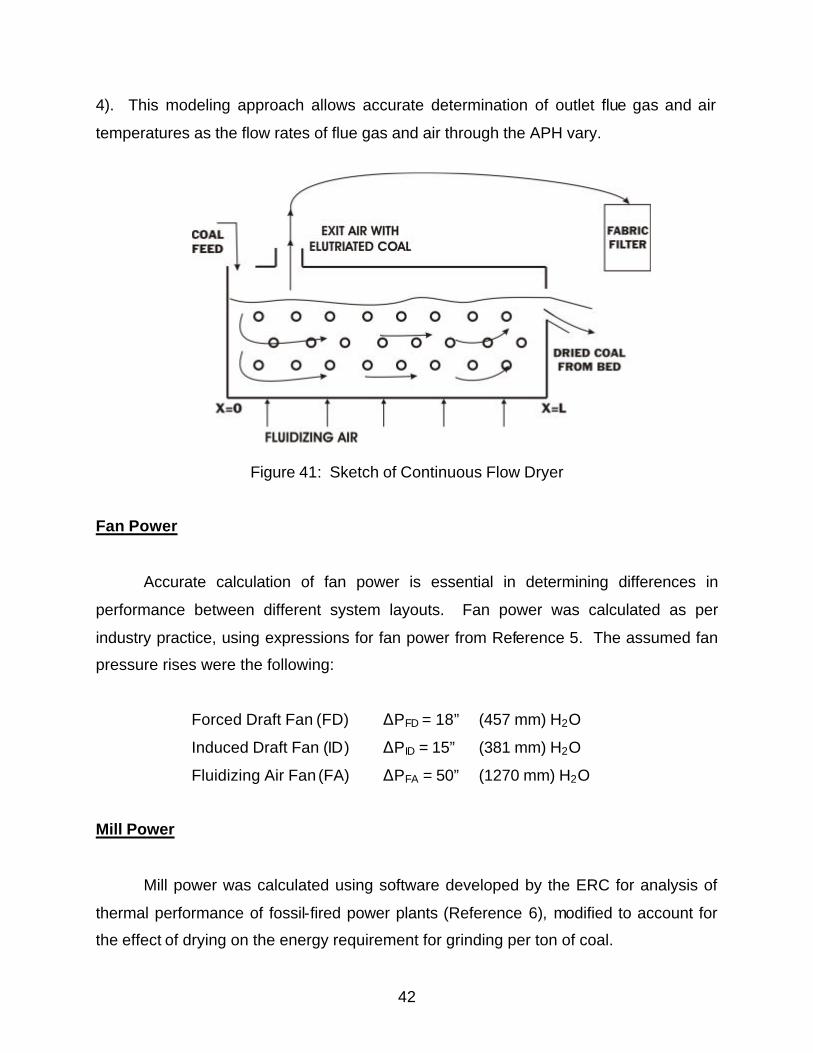
Dryer Design
Coal is fed to the dryer at one end, flows horizontally along the distributor and is
then discharged at the downstream end (Figure 41). The mathematical dryer model
described in Part I of the report was used to estimate required dryer size, flow rates of
fluidizing air and amount of in-bed heat transfer as functions of drying temperature and
coal product moisture.
Air Preheater (APH)
A bi-sector type APH was used for the analyses. The thermal performance of the
bi-sector APH was modeled using the ε-NTU theory of heat exchangers and metal
temperature software for APH analysis previously developed by the authors (Reference
42
4). This modeling approach allows accurate determination of outlet flue gas and air
temperatures as the flow rates of flue gas and air through the APH vary.
Figure 41: Sketch of Continuous Flow Dryer
Fan Power
Accurate calculation of fan power is essential in determining differences in
performance between different system layouts. Fan power was calculated as per
industry practice, using expressions for fan power from Reference 5. The assumed fan
pressure rises were the following:
Forced Draft Fan (FD) )PFD = 18” (457 mm) H2O
Induced Draft Fan (ID) )PID = 15” (381 mm) H2O
Fluidizing Air Fan (FA) )PFA = 50” (1270 mm) H2O
Mill Power
Mill power was calculated using software developed by the ERC for analysis of
thermal performance of fossil-fired power plants (Reference 6), modified to account for
the effect of drying on the energy requirement for grinding per ton of coal.
43
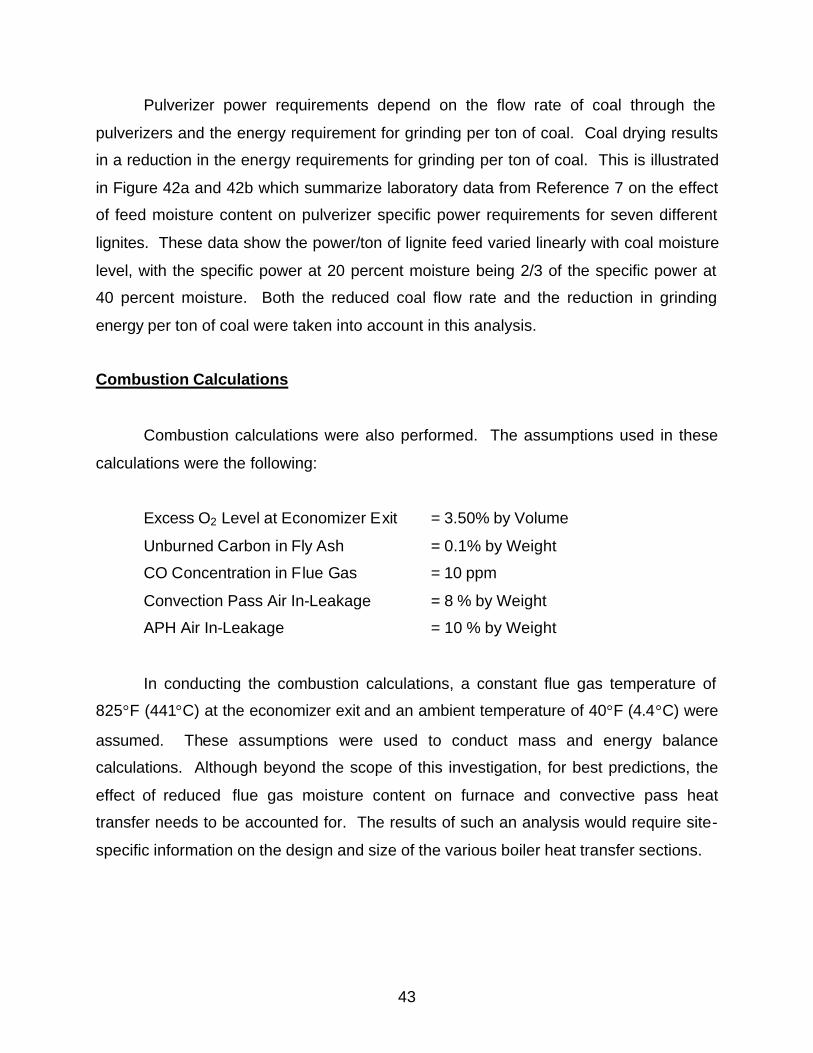
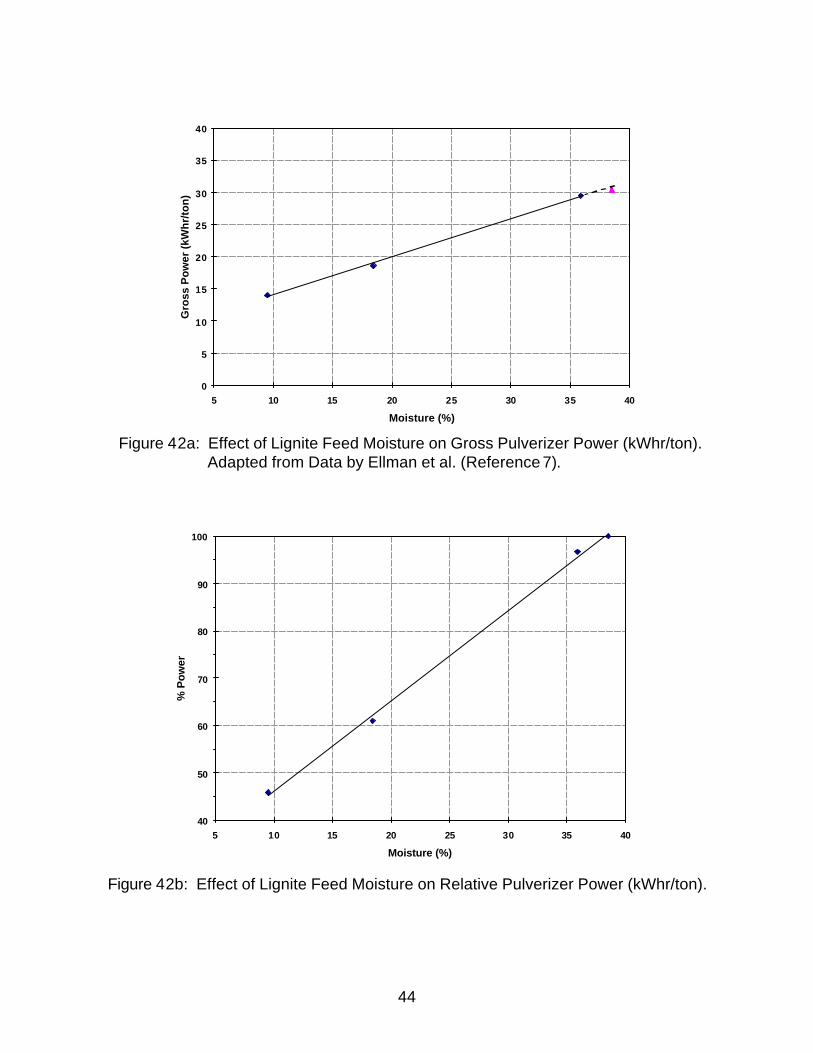
Pulverizer power requirements depend on the flow rate of coal through the
pulverizers and the energy requirement for grinding per ton of coal. Coal drying results
in a reduction in the energy requirements for grinding per ton of coal. This is illustrated
in Figure 42a and 42b which summarize laboratory data from Reference 7 on the effect
of feed moisture content on pulverizer specific power requirements for seven different
lignites. These data show the power/ton of lignite feed varied linearly with coal moisture
level, with the specific power at 20 percent moisture being 2/3 of the specific power at
40 percent moisture. Both the reduced coal flow rate and the reduction in grinding
energy per ton of coal were taken into account in this analysis.
Combustion Calculations
Combustion calculations were also performed. The assumptions used in these
calculations were the following:
Excess O2 Level at Economizer Exit = 3.50% by Volume
Unburned Carbon in Fly Ash = 0.1% by Weight
CO Concentration in Flue Gas = 10 ppm
Convection Pass Air In-Leakage = 8 % by Weight
APH Air In-Leakage = 10 % by Weight
In conducting the combustion calculations, a constant flue gas temperature of
825°F (441°C) at the economizer exit and an ambient temperature of 40°F (4.4°C) were
assumed. These assumptions were used to conduct mass and energy balance
calculations. Although beyond the scope of this investigation, for best predictions, the
effect of reduced flue gas moisture content on furnace and convective pass heat
transfer needs to be accounted for. The results of such an analysis would require site-
specific information on the design and size of the various boiler heat transfer sections.
44
40
50
60
70
80
90
100
5 10 15 20 25 30 35 40
Moisture (%)
% P
ow
er
0
5
10
15
20
25
30
35
40
5 10 15 20 25 30 35 40
Moisture (%)
Gro
ss P
ow
er (
kWh
r/to
n)
Figure 42a: Effect of Lignite Feed Moisture on Gross Pulverizer Power (kWhr/ton). Adapted from Data by Ellman et al. (Reference 7).
Figure 42b: Effect of Lignite Feed Moisture on Relative Pulverizer Power (kWhr/ton).
45
The combustion analysis provided results on the feed rate of coal (Mcoal) and total
(primary and secondary) air flow rates (Mair,tot) needed for combustion. These results
were used as inputs to the overall mass and energy balance calculations .
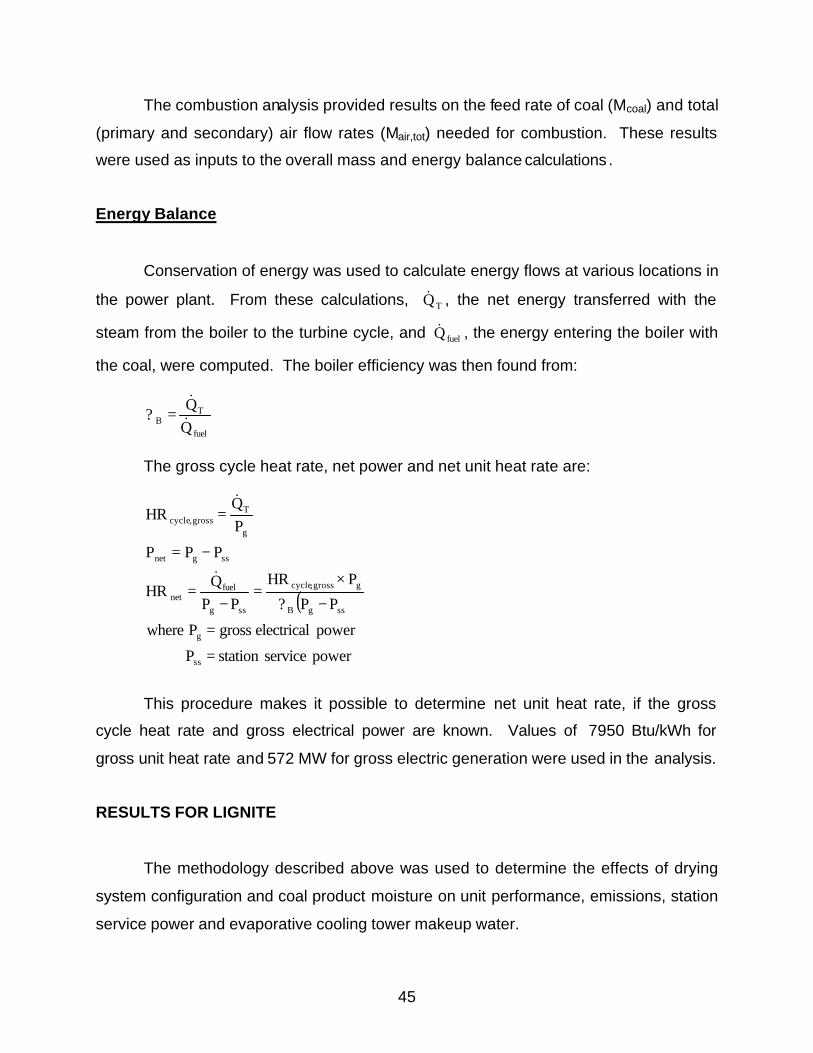
Energy Balance
Conservation of energy was used to calculate energy flows at various locations in
the power plant. From these calculations, TQ& , the net energy transferred with the
steam from the boiler to the turbine cycle, and fuelQ& , the energy entering the boiler with
the coal, were computed. The boiler efficiency was then found from:
fuel
TB Q
Q? &
&=
The gross cycle heat rate, net power and net unit heat rate are:
( )
power service stationP
power electrical grossP where
PP?
PHR
PPQ
HR
PPP
PQ
HR
ss
g
ssgB
ggross,cycle
ssg
fuelnet
ssgnet
g
Tgross,cycle
=
=
−
×=
−=
−=
=
&
&
This procedure makes it possible to determine net unit heat rate, if the gross
cycle heat rate and gross electrical power are known. Values of 7950 Btu/kWh for
gross unit heat rate and 572 MW for gross electric generation were used in the analysis.
RESULTS FOR LIGNITE
The methodology described above was used to determine the effects of drying
system configuration and coal product moisture on unit performance, emissions, station
service power and evaporative cooling tower makeup water.
46
2,500,000
2,550,000
2,600,000
2,650,000
2,700,000
2,750,000
15 20 25 30 35 40
Fuel Moisture [% by weight]
Flu
e G
as F
low
Rat
e at
ID F
an In
let [
kg/h
r] CCW/FG
CCW
Pgross = 572 MWLignite
80
100
120
140
160
180
200
15 20 25 30 35 40
Fuel Moisture [% by weight]
Flu
e G
as T
emp
erat
ure
at
ID F
an In
let
[°C
]
CCW/FG
CCW
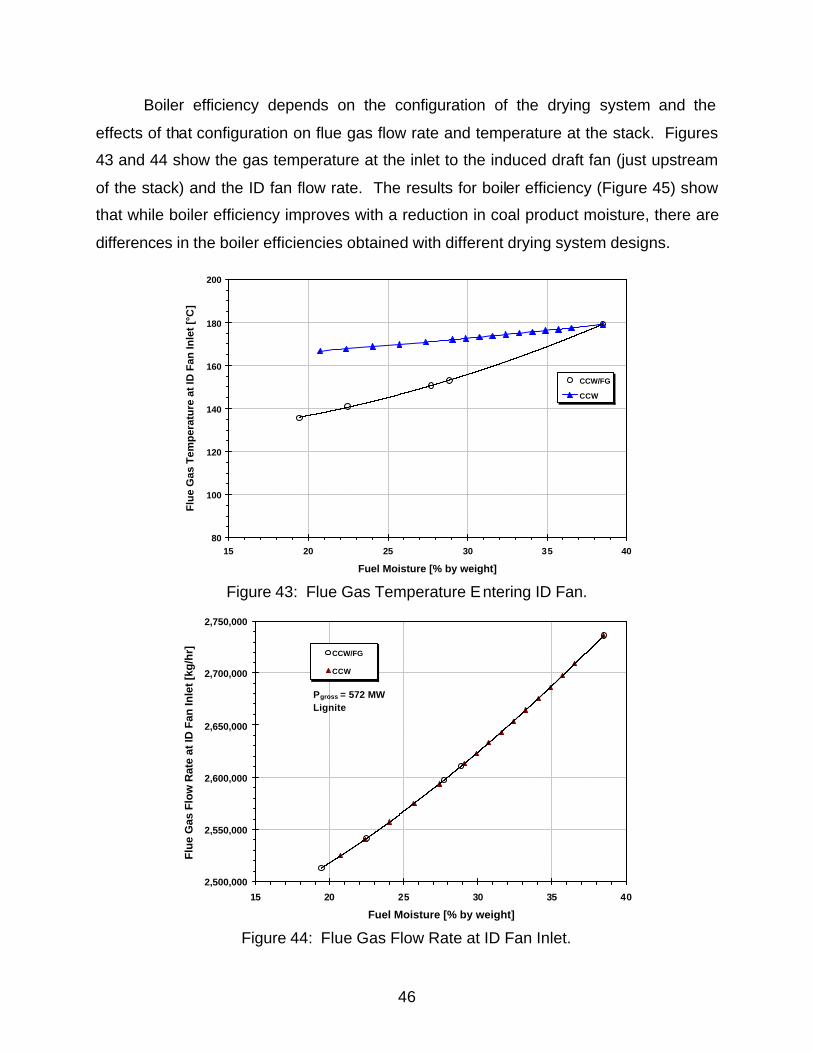
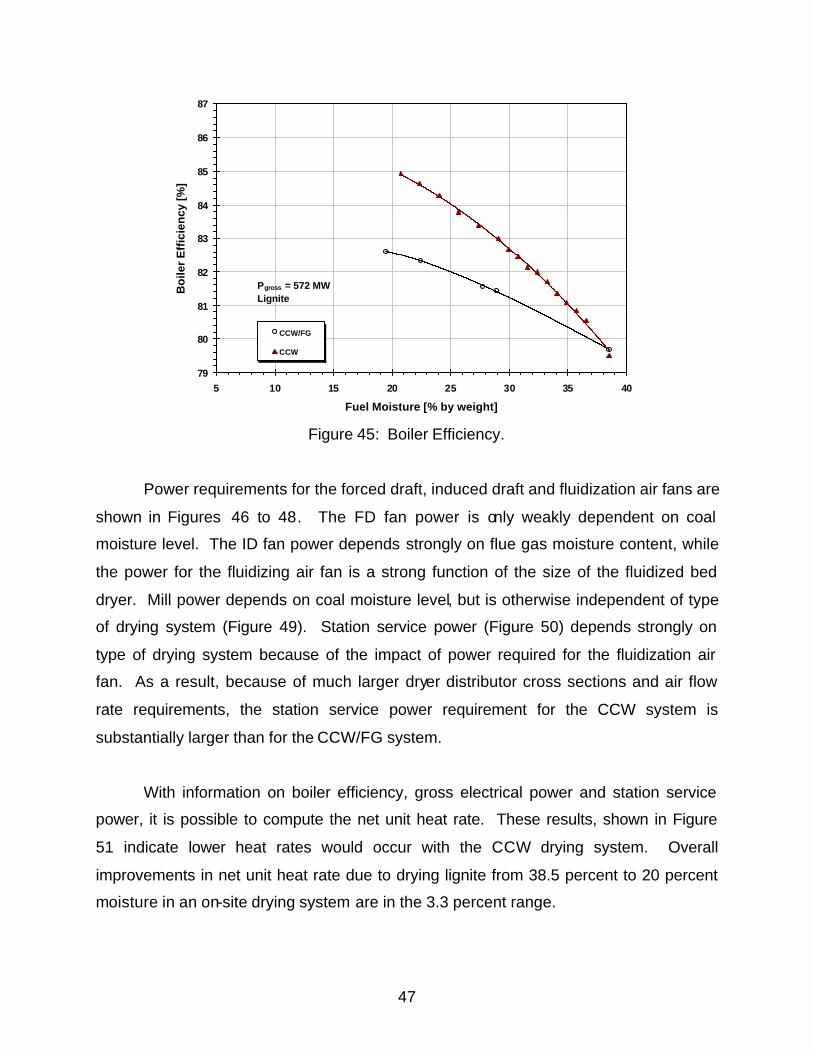
Boiler efficiency depends on the configuration of the drying system and the
effects of that configuration on flue gas flow rate and temperature at the stack. Figures
43 and 44 show the gas temperature at the inlet to the induced draft fan (just upstream
of the stack) and the ID fan flow rate. The results for boiler efficiency (Figure 45) show
that while boiler efficiency improves with a reduction in coal product moisture, there are
differences in the boiler efficiencies obtained with different drying system designs.
Figure 43: Flue Gas Temperature Entering ID Fan.
Figure 44: Flue Gas Flow Rate at ID Fan Inlet.
47
79
80
81
82
83
84
85
86
87
5 10 15 20 25 30 35 40
Fuel Moisture [% by weight]
Bo
iler
Eff
icie
ncy
[%]
CCW/FG
CCW
Pgross = 572 MWLignite
Figure 45: Boiler Efficiency.
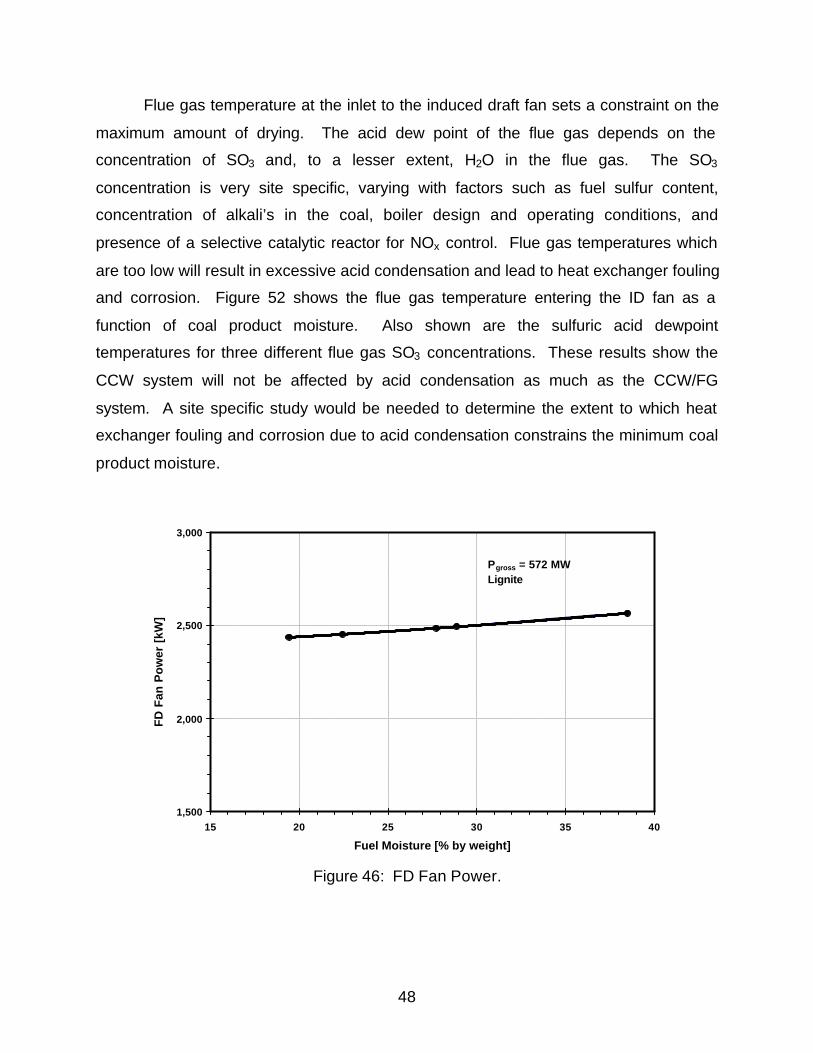
Power requirements for the forced draft, induced draft and fluidization air fans are
shown in Figures 46 to 48. The FD fan power is only weakly dependent on coal
moisture level. The ID fan power depends strongly on flue gas moisture content, while
the power for the fluidizing air fan is a strong function of the size of the fluidized bed
dryer. Mill power depends on coal moisture level, but is otherwise independent of type
of drying system (Figure 49). Station service power (Figure 50) depends strongly on
type of drying system because of the impact of power required for the fluidization air
fan. As a result, because of much larger dryer distributor cross sections and air flow
rate requirements, the station service power requirement for the CCW system is
substantially larger than for the CCW/FG system.
With information on boiler efficiency, gross electrical power and station service
power, it is possible to compute the net unit heat rate. These results, shown in Figure
51 indicate lower heat rates would occur with the CCW drying system. Overall
improvements in net unit heat rate due to drying lignite from 38.5 percent to 20 percent
moisture in an on-site drying system are in the 3.3 percent range.
48
1,500
2,000
2,500
3,000
15 20 25 30 35 40
Fuel Moisture [% by weight]
FD
Fan
Po
wer
[kW
]
Pgross = 572 MWLignite
Flue gas temperature at the inlet to the induced draft fan sets a constraint on the
maximum amount of drying. The acid dew point of the flue gas depends on the
concentration of SO3 and, to a lesser extent, H2O in the flue gas. The SO3
concentration is very site specific, varying with factors such as fuel sulfur content,
concentration of alkali’s in the coal, boiler design and operating conditions, and
presence of a selective catalytic reactor for NOx control. Flue gas temperatures which
are too low will result in excessive acid condensation and lead to heat exchanger fouling
and corrosion. Figure 52 shows the flue gas temperature entering the ID fan as a
function of coal product moisture. Also shown are the sulfuric acid dewpoint
temperatures for three different flue gas SO3 concentrations. These results show the
CCW system will not be affected by acid condensation as much as the CCW/FG
system. A site specific study would be needed to determine the extent to which heat
exchanger fouling and corrosion due to acid condensation constrains the minimum coal
product moisture.
Figure 46: FD Fan Power.
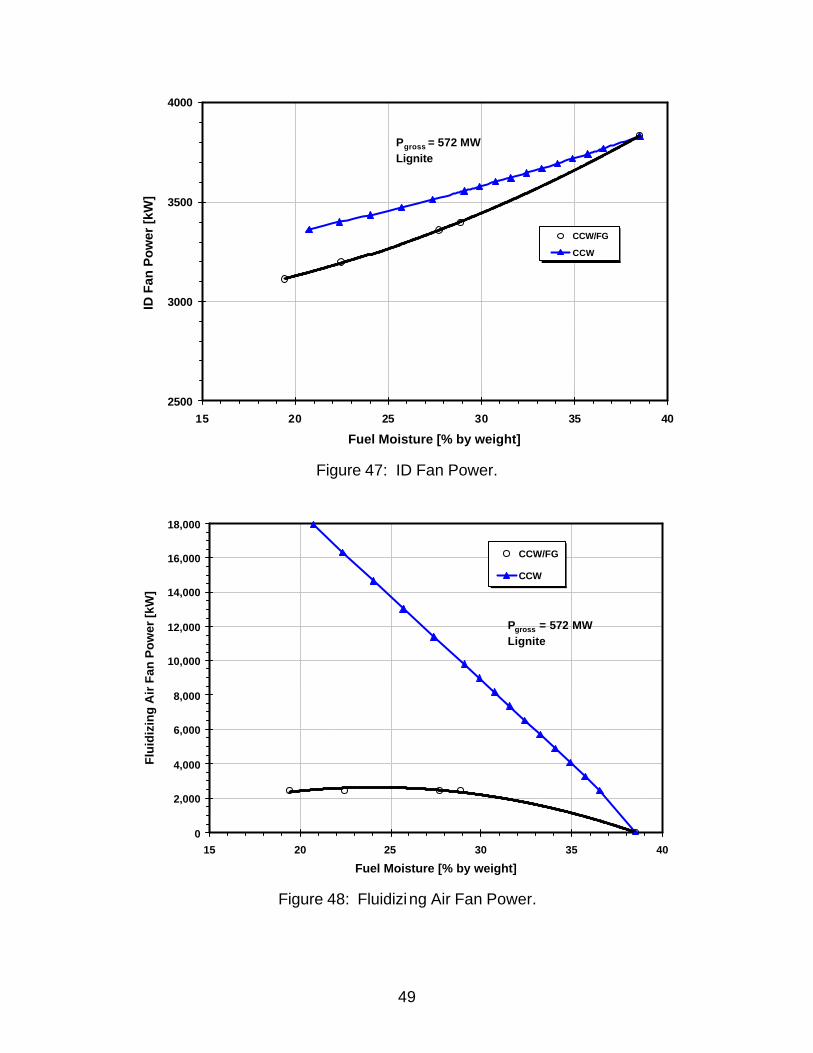
49
2500
3000
3500
4000
15 20 25 30 35 40
Fuel Moisture [% by weight]
ID F
an P
ow
er [
kW]
CCW/FG
CCW
Pgross = 572 MWLignite
0
2,000
4,000
6,000
8,000
10,000
12,000
14,000
16,000
18,000
15 20 25 30 35 40
Fuel Moisture [% by weight]
Flu
idiz
ing
Air
Fan
Po
wer
[kW
]
CCW/FG
CCW
Pgross = 572 MWLignite
Figure 47: ID Fan Power.
Figure 48: Fluidizing Air Fan Power.
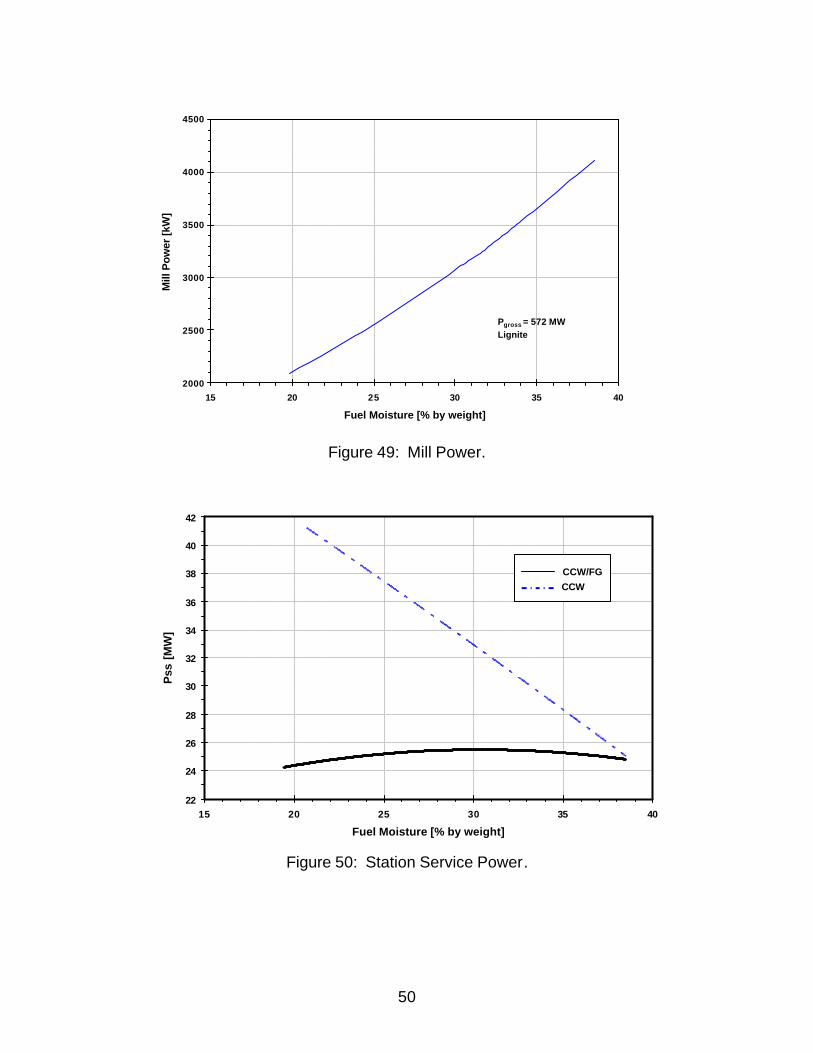
50
22
24
26
28
30
32
34
36
38
40
42
15 20 25 30 35 40
Fuel Moisture [% by weight]
Pss
[M
W]
CCW/FG
CCW
2000
2500
3000
3500
4000
4500
15 20 25 30 35 40
Fuel Moisture [% by weight]
Mill
Pow
er [k
W]
Pgross = 572 MWLignite
Figure 49: Mill Power.
Figure 50: Station Service Power.
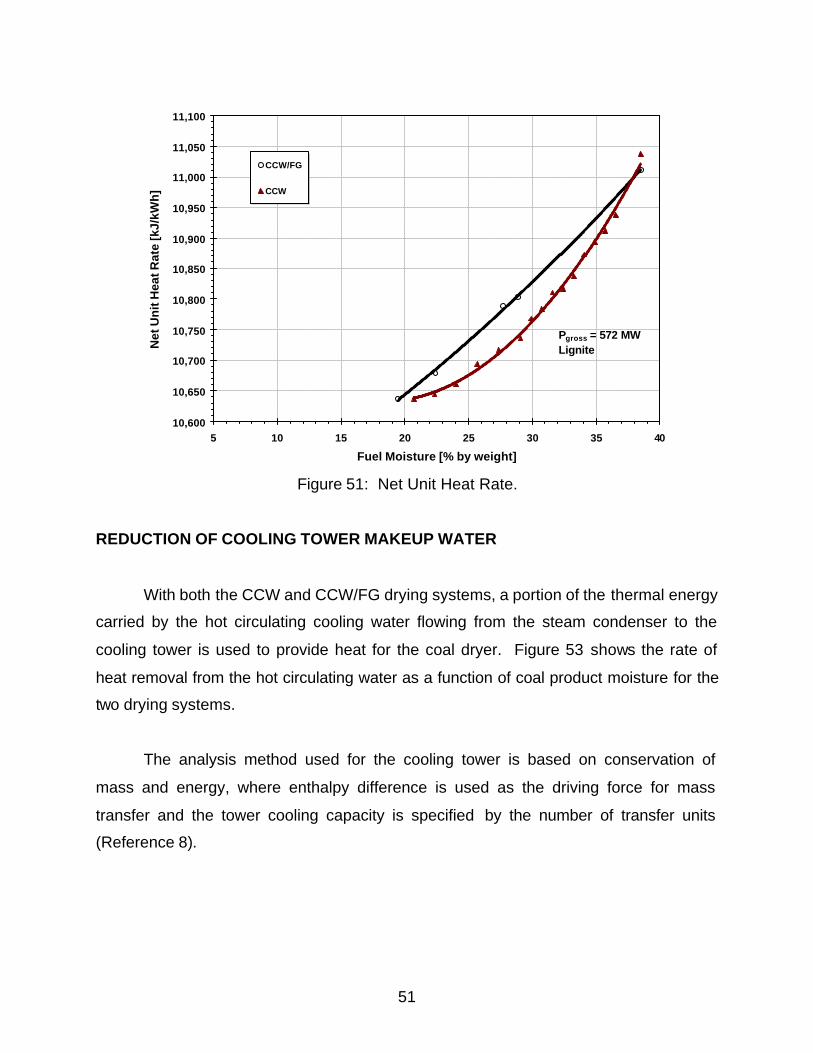
51
10,600
10,650
10,700
10,750
10,800
10,850
10,900
10,950
11,000
11,050
11,100
5 10 15 20 25 30 35 40
Fuel Moisture [% by weight]
Net
Un
it H
eat R
ate
[kJ/
kWh
]CCW/FG
CCW
Pgross = 572 MWLignite
Figure 51: Net Unit Heat Rate.
REDUCTION OF COOLING TOWER MAKEUP WATER
With both the CCW and CCW/FG drying systems, a portion of the thermal energy
carried by the hot circulating cooling water flowing from the steam condenser to the
cooling tower is used to provide heat for the coal dryer. Figure 53 shows the rate of
heat removal from the hot circulating water as a function of coal product moisture for the
two drying systems.
The analysis method used for the cooling tower is based on conservation of
mass and energy, where enthalpy difference is used as the driving force for mass
transfer and the tower cooling capacity is specified by the number of transfer units
(Reference 8).
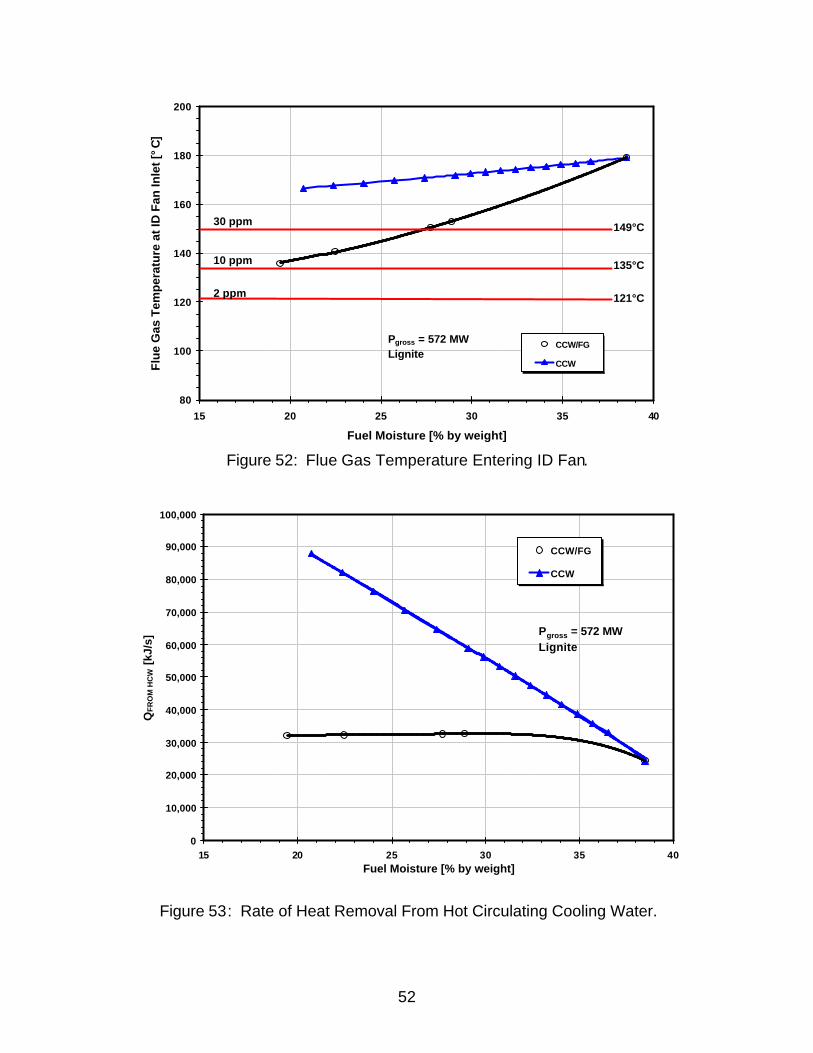
52
80
100
120
140
160
180
200
15 20 25 30 35 40
Fuel Moisture [% by weight]
Flu
e G
as T
emp
erat
ure
at
ID F
an In
let
[°C
]
CCW/FG
CCW
Pgross = 572 MWLignite
121°C
135°C
149°C
2 ppm
10 ppm
30 ppm
0
10,000
20,000
30,000
40,000
50,000
60,000
70,000
80,000
90,000
100,000
15 20 25 30 35 40Fuel Moisture [% by weight]
QF
RO
M H
CW
[kJ
/s]
CCW/FG
CCW
Pgross = 572 MWLignite
Figure 52: Flue Gas Temperature Entering ID Fan.
Figure 53: Rate of Heat Removal From Hot Circulating Cooling Water.
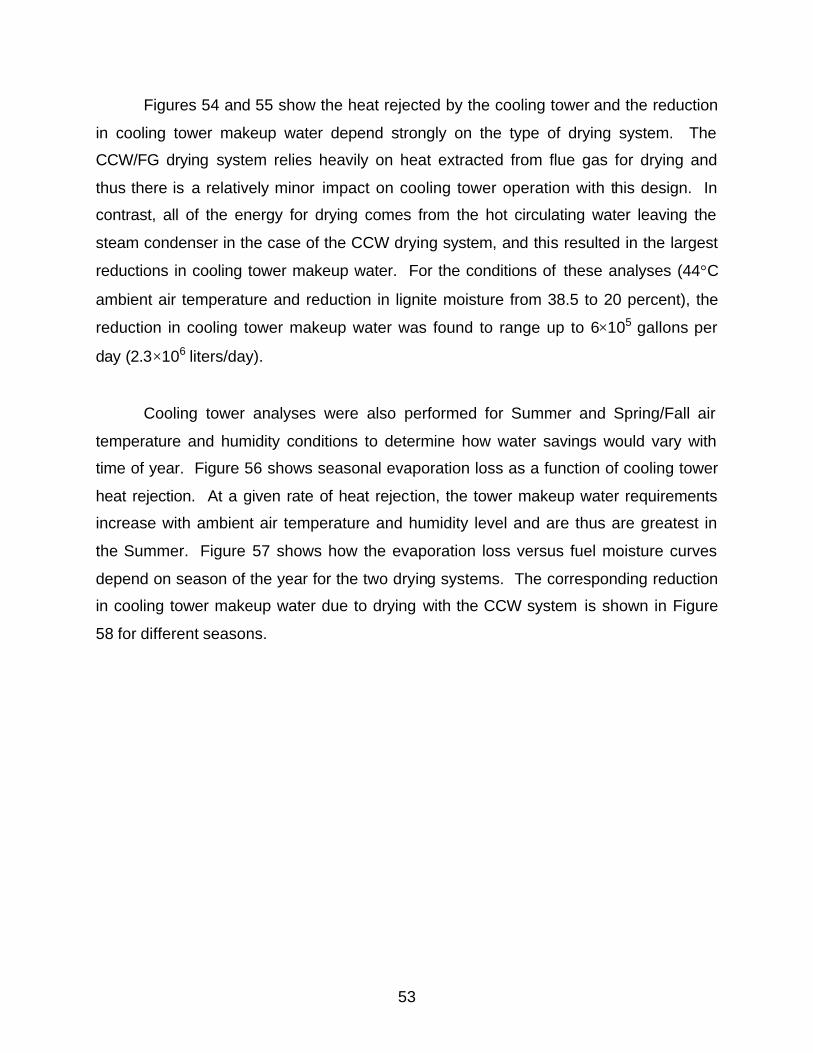
53
Figures 54 and 55 show the heat rejected by the cooling tower and the reduction
in cooling tower makeup water depend strongly on the type of drying system. The
CCW/FG drying system relies heavily on heat extracted from flue gas for drying and
thus there is a relatively minor impact on cooling tower operation with this design. In
contrast, all of the energy for drying comes from the hot circulating water leaving the
steam condenser in the case of the CCW drying system, and this resulted in the largest
reductions in cooling tower makeup water. For the conditions of these analyses (44°C
ambient air temperature and reduction in lignite moisture from 38.5 to 20 percent), the
reduction in cooling tower makeup water was found to range up to 6×10⁵ gallons per
day (2.3×10⁶ liters/day).
Cooling tower analyses were also performed for Summer and Spring/Fall air
temperature and humidity conditions to determine how water savings would vary with
time of year. Figure 56 shows seasonal evaporation loss as a function of cooling tower
heat rejection. At a given rate of heat rejection, the tower makeup water requirements
increase with ambient air temperature and humidity level and are thus are greatest in
the Summer. Figure 57 shows how the evaporation loss versus fuel moisture curves
depend on season of the year for the two drying systems. The corresponding reduction
in cooling tower makeup water due to drying with the CCW system is shown in Figure
58 for different seasons.
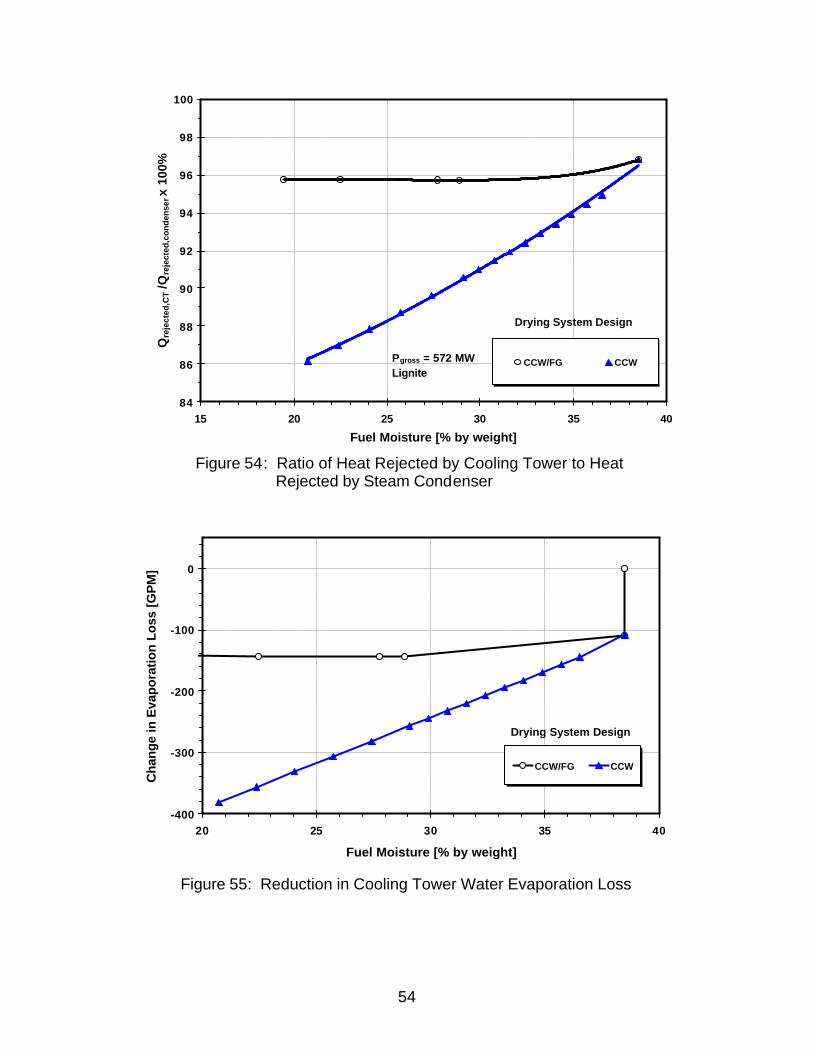
54
84
86
88
90
92
94
96
98
100
15 20 25 30 35 40
Fuel Moisture [% by weight]
Qre
ject
ed,C
T /Q
reje
cted
,co
nd
ense
r x
100%
CCW/FG CCWPgross = 572 MWLignite
Drying System Design
-400
-300
-200
-100
0
20 25 30 35 40
Fuel Moisture [% by weight]
Cha
nge
in E
vapo
ratio
n Lo
ss [
GP
M]
CCW/FG CCW
Drying System Design
Figure 54: Ratio of Heat Rejected by Cooling Tower to Heat Rejected by Steam Condenser
Figure 55: Reduction in Cooling Tower Water Evaporation Loss
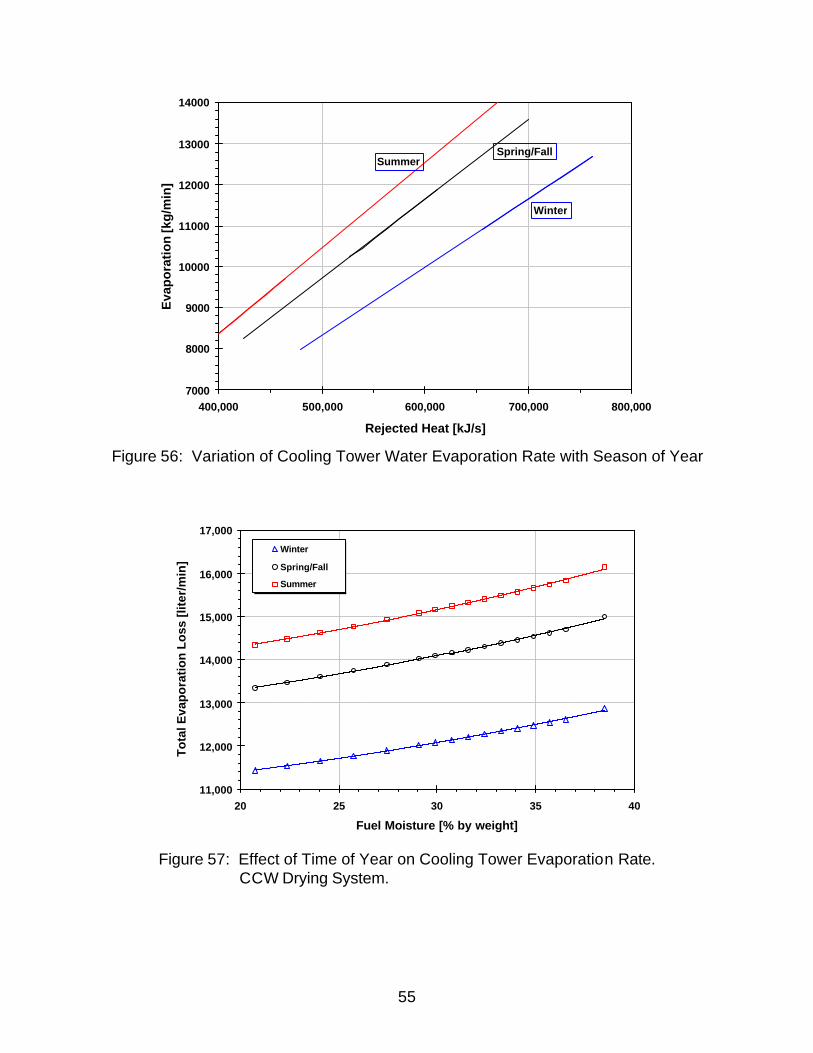
55
7000
8000
9000
10000
11000
12000
13000
14000
400,000 500,000 600,000 700,000 800,000
Rejected Heat [kJ/s]
Eva
po
rati
on
[kg
/min
]
Winter
Spring/FallSummer
11,000
12,000
13,000
14,000
15,000
16,000
17,000
20 25 30 35 40
Fuel Moisture [% by weight]
To
tal E
vap
ora
tio
n L
oss
[lit
er/m
in]
Winter
Spring/Fall
Summer
Figure 56: Variation of Cooling Tower Water Evaporation Rate with Season of Year
Figure 57: Effect of Time of Year on Cooling Tower Evaporation Rate. CCW Drying System.
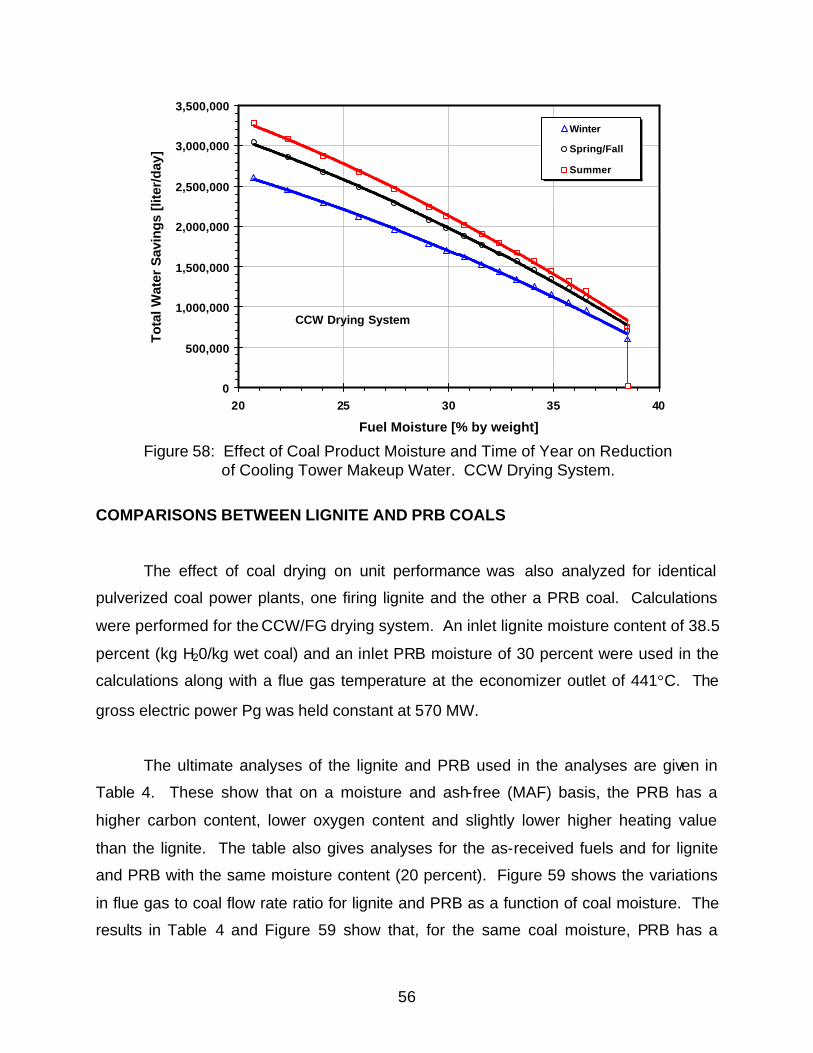
56
0
500,000
1,000,000
1,500,000
2,000,000
2,500,000
3,000,000
3,500,000
20 25 30 35 40
Fuel Moisture [% by weight]
To
tal W
ater
Sav
ing
s [li
ter/
day
]
Winter
Spring/Fall
Summer
CCW Drying System
Figure 58: Effect of Coal Product Moisture and Time of Year on Reduction of Cooling Tower Makeup Water. CCW Drying System.
COMPARISONS BETWEEN LIGNITE AND PRB COALS
The effect of coal drying on unit performance was also analyzed for identical
pulverized coal power plants, one firing lignite and the other a PRB coal. Calculations
were performed for the CCW/FG drying system. An inlet lignite moisture content of 38.5
percent (kg H20/kg wet coal) and an inlet PRB moisture of 30 percent were used in the
calculations along with a flue gas temperature at the economizer outlet of 441°C. The
gross electric power Pg was held constant at 570 MW.
The ultimate analyses of the lignite and PRB used in the analyses are given in
Table 4. These show that on a moisture and ash-free (MAF) basis, the PRB has a
higher carbon content, lower oxygen content and slightly lower higher heating value
than the lignite. The table also gives analyses for the as-received fuels and for lignite
and PRB with the same moisture content (20 percent). Figure 59 shows the variations
in flue gas to coal flow rate ratio for lignite and PRB as a function of coal moisture. The
results in Table 4 and Figure 59 show that, for the same coal moisture, PRB has a
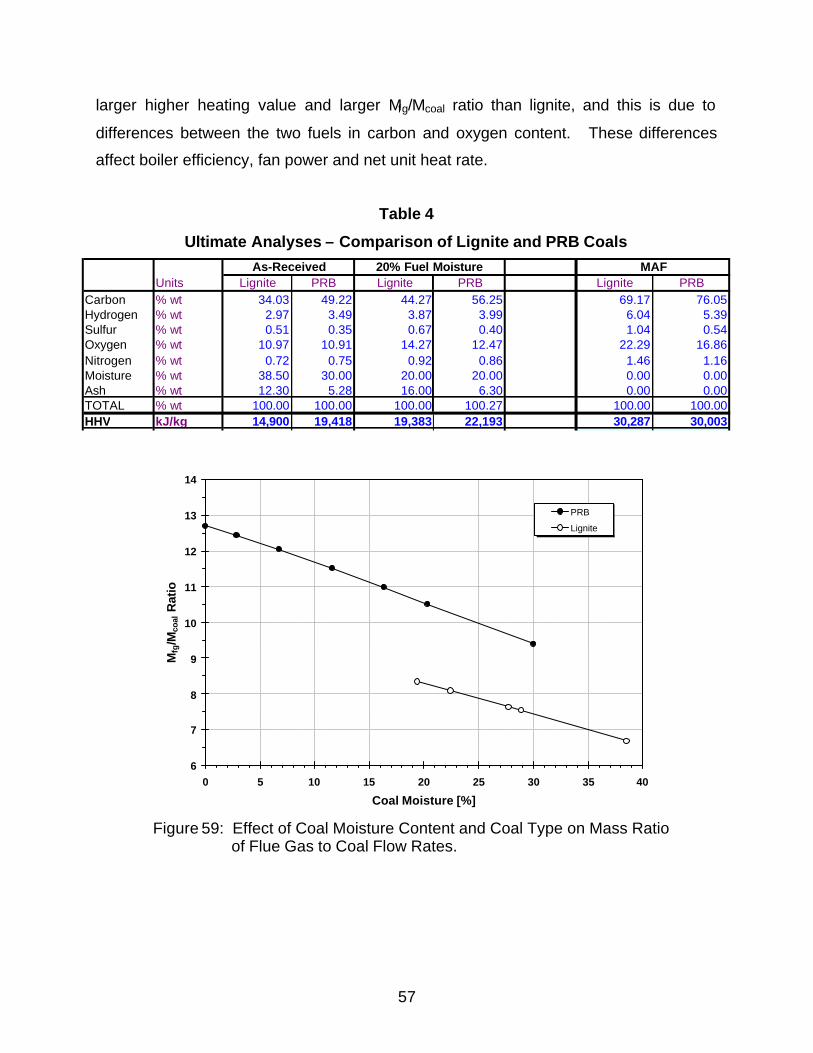
57
6
7
8
9
10
11
12
13
14
0 5 10 15 20 25 30 35 40
Coal Moisture [%]
Mfg
/Mco
al R
atio
PRB
Lignite
Units Lignite PRB Lignite PRB Lignite PRBCarbon % wt 34.03 49.22 44.27 56.25 69.17 76.05Hydrogen % wt 2.97 3.49 3.87 3.99 6.04 5.39Sulfur % wt 0.51 0.35 0.67 0.40 1.04 0.54Oxygen % wt 10.97 10.91 14.27 12.47 22.29 16.86Nitrogen % wt 0.72 0.75 0.92 0.86 1.46 1.16Moisture % wt 38.50 30.00 20.00 20.00 0.00 0.00Ash % wt 12.30 5.28 16.00 6.30 0.00 0.00TOTAL % wt 100.00 100.00 100.00 100.27 100.00 100.00HHV kJ/kg 14,900 19,418 19,383 22,193 30,287 30,003
f
As-Received MAF20% Fuel Moisture
larger higher heating value and larger Mfg/Mcoal ratio than lignite, and this is due to
differences between the two fuels in carbon and oxygen content. These differences
affect boiler efficiency, fan power and net unit heat rate.
Table 4
Ultimate Analyses – Comparison of Lignite and PRB Coals
Figure 59: Effect of Coal Moisture Content and Coal Type on Mass Ratio of Flue Gas to Coal Flow Rates.
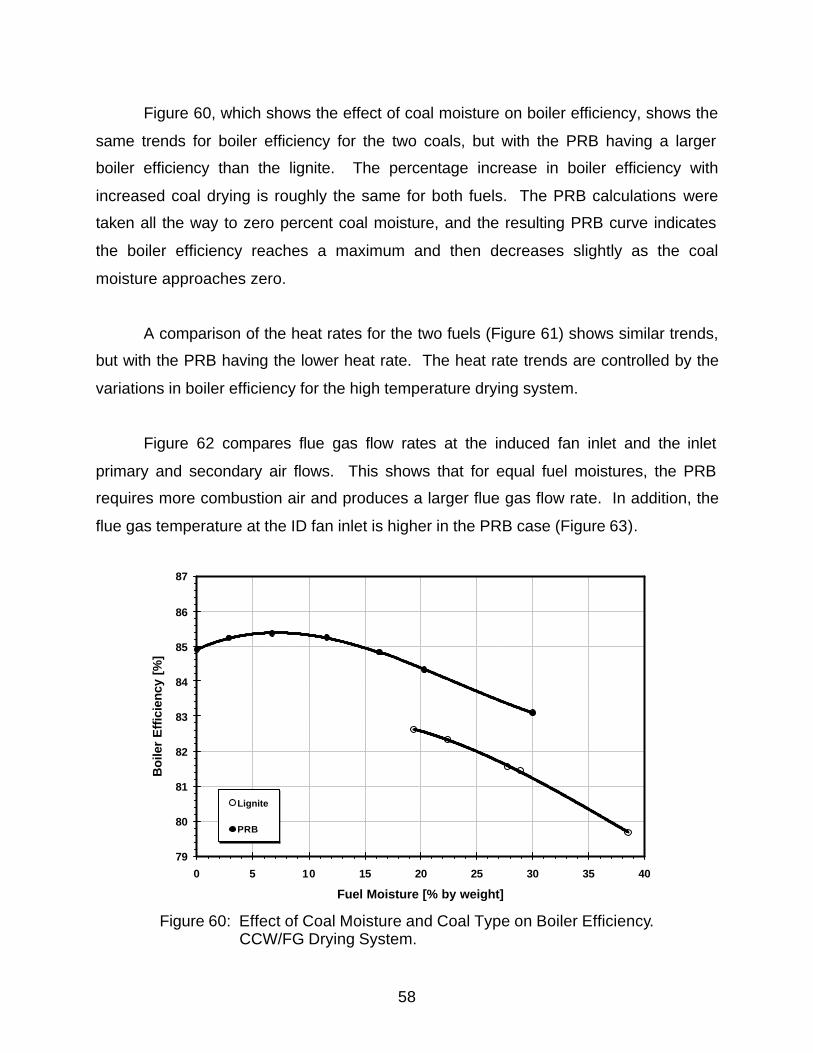
58
79
80
81
82
83
84
85
86
87
0 5 10 15 20 25 30 35 40
Fuel Moisture [% by weight]
Boi
ler
Eff
icie
ncy
[%]
Lignite
PRB
Figure 60, which shows the effect of coal moisture on boiler efficiency, shows the
same trends for boiler efficiency for the two coals, but with the PRB having a larger
boiler efficiency than the lignite. The percentage increase in boiler efficiency with
increased coal drying is roughly the same for both fuels. The PRB calculations were
taken all the way to zero percent coal moisture, and the resulting PRB curve indicates
the boiler efficiency reaches a maximum and then decreases slightly as the coal
moisture approaches zero.
A comparison of the heat rates for the two fuels (Figure 61) shows similar trends,
but with the PRB having the lower heat rate. The heat rate trends are controlled by the
variations in boiler efficiency for the high temperature drying system.
Figure 62 compares flue gas flow rates at the induced fan inlet and the inlet
primary and secondary air flows. This shows that for equal fuel moistures, the PRB
requires more combustion air and produces a larger flue gas flow rate. In addition, the
flue gas temperature at the ID fan inlet is higher in the PRB case (Figure 63).
Figure 60: Effect of Coal Moisture and Coal Type on Boiler Efficiency. CCW/FG Drying System.
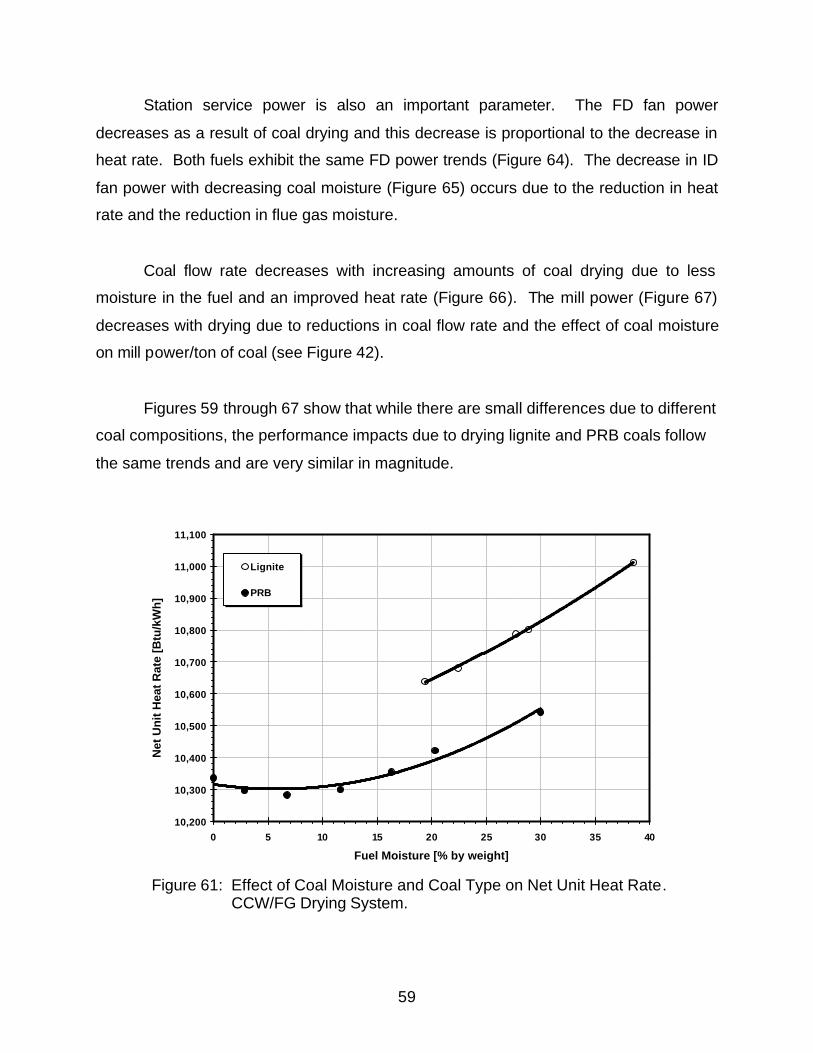
59
10,200
10,300
10,400
10,500
10,600
10,700
10,800
10,900
11,000
11,100
0 5 10 15 20 25 30 35 40
Fuel Moisture [% by weight]
Net
Un
it H
eat
Rat
e [B
tu/k
Wh
]
Lignite
PRB
Station service power is also an important parameter. The FD fan power
decreases as a result of coal drying and this decrease is proportional to the decrease in
heat rate. Both fuels exhibit the same FD power trends (Figure 64). The decrease in ID
fan power with decreasing coal moisture (Figure 65) occurs due to the reduction in heat
rate and the reduction in flue gas moisture.
Coal flow rate decreases with increasing amounts of coal drying due to less
moisture in the fuel and an improved heat rate (Figure 66). The mill power (Figure 67)
decreases with drying due to reductions in coal flow rate and the effect of coal moisture
on mill power/ton of coal (see Figure 42).
Figures 59 through 67 show that while there are small differences due to different
coal compositions, the performance impacts due to drying lignite and PRB coals follow
the same trends and are very similar in magnitude.
Figure 61: Effect of Coal Moisture and Coal Type on Net Unit Heat Rate. CCW/FG Drying System.
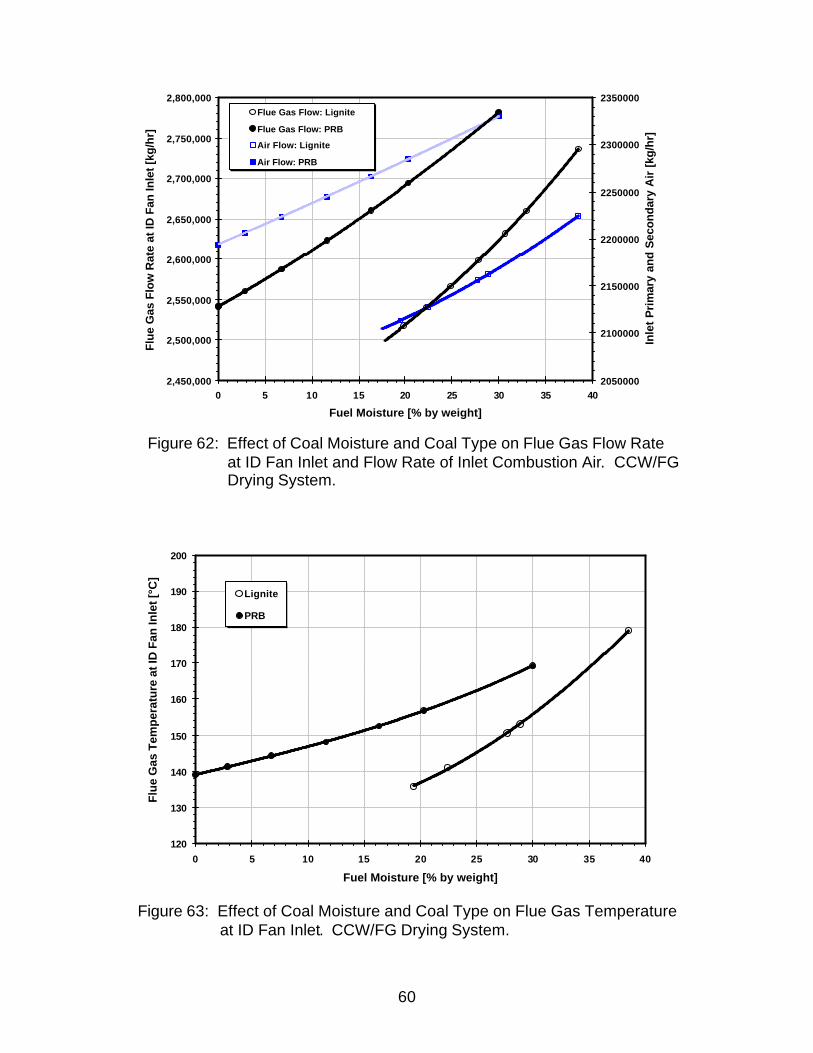
60
2,450,000
2,500,000
2,550,000
2,600,000
2,650,000
2,700,000
2,750,000
2,800,000
0 5 10 15 20 25 30 35 40
Fuel Moisture [% by weight]
Flu
e G
as F
low
Rat
e at
ID F
an In
let
[kg
/hr]
2050000
2100000
2150000
2200000
2250000
2300000
2350000
Inle
t P
rim
ary
and
Sec
on
dar
y A
ir [
kg/h
r]
Flue Gas Flow: Lignite
Flue Gas Flow: PRB
Air Flow: Lignite
Air Flow: PRB
120
130
140
150
160
170
180
190
200
0 5 10 15 20 25 30 35 40
Fuel Moisture [% by weight]
Flu
e G
as T
emp
erat
ure
at I
D F
an In
let [
°C]
Lignite
PRB
Figure 62: Effect of Coal Moisture and Coal Type on Flue Gas Flow Rate at ID Fan Inlet and Flow Rate of Inlet Combustion Air. CCW/FG Drying System.
Figure 63: Effect of Coal Moisture and Coal Type on Flue Gas Temperature at ID Fan Inlet. CCW/FG Drying System.
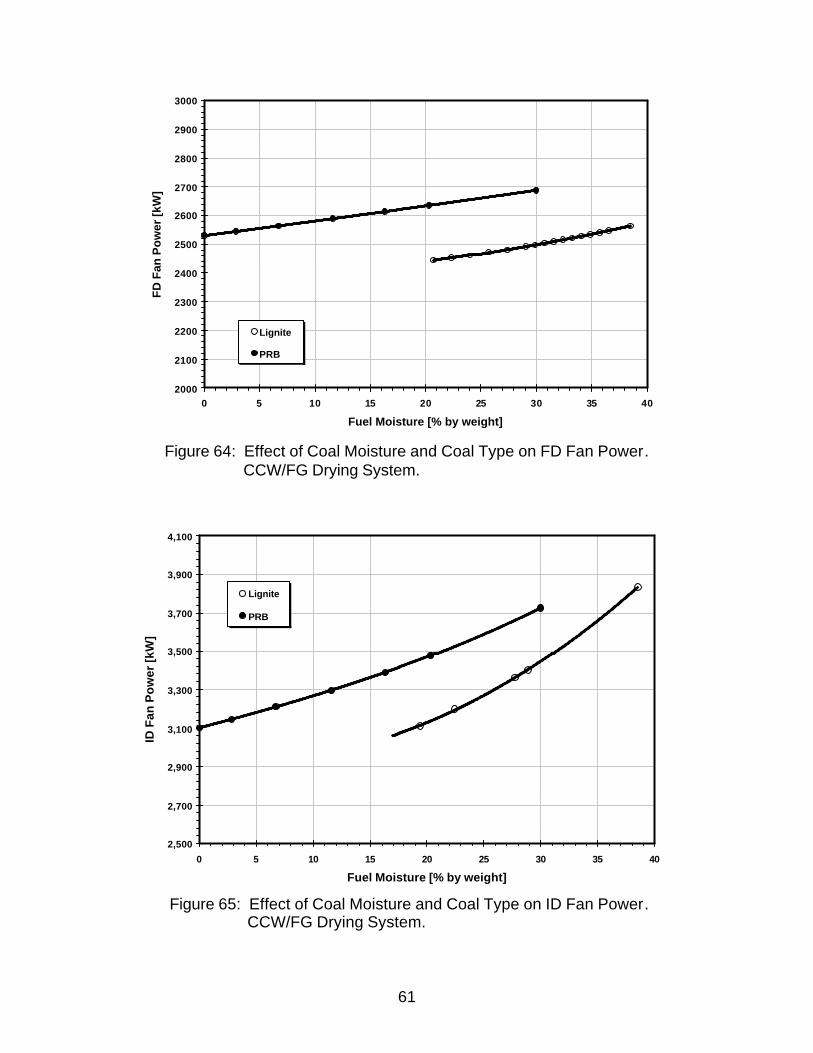
61
2000
2100
2200
2300
2400
2500
2600
2700
2800
2900
3000
0 5 10 15 20 25 30 35 40
Fuel Moisture [% by weight]
FD
Fan
Po
wer
[kW
]
Lignite
PRB
2,500
2,700
2,900
3,100
3,300
3,500
3,700
3,900
4,100
0 5 10 15 20 25 30 35 40
Fuel Moisture [% by weight]
ID F
an P
ow
er [k
W]
Lignite
PRB
Figure 64: Effect of Coal Moisture and Coal Type on FD Fan Power. CCW/FG Drying System.
Figure 65: Effect of Coal Moisture and Coal Type on ID Fan Power.
CCW/FG Drying System.
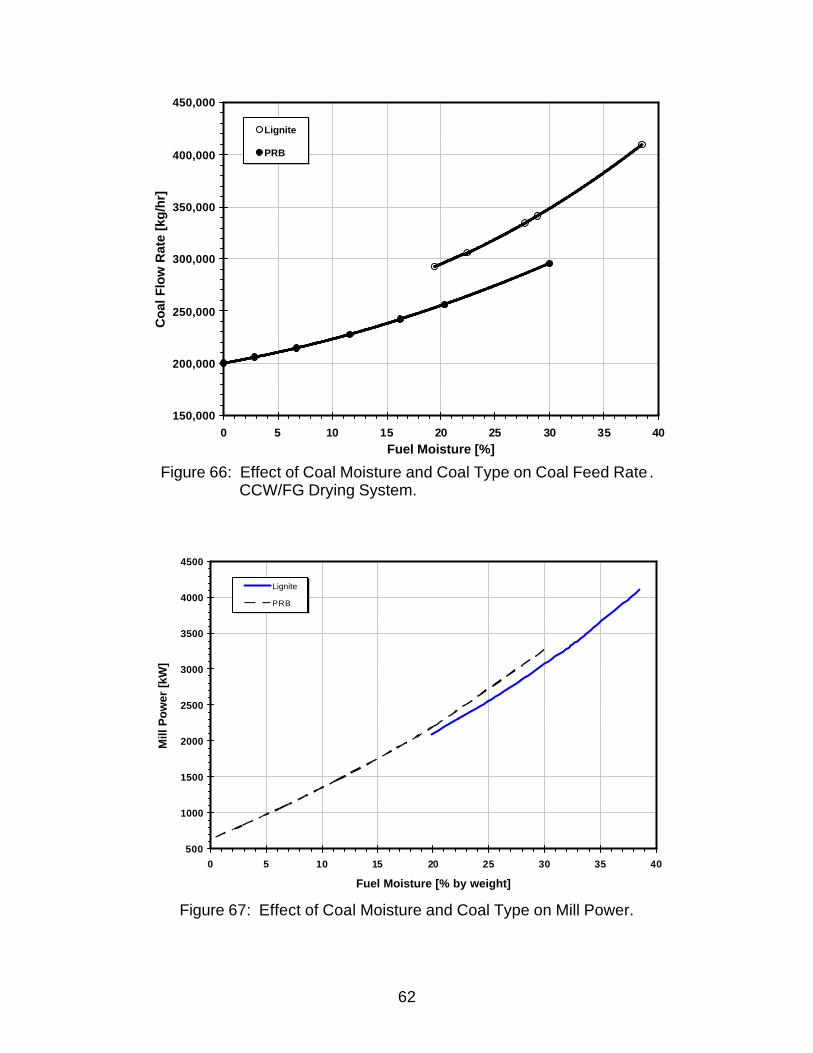
62
150,000
200,000
250,000
300,000
350,000
400,000
450,000
0 5 10 15 20 25 30 35 40Fuel Moisture [%]
Coa
l Flo
w R
ate
[kg/
hr]
Lignite
PRB
500
1000
1500
2000
2500
3000
3500
4000
4500
0 5 10 15 20 25 30 35 40
Fuel Moisture [% by weight]
Mill
Po
wer
[kW
]
Lignite
PRB
Figure 66: Effect of Coal Moisture and Coal Type on Coal Feed Rate . CCW/FG Drying System.
Figure 67: Effect of Coal Moisture and Coal Type on Mill Power.
63
PART III – ECONOMIC EVALUATION INTRODUCTION
Part II of this report contains descriptions of analyses carried out to compute the
effects of coal drying on unit heat rate, station service power, stack emissions, and
water consumption for evaporative cooling. Part III contains analyses to determine the
cost effectiveness of coal drying. The methodology and key assumptions used to
estimate the costs and benefits of coal drying and results of analyses are described in
this section. The results presented here are for two drying systems, one which utilizes a
combination of waste heat from the condenser and thermal energy extracted from boiler
flue gas (referred to in this report as CCW/FG) and one which relies completely on
waste heat from the condenser (referred to as CCW). See Table 3. The cost analyses
are for a lignite power plant with a gross electric power output of 572 MW.
INSTALLED EQUIPMENT COSTS
Installed equipment costs (in 2005 dollars) were estimated for the CCW/FG and
CCW drying systems for a lignite feed and a 441°C economizer exit gas temperature.
The analyses were performed to determine how equipment costs would vary as a
function of coal product moisture.
Estimated costs were obtained for the heat exchangers, fans, fluidized bed
dryers, baghouses, coal crushers and air flow ductwork needed for the drying systems.
For component sizing purposes, this required information on parameters such flue gas,
air and water flow rates, temperatures, pressure drops and rates of heat transfer, all of
which had been determined as part of the analyses for heat rate described in Part II of
this report.
The estimates of installed capital costs were obtained from vendors and from the
open literature. Where possible, cost estimates were obtained from independent
sources as a cross check on the numbers being used.
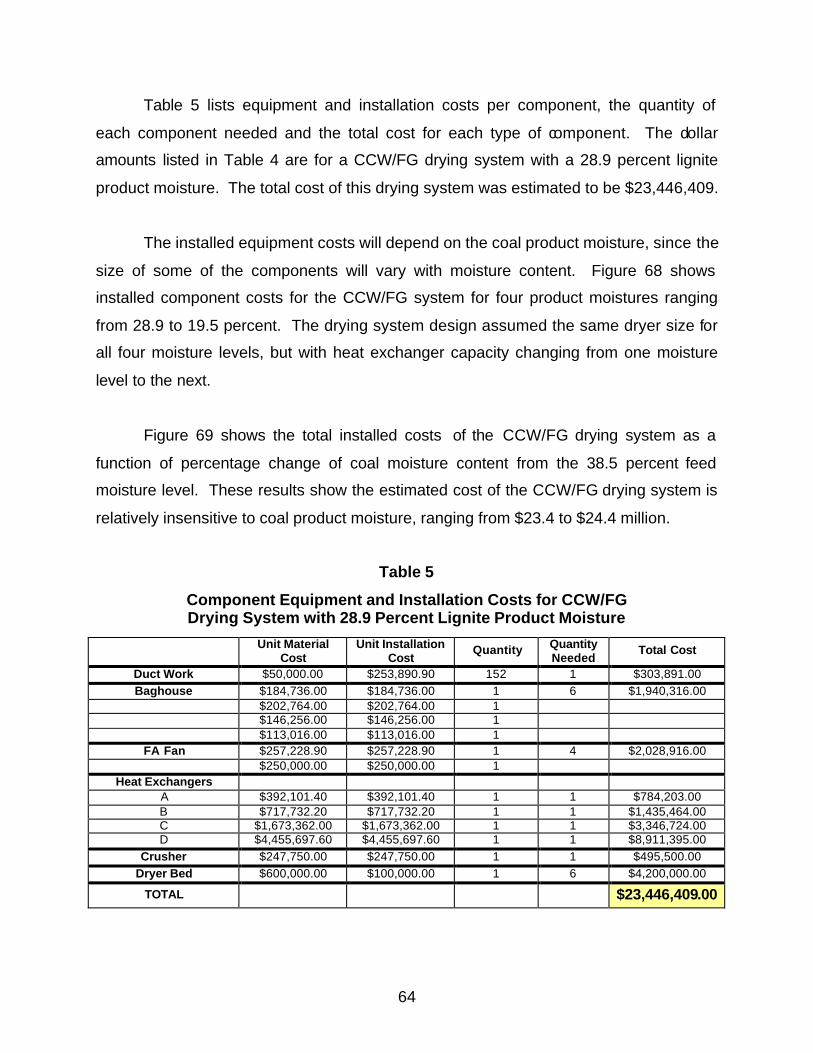
64
Table 5 lists equipment and installation costs per component, the quantity of
each component needed and the total cost for each type of component. The dollar
amounts listed in Table 4 are for a CCW/FG drying system with a 28.9 percent lignite
product moisture. The total cost of this drying system was estimated to be $23,446,409.
The installed equipment costs will depend on the coal product moisture, since the
size of some of the components will vary with moisture content. Figure 68 shows
installed component costs for the CCW/FG system for four product moistures ranging
from 28.9 to 19.5 percent. The drying system design assumed the same dryer size for
all four moisture levels, but with heat exchanger capacity changing from one moisture
level to the next.
Figure 69 shows the total installed costs of the CCW/FG drying system as a
function of percentage change of coal moisture content from the 38.5 percent feed
moisture level. These results show the estimated cost of the CCW/FG drying system is
relatively insensitive to coal product moisture, ranging from $23.4 to $24.4 million.
Table 5
Component Equipment and Installation Costs for CCW/FG Drying System with 28.9 Percent Lignite Product Moisture
Unit Material Cost
Unit Installation Cost
Quantity Quantity Needed
Total Cost
Duct Work $50,000.00 $253,890.90 152 1 $303,891.00 Baghouse $184,736.00 $184,736.00 1 6 $1,940,316.00
$202,764.00 $202,764.00 1 $146,256.00 $146,256.00 1 $113,016.00 $113,016.00 1
FA Fan $257,228.90 $257,228.90 1 4 $2,028,916.00 $250,000.00 $250,000.00 1
Heat Exchangers A $392,101.40 $392,101.40 1 1 $784,203.00 B $717,732.20 $717,732.20 1 1 $1,435,464.00 C $1,673,362.00 $1,673,362.00 1 1 $3,346,724.00 D $4,455,697.60 $4,455,697.60 1 1 $8,911,395.00
Crusher $247,750.00 $247,750.00 1 1 $495,500.00 Dryer Bed $600,000.00 $100,000.00 1 6 $4,200,000.00
TOTAL $23,446,409.00
65
23.3
23.5
23.8
24.0
24.3
24.5
8.0 10.0 12.0 14.0 16.0 18.0 20.0
Change in Moisture Content [%]
Inst
alla
tio
n a
nd
Mat
eria
l Co
st [M
illio
n $
]
0.0
1.0
2.0
3.0
4.0
5.0
6.0
7.0
8.0
9.0
10.0
Ductwork Baghouse FA Fan HX-A HX-B HX-C HX-D Dryers
Inst
alla
tio
n a
nd
Mat
eria
l Co
st [
Mill
ion
$]
HTC-46
HTC-47
HTC-49
HTC-50
28.927.722.519.5
Product Moisture %
Figure 68: Estimated Installed Equipment Costs for CCW/FG Drying System at Four Product Moisture Levels .
Figure 69: Total Installed Equipment Cost for CCW/FG Drying System as a Function of Coal Product Moisture.
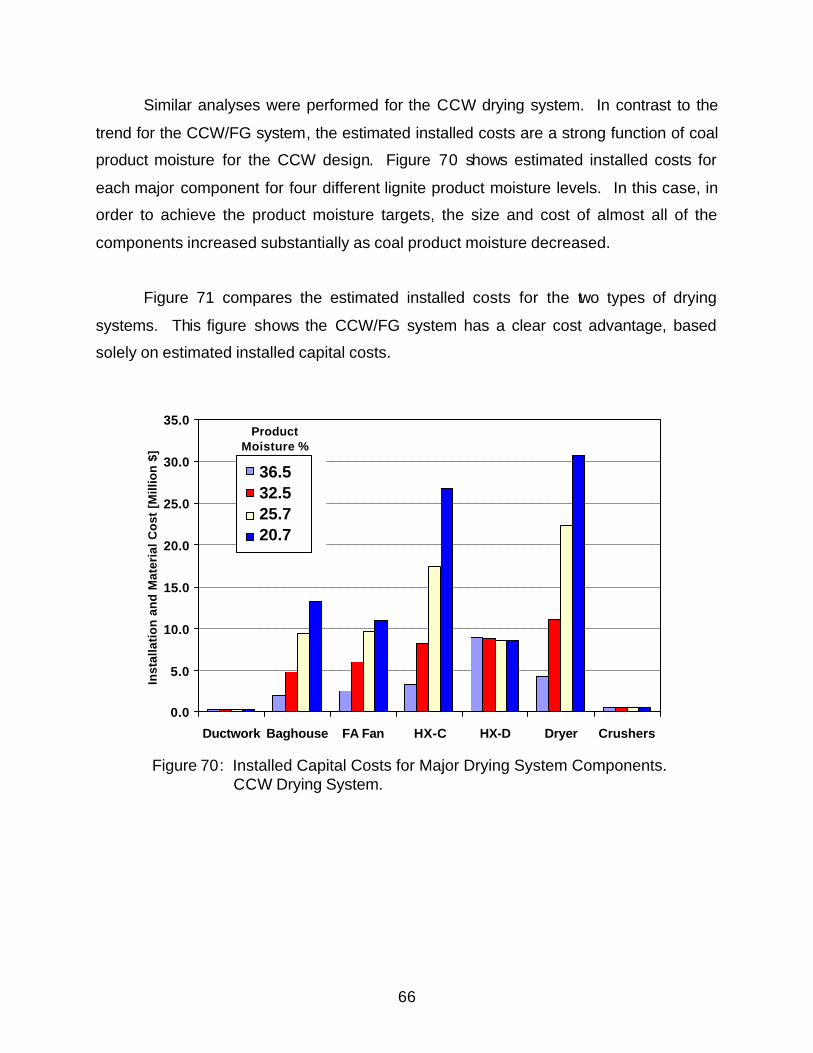
66
0.0
5.0
10.0
15.0
20.0
25.0
30.0
35.0
Ductwork Baghouse FA Fan HX-C HX-D Dryer Crushers
Inst
alla
tio
n a
nd
Mat
eria
l Co
st [
Mill
ion
$]
ULTC-300
ULTC-800
ULTC-1600
ULTC-2200
36.532.525.720.7
ProductMoisture %
Similar analyses were performed for the CCW drying system. In contrast to the
trend for the CCW/FG system, the estimated installed costs are a strong function of coal
product moisture for the CCW design. Figure 70 shows estimated installed costs for
each major component for four different lignite product moisture levels. In this case, in
order to achieve the product moisture targets, the size and cost of almost all of the
components increased substantially as coal product moisture decreased.
Figure 71 compares the estimated installed costs for the two types of drying
systems. This figure shows the CCW/FG system has a clear cost advantage, based
solely on estimated installed capital costs.
Figure 70: Installed Capital Costs for Major Drying System Components. CCW Drying System.
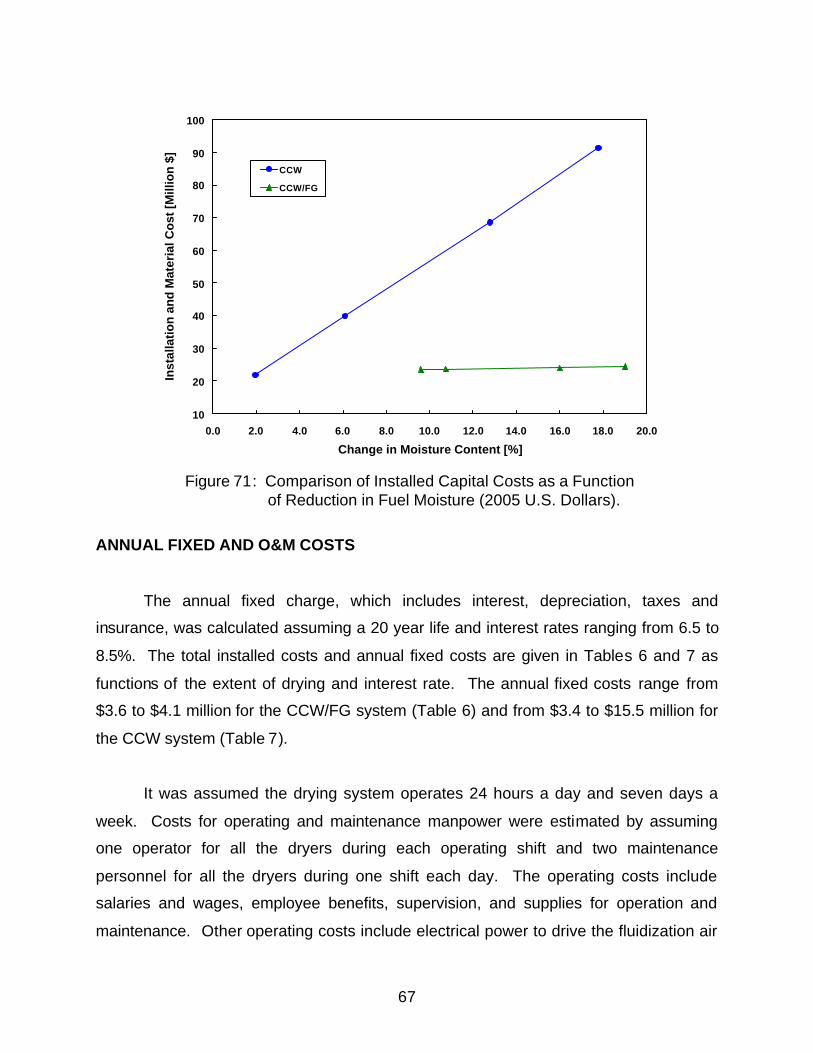
67
10
20
30
40
50
60
70
80
90
100
0.0 2.0 4.0 6.0 8.0 10.0 12.0 14.0 16.0 18.0 20.0
Change in Moisture Content [%]
Inst
alla
tio
n a
nd
Mat
eria
l Co
st [
Mill
ion
$].
CCW
CCW/FG
Figure 71: Comparison of Installed Capital Costs as a Function of Reduction in Fuel Moisture (2005 U.S. Dollars).
ANNUAL FIXED AND O&M COSTS
The annual fixed charge, which includes interest, depreciation, taxes and
insurance, was calculated assuming a 20 year life and interest rates ranging from 6.5 to
8.5%. The total installed costs and annual fixed costs are given in Tables 6 and 7 as
functions of the extent of drying and interest rate. The annual fixed costs range from
$3.6 to $4.1 million for the CCW/FG system (Table 6) and from $3.4 to $15.5 million for
the CCW system (Table 7).
It was assumed the drying system operates 24 hours a day and seven days a
week. Costs for operating and maintenance manpower were estimated by assuming
one operator for all the dryers during each operating shift and two maintenance
personnel for all the dryers during one shift each day. The operating costs include
salaries and wages, employee benefits, supervision, and supplies for operation and
maintenance. Other operating costs include electrical power to drive the fluidization air
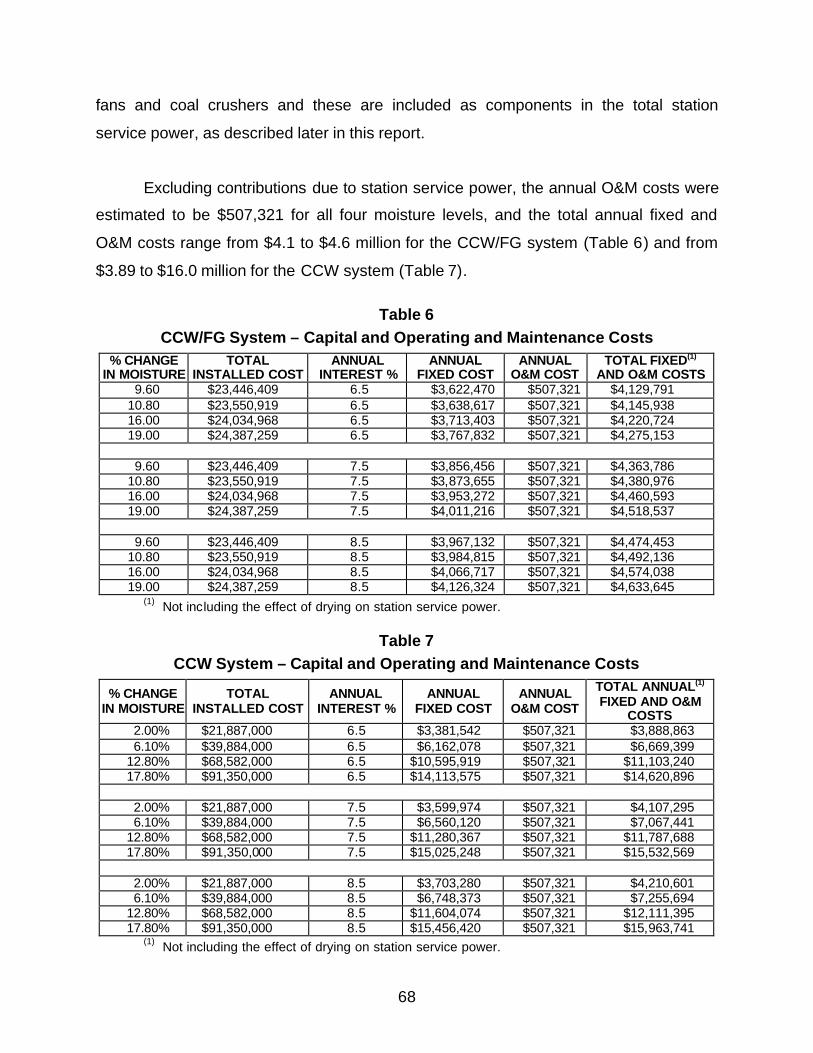
68
fans and coal crushers and these are included as components in the total station
service power, as described later in this report.
Excluding contributions due to station service power, the annual O&M costs were
estimated to be $507,321 for all four moisture levels, and the total annual fixed and
O&M costs range from $4.1 to $4.6 million for the CCW/FG system (Table 6) and from
$3.89 to $16.0 million for the CCW system (Table 7).
Table 6
CCW/FG System – Capital and Operating and Maintenance Costs % CHANGE
IN MOISTURE TOTAL
INSTALLED COST ANNUAL
INTEREST % ANNUAL
FIXED COST ANNUAL
O&M COST TOTAL FIXED(1)
AND O&M COSTS 9.60 $23,446,409 6.5 $3,622,470 $507,321 $4,129,791
10.80 $23,550,919 6.5 $3,638,617 $507,321 $4,145,938 16.00 $24,034,968 6.5 $3,713,403 $507,321 $4,220,724 19.00 $24,387,259 6.5 $3,767,832 $507,321 $4,275,153
9.60 $23,446,409 7.5 $3,856,456 $507,321 $4,363,786
10.80 $23,550,919 7.5 $3,873,655 $507,321 $4,380,976 16.00 $24,034,968 7.5 $3,953,272 $507,321 $4,460,593 19.00 $24,387,259 7.5 $4,011,216 $507,321 $4,518,537
9.60 $23,446,409 8.5 $3,967,132 $507,321 $4,474,453
10.80 $23,550,919 8.5 $3,984,815 $507,321 $4,492,136 16.00 $24,034,968 8.5 $4,066,717 $507,321 $4,574,038 19.00 $24,387,259 8.5 $4,126,324 $507,321 $4,633,645
(1) Not including the effect of drying on station service power.
Table 7 CCW System – Capital and Operating and Maintenance Costs
% CHANGE IN MOISTURE
TOTAL INSTALLED COST
ANNUAL INTEREST %
ANNUAL FIXED COST
ANNUAL O&M COST
TOTAL ANNUAL(1) FIXED AND O&M
COSTS 2.00% $21,887,000 6.5 $3,381,542 $507,321 $3,888,863 6.10% $39,884,000 6.5 $6,162,078 $507,321 $6,669,399
12.80% $68,582,000 6.5 $10,595,919 $507,321 $11,103,240 17.80% $91,350,000 6.5 $14,113,575 $507,321 $14,620,896
2.00% $21,887,000 7.5 $3,599,974 $507,321 $4,107,295 6.10% $39,884,000 7.5 $6,560,120 $507,321 $7,067,441
12.80% $68,582,000 7.5 $11,280,367 $507,321 $11,787,688 17.80% $91,350,000 7.5 $15,025,248 $507,321 $15,532,569
2.00% $21,887,000 8.5 $3,703,280 $507,321 $4,210,601 6.10% $39,884,000 8.5 $6,748,373 $507,321 $7,255,694
12.80% $68,582,000 8.5 $11,604,074 $507,321 $12,111,395 17.80% $91,350,000 8.5 $15,456,420 $507,321 $15,963,741
(1) Not including the effect of drying on station service power.
69
Costs Due to Increased Station Service Power
The components of station service power affected by coal drying include the
induced draft and forced draft fan power, mill and crusher power and power for the
fluidization air fans.
Coal drying results in a decreased flow rate of combustion air and a decreased
flow rate of flue gas thus reducing the power requirements for the forced draft and
induced draft fans. Note that fan power is proportional to the air or flue gas flow rate.
Pulverizer power requirements depend on the flow rate of coal through the
pulverizers and the energy requirement for grinding per ton of coal. Coal drying results
in a reduction in the energy requirements for grinding per ton of coal, as is illustrated in
Figure 72, which summarizes laboratory data from Reference 7 on the effect of feed
moisture content on pulverizer specific power requirements for seven different lignites.
These data show the power/ton of lignite feed varied linearly with coal moisture level,
with the specific power at 20 percent moisture being 2/3 of the specific power at 40
percent moisture. Both the reduced coal flow rate and the reduction in grinding energy
per ton of coal were taken into account in this analysis.
As noted above, coal drying results in a reduction of the power requirements for
the coal pulverizers and for the induced draft and forced draft fans. But it also leads to
the addition of two new power components … the power required to drive the fans for
the fluidization air and the power for the coal crushers. The flow rate of fluidization air
depends on dryer size, which, in turn, depends on the temperature(s) of the heat
source(s) used for drying and the difference between the inlet and exit coal moisture
levels.
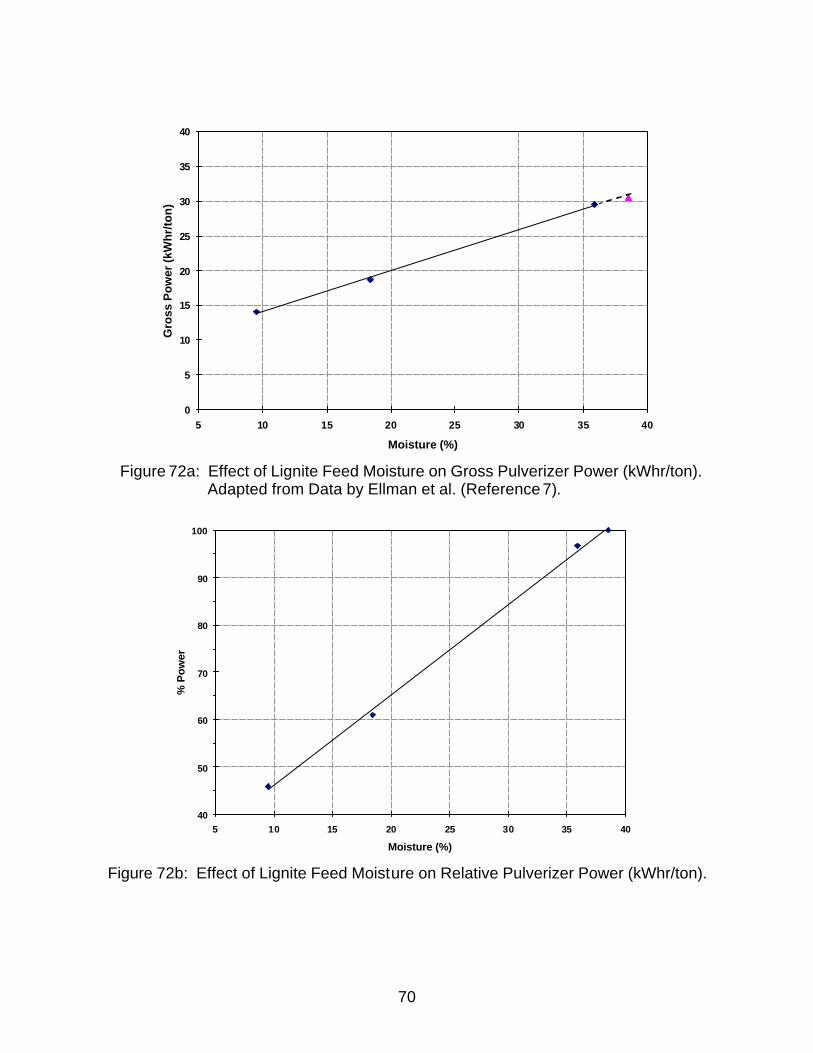
70
40
50
60
70
80
90
100
5 10 15 20 25 30 35 40
Moisture (%)
% P
ow
er
0
5
10
15
20
25
30
35
40
5 10 15 20 25 30 35 40
Moisture (%)
Gro
ss P
ow
er (k
Wh
r/to
n)
Figure 72a: Effect of Lignite Feed Moisture on Gross Pulverizer Power (kWhr/ton). Adapted from Data by Ellman et al. (Reference 7).
Figure 72b: Effect of Lignite Feed Moisture on Relative Pulverizer Power (kWhr/ton).
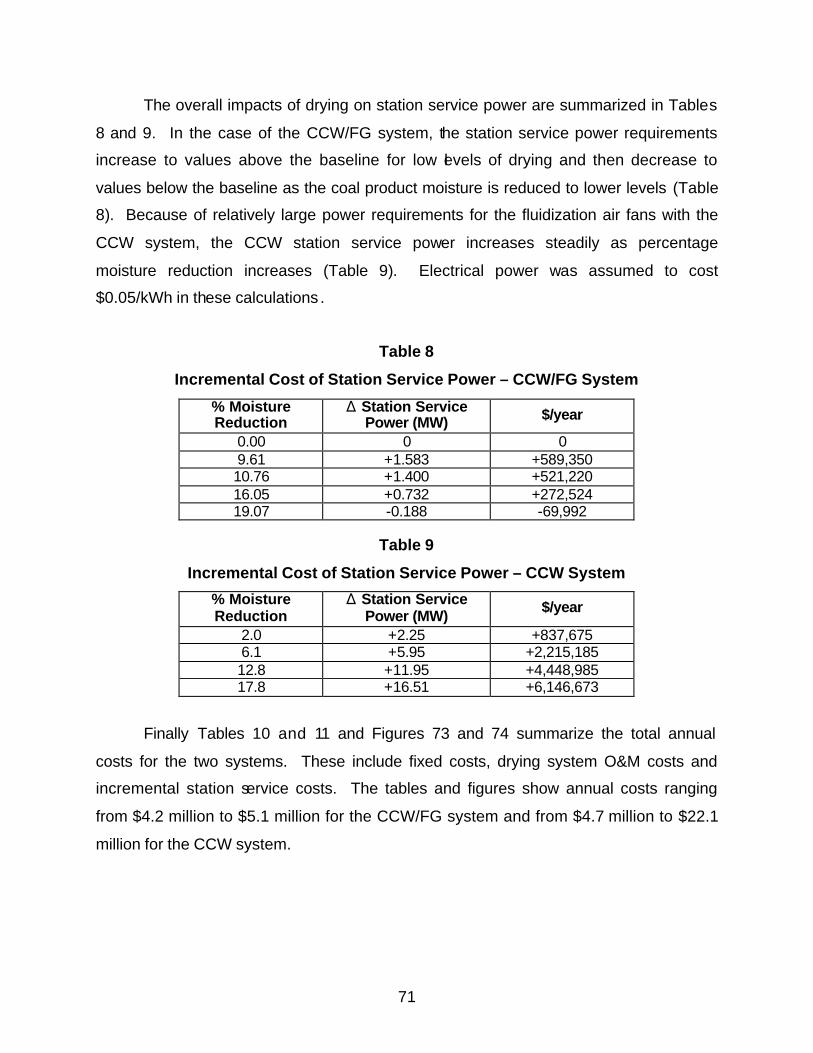
71
The overall impacts of drying on station service power are summarized in Tables
8 and 9. In the case of the CCW/FG system, the station service power requirements
increase to values above the baseline for low levels of drying and then decrease to
values below the baseline as the coal product moisture is reduced to lower levels (Table
8). Because of relatively large power requirements for the fluidization air fans with the
CCW system, the CCW station service power increases steadily as percentage
moisture reduction increases (Table 9). Electrical power was assumed to cost
$0.05/kWh in these calculations .
Table 8
Incremental Cost of Station Service Power – CCW/FG System
% Moisture Reduction
) Station Service Power (MW) $/year
0.00 0 0 9.61 +1.583 +589,350 10.76 +1.400 +521,220 16.05 +0.732 +272,524 19.07 -0.188 -69,992
Table 9
Incremental Cost of Station Service Power – CCW System
% Moisture Reduction
) Station Service Power (MW) $/year
2.0 +2.25 +837,675 6.1 +5.95 +2,215,185 12.8 +11.95 +4,448,985 17.8 +16.51 +6,146,673
Finally Tables 10 and 11 and Figures 73 and 74 summarize the total annual
costs for the two systems. These include fixed costs, drying system O&M costs and
incremental station service costs. The tables and figures show annual costs ranging
from $4.2 million to $5.1 million for the CCW/FG system and from $4.7 million to $22.1
million for the CCW system.
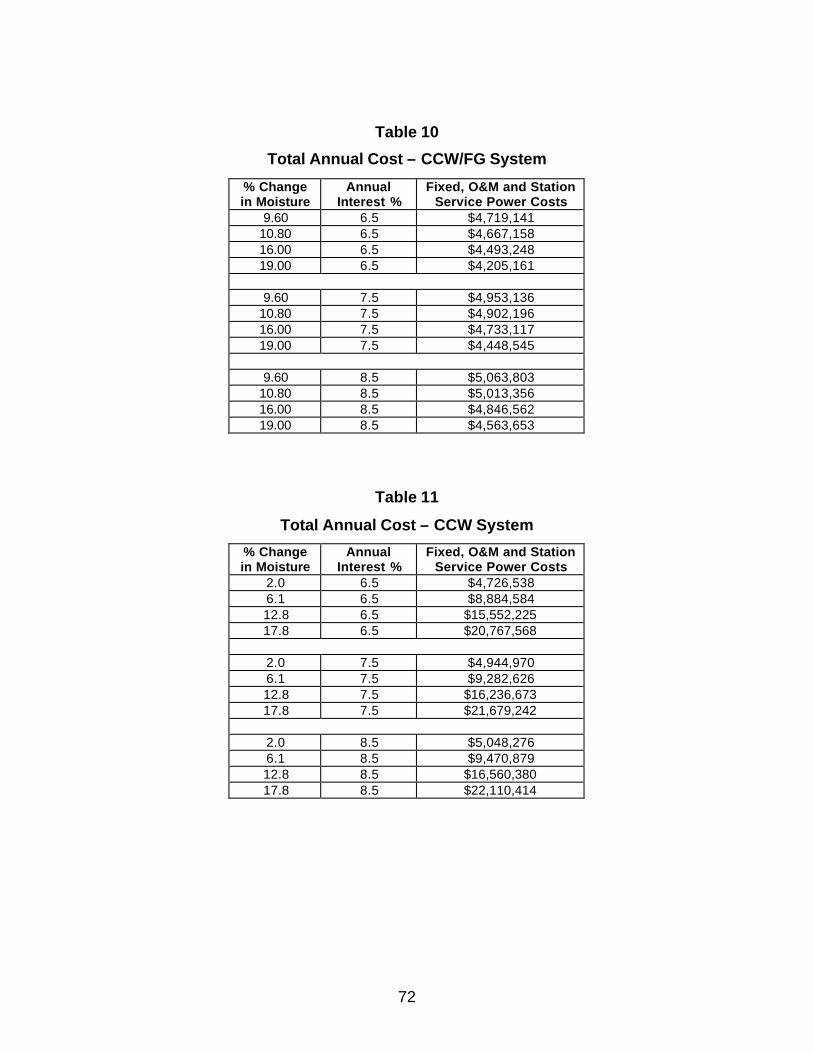
72
Table 10
Total Annual Cost – CCW/FG System
% Change in Moisture
Annual Interest %
Fixed, O&M and Station Service Power Costs
9.60 6.5 $4,719,141 10.80 6.5 $4,667,158 16.00 6.5 $4,493,248 19.00 6.5 $4,205,161
9.60 7.5 $4,953,136
10.80 7.5 $4,902,196 16.00 7.5 $4,733,117 19.00 7.5 $4,448,545
9.60 8.5 $5,063,803
10.80 8.5 $5,013,356 16.00 8.5 $4,846,562 19.00 8.5 $4,563,653
Table 11
Total Annual Cost – CCW System
% Change in Moisture
Annual Interest %
Fixed, O&M and Station Service Power Costs
2.0 6.5 $4,726,538 6.1 6.5 $8,884,584 12.8 6.5 $15,552,225 17.8 6.5 $20,767,568
2.0 7.5 $4,944,970 6.1 7.5 $9,282,626 12.8 7.5 $16,236,673 17.8 7.5 $21,679,242
2.0 8.5 $5,048,276 6.1 8.5 $9,470,879 12.8 8.5 $16,560,380 17.8 8.5 $22,110,414
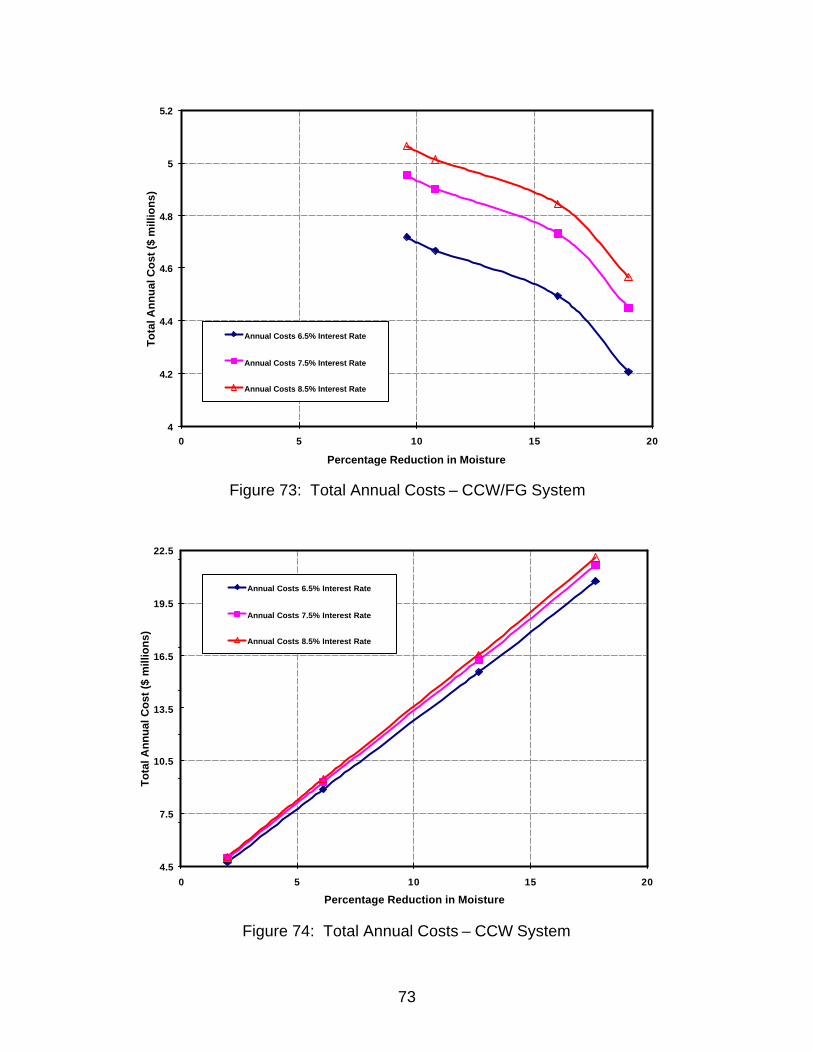
73
4
4.2
4.4
4.6
4.8
5
5.2
0 5 10 15 20
Percentage Reduction in Moisture
To
tal A
nn
ual
Co
st (
$ m
illio
ns)
Annual Costs 6.5% Interest Rate
Annual Costs 7.5% Interest Rate
Annual Costs 8.5% Interest Rate
4.5
7.5
10.5
13.5
16.5
19.5
22.5
0 5 10 15 20
Percentage Reduction in Moisture
To
tal A
nn
ual
Co
st (
$ m
illio
ns)
Annual Costs 6.5% Interest Rate
Annual Costs 7.5% Interest Rate
Annual Costs 8.5% Interest Rate
Figure 73: Total Annual Costs – CCW/FG System
Figure 74: Total Annual Costs – CCW System
74
FINANCIAL BENEFITS
The potential financial benefits fall into six categories:
• Reduced Fuel Costs • Reduced Ash Disposal Costs
• Avoided Costs of Emissions Control • Water Savings • Reduced Mill Maintenance Costs • Reduced Lost Generation Due to Mill Outages
The factors considered in quantification of these benefits are described in the
following sections of this report. Three estimates are listed for some of the unit cost
parameters to reflect ranges of possible values. For this reason, a range of values
(minimum to maximum) will be given for the total benefits.
Reduced Fuel Costs
The results presented in Part II of this report show that use of power plant waste
heat to dry the coal before pulverizing it results in a reduction in unit heat rate. Thus, for
a fixed gross power output, the percentage improvement in heat rate results in a
proportional percentage reduction in coal use. A delivered coal cost of $17.36/ton was
assumed for the analysis.
Reduced Ash Disposal Costs
A reduction in coal use results in a reduction in ash disposal costs. Ash disposal
costs of $8 to $16/ton were assumed. The calculated savings due to reduced fuel and
ash disposal costs are summarized in Table 12 for the CCW/FG system and in Table 13
for the CCW system.
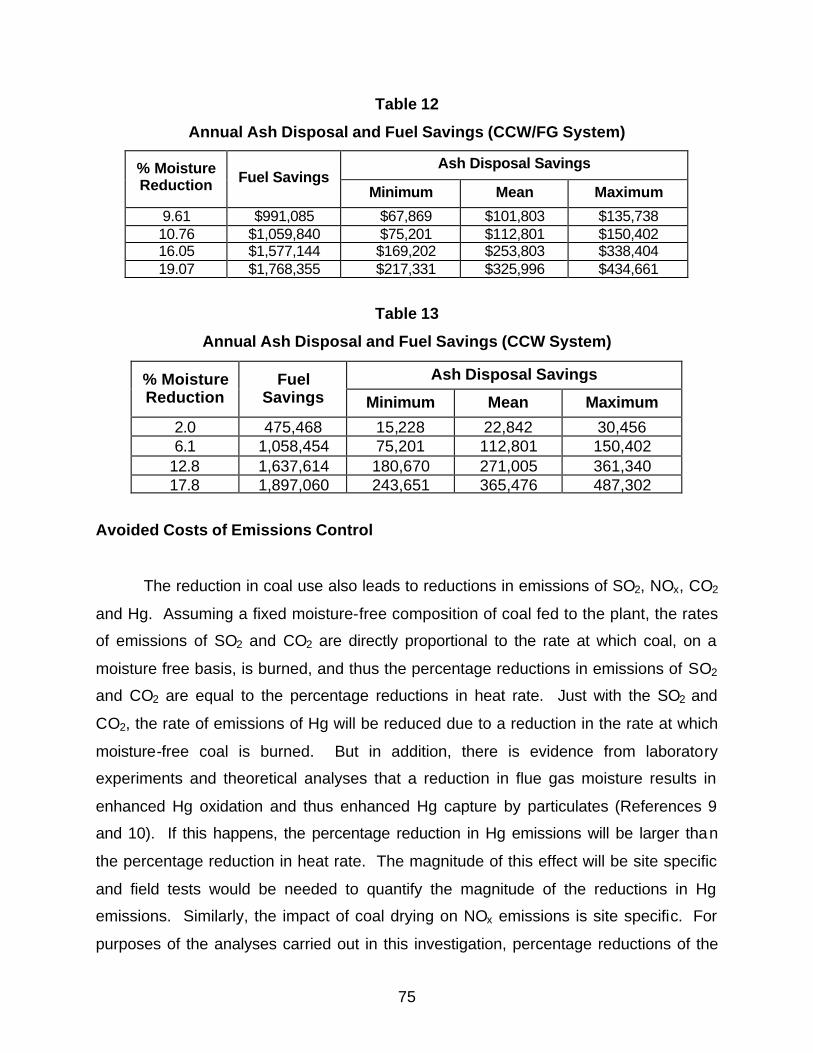
75
Table 12
Annual Ash Disposal and Fuel Savings (CCW/FG System)
Ash Disposal Savings % Moisture Reduction Fuel Savings
Minimum Mean Maximum
9.61 $991,085 $67,869 $101,803 $135,738 10.76 $1,059,840 $75,201 $112,801 $150,402 16.05 $1,577,144 $169,202 $253,803 $338,404 19.07 $1,768,355 $217,331 $325,996 $434,661
Table 13
Annual Ash Disposal and Fuel Savings (CCW System)
Ash Disposal Savings % Moisture Reduction
Fuel Savings Minimum Mean Maximum
2.0 475,468 15,228 22,842 30,456 6.1 1,058,454 75,201 112,801 150,402
12.8 1,637,614 180,670 271,005 361,340 17.8 1,897,060 243,651 365,476 487,302
Avoided Costs of Emissions Control
The reduction in coal use also leads to reductions in emissions of SO2, NOx, CO2
and Hg. Assuming a fixed moisture-free composition of coal fed to the plant, the rates
of emissions of SO2 and CO2 are directly proportional to the rate at which coal, on a
moisture free basis, is burned, and thus the percentage reductions in emissions of SO2
and CO2 are equal to the percentage reductions in heat rate. Just with the SO2 and
CO2, the rate of emissions of Hg will be reduced due to a reduction in the rate at which
moisture-free coal is burned. But in addition, there is evidence from laboratory
experiments and theoretical analyses that a reduction in flue gas moisture results in
enhanced Hg oxidation and thus enhanced Hg capture by particulates (References 9
and 10). If this happens, the percentage reduction in Hg emissions will be larger than
the percentage reduction in heat rate. The magnitude of this effect will be site specific
and field tests would be needed to quantify the magnitude of the reductions in Hg
emissions. Similarly, the impact of coal drying on NOx emissions is site specific. For
purposes of the analyses carried out in this investigation, percentage reductions of the
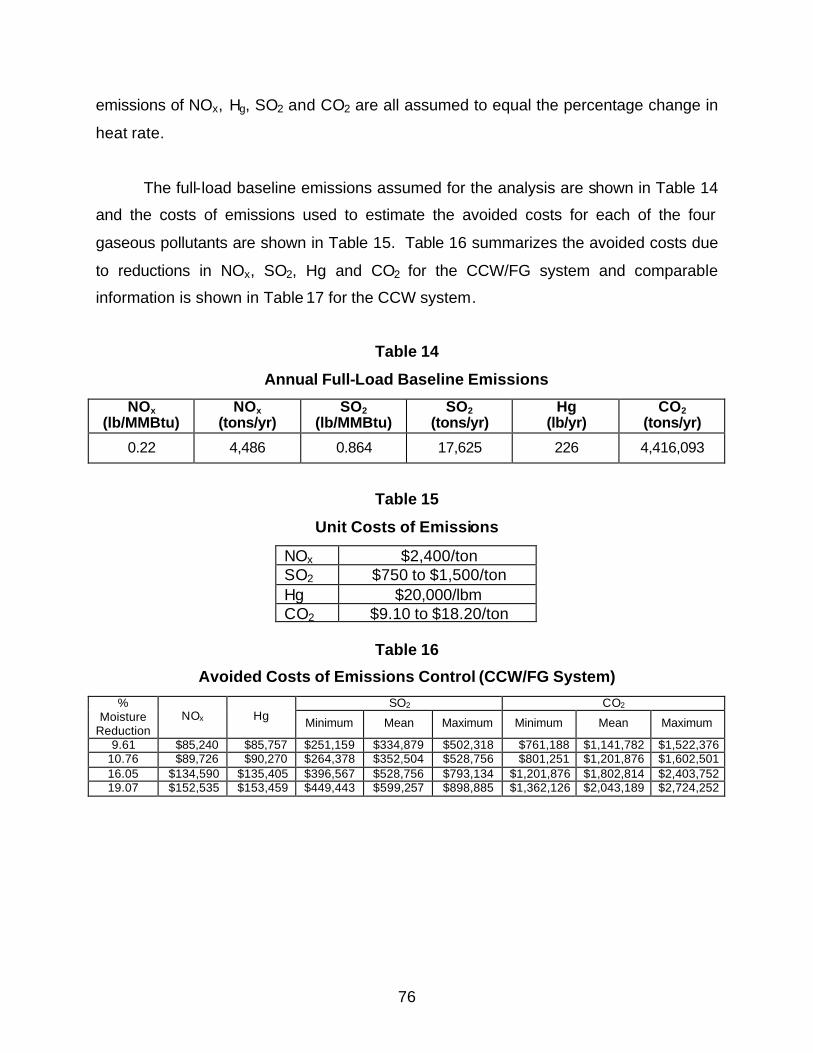
76
emissions of NOx, Hg, SO2 and CO2 are all assumed to equal the percentage change in
heat rate.
The full-load baseline emissions assumed for the analysis are shown in Table 14
and the costs of emissions used to estimate the avoided costs for each of the four
gaseous pollutants are shown in Table 15. Table 16 summarizes the avoided costs due
to reductions in NOx, SO2, Hg and CO2 for the CCW/FG system and comparable
information is shown in Table 17 for the CCW system.
Table 14
Annual Full-Load Baseline Emissions
NOx (lb/MMBtu)
NOx (tons/yr)
SO2 (lb/MMBtu)
SO2 (tons/yr)
Hg (lb/yr)
CO2 (tons/yr)
0.22 4,486 0.864 17,625 226 4,416,093
Table 15
Unit Costs of Emissions
NOx $2,400/ton SO2 $750 to $1,500/ton Hg $20,000/lbm CO2 $9.10 to $18.20/ton
Table 16
Avoided Costs of Emissions Control (CCW/FG System)
SO2 CO2 % Moisture
Reduction NOx Hg Minimum Mean Maximum Minimum Mean Maximum
9.61 $85,240 $85,757 $251,159 $334,879 $502,318 $761,188 $1,141,782 $1,522,376 10.76 $89,726 $90,270 $264,378 $352,504 $528,756 $801,251 $1,201,876 $1,602,501 16.05 $134,590 $135,405 $396,567 $528,756 $793,134 $1,201,876 $1,802,814 $2,403,752 19.07 $152,535 $153,459 $449,443 $599,257 $898,885 $1,362,126 $2,043,189 $2,724,252
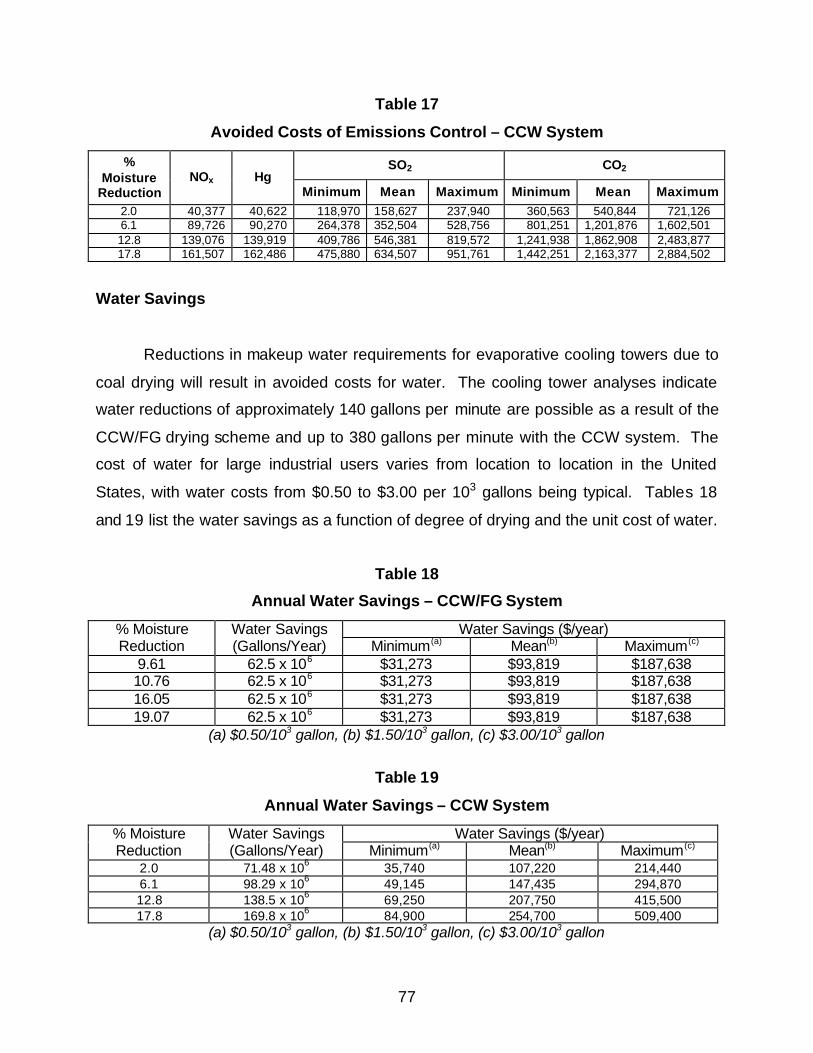
77
Table 17
Avoided Costs of Emissions Control – CCW System
SO2 CO2 % Moisture
Reduction NOx Hg
Minimum Mean Maximum Minimum Mean Maximum 2.0 40,377 40,622 118,970 158,627 237,940 360,563 540,844 721,126 6.1 89,726 90,270 264,378 352,504 528,756 801,251 1,201,876 1,602,501 12.8 139,076 139,919 409,786 546,381 819,572 1,241,938 1,862,908 2,483,877 17.8 161,507 162,486 475,880 634,507 951,761 1,442,251 2,163,377 2,884,502
Water Savings
Reductions in makeup water requirements for evaporative cooling towers due to
coal drying will result in avoided costs for water. The cooling tower analyses indicate
water reductions of approximately 140 gallons per minute are possible as a result of the
CCW/FG drying scheme and up to 380 gallons per minute with the CCW system. The
cost of water for large industrial users varies from location to location in the United
States, with water costs from $0.50 to $3.00 per 103 gallons being typical. Tables 18
and 19 list the water savings as a function of degree of drying and the unit cost of water.
Table 18
Annual Water Savings – CCW/FG System
Water Savings ($/year) % Moisture Reduction
Water Savings (Gallons/Year) Minimum(a) Mean(b) Maximum(c)
9.61 62.5 x 10⁶ $31,273 $93,819 $187,638 10.76 62.5 x 10⁶ $31,273 $93,819 $187,638 16.05 62.5 x 10⁶ $31,273 $93,819 $187,638 19.07 62.5 x 10⁶ $31,273 $93,819 $187,638
(a) $0.50/103 gallon, (b) $1.50/103 gallon, (c) $3.00/103 gallon
Table 19
Annual Water Savings – CCW System
Water Savings ($/year) % Moisture Reduction
Water Savings (Gallons/Year) Minimum(a) Mean(b) Maximum(c)
2.0 71.48 x 10⁶ 35,740 107,220 214,440 6.1 98.29 x 10⁶ 49,145 147,435 294,870 12.8 138.5 x 10⁶ 69,250 207,750 415,500 17.8 169.8 x 10⁶ 84,900 254,700 509,400
(a) $0.50/103 gallon, (b) $1.50/103 gallon, (c) $3.00/103 gallon
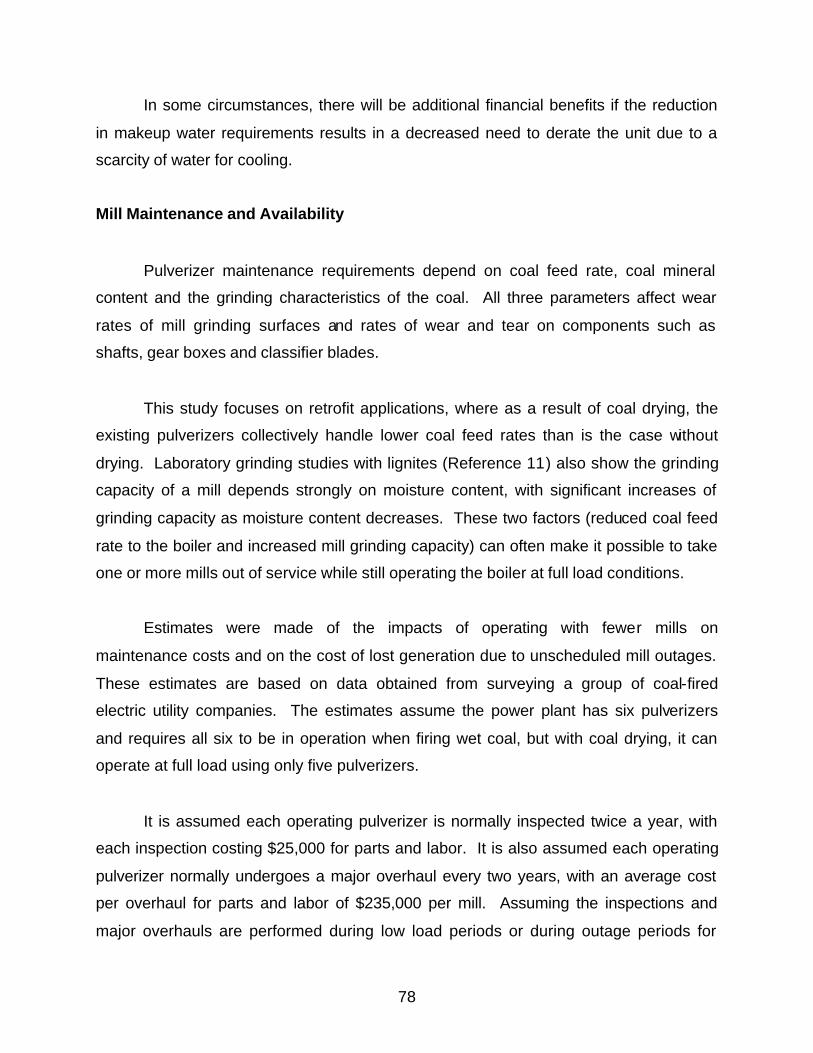
78
In some circumstances, there will be additional financial benefits if the reduction
in makeup water requirements results in a decreased need to derate the unit due to a
scarcity of water for cooling.
Mill Maintenance and Availability
Pulverizer maintenance requirements depend on coal feed rate, coal mineral
content and the grinding characteristics of the coal. All three parameters affect wear
rates of mill grinding surfaces and rates of wear and tear on components such as
shafts, gear boxes and classifier blades.
This study focuses on retrofit applications, where as a result of coal drying, the
existing pulverizers collectively handle lower coal feed rates than is the case without
drying. Laboratory grinding studies with lignites (Reference 11) also show the grinding
capacity of a mill depends strongly on moisture content, with significant increases of
grinding capacity as moisture content decreases. These two factors (reduced coal feed
rate to the boiler and increased mill grinding capacity) can often make it possible to take
one or more mills out of service while still operating the boiler at full load conditions.
Estimates were made of the impacts of operating with fewer mills on
maintenance costs and on the cost of lost generation due to unscheduled mill outages.
These estimates are based on data obtained from surveying a group of coal-fired
electric utility companies. The estimates assume the power plant has six pulverizers
and requires all six to be in operation when firing wet coal, but with coal drying, it can
operate at full load using only five pulverizers.
It is assumed each operating pulverizer is normally inspected twice a year, with
each inspection costing $25,000 for parts and labor. It is also assumed each operating
pulverizer normally undergoes a major overhaul every two years, with an average cost
per overhaul for parts and labor of $235,000 per mill. Assuming the inspections and
major overhauls are performed during low load periods or during outage periods for
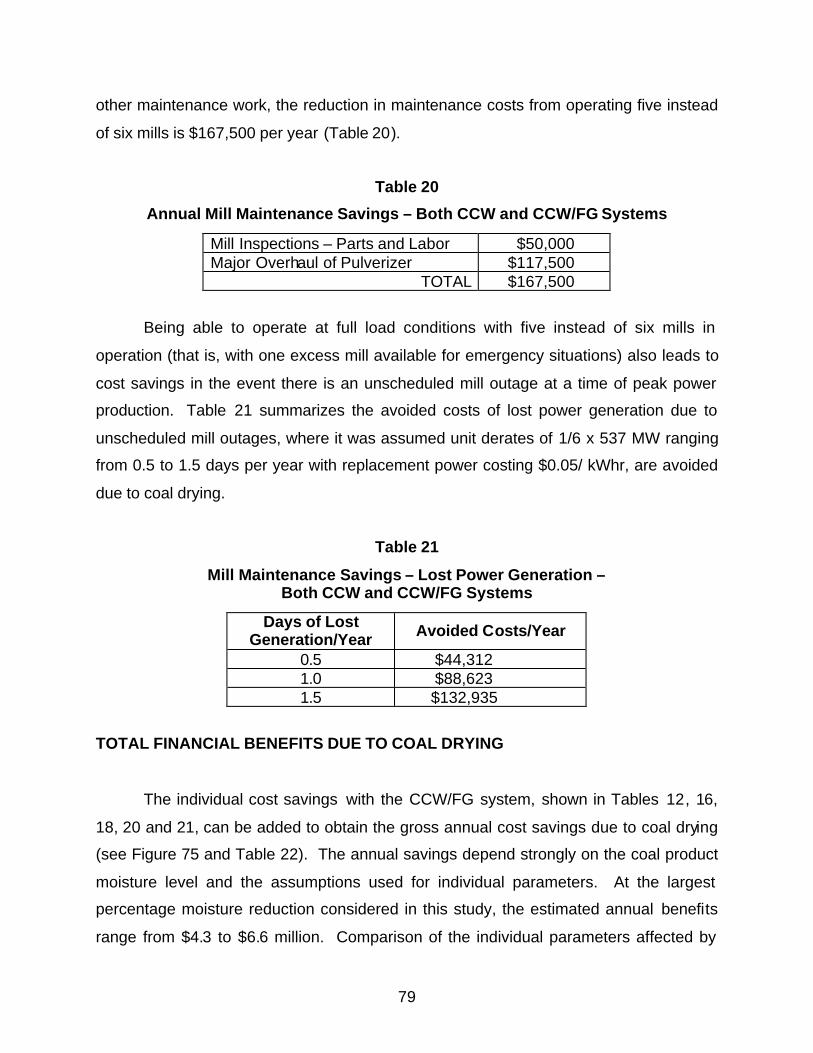
79
other maintenance work, the reduction in maintenance costs from operating five instead
of six mills is $167,500 per year (Table 20).
Table 20
Annual Mill Maintenance Savings – Both CCW and CCW/FG Systems
Mill Inspections – Parts and Labor $50,000 Major Overhaul of Pulverizer $117,500
TOTAL $167,500
Being able to operate at full load conditions with five instead of six mills in
operation (that is, with one excess mill available for emergency situations) also leads to
cost savings in the event there is an unscheduled mill outage at a time of peak power
production. Table 21 summarizes the avoided costs of lost power generation due to
unscheduled mill outages, where it was assumed unit derates of 1/6 x 537 MW ranging
from 0.5 to 1.5 days per year with replacement power costing $0.05/ kWhr, are avoided
due to coal drying.
Table 21
Mill Maintenance Savings – Lost Power Generation – Both CCW and CCW/FG Systems
Days of Lost Generation/Year Avoided Costs/Year
0.5 $44,312 1.0 $88,623 1.5 $132,935
TOTAL FINANCIAL BENEFITS DUE TO COAL DRYING
The individual cost savings with the CCW/FG system, shown in Tables 12, 16,
18, 20 and 21, can be added to obtain the gross annual cost savings due to coal drying
(see Figure 75 and Table 22). The annual savings depend strongly on the coal product
moisture level and the assumptions used for individual parameters. At the largest
percentage moisture reduction considered in this study, the estimated annual benefits
range from $4.3 to $6.6 million. Comparison of the individual parameters affected by
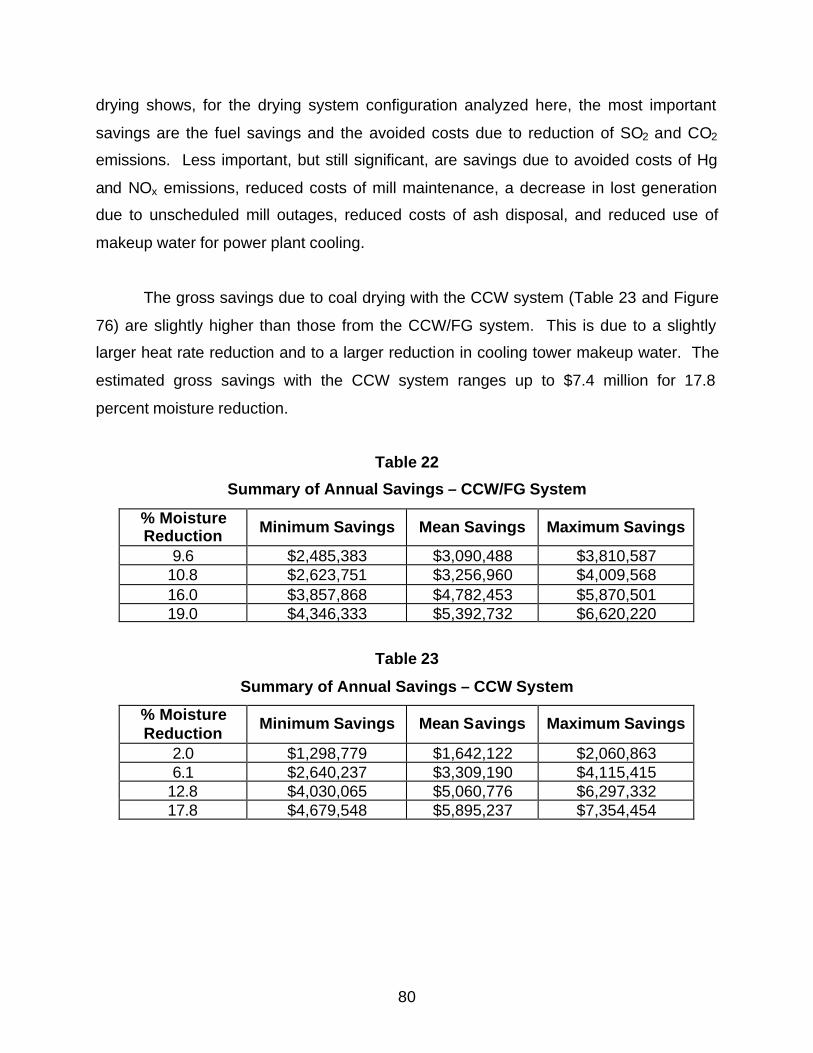
80
drying shows, for the drying system configuration analyzed here, the most important
savings are the fuel savings and the avoided costs due to reduction of SO2 and CO2
emissions. Less important, but still significant, are savings due to avoided costs of Hg
and NOx emissions, reduced costs of mill maintenance, a decrease in lost generation
due to unscheduled mill outages, reduced costs of ash disposal, and reduced use of
makeup water for power plant cooling.
The gross savings due to coal drying with the CCW system (Table 23 and Figure
76) are slightly higher than those from the CCW/FG system. This is due to a slightly
larger heat rate reduction and to a larger reduction in cooling tower makeup water. The
estimated gross savings with the CCW system ranges up to $7.4 million for 17.8
percent moisture reduction.
Table 22
Summary of Annual Savings – CCW/FG System
% Moisture Reduction Minimum Savings Mean Savings Maximum Savings
9.6 $2,485,383 $3,090,488 $3,810,587 10.8 $2,623,751 $3,256,960 $4,009,568 16.0 $3,857,868 $4,782,453 $5,870,501 19.0 $4,346,333 $5,392,732 $6,620,220
Table 23
Summary of Annual Savings – CCW System
% Moisture Reduction
Minimum Savings Mean Savings Maximum Savings
2.0 $1,298,779 $1,642,122 $2,060,863 6.1 $2,640,237 $3,309,190 $4,115,415
12.8 $4,030,065 $5,060,776 $6,297,332 17.8 $4,679,548 $5,895,237 $7,354,454
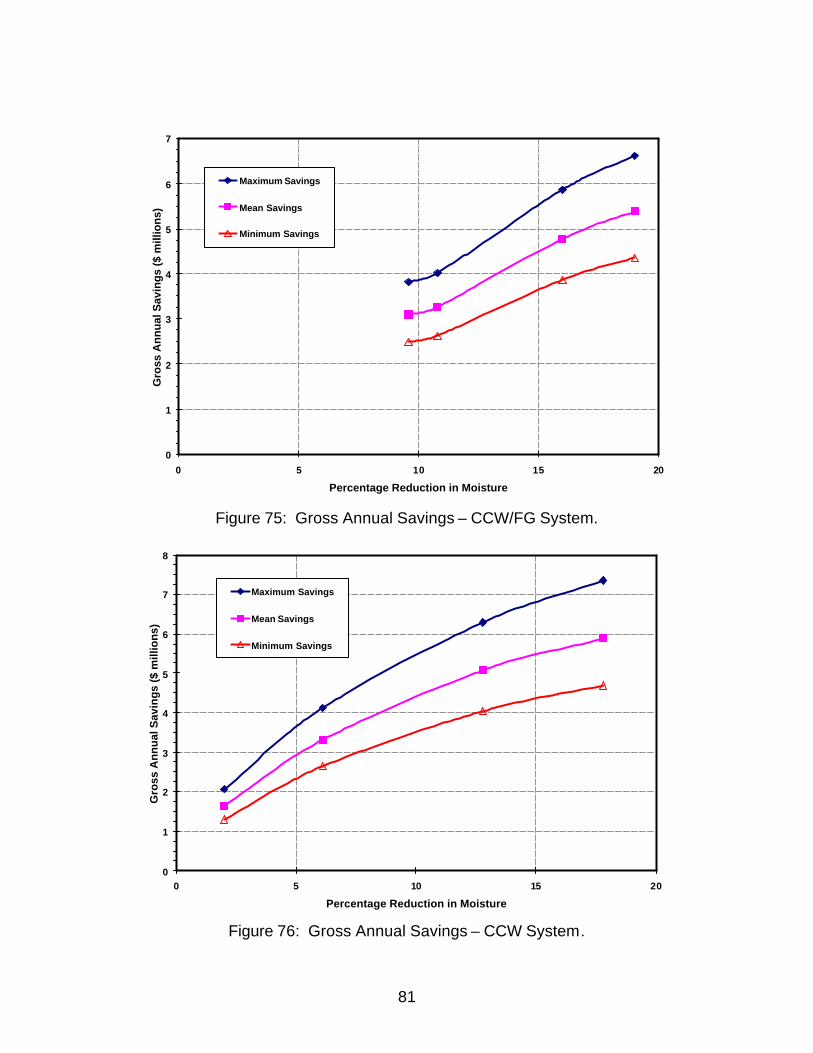
81
0
1
2
3
4
5
6
7
0 5 10 15 20
Percentage Reduction in Moisture
Gro
ss A
nn
ual
Sav
ing
s ($
mill
ion
s)
Maximum Savings
Mean Savings
Minimum Savings
0
1
2
3
4
5
6
7
8
0 5 10 15 20
Percentage Reduction in Moisture
Gro
ss A
nn
ual
Sav
ing
s ($
mill
ion
s)
Maximum Savings
Mean Savings
Minimum Savings
Figure 75: Gross Annual Savings – CCW/FG System.
Figure 76: Gross Annual Savings – CCW System.
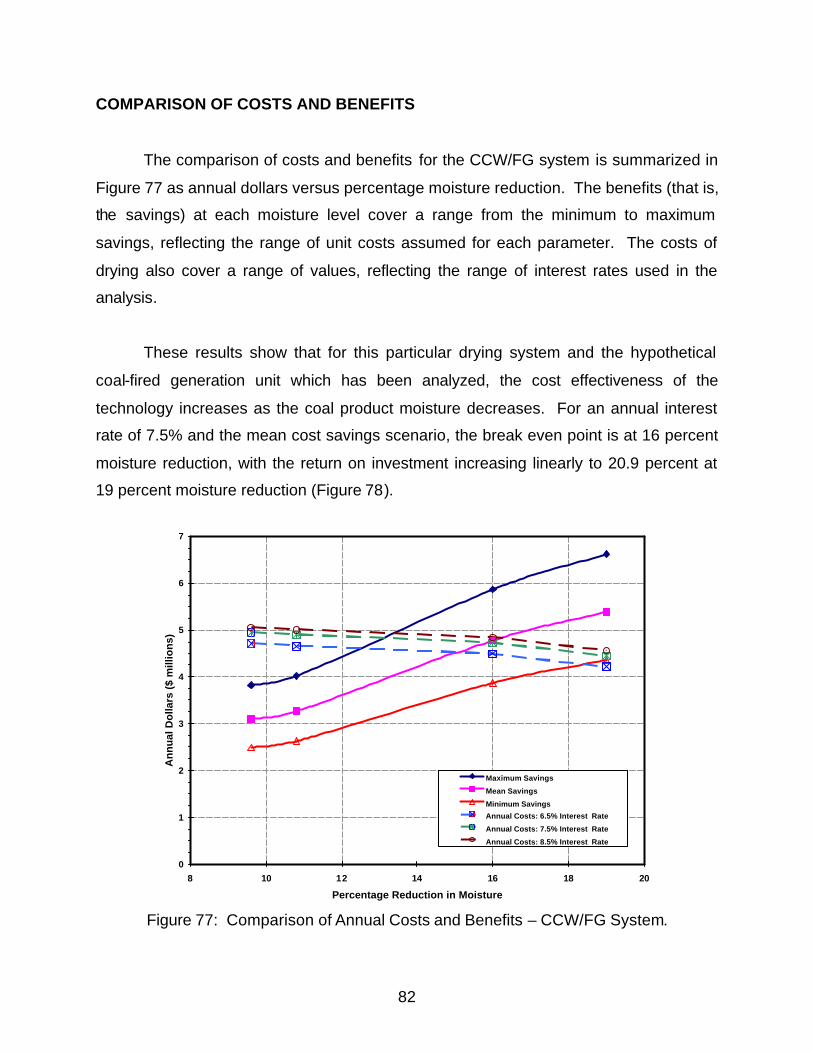
82
0
1
2
3
4
5
6
7
8 10 12 14 16 18 20
Percentage Reduction in Moisture
An
nu
al D
olla
rs (
$ m
illio
ns)
Maximum Savings
Mean Savings
Minimum Savings
Annual Costs: 6.5% Interest Rate
Annual Costs: 7.5% Interest Rate
Annual Costs: 8.5% Interest Rate
COMPARISON OF COSTS AND BENEFITS
The comparison of costs and benefits for the CCW/FG system is summarized in
Figure 77 as annual dollars versus percentage moisture reduction. The benefits (that is,
the savings) at each moisture level cover a range from the minimum to maximum
savings, reflecting the range of unit costs assumed for each parameter. The costs of
drying also cover a range of values, reflecting the range of interest rates used in the
analysis.
These results show that for this particular drying system and the hypothetical
coal-fired generation unit which has been analyzed, the cost effectiveness of the
technology increases as the coal product moisture decreases. For an annual interest
rate of 7.5% and the mean cost savings scenario, the break even point is at 16 percent
moisture reduction, with the return on investment increasing linearly to 20.9 percent at
19 percent moisture reduction (Figure 78).
Figure 77: Comparison of Annual Costs and Benefits – CCW/FG System.
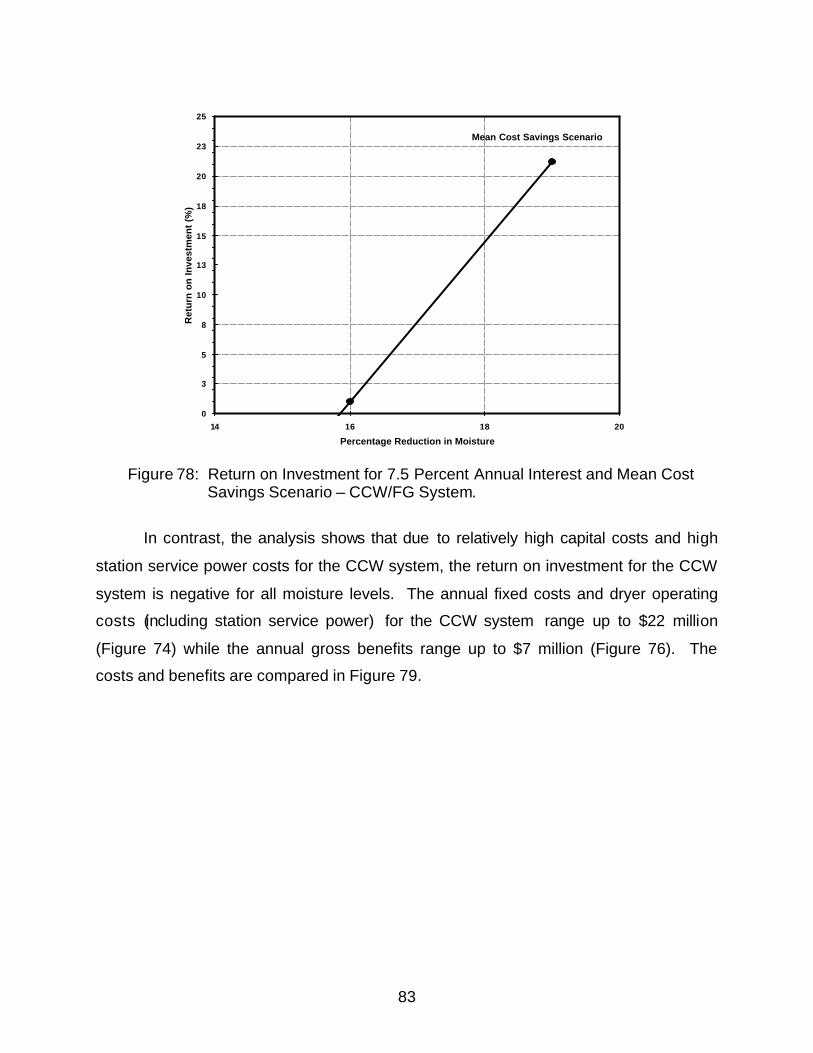
83
0
3
5
8
10
13
15
18
20
23
25
14 16 18 20
Percentage Reduction in Moisture
Ret
urn
on
Inve
stm
ent
(%)
Mean Cost Savings Scenario
Figure 78: Return on Investment for 7.5 Percent Annual Interest and Mean Cost Savings Scenario – CCW/FG System.
In contrast, the analysis shows that due to relatively high capital costs and high
station service power costs for the CCW system, the return on investment for the CCW
system is negative for all moisture levels. The annual fixed costs and dryer operating
costs (including station service power) for the CCW system range up to $22 million
(Figure 74) while the annual gross benefits range up to $7 million (Figure 76). The
costs and benefits are compared in Figure 79.
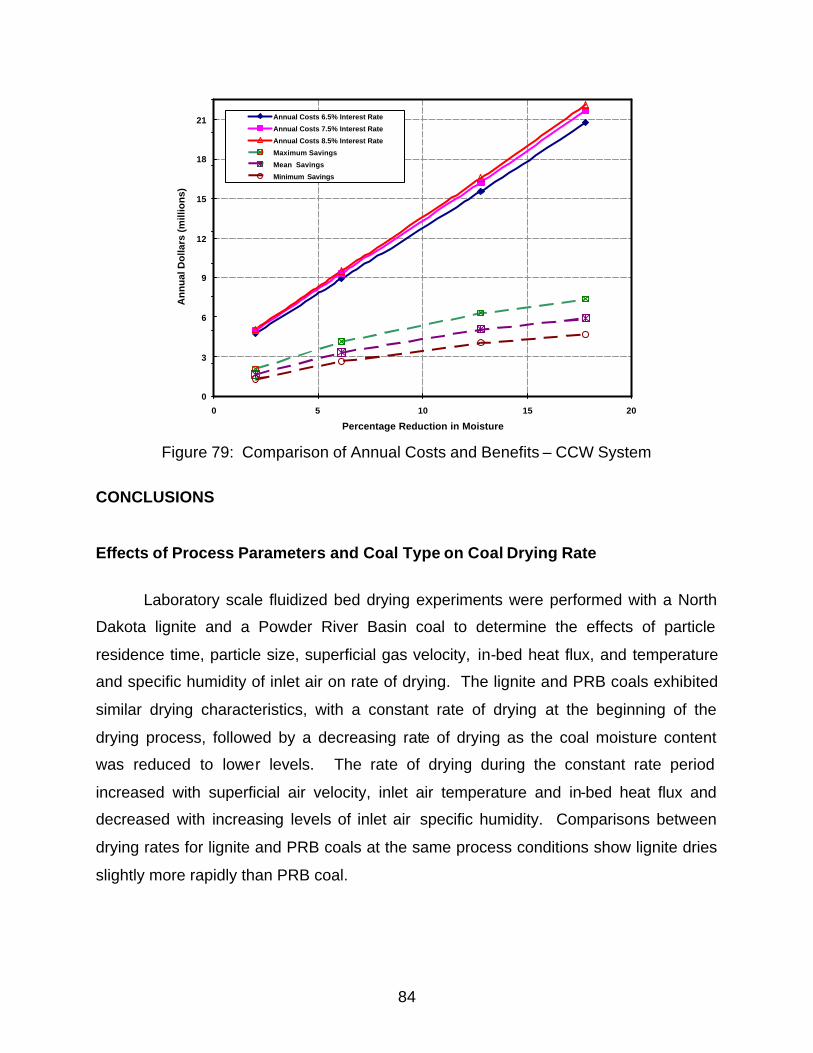
84
0
3
6
9
12
15
18
21
0 5 10 15 20
Percentage Reduction in Moisture
An
nu
al D
olla
rs (
mill
ion
s)
Annual Costs 6.5% Interest Rate
Annual Costs 7.5% Interest Rate
Annual Costs 8.5% Interest Rate
Maximum Savings
Mean Savings
Minimum Savings
Figure 79: Comparison of Annual Costs and Benefits – CCW System
CONCLUSIONS
Effects of Process Parameters and Coal Type on Coal Drying Rate
Laboratory scale fluidized bed drying experiments were performed with a North
Dakota lignite and a Powder River Basin coal to determine the effects of particle
residence time, particle size, superficial gas velocity, in-bed heat flux, and temperature
and specific humidity of inlet air on rate of drying. The lignite and PRB coals exhibited
similar drying characteristics, with a constant rate of drying at the beginning of the
drying process, followed by a decreasing rate of drying as the coal moisture content
was reduced to lower levels. The rate of drying during the constant rate period
increased with superficial air velocity, inlet air temperature and in-bed heat flux and
decreased with increasing levels of inlet air specific humidity. Comparisons between
drying rates for lignite and PRB coals at the same process conditions show lignite dries
slightly more rapidly than PRB coal.
85
A theoretical drying model was developed for batch fluidized bed drying
processes. Based on conservation of mass and energy and an equilibrium relation for
air humidity and coal moisture, the model gives excellent agreement with laboratory
data. A theoretical model was also developed for continuous flow fluidized bed dryers
operating at steady state conditions and calculated results were found to be in good
agreement with lignite drying data obtained from a pilot plant-scale dryer located at
Great River Energy’s Coal Creek Station.
Impacts of Coal Drying on Unit Operations
The second part of the project involved the design of drying systems for lignite
and PRB coal-fired power plants and analysis of the effects of drying system operation
on cooling tower makeup water, unit heat rate, auxiliary power and stack emissions.
The basic power plant configuration used in this analysis consisted of a balanced draft
boiler with both forced draft (FD) and induced draft (ID) fans, a bi-sector type air
preheater transferring thermal energy from the hot flue gas leaving the economizer to
the relatively low temperature air leaving the FD fans, and waste heat from the steam
condenser being carried by hot circulating water to an evaporative cooling tower, with
cold circulating water being returned to the condenser.
Two drying system designs were analyzed. One, referred to in this report by the
acronym, CCW, relies on waste heat extracted from the hot circulating water leaving the
condenser for drying. This drying scheme involves fluidized bed dryers, where waste
heat from the steam condenser is used to preheat the fluidization air and provide
additional heat for drying through in-bed heat exchangers. Coal is fed to the dryers and
is then transported with reduced moisture to the pulverizers before being conveyed to
the burners by transport air. The second type of drying system uses a combination of
condenser waste heat and heat extracted from boiler flue gas to attain higher drying
temperatures than are possible from condenser waste heat alone. This is referred to in
this report by the acronym, CCW/FG.
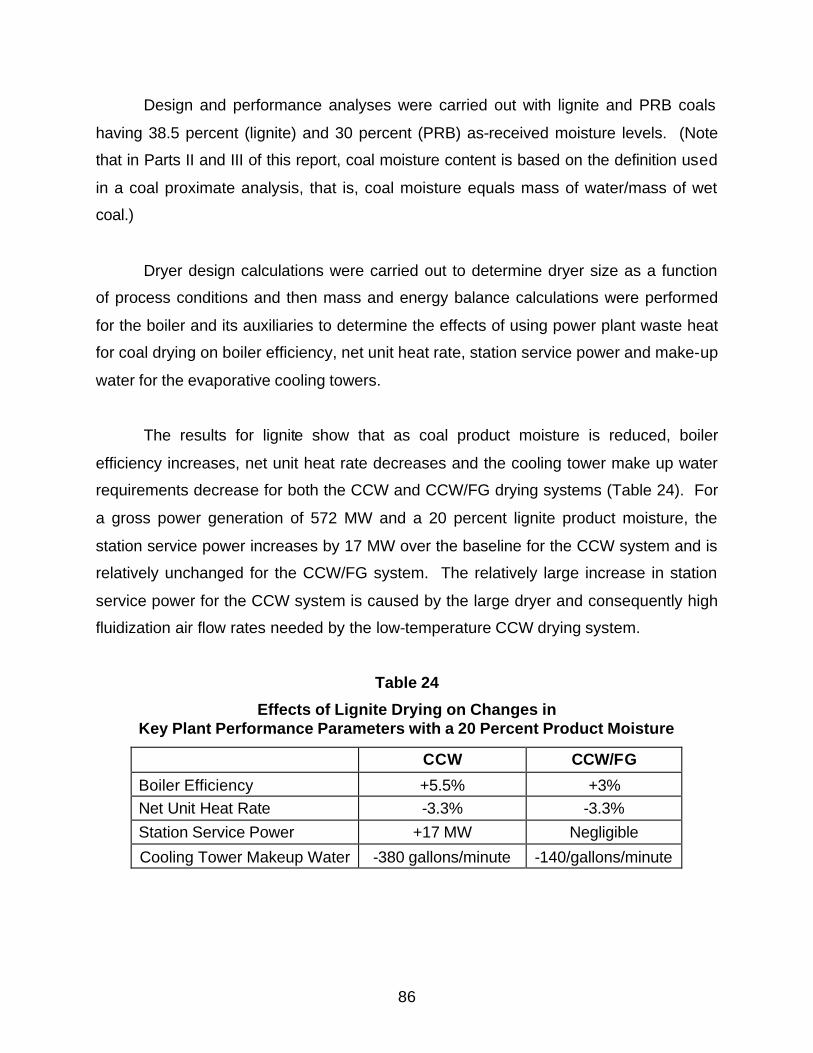
86
Design and performance analyses were carried out with lignite and PRB coals
having 38.5 percent (lignite) and 30 percent (PRB) as-received moisture levels. (Note
that in Parts II and III of this report, coal moisture content is based on the definition used
in a coal proximate analysis, that is, coal moisture equals mass of water/mass of wet
coal.)
Dryer design calculations were carried out to determine dryer size as a function
of process conditions and then mass and energy balance calculations were performed
for the boiler and its auxiliaries to determine the effects of using power plant waste heat
for coal drying on boiler efficiency, net unit heat rate, station service power and make-up
water for the evaporative cooling towers.
The results for lignite show that as coal product moisture is reduced, boiler
efficiency increases, net unit heat rate decreases and the cooling tower make up water
requirements decrease for both the CCW and CCW/FG drying systems (Table 24). For
a gross power generation of 572 MW and a 20 percent lignite product moisture, the
station service power increases by 17 MW over the baseline for the CCW system and is
relatively unchanged for the CCW/FG system. The relatively large increase in station
service power for the CCW system is caused by the large dryer and consequently high
fluidization air flow rates needed by the low-temperature CCW drying system.
Table 24
Effects of Lignite Drying on Changes in Key Plant Performance Parameters with a 20 Percent Product Moisture
CCW CCW/FG
Boiler Efficiency +5.5% +3% Net Unit Heat Rate -3.3% -3.3% Station Service Power +17 MW Negligible
Cooling Tower Makeup Water -380 gallons/minute -140/gallons/minute
87
Flue gas temperature at the inlet to the induced draft fan sets a constraint on the
maximum amount of drying. The acid dew point of the flue gas depends on the
concentration of SO3 in the flue gas. Flue gas temperatures which are too low will result
in excessive acid condensation and lead to heat exchanger fouling and corrosion. The
results show the CCW system will not be affected by acid condensation as much as the
CCW/FG system. A site-specific study would be needed to determine the extent to
which heat exchanger fouling and corrosion due to acid condensation constrains the
minimum coal product moisture.
The effect of coal drying on unit performance was also analyzed for identical
pulverized coal-fired power plants, one firing lignite and the other a PRB coal. These
calculations were performed for the CCW/FG drying system. The results show that
while there are small differences due to different coal compositions, the performance
impacts due to drying lignite and PRB coals follow the same trends and are very similar
in magnitude.
Economic Evaluation
Analyses were carried out to determine the cost effectiveness of the CCW and
CCW/FG drying systems. These analyses assumed a lignite feed with 38.5 percent
moisture, product moisture levels down to 19.5 percent and a gross electric power
output of 572 MW. Installed capital costs were found to depend on product moisture,
ranging up to $24.4 million for the CCW/FG drying system and up to $91 million for the
CCW system.
Annual fixed costs, assuming a 20 year life and a 7.5 percent interest rate range
up to $4.1 million for the CCW/FG system and up to $15.5 million for the CCW system.
Use of power plant waste heat to dry coal results in a net increase in station service
power of up to 16.5 MW for the CCW system and a negligibly small decrease in station
service power for the CCW/FG system. Accounting for annual fixed costs, drying
system operating and maintenance costs and costs associated with increases in station
88
service power, the annual costs of drying range up to $4.6 million for the CCW/FG
drying system and up to $22.1 million for the CCW system.
The potential financial benefits fall into six categories:
• Reduced Fuel Costs • Reduced Ash Disposal Costs • Avoided Costs of Emissions Control • Water Savings • Reduced Mill Maintenance Costs • Reduced Lost Generation Due to Mill Outages
Analyses were carried out to estimate the annual financial benefits and at the
lowest fuel product moisture levels, these ranged up to $6.6 million for the CCW/FG
system and up to $7.4 million for the CCW system.
Comparison of the individual parameters affected by drying shows the most
important savings are the fuel savings and the avoided costs due to reduction of SO2
and CO2 emissions. Less important, but still significant, are savings due to avoided
costs of Hg and NOx emission control, reduced costs of mill maintenance, a decrease in
lost generation due to unscheduled mill outages, reduced costs of ash disposal, and
reduced use of makeup water for power plant cooling.
A comparison of costs and benefits for the CCW/FG system show that for this
particular drying system and the hypothetical coal-fired generation unit which has been
analyzed, the cost effectiveness of the technology increases as the coal product
moisture decreases. For an annual interest rate of 7.5% and the mean cost savings
scenario, the break even point is at 16 percent coal moisture reduction, with the return
on investment increasing linearly to 20.9 percent at 19 percent coal moisture reduction.
In contrast, the analysis shows that due to relatively high capital costs and high
station service power costs for the CCW system, the return on investment for the CCW
89
system is negative for all moisture levels. The annual fixed costs and dryer operating
costs (including station service power) for the CCW system range up to $22 million
while the annual gross benefits range up to $7 million.
Additional Comments
The results from this project suggest that using power plant waste heat to dry
high-moisture fuels is both technically and economically feasible. The laboratory drying
tests showed that coal moisture can be reduced to less than one-half of that in the raw
coal with coal residence times in the dryer small enough to be economic. Rates of
drying for lignite and PRB coals were found to be of roughly the same magnitude, with
slightly higher drying rates for lignite.
The power plant performance analyses show that coal drying would result in
improved boiler efficiency, a reduced net unit heat rate, reduced stack emissions,
reduced makeup water requirements for evaporative cooling, reduced pulverizer
maintenance costs and improved unit availability. Savings due to decreased emissions
of SO2 and CO2 and decreased fuel costs are particularly significant cost factors. The
cost effectiveness of drying is heavily dependent on drying temperature, with a drying
system which uses a combination of heat extracted from boiler flue gas and from the
steam condenser providing a significant return on investment. While the low-
temperature CCW drying system, which relies exclusively on thermal energy from the
steam condenser, results in significantly greater reduction in cooling tower water
makeup, its relatively high installed capital costs and costs of increased station service
power make this option unattractive from a financial point of view.
The benefits and costs of coal drying will depend heavily on site-specific factors,
and detailed analyses would be needed to determine the most cost effective design for
a particular application. All of the analyses performed here are for retrofit applications.
However, a comparable study should be performed for new plant designs. Potential
savings from matching the boiler design and mill, fan, ESP and scrubber capacities to a
90
lower as-fired fuel moisture may very well lead to substantial additional reductions in
installed equipment costs.
REFERENCES 1. Bullinger, C., M. Ness, N. Sarunac, E. Levy, ”Coal Drying Improves Performance
and Reduces Emissions,” Presented at the 27th International Technical Conference on Coal Utilization and Fuel Systems, Clearwater, Florida, March 4-7, 2002.
2. Allardice, D. J., “The Water in Brown Coal,” in The Science of Victorian Brown
Coal: Structure, Properties and Consequences for Utilization ed. by R. A. Drurie; Butterworth-Heinemann, (1991).
3. Treybal, R., Mass Transfer Operations, second edition, McGraw Hill, page 498. 4. Levy, E. K., 1990. Power Plant Performance Monitoring and Improvement Vol. 7:
Operation of Regenerative Air Preheater. Electric Power Research Institute Report, EPRI CS/EL-4415-L.
5. Combustion: Fossil Power Systems, ed. J. Singer 3rd Ed. Published by
Combustion Engineering, Inc. 1981. 6. Levy, E., S. Munukutla, A. Jibilian, H. Crim, J. Cogoli, A. Kwasnik, and F. Wong,
“Analysis of the Effects of Coal Fineness, Excess Air and Exit Gas Temperature on the Heat Rate of a Coal-Fired Power Plant,” ASME Paper 84-JPGC-Pwr-1, presented at Joint Power Generation Conference, October 1984, Toronto, Canada.
7. Ellman, R., L. Dockter and J. Belter, “Pulverizing Lignite in a Ring-Roller Mill,”
U.S. Bureau of Mines Report 7631 (1972). 8. Perry’s Chemical Engineers’ Handbook, 7th ed. Robert H. Perry and Donald W.
Green. McGraw Hill. New York, New York. 1997. (Section 12-14.) 9. Wang, J., J. Cobb and W. Elder, “Study of Hg Oxidation in the Post-Combustion
Zones of a Coal-Fired Boiler,” Proceedings 2001 Conference on SCR/SNCR for NOx Control, Pittsburgh, Pennsylvania, May 2001.
10. Niksa, S., J. Helble and N. Fujiwara, “Kinetic Modeling of Homogeneous Mercury
Oxidation: The Importance of NO and H2O in Predicting Oxidation in Coal-Derived Systems,” Environmental Science and Technology 35, pp. 3701-3706, 2001.
91
11. Ellman, R., J. Belter and L. Dockter, “Lignite Pulverization: A Status Report” in U.S. Bureau of Mines Information Circular 8376, Technology and Use of Lignite, Proceedings of Bureau of Mines-University of North Dakota Symposium, Grand Forks, North Dakota, April 27-28, 1967.
NOMENCLATURE
A Tube Bundle Surface Area
Cc Specific Heat of Coal
CL Specific Heat of Coal Moisture
Cpair Specific Heat of Air
dp Particle Size
hg Enthalpy of Saturated H2O Vapor
ho Settled Bed Depth
am& Air Flow Rate
coalm& Coal Flow Rate
DCm& Mass Flow Rate of Dry Coal
coalwetm & Mass Flow Rate of Wet Coal
)P Fan Pressure Rise
P Absolute Pressure
Pg Gross Electrical Power
Psat Vapor Pressure of H2O
Pss Station Service Power
Pnet Net Electrical Power
Q Rate of Heat Transfer
Qave Average Heat Flux to Bed
LOSSQ& Rate of Heat Loss to Surroundings
TUBESQ& Rate of Heat Transfer in Tube Bundle
t Time
T Temperature
Ta,in Air Inlet Temperature
92
Tb Bed Temperature
U Overall Heat Transfer Coefficient
uL Internal Energy of Coal Moisture
Uo Superficial Air Velocity
VBed Bed Volume
xi Mass Fraction of Coal with Particle Size dpi
Y Coal Moisture
+ coaldry kg OH kg
2
2OHkg
> X/L (see Figure 31)
φ Relative Humidity
Γ Coal Moisture
coaldry kg
2OHkg
Γ& Drying Rate
Γ
dtd
ω Specific Humidity of Air
Subscripts
1 Entering Dryer
2 Leaving Dryer
Abbreviations
APH Air Preheater
CA Combustion Air
FA Fluidizing Air
FB Fluidized Bed
FD Forced Draft
HCW Hot Circulating Cooling Water
ID Induced Draft
Types of Drying Systems Classified by Heat Source
CCW Condenser Cooling Water
CCW/FG A Combination of Condenser Cooling Water and Boiler Flue Gas