a numerical simulation of pulverized coal … model.pdfa numerical simulation of pulverized coal...
TRANSCRIPT

Combustion and Flame 159 (2012) 353–366
Contents lists available at ScienceDirect
Combustion and Flame
journal homepage: www.elsevier .com/locate /combustflame
A numerical simulation of pulverized coal combustion employinga tabulated-devolatilization-process model (TDP model)
Nozomu Hashimoto a,⇑, Ryoichi Kurose b, Seung-Min Hwang c, Hirofumi Tsuji a, Hiromi Shirai a
a Central Research Institute of Electric Power Industry (CRIEPI), 2-6-1 Nagasaka, Yokosuka 240-0196, Japanb Department of Mechanical Engineering and Science, Kyoto University, Kyoto 606-8501, Japanc Graduate School of Venture, Department of Health Environment, Hoseo University, 1463-10 Seocho 3dong, Seochogu, Seoul 137-867, Republic of Korea
a r t i c l e i n f o a b s t r a c t
Article history:Received 14 February 2011Received in revised form 30 May 2011Accepted 30 May 2011Available online 21 June 2011
Keywords:Coal combustionNumerical simulationTDP modelDevolatilizationParticle heating rate
0010-2180/$ - see front matter � 2011 The Combustdoi:10.1016/j.combustflame.2011.05.024
⇑ Corresponding author. Address: Energy EnginResearch Institute of Electric Power Industry (CRIEPI240-0196, Japan. Fax: +81 46 856 3346.
E-mail address: [email protected] (N. H
A new coal devolatilization model employing a tabulated-devolatilization-process model (TDP model) isdeveloped, and its validity is investigated by performing a numerical simulation of a pulverized coal com-bustion field formed by an industrial low-NOx burner in a 100 kg-coal/h test furnace. The predicted char-acteristics of the pulverized coal combustion field obtained from the simulation employing the TDPmodel are compared with those employing the conventional devolatilization model, those employingthe two competing reaction rate model, and the experiments. The results show that drastic differencesin the gas flow patterns and coal particle behavior appear between simulations. In particular, the recir-culation flow behavior is strongly affected by the difference in the coal devolatilization model becauseof the difference in the volatile matter evolution rate. The TDP model captures the observed behaviorof the coal particles in the experiment better than the other models. Although it is considered that byadjusting the devolatilization parameters the prediction similar to the TDP model is also possible bythe other models, appropriate devolatilization parameters are automatically set to particles dependingon the particle heating rate without trial–error method by employing the TDP model.
� 2011 The Combustion Institute. Published by Elsevier Inc. All rights reserved.
1. Introduction
Pulverized coal combustion is utilized in the majority ofcoal-fired thermal power plants. There are many types of problemsin the operation of pulverized-coal-fired furnaces, e.g., fouling,slagging and sulfidation corrosion. The number of problems isexpected to increase in the future owing to the increased use oflow-grade coal, since world coal consumption will maintain an up-ward trend according to IEO2007 [2]. To solve such problems,understanding of the gas flow pattern, temperature distribution,gas species concentration distributions and coal particle behaviorin the furnace is essential. In particular, the coal particle behaviorin the burner region is important for the slagging and sulfidationcorrosion problems because the accumulation of ash is directlyaffected by the particle behavior, and the local concentrations ofcorrosion-promoting substances such as H2S are highly dependenton the coal particle behavior. Numerical simulations of a pulver-ized coal combustion field are effective for understanding such coalparticle behavior in the furnace [3–7].
ion Institute. Published by Elsevier
eering Laboratory, Central), 2-6-1 Nagasaka, Yokosuka
ashimoto).
Recently, numerical simulations for large-scale pulverized-coal-fired furnaces have been performed by some researchers[8–16]. Since the numerical simulation of the pulverized coalcombustion field is difficult because of the complexity of the coalcombustion phenomena, comparatively simplified models for thedevolatilization and combustion of coal particles are generallyemployed. However, sometimes employing such simplified modelsleads to relatively large errors in predicting the coal particle behav-ior in numerical simulations. One of the greatest simplifications ofmodels employed for the numerical simulation of the pulverizedcoal combustion field is the devolatilization model.
It is well known that the devolatilization of coal particles isstrongly affected by the coal particle heating rate [17,18]. Boththe volatile matter evolution rate and the total amount of volatilematter evolved from a coal particle are generally enhanced by ahigh particle heating rate [19]. This fact has been reported by var-ious researchers conducting experiments on the devolatilization ofcoal particles with more than one particle heating rate [20–24].Nevertheless, most numerical simulations of the pulverized coalcombustion field in large-scale furnaces employ a simplified modelfor the devolatilization of coal particles, in which the effect of thecoal particle heating rate described above cannot be considered.In the simplified model (referred to as ‘‘the conventional model’’,hereafter), the increase in the amount of volatile matter due to
Inc. All rights reserved.
Nomenclature
Ac pre-exponential factor for Eq. (3.15), 1/sAg pre-exponential factor for Eq. (3.12), 1/sAp projected area of particle, m2
As surface area of particle, m2
Av pre-exponential factor for the volatile matter evolutionrate equation, Eq. (2.2), 1/s
cp,p specific heat of particle, J/(kg K)cp,g specific heat of gas, J/(kg K)C char mass, kgDp particle diameter, mEc activation energy for Eq. (3.15), J/kmolEg activation energy for Eq. (3.12), J/kmolEv activation energy for the volatile matter evolution rate
equation, Eq. (2.2), J/kmolGCV calorific value of coal obtained by proximate analysis, J/
kg-coalhX enthalpy of chemical species X, J/kgkg thermal conductivity of gas, W/(m K)Kv devolatilization rate coefficient, 1/sKi reaction rate coefficientmp particle mass, kgmp,w moisture mass in particle, kgmp,v volatile matter mass in particle, kgmvola mass fraction of volatile matter in particle, kg/kg-coalmX mass fraction of chemical species X or chemical element
X in a coal particle, kg/kg-coalMX molecular weight, kg/kmolPg gas phase pressure, PaPX mass fraction of substance X obtained by proximate
analysis (as-received basis), kg/kg-coalPr Prandtl number
Q Q-factorqchar heat gain due to the char combustion, J/sR gas constant, J/(mol K)Rg gaseous reaction rate regarding the kinetics, mol/(s m3)Tg gas temperature, KTp particle temperature, Kufi fluid velocity component for direction i, m/supi particle velocity component for direction i, m/sUX mass fraction of chemical element X obtained by ulti-
mate analysis (dry-ash-free basis), kg/kg-coalUz mean axial particle velocity [m/s]V mass of volatile matter that has been evolved from a
coal particle, kgV� mass of volatile matter in particle, kgXi molar fraction of chemical species i, mol/molYi mass fraction of chemical species i, kg/kg[X] molar concentration of chemical species X, mol/m3
Greek symbolsep absorptivity of coal particlesqg density of gas, kg/m3
qp density of particle, kg/m3
m kinematic viscosity of gas, m2/sr Stefan–Boltzmann constantDhchar calorific value of char, J/kgDhdev required heat for devolatilization, 6.279 � 105 J/kg [1]Dhlat latent heat of water, 2.254 � 106 J/kgDhvola calorific value of volatile matter, J/kgDhCH4low calorific value of CH4low, J/kgDhCH4high calorific value of CH4high, J/kgDhC2H2 calorific value of C2H2, J/kg
354 N. Hashimoto et al. / Combustion and Flame 159 (2012) 353–366
the high particle heating rate is considered by using Q-factor as fol-lowing formula.
V� ¼ QV�0 ð1:1Þ
where V�, V�0 and Q are the amount of volatile matter evolved from acoal particle in the numerical simulation, the amount of volatilematter obtained by the proximate analysis, and the Q-factor,respectively. The Q-factor is generally treated as a constant valuefor all coal particles regardless of the particle heating rate. In addi-tion, the value of the Q-factor is based on empirical information ob-tained from different combustion fields, because an accurate valuefor the Q-factor cannot easily be obtained owing to the difficultyof estimating coal particle heating rate in the combustion field ofinterest before the execution of the numerical simulation.
Alternative model utilizing two competing mechanism was sug-gested by Kobayashi et al. [25] (two competing reaction rate mod-el). In this model, the effect of coal particle heating rate ondevolatilization of coal particle can be taken into account by con-sidering the two competing overall reactions. However, it is diffi-cult to obtain appropriate values for six parameters used in themodel in advance of the simulation. Du and Chen [26] conductednumerical simulations of a coal combustion field using differentsets of values for these parameters and found that these parame-ters strongly affect the simulation results. A trial-and-error methodis required to obtain appropriate parameters for these parametersand it may take a lot of time and effort.
In this study, a new model for the devolatilization of coalparticles referred to as the tabulated-devolatilization-processmodel (TDP model), in which appropriate values of the devolatil-ization parameters are selected for each coal particle from the
devolatilization database depending on the individual particleheating rate, is proposed. In addition, the validity of the TDP modelis examined by performing numerical simulations employing theTDP model, the conventional model, and the two competingreaction rate model for a combustion field in a 100 kg-coal/h testfurnace equipped with the CI-a burner, which is a low-NOx burnerwith the flame-stabilizing mechanism using a strong swirling flow.The predicted coal particle velocity in the test furnace is comparedwith the measurements using Laser Doppler velocimetry (LDV).
2. Modeling of the devolatilization of coal particles
2.1. Conventional model
In the numerical simulation of the pulverized coal combustionfield, the following formula that was proposed by Badzioch andHawksley [19] is commonly employed for modeling the devolatil-ization process:dVdt¼ KvðV� � VÞ ð2:1Þ
Kv ¼ Av exp � Ev
RTp
� �: ð2:2Þ
Here, V� is expressed asV� ¼ QV�0; ð2:3Þ
where V�0 and Q are, respectively, the amount of volatile matterobtained by proximate analysis and the Q-factor, which is employedto consider the increase in the amount of volatile matter caused bythe higher particle heating rate in a pulverized coal combustionfield. In the conventional model for coal combustion, Av, Ev and Q

Table 1Coal properties for devolatilization simulation.
Coal Newlands Wambo Plateau Adaro
Proximate analysis (wt.%)Moisturea 2.5 3.5 5.9 21.9Volatile matterb 28.4 35.7 41.3 54.7Fixed carbonb 56.4 54.6 48.8 44.0Ashb 15.2 9.7 9.9 1.3Fuel ratio (–) 1.97 1.53 1.18 0.80
Ultimate analysisb (wt.%)C 71.8 74.2 71.9 72.5H 4.5 5.6 5.5 6.2N 1.6 1.8 1.3 0.9O 6.4 8.3 11.1 19.1Combustible sulfur 0.5 0.4 0.4 0.1Heating value (low)b (MJ/kg) 28.2 29.6 28.8 29.6
a As received basis.b Dry basis.
103 104 105 1061
1.2
1.4
1.6
1.8
2
Coal particle heating rate [K/s]
V* /V
* '
: Newlands Fuel ratio: 2.0: Wambo Fuel ratio: 1.53: Plateau Fuel ratio: 1.18: Adaro Fuel ratio: 0.83
Fig. 1. V�/V�0 (Appropriate value for Q-factor) as a function of the coal particleheating rate calculated by the FLASHCHAIN model.
N. Hashimoto et al. / Combustion and Flame 159 (2012) 353–366 355
are constant values for all coal particles regardless of the particleheating rate. However, the value of V� strongly depends on the coalparticle heating rate. Therefore, suitable values for Av, Ev and Q varyconsiderably and depend on each particle diameter and how eachparticle is supplied to the coal combustion field. Such variation can-not be considered in the conventional model. In the next section,how suitable values for devolatilization parameters (Av, Ev and Q)depend on the particle heating rate is examined.
In spite of many efforts by various researchers, the detailedchemical compounds in volatile matter are not completely under-stood because of the complexity of the chemical structure of coal.Therefore, the volatile matter is generally treated as a postulatedsubstance in the numerical simulation of the coal combustion field.In the conventional model, the volatile matter is treated as the pos-tulated substance, CaHbOc, in which a, b and c represent the compo-sition ratio of each chemical element. These composition ratios arecalculated by the following equations.
a ¼ mC
12
� �=
mC
12þmH
1þmO
16
� �ð2:4Þ
b ¼ mH
1
� �=
mC
12þmH
1þmO
16
� �ð2:5Þ
c ¼ mO
16
� �=
mC
12þmH
1þmO
16
� �ð2:6Þ
mC ¼ 1� ðUO þ UHÞ=Pvola � Q
Pvola þ PfixC
� �ð2:7Þ
mH ¼ UH=Pvola � Q
Pvola þ PfixC
� �ð2:8Þ
mO ¼ UO=Pvola � Q
Pvola þ PfixC
� �ð2:9Þ
The overall reaction of CaHbOc is expressed as
CaHbOc þ aO2 ! bCO2 þ cH2O; ð2:10Þ
where a, b and c can be calculated from the values of a, b and c. Aspreviously mentioned, the detailed chemical species in the volatilematter are not completely understood. However, the overall calo-rific value of the coal, which is the sum of the calorific values ofthe volatile matter and the char, can be known by proximate anal-ysis. The overall calorific value in the numerical simulation shouldcorrespond to the calorific value of the coal obtained from proxi-mate analysis because the overall calorific value is constant, regard-less of the pathway taken to achieve the products, as stated by thewell-known Hess’s law. The calorific value of CaHbOc is calculatedby the following equation.
Dhvola ¼GCV � DhcharmC;char þ DhlatPmoist
mvolaþ Dhdev ð2:11Þ
Dhchar ¼ hC þMO2
MChO2 �
MCO2
MChCO2 ð2:12Þ
Here, the calorific value of the char, Dhchar, is regarded to be equalto that of the fixed carbon. Using these equations, the overall calo-rific value of a coal particle (MJ/kg-coal) in the numerical simulationcan be conformed to the calorific value of coal obtained from prox-imate analysis.
2.2. Effects of coal particle heating rate on devolatilizationcharacteristics
To investigate the effects of the coal particle heating rate on Av,Ev and V�/V�0, the devolatilization simulations were performed forsome coal rank. Properties of coals for the devolatilization simula-tions are listed in Table 1. In Table 1, the fuel ratio is defined as thevolatile matter mass fraction divided by the fixed carbon massfraction. A number of devolatilization models have been developedby various researchers, such as the CPD model [28,29], FG-DVC
model [30] and FLASHCHAIN model [31–38]. In this study, theFLASHCHAIN model and the CPD model, which can predict the de-tailed devolatilization process of coal particles, are used for thedevolatilization simulations. For the FLASHCHAIN model, only thedata from proximate analysis and ultimate analysis are required,while four of the parameters from 13C NMR measurement, whichare Mcl (the average molecular weight per aromatic cluster), Md
(the average side-chain molecular weight), r + 1 (the averagenumber of attachments per cluster), and p0 (the fraction of intactbridges), in addition to the data from ultimate analysis are requiredfor the CPD model. Since the data from 13C NMR measurementwere not available, these four parameters for the CPD model wereestimated by the correlation proposed by Genetti et al. [39].
Figures 1 and 2 show V�/V�0, which is appropriate value for theQ-factor, as a function of coal particle heating rate for different coalrank. For the CPD model, the result for Adaro coal could not be ob-tained because of the divergence in the simulation. This is consid-ered to be caused by that the properties of Adaro was out of rangefor the correlation. It is shown that V�/V�0 increases with increasingcoal particle heating rate for all coal rank in both Figs. 1 and 2. It isfound that the variation of V�/V�0 with the coal particle heating rateis large. In Fig. 1 (predicted by the FLASHCHAIN model), for in-stance, when the coal particle heating rate increases from3 � 103 to 2 � 105 K/s, V�/V�0 increases from 1.4 to 1.7 for New-lands, a change of more than 20%. In the same way, V�/V�0 increasesfrom 1.42 to 1.54, which is more than 8%, with the increase of theheating rate from 103 to 106 K/s for Newlands, in Fig. 2 (predictedby the CPD model).
Figures 3 and 4 show the effect of the coal particle heating rateon the devolatilization rate coefficient, Kv, for Newlands coalpredicted by the FLASHCHAIN model and the CPD model in an

356 N. Hashimoto et al. / Combustion and Flame 159 (2012) 353–366
Arrhenius diagrams. It is found that Kv increases with the increaseof heating rate for both the FLASHCHAIN model and the CPD mod-el. In Fig. 3 (predicted by the FLASHCHAIN model), for example, Kv
increases by approximately two orders of magnitude when the coalparticle heating rate increases from 3 � 103 to 2 � 105 K/s. In thesame manner, Kv increases over two orders of magnitude whenthe coal particle heating rate increases from 103 to 106 K/s, inFig. 4 (predicted by the CPD model). Although there are somediscrepancies between absolute values predicted by the FLASH-CHAIN model and that predicted by the CPD model, the tendenciesthat the Kv increases with the heating rate monotonically areconsistent.
103 104 105 1061
1.2
1.4
1.6
1.8
Coal particle heating rate [K/s]
V* /V
* '
: Newlands Fuel ratio: 2.0: Wambo Fuel ratio: 1.53: Plateau Fuel ratio: 1.18
Fig. 2. V�/V�0 (Appropriate value for Q-factor) as a function of the coal particleheating rate calculated by the CPD model.
0.6 0.8 1 1.2 1.4 1.6100
101
102
103
104
105
106
1000/T[K]
Kv [
1/s]
Heating rate: 200,000 K/sHeating rate: 20,000 K/sHeating rate: 3,000 K/s
Fig. 3. Effect of the coal particle heating rate on Kv (in Eq. (2.1)) for Newlands coalcalculated by the FLASHCHAIN model.
0.6 0.8 1 1.2 1.4 1.610
-4
10-3
10-2
10-1
100
101
102
1000/T[K]
Kv [
1/s]
: Heating rate = 106 K/s: Heating rate = 105 K/s: Heating rate = 104 K/s: Heating rate = 103 K/s
Fig. 4. Effect of the coal particle heating rate on Kv (in Eq. (2.1)) for Newlands coalcalculated by the CPD model.
Despite the fact that there are large variations of appropriatevalues for the devolatilization parameters depending on the coalparticle heating rate, the devolatilization parameters are identicalfor all coal particles in the conventional model. Such a treatmentcan cause relatively large errors in the predicted amount of the vol-atile matter evolved from coal particles in a numerical simulation.These errors can cause errors in the prediction of gas flows andparticle behavior. To minimize such errors, a new model for thedevolatilization is developed in this study.
2.3. Two competing rate reaction model
To take into account the effects of heating rate on devolatiliza-tion parameters, the model utilizing two competing mechanismwas suggested by Kobayashi et al. [25] (two competing reactionrate model). In this model, two competing overall reactions areconsidered as follows.
ð2:13Þ
The volatile evolution rate is expressed by following equations.
VðtÞð1� Pmoist � PashÞmp
¼Z t
0ða1R1 þ a2R2Þ exp �
Z t
0ðR1 þ R2Þdt
� �dt
ð2:14Þ
R1 ¼ A1 exp � E1
RTp
� �ð2:15Þ
R2 ¼ A2 exp � E2
RTp
� �ð2:16Þ
Here, a1 and a2 are mass stoichiometric coefficients, A1 and A2 arepre-exponential factors, E1 and E2 are activation energies for tworeactions. Using this model, the changes in the amount of volatilematter and devolatilization rate depending on particle heatingrate can be considered. However, it is difficult to obtain appropri-ate values for these six parameters in advance of the simulation.Du and Chen [26] conducted numerical simulations of a coal com-bustion field using different sets of values for these parametersand found that these parameters strongly affect the simulationresults. A trial-and-error method is required to obtain appropriateparameters for these parameters and it may take a lot of timeand effort.
2.4. Tabulated-devolatilization-process model (TDP model)
To consider the variation of Av, Ev and mvola for each coal parti-cle, a new model employing a tabulated-devolatilization-processmodel (TDP model) is developed in this study. Figure 5 showscalculation flow charts for the conventional model and TDP model.In the TDP model, a devolatilization database including varioustemperature histories and devolatilization parameters (Av, Ev andmvola) for each temperature history is prepared in advance of thecalculation. The devolatilization database can be constructed fromthe results of experiments using apparatus such as a drop tubefurnace as well as from the results of simulations using devolatil-ization models such as the CPD model [28,29], FG-DVC model[30] or FLASHCHAIN model [31–38]. In this study, PC Coal Lab[40], which can simulate the devolatilization process of a coal par-ticle based on the FLASHCHAIN model [31–38], was used to pro-duce the devolatilization database. The number of temperaturehistories in the database produced using PC Coal Lab is 81, with
Fig. 5. Calculation flow charts for the conventional model and TDP model.
N. Hashimoto et al. / Combustion and Flame 159 (2012) 353–366 357
particle heating rates of 1.7 � 103–5.9 � 107 K/s. In the conven-tional model, the devolatilization parameters are unchanged dur-ing the CFD calculation as shown in Fig. 5. In the TDP model, onthe other hand, appropriate values for the devolatilization param-eters are set for each coal particle at each iteration step. Theconcrete procedure is as follows:
1. First, the devolatilization parameters are set at initial values.2. The CFD calculation is performed using the devolatilization
parameters.3. After one iteration, the particle temperature history calculated
in the last iteration is compared with all temperature historiesin the devolatilization database for each coal particle (Fig. 6).The temperature history that is closest to the particle tempera-ture history obtained from the last CFD iteration is selectedfrom the devolatilization database.
4. The devolatilization parameters associated with the selectedtemperature history are set as the parameters for the nextCFD iteration.
Steps 2–4 are repeated until the convergence of the CFD calcu-lation result is achieved.
In the TDP model, mvola varies with the particle heating rate aspreviously explained. The variation of mvola means the variation ofthe chemical elements composition ratio and the calorific value of
Fig. 6. Schematic diagram of selection process (step t in Fig. 5).
the volatile matter. Therefore, a number of the volatile matters aspostulated chemical species must be defined if the volatile mattersare to be treated in the same manner as in the conventional model,i.e., treating the volatile matters as CaHbOc. In this case, a largecomputation time is required because a number of transport equa-tions for CaHbOc must be solved. In the TDP model, to avoid a largeincrease in the computation time, the volatile matters are treatedas postulated chemical species composed of CH4low, CH4high,C2H2, O2 and HCN, instead of CaHbOc as in the conventional model.CH4low and CH4high have same composition of chemical elementsbut their calorific values are different. By employing this treatmentof the volatile matter, the number of chemical species that must bedefined is not changed even if the number of values for mvola isincreased by the addition of data to the devolatilization database.The mass fractions of the chemical species are expressed by thefollowing equations.
mvola ¼ mCH4 þmC2H2 þmO2 þmHCN ð2:17Þ
mvola ¼ mC;vola þmH þmO þ ð1� jÞmN ð2:18Þ
mC;vola ¼1216
mCH4 þ2426
mC2H2 þ1227
mHCN ð2:19Þ
mC;char ¼ ð1� Pmoist � PashÞ � UC �mC;vola ð2:20Þ
mH ¼ ð1� Pmoist � PashÞ � UH
¼ 416
mCH4 þ2
26mC2H2 þ
127
mHCN ð2:21Þ
mO ¼ ð1� Pmoist � PashÞ � UO ¼ mO2 ð2:22Þ
mN ¼ ð1� Pmoist � PashÞ � UN ¼1
ð1� jÞ1427
mHCN ð2:23Þ
mC;char þmvola ¼ ð1� Pmoist � PashÞ ð2:24Þ
The mass fraction of each chemical species for an arbitrary value ofmvola can be obtained by solving the above simultaneous equations.
To conform the overall calorific value of a coal particle in thenumerical simulation to the calorific value obtained by proximateanalysis, the ratio of the mass fraction between CH4low and CH4high
is calculated by the following equations.

358 N. Hashimoto et al. / Combustion and Flame 159 (2012) 353–366
Dhvola ¼mCH4
mvolaðnDhCH4low þ ð1� nÞDhCH4highÞ þ
mC2H2
mvolaDhC2H2 ð2:25Þ
Dhvola ¼GCV � DhcharmC;char þ DhlatPmoist
mvolaþ Dhdev ð2:26Þ
Dhchar ¼ hC þMO2
MChO2 �
MCO2
MChCO2 ð2:27Þ
mCH4 ¼ nmCH4low þ ð1� nÞmCH4high ð2:28Þ
Using the Eqs. (2.25)–(2.28), the overall calorific value of a coal par-ticle (MJ/kg-coal) in the numerical simulation employing the TDPmodel can be conformed to the calorific value of the coal obtainedfrom proximate analysis, same as the conventional model.
3. Other models for numerical simulations of pulverized coalcombustion field
The simulation was performed using the STAR-CD code with theTDP model incorporated as a user subroutine. The mathematicalmodels and numerical methods other than the devolatilizationmodel employed here are as follows.
The gas-phase turbulence was represented by the renormaliza-tion group (RNG) k–e model [41,42], which is believed to give moreaccurate results for swirling and other highly strained flows thanthe generally used standard k–e model [43]. The gas-phase time-averaged continuity equation and conservation equations of themomentum, turbulent kinetic energy, dissipation, enthalpy andspecies are
@
@xiðqguiÞ ¼ 0 ð3:1Þ
@
@xiðqgui/Þ ¼
@
@xiC/
@/@xi
� �þ S/ þ Sp/; ð3:2Þ
where u denotes the generalized variables expressing fluid velocitycomponents ui, the turbulent kinetic energy k, the rate of eddy dis-sipation e, the fluid enthalpy h and the mass fractions of chemicalspecies Yi. Cu denotes the turbulent exchange coefficient, and Sf
and Spu represent the gas-phase source terms that are in additionto the convection and diffusion terms and the particle-phase sourceterms, respectively. The actual forms of these terms are provided inother papers [41–44]. The continuity and momentum equationswere solved using the PISO algorithm [45,46]. The nonlinear termsin the conservation equations were approximated by a first-orderupwind scheme, and a second-order central-difference schemewas employed for other derivatives.
The equation of motion for the representative coal particles isgiven by
mpdupi
dt¼ 1
2CdqpApjufj � upjjðufi � upiÞ ð3:3Þ
Cd ¼24ð1þ 0:15Re0:687
p ÞRep
ð3:4Þ
Rep ¼Dpjufi � upij
m; ð3:5Þ
The effect of the turbulence of the gas phase on particle motion wasmodeled by a stochastic method [47]. The particle temperature Tp
was calculated by considering the heat transfer due to convection,radiation, heat loss due to the evaporation of moisture and thedevolatilization reaction in coal particle, and heat gain due to charcombustion, using the following equation:
Table 2Parameters for Eq. (3.12).
Reactant Ag Eg (J/kmol)
CaHbOc, CH4low, CH4high, C2H2CO 3.09 � 108 1.67 � 108
1.26 � 1010 1.67 � 108
mpcp;pdTP
dt¼ �AshðTp � TgÞ þ AseprðH4
R � T4pÞ þ Dhlat
dmp;w
dt
þ Dhdevdmp;v
dtþ _qchar ð3:6Þ
h ¼kgZð2þ 0:6Re1=2
p Pr1=3ÞðeZ � 1ÞDp
ð3:7Þ
Z ¼ �cp;gðdmp=dtÞpDpkgð2þ 0:6Re1=2
p Pr1=3Þð3:8Þ
HR ¼ ðI=4rÞ1=4; ð3:9Þ
where the radiant intensity I [J/(m2 s)] was calculated by the dis-crete ordinates method [48], which simulates the radiative heattransfer among the gas, particles and wall. The absorptivities ofthe coal particles and wall are assumed to be 0.85 and 0.4, respec-tively. Also, the absorption coefficient of the gas was set at 0.075.The interaction of the conserved properties between the gas phaseand the coal particles was calculated by the particle-source-in cell(PSI-Cell) technique [49].
Gaseous combustion between the volatile matter and air wascalculated using a combined model of the kinetics and eddy dissi-pation models [50]. The chemical mechanism consists of two glo-bal reactions. In the conventional model, the reactions areexpressed by the following formulas.
CaHbOc þ O2 ! aCOþ bH2OCOþ O2 ! CO2
ð3:10Þ
In the TDP model, the reactions are expressed by the followingformulas:
CH4lowþ 1:5O2 ! COþ 2H2OCH4highþ 1:5O2 ! COþ 2H2OC2H2 þ 1:5O2 ! 2COþH2OCOþ O2 ! CO2
ð3:11Þ
Regarding the kinetics, the rate of reaction for the reactants is givenas an Arrhenius expression:
Rg ¼ AgTdg exp � Eg
RTg
� �½Reactant�f ½H2O�h½O2�k: ð3:12Þ
In this study, the rate parameters for 2-step global reaction of CH4
employed by Pember et al. [51] are used as the rate parametersfor all of reactions of volatile matter. The parameters in Eqs. (5.6)and (5.8) in Ref. [51] are used. The values of the parameters arelisted in Table 2.
The char burning rate was calculated using Field’s model [52]:
dCdt¼ � KcKd
Kc þ Kd
� �PgpD2
p ð3:13Þ
Kd ¼5:06� 10�7
Dp
Tp þ Tg
2
� �0:75
ð3:14Þ
Kc ¼ Ac exp � Ec
RTp
� �ð3:15Þ
This model is obtained under the assumption that the char burningrate is controlled by both the chemical reaction rate and the rate ofdiffusion of oxygen to the surface of the char particle. The values ofthe kinetic parameters Ac and Ec in Eq. (3.15) are 1.1 � 10�2 [(kg/m2 s)/(N/m2)] and 5.0 � 104 [J/mol], respectively [3].
d (–) f (–) h (–) k (–)
0.5 1 0 10 1 0.5 0.25

Table 3Coal properties for CFD simulation.
Coal Newlands
Proximate analysis (wt.%)Moisturea (3.4)Volatile matterb 29.19Fixed carbonb 54.76Ashb 16.05Fuel ratio (–) 1.88
Primary air+
Pulverized coal
Secondaryand tertiary
air
Burner
Exit ofthe furnace
Forced draft fan
Staged combustionairport
3.0m
Measurement portfor temperature andgas temperature
Fig. 7. Schematic of pulverized-coal-combustion test furnace.
N. Hashimoto et al. / Combustion and Flame 159 (2012) 353–366 359
4. Computational domain and conditions
The test furnace studied here is that at the Energy EngineeringResearch Laboratory of CRIEPI, in which an advanced low-NOx
burner (CI-a burner [4]) with a coal combustion capacity of about100 kg/h is installed (Fig. 7). The furnace is a water-cooled furnacemade of steel with refractory materials placed on the inside wall.The diameter and length of this furnace are 0.85 m and 8 m,respectively.
The configuration of the computational domain is shown inFig. 8. This was designed to faithfully match the actual configura-tion. The computational domain is half of the furnace, and a peri-odic condition is applied in the azimuthal direction. Combustionair was injected into the furnace through the burner and stagedcombustion air ports located 3.0 m from the burner outlet. Theair passing through the burner was divided into primary, second-ary and tertiary air. The primary air, which carries pulverized coal,had straight motion, and the secondary and tertiary air had strongswirling motion. The swirl vane angles for the secondary andtertiary air were set at 81� and 63�, respectively, which are theoptimum values for bituminous coal (these values are zero whenthe swirl force is zero).
The operating conditions of the furnace in the simulation weregiven to correspond with those in our experiment. The thermal in-
Fig. 8. Computational domain.
put of the coal combustion test furnace was 8.62 � 106 kJ/h (thecoal feed rate for each burner was approximately 100 kg/h). Theexcess air ratio was 1.24, and the O2 mole fraction at the furnaceoutlet was 4.0%. The staged combustion air ratio was set to 30%.The mass ratio of the pulverized coal (dry base) to the primaryair was 1:2.2, and the mass ratio of secondary air to tertiary airwas 1:6. The temperature of the primary air was set to 353 K,and that of the secondary and tertiary air was 598 K. Regardingthe boundary condition on the wall, the temperature outside thefurnace was assumed to be 308 K and thermal resistance was setto 0.04 (m2 s K)/J.
The test fuel is Newlands bituminous coal, the properties ofwhich are listed in Table 3. It was assumed that the pulverized coalparticles had diameters Dp of 5, 20, 40, 60, 80 and 100 lm. The
Ultimate analysisb (wt.%)C 71.70H 4.33N 1.43O 6.30Combustible sulfur 0.19Heating value (low)b (MJ/kg) 28.13
a As received basis.b Dry basis.
Table 4Initial diameter, mass fraction and number of representative coal particles.
Dp (lm) MFp (–) Np (–)
5 6.76 32020 26.81 128040 24.00 112060 16.25 80080 12.20 640
100 13.98 640
Table 5Parameters for the conventional model.
Case Ref. Av (1/s) Ev (J/kmol) Q (–)
2 Tominaga et al. [53] 2.02 � 103 3.11 � 107 1.23 Solomon and Hamblen [54] 4.5 � 1013 2.20 � 108 1.54 Johnson et al. [55] 1.0 � 1013 1.8 � 108 1.8
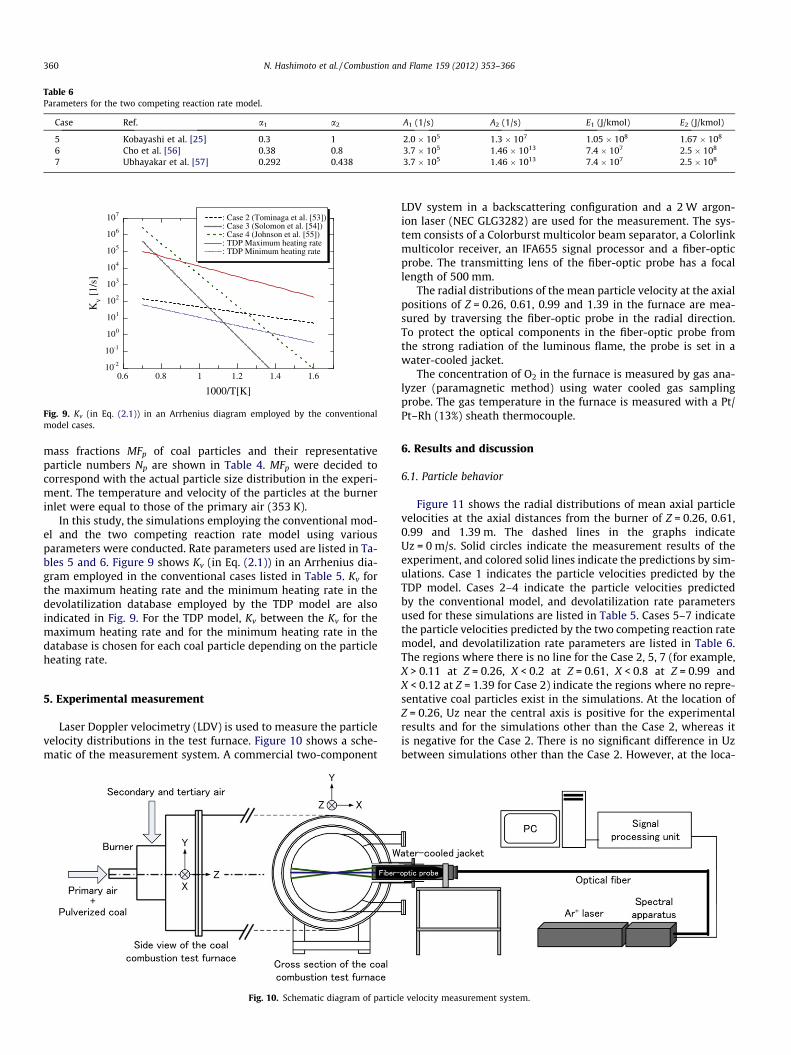
Table 6Parameters for the two competing reaction rate model.
Case Ref. a1 a2 A1 (1/s) A2 (1/s) E1 (J/kmol) E2 (J/kmol)
5 Kobayashi et al. [25] 0.3 1 2.0 � 105 1.3 � 107 1.05 � 108 1.67 � 108
6 Cho et al. [56] 0.38 0.8 3.7 � 105 1.46 � 1013 7.4 � 107 2.5 � 108
7 Ubhayakar et al. [57] 0.292 0.438 3.7 � 105 1.46 � 1013 7.4 � 107 2.5 � 108
0.6 0.8 1 1.2 1.4 1.610-2
10-1
100
101
102
103
104
105
106
107
1000/T[K]
Kv [
1/s]
: Case 2 (Tominaga et al. [53]): Case 3 (Solomon et al. [54]): Case 4 (Johnson et al. [55]): TDP Maximum heating rate: TDP Minimum heating rate
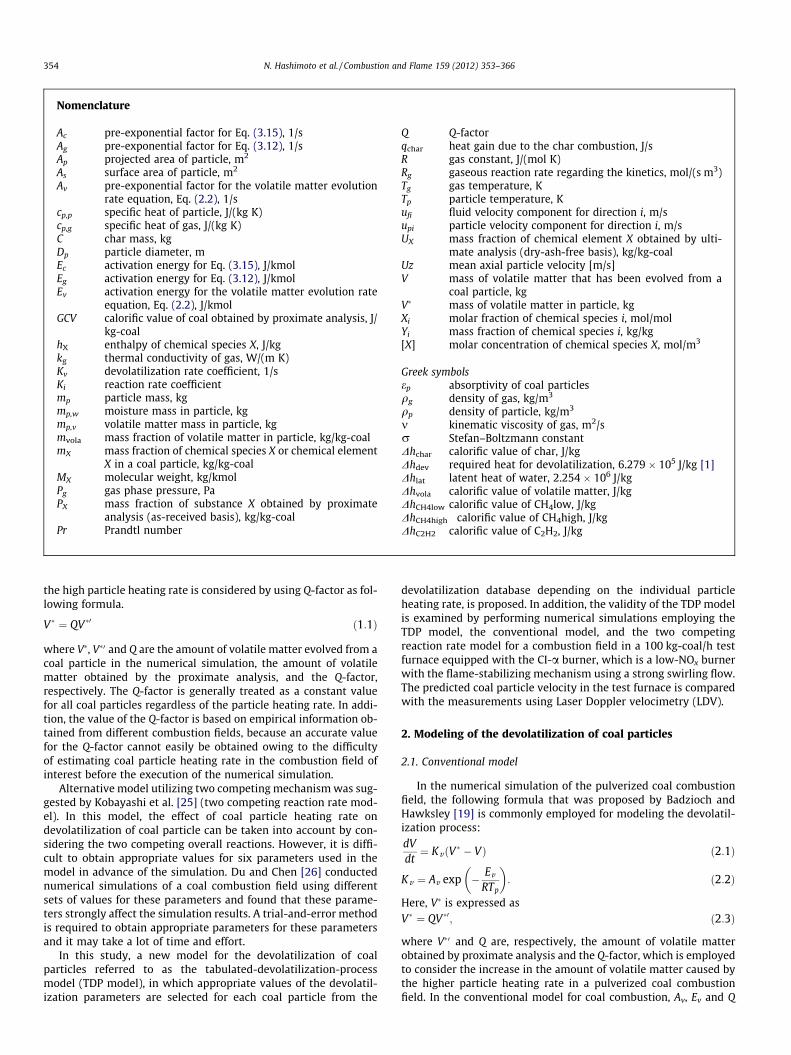
Fig. 9. Kv (in Eq. (2.1)) in an Arrhenius diagram employed by the conventionalmodel cases.
360 N. Hashimoto et al. / Combustion and Flame 159 (2012) 353–366
mass fractions MFp of coal particles and their representativeparticle numbers Np are shown in Table 4. MFp were decided tocorrespond with the actual particle size distribution in the experi-ment. The temperature and velocity of the particles at the burnerinlet were equal to those of the primary air (353 K).
In this study, the simulations employing the conventional mod-el and the two competing reaction rate model using variousparameters were conducted. Rate parameters used are listed in Ta-bles 5 and 6. Figure 9 shows Kv (in Eq. (2.1)) in an Arrhenius dia-gram employed in the conventional cases listed in Table 5. Kv forthe maximum heating rate and the minimum heating rate in thedevolatilization database employed by the TDP model are alsoindicated in Fig. 9. For the TDP model, Kv between the Kv for themaximum heating rate and for the minimum heating rate in thedatabase is chosen for each coal particle depending on the particleheating rate.
5. Experimental measurement
Laser Doppler velocimetry (LDV) is used to measure the particlevelocity distributions in the test furnace. Figure 10 shows a sche-matic of the measurement system. A commercial two-component
Fig. 10. Schematic diagram of particl
LDV system in a backscattering configuration and a 2 W argon-ion laser (NEC GLG3282) are used for the measurement. The sys-tem consists of a Colorburst multicolor beam separator, a Colorlinkmulticolor receiver, an IFA655 signal processor and a fiber-opticprobe. The transmitting lens of the fiber-optic probe has a focallength of 500 mm.
The radial distributions of the mean particle velocity at the axialpositions of Z = 0.26, 0.61, 0.99 and 1.39 in the furnace are mea-sured by traversing the fiber-optic probe in the radial direction.To protect the optical components in the fiber-optic probe fromthe strong radiation of the luminous flame, the probe is set in awater-cooled jacket.
The concentration of O2 in the furnace is measured by gas ana-lyzer (paramagnetic method) using water cooled gas samplingprobe. The gas temperature in the furnace is measured with a Pt/Pt–Rh (13%) sheath thermocouple.
6. Results and discussion
6.1. Particle behavior
Figure 11 shows the radial distributions of mean axial particlevelocities at the axial distances from the burner of Z = 0.26, 0.61,0.99 and 1.39 m. The dashed lines in the graphs indicateUz = 0 m/s. Solid circles indicate the measurement results of theexperiment, and colored solid lines indicate the predictions by sim-ulations. Case 1 indicates the particle velocities predicted by theTDP model. Cases 2–4 indicate the particle velocities predictedby the conventional model, and devolatilization rate parametersused for these simulations are listed in Table 5. Cases 5–7 indicatethe particle velocities predicted by the two competing reaction ratemodel, and devolatilization rate parameters are listed in Table 6.The regions where there is no line for the Case 2, 5, 7 (for example,X > 0.11 at Z = 0.26, X < 0.2 at Z = 0.61, X < 0.8 at Z = 0.99 andX < 0.12 at Z = 1.39 for Case 2) indicate the regions where no repre-sentative coal particles exist in the simulations. At the location ofZ = 0.26, Uz near the central axis is positive for the experimentalresults and for the simulations other than the Case 2, whereas itis negative for the Case 2. There is no significant difference in Uzbetween simulations other than the Case 2. However, at the loca-
e velocity measurement system.

0 0.1 0.2 0.3-10
0
10
20
Radial distance from central axis of the furnace, X [m]
Mea
n ax
ial p
artic
le v
eloc
ity, U
z [m
/s]
: Experiment (LDV): Case1 (TDP model): Case2: Case3: Case4: Case5: Case6: Case7
Z = 0.26 m
0 0.1 0.2 0.3-10
0
10
20
Radial distance from central axis of the furnace, X [m]
Mea
n ax
ial p
artic
le v
eloc
ity, U
z [m
/s] : Experiment (LDV)
: Case1 (TDP model): Case2: Case3: Case4: Case5: Case6: Case7
Z = 0.61 m
0 0.1 0.2 0.3
0
10
Radial distance from central axis of the furnace, X [m]
Mea
n ax
ial p
artic
le v
eloc
ity, U
z [m
/s]
: Experiment (LDV): Case1 (TDP model): Case2: Case3: Case4: Case5: Case6: Case7
Z = 0.99 m
0 0.1 0.2 0.3
0
2
4
6
Radial distance from central axis of the furnace, X [m]
Mea
n ax
ial p
artic
le v
eloc
ity, U
z [m
/s] : Experiment (LDV)
: Case1 (TDP model): Case2: Case3: Case4: Case5: Case6: Case7
Z = 1.39 m
Fig. 11. Radial distributions of mean axial particle velocities.
N. Hashimoto et al. / Combustion and Flame 159 (2012) 353–366 361
tion of Z = 0.61, 0.99 and 1.39 m, there are large difference in Uzbetween simulation results. At the location of Z = 0.61, Uz for sim-ulations other than Case 2 are positive value in the region ofX < 0.1, while that for Case 2 is negative value. The simulationsfor Case 1, 3, 4 and 6 overestimate the values of Uz. For the Cases5 and 7, the values of Uz around the central axis are in the samerange with LDV measurement results. However, at the location ofZ = 0.99 m, Uz around the central axis for the Cases 5 and 7 are al-most 0 m/s, while the LDV measurement results indicate that theflow around the central axis is positive. For the Case 2, Uz is nega-tive value in the region of X < 0.2. For the Cases 2 and 7, there is noparticle velocity data around the central axis because of the ab-sence of representative particle around the central axis. At thelocation of Z = 1.39 m, the values of Uz for the Case 1 (TDP model)are in better agreement with the LDV measurement results com-pared to that for other cases. The other cases underestimate thevalues of Uz around the central axis. In addition, there is no particlevelocity data around the central axis for the Cases 2, 5, and 7. Fromall of above results, it is considered that the particle behavior pre-dicted by the TDP model (Case 1) is in better agreement with theexperiment than that predicted by other cases in this research. Inwhat follows, detailed differences in gas velocity, particle volumefraction, volatile matter evolution rate, gas temperature and O2
mole fraction distributions in the furnace for characteristic cases,i.e., for Cases 1, 2 and 7 are discussed.
Figure 12 shows the gas velocity vectors on the cross section atthe center of the furnace for the Cases 2, 7, and 1. The colors of thevectors indicate the magnitude of the absolute velocity. It is ob-served that the gas flow patterns predicted by the Case 2 (a) andCase 1 (c) are considerably different. The gas flow velocity on thecentral axis of the furnace for the Case 1 is positive throughoutthe furnace, while there is a large region where the gas velocityon the central axis of the furnace is negative near the burner exit
for the Case 2. For the Case 7, the positive flow near the burner exitis stronger than that for Case 2. However, there is negative flow onthe central axis in the region around X = 1.0. These large differencesin the gas flow pattern cause the difference in the particle velocitydistributions shown in Fig. 11. For the Case 2, the coal particles,which are supplied from the center of the burner with the primaryair, cannot penetrate the strong reverse flow region around thecentral axis of the furnace. For the Case 1, on the other hand, mostof the particles advance straight with the positive flow around thecentral axis. This is the reason why the axial distributions of theparticle velocity are markedly different between the simulationsas observed in Fig. 11.
Figures 13 and 14 show the particle volume fraction on thecross section at the center of the furnace and the distributions ofthe coal particles, respectively. The colors of the particle inFig. 14 indicate the particle temperature. The difference in the par-ticle volume fraction is marked in Fig. 13. For the Case 2, almost noparticles exist around the central axis in the downstream region ofZ > 0.3, and a high particle volume fraction is observed near thefurnace wall. Most of the particles are blown to the region nearthe furnace sidewall due to the strong negative flow on the centralaxis as shown in Fig. 12a. Consequently, the particle volume frac-tion near the furnace sidewall is high, while that near the centralaxis is low in the downstream region of Z > 0.3. In the region nearthe burner exit (Z < 0.3), the particle volume fraction around thecentral axis is high and there is almost no particle with high tem-perature in this region as observed in Fig. 14a. For the Case 7, al-most no particles exist around the central axis in the downstream region of Z > 0.9 as shown in Fig. 13b. This is caused bythe fact most of the particles are blown to the region near the fur-nace sidewall due to the negative flow in the region around Z = 1.0as observed in Fig. 12b, same as Case 2. For the Case 1, on the otherhand, a high particle volume fraction is observed around the

Fig. 13. Distributions of particle volume fraction on the cross section at the centerof the furnace.
Fig. 12. Gas velocity vectors on the cross section at the center of the furnace.
362 N. Hashimoto et al. / Combustion and Flame 159 (2012) 353–366
central axis throughout the region in Fig. 13c. It should also benoted that there are some particles with high temperature in theregion near the burner exit as observed in Fig. 14c. This particlebehavior for the Case 1 is consistent with the photograph of theflame taken during the experiment.
Figure 15 shows the flame photograph obtained during theexperiment. A luminous flame with a columnar shape is observedin the region around the central axis of the furnace. The luminousflame begins from vicinity of the burner exit. In the region wherethe luminous flame is observed, it is considered that there mustbe high-temperature coal particles with sufficiently high particlevolume fraction to be observed as the luminous flame. As observedin Figures 13 and 14c, for the Case 1, the high-temperature parti-cles with a high particle volume fraction exist in the region aroundthe central axis where the luminous flame is observed in the exper-iment. For the Case 2, on the other hand, they exist only in the re-gion near the furnace sidewall where the luminous flame is notobserved in the experiment. For the Case 7, there is a region wherehigh-temperature coal particles are observed around the centralaxis. However, the region is short and high-temperature coal par-ticles are also observed near the furnace sidewall where the lumi-nous flame is not observed in the experiment.
Overall, it is apparent that the Case 1 captures the observedbehavior of the coal particles better than the other cases.
6.2. Devolatilization behavior
Figure 16 shows the distributions of the volatile matter evolu-tion rate on the cross section at the center of the furnace. The peak
value of the volatile matter evolution rate for the Case 1 is over twotimes larger than that for the Cases 2 and 7. This is caused by thefact that the coal particle heating rate in this study is relativelyhigh.
Figure 17 shows the probability of selection of each temper-ature history in the devolatilization database when particle tem-perature histories calculated in the CFD iteration are comparedwith temperature histories in the database (Fig. 6) for the TDPmodel. The horizontal axis indicates the particle heating rate ofeach temperature history in the devolatilization database. Theprobabilities of selection of the temperature histories werecalculated by averaging the number of selections during 1000iterations after the convergence of the CFD calculation wasachieved. It is found that the heating rates of most of the parti-cles are in the range of 104–106 K/s. In the TDP model, Av and Ev
giving a high devolatilization rate, and a high value of mvola forthe particle are set for the next iteration when a temperaturehistory with a high heating rate is selected from the devolatiliza-tion database. Consequently, the volatile matter evolution rate inthe region near the burner exit for the TDP model is higher thanthat for the conventional model, as can be observed in Fig. 16.The larger amount of volatile matter evolved from the coal par-ticles causes greater gas expansion due to the increase in the gasvolume and the combustion of volatile matter. In other words,the gas expansion due to the volatile matter evolution and itscombustion in the region near the burner exit for the TDP model

Fig. 14. Distributions of coal particles with particle temperature.
Fig. 15. Flame photograph obtained during the experiment.
Fig. 16. Distributions of volatile matter evolution rate on the cross section at thecenter of the furnace.
N. Hashimoto et al. / Combustion and Flame 159 (2012) 353–366 363
is greater than those for the conventional model. This is the rea-son why the gas flow patterns predicted by the TDP model and
other cases are markedly different in Fig. 12. Because of thelarge gas expansion owing to the high evolution rate of volatilematter, the penetrating force of the straight flow from the pri-mary air, which is supplied with the pulverized coal particlesfrom the center of the burner, is strong for the Case 1. Due tothe strong penetrating force, the straight flow from the primaryair can overcome the recirculation flow induced by the second-ary and tertiary air, which have strong swirling motion. Conse-quently, the gas flow velocity on the central axis of thefurnace for the TDP model is positive throughout the furnace.
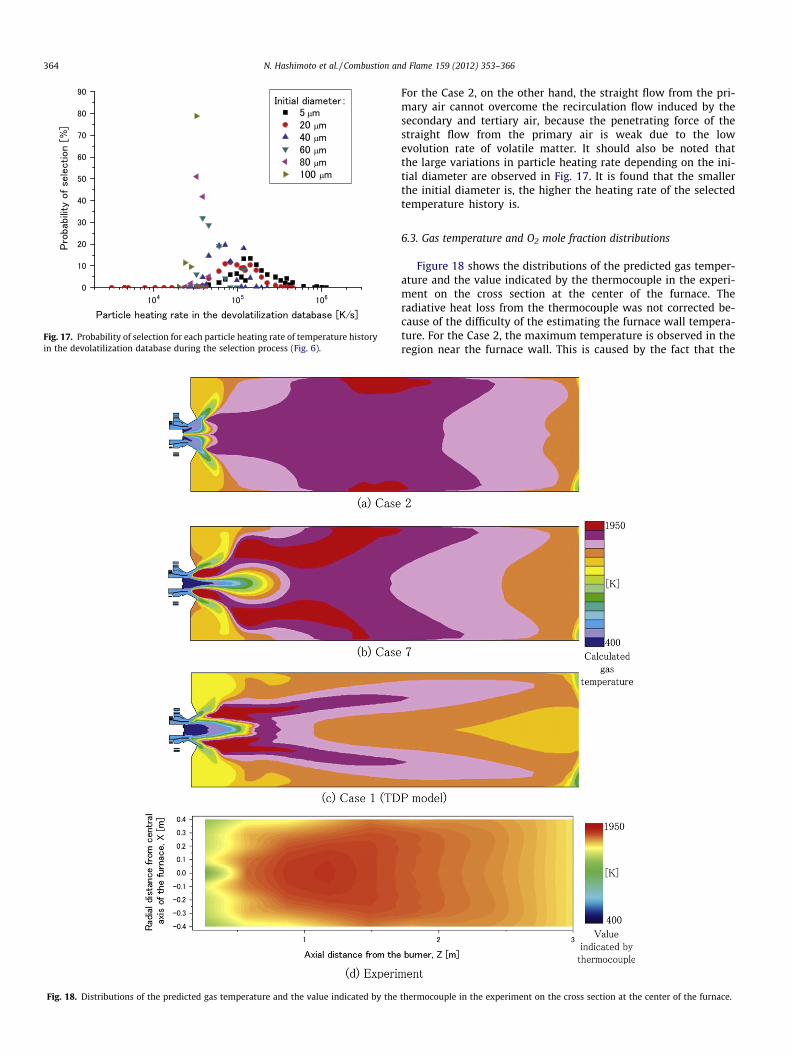
Fig. 18. Distributions of the predicted gas temperature and the value indicated by the
Fig. 17. Probability of selection for each particle heating rate of temperature historyin the devolatilization database during the selection process (Fig. 6).
364 N. Hashimoto et al. / Combustion and Flame 159 (2012) 353–366
For the Case 2, on the other hand, the straight flow from the pri-mary air cannot overcome the recirculation flow induced by thesecondary and tertiary air, because the penetrating force of thestraight flow from the primary air is weak due to the lowevolution rate of volatile matter. It should also be noted thatthe large variations in particle heating rate depending on the ini-tial diameter are observed in Fig. 17. It is found that the smallerthe initial diameter is, the higher the heating rate of the selectedtemperature history is.
6.3. Gas temperature and O2 mole fraction distributions
Figure 18 shows the distributions of the predicted gas temper-ature and the value indicated by the thermocouple in the experi-ment on the cross section at the center of the furnace. Theradiative heat loss from the thermocouple was not corrected be-cause of the difficulty of the estimating the furnace wall tempera-ture. For the Case 2, the maximum temperature is observed in theregion near the furnace wall. This is caused by the fact that the
thermocouple in the experiment on the cross section at the center of the furnace.
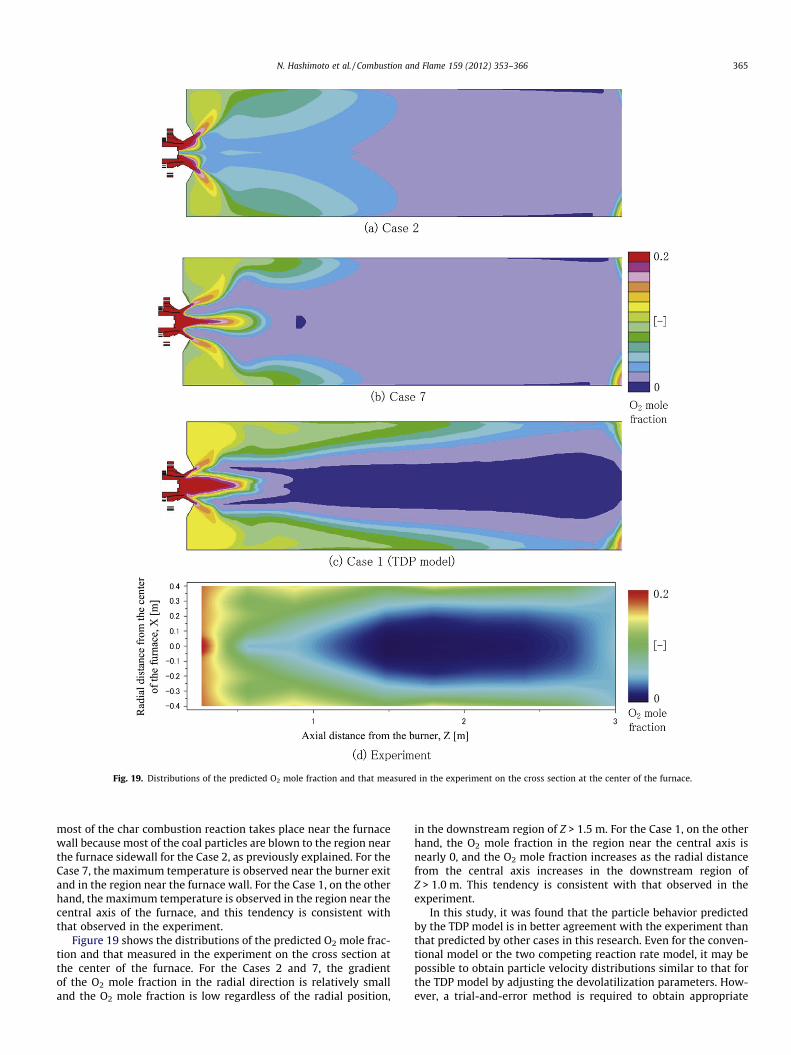
Fig. 19. Distributions of the predicted O2 mole fraction and that measured in the experiment on the cross section at the center of the furnace.
N. Hashimoto et al. / Combustion and Flame 159 (2012) 353–366 365
most of the char combustion reaction takes place near the furnacewall because most of the coal particles are blown to the region nearthe furnace sidewall for the Case 2, as previously explained. For theCase 7, the maximum temperature is observed near the burner exitand in the region near the furnace wall. For the Case 1, on the otherhand, the maximum temperature is observed in the region near thecentral axis of the furnace, and this tendency is consistent withthat observed in the experiment.
Figure 19 shows the distributions of the predicted O2 mole frac-tion and that measured in the experiment on the cross section atthe center of the furnace. For the Cases 2 and 7, the gradientof the O2 mole fraction in the radial direction is relatively smalland the O2 mole fraction is low regardless of the radial position,
in the downstream region of Z > 1.5 m. For the Case 1, on the otherhand, the O2 mole fraction in the region near the central axis isnearly 0, and the O2 mole fraction increases as the radial distancefrom the central axis increases in the downstream region ofZ > 1.0 m. This tendency is consistent with that observed in theexperiment.
In this study, it was found that the particle behavior predictedby the TDP model is in better agreement with the experiment thanthat predicted by other cases in this research. Even for the conven-tional model or the two competing reaction rate model, it may bepossible to obtain particle velocity distributions similar to that forthe TDP model by adjusting the devolatilization parameters. How-ever, a trial-and-error method is required to obtain appropriate

366 N. Hashimoto et al. / Combustion and Flame 159 (2012) 353–366
values for the devolatilization parameters because the coal particleheating rates, which depend strongly on the combustion field,cannot easily be known in advance. Furthermore, the influence ofvariations in coal particle heating rate as observed in Fig. 17 onthe devolatilization behavior cannot be taken into account by theconventional model. Even though the two competing reaction ratemodel can consider the effect of coal particle heating rate, it isfound that inappropriate devolatilization parameters might causethe large error in the particle behavior prediction.
Although the particle velocity distributions predicted by theTDP model was in better agreement with the experiment than thatpredicted by the other models, there are some discrepanciesbetween the TDP model and the experiment. For instance, inFig. 11, the discrepancies in the particle velocity distributionsbetween the simulation employing the TDP model and the exper-iment at Z = 0.26 and 0.61 m are relatively large, while the discrep-ancies at Z = 0.99 and 1.39 m are relatively small. This is consideredto be due to the low accuracy of the prediction of turbulent mixingfor the RNG k–e model. Watanabe et al. [58] performed a numericalsimulation of swirling cold-flows in the same test furnace as thatused in this study and found that the accuracy of the predictionof the characteristics of the recirculation flow by the k–e modelis lower than that obtained by the large-eddy simulation (LES).Therefore, the coupling of the TDP model with the LES is ourfuture work.
7. Conclusions
In this study, numerical simulations of a pulverized coal com-bustion field formed by an industrial low-NOx burner in a100 kg-coal/h test furnace were performed employing the TDPmodel, and its validity was examined. The predicted characteristicsof the pulverized coal combustion field are compared with thoseemploying the conventional model and the two competing reac-tion rate model.
It was found that the particle behavior predicted by the TDPmodel was in better agreement with the experiment than thatpredicted by the other models. The differences in the coal particlebehavior were caused by the difference in the gas flow patterns.The gas flow patterns predicted by the TDP model and the conven-tional model with the some rate parameters were markedlydifferent. This large difference was caused by the fact that thepenetrating force of the flow from the primary air port was strongfor the TDP model due to the strong gas expansion effect. The largegas expansion effect for the TDP model is caused by the highvolatile matter evolution rate from the coal particles with a highparticle-heating rate. Consequently, the straight flow from theprimary air port is dominant for the TDP model, while the largerecirculation flow induced by the swirling flow is dominant forthe conventional model. The inappropriate prediction of devolatil-ization behavior by the conventional model observed in this studyis attributed to the fact that the devolatilization parameters aregiven based on the empirical information obtained from differentcombustion fields, whereas those for the TDP model are selectedfor individual particle based on the information obtained fromthe combustion field of interest. Even though it is considered thatit is possible to obtain particle velocity distributions similar to thatfor the TDP model by adjusting the devolatilization parameters forthe conventional model or the two competing reaction rate model,a trial-and-error method is required to obtain appropriate valuesfor the devolatilization parameters. Furthermore, the variationsof devolatilization parameters depending on the coal particleheating rate cannot be considered in the conventional model. Byemploying the TDP model, appropriate devolatilization para-meters are automatically set to particles depending on the particleheating rate.
References
[1] M.M. Baum, P.J. Street, Combust. Sci. Technol. 3 (1971) 231–243.[2] International Energy Outlook 2007; Energy Information Administration,
Washington, DC, 2007, pp. 49–60.[3] N. Hashimoto, R. Kurose, H. Tsuji, H. Shirai, Energy Fuels 21 (2007) 1950–1958.[4] R. Kurose, H. Makino, A. Suzuki, Fuel 83 (2004) 693–703.[5] R. Kurose, M. Ikeda, H. Makino, Fuel 80 (2001) 1447–1455.[6] R. Kurose, H. Tsuji, H. Makino, Fuel 80 (2001) 1457–1465.[7] R. Kurose, H. Watanabe, H. Makino, KONA Powder Part. J. 27 (2009) 144–156.[8] T. Asotani, T. Yamashita, H. Tominaga, Y. Uesugi, Y. Itaya, S. Mori, Fuel 87
(2008) 482–490.[9] M. Kumar, S.G. Sahu, Energy Fuels 21 (2007) 3189–3193.
[10] R.I. Backreedy, L.M. Fletcher, L. Ma, M. Pourkashanian, A. Williams, Combust.Sci. Technol. 178 (2006) 763–787.
[11] L.X. Zhou, L. Li, R.X. Li, J. Zhang, Powder Technol. 125 (2002) 226–233.[12] J. Pallares, I. Arauzo, L.I. Diez, Fuel 84 (2005) 2364–2371.[13] R.I. Backreedy, J.M. Jones, L. Ma, M. Pourkashanian, A. Williams, A. Arenillas, B.
Arias, J.J. Pis, F. Rubiera, Fuel 84 (2005) 2196–2203.[14] A. Bosoaga, N. Panoiu, L. Mihaescu, R.I. Backreedy, L. Ma, M. Pourkashanian, A.
Williams, Fuel 85 (2006) 1591–1598.[15] C.M. Lee, K.A. Davis, M.P. Heap, E. Eddings, A. Sarofim, Proc. Combust. Inst. 28
(2000) 2375–2381.[16] J.R. Valentine, H.-S. Shim, K.A. Davis, S.-I. Seo, T.-H. Kim, Energy Fuels 21 (2007)
242–249.[17] R.H. Schlosberg, Chemistry of Coal Conversion, Plenum Press, New York, 1985.
pp. 131–138.[18] J.R. Gibbins, C.K. Man, K.J. Pendlebury, Combust. Sci. Technol. 93 (1993) 349–
361.[19] S. Badzioch, P.G.W. Hawksley, Ind. Eng. Chem. Process Des. Dev. 9 (1970) 521–
530.[20] M. Azhakesan, K.D. Bartle, P.L. Murdoch, J.M. Taylor, A. Williams, Fuel 70
(1991) 322–328.[21] H.-Y. Cai, A.J. Guell, I.N. Chatzakis, J.-Y. Lim, D.R. Dugwell, R. Kandiyoti, Fuel 75
(1996) 15–24.[22] A.J. Güell, H.-Y. Cai, D.R. Dugwell, R. Kandiyoti, Fuel Process. Technol. 36 (1993)
259–265.[23] C.-Z. Li, K.D. Bartle, R. Kandiyoti, Fuel 72 (1993) 3–11.[24] J. Yu, J.A. Lucas, T.F. Wall, Prog. Energy Combust. 33 (2007) 135–170.[25] H. Kobayashi, J.B. Howard, A.F. Sarofim, Proc. Combust. Inst. 16 (1977) 411–
425.[26] S.-W. Du, W.-H. Chen, Int. Commun. Heat Mass Transfer 33 (2006) 327–334.[28] T.H. Fletcher, A.R. Kerstein, R.J. Pugmire, D.M. Grant, Energy Fuels 4 (1990) 54–
60.[29] T.H. Fletcher, A.R. Kerstein, R.J. Pugmire, M.S. Solum, D.M. Grant, Energy Fuels 6
(1992) 414–431.[30] P.R. Solomon, M.A. Serio, E.M. Suuberg, Prog. Energy Combust. Sci. 18 (1992)
133–220.[31] S. Niksa, Combust. Flame 100 (1995) 384–394.[32] S. Niksa, A.R. Kerstein, Energy Fuels 5 (1991) 647–665.[33] S. Niksa, Energy Fuels 5 (1991) 665–673.[34] S. Niksa, Energy Fuels 5 (1991) 673–683.[35] S. Niksa, Energy Fuels 8 (1994) 659–670.[36] S. Niksa, Energy Fuels 8 (1994) 671–679.[37] S. Niksa, Energy Fuels 9 (1995) 467–478.[38] S. Niksa, Energy Fuels 10 (1996) 173–187.[39] D. Genetti, T.H. Fletcher, R.J. Pugmire, Energy Fuels 13 (1999) 60–68.[40] PC Coal Lab Version 3.2 User Gide and Tutorial, Niksa Energy Associates, 2004.[41] V. Yakhot, S.A. Orszag, J. Sci. Comput. 1 (1986) 3–51.[42] V. Yakhot, S.A. Orszag, S. Thangam, T.B. Gatski, C.G. Speziale, Phys. Fluids 4
(1992) 1510–1520.[43] B.E. Launder, D.B. Spalding, Comput. Methods Appl. Mech. Eng. 3 (1974) 269–
289.[44] A.M. Eaton, L.D. Smoot, S.C. Hill, C.N. Eatough, Prog. Energy Combust. 25 (1999)
387–436.[45] R.I. Issa, Comp. Phys. 62 (1986) 40–65.[46] R.I. Issa, A.D. Gosman, A.P. Watkins, J. Comput. Phys. 62 (1986) 66–82.[47] A.D. Gosman, E. Ioannides, AIAA paper 1981, No. 81-0323.[48] R. Siegel, J. Howell, Thermal Radiation Heat Transfer, fourth ed., Taylor &
Francis, New York, 2002. pp. 681–695.[49] C.T. Crowe, M.P. Sharma, D.E. Stock, Trans. ASME J. Fluids Eng. 99 (1977) 325–
332.[50] B.F. Magnussen, B.H. Hjertager, Proc. Combust. Inst. 16 (1976) 719–729.[51] R.B. Pember, L.H. Howell, J.B. Bell, P. Colella, W.Y. Crutchfield, W.A. Fiveland,
J.P. Jessee, Combust. Sci. Technol. 140 (1998) 123–168.[52] M.A. Field, Combust. Flame 13 (1969) 237–252.[53] H. Tominaga, M. Harada, T. Ando, Y. Suzuki, J. NIRE 6 (1997) 333–343. in
Japanese.[54] P.R. Solomon, D.G. Hamblen, Prog. Energy Combust. 9 (1983) 323–361.[55] G.R. Johnson, P. Murdoch, A. Williams, Fuel 67 (1988) 832–834.[56] C.P. Cho, S. Jo, H.Y. Kim, S.S. Yoon, Numer. Heat Transfer, Part A: Appl. 52
(2007) 1101–1122.[57] S.K. Ubhayakar, D.B. Stickler, C.W. von Rosenberg, R.E. Gannon, Proc. Combust.
Inst. 16 (1976) 427–436.[58] H. Watanabe, R. Kurose, S. Komori, J. Environ. Eng. 4 (2009) 1–11.