public journal of transportation - national center for transit
TRANSCRIPT


Volume 11, No. 3, 2008ISSN 1077-291X
The Journal of Public Transportation is published quarterly by
National Center for Transit ResearchCenter for Urban Transportation Research
University of South Florida • College of Engineering4202 East Fowler Avenue, CUT100
Tampa, Florida 33620-5375Phone: 813•974•3120
Fax: 813•974•5168Email: [email protected]
Website: www.nctr.usf.edu/jpt/journal.htm
© 2008 Center for Urban Transportation Research
PublicTransportation
Journal of

iii
Volume 11, No. 3, 2008ISSN 1077-291X
CONTENTS
Vehicle Trip Reduction Impacts of Transit-Oriented Housing��Robert Cervero, G. B. Arrington .......................................................................................................... 1
Estimating�� Energ��y Saving��s from Bus Improvement Options in Urban CorridorsMoazzem Hossain, Scott Kennedy ...................................................................................................19
Travel Demand Manag��ement: Lessons for MalaysiaJeyapalan Kasipillai, Pikkay Chan ...................................................................................................41 More Passeng��ers and Reduced Costs—The Optimization of the Berlin Public Transport Network Tom Reinhold, A. T. Kearney ...............................................................................................................57 Smart Growth and Transit-Oriented Development at the State Level: Lessons from California, New Jersey, and Western AustraliaJohn L. Renne ..............................................................................................................................................77
The Emerg��ing�� Field of Travel Training�� Services: A Systems Perspective Michael Wolf-Branigin, Karen Wolf-Branigin .......................................................................... 109

Vehicle Trip Reduction Impacts of Transit-Oriented Housing
�
Vehicle Trip Reduction Impacts of Transit-Oriented Housing
Robert Cervero, University of California, Berkeley G. B. Arrington, PB Placemaking
Abstract
A survey of 17 transit-oriented developments (TOD) in five U.S. metropolitan areas showed that vehicle trips per dwelling unit were substantially below what the Insti-tute of Transportation Engineer’s Trip Generation manual estimates. Over a typical weekday period, the surveyed TOD housing projects averaged 44 percent fewer vehi-cle trips than that estimated by the manual (3.754 versus 6.715). Vehicle trip rates of transit-oriented housing projects were particularly low in metropolitan Washington, D.C. and Portland, Oregon, both known for successful TOD planning at the regional and corridor levels. Trip rates also generally fell as neighborhood densities increased. Local officials should account for the lower automobile use of those residing in TOD housing through such measures as traffic impact-fee adjustments and reduced off-street parking requirements.
Introduction The widest knowledge gaps on the effects of transit-oriented development (TOD) on travel demand are in estimating vehicle trip generation rates. Many TOD pro-posals have been abruptly halted or redesigned at lower densities due to fears that dense development will flood surrounding streets with automobile traffic. Part of the problem lies in the inadequacy of current trip generation estimates, which are thought to overstate the traffic-inducing impacts of TOD. Institute of Transpor-tation Engineers (ITE) trip generation rates are the standard by which local traffic

Journal of Public Transportation, Vol. 11, No. 3, 2008
�
impacts are typically estimated and impact fees are set. Some analysts, however, have identified a serious “suburban bias” in the current ITE rates (Ewing et al. �996; Shoup �00�). Typically, the data used to set trip rates are drawn from suburban areas with free and plentiful parking, low-density, single land uses, and minimal transit services. Moreover, ITE’s auto trip reduction factors, used to reflect internal trip capture, are based on only a few mixed-use projects in Florida; there has been little or no observation of actual TODs. The end result is that the traffic impacts of TODs are often overstated. This can result in TOD developers paying higher impact fees, proffers, and exactions than they should. Smart growth requires smart calculations; thus, impact fees need to account for the likely (borrowing a term used in the United Kingdom) “trip de-generation” effects of TOD.
Empirical evidence on trip generation also can inform the setting of parking requirements near transit stations. Developers and financial institutions still prefer conventional parking ratios in TODs (Cervero et al. �004). Most TODs are thus parked oblivious to the fact that a rail stop is nearby and, as a result, their potential traffic-reducing benefits are muted. Structured parking, in particular, has a signifi-cant impact on development costs and is prohibitively expensive in many markets. Lower TOD parking ratios and reduced parking could reduce construction costs, leading to somewhat denser TODs in some settings.
Study FocusThis article summarizes the results of a recent Transit Cooperative Research Pro-gram (TCRP) study that examines vehicle trip generation rates for a representa-tive sample of �7 multi-family housing projects of varying sizes near rail transit stations in four parts of the country: Philadelphia/northeast New Jersey; Portland, Oregon; metropolitan Washington, D.C.; and the East Bay of the San Francisco Bay Area. Rail services in these areas are of a high quality and span across four urban rail technologies: commuter rail (Philadelphia SEPTA and NJ Transit); heavy rail (San Francisco BART and Washington Metrorail); light rail (Portland MAX); and streetcar (Portland).
The most current ITE Trip Generation manual (�003) includes data for nearly �,000 land uses and combinations; however, the focus of this research is on residential housing. The research aims to seed the ITE manual with original and reliable trip generation data for one important TOD land use—residen-tial housing—with the expectation that other TOD land uses and combina-

Vehicle Trip Reduction Impacts of Transit-Oriented Housing
3
tions will be added later. We also hope the research prompts local officials to challenge how they evaluate the likely traffic impacts of housing near major rail transit stations as well as the parking policies set for these projects. Lower levels of automobile travel among those living in transit-oriented housing is thought to come from three major sources: (�) residential self-selection, wherein for lifestyle reasons people consciously seek out housing near major transit stops for the very reason they want to regularly take transit to work and other desti-nations; studies in California suggest as much as 40 percent of the mode choice decision to commute via transit can be attributed to the self-selection phenom-enon (Cervero �007); (�) the presence of in-neighborhood retail sited between residences and stations that promote “rail-pedestrian” trip-chaining; an analysis of the American Housing Survey suggests that the presence of retail near rail sta-tions can boost transit’s commute mode share by as much as 4 percent (Cervero �996); and car-shedding (i.e., the tendency to reduce car-ownership when residing in efficient, transit-served locations) (Holtzclaw et al. �00�).
For studying traffic impacts of housing near rail stations, we selected mainly multi-family (rental) apartments and, in one instance, an owner-occupied condominium project. Table � provides background information on the selected TOD housing. Projects ranged in size from 90 units (Gresham Central Apartments in Portland) to 854 units (Park Regency in the East Bay city of Walnut Creek). Most projects were garden-style in design and 3-4 stories in height. The sampled Washington Metro-rail housing projects, however, tended to have much higher densities, with the exception of the four-story Avalon apartments near the Bethesda Metrorail sta-tion. The average number of parking spaces per project was around 400, yielding an average rate of �.�6 spaces per dwelling unit. Six of the surveyed housing proj-ects had ground-floor retail and/or commercial uses; however, all were primarily residential in nature (i.e., over 90% of gross floor area was for residential activities). One criterion in selecting projects to survey was that the project not be immedi-ately accessible to a freeway interchange. All of the sampled projects were more than 500 feet from a freeway entrance; five were situated within a quarter mile of a freeway on-ramp. The average walking distance from the project entrance to the nearest rail station entrance was �,060 feet.
Methods and AnalysesTo compile empirical data on vehicle trip rates for the �7 TOD housing projects, approval was first obtained from property owners and managers to allow the

Journal of Public Transportation, Vol. 11, No. 3, 2008
4
Tabl
e 1.
Bac
kgro
und
Info
rmat
ion
on T
OD
Hou
sing
Pro
ject
s

Vehicle Trip Reduction Impacts of Transit-Oriented Housing
5
installation of pneumatic-tube recorders at all curb cuts and driveways to sur-veyed projects. Local traffic engineering firms that specialize in vehicle trip data-collection were contracted to set up the tube counters and compile data. Two consecutive days in late May �007 were chosen to compile tube-count data that corresponded with peak conditions: middle of the week and prior to the summer vacation season.
The vehicle count data obtained in the field were converted to �4-hour as well as AM and PM peak-hour rates per dwelling unit for each project. The computed rates for TOD housing projects were compared to those found in the latest edition of the ITE manual for the equivalent land use (i.e., apartments and condomini-ums). Comparisons were drawn using the ITE manual’s “weighted averages” as well as estimates derived from best-fitting regression equations. Multivariate regres-sion equations also were estimated for predicting the trip generation rates of TOD housing as a function of explanatory variables. The article closes with discussions on the public-policy implications of the research findings.
Comparison of Vehicle Trip Generation RatesTOD housing clearly “de-generates” trips in the urbanized areas studied. Below, results for both �4-hour periods as well as peak periods are summarized.
Average Weekday Trip Rate ComparisonsTable � shows that, in all cases, �4-hour weekday vehicle trip rates were consider-ably below the ITE average rate for similar uses. Taking the unweighted average across the �7 case-study projects, TOD housing projects generated around 47 percent less vehicle traffic than that predicted by the ITE manual (3.55 trips per dwelling unit for TOD housing versus 6.67 trips per dwelling unit by ITE estimates). This held true using both the weighted average ITE rate and the ITE rates predicted using the best-fitting regression equations.
The largest vehicle trip reduction was found in the Washington, D.C. metropolitan area. Among the five mid- to high-rise apartment projects near Metrorail stations outside the District of Columbia, vehicle trip generation rates were more than 60 percent below that predicted by the ITE manual. There, �4-hour vehicle trip rates ranged from a high of 4.7� trip ends per dwelling unit at the more suburban Avalon project near the Grosvenor Metrorail Station (and outside the beltway) to a low of around one vehicle trip per weekday for every two dwelling units at the Meridian near Alexandria’s Braddock Station. The comparatively low vehicle trip

Journal of Public Transportation, Vol. 11, No. 3, 2008
6
generation rates for TOD housing near Washington Metrorail stations are consis-tent with recent findings showing high transit modal splits from a �005 survey of �8 residential sites (WMATA �006). For projects within ¼ mile of a Metrorail sta-tion (which matched the locations of all the five TOD housing projects we studied in the Washington metropolitan area), on average, 49 percent of residents used Metrorail for their commute or school trips. One of the projects we surveyed—the Avalon apartments at Grosvenor Station—also was surveyed in the �005 WMATA study. The Avalon, which had the highest trip generation rate among the five projects surveyed in the Washington area, had an impressively high work- and school-trip transit modal split in the �005 WMATA survey—54 percent—given its comparatively lower-density, car-oriented setting. High ridership levels and vehicle-trip suppression in metropolitan Washington are tied to the region’s suc-cess in creating a network of TODs, highlighted by the Rosslyn-Ballston corridor (Cervero et al. �004). Synergies clearly derive from having transit-oriented housing tied to transit-oriented employment and transit-oriented shopping along many Washington Metrorail corridors.
After the Washington area, TOD housing in the Portland area tended to have the lowest weekday trip generation rates—on average, around 40 percent below that predicted by the ITE manual. The range of experiences, however, varied, from a low of 0.88 weekday vehicle trips per dwelling unit for Collins Circle in downtown Portland to a high of 6.34 for more suburban Quantama Crossing (only slightly below the average rate from the ITE manual and a bit above the regression-gener-ated estimate from the ITE manual).
Among the surveyed Portland-area apartments, also notable for a low trip genera-tion rate are the Merrick Apartments near the MAX light rail Convention Center station in the Lloyd District, across the river from downtown Portland: �.0� week-day vehicle trips. Travel behavior of the residents of the Merrick Apartments also was studied in �005 (Dill �005). Based on a 43 percent response rate from �50 surveyed households at the Merrick Apartments, trip generation estimates can be imputed from that survey. The �005 survey asked: “In the past week (Saturday, January �9 through Friday, February 4), how many times did you go to the follow-ing place from your home in a vehicle, walking, bicycling, riding the bus, or riding MAX light rail? Each time you left your home during the week is a trip.” From household responses, an average of �.4� daily vehicle trips per dwelling from the Merrick Apartments was made. Doubling this rate (assuming those who drove away each day also returned) yields an estimated daily rate of �.84 vehicle trips

Vehicle Trip Reduction Impacts of Transit-Oriented Housing
7
Ta
ble
2. C
ompa
riso
n of
TO
D H
ousi
ng a
nd IT
E Ve
hicl
e Tr
ip G
ener
atio
n R
ates
: 24
Hou
r Es
tim
ates

Journal of Public Transportation, Vol. 11, No. 3, 2008
8
Ta
ble
2. C
ompa
riso
n of
TO
D H
ousi
ng a
nd IT
E Ve
hicl
e Tr
ip G
ener
atio
n R
ates
: 24
Hou
r Es
tim
ates
(con
t’d)
Vehicle Trip Reduction Impacts of Transit-Oriented Housing
9
per dwelling unit. This is bit higher than that found in our tube count survey but still substantially lower than the ITE rate. The �005 survey also estimated that �8 percent of all trips made by residents of the Merrick Apartments were by transit (both rail and bus). For work and school trips, transit’s estimated modal split was �3 percent.
Just as in the case of metropolitan Washington, Portland’s success at “de-generat-ing” vehicle trips around transit-oriented housing cannot be divorced from the regional context. High ridership and reduced car travel at the surveyed housing projects stems to a significant degree from the successful integration of urban development and rail investments along the Gresham-downtown-westside axis. In Portland, as in Washington, TODs are not isolated islands, but rather nodes along corridors of compact, mixed-use, walking friendly development—the so-called “necklace of pearls” urban form.
The San Francisco Bay Area also averaged vehicle trip generation rates substan-tially below those estimated by the ITE manual. Among the East Bay TOD housing projects studied, Montelena Homes (formerly called Archstone Barrington Hills) had the lowest weekday rate: �.46 vehicle trip ends per dwelling unit, 63 percent below ITE’s rate. A �003 survey of residents of this project found very high transit usage: 55 percent stated they commute by transit (both rail and bus) (Lund et al. �004). The �003 found the following commute-trip transit modal splits (com-pared to our recorded weekday trip rates): Wayside Commons—56 percent (3.�6 daily trips per dwelling unit); Verandas—54 percent (3.� daily trips per dwelling unit); Park Regency—37 percent (5.0� daily trips per dwelling unit); and Mission Wells—�3 percent (3.�� daily trips per dwelling unit).
Finally, the two apartment projects near suburban commuter rail stations outside of Philadelphia and the Newark metropolitan area of northeast New Jersey aver-aged weekday vehicle trip generation rates that were roughly one-quarter less than that predicted by the ITE manual. This is an appreciable difference, given the relatively low-density settings of these projects and the fact that commuter rail offers limited midday and late-night services.
Peak Period Trip Rate ComparisonsDifferences in vehicle trip generation rates during peak hours were quite similar to those found for the �4-hour period. In general, denser, more urban TOD housing had the greatest peak-hour trip rate differentials. For example, the PM trip rates

Journal of Public Transportation, Vol. 11, No. 3, 2008
�0
for Portland’s Collins Circle and Alexandria, Virginia’s Meridian projects were 84.3 percent and 9�.7 percent below ITE predictions, respectively.
Weighted Average ComparisonsThe results presented above were based on unweighted averages—i.e., each proj-ect was treated as a data point regardless of project size. The ITE manual, however, presents “weighted averages” of trip generation by summing all trip ends among cases and dividing by the sum of dwelling units. Thus, for “apple to apple” com-parisons, weighted average vehicle trip rates were computed for all �7 projects combined for weekday, AM peak, and PM peak. Figure � summarizes the results. Over a typical weekday period, the �7 surveyed TOD housing projects averaged 44 percent fewer vehicle trips than that estimated by the ITE manual (3.754 versus 6.7�5). The weighted average differentials were even larger during peak periods—49 percent lower rates during the AM peak and 48 percent lower rates during the PM peak. To the degree that impact fees are based on peak travel conditions, one can infer that traffic impacts studies might end up overstating the potential con-gestion-inducing effects of TOD housing in large rail-served metropolitan areas by as much as 50 percent.
Figure 1. Comparison of Weighted Average Vehicle Trip Rates:
TOD Housing and ITE Estimates

Vehicle Trip Reduction Impacts of Transit-Oriented Housing
��
ScatterplotsThe ITE Trip Generation manual reports summary findings in a scatterplot form accompanied by best-fitting regression equations. Figure � shows scatterplot results for the �7 surveyed TOD housing projects for the weekday period. Linear plots fit the data points reasonably well, explaining over two-thirds of the variation in vehicle trip ends. We note that the Merrick Apartments in Portland stands as an outlier, producing far fewer vehicle trip ends relative to its project size than the other TOD housing projects. Omitting this single case improved the regression fit considerably, increasing the R-square statistic to 0.8�9.
Figure 2. TOD Housing Weekday Vehicle Trip Ends
by Number of Dwelling Units
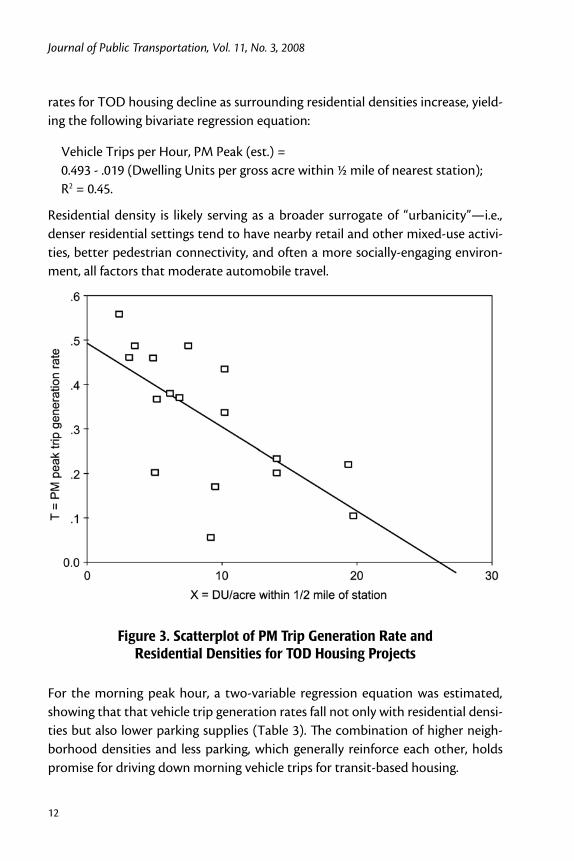
Factors Influencing TOD Housing Trip Generation RatesTrip generation rates among the �7 sampled TOD housing projects varied most strongly as a function of surrounding residential densities—i.e., the number of dwelling units per gross acre within a ½ mile radius of the rail station closest to the project, estimated from the �000 census. Figure 3 shows that PM trip generation

Journal of Public Transportation, Vol. 11, No. 3, 2008
��
rates for TOD housing decline as surrounding residential densities increase, yield-ing the following bivariate regression equation:
Vehicle Trips per Hour, PM Peak (est.) = 0.493 - .0�9 (Dwelling Units per gross acre within ½ mile of nearest station); R� = 0.45.
Residential density is likely serving as a broader surrogate of “urbanicity”—i.e., denser residential settings tend to have nearby retail and other mixed-use activi-ties, better pedestrian connectivity, and often a more socially-engaging environ-ment, all factors that moderate automobile travel.
Figure 3. Scatterplot of PM Trip Generation Rate and
Residential Densities for TOD Housing Projects
For the morning peak hour, a two-variable regression equation was estimated, showing that that vehicle trip generation rates fall not only with residential densi-ties but also lower parking supplies (Table 3). The combination of higher neigh-borhood densities and less parking, which generally reinforce each other, holds promise for driving down morning vehicle trips for transit-based housing.

Vehicle Trip Reduction Impacts of Transit-Oriented Housing
�3
A better fitting equation was produced for predicting PM peak trip rates as a proportion of ITE rates (Table 4). This model explained 63 percent of the varia-tion. The equation reveals that TOD housing projects closest to the CBD, in higher density residential settings, and in neighborhoods with smaller household sizes averaged the lowest PM trip rates.
Table 3. Best-Fitting Multiple Regression Equation for Predicting AM Peak Hour Trip Rates, TOD Housing Projects
Table 4. Multiple Regression Equation for Predicting PM Peak Trip Generation Rates as a Proportion of ITE Rate for TOD Housing Projects

Journal of Public Transportation, Vol. 11, No. 3, 2008
�4
Using the regression results from Table 4, estimated PM trip rates for the TOD projects were plotted as a proportion of the rates predicted by the ITE manual (Figure 4). Assuming an average household size of � persons, the predicted values as a function of distance to CBD (horizontal axis) and residential densities (within ½ mile of the nearest rail station, represented by the 5 lines) are shown in the figure. For example, the model predicts that, for a transit-oriented apartment �0 miles from the CBD in a neighborhood with �0 units per residential acre, the PM trip rate will be 55 percent of (or 45% below) the PM rate. If the same apartment in the same density setting were 5 miles from the CBD, the PM trip rate would be just 38 percent of the ITE rate. Another example: For two transit-oriented apart-ments �0 miles from the CBD, if the surrounding residential densities are �0 units per acre, the PM trip rate will be 45 percent of the ITE manual’s rate. And if the surrounding densities are �0 units per acre, they will be just �0 percent of the rate, or 80 percent lower.
Figure 4. Influences of Residential Densities and Distance to CBD on TOD Housing PM Trip Rates as a Proportion of ITE Rates
ConclusionClear policy directions fall out of this research. The appreciably lower trip genera-tion rates of transit-oriented housing projects call for adjustments in the measure-ment of traffic impacts. For peak periods (that often govern the design of roads

Vehicle Trip Reduction Impacts of Transit-Oriented Housing
�5
and highways), this research shows transit-oriented apartments average around one half the norm of vehicle trips per dwelling unit. The rates varied, however, from 70-90 percent lower for projects near downtown to �5-�5 percent lower for complexes in low-density suburbs. Regardless, smart growth needs smart calcu-lus—those who build projects that lower the need to make vehicle trips should be rewarded in the form of reduced traffic impact fees and exactions. The expectation is developers would pass on some of the cost savings to tenants, thus making hous-ing more affordable near rail stations.
The potential savings from a sliding-scale traffic impact fee could be substantial. In Sacramento, for example, the fee for multi-family housing with units in the range of �,�00 to �,500 square feet is $4,477 for an infill site to $�0,37� for a suburban setting. For a 700-unit infill site near one of Sacramento’s light rail station, the cost savings from a 50 percent reduction in trip generation estimates could sum to nearly $�.6 million.
To date, few jurisdictions have introduced sliding-scale fee structures to reflect the lowering of trip generation for TODs. Santa Clara County California’s Congestion Management Agency has produced guidelines calling for a 9 percent trip reduc-tion for housing within �,000 feet of a light-rail or commuter-rail station. While this is a positive step, according to our research findings, this adjustment is a bit tepid. Similarly, the URBEMIS software program sponsored by the California Air Resources Board, used to estimate the air quality impacts of new development, calls for up to a �5 percent lowering of trip rates for housing in settings with inten-sive transit services—again, likely on the low side, based on our findings. More in line with the findings presented here are the vehicle trip reductions granted to the White Flint Metro Center project, a mega-scale, mixed-use joint development project now being built at Washington Metrorail’s New Carrollton Station. With some �.� million square feet of office space, �50,000 square feet of commercial-retail, and 375 residential units scheduled at build out, the project was granted a 40 percent reduction in estimated trip rates for the housing component based on proximity to transit.
The trip-reducing benefits of TOD call for other development incentives, such as flexible parking codes, market-responsive zoning, streamlining the project review and permitting process, and investments in supportive public infrastructure. Evi-dence of trip de-generation also suggests TODs are strong markets for carsharing. Recent research in the San Francisco Bay Area reveals that those who participate in carsharing lower their car ownership levels by around �0 percent, with higher

Journal of Public Transportation, Vol. 11, No. 3, 2008
�6
vehicle-shedding rates among those living near rail stations (Cervero et al. �007). The combination of reducing off-street parking and increasing carsharing options would yield other benefits, including reducing the amount of impervious surface (and thus water run-off and heat island effects) and the creation of more walkable scales of development. Such practices are not heavy-handed planning interven-tions but rather market-oriented responses—namely, efforts to set design stan-dards and provide mobility options that are in keeping with the market prefer-ences of those who opt to live near rail transit stations.
References
Cervero, R. �996. Mixed land uses and commuting: Evidence from the American Housing Survey. Transportation Research A 30 (5): 36�-377.
Cervero, R. �007. Transit oriented development’s ridership bonus: A product of self selection and public policies. Environment and Planning A 39: �068-�085.
Cervero, R., G. Arrington, J. Smith-Heimer, R. Dunphy, and others. �004. Transit Oriented Development in America: Experiences, Challenges, and Prospects. Washington, D.C.: Transit Cooperative Research Program, Report �0�.
Cervero, R., A. Golub, and B. Nee. �007. City CarShare: Longer-term travel-demand and car ownership impacts. Transportation Research Record �99�: 70-80.
Dill, J. �005. Survey of Merrick TOD Residents: Final Report. Portland: Portland Metro.
Ewing, R., M. DeAnna, and S. Li. �996. Land use impacts on trip generation rates. Transportation Research Record �5�8: �-6.
Holtzclaw, J., R. Clear, H. Dittmar, D. Goldstein, and P. Haas. �00�. Location effi-ciency: Neighborhood and socio-economic characteristics determine auto ownership and use—studies in Chicago, Los Angeles, and San Francisco. Transportation Planning and Technology �5: �-�7.
Lund, H., R. Cervero, and R. Willson. �004. Travel Characteristics of Transit-Oriented Development in California. Oakland, California: CalTrans Transport Grant.
Institute of Transportation Engineers. �003. Trip Generation. Washington, D.C.: ITE.
Shoup, D. �00�. Roughly right or precisely wrong? Access, Spring, �0-�5.

Vehicle Trip Reduction Impacts of Transit-Oriented Housing
�7
Washington Metropolitan Area Transit Authority (WMATA). �006. 2005 Develop-ment-Related Ridership Survey: Final Report, Washington, D.C.: WMATA.
About the Authors
Robert Cervero ([email protected]) is Professor and Chair of the Department of City and Regional Planning at the University of California, Berkeley. He was chief author of TCRP Report �0�, Transit Oriented Development in America: Experiences, Challenges, and Prospects, and currently is conducting research and advising on transit-oriented development in China.
G.B. Arrington ([email protected]) is Principal Practice Leader for PB PlaceMaking in Portland, Oregon, having worked on numerous projects on integrat-ing transit and land use in the United States, China, Australia, New Zealand, Dubai, and the Caribbean. He is one of the founders of the Rail~Volution conference and an active member with the Congress for New Urbanism.

Journal of Public Transportation, Vol. 11, No. 3, 2008
�8

Estimating Energy Savings from Bus Improvement Options
�9
Estimating Energy Savings from Bus Improvement Options in
Urban CorridorsMoazzem Hossain, Department of Civil Engineering,
Bangladesh University of Engineering and Technology (BUET), Bangladesh Scott Kennedy, Masdar Institute of Science and Technology, UAE
Abstract
The potential to achieve significant energy savings in the road transport sector can be a powerful driver to promote bus transport, especially bus rapid transit (BRT) devel-opment. This research introduces a spreadsheet tool for making realistic estimates of energy savings due to increased use of buses, with an explicit inclusion of the effect of congestion on traffic flow and fuel consumption. Based on scenarios developed around projected growth in trip demand, changes in vehicle technology, lane expan-sion, and modal distribution of trips, the model determines typical daily profiles for fuel consumption by vehicle types. A case study has been performed on an urban corridor in the city of Kuala Lumpur to compare energy usage among three scenarios: business as usual, conventional bus lane, and full-scale BRT implementation. The BRT provides significant energy savings over both alternatives, with the greatest savings achieved when locating the BRT in a newly constructed lane.
IntroductionThe transport sector is the world’s primary consumer of petroleum products, accounting for 58 percent of global total final consumption in �004 (IEA �007). For developing and developed countries alike, the greatest share of this sector’s

Journal of Public Transportation, Vol. 11, No. 3, 2008
�0
fuel consumption comes from road transport (U.S. DOE �007; NEB �005; IEA �007; UN ESCAP �005). In light of concerns about oil price volatility, domestic energy security, and the environmental impact of burning fossil fuels, the road transport sector has been subject to increasing scrutiny over how its energy consumption can be reduced. Energy efficiency has now become a key component in recent initiatives to promote sustainable transport, particularly in the urban context. These include numerous regional and multinational efforts as well as initiatives spearheaded by individual municipalities (see examples in GDRC �007).
Among the different tools promoted to reduce road transport energy consump-tion, improvement of public bus systems is commonly recognized as a cost-effective option that can be implemented in the very near term (Hensher �007). Under favorable conditions, increasing the modal share of public bus over private transport can achieve significant benefits in both reduced energy consumption and improved air quality due to the higher energy efficiency per passenger-km of bus transit (Romilly �999; Shariar and Kahn �003; Hossain and Kennedy �006). Enhancements to public buses, such as increased frequency, reserved bus lanes, and full-scale bus rapid transit (BRT), can increase transit ridership as long as a supportive transport policy framework is in place. It has been claimed that high-quality BRT systems that replace conventional on-street bus services should be as effective as rail-based systems in generating patronage (Graham �005). In addition, increased modal shift in favor of public transport can result in fewer cars utilizing the same road space with a possible speed advantage and fewer flow breakdown situations. Fewer vehicles moving at a higher speed have an important bearing on the fuel consumption of the urban corridor.
To date, most analyses of energy consumption by the transport sector utilize a top-down approach that draws on fuel consumption statistics at the national or regional level. While this method can provide a gross indication of total energy demand by different modes, it cannot capture the effects of modal shift at the operational level, such as changes in traffic congestion and trip travel times. For example, a long-term energy planning tool such as LEAP (SEI �006) can set a sec-toral target of energy consumption and can estimate the energy consumption across various vehicle categories, but it cannot estimate the impact of initiatives that alter traffic flow in localized areas. Incorporating operational details and arrangements into energy consumption estimates is more significant when it comes down to a project implementation level. As an example, approval and implementation of a bus improvement project could receive a significant boost

Estimating Energy Savings from Bus Improvement Options
��
with a more realistic estimation of potential energy savings. Utilization of micro-simulation models along with the incorporation of vehicular emission functions may prove to be highly demanding in terms of technical know-how and cost impli-cations for many cities. This article introduces a simpler spreadsheet tool that can facilitate the estimation of potential energy savings with efficient public transport alternatives under various traffic scenarios.
Development of such a model requires information on vehicular emission and their dependence on driving behavior (i.e., instantaneous speed, acceleration, and idling). A number of research studies (Brzezinski, Enns, and Hart �999; Biggs and Akcelik �986; Post et al. �984) have proposed various mobile source emission models that calculate fuel consumption as an intermediate output to determine total vehicular emissions. While some of these models incorporate realistic driv-ing cycles, changes in travel demand, vehicle aging and other effects, the majority cannot be used to assess the energy use impact of more dynamic variables (i.e., idle time, acceleration/deceleration, etc.) that depend on vehicle operating conditions (Barth et al. �996). A comprehensive report on emission inventory methodologies (EEA �005) suggests two methods for including vehicle speed effects on mobile emissions. First, driving conditions can be categorized according to road type (i.e., urban, rural, or highway) and the emissions estimated based on speed-depen-dent emission factors and a mean vehicle speed for each category. Alternatively, speed-dependent emission functions can be integrated over speed-distribution curves that cover the entire range of driving conditions and their probability of occurrence. In the end, the authors suggest that the added complexity of includ-ing speed-distribution curves for calculating mobile source emission inventories may not be justified due to the high uncertainty in estimating vehicle emission factors. This uncertainty may result from a wide discrepancy of emission factors for vehicles of different type and age (Ntziachristos and Samaras �000). On the other hand, in estimating CO� emissions and fuel consumption, little variation exists among vehicles of similar engine size. In this case, including actual operating conditions in the energy estimation may be well justified. Such an effort can build from previous work to collect data on instantaneous speed-dependent fuel and emissions curves for different vehicle types (Rakha et al. �000; Tong et al. �000).
The present study focuses on the development of a modeling tool that includes the above issues in estimating the energy savings for bus transit improvement options. When applied to bus systems, the improvements may range from a simple demarcation of an exclusive bus lane to fully segregated high-quality BRT

Journal of Public Transportation, Vol. 11, No. 3, 2008
��
systems. With increased speed in a BRT lane, and potentially in other lanes if the number of private vehicles is reduced, BRT systems have the ability to decrease energy consumption by the transport sector significantly. However, due to tech-nological, operational, and behavioral changes, forecasting the effect of bus system enhancements on energy consumption is not a simple task. For this reason, a deci-sion support tool, the Sustainable Transport and Energy Planning (STEP) model, has been developed to assess the impact of such bus system implementation on the energy consumption along a defined corridor. The following section describes the modeling framework including model mechanisms, model data base, and calibrations. We then introduce transit and traffic scenarios for application of the model in a Kuala Lumpur corridor. Next, we describe the results of energy savings from model application. Discussions and implications of the results are presented in the concluding section.
Modeling FrameworkThe STEP model has been developed as a scenario-based planning tool to estimate the total energy consumption along a single traffic corridor for all road transport modes and vehicle types,� with a special focus on bus transport. Scenarios are based on projections of passenger trip demand, mix of vehicle types, distribu-tion between public and private modes, vehicle occupancy, and the number of lanes. The corridor itself is divided into sections, with each section characterized according to flow type, flow direction, number of lanes, and number of traffic signals or traffic circles. The model has two distinct parts, a traffic model and a fuel consumption calculator. For the former, projected passenger trip demand and other scenario parameters are used to determine typical daily profiles for average speed and volume along the corridor. It is advisable to construct three separate profiles for weekdays and weekends. For the latter, the fuel consumed by each vehicle category is calculated based on vehicle speed, travel time, volume, and fuel consumption curves for each vehicle type. In the case of dedicated bus lanes, volume, speed, and fuel consumption outputs are calculated separately for the bus lanes and nonbus lanes. The advantage of the present approach is that the effects of congestion and unstable vehicle flow are explicitly modeled and used in the estimations of fuel consumption and diverted demand (i.e., unmet demand diverted to an alternate route due to severe congestion). The model flow is sum-marized in Figure �.

Estimating Energy Savings from Bus Improvement Options
�3
Figure 1. STEP Model Structure
Traffic Data for Model DevelopmentTraffic data from a series of Automatic Incident Detection (AID) camera stations situated along the Cheras Road corridor were provided by the Urban Transporta-tion Department, Kuala Lumpur City Hall. At each AID station, a video camera and image processing unit are used to record continuously the number of passing vehicles, average vehicle speed, vehicle density, and other parameters averaged
Journal of Public Transportation, Vol. 11, No. 3, 2008
�4
over three-minute periods for each lane and vehicle class. Three vehicles classes are distinguished according to vehicle length: large, medium, and light category. The data were used to formulate the traffic flow models and estimate the model parameters. Data was available from cameras located at eight positions along the investigated part of the Cheras Road corridor. Figure � shows the location of the cameras used in the present project.
Figure 2. Camera Locations on Cheras Road, Kuala Lumpur

Estimating Energy Savings from Bus Improvement Options
�5
Traffic ModelThe objective of the traffic model is to estimate an hourly profile of realized vehicle volumes and travel times based on inputs of hourly passenger trip demand and various scenario parameters. The traffic model is actually a two-state model that estimates volumes and travel times separately for stable and unstable flow conditions. A new approach, described here, has been developed to estimate the percentage of time that traffic will reside in an unstable or stable state, based on the typical trip demand for a given period of the day. An expected value for the realized vehicle flow volume is found by summing stable and unstable volumes weighted by the probability of residing in either state. A similar approach is used to find the total travel time.
Stable and Unstable Traffic Flow Models. The distinction between stable and unstable flow is based on the traffic flow speed. When the speed crosses below a threshold value, denoted here as the breakdown speed (sb), the flow is considered unstable, while it is considered stable for all greater speeds. Figure 3 shows sample observations of speed and volume averaged over three-minute periods for an uninfluenced section of an urban arterial road in Kuala Lumpur. The breakdown speed is set here to 40kmph. The upper portion of the data reveals an inverse relationship between speed and volume; as volume increases, the speed gradu-ally declines. This region is considered stable. The lower portion reveals a region of unstable flow where both speed and volume are reduced due to interactions among a high density of vehicles.
Figure 3. Traffic Volume as Function of Speed

Journal of Public Transportation, Vol. 11, No. 3, 2008
�6
Classical volume-delay models can be formulated to approximate the relationship between speed and volume in the stable region. The volume-delay model used to represent the traffic flow during stable conditions was the Bureau of Public Roads (BPR) model (Highway Capacity Manual �000).
(�)
where:
t is the time required to travel the section length
tf is the free-flow time
v is the number of vehicles (or pcu) per hour
c is the capacity limit for the lane or group of lanes under consideration
The capacity is taken as the 98th percentile of observed volumes for a given sec-tion. Model parameters and are estimated by fitting the model to observed traffic data.
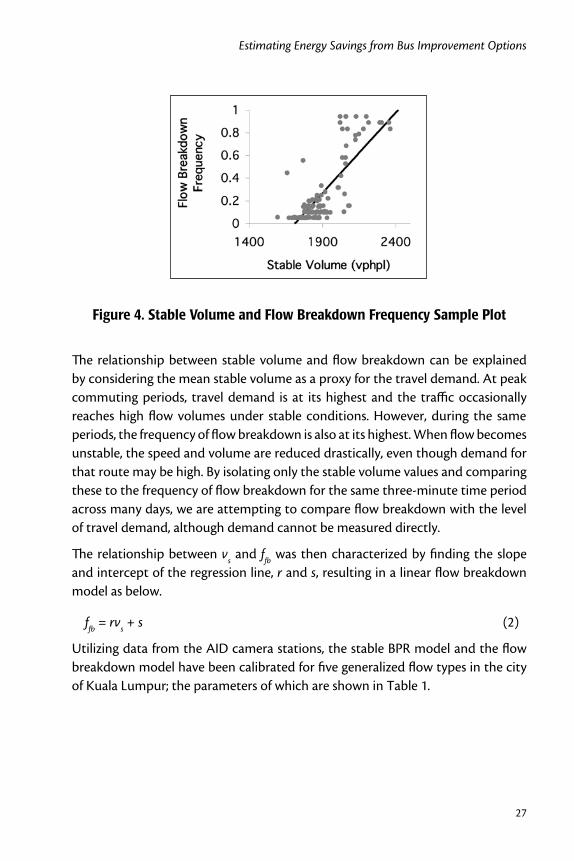
In the unstable region, the relationship between speed and volume becomes much more complex and a direct relationship between volume and speed was not determined. Instead, using a month-long series of three-minute averaged speed and volume observations for different sections, a correlation was found between the stable volumes and the percentage of time that the flow became unstable during the corresponding period. Stable flow and flow breakdown are mutually exclusive. Therefore, if flow breakdown occurred in �5 percent of the observations for a given period, this value (%FB = 0.�5) was then compared to the average of the stable volumes from the remaining 75 percent of the sample. The frequency of flow breakdown for a given period is roughly proportional to the mean stable volume observed over the same period, at least over a range of values for stable volume. A sample plot of stable volume, vs , and flow breakdown frequency, ffb , is shown for a month-long series of observations on an inbound section of Ipoh Road in Kuala Lumpur in Figure 4. A linear regression line is shown with R� = 0.73.

Estimating Energy Savings from Bus Improvement Options
�7
Figure 4. Stable Volume and Flow Breakdown Frequency Sample Plot
The relationship between stable volume and flow breakdown can be explained by considering the mean stable volume as a proxy for the travel demand. At peak commuting periods, travel demand is at its highest and the traffic occasionally reaches high flow volumes under stable conditions. However, during the same periods, the frequency of flow breakdown is also at its highest. When flow becomes unstable, the speed and volume are reduced drastically, even though demand for that route may be high. By isolating only the stable volume values and comparing these to the frequency of flow breakdown for the same three-minute time period across many days, we are attempting to compare flow breakdown with the level of travel demand, although demand cannot be measured directly.
The relationship between vs and ffb was then characterized by finding the slope and intercept of the regression line, r and s, resulting in a linear flow breakdown model as below.
ffb = rvs + s (�)
Utilizing data from the AID camera stations, the stable BPR model and the flow breakdown model have been calibrated for five generalized flow types in the city of Kuala Lumpur; the parameters of which are shown in Table �.

Journal of Public Transportation, Vol. 11, No. 3, 2008
�8
Table 1. Parameters for BPR and Proposed Flow Breakdown Models under Various Flow Range Situations
Fuel Consumption ModelNumerous agencies provide standard fuel economy data based on standardized driving cycles for various new vehicles each year. The U.S. Department of Energy and the Environmental Protection Agency jointly publish annual fuel economy statistics using the EPA driving cycle, while the Vehicle Certification Agency of the UK provides a similar annual database using the EC driving cycle. The EPA and EC driving cycles are representative of “typical” driving behavior for city or highway situations. As such they have been developed to estimate fuel consump-tion at an aggregate level, only differentiating between city and highway driving. They cannot be used to estimate changes in fuel consumption that would occur locally when driving behavior diverges from the standard cycles. One possible solution could be to scale the fuel consumption up or down according to changes in mean trip speed. However, even for trips with the same average speed, one can observe widely different instantaneous speed and acceleration profiles, each resulting in different fuel consumption and emission levels (Rakha et al. �000). A

Estimating Energy Savings from Bus Improvement Options
�9
more accurate approach would be to abandon the use of standard driving cycles and estimate the relationship between fuel consumption, speed, and acceleration directly. In a study by Rakha et al. (�000) and Ahn et al. (�00�), the authors esti-mated fuel consumption and emissions levels as a function of instantaneous speed and acceleration based on comprehensive dynamometer tests performed on five light-duty automobiles and three light-duty trucks (West et al. �997). Averaging the data into a “composite” vehicle, four curves were presented that relate instan-taneous fuel consumption to instantaneous vehicle speed for four driving modes, respectively. These are rapid acceleration (�.8m/s2), moderate acceleration (0.9 m/s2), steady speed, and deceleration (-0.9m/s2). For the purpose of our present study, we take a weighted average of the four curves according to the frequency that each mode occurs during the EC driving cycle. The EC driving cycle is used as there has not yet been a driving cycle constructed for Malaysian conditions. The resulting single curve, shown in Figure 5, represents the fuel consumption for a given average speed. To calibrate the curve for a specific vehicle type, all values are multiplied by a correction factor, which is the ratio of the average fuel consump-tion for the vehicle type in question over the fuel consumption for the composite vehicle in the study by Rakha et al. With this approach, the present model can accommodate other vehicle types, which might be available in future.
Figure 5. Calibrated Fuel Consumption vs. Speed for Light Vehicles

Journal of Public Transportation, Vol. 11, No. 3, 2008
30
By estimating the operating speed from the volume-delay function for stable flow and the mean speed for unstable flow, the fuel consumption can be estimated for the different vehicle types in the stream for all periods of the day.
Model OutputsThe primary output is the fuel consumption by vehicle category for all sections along the route. Other outputs include operating speed, percent flow breakdown, conges-tion index (i.e., ratio of a certain travel time period to free-flow travel time), and the amount of diverted demand. The latter is measured in terms of passenger trips.
Model ApplicationThe Cheras Road corridor of Kuala Lumpur has been chosen as the case study to test the model development. Total length of this corridor, from the intersection of Cheras Road and the Cheras-Kajang Expressway to the Taman Maluri city hub is approximately ��.5 km in both directions. Along the corridor, typical speed, accel-eration, volume, and even type of vehicle may change. The full corridor is therefore divided into sections that are classified according to the five generalized flow types identified in Table �. The segmentation of the Cheras Road corridor according to section type, length, and lane numbers for each segment are given in Table �.
Vehicle Fleet CharacteristicsThe composition of the present-day Malaysian vehicle fleet is developed from registration and fuel consumption data disaggregated by vehicle type, engine size, and fuel technology (Hossain and Kennedy �006). The technological aspects of the vehicle fleet are kept constant throughout the planning horizon (i.e., no changes in fuel efficiency) and fuel technology are assumed for any of the scenarios. Typical vehicle characteristics for Malaysian fleet are presented in Table 3.
In future scenarios, the user can define two of the following three sets of values: (�) percentage share of total vehicles by vehicle type, (�) percentage share of total passenger trips by vehicle type, and/or (3) average number of passengers for each vehicle type. If two categories are set, the other will automatically be determined.

Estimating Energy Savings from Bus Improvement Options
3�
Table 2. Section Characteristics
Table 3. Typical Vehicle Characteristics for Malaysian Fleet
*LDV–Light-duty vehicle **MDV–Medium-duty vehicle

Journal of Public Transportation, Vol. 11, No. 3, 2008
3�
Sensitivity AnalysisFor calibration of the model as a whole, a sensitivity analysis was performed for trip growth rate. For the base year of �006 in study area, the trip growth rate was set to �.73 percent per year. The growth rate in energy consumption, however, exceeded the trip growth rate, due to the influence of increased congestion on fuel consumption. For annual trip growth rates of �.73 percent, 4 percent, and 5 per-cent, energy consumption increased by 3.3 percent, 5 percent, and 6.�5 percent, respectively, for a typical scenario. The consistent result from the model shows the validity of the model in general.
ScenariosThree scenarios have been developed for comparison: business as usual (BAU), bus lane (BL), and bus rapid transit (BRT). The latter two scenarios are differntiated from BAU according to changes in modal share of bus transport, average bus occu-pancy, and avearage bus traveling speed. The reasoning behind the values chosen for each scenario is described below. For the BL and BRT scenarios, two different cases are examined. First, an existing lane is converted to a restricted lane for buses or BRT [no lane extension case (NLE)]. Alternatively, a new lane is added in each direction for the bus or BRT [lane extension case (LE)]. The base year is set to �006. All scenarios assume a constant growth rate in trip demand at �.73 percent per year and are evaluated in �0�0 and �0�0. The percentage share of total trips made by medium-duty vehicle (MDV) and truck also remain constant at 7 and 4 per-cent, respectively. Hence, the growth in trip demand by these two modes, which are more likely to be commercially based, is pegged to the overall trip growth.
BAU Scenario. The BAU assumes that no changes are made to the composition of the vehicle fleet over the entire time horizon. In other words, the percentage of vehicles taken up by cars (88.�%), MDV-truck (7.8%), trucks (3.3%), and buses (0.8%) remains the same in �0�0 and �0�0, even though the total number of vehi-cles increases to satisfy growing trip demand. There is no change in the quality or size of buses, so the average number of passengers per bus remains the same as the initial year (�0 pass/bus). There is also no change in the average number of passen-gers for cars, MDV-truck, or trucks, so the modal trip share also remains constant for all modes (i.e., cars [77%], MDV-truck [8%], trucks [4%], and buses [�0.7%]).
BL Scenario. The BL scenario represents a situation with dedicated bus lanes, but with an inferior level of service compared to a BRT. Passenger comfort, travel

Estimating Energy Savings from Bus Improvement Options
33
time, ticketing, and station facilities are all similar to the present-day bus system. Designated bus lanes without physical barriers have been implemented in Kuala Lumpur in the past. These projects have met with very limited success due to nonobservance of designated areas by private vehicles, lack of improvement in other aspects of bus service, and a perceived lack of space to allow continuous bus lanes. We have chosen to represent this type of scenario with a very modest improvement in modal share for buses of �� percent in �0�0 and �5 percent in �0�0. These value are intended to represent the impact of a “partial commitment” to bus service improvement and they can be adjusted if more detailed modal share forecasts are available. There is also a slight increase in passengers per bus as compared to BAU due to improved travel times in the dedicated lanes, from �5 per bus in �0�0 to 30 per bus in �0�0. A peak-hour bus operating speed of �8 kmph and off-peak hour operating speed of �4 kmph are assumed in this scenario based on the current speed situation in the existing bus lanes. However, these values can also be changed by the user to accommodate a different set of assumptions under different situations.
BRT Scenario. In the BRT scenario the level of service of the BRT system is consid-ered to be sufficiently high to justify a large modal shift from private vehicles to BRT. A mix of financial incentives, assistance, regulatory, and enforcement mecha-nisms can be exercised to create a favorable situation for service improvement and subsequent increase in public transport patronage. A few Southeast Asian cities have experienced significant increases in bus ridership in recent years with such measures. For example, by increasing its control over bus routes, schedules, fares, and overall system design, the Seoul Metropolitan Government has achieved a bus ridership increase as high as �4 percent with no visible impact on metro rider-ship (Pucher et al. �005). After introduction of BRT in Jakarta, about �4 percent of car drivers (BAQ Media Team �006) have shifted to the improved bus service alongside the general increase in bus patronage. Assuming a Malaysian govern-ment urban transport policy favoring such public transport patronage, we have chosen to set the BRT modal share to the target value that has been articulated in Malaysia’s current five-year plan, which is 30 percent in �0�0 and 40 percent in �0�0 (EPU �006), to illustrate the effect that achieving this modal share would have on energy consumption. These modal share values are assumed for this cor-ridor only and not for the entire city—setting high targets for corridor-specific values more likely will be achievable than for a citywide average. Average passen-gers per bus are also taken as higher in anticipation of the introduction of higher capacity buses, with 40 passengers per bus in �0�0 and 50 per bus in �0�0. During

Journal of Public Transportation, Vol. 11, No. 3, 2008
34
peak-demand periods, articulated buses with a capacity of up to �00 passengers have been considered to be available. A peak-hour bus operating at �4 kmph and an off peak-hour one operating at 3� kmph are assumed in this scenario based on the existing BRT system performance (U.S. FTA �004).
ResultsTotal Consumption by Fuel TypeTotal fuel consumption per week along the corridor was calculated for gasoline, diesel, and natural gas vehicles for the LE case. Quantities of all liquid fuels are provided in liters, while natural gas is in gasoline-equivalent liters. In all scenarios, gasoline consumption dominates all other fuels, as gasoline-powered cars make up the largest proportion of the fleet. Natural gas use is negligible as only a very small percentage of vehicles currently use this fuel.
For BAU, weekly gasoline consumption is initially at 574,000 liters and climbs to 649,000 liters in �0�0 and 903,000 liters in �0�0. In the BL scenario, gasoline con-sumption reaches 585,000 liters in �0�0 and 7��,000 liters in �0�0. For the BRT scenario, total gasoline consumption is the lowest at 434,000 liters in �0�0 and 464,000 liters in �0�0. Therefore, in the BRT case, gasoline consumption has been reduced relative to the BAU case by 33 percent in �0�0 and 49 percent in �0�0, mainly due to assumed modal shift from car to BRT system.
Diesel consumption, on the other hand, increases as more buses are included in the vehicle fleet. For the BAU case, weekly diesel consumption is initially at 55,000 liters in �006 and climbs to 6�,000 liters in �0�0 and 86,000 liters in �0�0. In the BL scenario, diesel consumption reaches 59,000 liters in �0�0 and 79,000 liters in �0�0. For the BRT scenario, total diesel consumption is the highest at 67,000 liters in �0�0 and 90,000 liters in �0�0. Therefore, the increase in BRT diesel consumption relative to the BAU case is 8 percent in �0�0 and 5 percent in �0�0. Although the BRT scenario bus numbers are significantly higher than the BAU scenario, there is only a small increase for diesel consumption in �0�0 because of the improved operating conditions in the BRT lane.
Total Energy SavingsTotal energy consumption across all fuels is calculated to compare the effective-ness of the different scenarios in terms of energy savings (see Table 4). Measured in ktoe/week, the BAU scenario has an intial energy consumption of 0.5� ktoe in �006, rising to 0.55 ktoe in �0�0 and 0.7� ktoe in �0�0. For the BL scenario, total

Estimating Energy Savings from Bus Improvement Options
35
energy consumption is 0.53 ktoe in �0�0 and 0.66 ktoe in �0�0. With the BRT option, total fuel consumption in the corridor is reduced relative to BAU by �4 percent (for LE and NLE) in �0�0 and by about 36 percent (LE) to 40 percent (NLE) in �0�0. The maximum possible energy savings are realized by moving from a BAU and NLE scenario to the BRT and LE scenario, reaching �9 percent and 45 percent by �0�0 and �0�0, respectively.
Table 4. Total Energy (ktoe/week) Savings for Various Scenarios and Cases
** In case of BRT and LE scenario with respect to BAU and NLE scenario.
Conclusions and RecommendationsThe spreadsheet-based model described in this article is a useful tool for estimat-ing energy savings for public transport improvement options and other related transport scenarios. Effects due to congestion have been included in the energy estimates through a new approach at modeling the onset of unstable flow, which otherwise would normally require a more complex microsimulation technique. Implementing a BRT system results in significant improvements in energy effi-ciency for the urban road corridor in this study. Relative to business as usual, BRT

Journal of Public Transportation, Vol. 11, No. 3, 2008
36
reduces the total fuel consumption in the corridor by �4 percent (for both LE and NLE case) in �0�0 and about 36 percent (LE case) to 40 percent (NLE case) in �0�0. The impact of adding an additional lane is shown to reduce energy consumption within each individual scenario in the range of 7 to �3 percent with the maxi-mum possible reduction with respect to the BAU scenario. This is due to reduced congestion of traffic after addition of a new lane. Demand is assumed to remain constant in the present analysis whether or not a new lane is added. The maximum possible energy savings between any two scenarios are realized by moving from a BAU scenario with no lane extension to the BRT scenario with an additional lane, reaching �9 and 45 percent by �0�0 and �0�0, respectively. The energy required to construct an additional lane has not been included in this energy analysis. An interesting extension would be to determine the length of time required for energy expended by lane construction to be recovered by fuel savings. This energy payback period could be an additional useful criterion for deciding on road-widen-ing projects.
Although the model can provide output related to operation conditions and fuel consumption under different scenarios, especially future modal split targets set by the user, it has no mechanism for addressing issues in achieving those modal split targets. Even with improved operation and level of service, some control/enforce-ment measures, like road pricing, parking restriction, and fuel taxation, might also be necessary to achieve the set target for public transport. Also, the model’s scope is limited to the boundary of a corridor without considering any influence from parallel or nearby routes. However, for a realistic project feasibilty study, it ulti-mately comes down to a corridor-level analysis for implementation decisions. In that perspective, this modeling tool can help promote bus transit improvements with its capability of realistic estimations of energy savings for such initiatives.
The present analysis has focused exclusively on energy consumption as an objec-tive for bus improvement initiatives. However, vehicle emissions are another very important criterion for sustainable urban transport; hence, the modeling approach used here should be extended in future work to estimate vehicular emissions from the different vehicle types. Since vehicle-type distribution and speed and volume profiles are already specified by the model, emissions could be determined fairly accurately by including vehicle emission factors. This extension is especially important considering that an expanded bus fleet can potentially damage urban air quality if insufficient pollution control measures are in place. The present model can therefore provide a very useful platform for not only esti-

Estimating Energy Savings from Bus Improvement Options
37
mating fuel consumption, but also for testing the corridor-specific impacts of new engine technology on vehicular emissions.
Endnote � In the current formulation of the STEP model, motorcycles have not been included.
References
Ahn, K., H. Rakha, A. Trani, and M. V. Aerde. �00�. Estimating fuel consumption and emissions based on instantaneous speeds and accelerations. Journal of Transportation Engineering (April): �8�–�90.
BAQ Media Team. �006. Bus rapid transit systems offer effective solution for Asian cities. Accessible at http://www.cleanairnet.org/baq2006/1757/propertyvalue-26756.html#h2_3.
Barth, M., F. An, J. Norbeck, and M. Ross, M. �996. Modal emissions modeling: A physical approach. Transportation Research Record No. �5�0, pp. 8�–88, Transportation Research Board, National Academy of Science.
Biggs, D. C., and R. Akcelik. �986. An energy-related model of instantaneous fuel consumption. Traffic Engineering Control �7(6): 3�0–3�5.
Brzezinski, D. J., P. Enns, and C. Hart.�999. Facility-specific speed correction factors. MOBILE6 Stakeholder Review Document (M6.SPD.00�). Ann Arbor, MI: U.S. Environmental Protection Agency.
EEA. �005. EMEP/CORINAIR. Emission inventory guidebook—�005. European Environment Agency, Part B, Group 7–Road Transport.
EPU. �006. Ninth Malaysia plan �006–�0�0. Putrajaya, Malaysia: Economic Plan-ning Unit, Prime Minister’s Department.
GDRC (Global Development Research Center). �007. Sustainable transport: Pro-grams and initiatives. Retrieved on August �4, �007 from http://www.gdrc.org/uem/sustran/sustran.html.
Graham, C. �005. The demand performance of bus rapid transit. Journal of Public Transportation 8(�).

Journal of Public Transportation, Vol. 11, No. 3, 2008
38
Hensher, D. �007. Sustainable public transport systems: Moving towards a value for money and network-based approach and away from blind commitment. Transport Policy �4:98–�0�.
Highway Capacity Manual. �000.Transportation Research Board.
Hossain, M., and S. Kennedy. �006. Estimating potential energy savings with efficient public transport alternatives under various traffic scenarios: A spreadsheet based tool for Kuala Lumpur. Sponsored by DANIDA-Economic Planning Unit of Malaysian Government (December).
International Energy Agency (IEA). �007. [Online] IEA Statistics, accessed June �6, �007 from International Energy Agency website, http://www.iea.org/Text-base/stats/index.asp.
National Energy Balance, Malaysia (NEB). �005. Ministry of Energy, Water and Communications, Malaysia.
Ntziachristos, L., and Z. Samaras.�000.COPERT III Computer programme to calcu-late emissions from road transport Methodology and emission factors (Ver-sion �.�). Report to the European Environmental Agency Topic Center on Air Emissions, Thessaloniki, Greece.
Post, K., J. H. Kent, J. Tomlin, and N. Carruthers. �984. Fuel consumption and emission modelling by power demand and a comparison with other models. Transportation Research Part A �8(3): �9�–��3.
Pucher, J., M. H. Kim, and J. Song.�005. Public transport reforms in Seoul: Innova-tions motivated by funding crisis. Journal of Public Transportation 8.5.
Rakha, H., M. Van Aerde, K. Ahn, and A. A. Trani. �000. Requirements for evaluat-ing traffic signal control impacts on energy and emissions based on instan-taneous speeds and acceleration measurements. TRB 79th Annual Meeting, Washington DC.
Romilly, P. �999.Substitution of bus for car travel in urban Britain: An economic evaluation of bus and car exhaust emission and other costs. Transportation Research Part D(4):�09–��5.
SEI (Stockholm Environment Institute). �006. Long-range energy alternatives plan-ning system. User Guide (March). Retrieved August �3, �007 from http://www.sei-us.org/default.asp?action=20.

Estimating Energy Savings from Bus Improvement Options
39
Shahriar, A. Z., and Khan, A. M. �003. Optimization of travel in bus rapid transit-based multimodal corridor. Journal of Public Transportation 6(�): 87–�06.
Tong, H. Y., W. T. Hung, and C. S. Cheung. �000. On-road motor vehicle emissions and fuel consumption in urban driving conditions. Journal of Air and Waste Management Association 50 (April).
UN ESCAP.�005. Review of developments in transport in Asia and the Pacific �005. Available at http://www.unescap.org/ttdw/Publications/TPTS_pubs/pub_2392/pub_2392_fulltext.pdf.
U.S. Department of Energy (U.S. DOE). �007. Fuel economy guide. U.S. Depart-ment of Energy and U.S. Environmental Protection Agency. Retrieved July ��, �007 from http://www.fueleconomy.gov.
U.S. Federal Transit Administration. �004. Characteristics of bus rapid transit for decision making. Project No: FTA-VA-�6-7���-�004. U.S. Department of Transportation, Office of Research, Demonstration and Innovation.
West, B., R. McGill, J. Hodgson, S. Sluder, and D. Smith. �997. Development of data-based light-duty modal emissions and fuel consumption models. Society of Automotive Engineers, Paper No. 97�9�0: ��74–��80.
About the Authors
Moazzem Hossain ([email protected]) is a professor of civil engineering at the Bangladesh University of Engineering and Technology. Prior to this position he was an associate professor in the Transportation and Logistics Program at Malay-sia University of Science and Technology. His research and consultation interests include transport system simulation, public transport operation, and nonmotorized transport. He has published extensively on the above topics in various journals and conference proceedings. He has developed MIXNETSIM, a mixed-traffic network model for simulating urban road network with heterogeneous traffic. The simulation model has been applied in various developing countries including Bangladesh to simulate use of bus lane and at-grade LRT operation under mixed-traffic situations of developing cities.
Scott Kennedy ([email protected]) is an associate professor at the Masdar Institute of Science and Technology in Abu Dhabi, United Arab Emirates, and cur-rently a visiting scholar at the Massachusetts Institute of Technology. His research interests are in modeling of energy systems, which include integration of renewable

Journal of Public Transportation, Vol. 11, No. 3, 2008
40
energy technologies into constrained electric grids and energy assessments of urban transportation networks. He has also been an active consultant and advisor for energy and environmental policy issues taken up by the Malaysian government.

4�
Travel Demand Management: Lessons for Malaysia
Travel Demand Management: Lessons for Malaysia
Jeyapalan Kasipillai & Pikkay Chan Monash University Sunway Campus
Abstract
The growth in the number of motor vehicles has exacted costs on both the Malaysian economy and environment. For reasons such as increasing disposable incomes and poor management of the public transportation system, the number of vehicles has grown unabated and, in fact, is aided by various contradictory policy measures such as national car projects and the existence of fuel subsidies.
A phased, five-pronged Transport Development Management-based approach is recommended towards targeting a sustainable transportation system in Malaysia: (1) alteration of charges on road taxes and car insurance, (2) elimination of fuel subsidies, (3) imposition of fuel taxes and amendments in the bases for car taxation, (4) congestion charging, particularly in Kuala Lumpur, and (5) national road pricing. This move towards an eventual sustainable transportation system is presented for consideration.
IntroductionMalaysia has experienced tremendous economic success over the last three decades, with spill-over effects for its citizens in terms of increased disposable incomes and leisure time. A corollary of the “good life” is improved transportation. As in all countries worldwide, accessibility and mobility afforded by transportation are driven mainly by the growth in private car ownership. Correspondingly, the

Journal of Public Transportation, Vol. 11, No. 3, 2008
4�
share for public transportation has fallen. In industrialized countries, car depen-dency is so deeply ingrained that, in the U.S. in particular, car ownership rates exceed an average of one car per licensed driver in many urban areas (Stopher �004).
In Malaysia, as at the end of �005, approximately �5 million vehicles (motor cars, motorcycles, taxis, buses and freight vehicles) plied Malaysian roads. Currently, the country has an adult population of about �5.� million. Ninety percent of motor vehicles in Malaysia are privately-owned. As a developing country, the relatively cheaper motorcycle takes the largest share at 7 million (47%), followed closely by passenger cars at 6.5 million (43%) (Department of Statistics Malaysia �006). From �000 to �005, the number of motorcycles and private passenger cars increased at an average rate of 4.5 percent and �0 percent, respectively. The future outlook is one of explosive growth, assuming no mitigating options are undertaken by the government and a “business as usual” scenario applies. According to Abidin et al. (�004), conservative projections place vehicle growth rates over the next �3 years at eight percent, with total vehicle numbers breaching 48 million by �0�0. Figure � illustrates the actual and projected upward surge in motor vehicle numbers.
Note: a = actual, e= estimated Source: Abidin et al. �004 and Department of Statistics Malaysia �006
Figure 1: Actual and Projected Number of Vehicles Malaysia (2000–2020)

43
Travel Demand Management: Lessons for Malaysia
Motor Vehicle Growth Many factors contribute to the growth in the number of vehicles in Malaysia, including increased population size and disposable incomes, fuel subsidies, and decentralization. Malaysia’s national car projects also have played a role in motor vehicle growth by limiting the options available to the government.
Increased Income and Demand for TransportationThe Malaysian economy has recorded an average Gross Domestic Product (GDP) growth of six percent over the last �0 years (Asian Development Bank �007). GDP per capita increased three-fold from USD �,779 in �980 to USD 5,�39 (Econstats �007; Department of Statistics Malaysia �006).
A study by Dargay and Gately (�999) suggests a positive relationship between income and the demand for transportation, both freight and passenger, with the greatest growth in developing countries. This is particularly true in Malaysia, as increasing disposable income has made private motor vehicles more affordable, leading to increased demand (Pucher et al. �005).
Malaysia’s National Car ProjectsAs part of its pro-growth and heavy-industrialization strategy, Malaysia actively promoted its automobile industry. The country has two home-grown car manufacturing companies: National Automobile Enterprise Co. Ltd. (Perusahaan Otomobil Nasional Bhd, or Proton, as it is more commonly known) and Perodua (Perusahaan Otomobil Kedua Sdn Bhd) (Spencer and Madhaven �989). Proton and Perodua together accounted for more than 90 percent of car sales since �000 (Mohamad and Kiggundu �007).
The government has supported both car manufacturing companies through various means, including protectionist policies. Imported vehicles in Malaysia are assigned �40 to 300 percent in excise duties to offer the two local carmakers a price advantage. With attractive pricing and protectionist policies, national cars are affordable to the public and have directly contributed to the increasing numbers of vehicles on the road. Given the Malaysian motor vehicle scenario, the govern-ment finds itself in the contradictory position of being involved in the car industry; measures to restrict private passenger car numbers would be akin to “shooting oneself in the foot.”
Fuel SubsidiesMalaysia provides fuel subsidies for petroleum, diesel, gas and electricity. Direct subsidies totaled MYR 8.�6 (USD �.47) billion in �005 before dropping slightly to

Journal of Public Transportation, Vol. 11, No. 3, 2008
44
MYR 7.30 (USD �.�4) billion in �006 as the government reduced the subsidy. This decrease, however, has been reversed, as it is estimated that, with prices scaling USD �00 per barrel, subsidies for �007 will balloon to MYR ��.� (USD 3.70) billion. Prices at the pump are among the lowest in the region at MYR �.9� (USD 0.58) per litre for petrol and MYR �.58 (USD 0.48) per litre for diesel.
The fuel subsidy debate, including eventual reduction and elimination, has direct bearings on the transportation sector in Malaysia. The transportation sector accounts for 40 percent of the Malaysia’s total energy consumption and is wholly dependent on fossil fuels (Abidin et al. �004). The use of subsidies masks the real price of transportation; as it is, motor vehicle users do not pay the full cost of travel, including externalities such as environmental pollution, congestion, and accidents (Meyer et al. �965). Such under-pricing has led to rapid motorization in Malaysia.
DecentralizationDecentralization is a double-edged sword in terms of motor vehicle usage. The trend towards decentralization accelerated from the �990s, abetted by Malaysia’s appetite for large-scale infrastructure investment with private-sector involvement, primarily in the construction of numerous expressways (Bunnell et al. �00�). One significant outcome of increased highway capacities is for homes and businesses to move further out of urban zones where land is both cheaper and more plenti-ful. This decentralization led to the same travel times, with longer distances but reduced congestion. A direct consequence was that car dependency increased as public transportation could not reach many of the outlying areas.
Decreasing Public Transportation UsageThe decline in public transportation usage coincided with the rise in the number of private motor vehicles, given the government’s private-transport-driven poli-cies. The capital city of Kuala Lumpur is serviced by four major bus fleets that run about �5,000 trips daily and by �4,7�� licensed taxies. In �998, the city’s urban rail services were complemented by two light rail transit (LRT) systems and a monorail (Phang �006).
Figure � illustrates that, even though an overall pattern of growth was seen in both LRT systems from �998 to �005, the rate of growth has slowed, especially from �000 onwards.

45
Travel Demand Management: Lessons for Malaysia
Source: Economic Planning Unit Malaysia �006
Figure 2: Average Daily Ridership (in 000s) on Urban Rail Services
(1998 to 2005)
The public has largely rejected public transportation as a viable mode of travel, as evidenced by a drastic drop in its usage rate in Kuala Lumpur from 35 percent in �980 to only �6 percent in �007 (Gakenheimer and Zegras �004). This figure does not compare favorably with other Asian cities that have higher public transpor-tation usage rates, including Seoul (60%), Singapore (56%), Manila (54%), Tokyo (49%), and Bangkok (30%), and is an indictment against the ambiguous policies set for the transportation sector in the country (Abdul-Aziz �006).
Government’s Response to Vehicle GrowthThe various documented negative effects of the growth in the number of motor vehicle include traffic congestion leading to wasted driver and passenger time and their associated costs; increased fuel consumption; air and noise pollution; and elevated accident and fatality rates. In Malaysia, there are also socio-political issues of eviction of poor urban residents to make way for infrastructure develop-ment. Given such negative outcomes, the government has given only a lukewarm

Journal of Public Transportation, Vol. 11, No. 3, 2008
46
response to unabated vehicular growth by introducing legislative measures to combat unwarranted abuse of the environment; in particular the implementation of emission standards and inspection and maintenance systems. Measures such as switching to natural gas fuels in the short term and bio-fuels in the long term also were implemented within the frameworks of two national-level fuel policies: the Five-Fuels Diversification Policy in �999 and the National Bio-Fuel Policy in �006. The Five-Fuels Diversification policy acknowledged biomass as a source of energy in addition to the traditional fuels of oil, natural gas, hydropower, and coal, whereas the National Bio-Fuel Policy took this initiative a step further by giving credence to bio-fuels (especially bio-diesels) as viable alternative sources of energy. Malaysia has a competitive advantage as the world’s leading palm oil producer, as one form of bio-diesel is derived from processed palm oil (Economic Planning Unit �006).
A point to note is that, in the midst of such government initiatives, there are still no direct policies to tackle demand for transportation at the source, except for the existence of privatized tolled highways. Malaysia practices a variant of road pric-ing in the form of tolled roads, the first of which was in �978 on the North-South Expressway (Johansen �989). However, toll charges in Malaysia were not explicitly implemented to internalize external costs such as congestion but reportedly to recover infrastructural costs. The Malaysian government set up a lease-like mechanism (known as Build–Operate–Transfer) wherein private concessionaires finance, design, build, and maintain roads in exchange for exclusive rights to impose tolls upon entry and exit within a time limit. Upon expiration of this time limit, ownership of the roads reverts to the government, and the roads, presum-ably, become toll-free. Despite spiraling toll charges, which are increasing on aver-age by �0 percent every three years, the number of vehicle continues to grow by a conservative estimate of eight percent annually (Abidin et al. �004).
Agenda for Reform: A Five-Pronged Transportation ApproachGiven the trends seen over the past decades as Malaysians continued to sink ever deeper into automobile dependency, the negative effects of high vehicle usage outweighed the benefits of accessibility and mobility. This situation prompted the government to explore alternative measures practiced elsewhere for domestic adoption. There was an urgent need for bold policy initiatives by the government to address some of the negative effects of the surge in private transportation in Malaysia. In this regard, the government undertook a National Transport Policy

47
Travel Demand Management: Lessons for Malaysia
and Strategy Study in �003, which dealt with land-based public transportation. The study probed into the need for a comprehensive transportation plan, particu-larly for urban areas. Major projects since completion of the study were, however, still skewed towards private car usage and include ITIS (Integrated Transport Information System), in which private motorists were provided real-time traffic information to plan their journeys effectively, as well as the SMART (Stormwater Management and Road Tunnel) system, which provides the dual purpose of traffic alleviation and flash-flood management (Economic Planning Unit Malaysia �006). The SMART system is a dual drainage and road structure located in Kuala Lumpur. The principal aim of this tunnel is to overcome the incidence of flash floods and reduce traffic jams during peak hours. The motorway tunnel, which is 4 km long, was opened for public use in May �007; the stormwater section began operations in June �007. Motorists incur MYR � for each trip for the use of the motorwater tunnel and save approximately 30 minutes of travel time.
Given the background of the transportation system in Malaysia, a five-pronged approach is recommended towards targeting a sustainable transportation system in Malaysia:
�) alteration of charges on road taxes and car insurance
�) elimination of fuel subsidies
3) imposition of fuel taxes and amendments in the bases for car taxation
4) congestion charging, particularly in Kuala Lumpur
5) national road pricing
All these approaches come within the ambit of Travel Demand Management (TDM) programs aiming collectively to encourage more efficient use of transport resources such as road and parking spaces as well as vehicle capacity and energy use. This is achieved by implementing strategies to improve transport options and achieve accessible and efficient use of land and various other planning reform and support programs (Meyer �997; Litman �003).
Effective TDM measures implemented in the early stages of development can avoid the problems that result from heavy reliance on private transportation. Granted that Malaysia is only �� years away from its self-imposed deadline of Developed Nation status in �0�0 and with unmitigated vehicular growth thus far, TDM can help mould the country’s economic, social, and environmental develop-ment towards more sustainable levels (Gwilliam et al. �004).

Journal of Public Transportation, Vol. 11, No. 3, 2008
48
Altering Charges on Road Taxes and Car Insurance Transportation as a good is essentially under-priced; 3� percent of the total costs of automobile use are external costs (e.g., pollution) and are paid not by drivers but by society. Twenty-four percent constitute internal fixed costs (e.g., deprecia-tion) that are not affected by driving distances (Litman �007).
A pertinent point to be made in quantifying costs associated with automobile usage is that consumers frequently underestimate the cost of running cars by con-sidering only ownership and operating costs without considering other associated external costs (Gardner and Abraham �006).
A starting point in the way individual perception of road user charging can be altered prior to the imposition of congestion charging involves road tax and car insurance. Altering the charging of both road tax and car insurance from a fixed yearly cost to a per-journey payment is a way of applying the Polluter Pays Prin-ciple (PPP). On the face of it, given millions of vehicles on the road, this step is an administratively tedious task, but the government already has the infrastructure in place for its implementation: odometer audits via its inspection and mainte-nance network or full electronic payment schemes such as those currently par-tially implemented for tolled roads.
In an article “Ministry looking into cross-subsidy to keep fuel prices down” (The Star, November ��, �007), it was reported that the government-proposed increas-ing road tax charges for luxury high-powered vehicles. However, a serious short-coming of this proposal is that it is still a flat charge that does not address the issue of distance traveled. In fact, flat charges encourage greater usage as, psychologi-cally, users want to lower the per-unit cost of travel. Such actions will inevitably defeat the purpose of lowering travel demand.
Elimination of Fuel SubsidiesA gradual reduction in and ultimate elimination of fuel subsidies should result in monies that can be channeled towards improving the reach and connectivity of public transportation networks and subsidies for the cost of public transporta-tion fares. This was, in fact, an approach purportedly taken by the government as prices at the pump, which are determined by the government, have increased by approximately 40 percent since �004 as subsidies were reduced twice, once in �005 and again in �006. Given no further reductions in the subsidy and compounded with recent peaks in fuel prices, it is extremely unlikely the subsidy bill will come

49
Travel Demand Management: Lessons for Malaysia
down. One obvious negative effect of fuel subsidies is the diversion of resources away from other development initiatives.
A suggestion is made for the reduction to be fine-tuned further by first lowering the subsidies at the pumps, leaving the subsidies for the other sectors of the econ-omy intact. The initial savings can be channeled towards the public transporta-tion agenda, effectively leaving out issues of cross-subsidies of other sectors of the economy. A matter that has to be reiterated is that public transportation services must be enhanced prior to reducing the demand for private cars via various traffic restraint programs to avoid a political and public backlash. Thus, fuel subsidies can be used for continuous enhancement of the public transportation system after the government has provided adequate initial support.
In the longer term, it is clear that subsidies should be gradually eliminated, as their associated costs, including regulatory and compliance costs on the part of the government and distortions created in the economy, are disproportionately high compared to the benefits garnered. The fuel subsidy mentality dents competitive-ness and encourages a consumption ethic (The Oxford Business Group �006). Subsidies discourage more efficient usage of fuel and the search for alternative fuels, thereby fostering an attitude of fossil fuel dependency. As a component of total car operating cost, fuel prices are a strong signal to alter consumption behavior in the long run (Ribeiro et al. �007). The conclusion is that Malaysia has been pampering its consumers of fossil fuels by not only allowing market forces to determine fuel prices, but by also compounding the situation with fuel subsidies.
Fuel and Car Taxes: A Necessary Evil?In the long run, fuel taxes encourage a conservation ethic, leading to prudent energy management, greater economic efficiency, and lower pollution emissions (Litman �007). Fuel taxes should be differentiated based on the amount of carbon, for example, to encourage use of “cleaner fuels.” To make fuel taxes more accepta-ble to the public, they must be hypothecated; that is, the revenue must be spent on infrastructural improvements or on public transportation.
Another tax initiative is managing within the existing framework where there is already a comprehensive system of car taxation via excise and import duties as well as sales taxes executed by the Royal Customs and Excise Duties Department Malaysia. An avenue exists for penalizing negative and rewarding positive envi-ronmental behaviors within the current system with minimal changeover and implementation costs. A revenue-neutral system can be implemented relatively

Journal of Public Transportation, Vol. 11, No. 3, 2008
50
easily, in which fuel-efficient, low-emission cars are taxed at lower rates while fuel-guzzling, high-emission cars are imposed high tax rates. Changing the relative pri-ces of different cars using an environmental benchmark would send strong signals to the market to provide incentives to both the purchasers and manufacturers of environmentally-friendly cars.
Congestion Charging in Urban ZonesRoad pricing means that motorists pay directly for the privilege of driving on a particular road or in a particular area (Victoria Transport Policy Institute �007). Congestion pricing is a particular type of road pricing where variable fees are char-ged with an explicit purpose to reduce congestion (Litman �007a). Congestion charging in urban zones such as the capital city of Kuala Lumpur should be given serious thought, given that no travel demand measures have been implemented since recommendations were made more than three decades ago by the capital city’s local government.
The central business district of Kuala Lumpur experiences the highest level of tra-ffic congestion in Malaysia. According to the report “Malaysia’s capital mulls traffic fees to cut congestion” (AFX News Ltd, November �0, �007), about � million cars enter into the city centre daily, with traffic growth of between �0 to �5 percent every year. In an early attempt to manage congestion levels, the Kuala Lumpur City Hall contemplated implementing an Area Licensing Scheme (ALS) in �976, similar to the scheme established in Singapore. The ALS was introduced by the Singapore government in June �975 with the primary objective of lowering traffic congestion during the peak hours. However, after installing �3 steel gantries at various strate-gic points within the city limits, a Malaysian Cabinet decision in �979 halted its full implementation. Three grounds for the rejection were given, including an inade-quate public transportation system; inadequate park-and-ride facilities for those wishing a shift from passenger car to public transportation; and the non-existence of an alternative route rimming the ALS boundary to allow traffic to flow without crossing the central business district (Mohamad and Kiggindu �007).
In September �007, Kuala Lumpur’s mayor resurrected the idea of congestion charging for the capital city, using the successful implementation in London and Stockholm as precedents. However, no other details were forthcoming regarding the timing or pricing of the charge. Operationally, it is observed that, with the ITIS in place, implementing the area-wide congestion charge is fairly easy.

5�
Travel Demand Management: Lessons for Malaysia
Care should be taken, however, in transplanting the London experience whole-sale to Kuala Lumpur. London’s city centre was experiencing severe congestion, parking charges were extremely high, and, well before congestion charging was implemented, a well-managed and efficient public transportation system encom-passing bus, transit, subway, rail, and taxi services was already in place (Washbrook et al. �006). In contrast, travel speed during congestion in Kuala Lumpur is still relatively acceptable compared to other Asian cities such as Bangkok and Jakarta. Free or low-cost parking spaces are available in many parts of Kuala Lumpur due to pressure from a strong pro-business lobby. Finally, public transportation in Kuala Lumpur is relatively less well-managed and efficient than in London.
A large part of the congestion charging issue would naturally center on issues of pricing. A study by Nor and Nor (�006) found that in the new administrative capital of Putrajaya, penalties ranging from MYR 3 (USD 0.88) for motorcycles to MYR �8 (USD 8.�4) for private cars, differentiated by the nature of travel (business, social, or tourism purposes), would have to be imposed to deter private transpor-tation usage.
Malaysia needs to learn from the experience of countries that have implemented congestion charging but localize the process to suit local conditions. In particular, public acceptance, viable alternative travel modes, and the hypothecation of reve-nue are vital ingredients to make congestion charging successful.
National Road PricingOne policy direction that should be seriously contemplated by the government includes road pricing on a national basis as a way for charging for external costs such as congestion, accidents, and environmental impacts. It is generally accepted that, in line with Pigouvian principles, road pricing should be based on marginal costing principles. In the UK, the government has argued that, in the long run, marginal cost is equivalent to fully-allocated cost, where capital costs were inclu-ded but congestion was not (Nash �007). While a full discussion of the theoretical debates surrounding this issue is beyond the scope of this paper, road pricing differentiated on fuel efficiency can be used to influence market behavior. For example, alternative-fuel vehicles can get a lower kilometerage charge, while heavy fuel consumers can be penalized.
To make road pricing more palatable to the public, the revenue raised from road pricing charges can be channelled towards further research into more environ-mentally-friendly vehicles in terms of fuel efficiency and emissions level as well as
Journal of Public Transportation, Vol. 11, No. 3, 2008
5�
improvements in the public transportation system. On an individual level, road pricing monies can even be used to provide financial incentives to individuals to buy environmentally-friendly vehicles which would in turn encourage manufacturers to move into developing greener auto technology. Initially, simple distance charges differentiated on engine capacity can be introduced. Simple distance charges do not require sophisticated technological support and can be introduced relatively quickly and easily. In the long term, to further influence travel behavior, road pricing also can be differentiated based on the time of day, distance travelled, congestion levels, and location. However, this would require Global Position System (GPS) antennas as well as accompanying hardware and software, which are still prohibitively expensive. However, given time and with the gradual reduction in prices in technological gad-gets, road pricing can be implemented relatively easily and is one of the safest bets in tackling the issue of car use and its associated negative aspects.
ConclusionIt is evident that government policies still encourage private car ownership when a longer-term view should be taken, especially the logical inference that there is a physical upper limit to the number of cars that roads can take. To change the policy slant towards that of sustainable transportation, especially in de-empha-sizing the car and conversely emphasizing public transportation, would require tremendous political will and public acceptance.
A phased introduction towards sustainable transportation using the recommen-ded TDM-based, five-pronged approach is strongly advised. The spirit of current initiatives towards cleaner vehicles and fuels could be retained and further enhan-ced by the encouragement of a shift to shorter and more efficient trips as well as travel by more environmentally-friendly forms of transportation.
A gradual, incremental implementation starting with the way road tax and car insurance are charged is preferred, as opposed to a “big bang” approach of a full-on system. Motorists would be given time to adjust to the idea of eventual full accountability for the cost of travel. Technology and policy needs constantly evolve and, over the longer term, a regime change towards full travel demand management via national road pricing is possible.
The payoffs are spectacular and run the gamut from environmental to economic gains, including reduced traffic congestion, road and parking facility cost savings, reduced accident and fatality rates and decreased pollution emission levels.

53
Travel Demand Management: Lessons for Malaysia
References
Abdul-Aziz, A.R. �006. Privatisation of fixed-rail transit systems: A case study of Malaysia’s STAR and PUTRA. Canadian Journal of Civil Engineering 33(7): 846-853.
Abidin, A.Z., H. Mansor, R.D.R. Ahmad, R. Abdullah, and I. Chung. �004. The esti-mation of carbon dioxide emissions from the transport sector in Malaysia (�000 – �0�0) for National Institute for Environmental Studies 9th Asian Pacific Integrated Model (AIM) Workshop. Kuala Lumpur, Malaysia. Acces-sible at: http://www-iam.nies.go.jp/aim/AIM_workshop/9thAIM/Session6/AIM-Mar’04.pdf. Accessed November �0, �007.
Bunnell, T., P.A. Barter, and S. Morshidi. �00�. City profile Kuala Lumpur Metro-politan Area: A globalising city-region. Cities �9(5): 357-370.
Dargay, J., and D. Gately. �999. Income’s effect on car and vehicle ownership, worldwide:�960–�0�5. Transportation Research Part A: Policy and Practice 33 (�): �0�-�38.
Department of Statistics Malaysia. �006. Compendium of Environment Statistics: Malaysia �006. Putrajaya, Malaysia: Percetakan Nasional Malaysia Bhd.
Economic Planning Unit Malaysia. (�006). Ninth Malaysia Plan �006-�0�0. Putra-jaya Malaysia: Economic Planning Unit. Accessible at: http://epu.jpm/my/MYR9/html. Accessed November ��, �007.
Gakenheimer, R., and C. Zegras. �004. Sustainable Mobility Project (SMP), �004 drivers of travel demand in cities of the developing world: A synthesis of eight case studies. Geneva, Switzerland. World Business Council for Sustainable Development (WBCSD). Accessible at: http://www.wbcsd.org/web/publica-tions/mobility/mobility-appendix.pdf. Accessed November �5, �007.
Gardner, B., and C. Abraham. �006. What drives car use? A grounded theory analy-sis of commuters’ reasons for driving. Transportation Research Part F 10(2007): 87-�00.
Gwilliam, K., K. Kojima, and T. Johnson. �004. Reducing air pollution from urban transport. The World Bank. Accessible at: http://www.airimpacts.org/docu-ments/local/ReducingAirPollutionUrbanTransport.pdf. Accessed November �7, �007.

Journal of Public Transportation, Vol. 11, No. 3, 2008
54
Johansen, F. �989. Toll road characteristics and toll road experience in selected South East Asia countries. Transportation Research Part A: General �3(6): 463-466.
Litman, T. A. �003. The online TDM Encyclopedia: Mobility Management Informa-tion Gateway. Transport Policy �0(3): �45-�49.
Litman, T.A. �007. Evaluating rail transit benefits: A comment. Transport Policy �4 (�007): 94-97.
Litman. T.A. (�007a). Win-win transportation solutions: Mobility management strategies that provide economic, social and environmental benefits. Victo-ria Transport Policy Institute. Accessible at: http://www.vtpi.org/winwin.pdf. Accessed November �5, �007.
Meyer, J., J. Kain, and M. Wohl. �965. The Urban Transportation Problem. Cam-bridge, USA: Harvard University Press.
Meyer, M. �997. A Toolbox for Alleviating Traffic Congestion and Enhancing Mobil-ity. Washington DC: Institute of Transportation Engineers.
Mohamad, J., and A.T. Kiggundu. �007. The rise of the private car in Kuala Lumpur, Malaysia: Assessing the policy options. IATSS Research 3�(�): 69-77.
Nash, C. �007. Road pricing in Britain. Journal of Transport Economics and Policy 4�(�): �35-�47.
Nor, N.G., and A.R. Nor. �006. Predicting the impact of demand - and supply-side measures on bus ridership in Putrajaya, Malaysia. Journal of Public Transporta-tion 9(5): 57-70.
Oxford Business Group. �006. Emerging Malaysia �006. Oxford Business Group. Accessible at: http://books.google.com/books?id=opMLipEWVO0C&pg=RA2-PA106&lpg=RA2-PA106&dq=fuel+subsidy+malaysia+2006&source=web&ots=BHt7hoNHrC&sig=e-eOw7cOv8yB2Aqukgce6cZR_lI#PRA2-PA107,M1 . Accessed October �5, �007.
Phang, S.Y. �006. Urban rail transit PPPs: Risk assessment of recent strategies. First International Conference on Funding Transportation Infrastructure, Canada. Accessible at: http://www.uofaweb.ualberta.ca/ipe/pdfs/TransportPaper-Phang.pdf.

55
Travel Demand Management: Lessons for Malaysia
Pucher, J., H. Park, and M.H. Kim. �006 Public transport reforms in Seoul: Innova-tions motivated by funding crisis. Journal of Public Transportation 8(5): 4�-6�.
Riberio, S.K., S. Kobayashi, M. Beuthe, J. Gasca, D.S. Lee, Y. Muromachi, D.J. Newton, S. Plotkin, D. Sperling, R. Wit, and P.J. Zhou. �007. Transportation and its infra-structure. In B. Metz, O.R. Davison, P.R. Bosch, R.M. Dave & L.A.Meyer (Eds.), Climate Change 2007: Mitigation. Contribution of Woking Group III to the Fourth Assessment Report of the Intergovernmental Panel on Climate Change. Cambridge, UK and New York, USA: Cambridge University Press.
Spencer, A.H., and S. Madhavan. �989. The car in South-east Asia. Transportation Research A �3(A): 4�5-437.
Stopher, P.R. �004. Reducing road congestion: a reality check. Transport Policy ��: pp.��7-�3�.
Victoria Transport Policy Institute. �007. Road pricing: Congestion pricing, value pricing, toll roads and HOT lanes. Online TDM Encyclopedia. Accessed at http://www.vtpi.org/tdm/tdm35.htm. Accessed October 3�, �007.
Washbrook, K., W. Haider, and M. Jaccard. �006. Estimating commuter mode choice: A discrete choice analysis of road pricing and parking charges. Trans-portation 33: 6��-639.
About the Authors
Jeyapalan Kasipillai ([email protected]) is a Professor and Chair of the Malaysian Business Unit at Monash University Sunway Campus. He completed his doctoral thesis at the University of New England, Australia and master’s degree at the University of Stirling, Scotland. He is a fellow member of both the UK Chartered Institute of Secretaries and the Malaysian Institute of Taxa-tion, a member of the Editorial Committee of e-Journal of Tax Research, Australia, and was appointed by Tax Notes International, Fairfax, USA in �004 to be its official correspondent for Malaysia.
Pikkay Chan ([email protected]) is a Graduate Research Assistant at the Malaysian Business Unit (MBU) of the School of Business, Monash University Sunway Campus Malaysia. She is a graduate of the Association of Chartered Certified Accountants, UK and holds a Master in Computing from the University of Kent. UK.

Journal of Public Transportation, Vol. 11, No. 3, 2008
56

57
More Passengers and Reduced Costs
More Passengers and Reduced Costs—The Optimization of the
Berlin Public Transport NetworkTom Reinhold, A. T. Kearney GmbH
Abstract
The Berliner Verkehrsbetriebe (BVG) has succeeded in increasing its revenue by more than 22 percent in three years. This was made possible by restructuring the transportation network as part of an integrated marketing strategy. Traffic simula-tions demonstrated that improving frequency on the main lines could shorten travel times and attract many new customers to public transportation. In addition, lines outside the core network with little utilization were identified where service could be reduced to achieve significant cost savings with only a slight decline in the number of passengers. In 2004, new premium products, the MetroBus and MetroTram, were introduced; in 2006, their services were improved yet further. Today, the MetroBus and MetroTram run on the 26 most important lines (in addition to the subway), 24 hours a day at very short intervals. They are intensively marketed, and customers can understand the Metro network almost as well as they can the subway network. The new MetroBus and MetroTram products have achieved great success, with passenger volume on some lines rising by more than 30 percent. Overall, the BVG has gained more than 21 million new trips per year and reduced its annual operating costs by more than 9.5 million euros.

Journal of Public Transportation, Vol. 11, No. 3, 2008
58
IntroductionAll public transportation companies in Germany depend on various types of subsidies to provide their range of services because ticket fares alone do not cover operational costs. Budget constraints in public funding over the past several years have reduced the level of subsidies for public transportation in Germany, and prompted demands for considerably greater efficiency in public transport opera-tions.
The transportation companies have succeeded in raising efficiency levels over the past several years; they are covering expenses to an increasing degree and thus reducing their need for subsidies. In general, they have achieved these results through cost-saving efforts such as cutting services, streamlining organizational structures, and improving process efficiency. The companies have found it much more difficult, however, to improve results by increasing revenues.
The BVG (Berliner Verkehrsbetriebe) is also currently undergoing a restructuring process. When the BVG (West Berlin) and the BVB (East Berlin) merged in the early �990s, the company had a combined total of more than �8,000 employees. Only about ��,000 of them remain today. These advances on the cost side, how-ever, have been met with only moderate increases or stagnation in ticket revenue since the late �990s. In �00�, ticket revenue decreased for the first time. As a consequence, BVG management took a number of steps in early �003 to increase revenues from ticket sales. These steps focused on integrated marketing with the aim of utilizing all four relevant mechanisms—new services, fare structures, adver-tising, and sales—and on the customers themselves, namely on what services they need and on how much they are prepared to pay for them.
Based on this approach, BVG management launched the BVG �005 Plus project in �003 to optimize services. By December 3�, �004, the greatest change in timetables in the history of the BVG had taken place. In the process, the company also intro-duced two new products, MetroBus and MetroTram, initially as daytime services and, later, during the night as well.
This project represented another ground-breaking activity for the BVG. For years, services had largely been determined on the basis of optimizing operations. But now, the BVG undertook a comprehensive, corridor-by-corridor analysis of all traffic patterns in the city and of the strengths and weaknesses of the public trans-portation system. Moreover, customers and media representatives were included in the planning, not only to increase acceptance for the project, but also to incor-porate as many ideas and suggestions for improvement as possible.

59
More Passengers and Reduced Costs
Despite the strong wish to orient services toward customers, the project faced the additional challenge of having to cut operations and therefore costs to a signifi-cant degree at the same time. The ambitious aim of the project, namely to increase the number of customers by � percent while simultaneously cutting operations by 3 percent, was frequently described as akin to squaring a circle. The fact that it nevertheless succeeded, and with tight deadlines as well, is due to an extraordinary effort put forth by many BVG employees, especially from the planning offices of the central marketing department, the bus and tram divisions, and public rela-tions, as well as from external engineering offices, consulting firms, and agencies. Not without pride, we note that comparable projects in other German metropoli-tan centers faced less daunting conditions. Hamburg, for example, was not forced to cut costs on introducing its Metrobuses, and Munich had considerably more time to incorporate input from its residents and district representatives.
The new daytime schedules went into effect in December �004. In May �006, the MetroLines, which had operated only during the day until this time, started �4-hour-service; these new lines are now available �4 hours a day, 7 days a week. This change was part of a general expansion of nighttime service that also included the metro (underground) system. Berlin thus took another step toward being “open around the clock.” Figure � presents an overview of the project plan.
In the beginning the planning process was analyzed to determine its strengths and weaknesses, and a target process was developed whose structure and agreed-upon milestones were designed to coordinate both the various BVG internal areas (mainly the central marketing department including both service development and marketing communications, the metro, tram, and bus divisions, central con-trolling, and workers’ representatives) and external partners (especially the Berlin State Senate as the authorizing agency, district offices and traffic commissions, the public transport federation, the S-Bahn [commuter rail company], passenger organizations, and the customers themselves). As it turned out, both internal and external resistance to such a process of change cannot be underestimated.
In three further stages of analysis, the BVG studied customer needs, competition between public transportation and individual cars in Berlin, and capacity utiliza-tion levels in its transport systems to systematically expand its existing databases, some of which were good, but others of which showed gaps. In planning nighttime services, it used a part-time matrix for the first time to determine demand.

Journal of Public Transportation, Vol. 11, No. 3, 2008
60
Figu
re 1
. Ove
rvie
w o
f Pro
ject
Pla
n* *Th
e im
ages
in th
is ar
ticle
are
ava
ilabl
e in
col
or. P
leas
e co
ntac
t the
aut
hor d
irect
ly.

6�
More Passengers and Reduced Costs
Factors in Selecting Transportation ServicesInnumerable studies have been done on what customers want from public trans-portation systems. Most of them, however, generate a comprehensive catalog of needs and conclude that customers are dissatisfied with virtually everything or that they see potential for improvement just about everywhere and that regular customers are even more critical than occasional customers. As far as company decisions go, these studies are usually not helpful because they offer no approaches for how best to utilize scarce resources. Instead, priority must be given to projects that improve services in such a way that they actually attract new customers, as opposed to only increasing the satisfaction of customers that the company already has anyway.
On the basis of the studies that it employed with different methodologies, the BVG therefore explicitly sought to identify the crucial commercial factors whose improvement could lead directly to an increase in the number of customers. The studies revealed that 80 percent of respondents desire short travel times, a result that far surpassed all other suggested ways of improving public transportation services in Berlin. The conclusion that travel time is the dominant factor may appear trivial, yet on closer examination it is astonishing how the other factors pale in comparison—including safety and cleanliness, which together accounted for only �� percent of total responses. Among other things, the fact that these criteria are currently adequately met reflects the BVG’s intention not to discour-age any customers from public transportation (which is not to deny that some customers would desire further improvements in these areas). The same is true for a virtually nonexistent willingness on the part of Berliners to pay more for a greater level of comfort. Although many customers would surely be pleased about fur-ther improvements in comfort, a sufficient level has already been achieved. More advances in comfort would therefore attract hardly any more customers.
The crucial factor of travel time comprises the entire journey from door to door, as compared to the alternative of driving a private car. The major constituent ele-ments in door-to-door public transportation service are the following:
• average speed of public transport vehicles
• intervals between vehicles (i.e., the amount of time spent waiting for the initial vehicle and any subsequent vehicles following transfers)
• number and/or necessity of transfers
• density of stations or stops (i.e., the distance from residence and destination to the nearest station or stop)

Journal of Public Transportation, Vol. 11, No. 3, 2008
6�
A very detailed study of these elements showed that the majority of respondents placed the highest priority on short intervals between vehicles. If faced with a choice between service running at very short intervals (�0 minutes or less) and a somewhat greater distance to the nearest station or stop (�0- to �5-minute walk) versus service running at longer intervals (�0 minutes) with a station or stop in the immediate vicinity, the overwhelming majority preferred the longer walk. The lines with the highest levels of customer satisfaction are those that run at intervals so short that customers do not even need to look at the timetable.
To attract new customers at the same level of resources, one must also consider cutting service on infrequently-used lines or stops and accepting the resulting slight decline in passenger volume to shorten intervals on well-frequented lines to �0 minutes or less. Customers will also accept up to two transfers if short intervals (or optimized connections) mean that they only have to wait for a short period of time (see Figure �).
Competitor AnalysisThe high importance that trip duration has on the choice of transportation is clear not only from the study results, but also from considering the actual modal split values on different corridors. A competitor analysis was performed based on traffic simulations that used many counts of adjusted, comprehensive spatial comparisons of travel times for public transportation versus private cars. The spatial units studied represented the traffic cells and fractions of traffic cells for the Berlin metropolitan area. The study was designed to compare the following for different subcells:
• changing levels of demand for transportation in general
• travel times for public transportation versus private cars
• market shares for public transportation
Traffic flows whose results exceeded certain ratios for the above points can be viewed as promising areas for acquiring new customers (i.e., as areas where there is a need for action). With around � million possible ratios, the BVG analysis there-fore focused on traffic flows that are large (high level of potential traffic consolida-tion), that currently have a high share of private car traffic, and that show relatively poor travel times for public transportation (see Figure 3 for example). Here, new customers could be induced to make the switch from private cars to public trans-portation by means of improved service such as new direct connections, acceler-

63
More Passengers and Reduced Costs
Figu
re 2
. Fac
tors
in S
elec
ting
Tra
nspo
rati
on S
ervi
ces

Journal of Public Transportation, Vol. 11, No. 3, 2008
64
ated transit, or shorter intervals. A relevant number of such ratios were found and used to plan concrete measures (see Figure 4).
Of course, there are many other reasons than relative travel times that influence the modal split, such as sociodemographic structures at the source and destina-tion areas, availability of private cars, and regional parking facilities. By far the clearest correlation, however, is found between the modal split and relative travel times. The following conclusions were reached:
• For door-to-door service, private cars are faster than public transportation on all high-demand corridors.
• Public transportation can achieve very high market shares of more than 80 percent as long as it requires no more than one and a half to two times as much time as private cars.
• Public transportation still retains a relatively high market share of around 30 percent (for “captive” users) even if it offers extremely poor travel times.
Capacity AnalysisWhereas the “top-down” competitor analysis was designed to yield primarily new customer potential for public transportation, a “bottom-up” capacity analysis was used to determine how well current service meets the demand and what if any potential for savings might be present. Capacity was calculated precisely in the form of seat kilometers divided by passenger kilometers expressed in percent, with standing room calculated on the basis of four persons per square meter of standing space. This means that when capacity utilization levels reach around 40 percent, all the seats are occupied and the carriage gives the subjective impression of being full. Capacity utilization levels of more 50 percent can occur during rush hour, but are not necessarily desirable from the perspective of comfort. By contrast, capacity utilization levels of under 5 percent are a clear indication of oversupply.
More precise considerations are, of course, needed to adjust capacity exactly to individual lines. Here, however, some general statements can be made using the example of the bus network (see also Figure 5).
• In overall terms, capacity utilization in the Berlin bus network shows con-siderable fluctuation. It averages around �7 percent, with some lines above 30 percent and many below �0 percent.
• Capacity utilization is high when buses serve axes with important feeder

65
More Passengers and Reduced Costs
Figu
re 3
. Cha
rlot
tenb
urg
Tran
spor
t Dis
tric
ts
(mor
e th
an 1
,000
trip
s pe
r da
y)
Journal of Public Transportation, Vol. 11, No. 3, 2008
66
Figu
re 4
. Mar
ket S
hare
s R
esul
t for
Pub
lic T
rans
port
vs.
Car

67
More Passengers and Reduced Costs
Figu
re 5
. Uti
lizat
ion
in B
us N
etw
ork
Journal of Public Transportation, Vol. 11, No. 3, 2008
68
functions for the rapid transit system or major arteries leading to the city center.
• Capacity utilization is low on many supplementary lines inside the Berlin S-Bahn (commuter rail) ring, as well as in the thinly populated outlying areas.
• During rush hour, capacity utilization is high, as expected. The lowest levels are in the early morning hours of the weekends.
Strategic GuidelinesResults gained from the three different analysis modules—customer demand, competition, and capacity—were used to develop strategic guidelines for network planning, which, in turn, had to be approved both internally and by the city gov-ernment. The public transportation network was more precisely differentiated, namely into a core network whose services were improved, and a supplementary network that ensures minimum service. The core network of the commuter rail (S-Bahn) and metro (U-Bahn) systems was expanded to include the newly created MetroLines, which are not to be confused with underground metro service but rather consist of buses and trams that serve major traffic axes. MetroLine service was improved such that customers can use these lines as easily as the underground metro lines (i.e., without having to know the timetables). In addition,
• They run throughout the day at short intervals of no more than �0 min-utes.
• Their lines follow major traffic axes in straight lines wherever possible.
• Their links are designed to create a “spider web” similar to that of the com-muter rail (S-Bahn) and metro (U-Bahn) system.
The MetroLines represent a spatial expansion of the core network into the outly-ing districts of the city, and their service also includes tangential connections. Viewed in terms of the usual catchment areas surrounding stations and stops, the new core network consisting of the commuter rail, underground metro, and new MetroLines now covers 87 percent of the residents of Berlin. The commuter rail and underground metro systems alone previously provided only slightly more than 70 percent of the population with premium transportation services.
The supplementary network complies with the directives of the municipal public transportation plan. It continues to ensure that 97 percent of all Berlin residents

69
More Passengers and Reduced Costs
live within 300 meters of a bus stop or within 600 to �,000 meters of a commuter rail or metro station. In the supplementary network, buses run at intervals of �0 minutes or less and on high-volume lines at intervals of �0 minutes or less. Although some reductions occurred in service here, almost all of these affect peripheral times of day or corridors that are sufficiently covered by other high-grade lines. Only a few lines were entirely discontinued, primarily those that for historical reasons ran parallel to the commuter rail (S-Bahn).
This hierarchical structure of the transportation network, which enables service to be adapted much more closely to actual traffic flow patterns, has made it possible to provide a higher frequency for 37 percent of Berlin’s residents, thus improving service. Service remained essentially the same for 58 percent of residents. Only 5 percent of the city’s residents were faced with reductions in service, which never-theless remained at acceptable levels in the eyes of the BVG. As expected, how-ever, when the changes were made, the 5 percent of residents whose service was reduced were considerably more vocal in their reactions than those who benefited from the changes.
Communicating with CustomersThe BVG broke new ground via a number of different channels in its dialog with customers (on-site, Internet, media), which was also designed to help customers understand the reasons for the changes and to neutralize potential criticism at an early stage. Considerable resources were devoted to communications and to strengthening customer loyalty. This was money well spent from today’s perspec-tive because this “partial democratization” of the process minimized the risk of planning errors from the start. Customers could inform themselves about the overall project as well as cast votes for individual lines via surveys, on the Internet, and at public events.
Another major element in the dialog with customers consisted of detailed on-site information about the changes in the form of “micromarketing.” Sixty different flyers with a total circulation of �.� million were printed and distributed to house-holds as well as to information stands, sales offices, and contact points such as shops. It turned out, however, that the expectations raised by this BVG campaign could hardly be met—complaints came from households that did not receive fly-ers, while the innovative new sales strategy of using small neighborhood shops was ignored by the media.

Journal of Public Transportation, Vol. 11, No. 3, 2008
70
The micromarketing campaign was criticized, and justifiably so, for not present-ing a sufficiently clear overview of all relevant information. Further criticism was directed at the belated distribution of the timetables, which were not ready until the very day that service changed. This tardiness was due in large part to the fact that the Berlin State Senate stipulated last-minute modifications as part of its approval process. In fact, the BVG did not actually receive its legally-required authorization of the lines until one day before the scheduled change in service.
As far as the customers are concerned, the MetroLines fulfill their promise of simplifying service. Just like the rapid transit system, most customers do not have to study the timetables anymore, or for that matter even look at them. This prod-uct also improves orientation within the enormous network of the Berlin urban area. Trains and MetroLines can be used for long distances and to reach major destinations, while “normal” bus and tram lines, ferries, demand-based services, and nighttime lines provide finer meshed coverage and take customers to their precise destinations. The “always there” promise provides not only spatial orienta-tion but also a clear commitment to temporal coverage. The underground metro and MetroLines offer reliable service at nonpeak periods of the day and at night to customers who at these times are generally less familiar with the network and timetables. Nighttime service thus plays a crucial role in upholding the promises made by the new product and service network. It was redesigned in May �006.
Nighttime ServiceThe historical origins of nighttime service are rooted in the need to bring BVG staff to their depots and terminal stations before the start of (daytime) operation, and to take them home again after service stopped at night. Thus, nighttime service was completely different from its daytime counterpart because the two networks had largely different destinations as well as customers. Although the original night-time network underwent many changes over subsequent decades, it remained very different from daytime service. Yet the demand for nighttime service has now become much more similar to that for the day. Mobility in the night is now marked by more customer groups than before. While nighttime mobility used to be mainly the province of the above-mentioned transport staff as well as shift workers in industry, public utilities, and hospitals, it now includes more customer groups and transport purposes. New types of jobs across a broad range of service sectors as well as the widespread use of these services account for a large part of

7�
More Passengers and Reduced Costs
this growth, in addition to expansions in leisure activities and tourism. Mobility for the purpose of shopping has now also extended into the night in Berlin.
The BVG’s analysis of nighttime transportation showed only a slightly lower share of the market than for the day. Nighttime traffic has increased, and also shows a greater distribution over most of the central parts of the city. More pronounced traffic flows are evident here than before, with affinities for public transporta-tion.
Based on these conclusions, the new design for the nighttime network included �4-hour service for the MetroLines, �4-hour underground metro service on week-ends, and better connections.
When the new timetables went into effect in May �006, they also included connec-tions to the new Berlin Central Train Station as well as reductions in service for the early hours of the weekends. The MetroLines now run �4 hours a day, 7 days a week (see Figure 6). From 6:00 A.M. until 9:00 P.M. they run at intervals of �0 minutes or less (some at intervals of 3⅓ or 5 minutes). From 4:30 to 6:00 A.M. and from 9:00 P.M. to ��:30 A.M., they run at intervals of �0 or �0 minutes. During the nighttime period from ��:30 to 4:30 A.M., the MetroLines run at intervals of �5 or 30 minutes. The underground metro now runs during the night on all lines at �5-minute inter-vals, although only on Fridays, Saturdays, and before holidays. On weekday nights, the metro trains are replaced by bus lines that serve the same lines and stations. Connections, which had already been coordinated by a computer-supported sys-tem, have been increased in number and more clearly publicized, such as in the BVG’s public transportation atlas, which is issued at regular intervals.
Around 90 percent of the BVG’s customers now note that the same lines they use during the day also run at night. The BVG is therefore anticipating mutual reinforcement between night and day (i.e., greater use of public transportation during the day or night is expected to encourage a higher average number of trips for individual customers).
More Customers Mean Higher RevenuesAll in all, the BVG views its BVG �005 Plus project as a complete success, and thus it appears that the circle has indeed been squared (see Figure 7). This project has enabled the BVG to reduce the annual volume of its operations by 4 million kilo-meters, with most of these savings taking place in the bus division. This figure is lower than the original target for the project, because objections by residents and

Journal of Public Transportation, Vol. 11, No. 3, 2008
7�
Figu
re 6
. Met
ro N
etw
ork
Ove
rvie
w

73
More Passengers and Reduced Costs
municipal authorities meant that not all the money-saving measures could be implemented. Yet it still enabled a considerable reduction in operations that has resulted in savings of 9.5 million euros per year, as well as an increase of �4 mil-lion new trips—or � percent of total demand (see Figure 8). Moreover, it has also led to greater revenues for other companies, especially the S-Bahn Berlin GmbH (commuter rail), which, without changing its own services, has benefited from improved feeder lines and the elimination of parallel bus lines.
Passenger counts carried out over the entire BVG network in �005 and �006 to assess the changes in demand show that the anticipated increase in passenger volume has in fact taken place. In terms of development, the MetroLines have proven to be especially attractive. Not only has the number of customers shown a clear increase where service intervals were shortened, but the largely unchanged lines have also gained customers thanks to enhanced marketing of the core net-work and the product promise of the MetroLines. Ticket revenues have also risen as expected, which indicates that the increased number of rides is due in fact to newly acquired customers as opposed to more intensive use of monthly passes.
These figures as well as several other effects enter into the BVG’s annual accounts of revenue and passenger volume. But still other effects, such as fare hikes, counter these positive results by lowering the number of customers. In a study for the year �005, the BVG performed a detailed investigation of these different effects and determined their quantitative outcomes. With respect to ticket revenues, two negative effects were met by seven positive effects, including optimized service. Regarding passenger volumes, four negative effects (including the fare hikes) faced three positive effects, also including optimized service.
Berlin’s public transportation services are now entering a phase that will not feature large-scale changes, during which both current and potential customers can become better acquainted with the newly designed network. The BVG will support this process with the help of targeted product information, advertising, and enhanced sales activities. In view of developments, such as those in Hamburg where the MetroLines continued to attract new customers several years after their introduction, the BVG hopes to enjoy increasing passenger volumes as well as revenues well after the project is concluded.

Journal of Public Transportation, Vol. 11, No. 3, 2008
74
Figu
re 7
. Con
firm
atio
n of
Pla
nnin
g

75
More Passengers and Reduced Costs
Figu
re 8
. Tot
al C
ontr
ibut
ion
to R
estr
uctu
re P
.A.

Journal of Public Transportation, Vol. 11, No. 3, 2008
76
About the Author
Tom Reinhold ([email protected]) studied transportation planning and operations from �989 to �99� at the Technical University Berlin. He earned his Ph.D. from the Institute for Transport Economics and Transport Policies. As a visiting scholar he studied at the Institute for Transportation Studies at the University of California in Berkeley. From �996 to �999, he worked at the research division of the BMW Corporation. In �999, he joined Roland Berger Strategy Consultants where he became senior project manager in the field of public transportation. From �003 to �007, Dr. Reinhold was executive director of the Berliner Verkehrsbetriebe (BVG) with responsibility for the marketing division, which includes corporate planning for the transportation network, fare and ticket structures, marketing communications, and sales. The findings of this article are derived from this period. In November �007, Dr. Reinhold joined A. T. Kearney as principal, where he is responsible for the railway and public transport business in Central Europe.

77
Smart Growth and Transit-Oriented Development at the State Level
Smart Growth and Transit- Oriented Development
at the State Level: Lessons from California, New Jersey,
and Western Australia
John L. Renne, University of New Orleans
Abstract
The states of California, New Jersey, and Western Australia encourage smart growth through the employment of transit-oriented development (TOD). This article docu-ments each state’s approach and highlights the importance of interagency coopera-tion at the state-level and intergovernmental cooperation between state and local governments. This article discusses the importance of state government participation in the planning and creation of policy to facilitate TOD and recommends elements for a model state TOD program.
IntroductionTransit-oriented development (TOD)—compact, mixed-use, and pedestrian-friendly precincts around transit stations—is an increasingly popular strategy for encouraging smart growth in both Australia and the United States. California, New Jersey, and Western Australia have implemented policies and programs that facilitate intra- and intergovernmental cooperation to promote TODs. This article

Journal of Public Transportation, Vol. 11, No. 3, 2008
78
describes the policies in each state and discusses the importance of state govern-ment leadership for promoting smart growth and creating TODs.
Similarities and Differences Between California, New Jersey, and Western AustraliaA comparison between planning in different states within America and between the United States and Australia must acknowledge both similarities and differ-ences. The state government of Western Australia is based on the parliamentary system unlike the state governments of California and New Jersey. While this structural difference may seem significant, transportation planning decisions in both Australia and the United States are typically determined by bureaucrats working for state transportation departments in ccordination with elected offi-cials, while land-use decisions are made by local councils. Unlike state powers in America, the Western Australia Planning Commission (WAPC) has the right to override local land-use decisions, yet this power is seldom used because of a strong belief in local decision making. An example of this is a recent proposal to build a TOD on state- owned property in Claremont, Western Australia. The Public Transport Authority (PTA), a state agency, spent years planning a mixed-use TOD adjacent to a rail station on the agency’s property. A local election resulted in a town council that opposed the project. In the face of PTA’s intentions to push the project along, the Minister for Planning and Infrastructure and the WAPC would not overrule the local decision. The PTA, despite being a state agency, was treated like any other private sector developer.
Tables � and � provide a comparison across each of these states and urban areas within the states. As shown in Table �, California is the most populated state with �8 times as many people as Western Australia and 4 times as many people as New Jersey. It also has the largest rail network. The urban densities of major metropoli-tan statistical areas (MSAs) in California range from 3,369 people per square mile in San Diego to 4,7�7 people per square mile in the San Francisco MSA. The New York/Northern New Jersey MSA’s urban population density is 4,�03 people per square mile while Perth is the lowest with �,754 people per square mile. Although Perth has the lowest population and employment densities accompanied by high levels of car ownership and use, it has a relatively high proportion of jobs in the central business district (CBD) and a relatively high proportion of public transport usage per capita on rail (as shown in Table �). Western Australia’s population is not likely to match either California or New Jersey, but as the city grows, current

79
Smart Growth and Transit-Oriented Development at the State Level
Tabl
e 1.
Com
pari
son
of C
alifo
rnia
, New
Jer
sey,
and
Wes
tern
Aus
tral
ia
� U.S
. Cen
sus E
stim
ate–
�006
.� A
ustr
alia
n Bu
reau
of S
tatis
tics (
ABS
) Est
imat
e–�0
05.
3 U.S
. dat
a fr
om th
e �0
05 N
atio
nal T
rans
it D
atab
ase
(NTD
; htt
p://
ww
w.n
tdpr
ogra
m.g
ov/n
tdpr
ogra
m/)
. CR,
com
-m
uter
rail;
HR,
hea
vy ra
il/su
bway
; LR,
ligh
t rai
l.4 U
.S. d
ata
from
the
NTD
. Tot
al m
iles c
alcu
late
d by
div
idin
g th
e di
rect
iona
l mile
s in
half.
Aus
tral
ian
data
from
Tr
ansP
erth
web
site
and
a Po
wer
Poin
t slid
e fr
om P
eter
New
man
. 5 U
.S. d
ata
from
the
U.S
. Cen
sus b
ased
on
urba
n ar
ea d
ensit
ies f
or M
SAs i
n �0
00.
6 Ken
wor
thy
and
Laub
e’s a
nd th
e In
tern
atio
nal A
ssoc
iatio
n of
Pub
lic T
rans
port
’s M
illen
nium
Citi
es D
atab
ase
base
d on
dat
a fo
r �99
5. S
ince
�99
5, th
e go
vern
men
t of W
este
rn A
ustr
alia
has
bee
n en
cour
agin
g in
fill d
evel
op-
men
t with
a p
olic
y th
at 6
0 pe
rcen
t of n
ew d
evel
opm
ent s
houl
d be
infil
l and
40
perc
ent g
reen
field
; the
refo
re,
this
may
slig
htly
und
erre
pres
ent c
urre
nt p
opul
atio
n de
nsiti
es in
Per
th.

Journal of Public Transportation, Vol. 11, No. 3, 2008
80
Table 2. Comparison of Los Angeles, San Fransisco, San Diego, New York, and Perth
Source: Kenworthy and Laube’s and the International Association of Public Transport’s Millennium Cities database (data represents �995).
policies favor infill development and TOD. What remains a major question in all three states is whether smart growth efforts will make a noticeable shift away from automobile-based sprawling development.
The dominance of automobiles, low-density suburbs, and segregated land uses is common across the three states. These three states have been chosen in this comparison due to the nature of their state-government led process to facilitate

8�
Smart Growth and Transit-Oriented Development at the State Level
TOD. The departments of transportation in California and New Jersey and the Department for Planning and Infrastructure (DPI)� began a cross-agency dialogue in the late �990s/early �000s to facilitate TOD planning and policy. This article summarizes policy and planning outcomes from each of these efforts.
Smart Growth and TOD Planning at the State Level Urban rail is becoming a fashionable mobility alternative, especially in cities where no foreseeable solutions exist to paralyzing traffic congestion. The Economist reported that light rail ridership in the United States was up ��.� percent from �005 to �006. Salt Lake City saw a growth in light rail ridership of 39 percent during the same period; trains are running overcapacity (All aboard! �006). These trends, coupled with a growing market for New Urbanist neighborhoods, are making conditions ripe for TOD, although government regulations remain an obstacle. Levine (�006) argues that compact, mixed-use communities are illegal in most cities. Recent books, articles, and reports have focused on local and regional policies for facilitating TOD, but relatively few studies have looked at the role of the state government.
State TOD policy is critical because it can set a tone for regional and local policy. States have a vested interest in the success of TOD. According to the U.S. Census, in �003–�004, state government spending accounted for 74 percent of capital expenditures on roads and highways. Perhaps more surprising, states picked up �8 percent of transit subsidies across the United States. In total, state government spent more than $�.� trillion on passenger transportation across the United States. The situation is similar in Australia where state governments pay for the majority of passenger transportation infrastructure and services (Bureau of Transport and Regional Economics �003).
Developing a mixed-use, pedestrian-friendly precinct around train stations is not a new concept, but it is regaining popularity. Older cities in the United States and Australia first developed during the train and tram era, which took place from the �860s until the proliferation of the automobile during the �0th century (New-man and Kenworthy �999). Cities like Boston, Chicago, Melbourne, New York, Philadelphia, and Sydney still rely on the rail infrastructure created during that period. Today, older and newer cities alike in America and Australia are turning to transit and TOD as an alternative to sprawl, and as a way to encourage economic revitalization, community diversity, and travel alternatives. Transit-Oriented Devel-opment in America: Experiences, Challenges, and Prospects (Cervero et al. �004) studied TODs across the United States to determine effective polices. This volumi-

Journal of Public Transportation, Vol. 11, No. 3, 2008
8�
nous study reports on many public and private sector benefits of TOD. Under the right conditions, TODs yield higher shares of transit ridership compared to their surrounding regions (Cervero �994; Lund, Cervero, and Wilson �004; Renne �005). They also lead to higher land values closer to rail stations (Cervero et al. �004; Cali-fornia Department of Transportation �00�b). The New Transit Town: Best Practices in Transit-Oriented Development (Dittmar and Ohland �004) provides case studies of how local and regional TOD policies have been instrumental across the United States. This book discusses key issues such as zoning, financing, and parking. The Urban Land Institute’s Developing Around Transit (Dunphy et al. �004) covers much of the same ground but is written partially to inform the development and transit industries about how to better plan and capitalize on TOD. Dunphy et al. (�004) recommend �0 principles for developing around transit:
�. Make it better with a vision.
�. Apply the power of partnerships.
3. Think development when thinking about transit.
4. Get the parking right.
5. Build a place, not a project.
6. Make retail development market driven, not transit driven.
7. Mix uses, but not necessarily in the same place.
8. Make buses a great idea.
9. Encourage every price point to live around transit.
�0. Engage corporate attention.
A study funded by the U.S. Federal Transit Administration found that over the next �5 years, �4.6 million households, which represent one-quarter of all new households, could be looking for housing in TODs (Center for Transit Oriented Development �004). Another study found market demand for compact, mixed-use communities between �0 to 33 percent of households across America (Levine and Inam �004). The strong demand for the TOD lifestyle is perhaps an important reason that Emerging Trends in Real Estate rated TOD as the top real estate invest-ment prospect in �005 and �006. Because of increasing demand, fueled by a demo-graphic-shift that is favoring cities, land around train stations appreciates faster in growing markets and holds value in declining markets (Urban Land Institute and PricewaterhouseCoopers �005 and �006).

83
Smart Growth and Transit-Oriented Development at the State Level
When looking specifically at research focused on state governments and TOD policy, the literature is nascent. Transit-Oriented Development in America: Experi-ences, Challenges, and Prospects (Cervero et al. �004) discusses a few state TOD policies within its case studies, but the focus of the report is on local and regional policies. States play an important role in financing strategic and station-area plan-ning, infrastructure, and streetscape improvements. Other roles for state govern-ment include promoting regional planning and coordination across state agencies, setting goals to facilitate tax savings, encouraging environmental stewardship, creating funding programs and incentives, reducing regulatory and statutory bar-riers to land use, promoting public-private partnerships, and establishing pilot programs (Hersh �00� cited in Cervero et al. �004). Transit-Oriented Development in America found that four states have official TOD polices: California’s Transit Village Development Planning Act, Oregon’s Senate Bill 763 Vertical Housing Zone Bill, New Jersey Transit Village Initiative, and Maryland Transit Administration’s program to fund TOD across the state. The Oregon bill authorizes tax abatements to infill medium- and high-density housing near rail stations. The Maryland Transit Administration provides substantial support for TOD, but despite being a state agency, it functions as a transit agency (Cervero et al. �004).
Transit Villages in California: Progress, Prospects, and Policy Reforms (Cervero �998) provides an analysis of state TOD policies in California. It summarizes interviews with planners into reasons the Transit Village Development Planning Act of �994 failed to make much of an impact—the policy lacked funding and incentives for the application of Transit Village plans in California. As discussed below, California has taken strides to encourage TOD since this report, although funding remains a persistent problem.
The Role of State DOTs in Support of Transit-Oriented Development (Cambridge Systematics �006) focuses specifically on state departments of transportation (DOTs). They found that DOTs in California, Florida, Maryland, Massachusetts, New Jersey, Pennsylvania, and Washington, D.C. are proactively involved with TOD, while DOTs in Colorado, Illinois, Minnesota, Oregon, and the State of Washington are implementing “other TOD-supportive activities.” Not surprising, they found that many states have been reluctant to become involved with TOD because they view land-use planning as a function of local government, although as states increasingly become interested in smart growth, they are looking for ways to work in partnership with local governments on coordinating transportation and land-use policies. Louisiana, for example, is in the process of evaluating a new

Journal of Public Transportation, Vol. 11, No. 3, 2008
84
state planning office, which would seek to curb sprawl and promote infill develop-ment coordinated with transportation infrastructure.
A report by the American Planning Association (APA), Planning for Smart Growth: 2002 State of the States (Johnson et al., �00�), found that one-quarter of states in America had implemented moderate to substantial comprehensive planning reforms in support of smart growth. They also found bipartisan support, as smart growth executive orders issued from �99�–�00� were evenly divided between Republican and Democratic governors. Only �3 states have not attempted to encourage smart growth. The U.S. Environmental Protection Agency’s (EPA) online database lists smart growth policies by state. This database includes local, regional, and state policies. Table 3 shows state governments that have adopted smart growth policies, by type, as reported by the U.S. EPA.�
Table 3. State-Level Smart Growth Policies by State and Category as Reported by the U.S. EPA
Source: U.S. Environmental Protection Agency �005.�. Categories are defined by the U.S. EPA. �. The comprehensiveness of the U.S. EPA database is questionable. Some states, such as New Jersey,
have policies to promote compact building design, directing development toward existing com-munities, and policies in other categories, but they were not included in the U.S. EPA database.
According to the U.S. EPA, encouraging open space preservation is the most popular category of smart growth policy among state governments. Promoting development in existing communities also ranked high. This category is broadly defined and includes a variety of policies such as encouragement for civic buildings

85
Smart Growth and Transit-Oriented Development at the State Level
in cities and towns rather than in undeveloped areas. It also includes brownfield and greyfield cleanup. Promoting a variety of transportation choices was the third most frequently cited smart growth policy of state government.
Smart growth and TOD literature does not adequately address state TOD policies, most likely because of the topic’s niche nature. While local and regional polices for encouraging TOD are paramount, state government has an important role in facilitating TOD both in Australia and the United States. State-level government in Australia typically engages more in land-use planning compared to American states, but both serve similar functions because ultimately local officials conduct land-use planning. The state’s role in Australia is similar to the role of metropolitan planning organizations (MPOs) in the United States. In both countries the state and/or MPO is responsible for considering the long-range impacts of transporta-tion infrastructure on land use. State government in both are responsible for the planning and implementation of transportation infrastructure, predominately highways. All American and Australian states have transportation departments that are responsible for spending millions on existing and new transportation infrastructure. States in both countries have regulatory agencies that deal with environmental, housing and finance, and economic development issues.
State-level land-use planning, including planning for TOD, is only conducted in a handful of states in America. California, Florida, Maryland, New Jersey, and Oregon, are five states that have the best-developed policies to constrain sprawl and encourage compact development in existing urban areas. In both Florida and Maryland, policies are broad and do not focus specifically on promoting TOD compared to California, New Jersey, and Oregon. In Australia, New South Wales, Queensland, South Australia, Victoria, and Western Australia all have a strategic policy for coordinating future development with rapid transit (Newman �005) but Western Australia has established a special committee to encourage TOD. The next section summarizes polices in California, New Jersey, and Western Austra-lia—three leaders in state-level TOD policy.
CaliforniaPopulation growth, traffic congestion, and expensive housing led to grassroots support for smart growth in California. The state has promoted the coordination of land use and transportation planning through several policies and programs (as shown in Table 4). The Community Based Transportation Planning grant program

Journal of Public Transportation, Vol. 11, No. 3, 2008
86
encourages compact and mixed-use development for projects that have a defined transportation objective, such as increasing transit ridership. The government also provides grants that reward communities that build housing and help reduce the jobs/housing imbalance. Localities receive bonuses when new units fulfill smart growth principles, such as being located in infill neighborhoods or close to retail and community services, or when units are affordable. The state provides techni-cal planning assistance to encourage TOD and in some instances, the Department of Transportation (CalTrans) provides partial funding for parking structures in TODs. This has been important to free up surfacing parking to allow for a higher and better use of the land, including the construction of buildings near transit sta-tions (as shown in Figures � and �).
The Transit Village Development Planning Act of �994 and Assembly Bill No. �3�0 (passed in �004) were intended to encourage TOD across the state. The earlier act allowed municipalities to create transit village plans around rail transit stations when they met a specific list of �3 public benefits. The act’s revision in �004 expanded tran-sit village plans to any transit facility, including bus, rail, or ferry. Furthermore, it loos-ened the language of the previous act by stating that the plan must include only 5 of �3 “demonstrable public benefits.” A study conducted in the late �990s found few planners knew about the act because it really did not provide any financial benefits as the state had allocated insufficient funding to support transit village plans or con-struction (Cervero �998). Tax increment financing (TIF) and land assemblage were originally part of the legislation but were removed before the bill’s passage. Because of the state’s rocky history with the misuse of redevelopment powers, legislators were hesitant to grant such powers to TODs unless they were within a blighted area, and in these situations, planners could rely on redevelopment law, thus leaving no need for a separate law for a transit village.3
A recent policy change by the State Treasurer’s Office has led to more opportuni-ties for affordable housing in TODs. Until recently, tax credits for affordable hous-ing were distributed though a lottery system. Under a smart growth strategy called The Double Bottom Line: Investing in California’s Emerging Markets (California State Treasurer �00�), the state began allocating tax credits on a point-based sys-tem. For developers to receive subsidies, they must choose sites close to transit, parks, and other amenities to receive the most points. An interview with Doug Shoemaker, deputy director of the Non-Profit Housing Association of Northern California (NPH), revealed his view on the program’s success:

87
Smart Growth and Transit-Oriented Development at the State Level
I’d say that absent such a policy, the pattern would be more diffuse in that you’d still see 80 percent of the affordable multifamily housing as infill housing, but perhaps not as transit accessible. I think it’s relatively easier for affordable housing to be financed as part of TODs in California as a result of these policies (Shoemaker 2004).
Figure 1. Compact Affordable Housing above Retail Next to the Train Station in Oakland’s Fruitvale Transit Village
Figure 2. Hazard Center Station TOD in San Diego

Journal of Public Transportation, Vol. 11, No. 3, 2008
88
Other programs, such as the Cleanup Loans and Environmental Assistance to Neighborhoods (CLEAN) Program, Downtown Rebound Planning Grants Pro-gram, and the State Community Development Block Grant Program (CDBG) encourage infill development. While many of these programs are used outside of TODs, these policies have proved useful for encouraging TOD. Another example of a smart growth policy well suited to TODs has been the Safe Routes to Schools Program, which funds crosswalks, waking and bicycling paths, and traffic calming in neighborhoods with schools.
Table 4. California’s Smart Growth Policies

89
Smart Growth and Transit-Oriented Development at the State Level
Table 4. California’s Smart Growth Policies (cont’d.)
Source: California Department of Transportation �00�b; Johnson et al. �00�; U.S. Environ-mental Protection Agency �005.
California’s Statewide TOD StudyThe Statewide Transit-Oriented Development Study: Factors for Success in California (California Department of Transportation, �00�a) recommended promoting TOD based on a variety of public benefits. The report found that TOD may reduce the
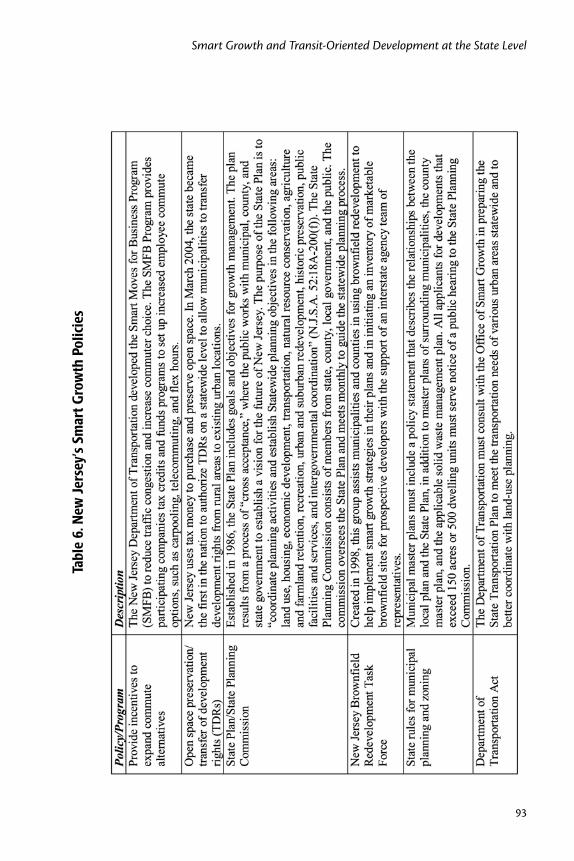
Journal of Public Transportation, Vol. 11, No. 3, 2008
90
rate of increase in vehicle miles traveled (VMTs) and increase households’ disposable income due to lower rates of automobile ownership and use. TODs could also lead to less air pollution and energy consumption, spur economic development, contrib-ute to more affordable housing, and decrease infrastructure expenditures (California Department of Transportation �00�a). The report concluded by recommending �4 strategies at the state policy level. These strategies are categorized into two main areas: (�) state policies and programs and (�) state funding for TOD planning and implementation. Table 5 lists the specific recommendations for each area.
Table 5. Specific Recommendations from California’s Statewide TOD Study 1. State Policies and Programs Strategy �A Improve coordination of local and regional land use and transportation planning
Strategy �B Use and sale of state land for TOD Strategy �C Facilitate local review and approval processes Strategy �C(�) Coordinate a study of California Environmental Quality Act (CEQA) processes in relation to TOD
Strategy �C(�) Improve models and analysis tools Strategy �C(3) Improve data of effects and benefits of TOD Strategy �D Technical assistance and information
2. State Funding for TOD Planning and Implementation Strategy �A Provide funding to local agencies to plan and implement TOD near major transit stations
Strategy �A(�) Funding for local TOD planning Strategy �A(�) Funding for local agency TOD implementation Strategy �A(3) Funding for TOD demonstration projects Strategy �A(4) State Housing Incentive Program Strategy �B Targeted tax-increment financing for TOD Strategy �C Financing for private sector development Strategy �D Use of state transportation funds for TOD Strategy �E Expand Location Efficient Mortgagea Program
Source: California Department of Transportation �00�a, pp. �53–�54.a Location efficient mortgage programs allow homebuyers near transit stations to take on larger
than conventional mortgages due to lower household transportation expenditures.
Local and Regional Smart Growth and TOD Policy in CaliforniaAlthough the focus of this article is on state TOD policy, local policies are also important for TOD implementation. Attention to TOD by the state government

9�
Smart Growth and Transit-Oriented Development at the State Level
in California has created a signal to local government and MPOs that they too should be working to better integrate land uses around transit stations.
Local and regional policies in California were the subject of two chapters (one each for Northern and Southern California) in Transit-Oriented Development in the United States: Experiences, Challenges, and Prospects (Cervero et al. �004). While many programs and policies were discussed, probably one of the most successful was the Bay Area’s Transportation for Livable Communities (TLC) program. Operated by the Metropolitan Transportation Commission (MTC), the region’s MPO, TLC plans to fund approximately $7� million in �007–�009 for smart growth projects, including TOD (Metropolitan Transportation Commission �004). Part of TLC, the Housing Incentive Program (HIP), subsidizes both compact and affordable housing in TODs. HIP promotes residential density near transit sta-tions and grants subsidies to cities and/or counties ranging from $�,000 to $�,000 per bedroom—the denser the project, the higher the subsidy. Affordable units also receive a $500 bonus per bedroom (Cervero et al. �004). The program has encouraged pedestrian-friendly and transit-oriented design by requiring that site plans include a sidewalk from the center of the development to the transit stop. Moreover, the subsidies have mandated that the development must be within one-third of a mile to a major transit station. According to the MTC, the HIP was established in late �000 to address two of the Bay Area’s biggest problems—traffic and housing shortages. From �00� to �004, the MTC set aside $9 million for the HIP (Cervero et al. �004).
In addition to the MTC, the Bay Area Association of Governments (ABAG) and the Bay Area Rapid Transit District (BART) have been active supporters of smart growth and TOD. In �003, BART released Transit-Oriented Development Guide-lines, which aimed to promote TOD along the Bay Area’s regional commuter rail lines. The guidelines have helped educate planners, local officials, and developers about the importance of quality site design and how to address issues associated with parking in TODs.
In San Diego, support for smart growth and TOD has been strong. A chapter in The New Transit Town: Best Practices in Transit-Oriented Development (Dittmar and Ohland �004) illustrates the success of San Diego’s Barrio Logan’s Mercado Project. The study described San Diego’s widespread support for TOD, which was one of the first cities in the United States to adopt TOD design guidelines in the early �990s. Successful TODs in the region have resulted from cooperation between
Journal of Public Transportation, Vol. 11, No. 3, 2008
9�
the City and County of San Diego, the Metropolitan Transit Development Board (MTDB), and the San Diego Association of Governments (SANDAG).
Even Los Angeles, which most people associate with highways and sprawl, has made strides toward smart growth and TOD. While some may view Los Angeles’s success with TOD as mixed, regional and local cooperation may promulgate a number of successful TODs in the future. The Southern California Association of Governments, Los Angeles’s MPO, has worked closely with the County of Los Angeles’s Regional Planning Department to prepare livable community and smart growth guidelines. The failure of some stations to implement a TOD may result from MTA’s4 decision to build the Blue Line along a corridor where land was inexpensive due to economic stagnation and an auto-dominated landscape.5
According to Cervero et al., “…TOD undertakings in these areas are often doubly challenged—they must overcome local zoning codes and surrounding land uses that favor the automobile while struggling to revive sometimes moribund real-estate markets” (Cervero et al. �004, p. 4�9). Planning for TOD should encompass a realistic assessment of local conditions, including economic feasibilities, although as demonstrated in Los Angeles, this does not always occur. Fortunately for TOD in Los Angeles, the recently constructed Gold Line from downtown Pasadena to Los Angeles has proven to be more successful.
New JerseyNew Jersey is a leader in smart growth and TOD policy. According to the Office of Smart Growth, the state traces its policies to �934 when Governor Moore appointed a temporary planning board and the first state planning act was passed.6 Contemporary policies for growth management have stemmed from the �970s, when Governor Byrne established the Governor’s Office of Policy and Planning, and from �986, when Governor Kean signed into law the State Planning Act creating the State Planning Commission and the Office of State Planning (renamed the Office of Smart Growth in �00�).
Table 6 describes some of the key smart growth policies in New Jersey. New Jersey has provided incentives for expanded employer-based commuting alternatives, the preservation of rural lands, and the transfer of development rights (TDRs). Plans in the Garden State have sought to gain “cross acceptance,” a process whereby municipalities, counties, and the state reconcile goals and objectives within the State Plan. The State Plan must address land use, housing, economic

93
Smart Growth and Transit-Oriented Development at the State Level
Tabl
e 6.
New
Jer
sey’
s Sm
art G
row
th P
olic
ies

Journal of Public Transportation, Vol. 11, No. 3, 2008
94
Tabl
e 6.
New
Jer
sey’
s Sm
art G
row
th P
olic
ies
(con
t’d.)
Sour
ce:
McG
reev
ey �
00�;
New
Jers
ey D
epar
tmen
t of C
omm
unity
Affa
irs �
005;
New
Jers
ey D
epar
tmen
t of T
rans
port
atio
n �0
05; U
.S.
Envi
ronm
enta
l Pro
tect
ion
Age
ncy
�005
.

95
Smart Growth and Transit-Oriented Development at the State Level
development, transportation, natural resource conservation, agricultural reten-tion, recreation, redevelopment, historic preservation, intergovernmental coor-dination and public facilities and services. The State Planning Commission is an intergovernmental body, including members from the public, which oversees the plan through monthly meetings to guide the New Jersey planning process.
A number of other policies and initiatives have been tied into the state’s planning process. The Brownfield Redevelopment Task Force is a state intraagency group that has assisted counties and local governments in redeveloping brownfields, which has helped to spur redevelopment. The State’s Municipal Planning and Zon-ing law has mandated that municipalities establish a policy statement about how their local plan relates to the State Plan, the county master plan, and the plans of surrounding local governments. It also requires that any development exceeding �50 acres or 500 dwelling units must notify the State Planning Commission and hold a public meeting.
The Department of Transportation Act, enacted in �99�, mandated that the New Jersey Department of Transportation consult with the Office of Smart Growth in coordinating transportation infrastructure with statewide land-use planning. In �00�, under Executive Order by Governor McGreevey, the Smart Growth Policy Council was established to ensure that all state agencies incorporate smart growth principles into their functional plans and regulations. It also sought to advance smart growth planning via legislation and administrative changes in transporta-tion, new schools, and brownfields.
Transit-oriented development in New Jersey is an old concept revived under new circumstances. Originally, commuter-rail suburbs built along a vast rail network serving New York City and Philadelphia allowed for the first generation of TODs in the Garden State. This lifestyle enabled people to escape living in the city while still accessing employment in urban centers. New Jersey has become the most urban-ized state in America, and one of the wealthiest (in terms of income per capita). Its strategic location on the Northeast Corridor, between New York City and Philadelphia, has produced a strong job base for the state; however, New Jersey is not entirely reliant on these two metropolises. Many employment opportuni-ties within the state have emerged, however, vast amount of jobs in the suburbs have led to deplorable traffic congestion. TODs (otherwise known in New Jersey as transit villages) offer residents an escape from congestion, but this time they have been returning from suburbia to traditional historic downtowns (as shown in Figure 3).

Journal of Public Transportation, Vol. 11, No. 3, 2008
96
Figure 3. Retail Below the Train Station in the South Orange Transit Village
The New Jersey Transit Village InitiativeEstablished in �999 by Governor Whitman, the New Jersey Transit Village Initia-tive is an interagency state program that promotes TOD. Today, there are �9 designated transit villages. Each transit village municipality works directly with the state government to promote compact mixed-use housing and economic development around its station. The New Jersey Department of Transportation (NJDOT) provides staff, directs the program, and manages a task force consisting of multiple state agencies that govern the initiative. In addition to the NJDOT, the Transit Village Initiative Task Force includes representatives from the following agencies: New Jersey Transit, Department of Environmental Protection (DEP), New Jersey Redevelopment Authority (NJRA), Department of Community Affairs (DCA; including representatives from the Office of Smart Growth and Main Street

97
Smart Growth and Transit-Oriented Development at the State Level
New Jersey), Economic Development Authority, Housing and Mortgage Finance Agency (HMFA), Commerce and Economic Growth Commission, and New Jersey Council on the Arts.
Members of the task force work directly with representatives from the local gov-ernments. Often, developers need approval from various state agencies, such as site remediation from the DEP or traffic impact from the NJDOT. Task force rep-resentatives, as well as the transit village coordinator from the NJDOT, work with local officials to expedite the development application approval process. Another benefit of being a transit village includes receiving preferential consideration for state grants. Transit villages also receive free technical assistance on planning and development issues. Each year, representatives from transit villages are invited to a forum where experts help local planners and officials overcome TOD imple-mentation obstacles. However, local transit village contacts are encouraged to call on task force members for assistance anytime during the year. This “direct line” between the state and local government makes the Transit Village Initiative unique when compared to other TOD programs in the United States.
For transit village designation, a municipality must meet specified criteria support-ing TOD when applying to the state. Applications are accepted during defined periods as dictated by the task force in conjunction with the governor’s office. According to the NJDOT, local governments interested in becoming a transit village must commit in writing to growth in housing, jobs, and population. They must have a train, ferry, or major bus station, and meet a number of smart growth criteria, including an “adopted land-use strategy for achieving compact, transit-supportive, mixed-use development within walking distance of transit. This can be in the form of a redevelopment plan, zoning ordinance, master plan or overlay zone” (New Jersey Department of Transportation �005). Other criteria include having vacant land near the station and a pedestrian- and bicycling-friendly urban environment.
The Alan M. Voorhees Transportation Center at Rutgers has been evaluating the success of the New Jersey Transit Village Initiative since �00�. This includes both process- and outcomes-based research. All of the reports, some of which have been written by this author, are available on the Alan M. Voorhees Transportation Center’s website.7

Journal of Public Transportation, Vol. 11, No. 3, 2008
98
Western AustraliaHope for the Future: The Western Australian State Sustainability Strategy (Govern-ment of Western Australia �003) discusses the need to manage urban and regional growth, revitalizing declining centers and suburbs, and integrating land use with balanced transport. The State Government of Western Australia also encourages TOD in Network City: Community Planning Strategy for Perth and Peel (Govern-ment of Western Australia �004). The public identified TOD as a key factor in managing future growth as part of the Dialogue with the City outreach effort. Forecasts predict a growth in the region from �.46 million people in �00� to about �.�� million by �03�.
The priority strategies of the Network City Action Plan seek to foster land use and transport integration to form a network city: a city based on a series of intercon-nected TODs. The plan aims to limit urban sprawl by providing 60 percent of required additional dwellings in existing urban areas and 40 percent in new growth areas. To achieve this goal, a holistic governmental approach will be required, including partnerships between the state and local government to set and achieve targets.
Town planning in Western Australia comprises strategic and statutory planning. Network City sets the strategic vision for the region. Also dealing with strategic planning, the TOD committee, formed in �004 and chaired by the Department for Planning and Infrastructure (DPI), has members representing the Public Transport Authority (PTA), TransPerth, Department of Housing and Works, Main Roads WA, Midland Redevelopment Authority, East Perth Redevelopment Author-ity,8 LandCorp, and the Western Australian Local Government Association. This cross-agency group replaced the Urban Rail Station Redevelopment Coordinating Committee, formed at the request of the Minister for Planning and Infrastructure in �00�. The role of the earlier committee was to provide a planning context for the PTA’s Building Better Stations capital works program. Since inception, the TOD committee has reviewed the TOD potential of every station on the network (including major bus-only centers) and prioritized TOD activity in accordance with the following six criteria:
�. Strategic significance of location (i.e., metro centers, university, or hospital)
�. Potential for maximizing ridership, through increased catchment of residential, business, or park and ride

99
Smart Growth and Transit-Oriented Development at the State Level
3. Infrastructure need (i.e., station or road upgrades)
4. Potential for socioeconomic benefits (i.e., community activity, public safety, jobs)
5. Partnership potential (i.e., local government or private sector willingness)
6. Development opportunities (i.e., significant public or private land parcels adjacent and potential number of dwellings)
The TOD committee has also established joint priorities across the agencies (and other parts of government) for infrastructure investment and TOD development. Having formed a close association with the Planning and Transport Research Centre of Western Australia to research and measure the effectiveness of TOD initiatives, the committee has instigated a program to review priorities regularly and to refine the selection criteria and future success measures. The committee has identified land to acquire through the Western Australian Planning Commis-sion (WAPC) to protect future TOD opportunities particularly around the new South West Metro rail line. They have also reviewed Development Control Policy DC �.6—Planning to Support Transit Use and Transit Oriented Development, a statutory mechanism to encourage TOD across Perth. Finally, the TOD committee is developing two tools: an assessment framework for prioritizing which stations should receive investment and redevelopment and a monitoring method, under development by this author, to gauge the success of TOD using a sustainability framework based on travel behavior; local economy; the natural, built, and social environments; and the policy context.
Statutory planning for TOD, as mentioned, is governed by Development Control Policy DC �.6, which has the following objectives:
• To promote public transport as an alternative to car travel and enhance mobility in the community, particularly for those who do not have access to a car.
• To ensure the optimum use of land close to railway stations, bus terminals, transport interchanges and corridors containing frequent public transport services for residential, commercial and other intensive uses.
• To maximize accessibility to rail and other public transport services, in particular high-frequency bus routes.
• To maximize accessibility by rail and other public transport to a range of work, shopping, and other urban activities.

Journal of Public Transportation, Vol. 11, No. 3, 2008
�00
• To facilitate safe pedestrian and cycle access to and from public transport services and a range of activities focused around them.
• To promote the development of a more sustainable urban form.
• To promote designs for public transport that minimize any adverse impact on local amenity arising from public transport operations.
• To ensure adequate consideration is given to public transport access by planning authorities, consultants, and developers.
With respect to TOD, DC �.6 is one of the most innovative policies ever written across Australia and the United States. It spells out, albeit in general terms, the need for local government to plan for high-density and mixed-use development around major transport nodes. DC �.6 encourages mixed land uses within stra-tegic regional centers, especially major office development, major retail facilities, high-density housing, sporting stadiums, and major entertainment venues. It also encourages increased residential densities and commercial and mixed uses within the TOD precinct of all major public transport infrastructure nodes. It specifies that medium- to high-density residential development should accommodate groups that are dependent on public transport, such as the elderly, the socioeco-nomically disadvantaged, and those with disabilities. The policy also encourages uses that allow for retail and office space and recreational, educational, and enter-tainment activities within TODs (as shown in Figure 4). The policy specifies against low-intensity commercial uses, such as showrooms and warehouses; low-density residential, public utilities, and drainage reserves; and large areas of undeveloped public open space in areas where TOD would be appropriate.
DC �.6 specifically calls for higher residential densities and reduced car parking provisions in town planning schemes9 to encourage walking, cycling, and use of public transport. It recommends the implementation of TOD through the update of town planning schemes. Local governments are required to update their town planning scheme once every five years, and through this process the WAPC, which uses DC �.6 to guide its decisions, may encourage them to plan for higher density and mixed-use development. DC �.6 also calls for a pedestrian-friendly, attractive urban environment with safe streets that have buildings adjacent to sidewalks, quality sidewalk design, and safe at-grade pedestrian crossings. DC �.6 also encour-ages the adoption of design standards in which the built environment contains shade trees, verandas, and pedestrian amenities. Street networks should be inter-connected and accessible within TODs and include a number of “destinations” such as cafés and neighborhood centers.
�0�
Smart Growth and Transit-Oriented Development at the State Level
Figure 4. Mixed Use Development above the Subiaco Train Station
In addition to DC �.6, a number of other policies also encourage the integration of land use and transport planning with the aim of achieving more compact and mixed-use development in Western Australia. The Metropolitan Region Scheme (MRS) identifies reserves for future rights-of-way. The Metropolitan Centres policy identifies a hierarchy of locations for retail and commercial development at regional and district centers.
Curtis (�999) concluded that Western Australia has innovative policies that work toward an integrated land use and transport system, but that these were not sup-ported by a uniform policy described in a central document. It could be argued that the Network City is attempting to achieve this, but until a plan for implemen-tation is released, this will remain uncertain.
The problem for TOD today is the same problem that Curtis identified in �999: “There appears to be a misalignment between strategies and actions, with little evidence of implementation that achieves balanced transport outcomes” (p. 349). The successes of redevelopment authorities in places like Midland and Subiaco unfortunately affect only a small percentage of new development, most of which is low density and automobile dependent. While Perth has a history of planning,

Journal of Public Transportation, Vol. 11, No. 3, 2008
�0�
much of it has perpetuated a car culture. The Network City’s goal of 60 percent infill development over the next 30 years will require substantial cooperation among the state government, local government, community, and private sector if TOD is to become more than a niche development product.
A study published by this author in �005 looked at TOD attitudes, obstacles, and opportunities in Perth. The research included a survey of all local governments with train stations in Perth, as well as 37 interviews with stakeholders from both the public and private sector. While the findings suggested the market for TOD has been strong and growing, one of the biggest obstacles for the private sector is that every new TOD requires reinventing the wheel. Developers often experience longer-than-usual delays through the development approval process compared to typical suburban developments. A lack of awareness and training among public employees responsible for various aspects of implementation was also identified as a problem. The report identified �0 recommendations for TOD in Western Australia:
�. Better marketing and branding for TOD.
�. A central transport and land-use strategy with targets.
3. A TOD code to guide the statutory planning process in TODs, including parking policy.
4. Community participation in local visioning processes and the streamlining of development applications where they conform with the local TOD vision.
5. Local and state government partnerships for TOD implementation.
6. A financing strategy, including an income stream to assist transit investment and land assembly.
7. State government facilitation of TOD education.
8. A plan for affordable housing.
9. Linking TOD to the development of new education, health, and other public buildings.
�0. A plan for tracking TOD outcomes (Renne �005).
ConclusionTOD planning in California, New Jersey, and Western Australia demonstrates simi-lar but different approaches. As discussed earlier, it is important to remember that

�03
Smart Growth and Transit-Oriented Development at the State Level
states do not typically have a role in land-use decisions. States control transporta-tion infrastructure dollars and thus can coerce and provide incentives to locals for “doing it right.” The role of MPOs was not addressed much in this article and more research is needed to determine if states would be better off passing money to MPOs to create programs like the TLC and HIP in the Bay Area. Even if states choose to activate MPOs more in planning for TOD, there is still an important role for state government in setting a policy framework for communication across state agencies and among lower levels of government in planning for TOD.
Although California took a legislative approach in the �990s through the adop-tion of the Transit Village Development Planning Act, the lack of financial support resulted in virtually no impact. Several non-TOD-specific tools have been useful, particularly the state treasurer’s decision to use a point-based system in allocat-ing affordable housing tax credits, which has resulted in more nonprofit housing developers locating developments in TODs. The �00� California-sponsored study demonstrated the main role of the state government—providing leadership, research, technical expertise, and a nexus for coordinating TOD at both the local and regional levels.
The state’s role in New Jersey, while different from California, has produced similar results. While the New Jersey Transit Village Initiative provides a little more fund-ing specifically for transit villages, as well as technical expertise for designated municipalities, the ultimate boon has been the hype of the program among local government and developers. Local governments want the credibility to call them-selves transit villages and developers with TOD expertise are beginning to focus on those communities. The transit village designation is a signal to the private sec-tor that compact, mixed-use development is welcomed and encouraged. Smart growth advocates are increasingly at odds with locally NIMBYs who are unwilling to accept any growth. The Transit Village Initiative in New Jersey is a model for local and state partnership to create smart growth zones, otherwise known as transit villages, where developers can focus their attention.
The model in Western Australia is similar to the one in New Jersey. Despite a differ-ent political system, one which ultimately gives state government more planning powers, local governments across Perth have a major say in land-use decisions. Although the state can override local decisions, this rarely happens. The state TOD committee in Western Australia has been a forum for moving TOD planning and implementation forward. The committee coordinates capital investment, govern-ment policy, and implementation strategy.
Journal of Public Transportation, Vol. 11, No. 3, 2008
�04
Model State TOD ProgramGiven the best practice examples of California, New Jersey, and Western Australia, this section presents a model state TOD program. Regions looking to implement TODs should collaborate with their state government to establish a committee that brings together stakeholders from various state agencies, MPOs, transit agen-cies, and local government. The following �0 actions are important to any state looking to encourage TOD:
�. Establish a committee that meets on a monthly or quarterly basis.
�. Ensure intrastate agency participation, including agencies that deal with transportation, housing, the environment, economic development, and any others that have a stake in smart growth.
3. Ensure intergovernmental participation, including MPOs and municipal government.
4. Ensure transit provider participation.
5. Ensure participation from the affordable housing sector.
6. Establish short- and long-term goals that will drive a work plan.
7. Establish clear goals and objectives so local government and developers know what to expect.
8. Use the committee to coordinate capital investments to reinforce suc-cess.
9. Use marketing and branding to sell a lifestyle choice.
�0. Monitor outcomes and continually update goals and objectives.
In a classic debate about smart growth in the Journal of the American Planning Association, Reid Ewing stated, “My answer to sprawl is active planning of the type practiced everywhere except the United States…” (Ewing �997, p. ��8). Active planning means participation among various agencies, governments, and stakeholders. TOD initiatives in California, New Jersey, and Western Australia demonstrate the importance of a collaborative approach—one that should be considered by any state looking to manage growth.

�05
Smart Growth and Transit-Oriented Development at the State Level
Endnotes� DPI contains Main Roads WA, Western Australia’s DOT equivalent.
� No single source, including the U.S. EPA database, was found that accurately reported all state-level smart growth policies. Data presented in this article was compiled from a variety of sources and to the best of the author’s knowledge it represents an accurate inventory, although new policies are continually emerg-ing.
3 In the early �990s redevelopment legislation in California was strengthened to ensure that such zones were actually located in a blighted area because redevelop-ment zones place a greater tax burden on the state government.
4 The MTA is Los Angeles’s regional transit agency.
5 For more information on the Blue Line’s failure with respect to TOD, read “The Blue Line Blues: Why the Vision of Transit Village May Not Materialize Despite Impressive Growth in Transit Ridership” by Loukaitou-Sideris and Banerjee in the Journal of Urban Design (�000) 5, �: �0�–��5.
6 A chronology of planning policy can be found at: http://www.nj.gov/dca/osg/smart/chronology.shtml.
7 http://www.policy.rutgers.edu/vtc/tod/tod_projects.html.
8 The Midland and East Perth Redevelopment Authorities have been created by the state government of Western Australia to encourage infill development and TOD.
9 Town planning schemes in Western Australia are initiated by local government and approved by the Minister for Planning and Infrastructure based on a recom-mendation of the WAPC. They become the statutory planning regulation that governs development applications.
References
All aboard! �006. The Economist.
Bureau of Transport and Regional Economics. �003. State spending on roads Com-monwealth of Australia.

Journal of Public Transportation, Vol. 11, No. 3, 2008
�06
California Department of Transportation. �00�a. Statewide transit-oriented devel-opment study: Factors for success in California. Sacramento: California Depart-ment of Transportation.
California Department of Transportation. �00�b. Statewide transit-oriented devel-opment study: Factors for success in California—technical appendix. Sacra-mento: California Department of Transportation.
California State Treasurer. �00�. The Double Bottom Line: Investing in California’s Emerging Markets. California State Treasurer, Sacramento, California.
Cambridge Systematics. �006. The role of state DOTs in support of transit-oriented development. Project �5-�5, Task �0 National Cooperative Highway Research Program, Transportation Research Board, Washington, DC.
Center for Transit-Oriented Development. �004. Hidden in plain sight: Capturing the demand for housing near transit. Las Vegas, NM: Reconnecting America.
Cervero, R. �994. Transit-based housing in California: Evidence on ridership impacts. Transport Policy �,3: �74–�83.
Cervero, R. �998. Transit villages in California: Progress, prospects, and policy reforms. Berkeley, CA: Institute of Urban and Regional Development, Univer-sity of California at Berkeley.
Cervero, R., G. B. Arrington, J. Smith-Heimer, R. Dunphy, S. Murphy, C. Ferrell, N. Goguts, Y.-H. Tsai, J. Boroski, R. Golem, P. Peninger, E. Nakajima, E. Chui, M. Meyers, S. McKay, and N. Witenstein. �004. Transit-oriented development in America: Experiences, challenges, and prospects. TCRP Report �0�. Washing-ton, DC: National Academy Press.
Curtis, C. �999. Turning strategies into actions—Integrated land use and transport planning in Western Australia. �3rd Australasian Transport Research Forum, Perth, Western Australia. September �9–October �, �999, pp. 349–363.
Dittmar, H., and G. Ohland. �004. The new transit town: Best practices in transit-oriented development. Washington, DC: Island Press.
Dunphy, R., R. Cervero, F. Dock, M. McAvey, and D. Porter. �004. Developing around transit: strategies and solutions that work. Washington, DC: Urban Land Institute.
Ewing, R. �997. Is Los Angeles-Style sprawl desirable? Journal of the American Plan-ning Association 63:�07–��6.

�07
Smart Growth and Transit-Oriented Development at the State Level
Government of Western Australia. �003. Hope for the future: The Western Aus-tralian state sustainability strategy. Perth: Department of the Premier and Cabinet.
Government of Western Australia. �004. Network city: Community planning strat-egy for Perth and Peel. Perth: Western Australian Planning Commission.
Hersh, L. �00�. The role of state government in transit-oriented development. Phila-delphia: Pennsylvania Environmental Defense Council.
Johnson, D., P. E. Salkin, and J. Jordan. �00�. Planning for smart growth: 2002 State of the states. Chicago: American Planning Association.
Kenworthy, J. and F. Laube. �00�. Millennium cities database. Brussels: International Association of Public Transport.
Levine, J. �006. Zoned out: Regulation, markets, and choices in transportation and metropolitan land-use. Washington, DC: Resources for the Future.
Levine, J., and A. Inam. �004. The market for transportation-land use integration: Do developers want smarter growth than regulations allow? Transportation 3�: 409–4�7.
Lund, H., R. Cervero, and R. Wilson. �004. Travel characteristics of transit-oriented development in California. Sacramento: Caltrans Statewide Planning Studies.
McGreevey, G. J. �00�. Executive Order # 4: Smart Growth Policy Council [Online] http://www.state.nj.us/infobank/circular/eoindex.htm#mcgreevey.
Metropolitan Transportation Commission. �004. Transportation for livable com-munities capital program: Draft recommended program of projects. Metro-politan Transportation Commission, Oakland, CA.
New Jersey Department of Community Affairs. �005. Office of Smart Growth [Online] http://www.nj.gov/dca/osg.
New Jersey Department of Transportation. �005. Transit Village Initiative Website [Online] http://www.state.nj.us/transportation/community/village/.
Newman, P. �005. Transit oriented development: An Australian overview. Pro-ceedings from Transit Oriented Development: Making It Happen, Planning and Transport Research Centre, Fremantle, Western Australia, July 5–8, �005. http://www.patrec.org/conferences/TODJuly�005/TODJuly�005.html.

Journal of Public Transportation, Vol. 11, No. 3, 2008
�08
Newman. P., and J. Kenworthy. �999. Sustainability and cities: Overcoming automo-bile dependence. Washington, DC: Island Press.
Renne, J. �005. Transit-oriented development in Western Australia: Attitudes, obstacles, and opportunities. Perth, Western Australia: Planning and Transport Research Centre.
Shoemaker, D. �004. Personal interview.
Urban Land Institute and PricewaterhouseCoopers. �005. Emerging trends in real estate 2005. Washington, DC: Urban Land Institute.
Urban Land Institute and PricewaterhouseCoopers. �006. Emerging trends in real estate 2006. Washington, DC: Urban Land Institute.
U.S. Environmental Protection Agency. �005. Smart Growth Policy Database [Online] http://cfpub.epa.gov/sgpdb/sgdb.cfm. Available from U.S. Environ-mental Protection Agency.
About the Author
John L. Renne ([email protected]) is an assistant professor of urban planning and transportation studies at the University of New Orleans. He is also an associate director of the university’s Transportation Center. His research focuses on land-use and transportation planning in the United States and Australia. He is affiliated with the Planning and Transport Research Centre of Western Australia and the Institute for Sustainability and Technology Policy in Western Australia.

�09
The Emerging Field of Travel Training Services: A Systems Perspective
The Emerging Field of Travel Training Services: A Systems PerspectiveMichael Wolf-Branigin, George Mason University Karen Wolf-Branigin, Easter Seals Project Action
Abstract
Travel training provides a promising approach for moving persons from paratransit to fixed-route transportation services. This study identifies current funding trends and discusses the volume and diversity of services within the travel training instruction field. Measuring the emergence of this field focused on four properties of systems: intention, boundary, resources, and exchange. We used these properties to facilitate sharing of information and learning among the participating organizations. Initial findings indicated that older, established programs tended to be larger and moved more persons to fixed routes, while programs that employed their own staff rather than contracting out staff produced more outputs per staff person. We conclude that the diversity of the field’s innovators have strengthened the problem-solving capacity. Based on the findings, a preliminary research and evaluation agenda is proposed.
IntroductionRecognizing the benefits of teaching individuals to use public transportation, various professionals and organizations throughout North America have devoted resources to design and implement travel training services. Travel training refers to a program that provides instruction in travel skills to individuals with any dis-ability except visual impairment (Groce �996). This inquiry into the emergence

Journal of Public Transportation, Vol. 11, No. 3, 2008
��0
of travel training studied four properties of organizations or systems—intention, boundary, resources, and exchange—suggested by Katz and Gartner (�988) and used these properties to facilitate information sharing among the participating organizations.
Jack Gorelick of the Association for the Help of the Retarded in New York City—credited as the originator of travel training services (Sauerburger �999)—formalized the first travel training programs with the New York City Board of Education in the �970s. Since then, scores of organizations began offering travel training services throughout the United States, Canada, and Western Europe. While encouraging and assisting customers to use fixed-route transit and increase their independence, travel trainers realized the benefits of creating a professional association to strengthen their efforts in refining pedagogy, discussing funding streams, communicating information about administrative and human resource policy and practice, developing mechanisms to inform themselves, and sharing promising and best practices. From these grassroots, the Association of Travel Instruction was formed in �999, with an inaugural conference held in �00�. The conference’s purpose was to share and inform colleagues about methods for train-ing customers with disabilities to use fixed-route public transportation services (Moakley �00�).
Travel trainers work in communities where they are employed by a range of not-for-profit and for-profit organizations that include schools, human service agencies, self-advocacy organizations, transit authorities and agencies, and consulting firms. While it appears that the number of travel trainers and organizations employing travel trainers increased over the past decade, information remains limited. Three reasons are typically cited for this apparent growth. The first involves changes in federal disability policy including the Individuals with Disabilities Education Act of �975 and the Americans with Disabilities Act (ADA) of �990. The second involves the promotion of travel training services by people with disabilities, family members, and professionals satisfied with how the service contributes to inde-pendence, increased mobility, and full community membership for people with disabilities. The third centers on public transportation providers that encourage cost-effective approaches for serving customers with disabilities and older adults who were frequent users of ADA paratransit services (Carpenter �994).
Social innovations evolve through the diverse perspectives and efforts of partici-pating stakeholders (Page �007; Westley, Zimmerman, and Patton �006). Within this context, travel training developed to meet the emerging needs of persons

���
The Emerging Field of Travel Training Services: A Systems Perspective
using paratransit and other transportation services. This instruction provides an innovative strategy for increasing ridership for various populations includ-ing persons with intellectual and developmental disabilities (Crain & Associates �998). Furthermore, it has become popular to demonstrate to older adults how to increase their independence through using public transportation (Burkardt, McGavock, and Nelson �00�). Representatives of public transit agencies state that having persons with disabilities use conventional transit provides a cost-effective alternative. Achieving this required that conventional transit become more acces-sible (Iannuzziello �00�).
Without an organizing body with oversight responsibilities or debate on guiding principles, there currently exists no generally accepted definition of travel training service. To bring greater cohesiveness to the field, Project ACTION (Accessible Community Transportation in our Nation) began funding more than �0 related projects (Weiner �998) in an effort to delineate the knowledge and skills recom-mended for professional travel trainers. Commissioned by the U.S. Congress in �988 as a national research and demonstration project, Easter Seals Project ACTION (ESPA) serves as a national training and technical assistance center on accessible transportation. While each travel training service is unique, the major activities typically include a comprehensive set of services including assessment, trip planning, familiarity of the built environment, travel instruction plan devel-opment, and strategies of instruction. These strategies focus on crossing streets, using public conveyor systems, boarding, riding, alighting vehicles, and handling emergencies (ESPA �007).
This study addresses three areas of interest to advocates of travel training service. First, we attempt to quantify the current practices, capacities, and outputs of travel trainers employed by transit authorities and agencies. Second, we identify the initial trends in order to inform travel trainers and organizations attempting to improve their services. Finally, we propose an evaluation and research agenda to enhance further the travel training profession. We applied a systems evaluation framework focusing on the three waves of systems theory: general systems theory, cybernetics, and complexity science (Midgley �006). General systems theory encourages stakeholders to consider the three levels of systems involved in the persons’ lives: (�) the micro level involves family and friends, (�) the mezzo level involves local organizations providing services, and (3) the macro level involves federal and state policy affecting the provision of services.

Journal of Public Transportation, Vol. 11, No. 3, 2008
���
General systems theory considers the interactions between client systems that are interconnected and include family/friends, education, employment, and health services. Understanding these interconnections improves an organization’s ability to respond to the emerging preferences of users (Wolf-Branigin �006) and builds robustness in the users to assure that they can adapt to changing conditions (Greene �00�). For example, using spatial data on housing locations can identify that persons with intellectual and developmental disabilities who live indepen-dently or semi-independently reside closer to public transportation routes when compared to persons living in group homes (Wolf-Branigin, LeRoy, and Miller �00�).
Assuring that the diverse strengths, needs, and preferences of each customer receive sufficient attention relies on the perspectives of multiple stakeholders. While this includes the development of the travel training field from the ground up, it also requires that necessary conditions be in place (e.g., support from transit agency administrators and board members). Federal directives and incentives, plus the support and promised referrals from human service agencies further strengthen the field’s robustness. As Williams and Imam (�006) state, recogniz-ing three patterns within systems thought—perspectives (assumes benefits can be found from investigating phenomena differently), boundaries (defines what is inside or outside the scope of inquiry), and entangled systems (observing systems within systems)—aids in analyzing viable organizations and how they develop in response to stakeholder needs.
We studied four properties—intention, boundary, resources, and exchange—in order to facilitate sharing of information and learning within the participating organization (de Geus �994). Interactions occur within organizations where cus-tomers have multiple options from which to make decisions. This information feeds back into the system to inform the customers and their transit facilities (Proehl �00�). Within a complex systems framework, these results represent the travel training network’s emergent behavior (Pozatek �994; Rhee �000; Bolland and Atherton �999; Agar �999; Halmi �003).
MethodSampleRepresentatives of ��8 public transportation providers received questionnaires through a listserv. Representatives of 74 different organizations, the unit of analy-

��3
The Emerging Field of Travel Training Services: A Systems Perspective
sis, responded (N=74). For the purpose of group comparisons and correlations, this sample size met the suggested size for moderate to strong effects (Cohen �99�). Using a mixed-methods approach (Creswell �003), we analyzed numeric and nonnumeric data.
InstrumentA semistructured questionnaire measured six areas: (�) number of travel trainers employed and contracted by transit agencies, (�) number of full-time employees (FTEs) allocated to travel training services, (3) funding sources, (4) number of individuals served in past �� months, (5) number traveling independently on fixed route resulting from travel training services, and (6) number able to transi-tion from paratransit to fixed route in past �� months (Figure �). Short answers were obtained on agency motives for participating and advice for others consider-ing travel training. The instrument reflected the four properties of organizations (intention, boundaries, resources, and exchange of goods and knowledge) sug-gested by Katz and Gardner (�988). Providing services in-house versus contracted services indicated intention. Type of funding source (federal vs. nonfederal) reflected boundaries; number of funding sources, FTEs, length of time providing services reflected resources. Finally, the qualitative responses primarily reference exchanges.
Data AnalysisWe used descriptive and inferential statistics, including correlations and group comparisons to identify initial trends, and reviewed qualitative data to identify exchange of information themes. Inferential statistics used included Pearson’s correlations and independent t-tests. Because this was an initial study with several highly variable distributions, a �0 percent trim was taken for all scaled (interval and ratio) variables. For group comparisons equal variances were not assumed.
ResultsDescriptive StatisticsTypes and amounts from funding sources are summarized in Table �. Nearly 9 out of �0 travel training programs have a single funding source (89.�%); � to 3 fund-ing sources were found in 8.� percent of the programs; �.8 percent had 4 or more sources. These funding sources were divided evenly between federal funds (50%) and nonfederal funds (50%). The dominant federal source was their general oper-ating funds, whereas nonfederal sources included a combination of local property

Journal of Public Transportation, Vol. 11, No. 3, 2008
��4
Figure 1. Questionnaire

��5
The Emerging Field of Travel Training Services: A Systems Perspective
tax, sales tax, municipal budget, Department of Community Economic Develop-ment, State Department of Education, state special needs grant, state special transportation fund–cigarette tax, state casino revenue, motor vehicle excise tax, private foundations, and the United Way.
The majority of programs cited the employer of record as in-house (57%), with about one third contracted out to another source (3�%). The remaining �� per-cent used a combination of in-house and contracted services. One full-time staff person provided travel training services in 44 percent of the reporting organiza-tions, with 5� percent of the organizations having more than one staff member.
Inferential StatisticsOutcome per FTE. We calculated outcome per FTE dedicated to travel training by dividing the number of persons in the past �� months who received service, used fixed route independently, and made the transition from paratransit to fixed route for some or all of their trips. Results indicate that for each FTE, the mean number served was 99.� (SD = �39.5), mean number using fixed route independently was 39.9 (SD = 56.9), and number moved from paratransit to fixed route was ��.4 (SD = �3.0).
Correlations. The length of time an organization provided travel training services was significantly correlated with a greater number of persons served (r = .�67; p = .038) with a greater number of persons using fixed route independently (r = �90; p = .046). Similarly, the number of FTEs within an organization providing travel training services was positively correlated with the number of customers using fixed route (r = .�84; p = .049) and the number of customers moved from para-transit to fixed route (r = .406; p = .0�4). Outcomes were correlated with number served (r = .349; p = .0��) and the number using fixed route independently (r = .5�0; p = .003) per FTE (Table �).
Table 1. Type and Amounts from Funding Sources Descriptive Statistics N Mean Median SD
FTEs in travel training 56 �.00 �.88 �.47In past �� months Individuals served 47 33�.9 76.0 604.� Number traveling fixed route 36 �54.3 53.0 389.8 Moved from paratransit to fixed �9 56.7 �5.0 �34.7

Journal of Public Transportation, Vol. 11, No. 3, 2008
��6
Table 2. Correlations of Travel Training Correlations of Travel Training by N r p-value
Length of time training program in operation
Number served 35 .383 .0��*
Used fixed route �8 .353 .033*
Moved from paratransit �� .��7 .�54
FTEs
Number served 35 .��4 .�35
Used fixed route 35 .�84 .049*
Moved from paratransit �9 .406 .0�4*
Outcomes per FTE
Number served per FTE 34 .359 .0��*
Used fixed route per FTE �7 .5�0 .003**
Moved from paratransit per FTE �� .�80 .���
* Significant at <.05 ** Significant at <.0�
Group Comparisons. We compared agencies that contracted out services to those where the organization was the employer of record for three outcomes (Table 3). When comparing the number served in the past �� months per FTE, agencies employing their travel trainers had M=�36.75, s.d. =�70.70, while agencies that contracted out services had M=3�.9�, s.d. =�6.4� (t=-�.73; p=.0��). When com-paring the number who used fixed route in the past �� months per FTE, agencies employing travel trainers had M=44.�8, s.d.=65.4�, while the agencies contracting for services had M=�6.�5, s.d.=�3.9� (t=-�.65, p=.��7). The number moved to fixed route in the past �� months per FTE and employed by agency had M=��.37, s.d. =�3.49; agencies contraction for services had M=9.59, s.d. =�0.34 (t=-.53, p=.600).
Qualitative Responses Responses from the transit agencies representatives (n=46) concerning their motives for creating, maintaining, and sharing information on their experiences of providing travel training services focused on three themes: (�) cost containment resulting from a transition from paratransit to fixed route for some or all of their trips (n=�6, 57%); (�) assisting individuals, for example, reducing their isolation (n=�6, 35%); and (3) verifying eligibility and referral (n=4, 8%). When asked what advice they would give others who are creating or considering a travel training program, the representatives (n=46) indicated five major themes: (�) getting
��7
The Emerging Field of Travel Training Services: A Systems Perspective
advice from others with established programs (n=��; �6%), (�) responding to the persons’ needs (n=��; �6%), (3) collaborating with other community service orga-nizations (n=��; �4%), (4) garnering community support (n=6; �3%), and (5) sup-porting staff through training and technical assistance (n=5; ��%). Respondents indicated the primary funding source for paratransit for 44 of the programs and included four categories: (�) city or regional tax (n=�9; 43%), (�) general operating budget (n=�8; 4�%), (3) federal grant (n=4; 9%), and (4) other grant or foundation such as Job Access and Reverse Commute Program (n=3; 7%).
Discussion and ApplicationsThis initial survey of the travel training field demonstrates the presence of the three patterns—perspectives, boundaries, and entangled—of systems thought (Williams and Imam �006). Diverse perspectives of the participating organizations were reflected as some providers were governmental, while others were privately owned. Some contracted for services, while others provided some services in hours, and still others had a combination of the two. The capacity to provide services in a cost-effective manner reflects the boundaries (limits or rules) under which the differing types of providers performed. The overlapping paratransit and fixed-route services, multiple needs of a diverse customer base, and the mul-tiple funding sources under which many of the transit systems operate represent entangled systems.
Table 3. Group Comparisons Group Differences Mean S.D. t-value p-value
Number served past �� months/FTE -�.73 .0��*
Employer of record (n=��) �36.75 �70.70
Not employer of record (n=��) 3�.9� �6.4�
Used fixed route past �� months/FTE -�.65 .��7
Employer of record (n=�6) 44.�8 65.4�
Not employer of record (n=�0) �6.�5 �3.9�
Moved to fixed route past �� months/FTE -.53 .600
Employer of record (n=��) ��.37 �3.49
Not employer of record (n=9) 9.59 �0.34
* Significant at <.05

Journal of Public Transportation, Vol. 11, No. 3, 2008
��8
Programs with a longer history of providing services tended to deliver a larger number of services. This result should be expected, as these programs had a more defined and diversified funding base. Significant correlations were present based on when (earlier) a travel training program was established with two variables: the numbers served and the number using fixed route. Similarly, programs with a greater number of employed FTEs were correlated significantly with two variables: more customers using fixed route and more customers moved to paratransit.
Large differences in outcomes appeared between travel training staff employed by the organization versus those under contract. Transit agencies that were the employer of record served a significantly greater number. Future studies should investigate this issue to determine whether the contract organizations were reimbursed primarily through a successful outcome approach. Such a funding approach could have focused their efforts on fewer persons to ensure success.
Developing and determining which key data elements for use provides decision-makers with a basis for interpreting data. Travel training services play an instru-mental role in transcending separate services offered by a transit system, namely supporting customers to use all or part of their fixed-route trips.
Several limitations exist in this initial study. To reduce respondent confusion in future administrations of the questionnaire (Figure �), we provide a few sugges-tions. On question 3,
Does your agency/authority:
A. Employ travel trainers (you are the employer of record)
B. Contract out with another organization (they are the employer of record)
Several respondents answered “no” to A and B. However, they indicated that while they did not have a “formal” travel training program, they completed the chart in Question 5. For these respondents Question 3 A was coded “yes.” If using this instrument in the future, Question 3 should be reworded as follows:
Does your agency/authority:
A. Employ staff (you are the employer of record) to provide any type of travel training service (include related services such as intake, path of travel assess-ment, training, completing forms, supervision, continuing education for the employee, etc.).

��9
The Emerging Field of Travel Training Services: A Systems Perspective
On Question 4 (How many full-time equivalent travel training staff members are employed?), there appeared to be some confusion on whether the respondent answered yes to A or B in Question 3, Several respondents indicated the number of staff members listed in Question 5, therefore indicating the total number of staff members (not the number of FTE). Several respondents indicated the number of FTE providing travel training service. Question 4 was coded to reflect the number of staff members who provided any type of travel training service. If this instru-ment is used in the future, Question 4 should be reworded as follows:
Whether you answered yes to A or B in Question 3, how many staff members (full or part time) provide any type of travel training service (included related services such as intake, path of travel assessment, training, completing forms, supervision, continuing education for the employee, etc.).
RecommendationsAs travel trainers and their evaluators develop a body of knowledge to inform practitioners, we suggest three areas for study. The first involves conducting efficiency analyses including cost/benefit analyses and cost effectiveness studies. The second develops a generalized database with a core set of variables for future collection by travel training programs. The third concentrates on infusing a devel-opmental evaluation approach (Westley, Zimmerman, and Patton �006) to ensure that providers do not simply perform time-limited formative and outcome evalu-ations, but also create a model whereby indicators of sustainability emerge.
Efficiency Analyses This area of study should concentrate on cost-benefit and cost effectiveness analyses of travel training programs (Rossi, Lipsey, and Freeman �004) to continu-ally attempt to identify the most efficient means of service delivery. Given the benefits of datasets containing both outcome and cost data, these analyses will be relatively simple to compute.
Database Elements A key aspect will be creating and sustaining a generalized database with a core set of variables to be collected by all travel training programs. These variables should be relational to existing local transit authority databases. As a starting point, we recommend that travel instruction programs collect several data elements includ-ing, number of customers served, type of services provided, percent of services

Journal of Public Transportation, Vol. 11, No. 3, 2008
��0
received by customers, percent of time staff provides travel training service and services other than travel training, number of customers using fixed route because of the service, and moving from paratransit to fixed route for all trips, and cost savings per customer.
We further recommend that individuals and organizations seeking to implement travel instruction use available resources and support from others. A body of knowledge and resources is coalescing. Easter Seals Project Action Clearinghouse provides a variety of publications (e.g., Competencies for the Practice of Travel Training and Travel Instruction, and Curriculum to Introduce Travel Training to Staff Who Work with People with Disabilities).
Developmental Evaluation Future programs will benefit from the sequencing of activities and trainings that facilitate the development of advanced skills (Fitch �005). Given the dynamic nature of travel instruction, assuring the sustainability of similar initiatives will benefit by using a developmental evaluation approach where the driving force simply does not measure outcomes, but also accounts and adapts to developing linkages between information technology and travel instruction (Westley, Zim-merman, and Patton �006).
Because several of the items were high variability, we suggest that the respondents receive clear definitions of the items measured on future administrations of the questionnaire. While this survey provided an initial estimate of travel training’s affect within the United States and Canada, these estimates will surely be refined in future studies. Creating a developmental evaluation approach that assumes a sustainability perspective should address this concern over time. The travel train-ing field appeared to benefit from the diversity of heuristics and perspectives (Page �007). This diversity sets the stage for greater problem-solving abilities as transit systems confront challenging sustainability issues resulting from tightening resources and greater demand for services.

���
The Emerging Field of Travel Training Services: A Systems Perspective
References
Agar, M. �999. Complexity theory: An exploration and overview based on John Holland’s work. Field Methods ��(�): 99–��0.
Bolland, K., and C. Atherton. �999. Chaos theory: An alternative approach to social work practice and research. Families in Society: The Journal of Contemporary Human Services 80(4): 367–373.
Burkardt, J., A. McGavock, and C. Nelson. �00�. Improving public transit options for older persons. Washington, DC: TCRP, Transportation Research Board of the National Academies.
Carpenter, J. E. �994. Accommodating cognitive disabilities in public transit. Trans-portation Quarterly 48(�): 45–54.
Cohen, J. �99�. A power primer. Psychological Bulletin ���: �55–�59.
Crain & Associates, Inc. �998. Using public transportation to reduce the economic, social and human costs of personal immobility. Washington, DC: TCRP, Trans-portation Research Board of the National Academies. Retrieved October �4, �007 from http://www.nap.edu/catalog.php?record_id=9438#toc.
Creswell, J. �003. Research design: Qualitative, quantitative, and mixed methods approaches, �nd ed. Thousand Oaks, CA: Sage.
de Geus, A. �994. Modeling to predict or to learn? In J. D. Morecroft and J. D. Stern-man, eds., Modeling for Learning Organizations. Portland, OR: Productivity Press.
ESPA. �007. Introduction to travel training course curriculum. Washington: Easter Seals Project Action.
Fitch, D. �005. The diffusion of information technology in the human services: Implications for social work education. Journal of Teaching in Social Work �5, (�/�): �9�–�04.
Greene, R. �00�. Resiliency: An integrated approach to practice, policy, and research. Washington, DC: NASW Press.
Groce, M. �996. An introduction to travel training. NICHY 9 (June): �–5.
Halmi, A. �003. Chaos and non-linear dynamics: New methodological approaches in the social sciences and social work practice. International Social Work 46(�): 83–�0�.

Journal of Public Transportation, Vol. 11, No. 3, 2008
���
Iannuzziello, A. �00�. Communicating with persons with disabilities in a multimodal transit environment: A synthesis of transit practice. TCRP, Washington, DC: TCRP, Transportation Research Board of the National Academies.
Katz, J., and W. Gartner. �988. Properties of emerging organizations. Academy of Management Review �3: 4�9–44�.
Moakley, T. J. �00�. Training disabled passengers to ride public transit. Mass Tran-sit �7, 4: 34–36.
Midgley, G. �006. Systems thinking for evaluation. In B. Williams and I. Imam, eds., Systems Concepts in Evaluation: An Expert Anthology. Point Reyes, CA: EdgePress, ��–34.
Page, S. E. �007. The difference: How the power of diversity creates better groups, firms, schools, and societies. Princeton, NJ: Princeton University Press, 70–73.
Pozatek, E. �994. The problem of certainty: Clinical social work in the postmodern era. Social Work 39(4): 396–403.
Proehl, R. �00�. Organizational change in the human services. Thousand Oaks, CA: Sage, 76-80.
Rhee, Y. �000. Complex systems approach to the study of politics. Systems Research and Behavioral Science �7(6): 487–49�.
Rossi, P., M. Lipsey, and H. Freeman. �004. Evaluation: A systematic approach, 7th ed. Thousand Oaks, CA: Sage.
Sauerburger, D. �999. Association for Travel Training Formed! Washington, DC: Washington Orientation and Mobility Association. Retrieved October �6, �007 from http://www.sauerburger.org/dona/ati.htm.
Weiner, W. �998. Travel instruction: A standards curriculum development proj-ect. Project ACTION Update (Fall). Washington, DC: Easter Seals Project ACTION.
Westley, F., B. Zimmerman, and M. Patton. �006. Getting to maybe: How the world is changed. Toronto: Random House Canada.
Williams, B., and I. Iman. �006. Systems concepts in evaluation: An expert anthology. Point Reyes, CA: EdgePress.

��3
The Emerging Field of Travel Training Services: A Systems Perspective
Wolf-Branigin, M., B. LeRoy, and J. Miller. �00�. Physical inclusion of people with developmental disabilities: An evaluation of the Macomb-Oakland Regional Center. American Journal on Mental Retardation �06(4): 368–375.
Wolf-Branigin, M. �006. Self-organization in housing choices of persons with dis-abilities. Journal of Human Behavior in the Social Environment �3(4): �5–35.
About the Authors
Micheal Wolf-Branigin ([email protected]), an associate professor of social work at George Mason University, teaches courses in research methods and social policy. His research focuses on complex systems and its application to social work practice. He studied economics at the University of Stockholm before completing his MSW from the University of Michigan. After working more than �0 years in the addictions and disabilities fields, he received his Ph.D. from Wayne State University in �999. Since that time, he held positions in governmental and nongovernmental consulting and academia. He currently serves on the editorial boards of several academic journals.
Karen Wolf-Branigin ([email protected]) is the Training and Technical Assistance Manager with Easter Seals Project ACTION (Accessible Com-munity Transportation in our Nation) and the National Center on Senior Trans-portation. Her current work includes overseeing training and technical assistance activities designed to implement the Americans with Disabilities Act regulations related to accessible, reliable transportation for people with disabilities and older adults. She holds an MSW from the University of Michigan in social welfare policy and planning.