profiling developments in financial access and usage in … · mfsp mobile phone financial service...
TRANSCRIPT
FinAccessNational Survey 2013
OCTOBER 2013
Profiling developments in financial access and usage in Kenya
FINACCESS NATIONAL SURVEY2013
Technical parTners
Financial access parTnership MeMbers
principal parTners anD FUnDers
Every effort has been made to provide accurate and complete information. However, the members of the Financial Access Partnership, FSD Kenya, its Trustees and partner development agencies make no claims, promises or guarantees about the accuracy, completeness, or adequacy of the contents of this report and expressly disclaim liability for errors and omissions in the contents of this report.
Central Bank of Kenya (CBK)
Commercial Bank of Africa
Co-operative Bank of Kenya
Decentralised Financial Systems
Development Alternative International (DAI)
Equity Bank
Financial Sector Deepening (FSD) Kenya
Institute of Economic Affairs (IEA)
Kenya Bankers Association
Kenya Commercial Bank
Kenya Institute for Public Policy Research and Analysis (KIPPRA)
Kenya National Bureau of Statistics (KNBS)
K-REP Development Agency
Microsave
Ministry of Labour
National Treasury
PostBank
The FinAccess Secretariat is housed and administered at the Central Bank of Kenya
The Kenya Financial Sector Deepening (FSD) programme was established in early 2005 to support the development of financial markets in Kenya as a means to stimulate wealth creation and reduce poverty. Working in partnership with the financial services industry, the programme’s goal is to expand access to financial services among lower income households and smaller enterprises. It operates as an independent trust under the supervision of professional trustees, KPMG Kenya, with policy guidance from a Programme Investment Committee (PIC). Current funders include the UK’s Department for International Development (DFID), the Swedish International Development Agency (SIDA), and the Bill and Melinda Gates Foundation.
Government of Kenya
FINACCESS NATIONAL SURVEY
2013
| 1 |
The Financial Sector Medium Term Plan (MTP), 2012-2017 was developed in pursuit of objectives of Kenya’s strategic development blue print, Vision 2030. It sets out the sector priority goals including the need to enhance financial inclusion. Realization of this goal hinges upon widening access and use of affordable financial services and products by a majority of the Kenyan population. This is especially the case with the poor, low-income households and micro and small enterprises (MSEs), which largely comprise those segments which are un-served and under-served by the financial sector. Expanding financial inclusion to embrace these population segments at an affordable price and on a sustainable basis is associated with various socio-economic benefits both to the individual clients and the community at large.
The Financial Access Partnership (FAP), a public-private sector partnership formed in 2005 as part of the activities of the United Nations International Year of Microcredit (UN-IYMC), champions the conduct of The Financial Access (FinAccess) Surveys. FAP comprises government departments and agencies, financial sector players and associations, research and academic institutions and development partners, among others. FAP has conducted three successful FinAccess surveys: in 2006, 2009 and 2013. The 2006 survey provided the baseline measurements for Kenya’s financial access and inclusion landscape. The second and third surveys are important to track progress and demonstrate the evolution and dynamics in the financial inclusion landscape, since 2006. Valuable lessons drawn from all three surveys have benefitted stakeholders immensely. Proper understanding of the financial inclusion landscape is crucial to provide evidence based identification of constraints and design of appropriate policy strategies and reforms. It is also essential for designing appropriate products and delivery channels to suit targeted clientele, in order to expand financial inclusion.
The FinAccess 2013 survey results reveal that Kenya’s financial inclusion landscape has undergone considerable change with the overall conclusion that it has expanded. The proportion of the adult population using different forms of formal financial services stands at 66.7% in 2013 compared to 41.3% in 2009. This is quite an achievement. Similarly, the proportion of the adult population totally excluded from financial services has declined to 25.4% in 2013 from 31.4% in 2009. This is a vindication of policy strategies and reforms by government as well as financial sector players’ initiatives and innovations. More people, especially the under-served and un-served segments, are now accessing and using financial services and products
by different providers. More interesting is the revelation that people are moving towards use of broader portfolios of financial services. Amongst the adult population, the use of combinations of formal prudential, non-formal prudential and informal products has risen from 16% in 2006 to 25% in 2009 to 29% in 2013. The broad spectrum of financial services is yielding distinct benefits to the different consumer groups. The consumption of the portfolio of financial services and products clearly shows that consumers require choices; hence the need to maintain the diversity and encourage competition and transparency of the different financial services providers amongst the different market segments and focus groups. It is critical to further enhance efficiency, drive down transactions costs and promote the development of financial services and products that will benefit financial inclusion efforts. This is particularly important given that a quarter of the adult population is still not using any form of formal, semi-formal or informal financial services and products.
It is my belief that the top line findings of this report, to be followed in due course by greater in-depth analysis using the FinAccess series datasets, will benefit policy makers, financial sector players, development partners and researchers, among others. The survey results will help to better understand the constraints that still impede financial inclusion and design policy reforms, products and delivery channels that will expand financial inclusion. Past research studies have demonstrated that demand for financial services and products from the poor, low-income households and MSMEs in developing and emerging markets grows when the providers know what these segments of the population use and value; the services and products they demand can then be offered on a sustainable basis. These services and products are usually affordable, convenient, flexible, reliable, safe and sustainable. I urge you all to interrogate these data sets and information in order to develop strategies to scale up financial inclusion to the under-served and un-served segments of the population. This will enhance financial sector development and make Kenya the financial hub in the Eastern African region.
prof. njuguna ndung’u, cbsGovernor, central bank of Kenya
Foreword
| 2 |
FINACCESS NATIONAL SURVEY2013
List of terms and abbreviationsaMl/cFT Anti-Money Laundering/Combating the Financing of Terrorism
asca Accumulating Savings and Credit Association
aTM Automated teller machine
baraza Locally convened community meeting
capi Computer assisted personal interviewing technology
cbK Central Bank of Kenya
chama ROSCA (in Swahili)
DpFb Deposit Protection Fund Board
DTM Deposit Taking Microfinance Institution
DTs Deposit Taking Sacco
Duka Shop (in Swahili)
Fap Financial Access Partnership
Finaccess Financial Access
FsD Financial Sector Deepening
helb Higher Education Loans Board
iD Identity card
Kish Sampling method for randomly selecting individual in household
Knbs Kenya National Bureau of Statistics
Ksh Kenya Shilling
KYc Know Your Customer
lcl Lower confidence limit
lsM Living standards measure
MFi Micro-finance Institution
MFsp Mobile phone financial service provider
M-pesa Mobile-based money transfer service (Pesa means money in Swahili)
MTp Medium term plan
nassep National Sample Survey and Evaluation Programme
nhiF National Hospital Insurance Fund
nssF National Social Security Fund
QTc Questionnaire technical committee
rGa Research Guide Africa
rOsca Rotating savings and credit association
saccO Savings and credit co-operative
sasra Sacco Societies Regulatory Authority
sODa Survey on-demand application
Ucl Upper confidence limit
Un YMc United Nations Year of Microcredit
FINACCESS NATIONAL SURVEY
2013
| 3 |
Foreword ................................................................................................................................................................1
list of terms and abbreviations .....................................................................................................................2
Table of contents .................................................................................................................................................3
acknowledgements ............................................................................................................................................4
1. Introduction .................................................................................................................................................. 5
background ...........................................................................................................................................5
survey objectives .................................................................................................................................5
Methodology ..........................................................................................................................................5
Questionnaire design .........................................................................................................................5
Field data collection methods .........................................................................................................5
survey validity .......................................................................................................................................6
reading the results .............................................................................................................................6
2. Profiling the Kenyan population ........................................................................................................... 8
basic demographics ..........................................................................................................................8
livelihoods and income.....................................................................................................................9
Wealth and vulnerability .................................................................................................................11
3. Financial access and usage in Kenya ............................................................................................. 12
The access strand ............................................................................................................................12
access strands by year ..................................................................................................................13
access strands by demographics ..............................................................................................13
access strands by livelihood and wealth .................................................................................16
access strand overlaps ..................................................................................................................17
4. Use of financial service providers .................................................................................................... 18
Type of financial service providers used by demographics ..............................................19
Use of financial services and products by groups ................................................................22
5. Use of financial services and products. ......................................................................................... 26
Use of financial services by product type ................................................................................26
Use of financial services by demographics.............................................................................27
6. Financial channels ................................................................................................................................. 30
proximity ..............................................................................................................................................30
banks ....................................................................................................................................................32
Technology ..........................................................................................................................................32
remittance channels used............................................................................................................33
Mobile money .....................................................................................................................................34
Frequency of usage .........................................................................................................................35
7. Financial literacy and consumer perceptions .............................................................................. 36
awareness of financial terms and institutions .......................................................................36
Financial decision making and sources of advice ................................................................37
Financial numeracy .........................................................................................................................37
interest rate perceptions ................................................................................................................38
challenges with financial service providers ...........................................................................38
8. Appendix – selected data tables and maps .................................................................................. 39
Table of contents
| 4 |
FINACCESS NATIONAL SURVEY2013
This FinAccess 2013 survey top line findings report is the joint effort of many institutions and people. The main participating institutions included the Financial Access Partnership (FAP), a private-public partnership of government and its agencies, the financial sector players and development partners, among others; the organs of FAP, namely: the Financial Access Management (FAM) comprising the Central Bank of Kenya (CBK) and Financial Sector Deepening (FSD) Kenya and the FinAccess Secretariat based at the CBK’s Research and Policy Analysis Department have remained steadfast in conducting the survey for the purpose of measuring financial access and inclusion, and understanding its dynamics. The Kenya National Bureau of Statistics (KNBS), a key member of FAP, facilitated crucial tasks of the surveys, including sampling and weighting, amongst others. Other industry players that partner in FAP participated under the Questionnaire Technical Committee (QTC) during the development of the research instrument/ questionnaire.
In particular, the leadership of the three key institutions namely, Prof. Njuguna Ndung’u, CBS - the Governor of the CBK, Dr David Ferrand - the Director of FSD Kenya and Mr Zachary Mwangi - the Acting Director General of the KNBS provided the stewardship for the survey. Mr Charles G. Koori the Director of Research and Policy Analysis Department at the
CBK, and Mr Daniel K.A Tallam, Assistant Director, Financial Stability and Access Division in the Department provided invaluable guidance in the planning and conduct of the survey. The FinAccess Secretariat that undertook data analysis and compilation of the top line findings comprised Dr Alfred Ouma Shem (CBK), the late Mr Ravindra Ramrattan (FSD Kenya), Mr Isaac Mwangi (CBK), Mr Amos Odero (FSD Kenya), Ms Haggar Olel (FSD Kenya), Mr Paul Samoei and Mr Samuel Kipruto both of the KNBS. The team also benefited from the expertise of Dr Dayo Forster, an independent consultant, and Mr Cappitus Chironga of the Financial Stability and Access Division (CBK). Mr John Bore of KNBS provided essential inputs on sampling and data weighting. Not to be forgotten are those who carried out most of the administrative and logistical coordination from both within the CBK and FSD Kenya.
We acknowledge all efforts made towards the success of the FinAccess 2013 survey including respondents in the field, the research house TNS-RMS and their field team that conducted field work, as well as Research Guide Africa for ensuring quality control of the whole survey process. Many others helped in one way or the other and though we cannot mention all by name, we thank them most sincerely for their efforts and contributions.
This report is dedicated to the memory of the late Ravindra Ramrattan, who played a major rolein bringing the FinAccess 2013 survey to fruition. Ravi tragically lost his life during the
Nairobi Westgate terror attack on 21st September, 2013.
Acknowledgements
FINACCESS NATIONAL SURVEY
2013
| 5 |
1. Introduction background
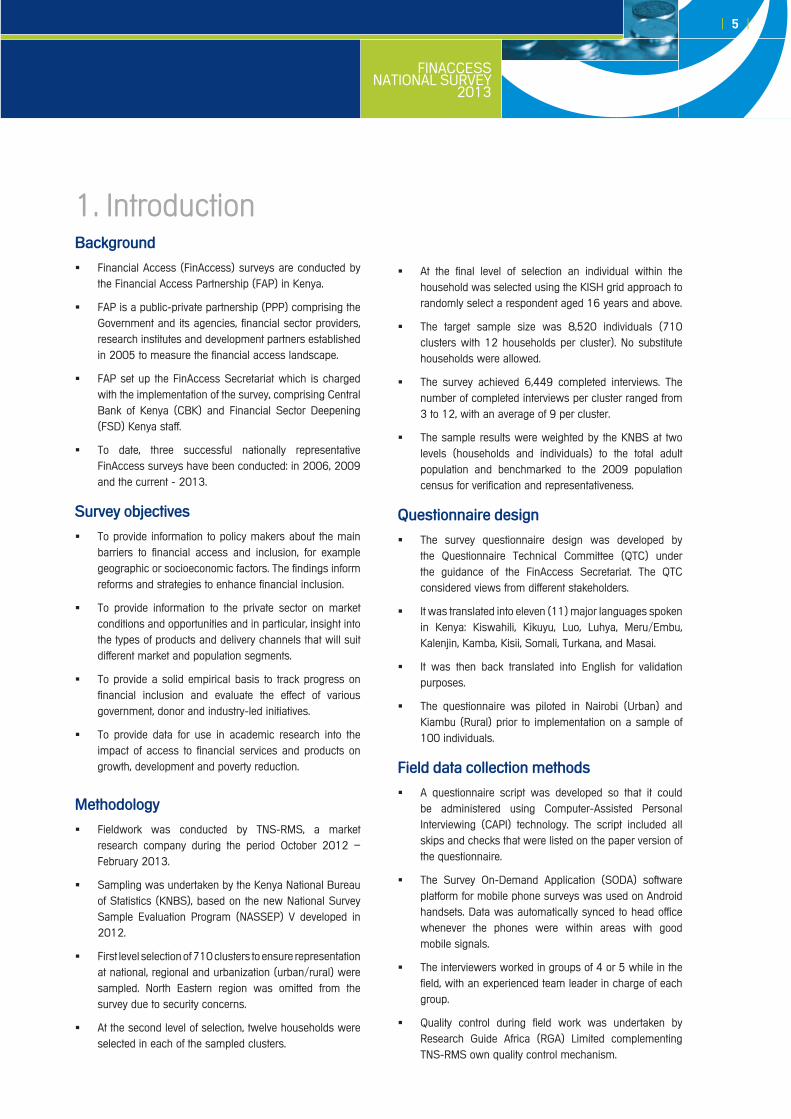
Financial Access (FinAccess) surveys are conducted by �the Financial Access Partnership (FAP) in Kenya.
FAP is a public-private partnership (PPP) comprising the �Government and its agencies, financial sector providers, research institutes and development partners established in 2005 to measure the financial access landscape.
FAP set up the FinAccess Secretariat which is charged �with the implementation of the survey, comprising Central Bank of Kenya (CBK) and Financial Sector Deepening (FSD) Kenya staff.
To date, three successful nationally representative �FinAccess surveys have been conducted: in 2006, 2009 and the current - 2013.
survey objectivesTo provide information to policy makers about the main �barriers to financial access and inclusion, for example geographic or socioeconomic factors. The findings inform reforms and strategies to enhance financial inclusion.
To provide information to the private sector on market �conditions and opportunities and in particular, insight into the types of products and delivery channels that will suit different market and population segments.
To provide a solid empirical basis to track progress on �financial inclusion and evaluate the effect of various government, donor and industry-led initiatives.
To provide data for use in academic research into the �impact of access to financial services and products on growth, development and poverty reduction.
MethodologyFieldwork was conducted by TNS-RMS, a market �research company during the period October 2012 – February 2013.
Sampling was undertaken by the Kenya National Bureau �of Statistics (KNBS), based on the new National Survey Sample Evaluation Program (NASSEP) V developed in 2012.
First level selection of 710 clusters to ensure representation �at national, regional and urbanization (urban/rural) were sampled. North Eastern region was omitted from the survey due to security concerns.
At the second level of selection, twelve households were �selected in each of the sampled clusters.
At the final level of selection an individual within the �household was selected using the KISH grid approach to randomly select a respondent aged 16 years and above.
The target sample size was 8,520 individuals (710 �clusters with 12 households per cluster). No substitute households were allowed.
The survey achieved 6,449 completed interviews. The �number of completed interviews per cluster ranged from 3 to 12, with an average of 9 per cluster.
The sample results were weighted by the KNBS at two �levels (households and individuals) to the total adult population and benchmarked to the 2009 population census for verification and representativeness.
Questionnaire designThe survey questionnaire design was developed by �the Questionnaire Technical Committee (QTC) under the guidance of the FinAccess Secretariat. The QTC considered views from different stakeholders.
It was translated into eleven (11) major languages spoken �in Kenya: Kiswahili, Kikuyu, Luo, Luhya, Meru/Embu, Kalenjin, Kamba, Kisii, Somali, Turkana, and Masai.
It was then back translated into English for validation �purposes.
The questionnaire was piloted in Nairobi (Urban) and �Kiambu (Rural) prior to implementation on a sample of 100 individuals.
Field data collection methodsA questionnaire script was developed so that it could �be administered using Computer-Assisted Personal Interviewing (CAPI) technology. The script included all skips and checks that were listed on the paper version of the questionnaire.
The Survey On-Demand Application (SODA) software �platform for mobile phone surveys was used on Android handsets. Data was automatically synced to head office whenever the phones were within areas with good mobile signals.
The interviewers worked in groups of 4 or 5 while in the �field, with an experienced team leader in charge of each group.
Quality control during field work was undertaken by �Research Guide Africa (RGA) Limited complementing TNS-RMS own quality control mechanism.
| 6 |
FINACCESS NATIONAL SURVEY2013
FA06 FA09 FA13
length 36 pages 49 pages 43 pages
average interview duration 45 minutes 60 minutes 60 minutes
sections
General demographics
Access to amenities
Biggest risks
Financial literacy x
Effective numeracy x
Livelihood and income
Product usage
Money transfers
Mobile phone financial services x
Savings
Informal groups
Credit
Insurance
Technology
Vulnerability
Housing conditions
Expenditure
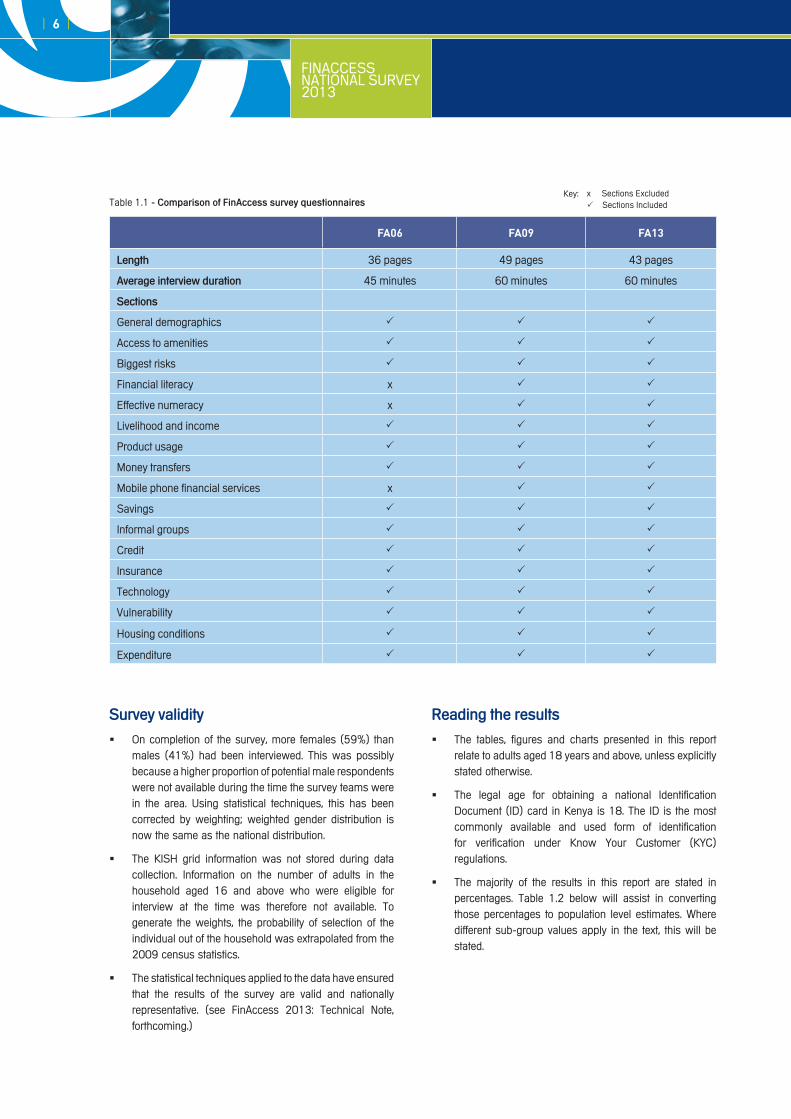
survey validityOn completion of the survey, more females (59%) than �males (41%) had been interviewed. This was possibly because a higher proportion of potential male respondents were not available during the time the survey teams were in the area. Using statistical techniques, this has been corrected by weighting; weighted gender distribution is now the same as the national distribution.
The KISH grid information was not stored during data �collection. Information on the number of adults in the household aged 16 and above who were eligible for interview at the time was therefore not available. To generate the weights, the probability of selection of the individual out of the household was extrapolated from the 2009 census statistics.
The statistical techniques applied to the data have ensured �that the results of the survey are valid and nationally representative. (see FinAccess 2013: Technical Note, forthcoming.)
reading the resultsThe tables, figures and charts presented in this report �relate to adults aged 18 years and above, unless explicitly stated otherwise.
The legal age for obtaining a national Identification �Document (ID) card in Kenya is 18. The ID is the most commonly available and used form of identification for verification under Know Your Customer (KYC) regulations.
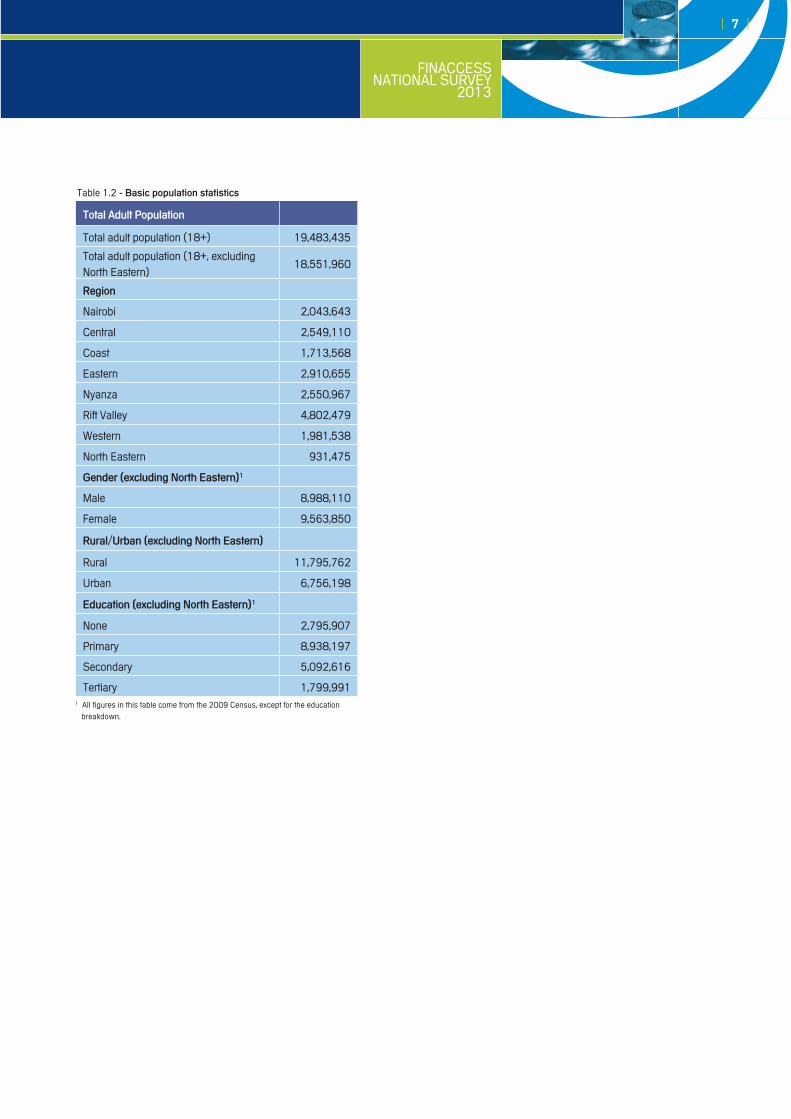
The majority of the results in this report are stated in �percentages. Table 1.2 below will assist in converting those percentages to population level estimates. Where different sub-group values apply in the text, this will be stated.
Table 1.1 - comparison of Finaccess survey questionnairesx Sections Excluded Sections Included
Key:
FINACCESS NATIONAL SURVEY
2013
| 7 |
Total adult population
Total adult population (18+) 19,483,435
Total adult population (18+, excluding North Eastern)
18,551,960
region
Nairobi 2,043,643
Central 2,549,110
Coast 1,713,568
Eastern 2,910,655
Nyanza 2,550,967
Rift Valley 4,802,479
Western 1,981,538
North Eastern 931,475
Gender (excluding north eastern)1
Male 8,988,110
Female 9,563,850
rural/Urban (excluding north eastern)
Rural 11,795,762
Urban 6,756,198
education (excluding north eastern)1
None 2,795,907
Primary 8,938,197
Secondary 5,092,616
Tertiary 1,799,991
Table 1.2 - basic population statistics
1 All figures in this table come from the 2009 Census, except for the education breakdown.
| 8 |
FINACCESS NATIONAL SURVEY2013
2 18+ excluding North Eastern region
age groups (%)
Urban/rural
Rural 65%
Urban 35%
18-25yrs
26-35yrs
36-45yrs
46-55yrs
>55yrs
23.7
32.7
19.3
10.7
13.6
4852
2. profiling the Kenyan population
basic demographics
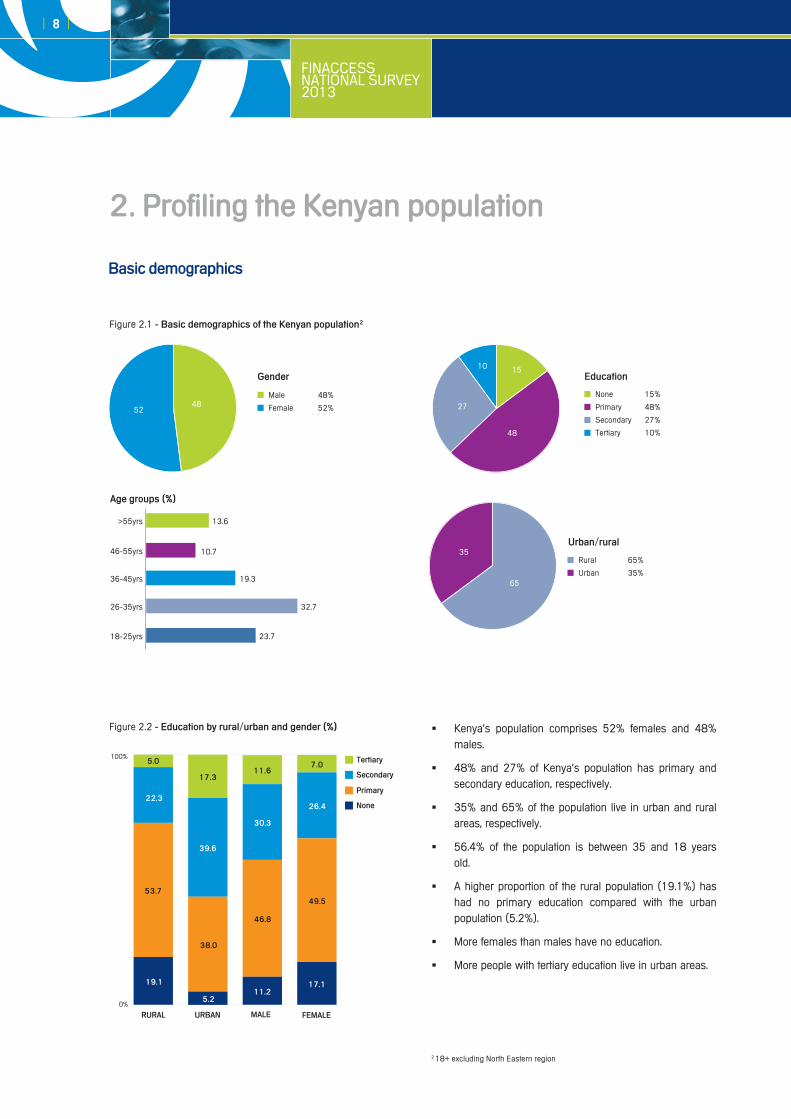
Figure 2.1 - basic demographics of the Kenyan population2
Gender
Male 48%
Female 52%
education
None 15%
Primary 48%
Secondary 27%
Tertiary 10%
Kenya’s population comprises 52% females and 48% �males.
48% and 27% of Kenya’s population has primary and �secondary education, respectively.
35% and 65% of the population live in urban and rural �areas, respectively.
56.4% of the population is between 35 and 18 years �old.
A higher proportion of the rural population (19.1%) has �had no primary education compared with the urban population (5.2%).
More females than males have no education. �
More people with tertiary education live in urban areas. �
Figure 2.2 - education by rural/urban and gender (%)
rUral MaleUrban FeMale
none
primary
secondary
Tertiary
0%
100%
19.1
5.2
46.8
49.553.7
38.0
11.217.1
22.3
39.6
30.3
26.4
17.3
5.011.6
7.0
48
65
1510
27
35
FINACCESS NATIONAL SURVEY
2013
| 9 |
livelihoods and income
Table 2.1 - livelihood classification
Classification Main source of income
AgricultureSelling produce from their own farm (cash or subsistence crops), selling their livestock, fishing or employment on others’ farms
EmployedEmployment to do domestic chores, employment by the government or employed in the private sector
Own business Running own business (manufacturing, trading/retail or services)
Dependent Pension, family/friends or aid agency
Other Letting of land/house/rooms/investments
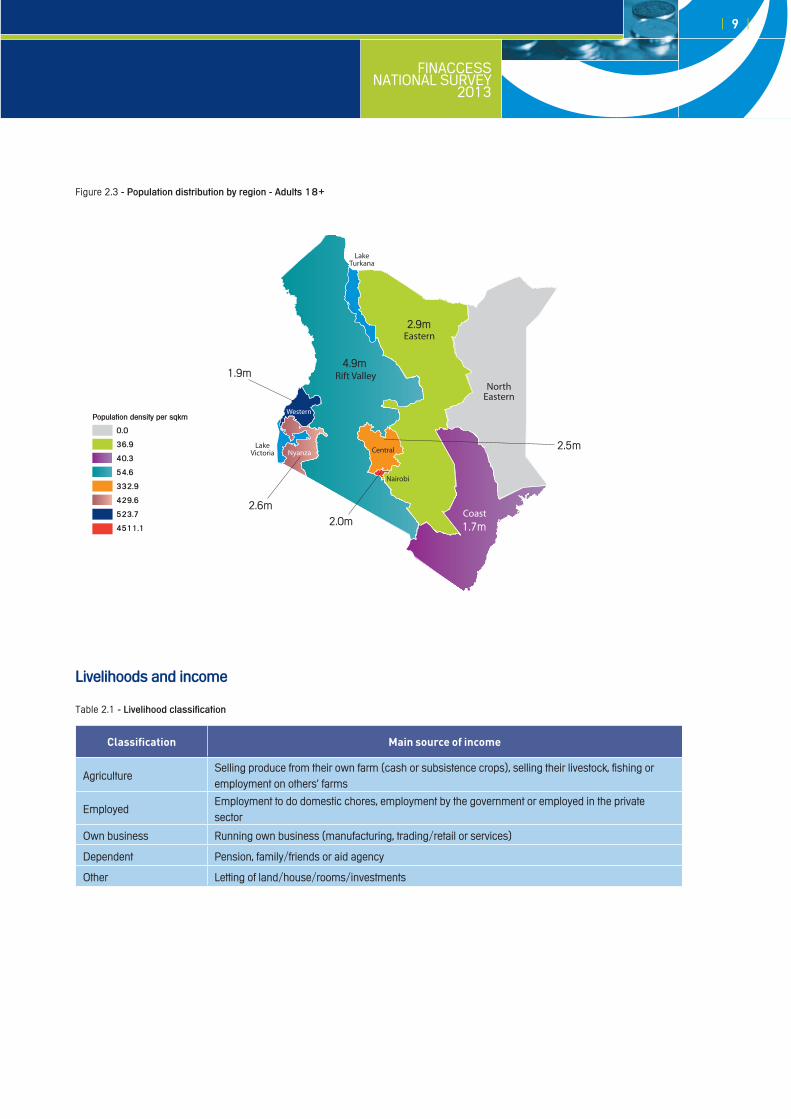
population density per sqkm
Figure 2.3 - population distribution by region - adults 18+
0.0
36.9
40.3
54.6
332.9
429.6
523.7
4511.1
1.9m
2.6m2.0m
2.5m
2.9m
4.9m
1.7m
Western
| 10 |
FINACCESS NATIONAL SURVEY2013
0.8
employed Own business agriculture Dependent Other
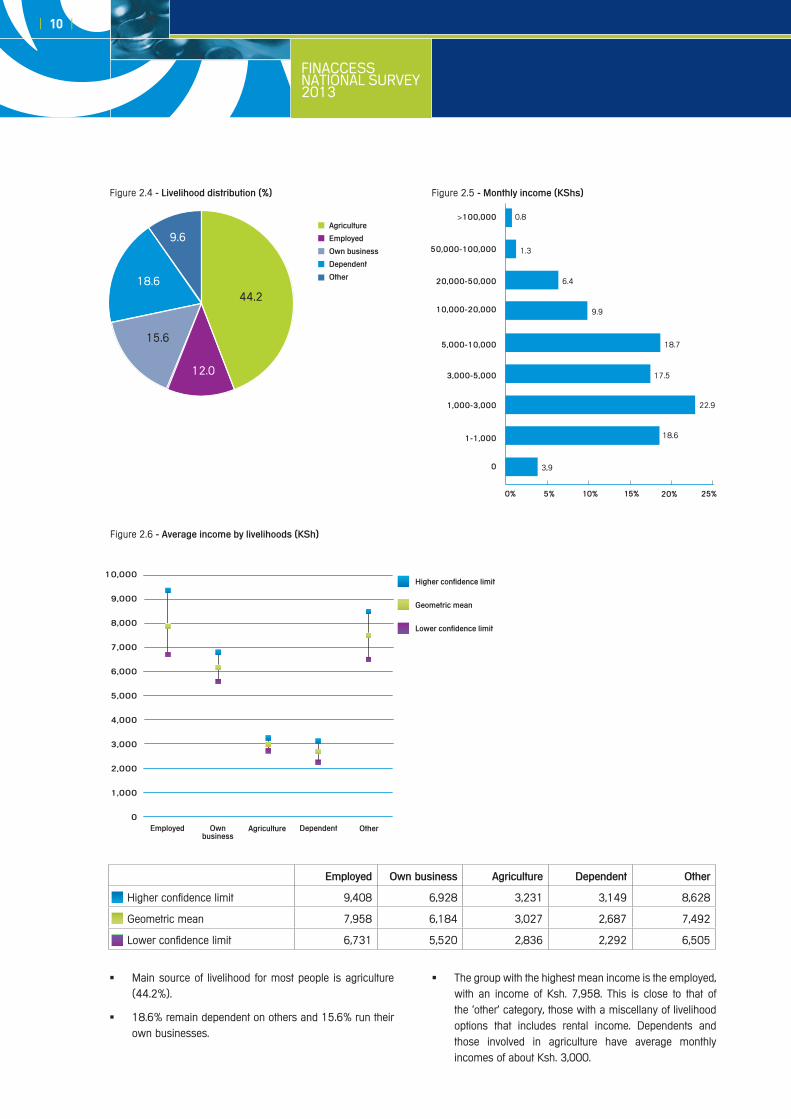
Higher confidence limit 9,408 6,928 3,231 3,149 8,628
Geometric mean 7,958 6,184 3,027 2,687 7,492
Lower confidence limit 6,731 5,520 2,836 2,292 6,505
Figure 2.4 - livelihood distribution (%) Figure 2.5 - Monthly income (Kshs)
agriculture
employed
Own business
Dependent
Other
>100,000
50,000-100,000
20,000-50,000
10,000-20,000
5,000-10,000
3,000-5,000
1,000-3,000
1-1,000
0
0% 5% 10% 15% 20% 25%
18.7
17.5
22.9
18.6
3,9
9.9
6.4
1.3
Main source of livelihood for most people is agriculture �(44.2%).
18.6% remain dependent on others and 15.6% run their �own businesses.
The group with the highest mean income is the employed, �with an income of Ksh. 7,958. This is close to that of the ‘other’ category, those with a miscellany of livelihood options that includes rental income. Dependents and those involved in agriculture have average monthly incomes of about Ksh. 3,000.
Figure 2.6 - average income by livelihoods (Ksh)
10,000
9,000
8,000
7,000
6,000
5,000
4,000
3,000
2,000
1,000
0employed Own
businessagriculture Dependent Other
higher confidence limit
Geometric mean
lower confidence limit
44.2
12.0
15.6
18.6
9.6
FINACCESS NATIONAL SURVEY
2013
| 11 |
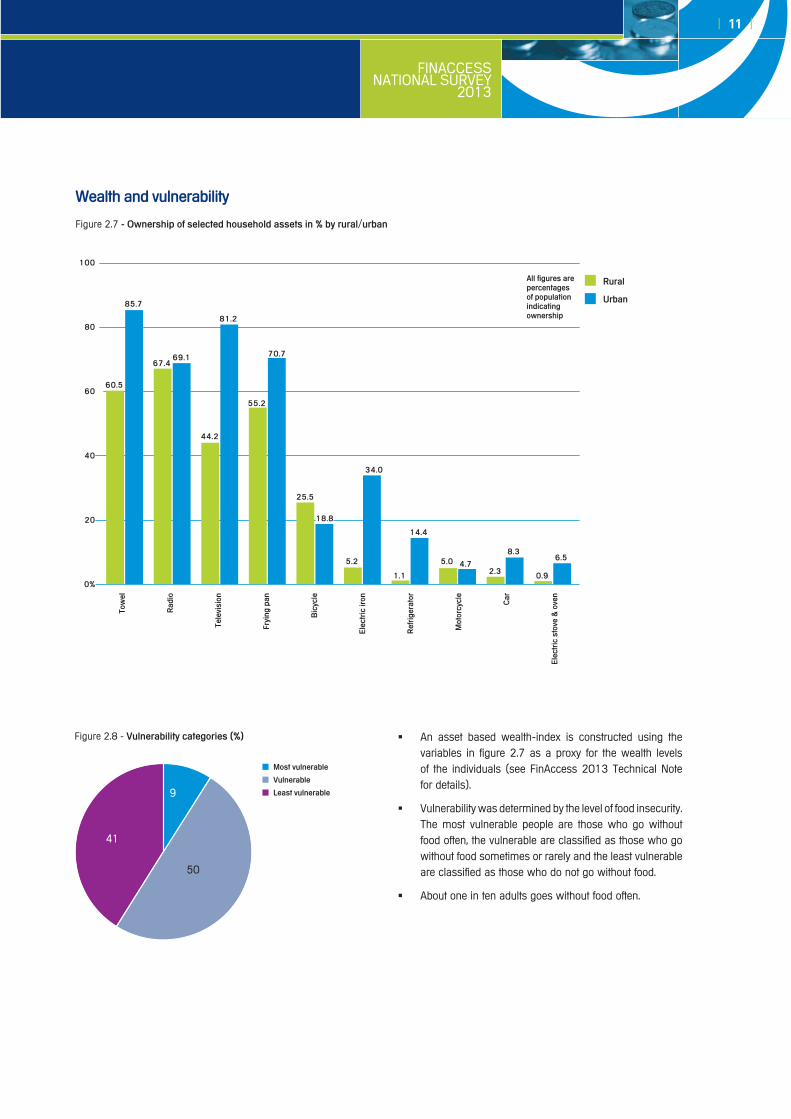
An asset based wealth-index is constructed using the �variables in figure 2.7 as a proxy for the wealth levels of the individuals (see FinAccess 2013 Technical Note for details).
Vulnerability was determined by the level of food insecurity. �The most vulnerable people are those who go without food often, the vulnerable are classified as those who go without food sometimes or rarely and the least vulnerable are classified as those who do not go without food.
About one in ten adults goes without food often. �
Figure 2.8 - Vulnerability categories (%)
Most vulnerable
Vulnerable
least vulnerable
Figure 2.7 - Ownership of selected household assets in % by rural/urban
Wealth and vulnerability
Tow
el
rad
io
Tele
visi
on
Fryi
ng p
an
bic
ycle
ele
ctri
c ir
on
ref
rige
rato
r
Mot
orcy
cle
car
ele
ctri
c st
ove
& o
ven
100
80
60
40
20
0%
rural
Urban
all figures are percentages of population indicating ownership
60.5
44.2
55.2
25.5
5.2
1.1
5.0
85.7
81.2
70.7
18.8
34.0
14.4
4.72.3
8.3
0.9
6.5
67.469.1
41
9
50
| 12 |
FINACCESS NATIONAL SURVEY2013
3. Financial access and usage in Kenya
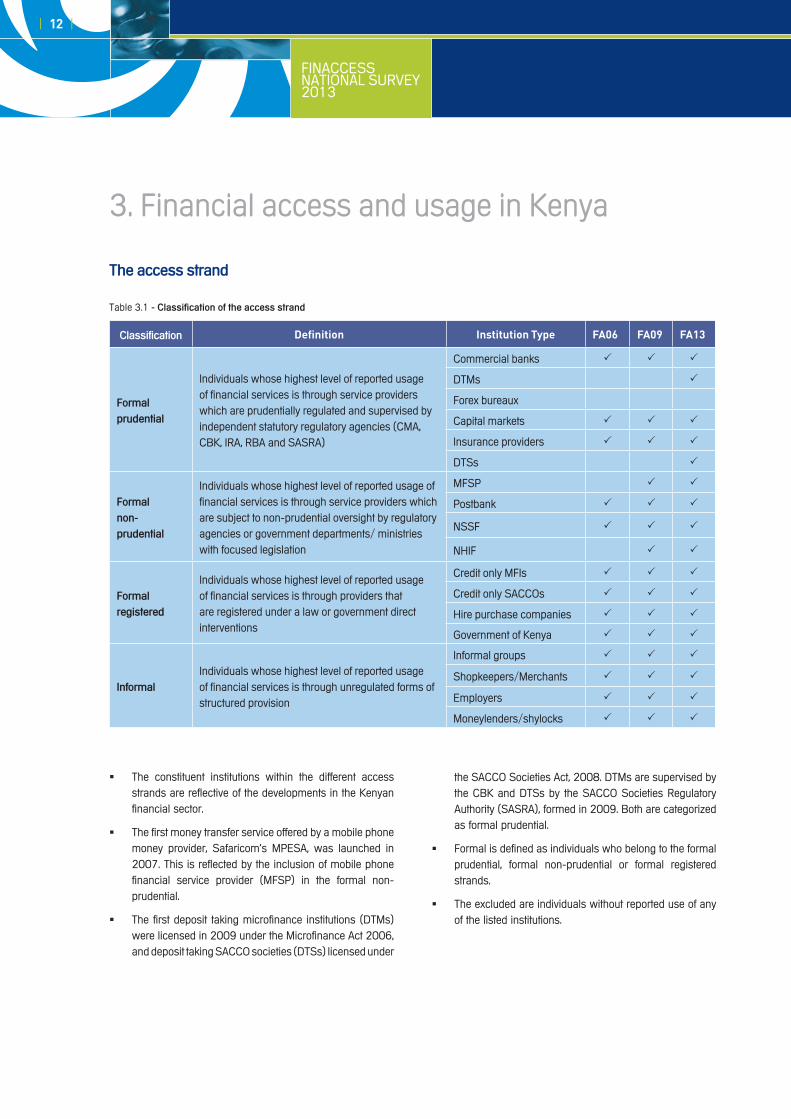
Table 3.1 - classification of the access strand
The access strand
classification Definition Institution Type FA06 FA09 FA13
Formalprudential
Individuals whose highest level of reported usage of financial services is through service providers which are prudentially regulated and supervised by independent statutory regulatory agencies (CMA, CBK, IRA, RBA and SASRA)
Commercial banks
DTMs
Forex bureaux
Capital markets
Insurance providers
DTSs
Formalnon-prudential
Individuals whose highest level of reported usage of financial services is through service providers which are subject to non-prudential oversight by regulatory agencies or government departments/ ministries with focused legislation
MFSP
Postbank
NSSF
NHIF
Formalregistered
Individuals whose highest level of reported usage of financial services is through providers that are registered under a law or government direct interventions
Credit only MFIs
Credit only SACCOs
Hire purchase companies
Government of Kenya
informalIndividuals whose highest level of reported usage of financial services is through unregulated forms of structured provision
Informal groups
Shopkeepers/Merchants
Employers
Moneylenders/shylocks
The constituent institutions within the different access �strands are reflective of the developments in the Kenyan financial sector.
The first money transfer service offered by a mobile phone �money provider, Safaricom’s MPESA, was launched in 2007. This is reflected by the inclusion of mobile phone financial service provider (MFSP) in the formal non-prudential.
The first deposit taking microfinance institutions (DTMs) �were licensed in 2009 under the Microfinance Act 2006, and deposit taking SACCO societies (DTSs) licensed under
the SACCO Societies Act, 2008. DTMs are supervised by the CBK and DTSs by the SACCO Societies Regulatory Authority (SASRA), formed in 2009. Both are categorized as formal prudential.
Formal is defined as individuals who belong to the formal �prudential, formal non-prudential or formal registered strands.
The excluded are individuals without reported use of any �of the listed institutions.
FINACCESS NATIONAL SURVEY
2013
| 13 |
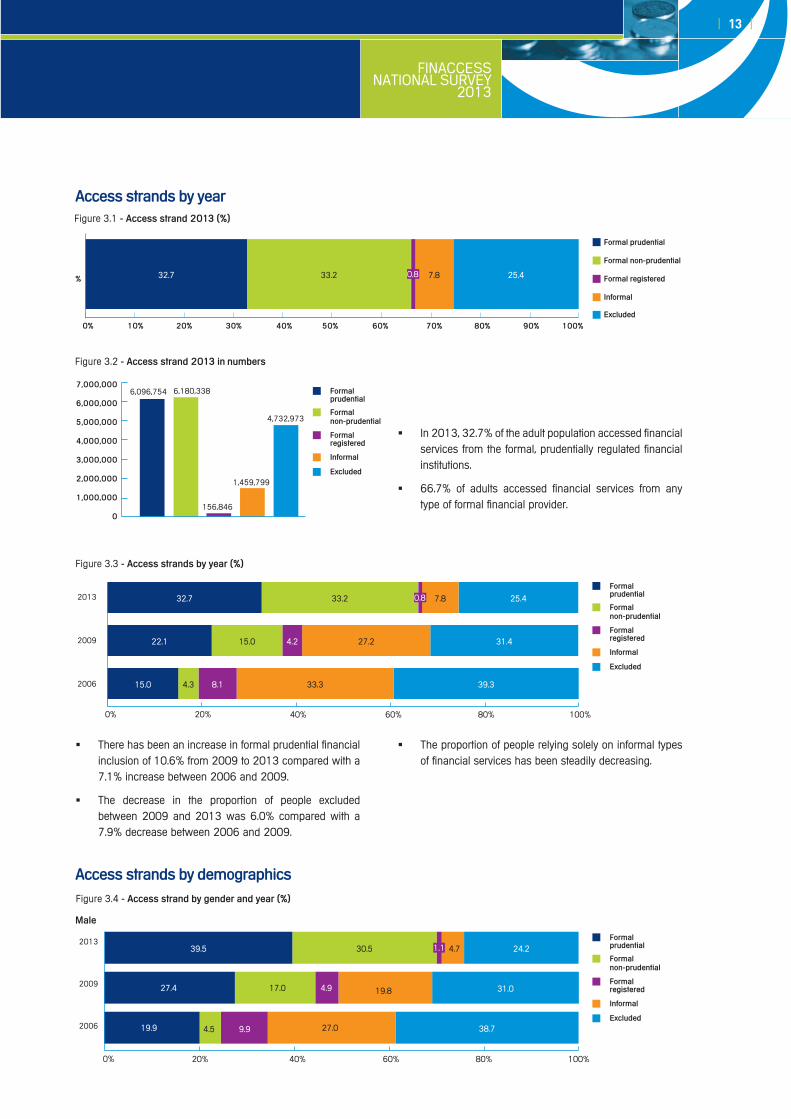
In 2013, 32.7% of the adult population accessed financial �services from the formal, prudentially regulated financial institutions.
66.7% of adults accessed financial services from any �type of formal financial provider.
Figure 3.2 - access strand 2013 in numbers
Figure 3.1 - access strand 2013 (%)
Formal prudential
Formal registered
Formal non-prudential
informal
excluded0%
%
10%
32.7 33.2 0.8 7.8 25.4
20% 30% 40% 50% 60% 70% 80% 90% 100%
7,000,000
6,000,000
5,000,000
4,000,000
3,000,000
2,000,000
1,000,000
0
6,096,754 6,180,338
156,846
1,459,799
4,732,973
Formal registered
Formalnon-prudential
informal
excluded
Formal prudential
There has been an increase in formal prudential financial �inclusion of 10.6% from 2009 to 2013 compared with a 7.1% increase between 2006 and 2009.
The decrease in the proportion of people excluded �between 2009 and 2013 was 6.0% compared with a 7.9% decrease between 2006 and 2009.
The proportion of people relying solely on informal types �of financial services has been steadily decreasing.
Figure 3.4 - access strand by gender and year (%)
Figure 3.3 - access strands by year (%)
Formal registered
Formalnon-prudential
informal
excluded
Formal prudential2013
2009
2006
0% 20% 40% 60% 100%80%
32.7
22.1
15.0
33.2
15.0
4.3
0.8
4.2
8.1
7.8
27.2
33.3
25.4
31.4
39.3
Formal registered
Formalnon-prudential
informal
excluded
Formal prudential2013
2009
2006
0% 20% 40% 60% 100%80%
Male
39.5
27.4
19.9
30.5
17.0
4.5
1.1
4.9
9.9
4.7
19.8
27.0
24.2
31.0
38.7
access strands by demographics
access strands by year
| 14 |
FINACCESS NATIONAL SURVEY2013
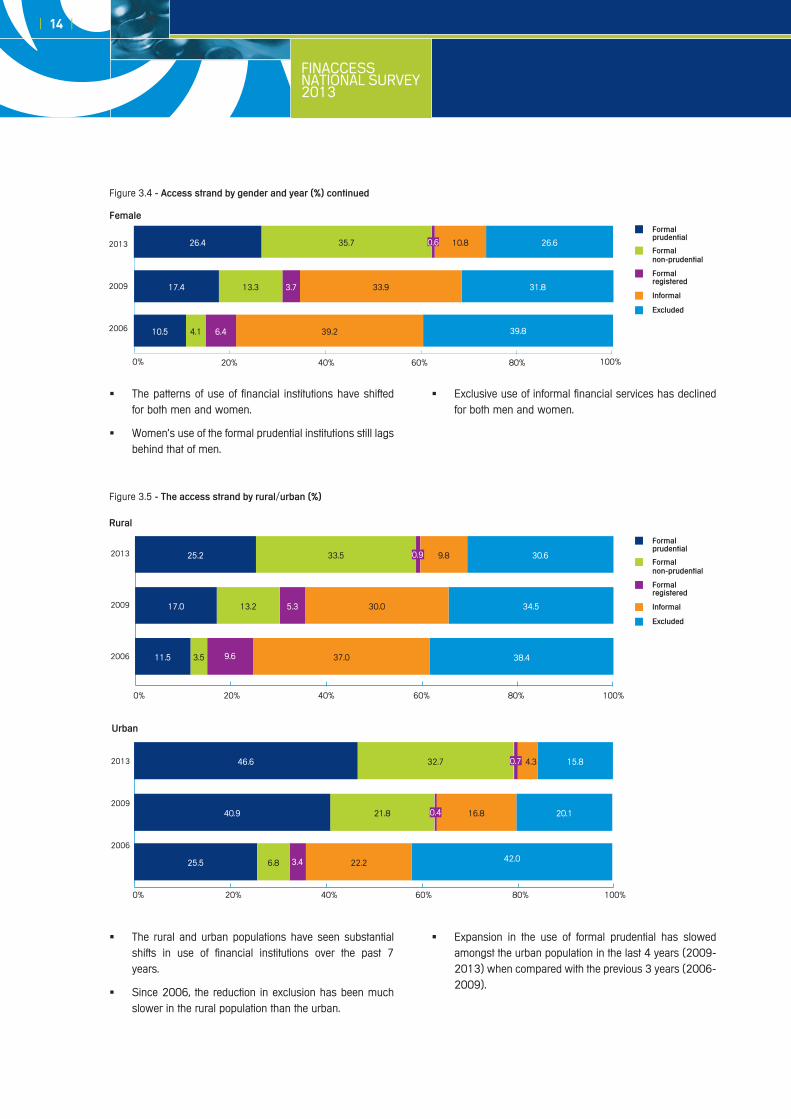
The rural and urban populations have seen substantial �shifts in use of financial institutions over the past 7 years.
Since 2006, the reduction in exclusion has been much �slower in the rural population than the urban.
Expansion in the use of formal prudential has slowed �amongst the urban population in the last 4 years (2009-2013) when compared with the previous 3 years (2006-2009).
Figure 3.5 - The access strand by rural/urban (%)
Urban
2013
2009
2006
0% 20% 40% 60% 100%80%
46.6 32.7 0.7 4.3 15.8
40.9
25.5
21.8
6.8
0.4
3.4
16.8
22.2
20.1
42.0
The patterns of use of financial institutions have shifted �for both men and women.
Women's use of the formal prudential institutions still lags �behind that of men.
Exclusive use of informal financial services has declined �for both men and women.
2013
2009
2006
Female
0% 20% 40% 60% 100%80%
26.4
17.4
10.5
35.7
13.3
4.1
0.6
3.7
6.4
10.8
33.9
39.2
26.6
31.8
39.8
Formal registered
Formalnon-prudential
informal
excluded
Formal prudential
2013
2009
2006
0% 20% 40% 60% 100%80%
rural
25.2
17.0
11.5
33.5
13.2
3.5
0.9
5.3
9.6
9.8
30.0
37.0
30.6
34.5
38.4
Formal registered
Formalnon-prudential
informal
excluded
Formal prudential
Figure 3.4 - access strand by gender and year (%) continued
FINACCESS NATIONAL SURVEY
2013
| 15 |
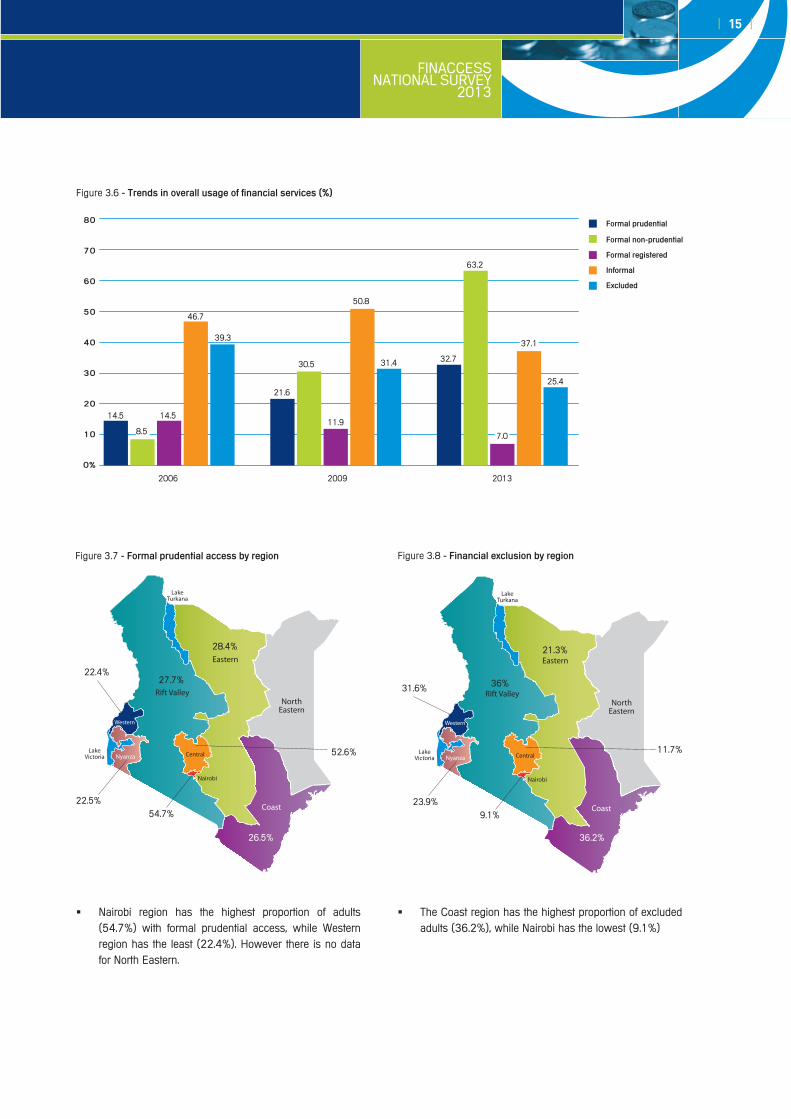
Figure 3.7 - Formal prudential access by region
22.4%
22.5%54.7%
52.6%
28.4%
27.7%
26.5%
Western
Nairobi region has the highest proportion of adults �(54.7%) with formal prudential access, while Western region has the least (22.4%). However there is no data for North Eastern.
Figure 3.8 - Financial exclusion by region
The Coast region has the highest proportion of excluded �adults (36.2%), while Nairobi has the lowest (9.1%)
Figure 3.6 - Trends in overall usage of financial services (%)
2006 2009 2013
80
70
60
50
40
30
20
10
0%
14.5
8.5
14.5
46.7
39.3
21.6
30.5
11.9
50.8
31.4 32.7
63.2
7.0
37.1
25.4
Formal registered
Formal non-prudential
informal
excluded
Formal prudential
31.6%
23.9%9.1%
11.7%
21.3%
36%
36.2%
Western
| 16 |
FINACCESS NATIONAL SURVEY2013
access strands by livelihood and wealth
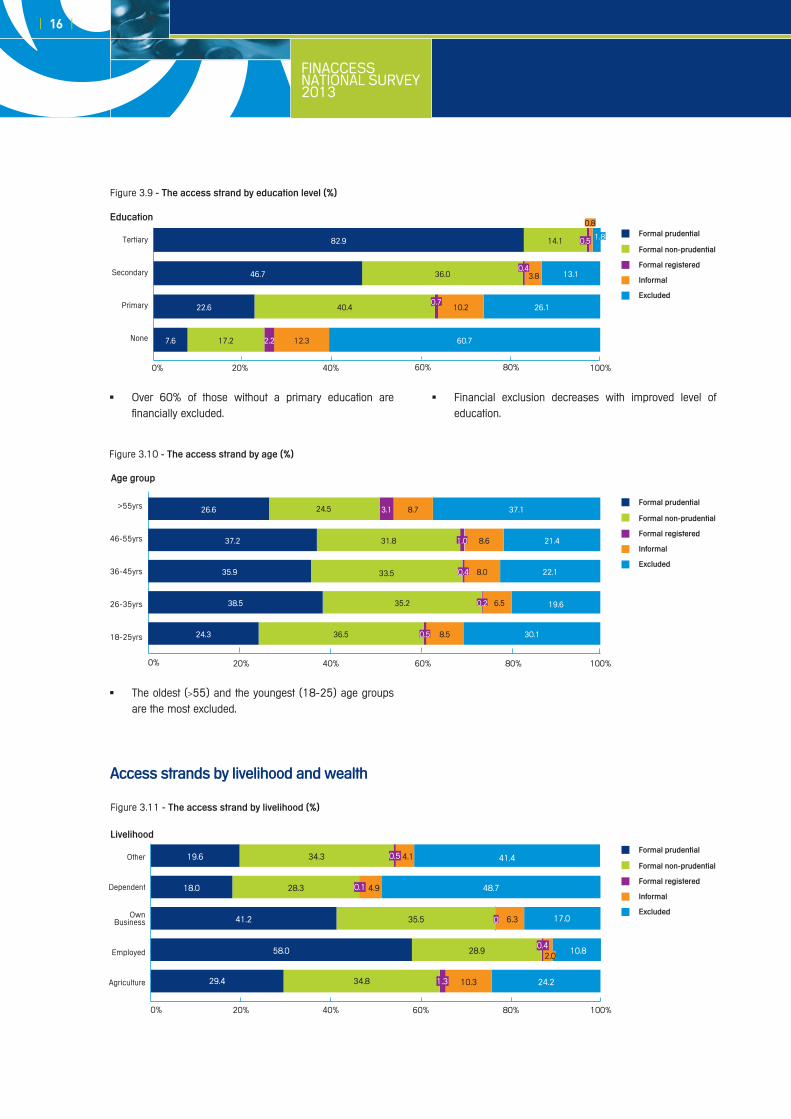
The oldest ( � >55) and the youngest (18-25) age groups are the most excluded.
Over 60% of those without a primary education are �financially excluded.
Financial exclusion decreases with improved level of �education.
Figure 3.9 - The access strand by education level (%)
Figure 3.10 - The access strand by age (%)
Tertiary
Secondary
Primary
None
0% 20% 40% 60% 100%80%
education
82.9
46.7
22.6
7.6 17.2 2.2 12.3 60.7
40.40.7
10.2 26.1
36.00.4
3.8 13.1
14.1 0.5
0.8
1.8
Formal registered
Formal non-prudential
informal
excluded
Formal prudential
>55yrs
46-55yrs
36-45yrs
26-35yrs
18-25yrs
0% 20% 40% 60% 100%80%
age group
26.6
37.2
35.9
38.5
24.3
31.8
33.5
35.2
36.5
1.0
0.4
0.2
0.5
8.6
8.0
6.5
8.5
21.4
22.1
19.6
30.1
24.5 3.1 8.7 37.1
Formal registered
Formal non-prudential
informal
excluded
Formal prudential
Figure 3.11 - The access strand by livelihood (%)
livelihood
Other
Dependent
OwnBusiness
Employed
Agriculture
0% 20% 40% 60% 100%80%
19.6
18.0
41.2
58.0
29.4
34.3
28.3
35.5
28.9
34.8
4.1
4.9
0
0.4
1.3
0.5
0.1
6.3
2.0
10.3
41.4
48.7
17.0
10.8
24.2
Formal registered
Formal non-prudential
informal
excluded
Formal prudential
FINACCESS NATIONAL SURVEY
2013
| 17 |
Twice as many of those employed have formal prudential �access than those in agriculture.
Almost half the dependents are excluded, while only one �in ten of those who are employed are excluded.
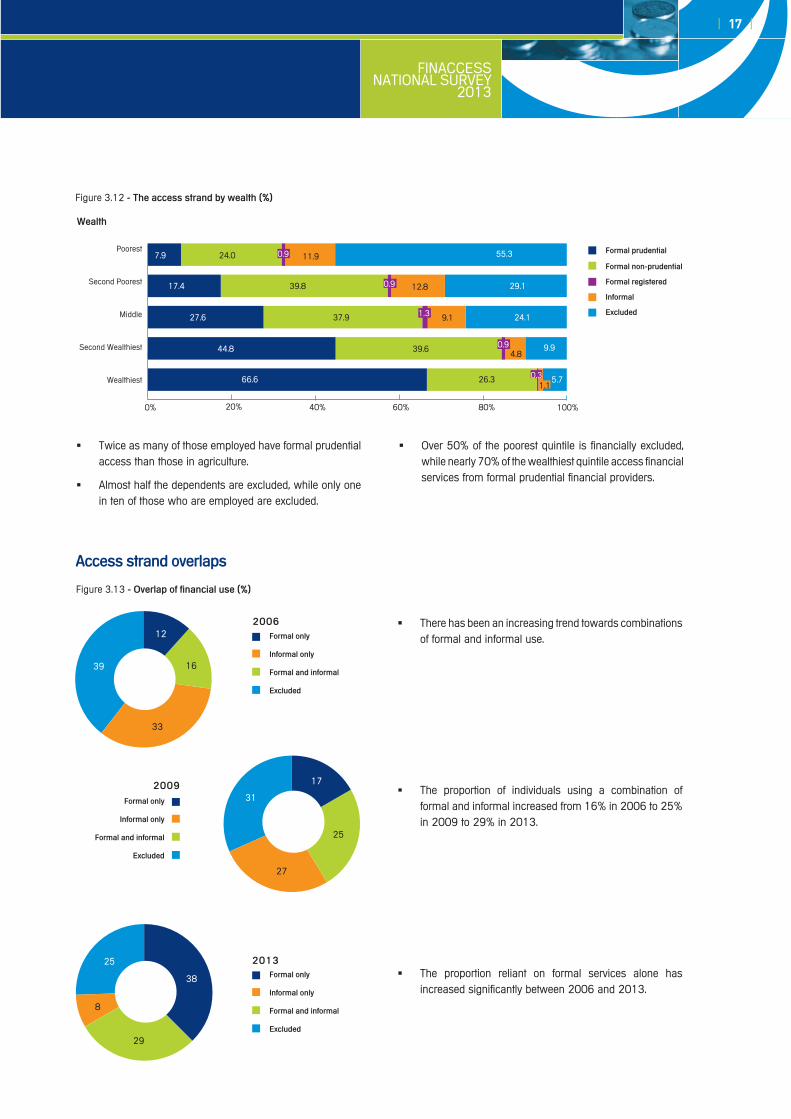
Over 50% of the poorest quintile is financially excluded, �while nearly 70% of the wealthiest quintile access financial services from formal prudential financial providers.
Wealth
Poorest
Second Poorest
Middle
Second Wealthiest
Wealthiest
0% 20% 40% 60% 100%80%
7.9
17.4
27.6
44.8
66.6
24.0
39.8
37.9
39.6
26.3
11.9
0.9
1.3
0.9
0.3
0.9
12.8
9.1
4.8
1.1
55.3
29.1
24.1
9.9
5.7
Figure 3.12 - The access strand by wealth (%)
Figure 3.13 - Overlap of financial use (%)
access strand overlaps
There has been an increasing trend towards combinations �of formal and informal use.
The proportion of individuals using a combination of �formal and informal increased from 16% in 2006 to 25% in 2009 to 29% in 2013.
The proportion reliant on formal services alone has �increased significantly between 2006 and 2013.
39
12
16
33
31
17
25
27
25
38
29
8
Formal only
informal only
Formal and informal
excluded
Formal only
informal only
Formal and informal
excluded
Formal only
informal only
Formal and informal
excluded
2006
2009
2013
Formal registered
Formal non-prudential
informal
excluded
Formal prudential
| 18 |
FINACCESS NATIONAL SURVEY2013
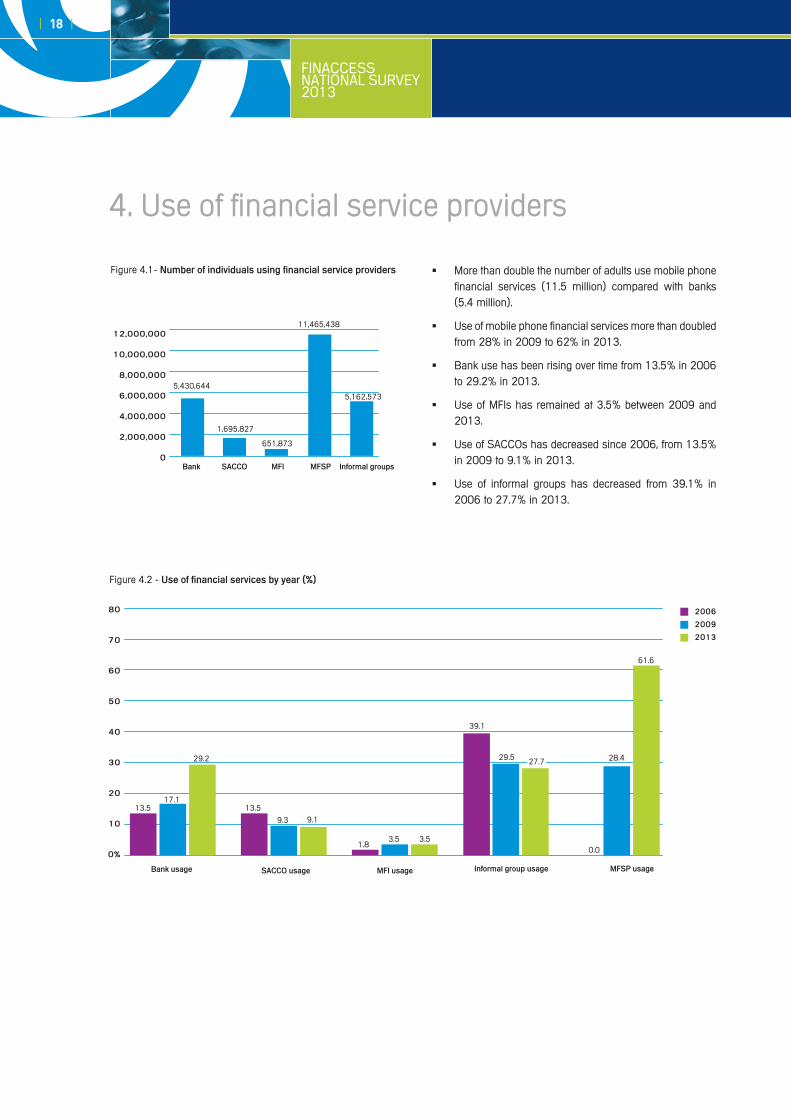
More than double the number of adults use mobile phone �financial services (11.5 million) compared with banks (5.4 million).
Use of mobile phone financial services more than doubled �from 28% in 2009 to 62% in 2013.
Bank use has been rising over time from 13.5% in 2006 �to 29.2% in 2013.
Use of MFIs has remained at 3.5% between 2009 and �2013.
Use of SACCOs has decreased since 2006, from 13.5% �in 2009 to 9.1% in 2013.
Use of informal groups has decreased from 39.1% in �2006 to 27.7% in 2013.
Figure 4.1- number of individuals using financial service providers
4. Use of financial service providers
12,000,000
10,000,000
8,000,000
6,000,000
4,000,000
2,000,000
0bank saccO MFi MFsp informal groups
5,430,644
1,695,827
651,873
11,465,438
5,162,573
Figure 4.2 - Use of financial services by year (%)
80
70
60
50
40
30
20
10
0%
informal group usagebank usage saccO usage MFi usage MFsp usage
2006
2009
2013
27.7 28.4
61.6
0.0
17.1
29.2
13.513.5
9.3 9.1
1.83.5 3.5
39.1
29.5
FINACCESS NATIONAL SURVEY
2013
| 19 |
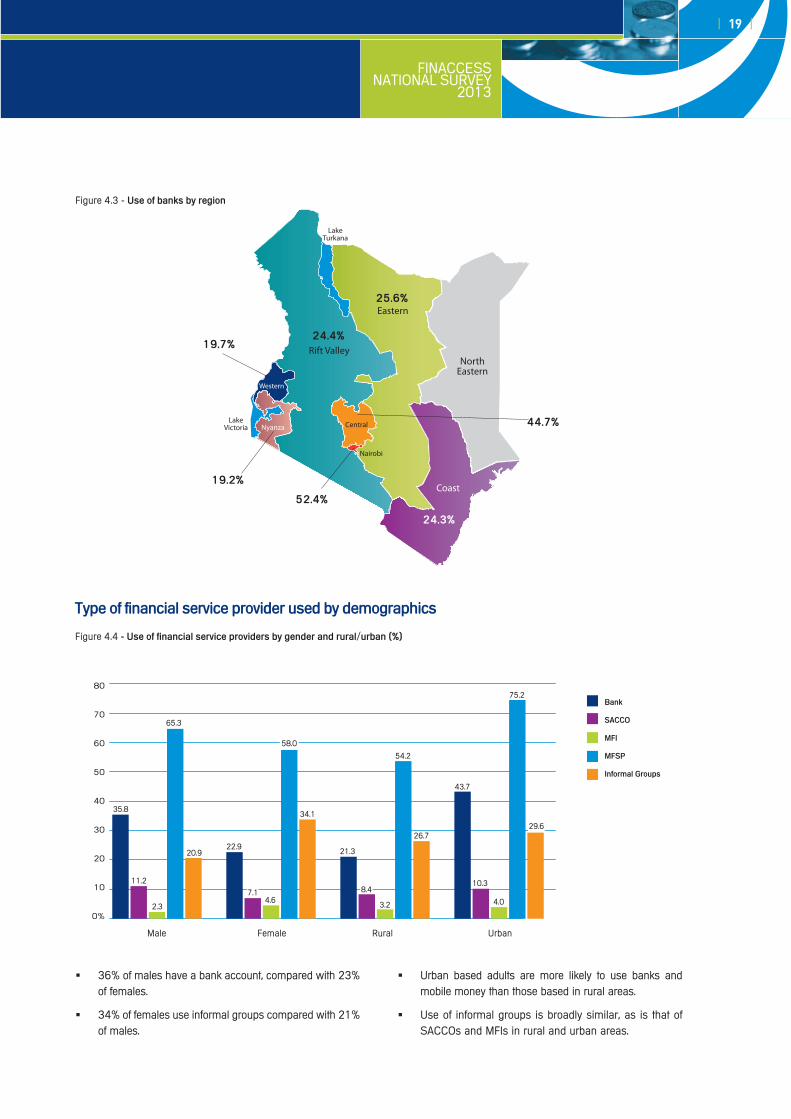
Figure 4.3 - Use of banks by region
19.7%
19.2%
52.4%
44.7%
25.6%
24.4%
24.3%
Western
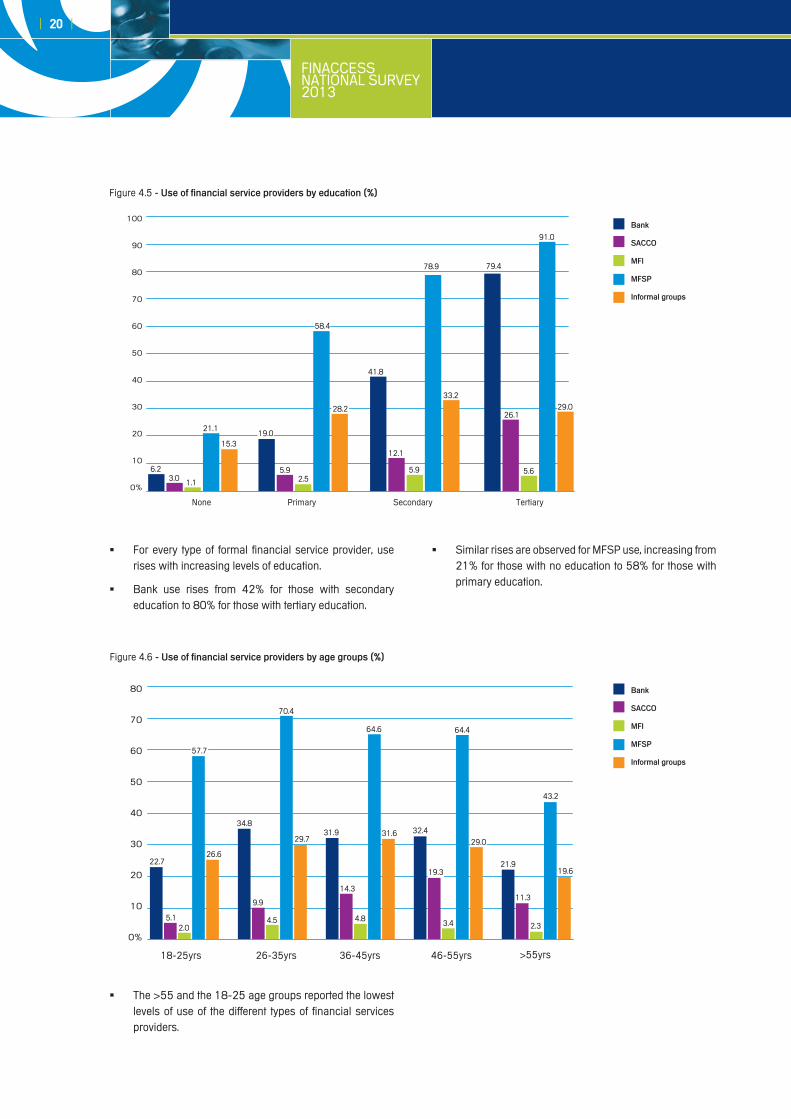
Figure 4.4 - Use of financial service providers by gender and rural/urban (%)
Type of financial service provider used by demographics
bank
saccO
MFi
MFsp
informal Groups
80
70
60
50
40
30
20
10
0%
Male Female Rural Urban
35.8
11.2
2.3
65.3
20.922.9
7.14.6
58.0
34.1
21.3
8.4
3.2
54.2
26.7
43.7
10.3
4.0
75.2
29.6
36% of males have a bank account, compared with 23% �of females.
34% of females use informal groups compared with 21% �of males.
Urban based adults are more likely to use banks and �mobile money than those based in rural areas.
Use of informal groups is broadly similar, as is that of �SACCOs and MFIs in rural and urban areas.
| 20 |
FINACCESS NATIONAL SURVEY2013
For every type of formal financial service provider, use �rises with increasing levels of education.
Bank use rises from 42% for those with secondary �education to 80% for those with tertiary education.
Similar rises are observed for MFSP use, increasing from �21% for those with no education to 58% for those with primary education.
The � >55 and the 18-25 age groups reported the lowest levels of use of the different types of financial services providers.
100
90
80
70
60
50
40
30
20
10
0%
None Primary Secondary Tertiary
6.2
19.0
3.05.9
1.1 2.5
15.3
28.2
41.8
78.9
33.2
79.4
91.0
26.129.0
5.6
12.1
5.9
21.1
58.4
Figure 4.5 - Use of financial service providers by education (%)
bank
saccO
MFi
MFsp
informal groups
80
70
60
50
40
30
20
10
0%
18-25yrs 26-35yrs 36-45yrs 46-55yrs >55yrs
22.7
5.12.0
57.7
26.6
34.8
9.9
4.5
70.4
29.731.9
14.3
4.8
64.6
31.6 32.4
19.3
3.4
64.4
29.0
21.9
11.3
2.3
43.2
19.6
Figure 4.6 - Use of financial service providers by age groups (%)
bank
saccO
MFi
MFsp
informal groups

FINACCESS NATIONAL SURVEY
2013
| 21 |
Figure 4.7 - Use of financial service providers by livelihood (%)
100
90
80
70
60
50
40
30
20
10
0%Wealthiest Second
wealthiestMiddle Second
poorest Poorest
62.9
16.5
6.0
87.9
31.5
40.0
13.1
4.9
79.1
31.5
22.9
9.2
2.3
60.2
31.9
13.5
4.6 3.0
52.1
28.2
5.82.1
1.3
28.0
15.5
Figure 4.8 - Use of financial service providers by wealth (%)
100
90
80
70
60
50
40
30
20
10
0%
Agriculture Employed Own business Dependent Other
24.9
10.0
3.6
59.4
31.3
56.4
83.8
25.3
36.8
72.6
33.5
16.3
1.2 1.7
41.6
13.0
19.6
4.81.6
52.6
12.3
4.27.8
17.3
2.2
bank
saccO
MFi
MFsp
informal groups
Use of banks, mobile money, SACCOs and MFIs is �highest in the wealthiest quintile and lowest in the poorest quintile.
Use of informal groups stays roughly the same across the �first three quintiles, with only a slight drop in the fourth; it declines sharply amongst the poorest.
Use of banks, MFSP and SACCOs is highest amongst �the employed.
Use of informal groups and MFIs is highest amongst �those who own a business or derive livelihood from agriculture.
| 22 |
FINACCESS NATIONAL SURVEY2013
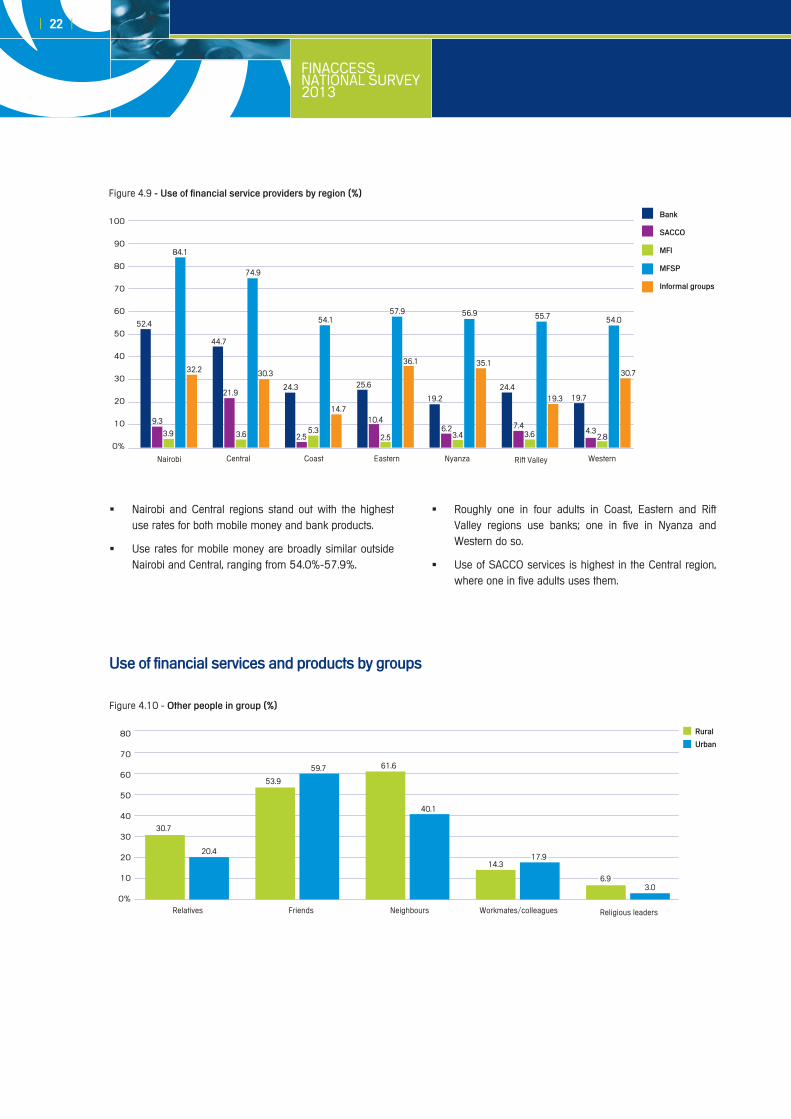
Nairobi and Central regions stand out with the highest �use rates for both mobile money and bank products.
Use rates for mobile money are broadly similar outside �Nairobi and Central, ranging from 54.0%-57.9%.
Roughly one in four adults in Coast, Eastern and Rift �Valley regions use banks; one in five in Nyanza and Western do so.
Use of SACCO services is highest in the Central region, �where one in five adults uses them.
Use of financial services and products by groups
Figure 4.10 - Other people in group (%)
rural
Urban80
70
60
50
40
30
20
10
0%Relatives Friends Neighbours Workmates/colleagues Religious leaders
30.7
20.4
53.9
59.7 61.6
40.1
14.317.9
6.93.0
Figure 4.9 - Use of financial service providers by region (%)
100
90
80
70
60
50
40
30
20
10
0%
Nairobi Central Coast Eastern Nyanza Rift Valley Western
52.4
9.3
3.9
84.1
32.2
44.7
21.9
3.6
74.9
30.3
24.3
2.55.3
54.1
14.7
25.6
10.4
2.5
57.9
36.1
19.2
6.23.4
56.9
35.1
24.4
7.43.6
55.7
19.3 19.7
4.32.8
54.0
30.7
bank
saccO
MFi
MFsp
informal groups
FINACCESS NATIONAL SURVEY
2013
| 23 |
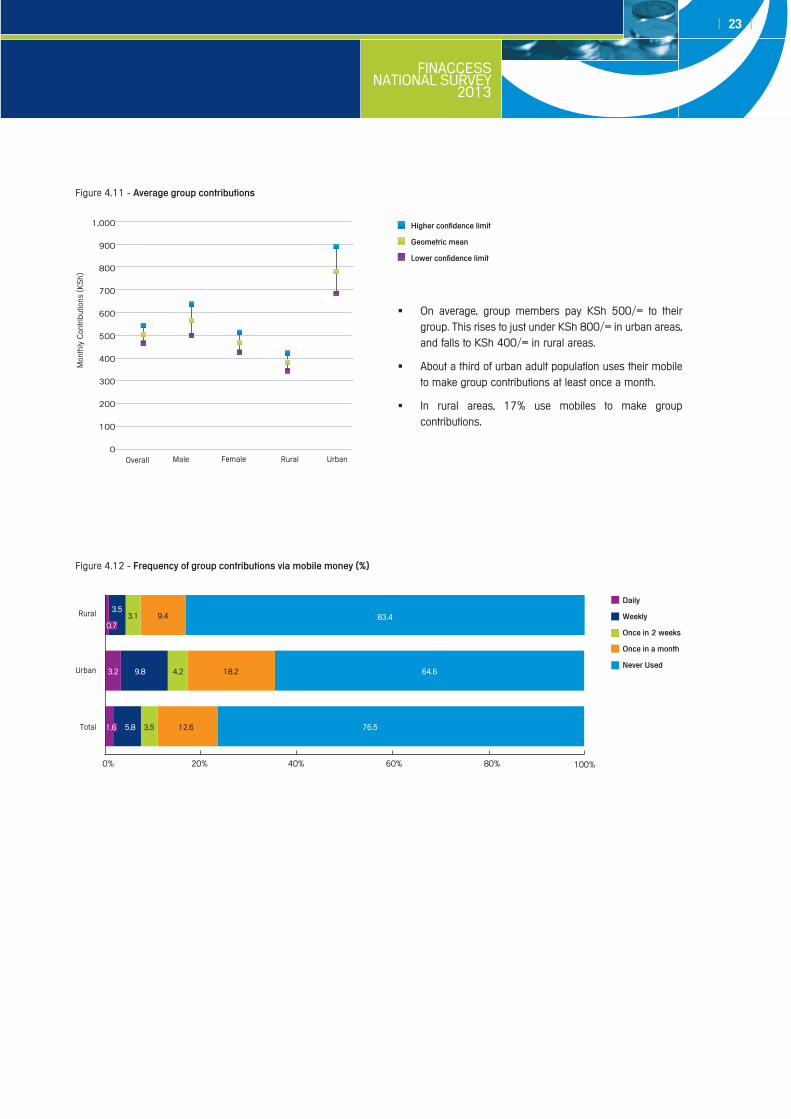
Figure 4.11 - average group contributions
1,000
900
800
700
600
500
400
300
200
100
0Overall
Mon
thly
Con
trib
utio
ns (
KS
h)
Male Female Rural Urban
higher confidence limit
Geometric mean
lower confidence limit
Figure 4.12 - Frequency of group contributions via mobile money (%)
On average, group members pay KSh 500/= to their �group. This rises to just under KSh 800/= in urban areas, and falls to KSh 400/= in rural areas.
About a third of urban adult population uses their mobile �to make group contributions at least once a month.
In rural areas, 17% use mobiles to make group �contributions.
Rural
Urban
Total
0% 20% 40% 60% 100%80%
Daily
Weekly
Once in 2 weeks
Once in a month
never Used
0.7
3.2
1.6
3.1
4.2
3.5
3.5
9.8
5.8
9.4
18.2
12.6
83.4
64.6
76.5
| 24 |
FINACCESS NATIONAL SURVEY2013
Figure 4.13 - What group does for its members (%)
Figure 4.14 - Group does/has these items/characteristics (%)
80
70
60
50
40
30
20
10
0%
80
70
60
50
40
30
20
10
0%
We
colle
ct m
oney
and
giv
e to
eac
h m
embe
r a lu
mp
sum
(po
t) o
r gift
in
turn
Wel
fare
/cla
n gr
oup
– w
e he
lp e
ach
othe
r out
for t
hing
s lik
e fu
nera
ls
We
save
and
lend
mon
ey to
m
embe
rs a
nd n
on-m
embe
rs to
be
repa
id w
ith in
tere
st
We
save
toge
ther
and
put
the
mon
ey
in a
n ac
coun
t
We
perio
dica
lly d
istr
ibut
e al
l mon
ies
held
by
the
grou
p to
its
mem
bers
We
mak
e ot
her k
inds
of i
nves
tmen
ts
as a
gro
up e
g pr
oper
ty, b
usin
ess
We
inve
st in
the
stoc
k m
arke
t as
a gr
oup
A w
ritte
n re
cord
of t
he m
oney
m
embe
rs h
ave
paid
/ re
ceiv
ed
Ele
ct o
ffici
als
thro
ugh
votin
g
A tr
easu
rer/
finan
ce p
erso
n w
ho
is n
ot a
lso
the
chai
rman
A w
ritte
n co
nstit
utio
n
A c
ertif
icat
e of
reg
istr
atio
n
A b
ank
acco
unt
Mor
e th
an o
ne s
igna
tory
on
the
cheq
ue b
ook
A g
roup
che
que
book
A lo
ckab
le m
oney
box
with
mor
e th
an o
ne k
ey
Rec
eive
don
atio
ns/g
rant
s fr
om
orga
nisa
tions
Bor
row
mon
ey fr
om in
divi
dual
/
priv
ate
inve
stor
Bor
row
mon
ey fr
om M
FIs
eg
KW
FT, F
aulu
Bor
row
mon
ey fr
om a
ban
k eg
Som
eone
who
is n
ot a
mem
ber
of th
e gr
oup
who
man
ages
it
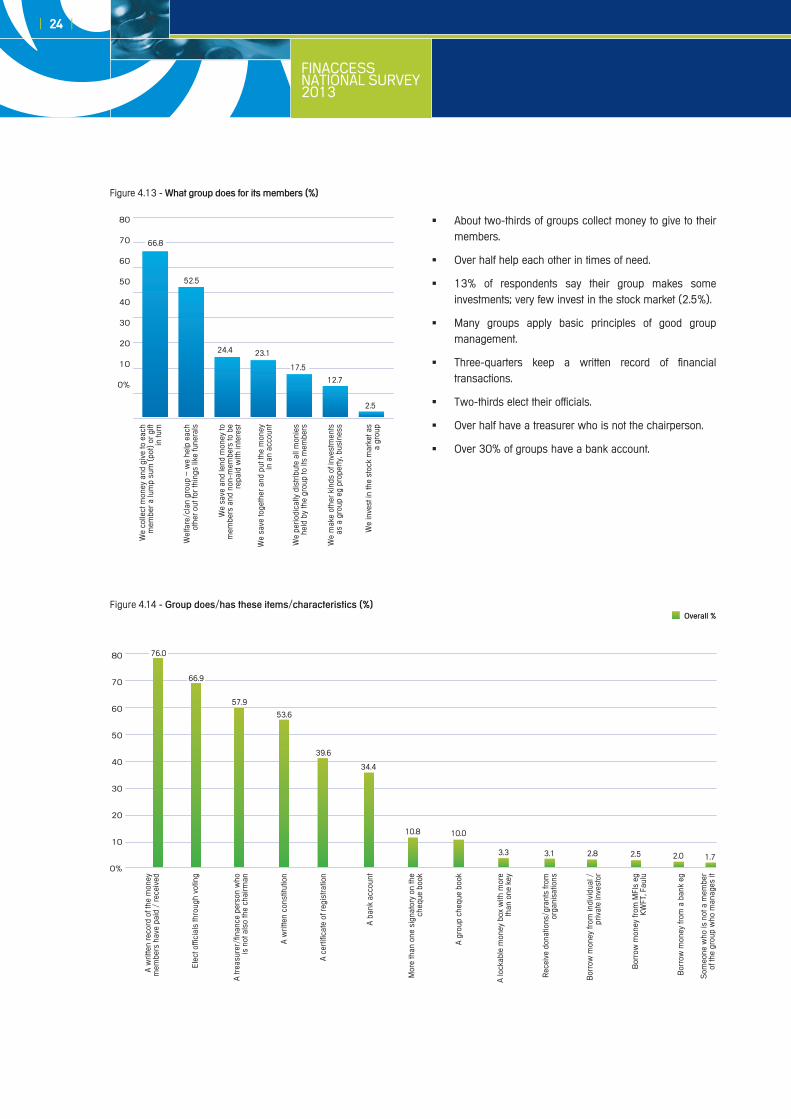
About two-thirds of groups collect money to give to their �members.
Over half help each other in times of need. �
13% of respondents say their group makes some �investments; very few invest in the stock market (2.5%).
Many groups apply basic principles of good group �management.
Three-quarters keep a written record of financial �transactions.
Two-thirds elect their officials. �
Over half have a treasurer who is not the chairperson. �
Over 30% of groups have a bank account. �
66.8
52.5
24.4 23.1
17.5
12.7
2.5
Overall %
76.0
66.9
57.9
53.6
39.6
34.4
10.8 10.0
3.3 3.1 2.8 2.5 2.0 1.7
FINACCESS NATIONAL SURVEY
2013
| 25 |
Figure 4.15 - reasons for joining groups (%)
To h
ave
a lu
mp
sum
to u
se w
hen
its y
our
turn
To k
eep
mon
ey s
afe
To h
elp
whe
n th
ere
is a
dea
th in
the
fam
ily
To h
elp
whe
n th
ere
is a
ny o
ther
em
erge
ncy
it is
com
puls
ory
in y
our
clan
/vill
age
To s
ocia
lise
/ m
eet y
our
frie
nds
To e
xcha
nge
idea
s ab
out b
usin
ess
To in
vest
in b
igge
r th
ings
by
pulli
ng m
oney
/
reso
urce
s to
geth
er
Gro
up b
uys
you
hous
ehol
d go
ods
or fa
rm
good
whe
n its
you
r tu
rn
To in
crea
se in
com
e by
lend
ing
bec
ause
you
cou
ld n
ot g
et m
oney
or
help
an
ywhe
re e
lse
You
can
get m
oney
eas
ily w
hen
you
need
it
Get
str
engt
h to
sav
e fr
om s
avin
g w
ith
othe
rs
can
't sa
ve a
t hom
e -
mon
ey g
ets
used
on
othe
r th
ings
bec
ause
it e
ncou
rage
s m
e to
wor
k ha
rder
Oth
er
9.89.7
1.0 1.0 1.4 1.8 1.5 0.5 1.1 1.2 1.1 1.3
7.3
4.92.9 2.5
1.6
35
30
25
20
15
10
5
0%
Male
Female31.3
18.2
9.5 9.0
6.2 5.84.3
2.7 2.62.42.5
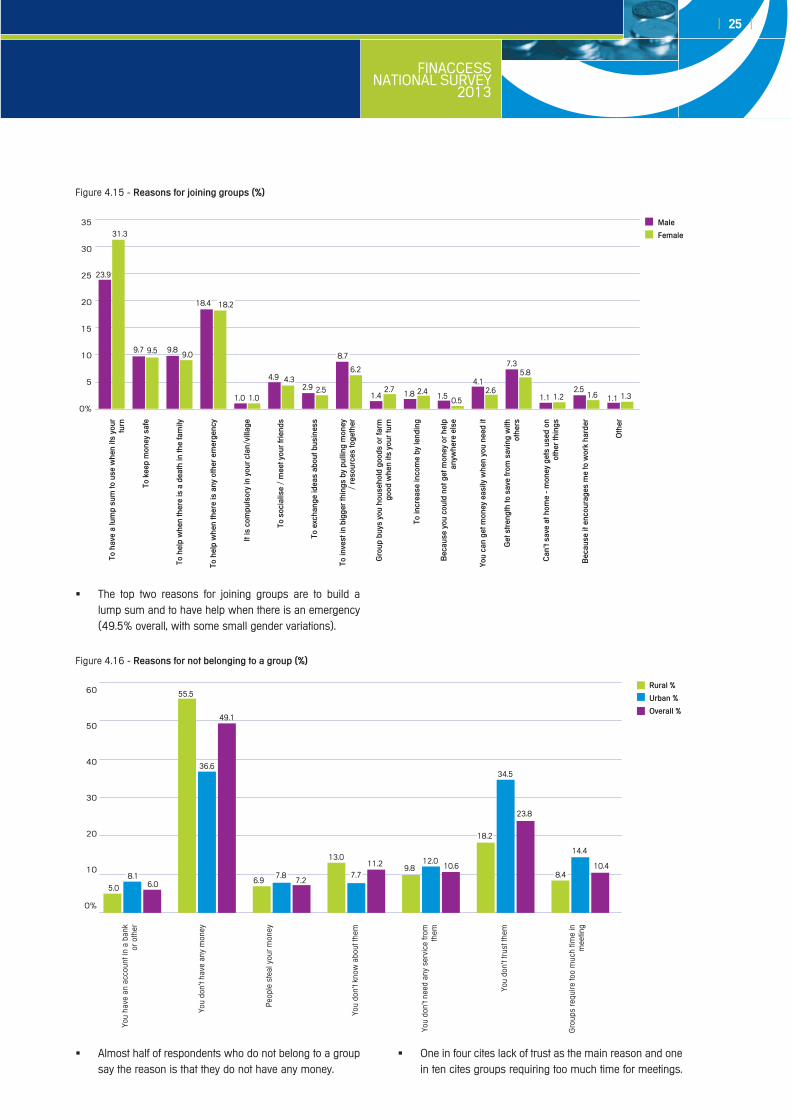
Almost half of respondents who do not belong to a group �say the reason is that they do not have any money.
One in four cites lack of trust as the main reason and one �in ten cites groups requiring too much time for meetings.
The top two reasons for joining groups are to build a �lump sum and to have help when there is an emergency (49.5% overall, with some small gender variations).
Figure 4.16 - reasons for not belonging to a group (%)
rural %
Urban %
Overall %
60
50
40
30
20
10
0%
You
have
an
acco
unt i
n a
bank
or
oth
er
You
don'
t hav
e an
y m
oney
Peo
ple
stea
l you
r m
oney
You
don'
t kno
w a
bout
them
You
don'
t nee
d an
y se
rvic
e fr
om
them
You
don'
t tru
st th
em
Gro
ups
requ
ire to
o m
uch
time
in
mee
ting
5.0
8.1
55.5
36.6
49.1
6.97.8
7.2
13.0
7.711.2 9.8
12.010.6
18.2
34.5
23.8
8.4
14.4
10.4
6.0
23.9
18.4
8.7
4.1
| 26 |
FINACCESS NATIONAL SURVEY2013
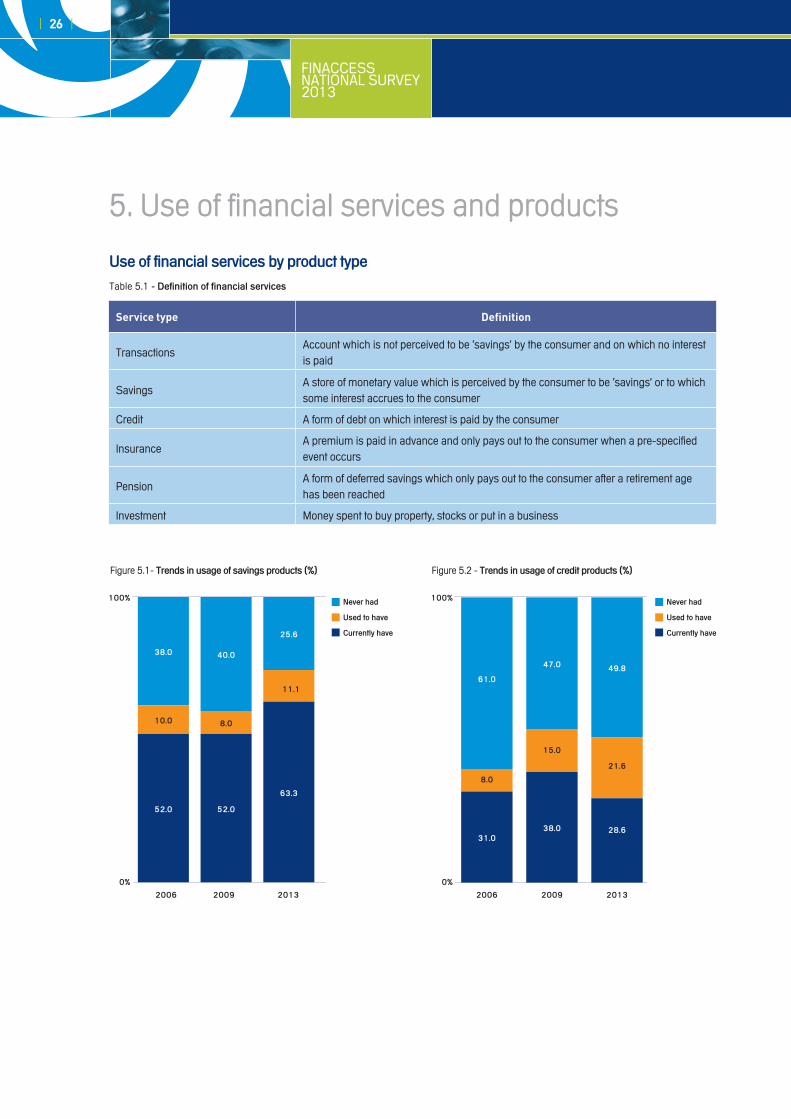
5. Use of financial services and products
Service type Definition
TransactionsAccount which is not perceived to be ‘savings’ by the consumer and on which no interest is paid
SavingsA store of monetary value which is perceived by the consumer to be ‘savings’ or to which some interest accrues to the consumer
Credit A form of debt on which interest is paid by the consumer
InsuranceA premium is paid in advance and only pays out to the consumer when a pre-specified event occurs
PensionA form of deferred savings which only pays out to the consumer after a retirement age has been reached
Investment Money spent to buy property, stocks or put in a business
Figure 5.1- Trends in usage of savings products (%) Figure 5.2 - Trends in usage of credit products (%)
never had
Used to have
currently have
never had
Used to have
currently have
52.0 52.0
63.3
10.0 8.0
11.1
38.0 40.0
25.6
0%
2006 2009 2013
100%
0%
2006 2009 2013
100%
31.038.0 28.6
8.0
15.0
21.6
61.0
47.0 49.8
Table 5.1 - Definition of financial services
Use of financial services by product type
FINACCESS NATIONAL SURVEY
2013
| 27 |
Figure 5.2 - Trends in usage of credit products (%)
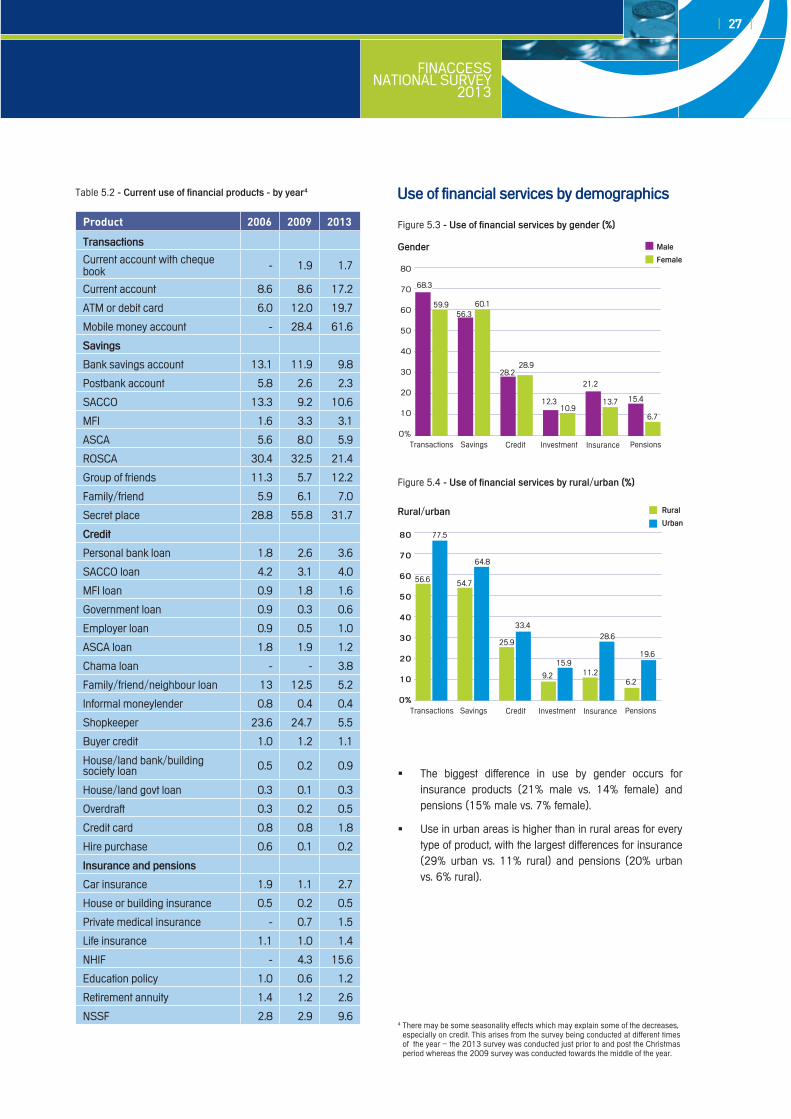
The biggest difference in use by gender occurs for �insurance products (21% male vs. 14% female) and pensions (15% male vs. 7% female).
Use in urban areas is higher than in rural areas for every �type of product, with the largest differences for insurance (29% urban vs. 11% rural) and pensions (20% urban vs. 6% rural).
Product 2006 2009 2013
Transactions
Current account with cheque book - 1.9 1.7
Current account 8.6 8.6 17.2
ATM or debit card 6.0 12.0 19.7
Mobile money account - 28.4 61.6
savings
Bank savings account 13.1 11.9 9.8
Postbank account 5.8 2.6 2.3
SACCO 13.3 9.2 10.6
MFI 1.6 3.3 3.1
ASCA 5.6 8.0 5.9
ROSCA 30.4 32.5 21.4
Group of friends 11.3 5.7 12.2
Family/friend 5.9 6.1 7.0
Secret place 28.8 55.8 31.7
credit
Personal bank loan 1.8 2.6 3.6
SACCO loan 4.2 3.1 4.0
MFI loan 0.9 1.8 1.6
Government loan 0.9 0.3 0.6
Employer loan 0.9 0.5 1.0
ASCA loan 1.8 1.9 1.2
Chama loan - - 3.8
Family/friend/neighbour loan 13 12.5 5.2
Informal moneylender 0.8 0.4 0.4
Shopkeeper 23.6 24.7 5.5
Buyer credit 1.0 1.2 1.1
House/land bank/building society loan 0.5 0.2 0.9
House/land govt loan 0.3 0.1 0.3
Overdraft 0.3 0.2 0.5
Credit card 0.8 0.8 1.8
Hire purchase 0.6 0.1 0.2
insurance and pensions
Car insurance 1.9 1.1 2.7
House or building insurance 0.5 0.2 0.5
Private medical insurance - 0.7 1.5
Life insurance 1.1 1.0 1.4
NHIF - 4.3 15.6
Education policy 1.0 0.6 1.2
Retirement annuity 1.4 1.2 2.6
NSSF 2.8 2.9 9.6
Table 5.2 - current use of financial products - by year4
Figure 5.3 - Use of financial services by gender (%)
Figure 5.4 - Use of financial services by rural/urban (%)
There may be some seasonality effects which may explain some of the decreases, especially on credit. This arises from the survey being conducted at different times of the year – the 2013 survey was conducted just prior to and post the Christmas period whereas the 2009 survey was conducted towards the middle of the year.
Transactions Savings Credit Investment Insurance Pensions
80
70
60
50
40
30
20
10
0%
80
70
60
50
40
30
20
10
0%
Gender
rural/urban
Male
Female
rural
Urban
Transactions Savings Credit Investment Insurance Pensions
68.3
56.6
77.5
54.7
64.8
25.9
33.4
9.2
15.911.2
28.6
6.2
19.6
59.956.3
60.1
28.228.9
12.310.9
21.2
13.7 15.4
6.7
4
Use of financial services by demographics
| 28 |
FINACCESS NATIONAL SURVEY2013
age groups
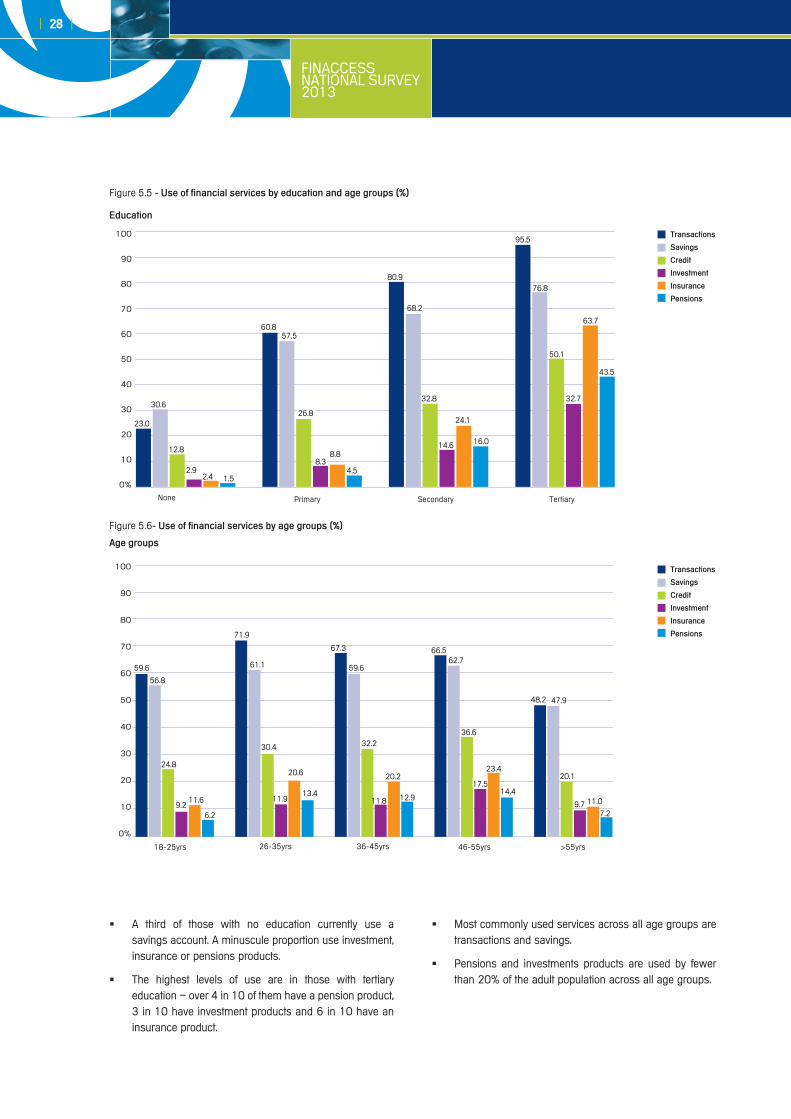
Figure 5.5 - Use of financial services by education and age groups (%)
Figure 5.6- Use of financial services by age groups (%)
A third of those with no education currently use a �savings account. A minuscule proportion use investment, insurance or pensions products.
The highest levels of use are in those with tertiary �education – over 4 in 10 of them have a pension product, 3 in 10 have investment products and 6 in 10 have an insurance product.
Most commonly used services across all age groups are �transactions and savings.
Pensions and investments products are used by fewer �than 20% of the adult population across all age groups.
Transactions
savings
credit
investment
insurance
pensions
Transactions
savings
credit
investment
insurance
pensions
education
100
90
80
70
60
50
40
30
20
10
0%
None Primary Secondary Tertiary
18-25yrs 26-35yrs 36-45yrs 46-55yrs >55yrs
100
90
80
70
60
50
40
30
20
10
0%
23.0
30.6
60.857.5
80.9
68.2
32.8
14.6
24.1
16.0
95.5
76.8
50.1
32.7
63.7
43.5
26.8
8.38.8
4.5
12.8
2.92.4 1.5
59.6
56.8
24.8
9.211.6
6.2
71.9
61.1
30.4
11.9
20.6
13.4
67.3
59.6
32.2
11.8
20.2
12.9
66.562.7
36.6
17.5
23.4
14.4
48.2 47.9
20.1
9.7 11.0
7.2
FINACCESS NATIONAL SURVEY
2013
| 29 |
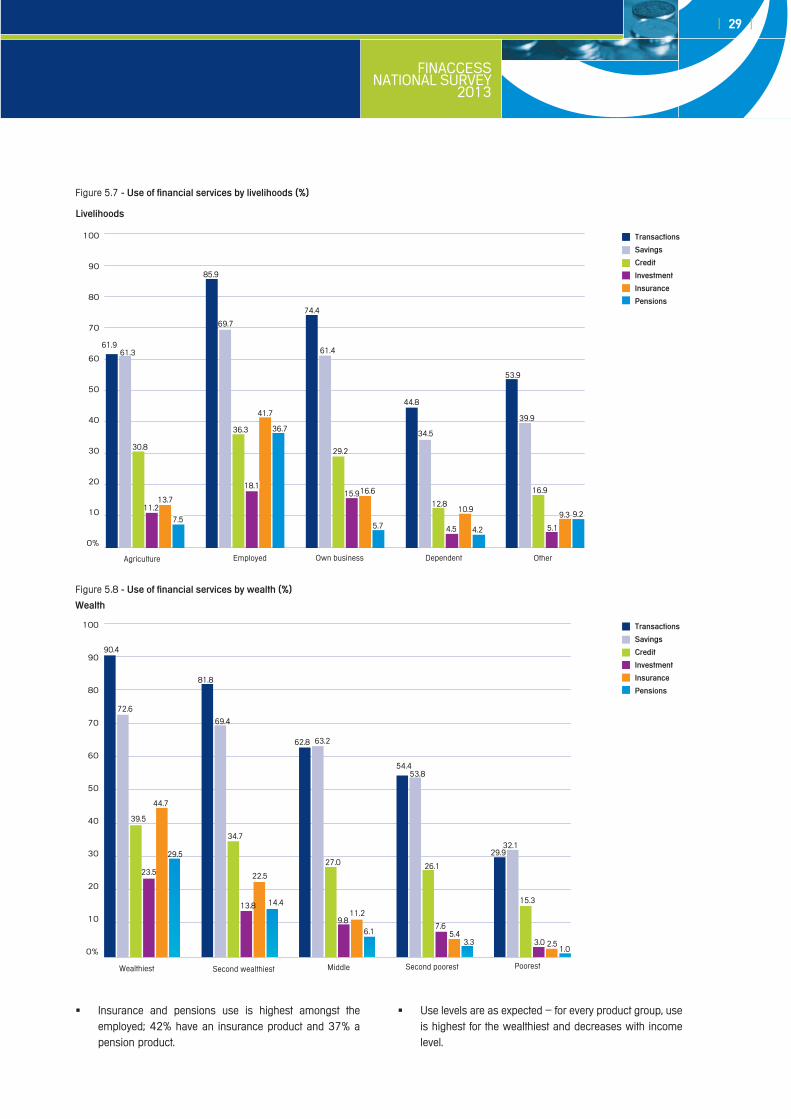
livelihoods
Figure 5.7 - Use of financial services by livelihoods (%)
Figure 5.8 - Use of financial services by wealth (%)
Insurance and pensions use is highest amongst the �employed; 42% have an insurance product and 37% a pension product.
Use levels are as expected – for every product group, use �is highest for the wealthiest and decreases with income level.
100
90
80
70
60
50
40
30
20
10
0%
Agriculture Employed Own business Dependent Other
61.961.3
85.9
69.7
36.3
18.1
41.7
36.7
74.4
61.4
29.2
15.916.6
5.7
44.8
34.5
12.8
4.5
10.9
4.2
53.9
39.9
16.9
5.1
9.3 9.2
30.8
11.213.7
7.5
Wealth
100
90
80
70
60
50
40
30
20
10
0%
Wealthiest Second wealthiest Middle Second poorest Poorest
90.4
72.6
39.5
44.7
81.8
69.4
34.7
13.8
22.5
62.8 63.2
27.0
9.811.2
6.1
54.453.8
26.1
7.65.4
3.3
29.932.1
15.3
3.01.0
2.5
14.4
23.5
29.5
Transactions
savings
credit
investment
insurance
pensions
Transactions
savings
credit
investment
insurance
pensions
| 30 |
FINACCESS NATIONAL SURVEY2013
11.6
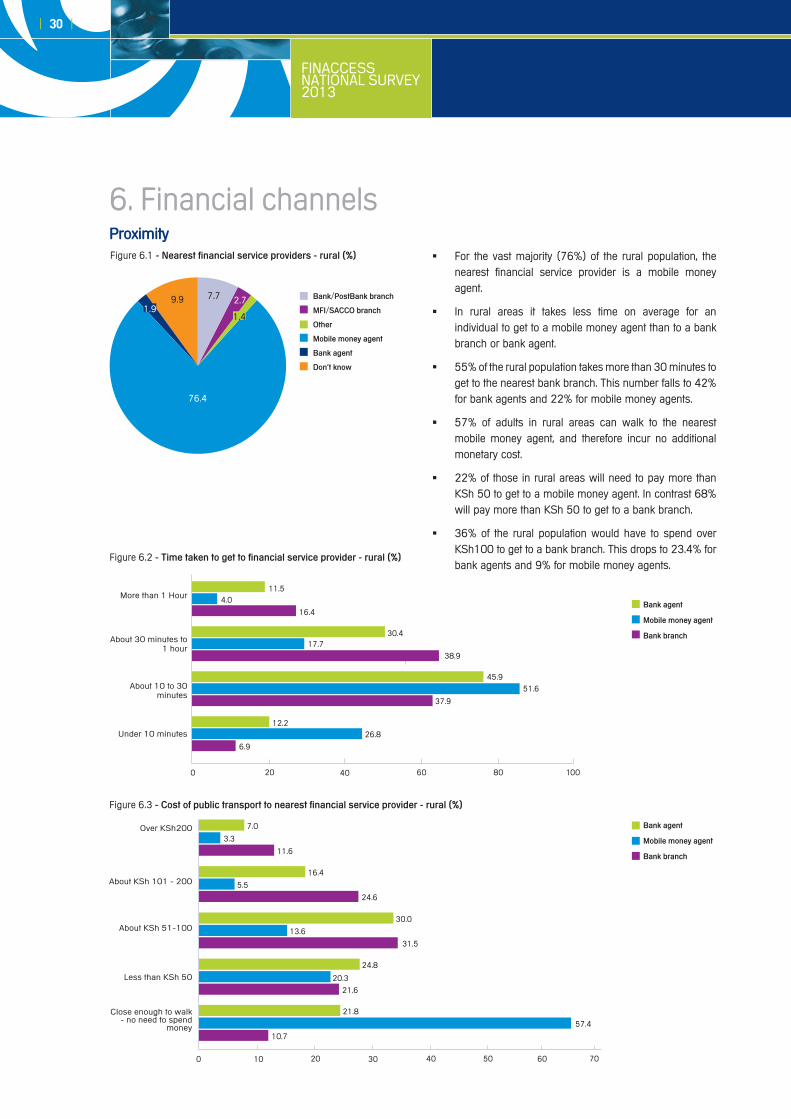
Figure 6.1 - nearest financial service providers - rural (%)
6. Financial channelsproximity
Figure 6.3 - cost of public transport to nearest financial service provider - rural (%)
For the vast majority (76%) of the rural population, the �nearest financial service provider is a mobile money agent.
In rural areas it takes less time on average for an �individual to get to a mobile money agent than to a bank branch or bank agent.
55% of the rural population takes more than 30 minutes to �get to the nearest bank branch. This number falls to 42% for bank agents and 22% for mobile money agents.
57% of adults in rural areas can walk to the nearest �mobile money agent, and therefore incur no additional monetary cost.
22% of those in rural areas will need to pay more than �KSh 50 to get to a mobile money agent. In contrast 68% will pay more than KSh 50 to get to a bank branch.
36% of the rural population would have to spend over �KSh100 to get to a bank branch. This drops to 23.4% for bank agents and 9% for mobile money agents.
bank/postbank branch
MFi/saccO branch
Other
Mobile money agent
bank agent
Don't know
76.4
7.7 2.7
1.41.9
9.9
3.3
5.5
13.6
20.3
57.4
bank agent
Mobile money agent
bank branch
bank agent
Mobile money agent
bank branch
Figure 6.2 - Time taken to get to financial service provider - rural (%)
0 20 40 60 80 100
11.5
30.4
45.9
12.2
4.0
17.7
51.6
26.8
16.4
38.9
37.9
6.9
More than 1 Hour
About 30 minutes to 1 hour
About 10 to 30 minutes
Under 10 minutes
0 10 20 30 40 50 60 70
Over KSh200
About KSh 101 - 200
About KSh 51-100
Less than KSh 50
Close enough to walk - no need to spend
money
7.0
16.4
24.6
30.0
31.5
24.8
21.8
21.6
10.7
FINACCESS NATIONAL SURVEY
2013
| 31 |
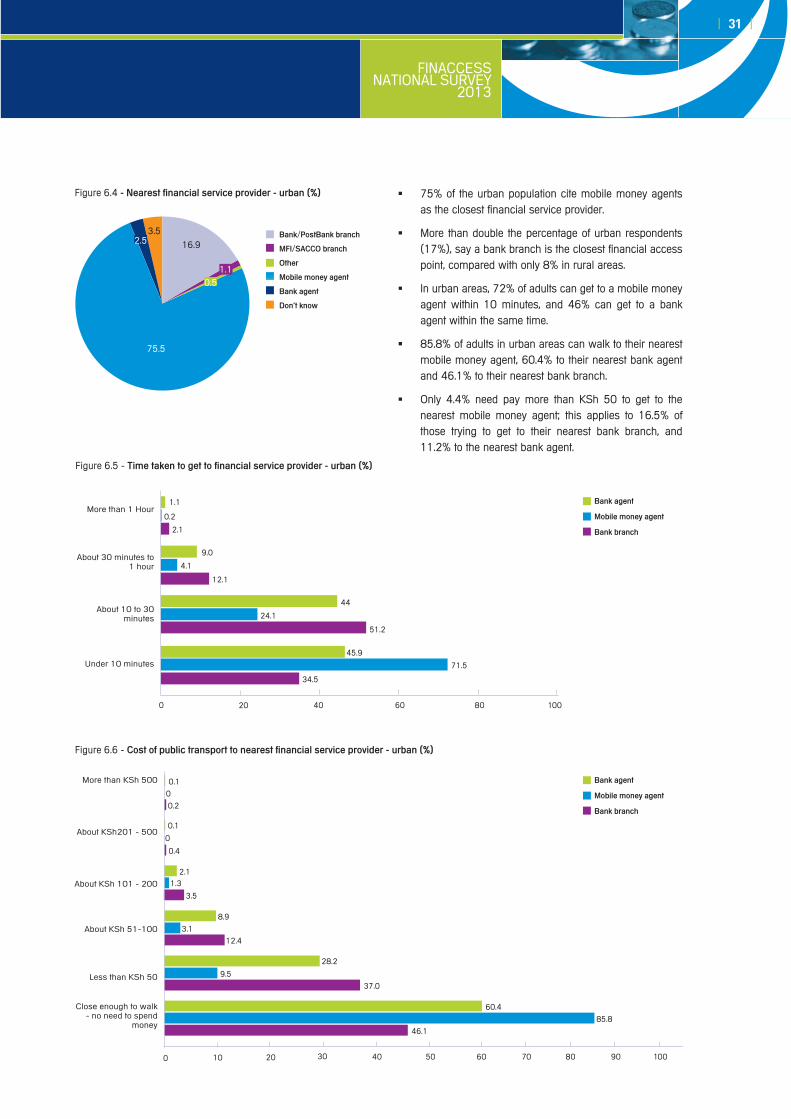
Figure 6.4 - nearest financial service provider - urban (%)
bank/postbank branch
MFi/saccO branch
Other
Mobile money agent
bank agent
Don't know
Figure 6.5 - Time taken to get to financial service provider - urban (%)
0 20 40 60 80 100
1.1
9.0
44
45.9
0.2
4.1
24.1
71.5
2.1
12.1
51.2
34.5
More than 1 Hour
About 30 minutes to 1 hour
About 10 to 30 minutes
Under 10 minutes
75% of the urban population cite mobile money agents �as the closest financial service provider.
More than double the percentage of urban respondents �(17%), say a bank branch is the closest financial access point, compared with only 8% in rural areas.
In urban areas, 72% of adults can get to a mobile money �agent within 10 minutes, and 46% can get to a bank agent within the same time.
85.8% of adults in urban areas can walk to their nearest �mobile money agent, 60.4% to their nearest bank agent and 46.1% to their nearest bank branch.
Only 4.4% need pay more than KSh 50 to get to the �nearest mobile money agent; this applies to 16.5% of those trying to get to their nearest bank branch, and 11.2% to the nearest bank agent.
Figure 6.6 - cost of public transport to nearest financial service provider - urban (%)
0.2
0
0
0.1
0.1
8.9
28.2
60.4
3.1
9.5
85.8
2.11.3
0.4
3.5
12.4
37.0
46.1
0 10 20 30 40 50 60 70 80 90 100
More than KSh 500
About KSh201 - 500
About KSh 101 - 200
About KSh 51-100
Less than KSh 50
Close enough to walk - no need to spend
money
75.5
16.9
1.10.5
2.53.5
bank agent
Mobile money agent
bank branch
bank agent
Mobile money agent
bank branch
| 32 |
FINACCESS NATIONAL SURVEY2013
Figure 6.7 - bank use by region by year (%)
Figure 6.8 - awareness and use of agency banking (%)
Figure 6.9 - access to and use of internet (%) Figure 6.10 - Mobile phone ownership by year (%)
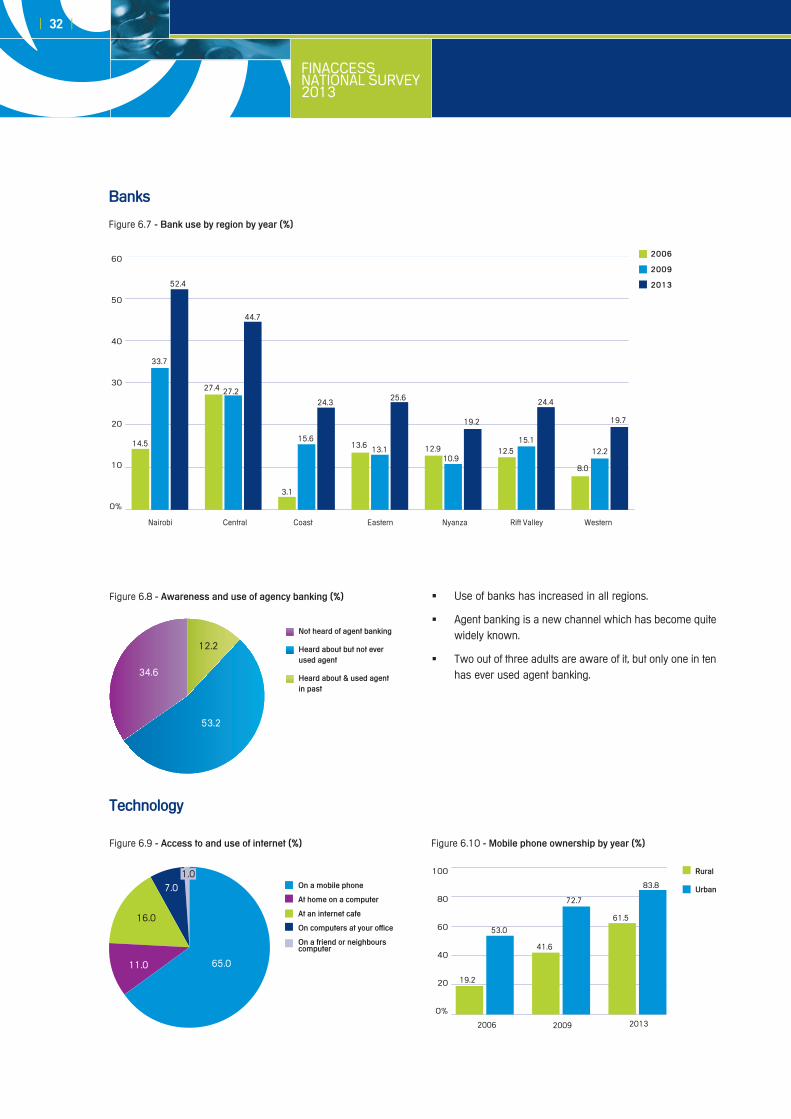
Use of banks has increased in all regions. �
Agent banking is a new channel which has become quite �widely known.
Two out of three adults are aware of it, but only one in ten �has ever used agent banking.
banks
Technology
On a mobile phone
at home on a computer
at an internet cafe
On computers at your office
On a friend or neighbours computer
2006
2009
2013
Nairobi Central Coast Eastern Nyanza Rift Valley Western
60
50
40
30
20
10
0%
not heard of agent banking
heard about but not ever used agent
heard about & used agent in past
34.6
12.2
53.2
rural
Urban
100
80
60
40
20
0%
2006 2009 2013
19.2
53.0
41.6
72.7
61.5
83.8
14.5
33.7
52.4
27.4 27.2
44.7
3.1
15.6
24.3
13.6 13.1
25.6
12.910.9
19.2
12.515.1
24.4
8.0
12.2
19.7
11.0
16.0
7.01.0
65.0
FINACCESS NATIONAL SURVEY
2013
| 33 |
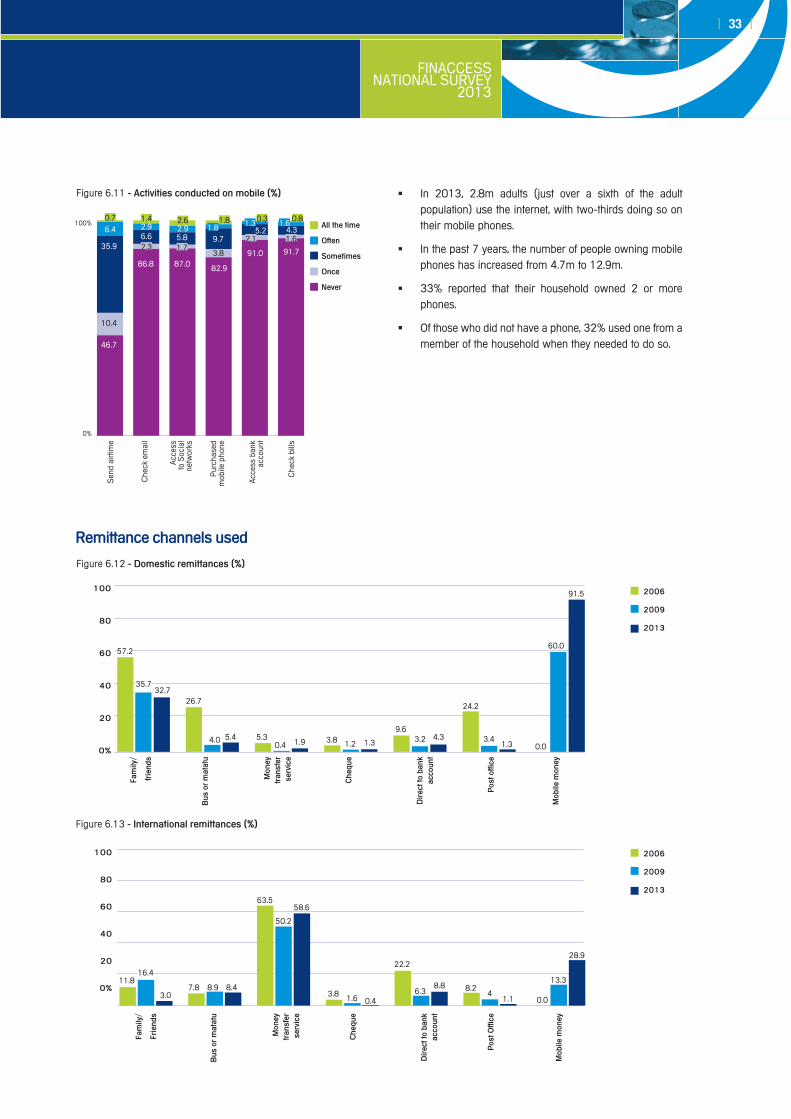
Figure 6.11 - activities conducted on mobile (%) In 2013, 2.8m adults (just over a sixth of the adult �population) use the internet, with two-thirds doing so on their mobile phones.
In the past 7 years, the number of people owning mobile �phones has increased from 4.7m to 12.9m.
33% reported that their household owned 2 or more �phones.
Of those who did not have a phone, 32% used one from a �member of the household when they needed to do so.
0%
100%
Sen
d ai
rtim
e
Che
ck e
mai
l
Acc
ess
to S
ocia
l ne
twor
ks
Pur
chas
ed
mob
ile p
hone
Acc
ess
bank
ac
coun
t
Che
ck b
ills
all the time
Often
sometimes
Once
never
46.7
86.8 87.0 82.9
91.0 91.73.8
2.1 1.69.75.2 4.31.8 1.3 1.61.8 0.3 0.8
1.75.82.92.6
2.36.62.91.4
10.4
35.9
6.40.7
remittance channels used
2006
2009
2013
2006
2009
2013
Fam
ily/
frie
nds
bus
or
mat
atu
Mon
ey
tran
sfer
se
rvic
e
che
que
Dir
ect t
o ba
nk
acco
unt
pos
t offi
ce
Mob
ile m
oney
57.2
35.732.7
5.4 5.30.4 1.9 3.8 1.2 1.3
9.63.2 4.3
24.2
3.41.3 0.0
60.0
91.5
4.0
26.7
100
80
60
40
20
0%
Figure 6.12 - Domestic remittances (%)
Fam
ily/
Frie
nds
bus
or
mat
atu
Mon
ey
tran
sfer
se
rvic
e
che
que
Dir
ect t
o ba
nk
acco
unt
pos
t Offi
ce
Mob
ile m
oney
11.816.4
3.07.8 8.9 8.4
63.5
50.2
58.6
3.8 1.6 0.4
22.2
6.38.8 8.2
41.1 0.0
13.3
28.9
Figure 6.13 - international remittances (%)
100
80
60
40
20
0%
| 34 |
FINACCESS NATIONAL SURVEY2013
Mobile money has had a dramatic impact on domestic �remittances.
In 2006, over half (57%) of money transfers within �Kenya were through family/friends; in 2013 it dropped to a third.
Use of buses and matatus for domestic remittances �decreased from 27% in 2006 to 5% in 2013.
Use of the Post Office decreased from 24% in 2006 to �1% in 2013.
One method has held its own over the years – about 60% �of adults who send or receive international remittances, use money transfer services such as Western Union and Money Gram amongst others.
An increasing number now use mobile phone money �transfer service (up from 13% in 2009 to 29% in 2013) for international transfers.
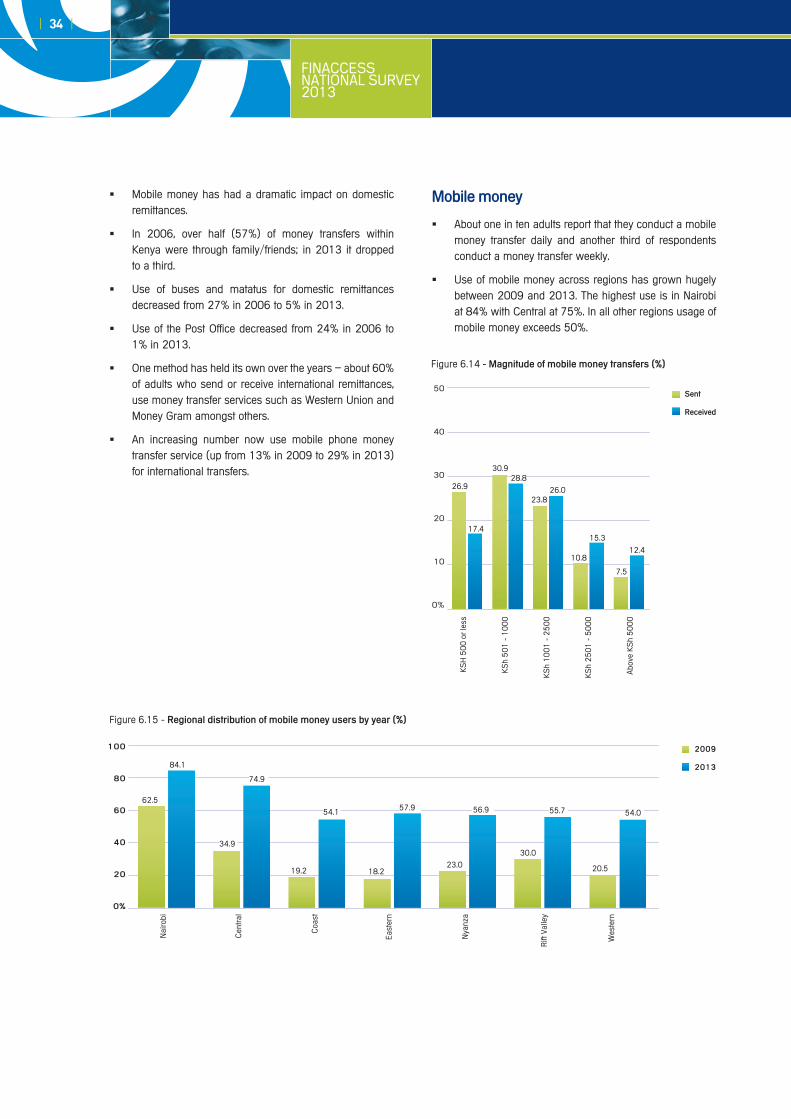
About one in ten adults report that they conduct a mobile �money transfer daily and another third of respondents conduct a money transfer weekly.
Use of mobile money across regions has grown hugely �between 2009 and 2013. The highest use is in Nairobi at 84% with Central at 75%. In all other regions usage of mobile money exceeds 50%.
Mobile money
Figure 6.15 - regional distribution of mobile money users by year (%)
Nai
robi
Cen
tral
Coa
st
Eas
tern
Nya
nza
Rift
Val
ley
Wes
tern
100
80
60
40
20
0%
2009
2013
62.5
84.1
34.9
74.9
19.2
54.1
18.2
57.9
23.0
56.9
30.0
55.7
20.5
54.0
Figure 6.14 - Magnitude of mobile money transfers (%)
sent
received
50
40
30
20
10
0%
KS
H 5
00
or l
ess
KS
h 5
01
- 1
00
0
KS
h 1
00
1 -
25
00
KS
h 2
50
1 -
50
00
Abo
ve K
Sh
50
00
26.9
17.4
30.928.8
23.826.0
10.8
15.3
7.5
12.4
FINACCESS NATIONAL SURVEY
2013
| 35 |
Daily
Weekly
Monthly
Once or twice a year
irregularly
Informal groups
Mobile money
MFI
SACCO
Bank
0
4.1 37.0 53.6 1.8 3.5
8.6 26.5 31.1 3.1 30.7
14.2
13.5
23.7
13.7
5.6
64.8
54.913.82.1
7.01.0
67.4 5.811.80.8
20 40 60 10080
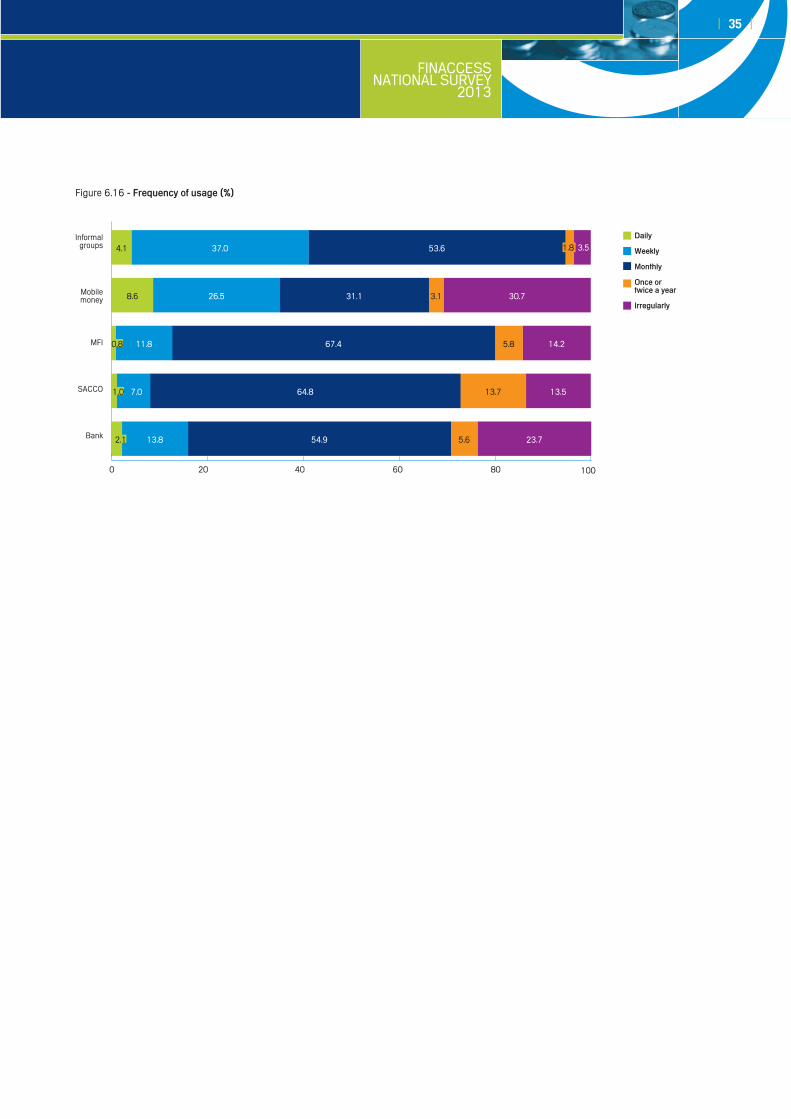
Figure 6.16 - Frequency of usage (%)
| 36 |
FINACCESS NATIONAL SURVEY2013
Figure 7.2 - awareness of financial institutions (%)
100
80
60
40
20
0
Nat
iona
l Soc
ial S
ecur
ity
Fund
Nat
iona
l Hea
lth
Insu
ranc
e Fu
nd
Nai
robi
Sec
uriti
es
Exc
hang
e
Cre
dit r
efer
ence
bur
eau
Pyr
amid
sch
eme
79.5 78.1
30.7
20.0
32.0
Figure 7.1 - awareness of financial terms (%)
7. Financial literacy and consumer perceptions
100
80
60
40
20
0%
sav
ings
acc
ount
insu
ranc
e
inte
rest
sha
res
che
que
col
late
ral
bud
get
inve
stm
ent
aTM
car
d
infla
tion
pen
sion
Mor
tgag
e
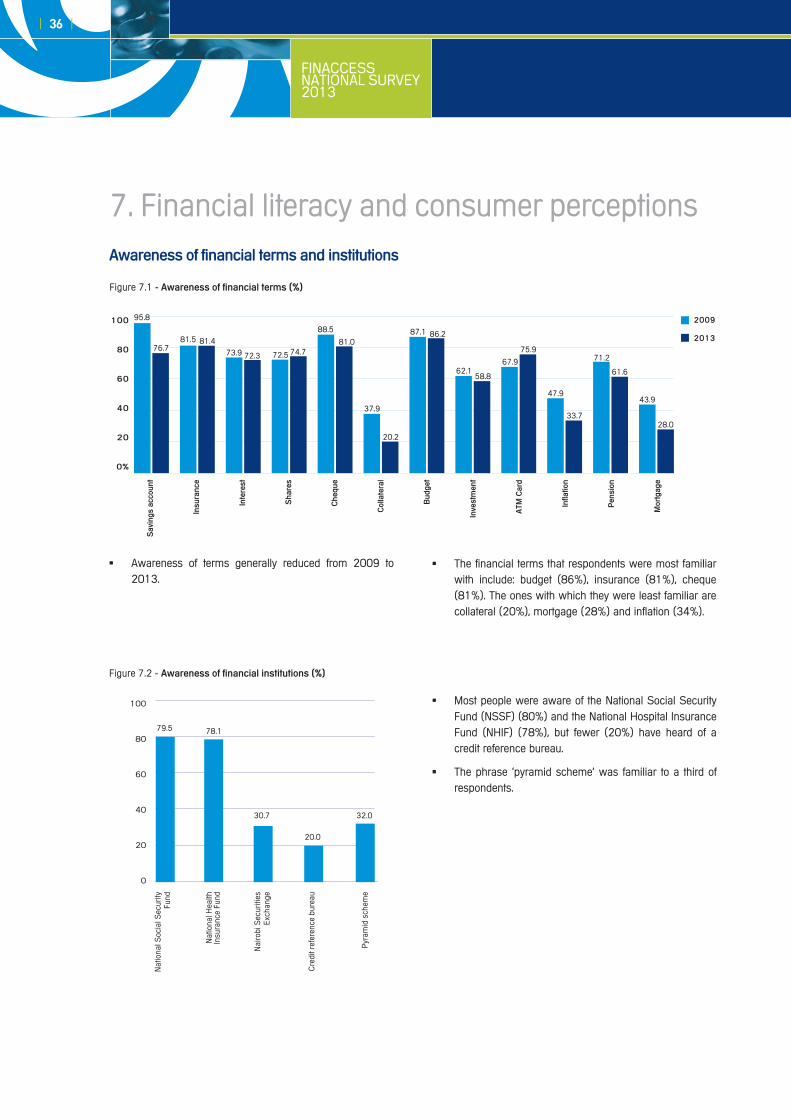
Awareness of terms generally reduced from 2009 to �2013.
Most people were aware of the National Social Security �Fund (NSSF) (80%) and the National Hospital Insurance Fund (NHIF) (78%), but fewer (20%) have heard of a credit reference bureau.
The phrase ‘pyramid scheme’ was familiar to a third of �respondents.
95.8
76.781.5 81.4
73.9 72.3 72.5 74.7
88.5
81.0
37.9
20.2
87.1
62.167.9
47.9
71.2
43.9
86.2
58.8
75.9
33.7
61.6
28.0
2009
2013
awareness of financial terms and institutions
The financial terms that respondents were most familiar �with include: budget (86%), insurance (81%), cheque (81%). The ones with which they were least familiar are collateral (20%), mortgage (28%) and inflation (34%).
FINACCESS NATIONAL SURVEY
2013
| 37 |
Financial numeracy
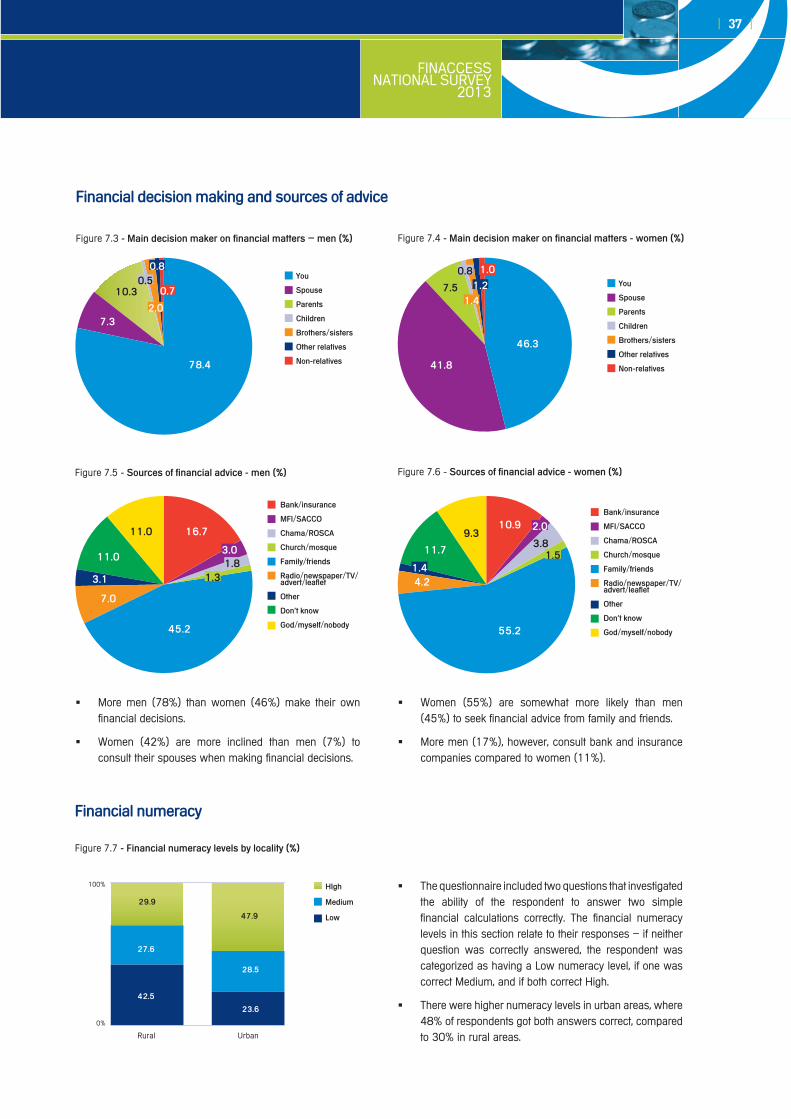
The questionnaire included two questions that investigated �the ability of the respondent to answer two simple financial calculations correctly. The financial numeracy levels in this section relate to their responses – if neither question was correctly answered, the respondent was categorized as having a Low numeracy level, if one was correct Medium, and if both correct High.
There were higher numeracy levels in urban areas, where �48% of respondents got both answers correct, compared to 30% in rural areas.
Figure 7.7 - Financial numeracy levels by locality (%)
high
Medium
low47.9
42.5
27.6
28.5
23.6
29.9
0%
100%
Rural Urban
More men (78%) than women (46%) make their own �financial decisions.
Women (42%) are more inclined than men (7%) to �consult their spouses when making financial decisions.
Women (55%) are somewhat more likely than men �(45%) to seek financial advice from family and friends.
More men (17%), however, consult bank and insurance �companies compared to women (11%).
Figure 7.5 - sources of financial advice - men (%) Figure 7.6 - sources of financial advice - women (%)
bank/insurance
MFi/saccO
chama/rOsca
church/mosque
Family/friends
radio/newspaper/TV/advert/leaflet
Other
Don't know
God/myself/nobody
bank/insurance
MFi/saccO
chama/rOsca
church/mosque
Family/friends
radio/newspaper/TV/advert/leaflet
Other
Don't know
God/myself/nobody
Figure 7.3 - Main decision maker on financial matters – men (%) Figure 7.4 - Main decision maker on financial matters - women (%)
Financial decision making and sources of advice
You
spouse
parents
children
brothers/sisters
Other relatives
non-relatives
You
spouse
parents
children
brothers/sisters
Other relatives
non-relatives
45.2
7.0
3.1
11.0
11.0 16.7
3.01.8
1.3
55.2
4.21.4
11.7
9.310.9 2.0
3.81.5
46.3
41.8
7.5
0.8
1.41.2
1.0
78.4
7.3
10.30.5
0.8
2.0
0.7
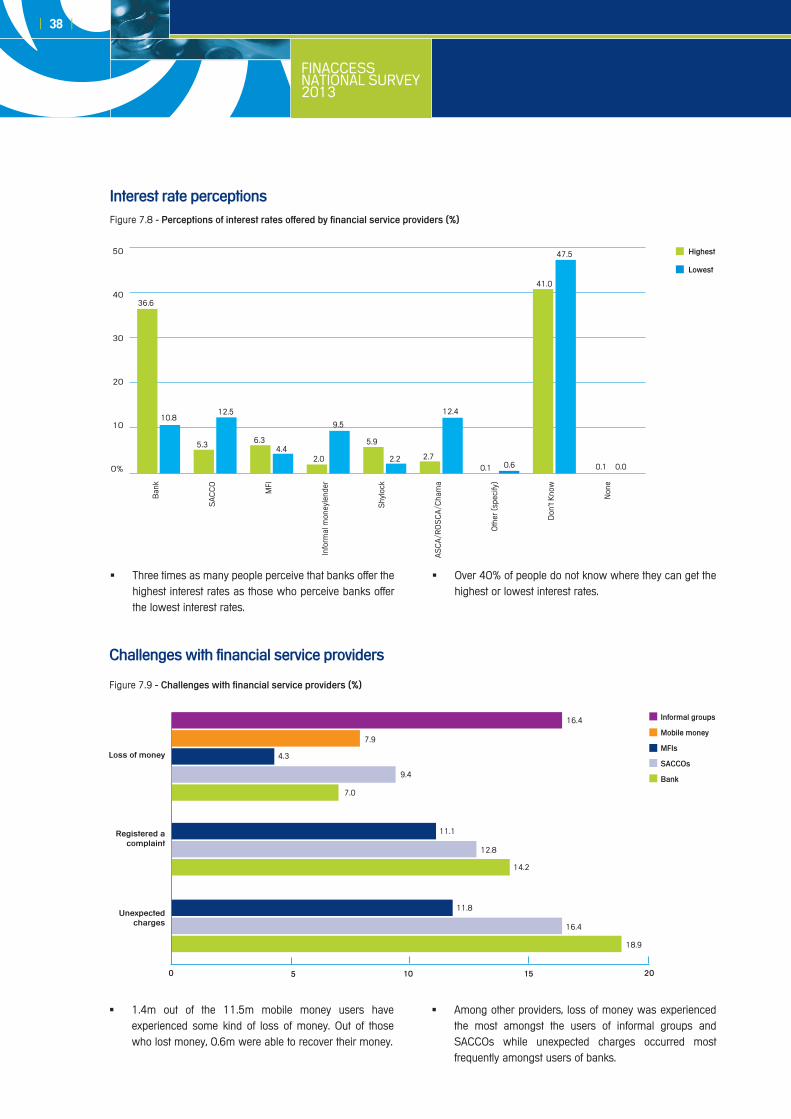
| 38 |
FINACCESS NATIONAL SURVEY2013
interest rate perceptions
highest
lowest
50
40
30
20
10
0%
Ban
k
SA
CC
O
MFI
Info
rmal
mon
eyle
nder
Shy
lock
AS
CA
/RO
SC
A/C
ham
a
Oth
er (
spec
ify)
Don
't K
now
Non
e
Three times as many people perceive that banks offer the �highest interest rates as those who perceive banks offer the lowest interest rates.
Over 40% of people do not know where they can get the �highest or lowest interest rates.
Figure 7.8 - perceptions of interest rates offered by financial service providers (%)
36.6
10.8
5.3
12.5
6.34.4
2.0
9.5
5.9
2.2 2.7
12.4
0.1 0.6
41.0
0.00.1
47.5
challenges with financial service providers
1.4m out of the 11.5m mobile money users have �experienced some kind of loss of money. Out of those who lost money, 0.6m were able to recover their money.
Among other providers, loss of money was experienced �the most amongst the users of informal groups and SACCOs while unexpected charges occurred most frequently amongst users of banks.
Figure 7.9 - challenges with financial service providers (%)
0 5 10 15 20
7.9
4.3
11.1
11.8
17.7 9.4
12.8
16.4
16.4
7.0
14.2
18.9
loss of money
registered acomplaint
Unexpectedcharges
informal groups
Mobile money
MFis
saccOs
bank
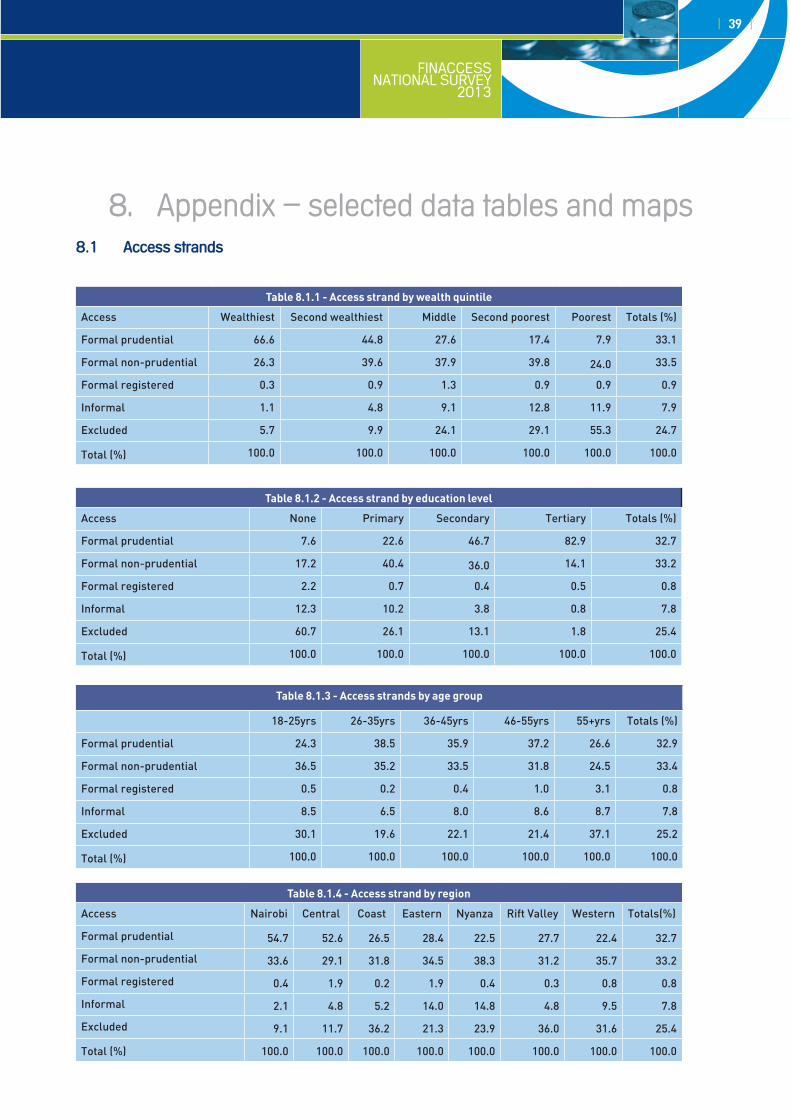
FINACCESS NATIONAL SURVEY
2013
| 39 |
8.1 access strands
8. Appendix – selected data tables and maps
Table 8.1.1 - Access strand by wealth quintile
Access Wealthiest Second wealthiest Middle Second poorest Poorest Totals (%)
Formal prudential 66.6 44.8 27.6 17.4 7.9 33.1
Formal non-prudential 26.3 39.6 37.9 39.8 24.0 33.5
Formal registered 0.3 0.9 1.3 0.9 0.9 0.9
Informal 1.1 4.8 9.1 12.8 11.9 7.9
Excluded 5.7 9.9 24.1 29.1 55.3 24.7
Total (%) 100.0 100.0 100.0 100.0 100.0 100.0
Table 8.1.2 - Access strand by education level
Access None Primary Secondary Tertiary Totals (%)
Formal prudential 7.6 22.6 46.7 82.9 32.7
Formal non-prudential 17.2 40.4 36.0 14.1 33.2
Formal registered 2.2 0.7 0.4 0.5 0.8
Informal 12.3 10.2 3.8 0.8 7.8
Excluded 60.7 26.1 13.1 1.8 25.4
Total (%) 100.0 100.0 100.0 100.0 100.0
Table 8.1.3 - Access strands by age group
18-25yrs 26-35yrs 36-45yrs 46-55yrs 55+yrs Totals (%)
Formal prudential 24.3 38.5 35.9 37.2 26.6 32.9
Formal non-prudential 36.5 35.2 33.5 31.8 24.5 33.4
Formal registered 0.5 0.2 0.4 1.0 3.1 0.8
Informal 8.5 6.5 8.0 8.6 8.7 7.8
Excluded 30.1 19.6 22.1 21.4 37.1 25.2
Total (%) 100.0 100.0 100.0 100.0 100.0 100.0
Table 8.1.4 - Access strand by region
Access Nairobi Central Coast Eastern Nyanza Rift Valley Western Totals(%)
Formal prudential 54.7 52.6 26.5 28.4 22.5 27.7 22.4 32.7
Formal non-prudential 33.6 29.1 31.8 34.5 38.3 31.2 35.7 33.2
Formal registered 0.4 1.9 0.2 1.9 0.4 0.3 0.8 0.8
Informal 2.1 4.8 5.2 14.0 14.8 4.8 9.5 7.8
Excluded 9.1 11.7 36.2 21.3 23.9 36.0 31.6 25.4
Total (%) 100.0 100.0 100.0 100.0 100.0 100.0 100.0 100.0
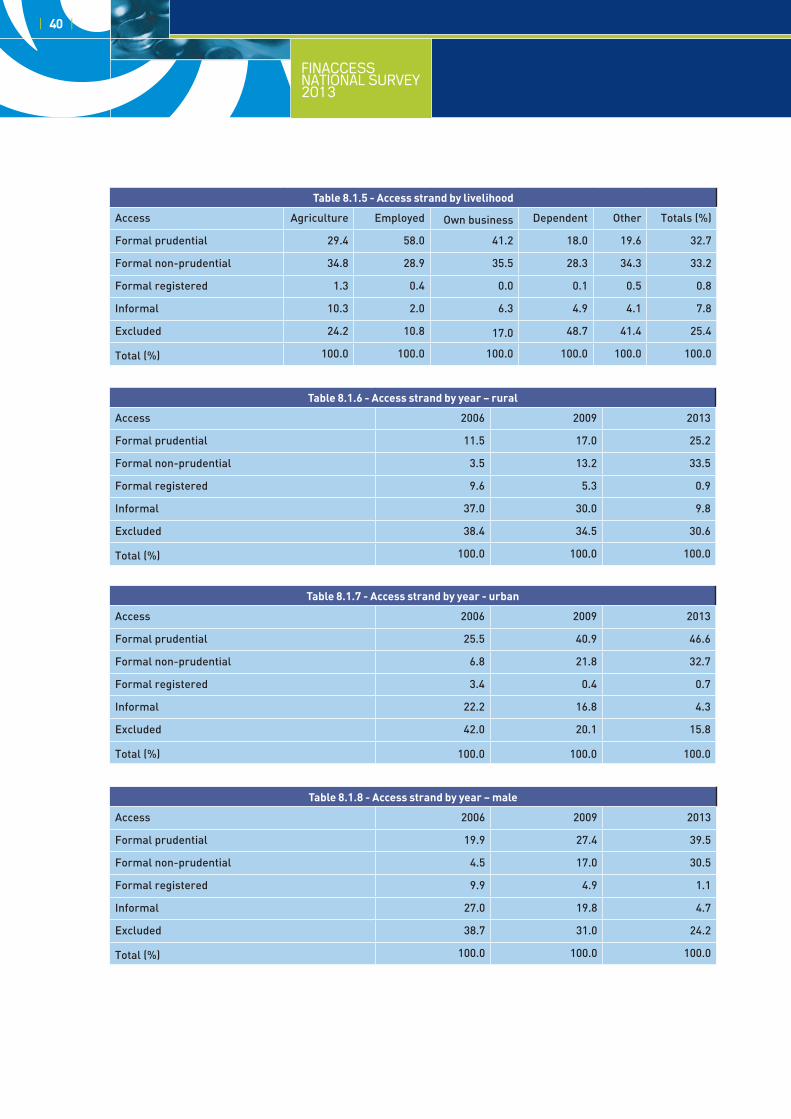
| 40 |
FINACCESS NATIONAL SURVEY2013
Table 8.1.5 - Access strand by livelihood
Access Agriculture Employed Own business Dependent Other Totals (%)
Formal prudential 29.4 58.0 41.2 18.0 19.6 32.7
Formal non-prudential 34.8 28.9 35.5 28.3 34.3 33.2
Formal registered 1.3 0.4 0.0 0.1 0.5 0.8
Informal 10.3 2.0 6.3 4.9 4.1 7.8
Excluded 24.2 10.8 17.0 48.7 41.4 25.4
Total (%) 100.0 100.0 100.0 100.0 100.0 100.0
Table 8.1.6 - Access strand by year – rural
Access 2006 2009 2013
Formal prudential 11.5 17.0 25.2
Formal non-prudential 3.5 13.2 33.5
Formal registered 9.6 5.3 0.9
Informal 37.0 30.0 9.8
Excluded 38.4 34.5 30.6
Total (%) 100.0 100.0 100.0
Table 8.1.7 - Access strand by year - urban
Access 2006 2009 2013
Formal prudential 25.5 40.9 46.6
Formal non-prudential 6.8 21.8 32.7
Formal registered 3.4 0.4 0.7
Informal 22.2 16.8 4.3
Excluded 42.0 20.1 15.8
Total (%) 100.0 100.0 100.0
Table 8.1.8 - Access strand by year – male
Access 2006 2009 2013
Formal prudential 19.9 27.4 39.5
Formal non-prudential 4.5 17.0 30.5
Formal registered 9.9 4.9 1.1
Informal 27.0 19.8 4.7
Excluded 38.7 31.0 24.2
Total (%) 100.0 100.0 100.0
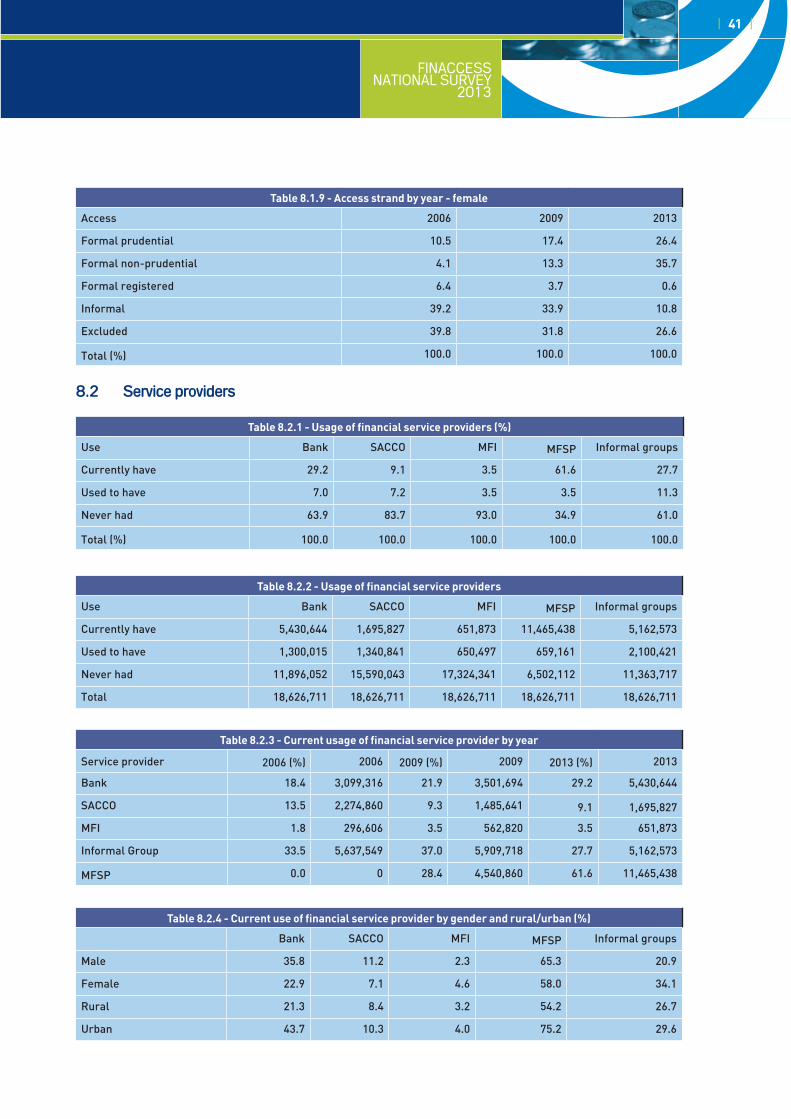
FINACCESS NATIONAL SURVEY
2013
| 41 |
Table 8.1.9 - Access strand by year - female
Access 2006 2009 2013
Formal prudential 10.5 17.4 26.4
Formal non-prudential 4.1 13.3 35.7
Formal registered 6.4 3.7 0.6
Informal 39.2 33.9 10.8
Excluded 39.8 31.8 26.6
Total (%) 100.0 100.0 100.0
8.2 service providers
Table 8.2.1 - Usage of financial service providers (%)
Use Bank SACCO MFI MFSP Informal groups
Currently have 29.2 9.1 3.5 61.6 27.7
Used to have 7.0 7.2 3.5 3.5 11.3
Never had 63.9 83.7 93.0 34.9 61.0
Total (%) 100.0 100.0 100.0 100.0 100.0
Table 8.2.2 - Usage of financial service providers
Use Bank SACCO MFI MFSP Informal groups
Currently have 5,430,644 1,695,827 651,873 11,465,438 5,162,573
Used to have 1,300,015 1,340,841 650,497 659,161 2,100,421
Never had 11,896,052 15,590,043 17,324,341 6,502,112 11,363,717
Total 18,626,711 18,626,711 18,626,711 18,626,711 18,626,711
Table 8.2.3 - Current usage of financial service provider by year
Service provider 2006 (%) 2006 2009 (%) 2009 2013 (%) 2013
Bank 18.4 3,099,316 21.9 3,501,694 29.2 5,430,644
SACCO 13.5 2,274,860 9.3 1,485,641 9.1 1,695,827
MFI 1.8 296,606 3.5 562,820 3.5 651,873
Informal Group 33.5 5,637,549 37.0 5,909,718 27.7 5,162,573
MFSP 0.0 0 28.4 4,540,860 61.6 11,465,438
Table 8.2.4 - Current use of financial service provider by gender and rural/urban (%)
Bank SACCO MFI MFSP Informal groups
Male 35.8 11.2 2.3 65.3 20.9
Female 22.9 7.1 4.6 58.0 34.1
Rural 21.3 8.4 3.2 54.2 26.7
Urban 43.7 10.3 4.0 75.2 29.6
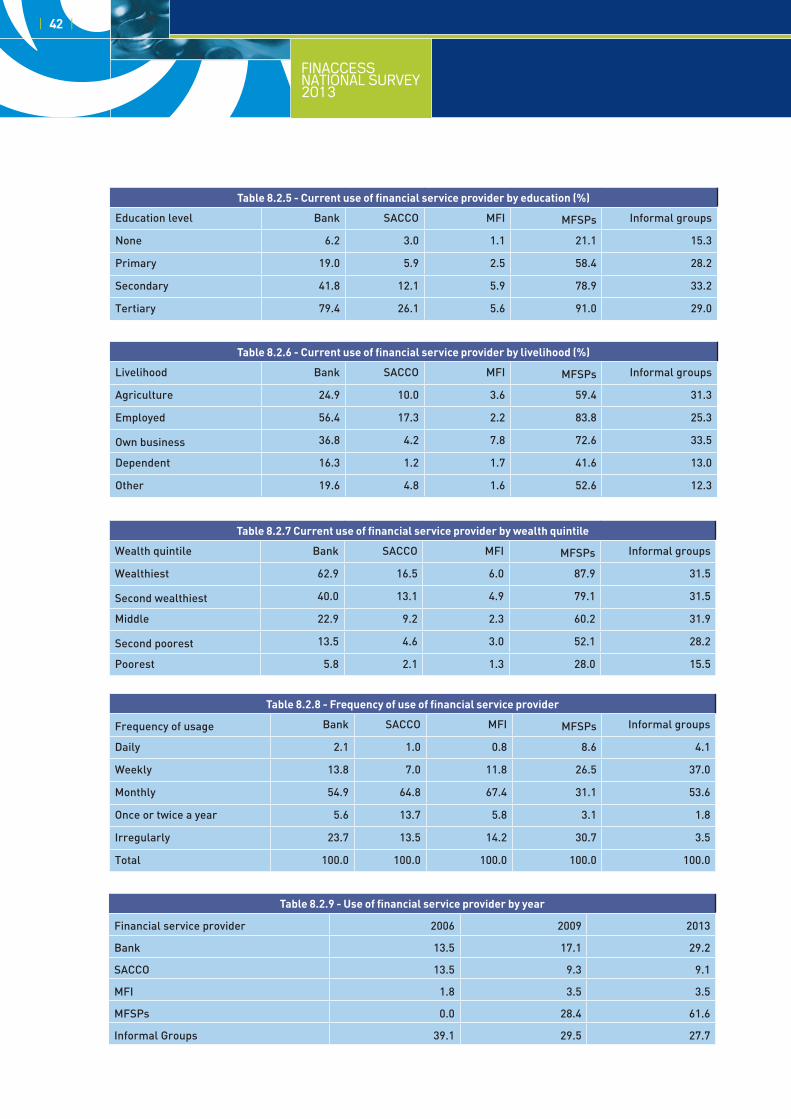
| 42 |
FINACCESS NATIONAL SURVEY2013
Table 8.2.5 - Current use of financial service provider by education (%)
Education level Bank SACCO MFI MFSPs Informal groups
None 6.2 3.0 1.1 21.1 15.3
Primary 19.0 5.9 2.5 58.4 28.2
Secondary 41.8 12.1 5.9 78.9 33.2
Tertiary 79.4 26.1 5.6 91.0 29.0
Table 8.2.6 - Current use of financial service provider by livelihood (%)
Livelihood Bank SACCO MFI MFSPs Informal groups
Agriculture 24.9 10.0 3.6 59.4 31.3
Employed 56.4 17.3 2.2 83.8 25.3
Own business 36.8 4.2 7.8 72.6 33.5
Dependent 16.3 1.2 1.7 41.6 13.0
Other 19.6 4.8 1.6 52.6 12.3
Table 8.2.7 Current use of financial service provider by wealth quintile
Wealth quintile Bank SACCO MFI MFSPs Informal groups
Wealthiest 62.9 16.5 6.0 87.9 31.5
Second wealthiest 40.0 13.1 4.9 79.1 31.5
Middle 22.9 9.2 2.3 60.2 31.9
Second poorest 13.5 4.6 3.0 52.1 28.2
Poorest 5.8 2.1 1.3 28.0 15.5
Table 8.2.8 - Frequency of use of financial service provider
Frequency of usage Bank SACCO MFI MFSPs Informal groups
Daily 2.1 1.0 0.8 8.6 4.1
Weekly 13.8 7.0 11.8 26.5 37.0
Monthly 54.9 64.8 67.4 31.1 53.6
Once or twice a year 5.6 13.7 5.8 3.1 1.8
Irregularly 23.7 13.5 14.2 30.7 3.5
Total 100.0 100.0 100.0 100.0 100.0
Table 8.2.9 - Use of financial service provider by year
Financial service provider 2006 2009 2013
Bank 13.5 17.1 29.2
SACCO 13.5 9.3 9.1
MFI 1.8 3.5 3.5
MFSPs 0.0 28.4 61.6
Informal Groups 39.1 29.5 27.7
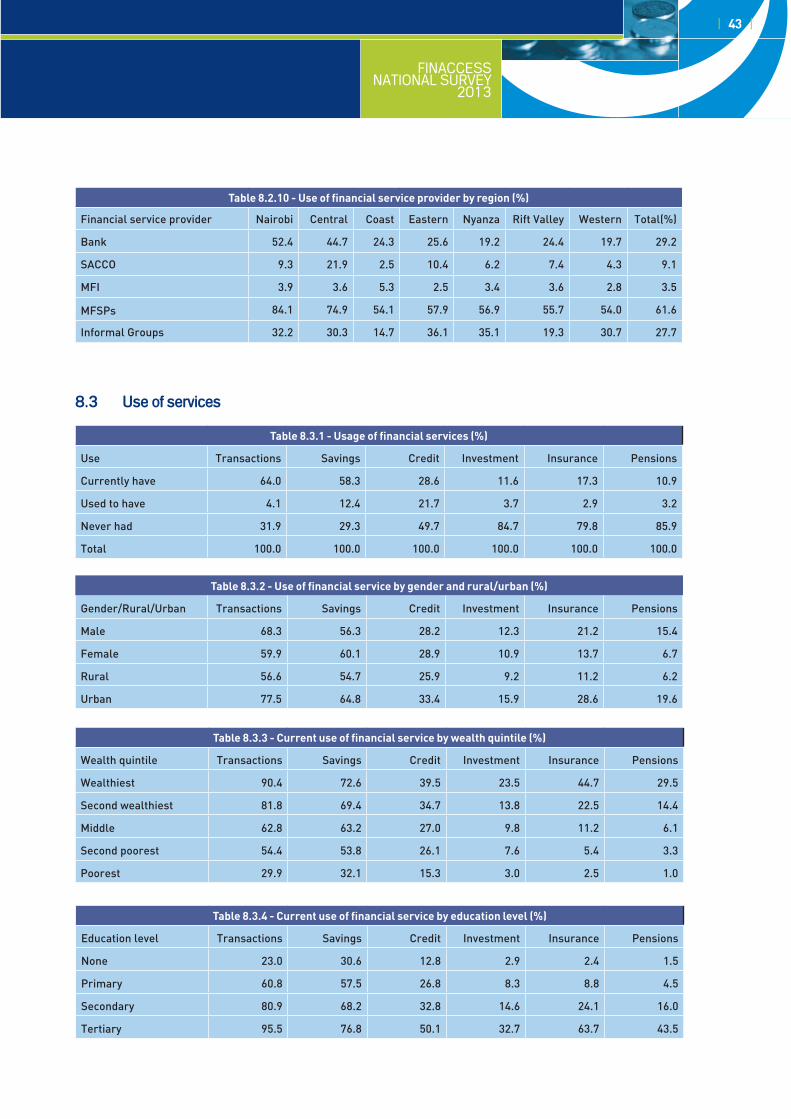
FINACCESS NATIONAL SURVEY
2013
| 43 |
Table 8.2.10 - Use of financial service provider by region (%)
Financial service provider Nairobi Central Coast Eastern Nyanza Rift Valley Western Total(%)
Bank 52.4 44.7 24.3 25.6 19.2 24.4 19.7 29.2
SACCO 9.3 21.9 2.5 10.4 6.2 7.4 4.3 9.1
MFI 3.9 3.6 5.3 2.5 3.4 3.6 2.8 3.5
MFSPs 84.1 74.9 54.1 57.9 56.9 55.7 54.0 61.6
Informal Groups 32.2 30.3 14.7 36.1 35.1 19.3 30.7 27.7
Table 8.3.1 - Usage of financial services (%)
Use Transactions Savings Credit Investment Insurance Pensions
Currently have 64.0 58.3 28.6 11.6 17.3 10.9
Used to have 4.1 12.4 21.7 3.7 2.9 3.2
Never had 31.9 29.3 49.7 84.7 79.8 85.9
Total 100.0 100.0 100.0 100.0 100.0 100.0
Table 8.3.2 - Use of financial service by gender and rural/urban (%)
Gender/Rural/Urban Transactions Savings Credit Investment Insurance Pensions
Male 68.3 56.3 28.2 12.3 21.2 15.4
Female 59.9 60.1 28.9 10.9 13.7 6.7
Rural 56.6 54.7 25.9 9.2 11.2 6.2
Urban 77.5 64.8 33.4 15.9 28.6 19.6
Table 8.3.3 - Current use of financial service by wealth quintile (%)
Wealth quintile Transactions Savings Credit Investment Insurance Pensions
Wealthiest 90.4 72.6 39.5 23.5 44.7 29.5
Second wealthiest 81.8 69.4 34.7 13.8 22.5 14.4
Middle 62.8 63.2 27.0 9.8 11.2 6.1
Second poorest 54.4 53.8 26.1 7.6 5.4 3.3
Poorest 29.9 32.1 15.3 3.0 2.5 1.0
8.3 Use of services
Table 8.3.4 - Current use of financial service by education level (%)
Education level Transactions Savings Credit Investment Insurance Pensions
None 23.0 30.6 12.8 2.9 2.4 1.5
Primary 60.8 57.5 26.8 8.3 8.8 4.5
Secondary 80.9 68.2 32.8 14.6 24.1 16.0
Tertiary 95.5 76.8 50.1 32.7 63.7 43.5
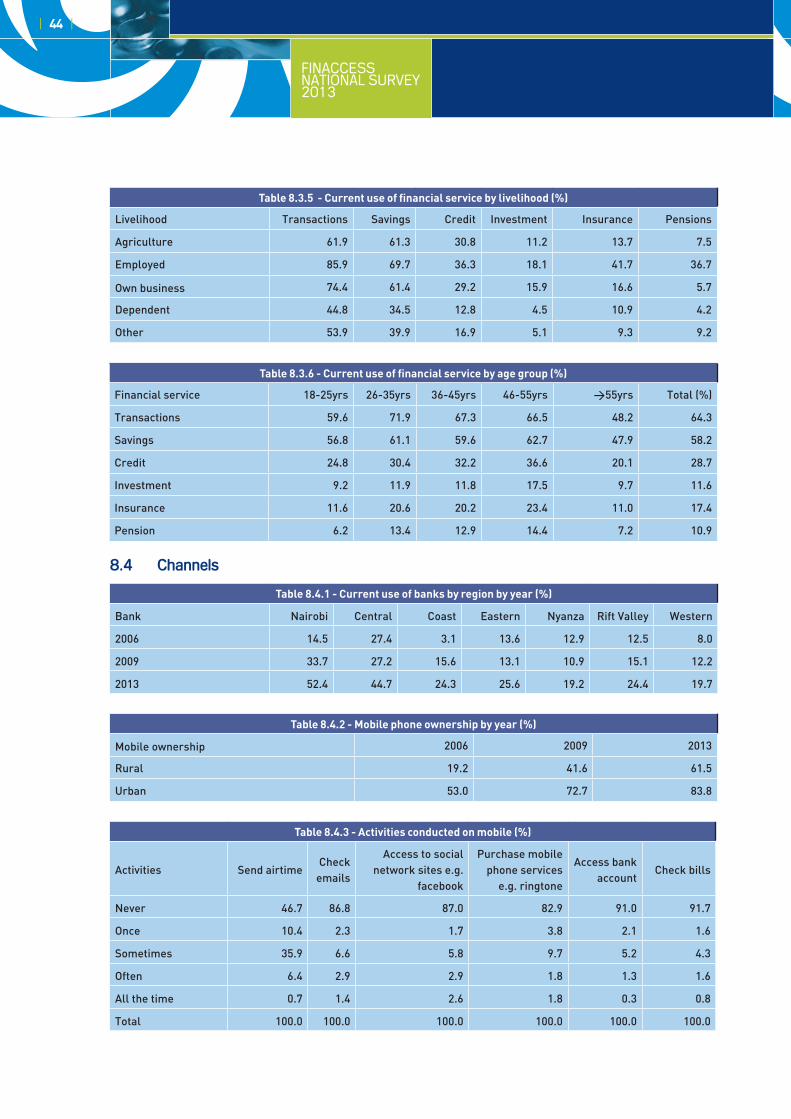
| 44 |
FINACCESS NATIONAL SURVEY2013
Table 8.3.5 - Current use of financial service by livelihood (%)
Livelihood Transactions Savings Credit Investment Insurance Pensions
Agriculture 61.9 61.3 30.8 11.2 13.7 7.5
Employed 85.9 69.7 36.3 18.1 41.7 36.7
Own business 74.4 61.4 29.2 15.9 16.6 5.7
Dependent 44.8 34.5 12.8 4.5 10.9 4.2
Other 53.9 39.9 16.9 5.1 9.3 9.2
Table 8.3.6 - Current use of financial service by age group (%)
Financial service 18-25yrs 26-35yrs 36-45yrs 46-55yrs >55yrs Total (%)
Transactions 59.6 71.9 67.3 66.5 48.2 64.3
Savings 56.8 61.1 59.6 62.7 47.9 58.2
Credit 24.8 30.4 32.2 36.6 20.1 28.7
Investment 9.2 11.9 11.8 17.5 9.7 11.6
Insurance 11.6 20.6 20.2 23.4 11.0 17.4
Pension 6.2 13.4 12.9 14.4 7.2 10.9
8.4 channels
Table 8.4.1 - Current use of banks by region by year (%)
Bank Nairobi Central Coast Eastern Nyanza Rift Valley Western
2006 14.5 27.4 3.1 13.6 12.9 12.5 8.0
2009 33.7 27.2 15.6 13.1 10.9 15.1 12.2
2013 52.4 44.7 24.3 25.6 19.2 24.4 19.7
Table 8.4.2 - Mobile phone ownership by year (%)
Mobile ownership 2006 2009 2013
Rural 19.2 41.6 61.5
Urban 53.0 72.7 83.8
Table 8.4.3 - Activities conducted on mobile (%)
Activities Send airtimeCheck
emails
Access to social network sites e.g.
Purchase mobile phone services
e.g. ringtone
Access bank account
Check bills
Never 46.7 86.8 87.0 82.9 91.0 91.7
Once 10.4 2.3 1.7 3.8 2.1 1.6
Sometimes 35.9 6.6 5.8 9.7 5.2 4.3
Often 6.4 2.9 2.9 1.8 1.3 1.6
All the time 0.7 1.4 2.6 1.8 0.3 0.8
Total 100.0 100.0 100.0 100.0 100.0 100.0
| 45 |
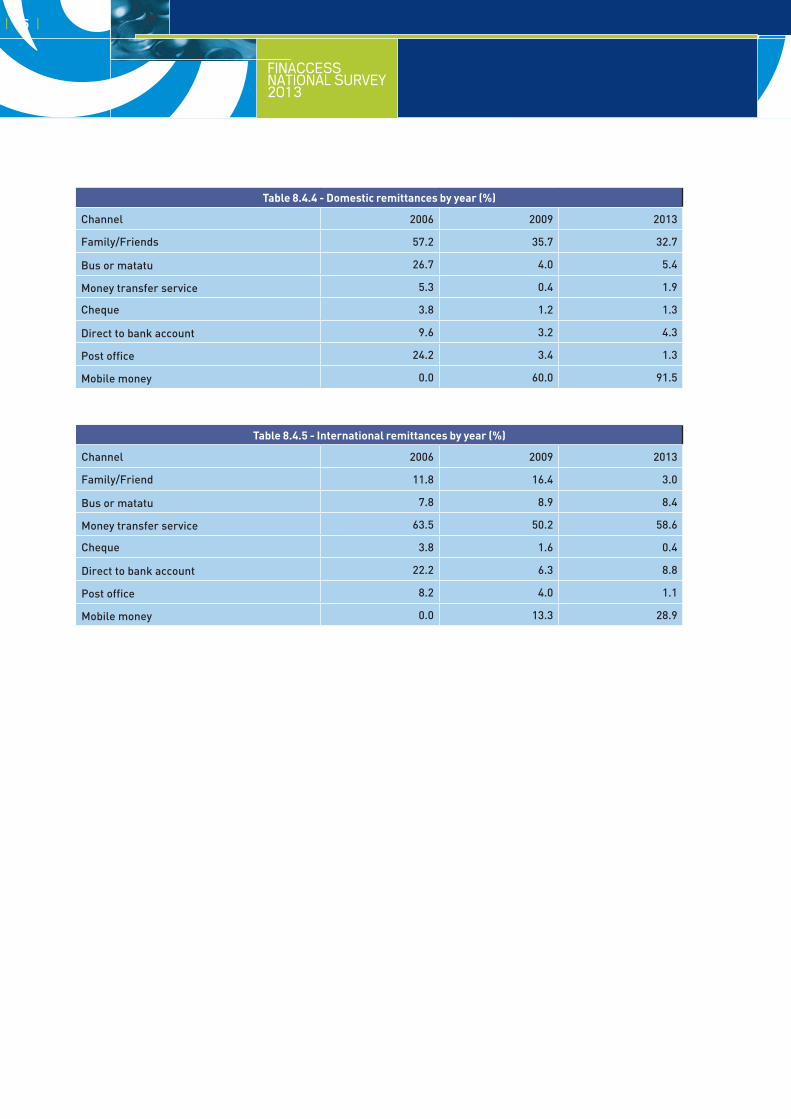
FINACCESS NATIONAL SURVEY
2013
| 45 |
Table 8.4.4 - Domestic remittances by year (%)
Channel 2006 2009 2013
Family/Friends 57.2 35.7 32.7
Bus or matatu 26.7 4.0 5.4
Money transfer service 5.3 0.4 1.9
Cheque 3.8 1.2 1.3
Direct to bank account 9.6 3.2 4.3
Post office 24.2 3.4 1.3
Mobile money 0.0 60.0 91.5
Table 8.4.5 - International remittances by year (%)
Channel 2006 2009 2013
Family/Friend 11.8 16.4 3.0
Bus or matatu 7.8 8.9 8.4
Money transfer service 63.5 50.2 58.6
Cheque 3.8 1.6 0.4
Direct to bank account 22.2 6.3 8.8
Post office 8.2 4.0 1.1
Mobile money 0.0 13.3 28.9
| 45 |
FINACCESS NATIONAL SURVEY2013
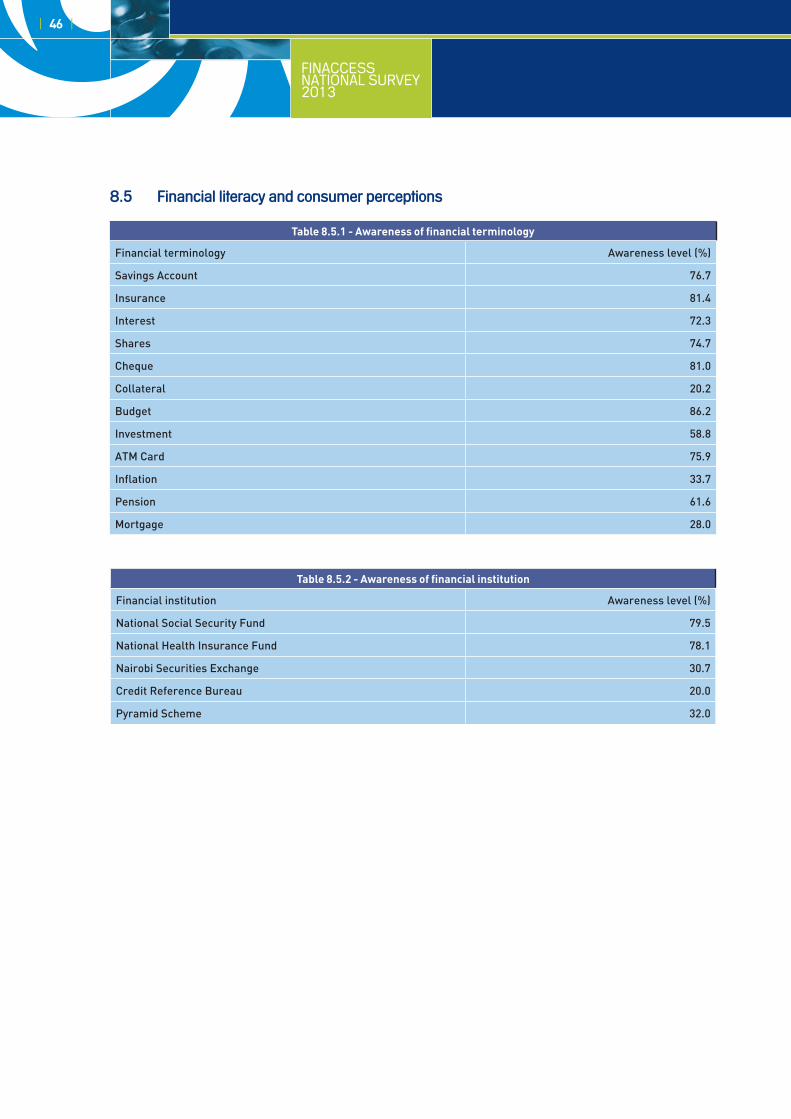
| 46 |
FINACCESS NATIONAL SURVEY2013
8.5 Financial literacy and consumer perceptions
Table 8.5.1 - Awareness of financial terminology
Financial terminology Awareness level (%)
Savings Account 76.7
Insurance 81.4
Interest 72.3
Shares 74.7
Cheque 81.0
Collateral 20.2
Budget 86.2
Investment 58.8
ATM Card 75.9
Inflation 33.7
Pension 61.6
Mortgage 28.0
Table 8.5.2 - Awareness of financial institution
Financial institution Awareness level (%)
National Social Security Fund 79.5
National Health Insurance Fund 78.1
Nairobi Securities Exchange 30.7
Credit Reference Bureau 20.0
Pyramid Scheme 32.0
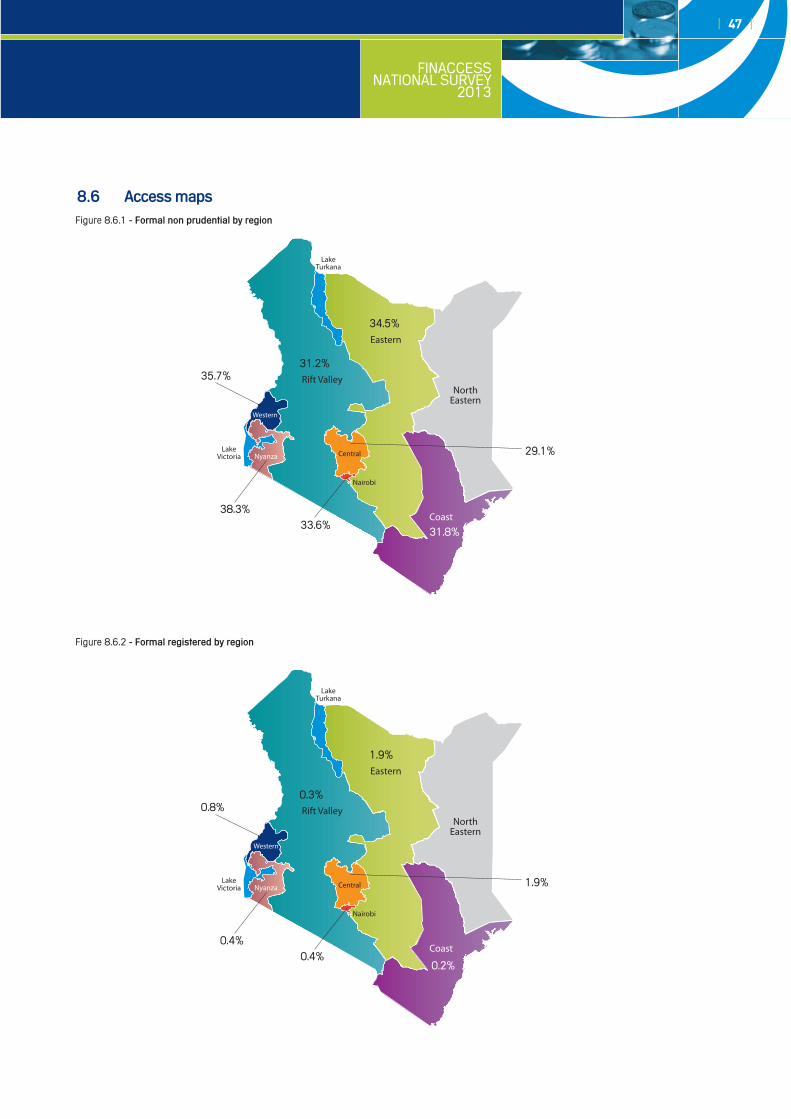
FINACCESS NATIONAL SURVEY
2013
| 47 |
8.6 access maps
35.7%
38.3%33.6%
29.1%
34.5%
31.2%
31.8%
Western
Figure 8.6.1 - Formal non prudential by region
Figure 8.6.2 - Formal registered by region
0.8%
0.4%0.4%
1.9%
1.9%
0.3%
0.2%
Western
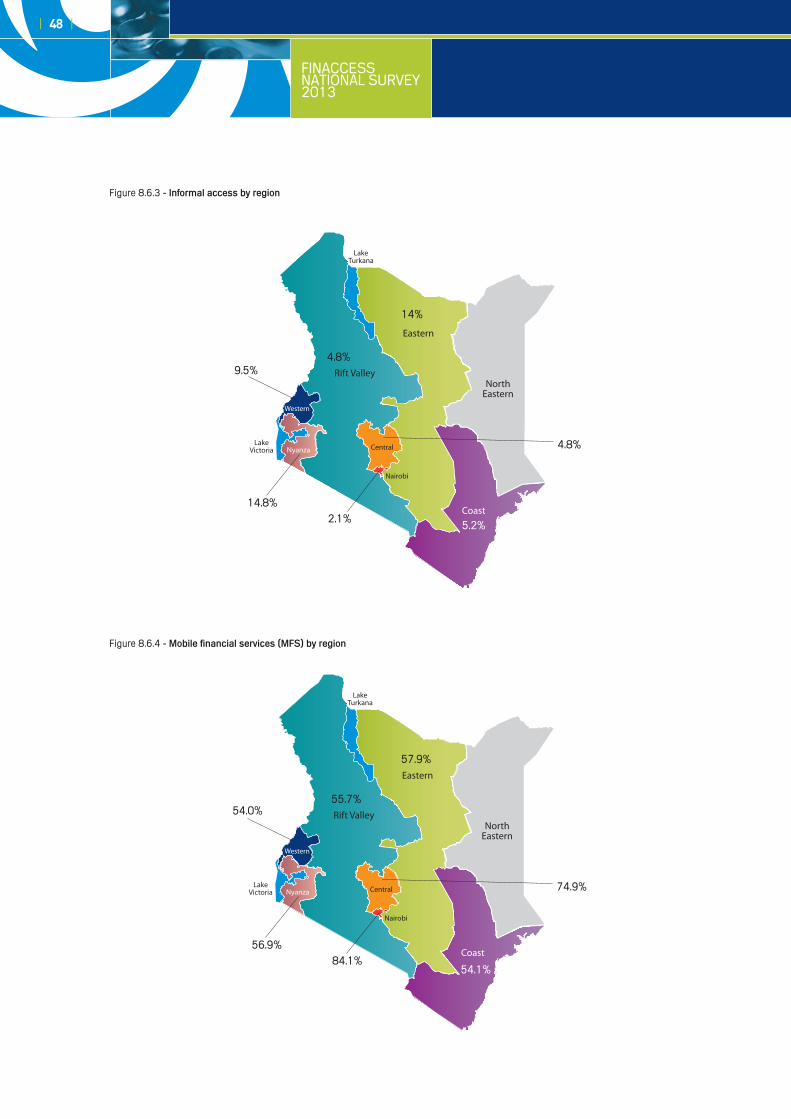
| 48 |
FINACCESS NATIONAL SURVEY2013
Figure 8.6.3 - informal access by region
Figure 8.6.4 - Mobile financial services (MFs) by region
9.5%
14.8%2.1%
4.8%
14%
4.8%
5.2%
Western
54.0%
56.9%84.1%
74.9%
57.9%
55.7%
54.1%
Western

FINACCESS NATIONAL SURVEY
2013
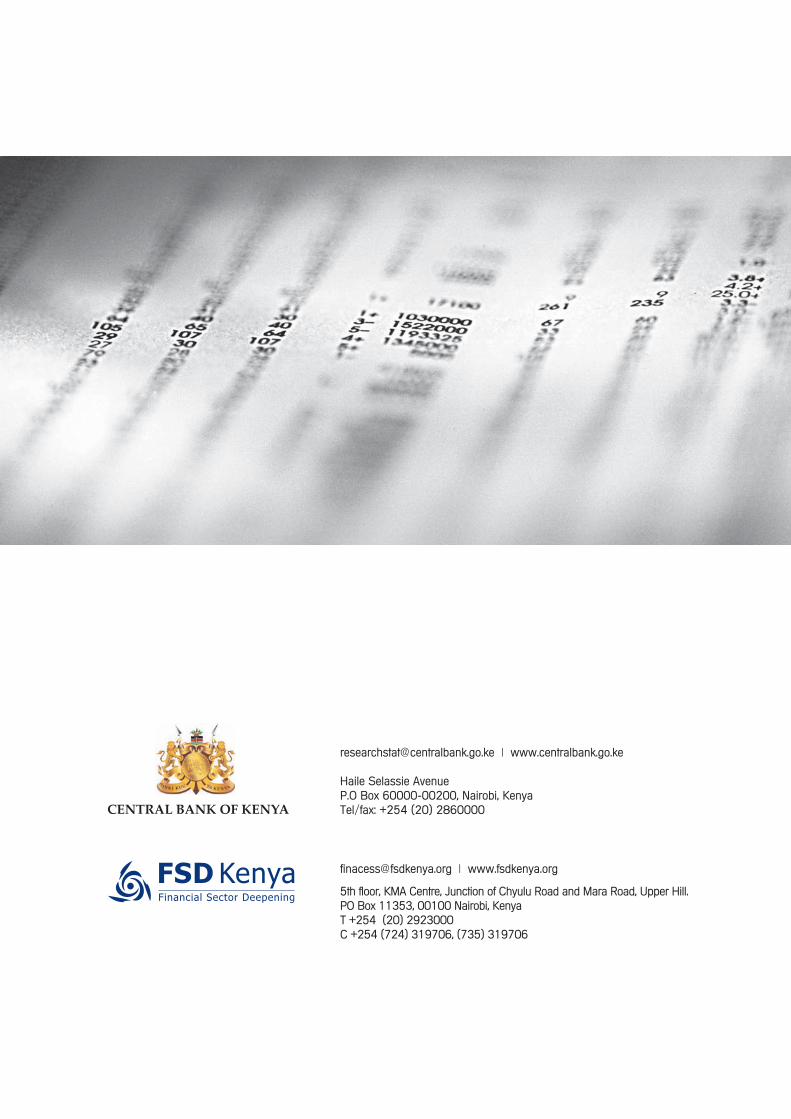
5th floor, KMA Centre, Junction of Chyulu Road and Mara Road, Upper Hill.PO Box 11353, 00100 Nairobi, KenyaT +254 (20) 2923000C +254 (724) 319706, (735) 319706
[email protected] | www.fsdkenya.org
[email protected] | www.centralbank.go.ke
Haile Selassie AvenueP.O Box 60000-00200, Nairobi, KenyaTel/fax: +254 (20) 2860000