prioritization report final -...
TRANSCRIPT

HEALTH CLUSTER
Summary Report Prioritization of woredas for the drought
related emergency health response
Dereje Ayana
2/22/2016

1
Contents
Context ................................................................................................................................................ 2
Objectives ........................................................................................................................................... 2
Methodology ....................................................................................................................................... 2
Findings ............................................................................................................................................... 4
1. Overall health priority ............................................................................................................. 4
2. Meningitis ............................................................................................................................... 5
3. Acute Watery Diarrhoea ......................................................................................................... 6
5. Malaria .................................................................................................................................... 8
6. Dengue .................................................................................................................................... 9
7. Yellow Fever .......................................................................................................................... 10
8. Scabies................................................................................................................................... 11
9. Other: .................................................................................................................................... 12
Limitation and Way forward ............................................................................................................. 12

2
Context
The failed belg rain compounded by the El Niño weather conditions that weakened summer rain has
caused a drought situation in Ethiopia resulting in crop failure, loss of livestock and hence food
insecurity. As a result of the acute food insecurity in many parts of the country, the incidence of
malnutrition has increased. According to the Humanitarian Requirements Document (HRD) the
estimated number of beneficiaries requiring humanitarian assistance in January 2016 was 10.2
million. The same document projected more than 400,000 children to be acutely malnourished and
another 1.7 million children are estimated to suffer from moderate acute malnutrition. This
malnutrition state will increase susceptibility to illness leading to increased morbidity and mortality.
The drought situation has further compromised the already precarious WASH practices, contributing
to the increased incidence of water washed and water borne diseases. In the last few months alone
many woredas in Amhara, Tigray and Oromia regions have reported a dramatic increase in the
number of cases of scabies.
The drought and flooding in some areas is expected to exacerbate disease outbreaks in different
parts of the country and heightened risks of climate sensitive disease outbreaks, such as malaria,
dengue fever, cholera and meningitis. Two woredas of Oromia and Somali regions bordering Kenya
are affected by AWD outbreak currently. Meningococcal Meningitis outbreak was detected and
responded to in a refugee camp located in Gambella. In Dire Dawa, there is an on ongoing outbreak
of Dengue fever, a relatively new disease to Ethiopia. Sporadic outbreaks of measles were confirmed
in many parts of the country, necessitating measles campaign particularly in hot spot woredas.
In addition to these public health emergencies, the health delivery system is stretched by added
burden of internal displacement and refugees. The Joint Government – Humanitarian Partners
National Flood Contingency Plan for the 2015 bega Season projected around 315,930 will be
affected or displaced as a result of floods. According to IOM figures as of October 2015 a total of
422,750 people are displaced as a result of internal disputes, drought and flood. The number of
refugees hosted in Ethiopia is close to 590,000.
Based on the findings of a multi-sectoral assessment, 186 woredas were classified as priority one hot
spot woreda and another 155 and 89 woredas priority two and three respectively. Considering the
large number of woredas categorized as priority hot spots and the limited resource available, there
is a need to prioritize woredas from the perspective of risks to public health emergencies. The
prioritization will provide actors engaged in the emergency health response with preliminary
information on where to focus for further assessment and immediate response.
Objectives
1. Categorize all woredas of the country in to three priority levels based on potential risks of
public health emergencies
2. Provide the basis for a more detailed objective risk assessment at a subnational level
Methodology
The variables used in the prioritization include major risks and driving factor for public health
emergencies in the current drought context of Ethiopia were identified based on historical data and
3
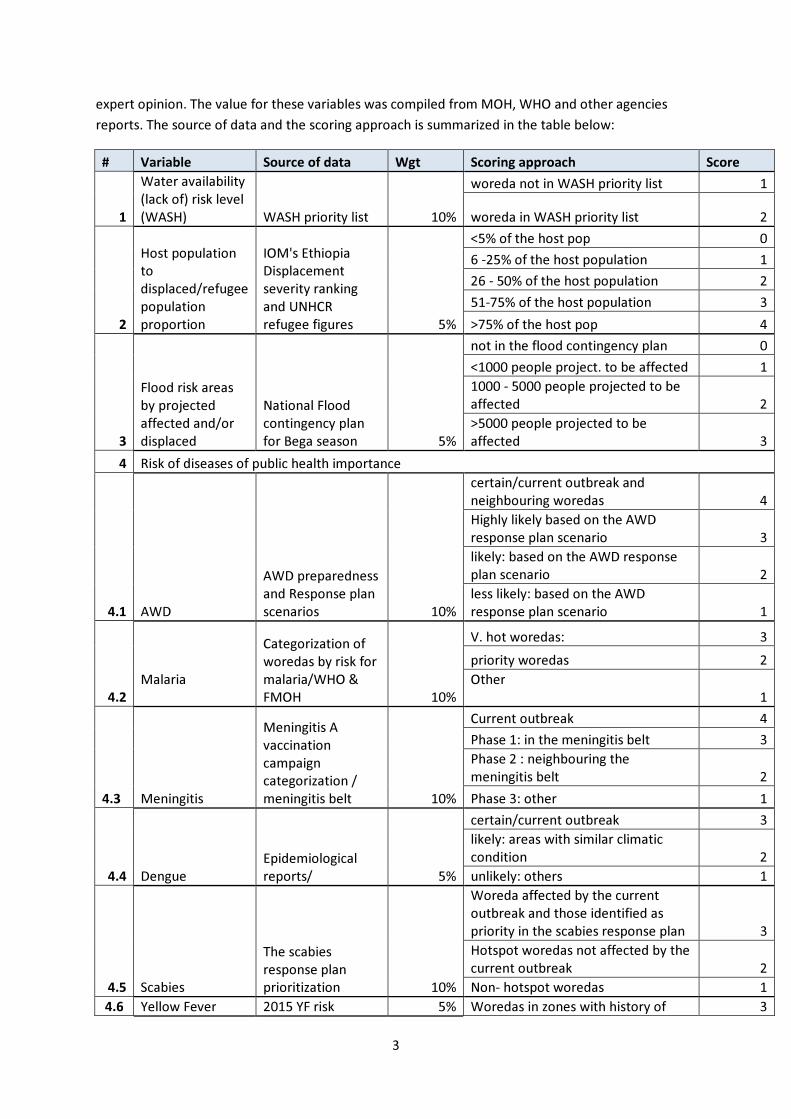
expert opinion. The value for these variables was compiled from MOH, WHO and other agencies
reports. The source of data and the scoring approach is summarized in the table below:
# Variable Source of data Wgt Scoring approach Score
1
Water availability
(lack of) risk level
(WASH) WASH priority list 10%
woreda not in WASH priority list 1
woreda in WASH priority list 2
2
Host population
to
displaced/refugee
population
proportion
IOM's Ethiopia
Displacement
severity ranking
and UNHCR
refugee figures 5%
<5% of the host pop 0
6 -25% of the host population 1
26 - 50% of the host population 2
51-75% of the host population 3
>75% of the host pop 4
3
Flood risk areas
by projected
affected and/or
displaced
National Flood
contingency plan
for Bega season 5%
not in the flood contingency plan 0
<1000 people project. to be affected 1
1000 - 5000 people projected to be
affected 2
>5000 people projected to be
affected 3
4 Risk of diseases of public health importance
4.1 AWD
AWD preparedness
and Response plan
scenarios 10%
certain/current outbreak and
neighbouring woredas 4
Highly likely based on the AWD
response plan scenario 3
likely: based on the AWD response
plan scenario 2
less likely: based on the AWD
response plan scenario 1
4.2
Malaria
Categorization of
woredas by risk for
malaria/WHO &
FMOH 10%
V. hot woredas: 3
priority woredas 2
Other
1
4.3 Meningitis
Meningitis A
vaccination
campaign
categorization /
meningitis belt 10%
Current outbreak 4
Phase 1: in the meningitis belt 3
Phase 2 : neighbouring the
meningitis belt 2
Phase 3: other 1
4.4 Dengue
Epidemiological
reports/ 5%
certain/current outbreak 3
likely: areas with similar climatic
condition 2
unlikely: others 1
4.5 Scabies
The scabies
response plan
prioritization 10%
Woreda affected by the current
outbreak and those identified as
priority in the scabies response plan 3
Hotspot woredas not affected by the
current outbreak 2
Non- hotspot woredas 1
4.6 Yellow Fever 2015 YF risk 5% Woredas in zones with history of 3

4
assessment report yellow fever outbreak
Woredas in ecological 1, 3 and 5
zones of the YF risk ass. 2
Woredas in ecological 1, 3 and 5
zones of the YF risk ass. 1
4.7
Measles risk
ranking
WHO/EPI measles
ranking 10%
Very High risk 4
High risk 3
Medium risk 2
Low risk 1
5
Food insecurity
ranking
DRMFC
prioritization of
woredas for the
current emergency 15%
First priority 4
Second priority 3
Third Priority 2
Not priority 1
6 Population size CSA 2015 5%
>=150,000 4
>=100,000 - <150,000 3
>=50,000 - < 100,000 2
<50,000 1
Total 100%
>2 Priority 1
>1.5, <2 Priority 2
<1.5 Priority 3
Findings
1. Overall health priority
The overall priority for a woreda is the summation of the values for all the variables. Out of the 701
woredas where data on all the prioritization variables was available 69 were priority one, while 340
and 292 were priority two and three. Amhara region has the highest number of priority one woredas
while the region with highest proportion of priority one woredas is Gambella. The Graph and map
below show the categorization of woredas in a region by overall health priority.
5
Graph 1 Overall health priority
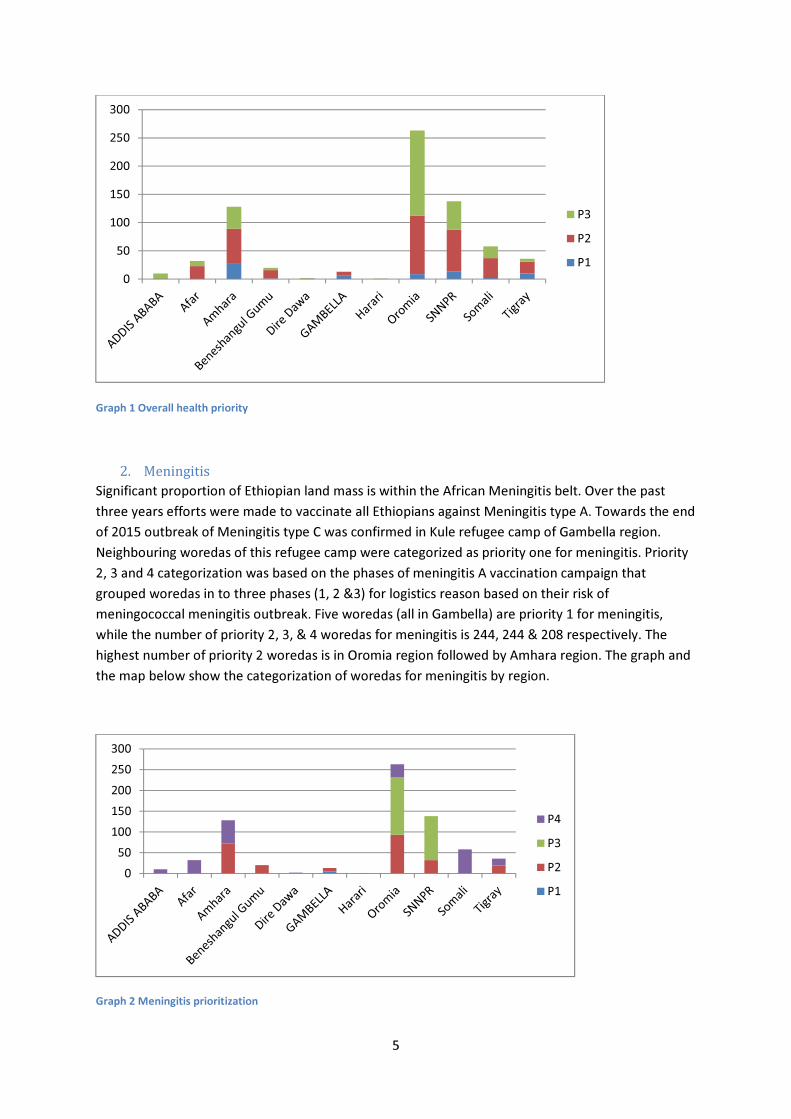
2. Meningitis
Significant proportion of Ethiopian land mass is within the African Meningitis belt. Over the past
three years efforts were made to vaccinate all Ethiopians against Meningitis type A. Towards the end
of 2015 outbreak of Meningitis type C was confirmed in Kule refugee camp of Gambella region.
Neighbouring woredas of this refugee camp were categorized as priority one for meningitis. Priority
2, 3 and 4 categorization was based on the phases of meningitis A vaccination campaign that
grouped woredas in to three phases (1, 2 &3) for logistics reason based on their risk of
meningococcal meningitis outbreak. Five woredas (all in Gambella) are priority 1 for meningitis,
while the number of priority 2, 3, & 4 woredas for meningitis is 244, 244 & 208 respectively. The
highest number of priority 2 woredas is in Oromia region followed by Amhara region. The graph and
the map below show the categorization of woredas for meningitis by region.
Graph 2 Meningitis prioritization
0
50
100
150
200
250
300
P3
P2
P1
0
50
100
150
200
250
300
P4
P3
P2
P1

6
3. Acute Watery Diarrhoea
Large scale outbreaks of Acute Watery Diarrhoea have affected Ethiopia at large since 2006. There is
currently an outbreak of AWD in Moyale (Oromia and Somali Regions). Two woredas affected by the
current outbreak and 18 woredas with very close link to the affected woredas are categorized as
priority one. The priority 2, 3 & 4 categorization was done based on the scenario of the National
AWD preparedness and response plan. Most of the woredas in the high likely category are close to
the South Sudan border. The Graph and the map below summarize the AWD prioritization.
Graph 3 AWD priority
0
50
100
150
200
250
300
P4
P3
P2
P1

7
4. Measles:
In 2015 more than 20 outbreaks of measles were reported from different parts of the
country and the numbers of cases reported in 2015 exceed those reported in 2014 by over
100%. The EPI unit of WHO mapped out the risk to measles base on the following criteria:
accumulation of susceptible, measles routine EPI and campaign coverage, non- measles
febrile rate, Epi-link to outbreak Woreda in the last three months, evidence of malnutrition
and other risk factors such as displacement, refugee setting, conflict and inaccessibility.
Woredas identified as very high risk were grouped as priority 1 and those with low risk to
measles were categorized as priority 4. SNRRP followed by Amhara region has the highest
number of priority 1 woredas. See the graph and map below for summary of measles
priority by region

8
Graph 4 Measles priority
5. Malaria
Malaria transmission in Ethiopia is seasonal and unstable. Ethiopia has history of frequent,
sometimes devastating, malaria epidemics. In the last decade the number of reported epidemics has
declined. Even though there is no consensus on classification of woredas, for operational purposes
very hot and priority woredas for malaria transmission are identified. For this exercise hot spot
woredas are priority one, malaria priority woredas are priority two and the others are priority three.
There are sixty three woredas each in the priority one and two categories.
0
50
100
150
200
250
300
P4
P3
P2
P1

9
Graph 5 Malaria priority
6. Dengue
Dengue is a relatively new disease in Ethiopia. Outbreak of the disease was confirmed previously in
Gode (Somali region) and at present there is an ongoing outbreak in Dire Daw. The two areas
affected by the outbreak are categorized as priority one, areas with similar climatic condition( Afar
and Somali regions) are priority two while the rest of the country is classified as priority three.
0
50
100
150
200
250
300
P3
P2
P1

10
Graph 6 Dengue priority
7. Yellow Fever
Thirty nine woredas in Ethiopia have history of yellow fever outbreak and these woredas were
classified as priority one. In 2015 yellow fever risk assessment was done using sero survey. Woredas
in ecological zones where YFV circulation was confirmed are grouped as priority and those in
Ecological zones without YFV circulation priority three.
0
50
100
150
200
250
300
P3
P2
P1

11
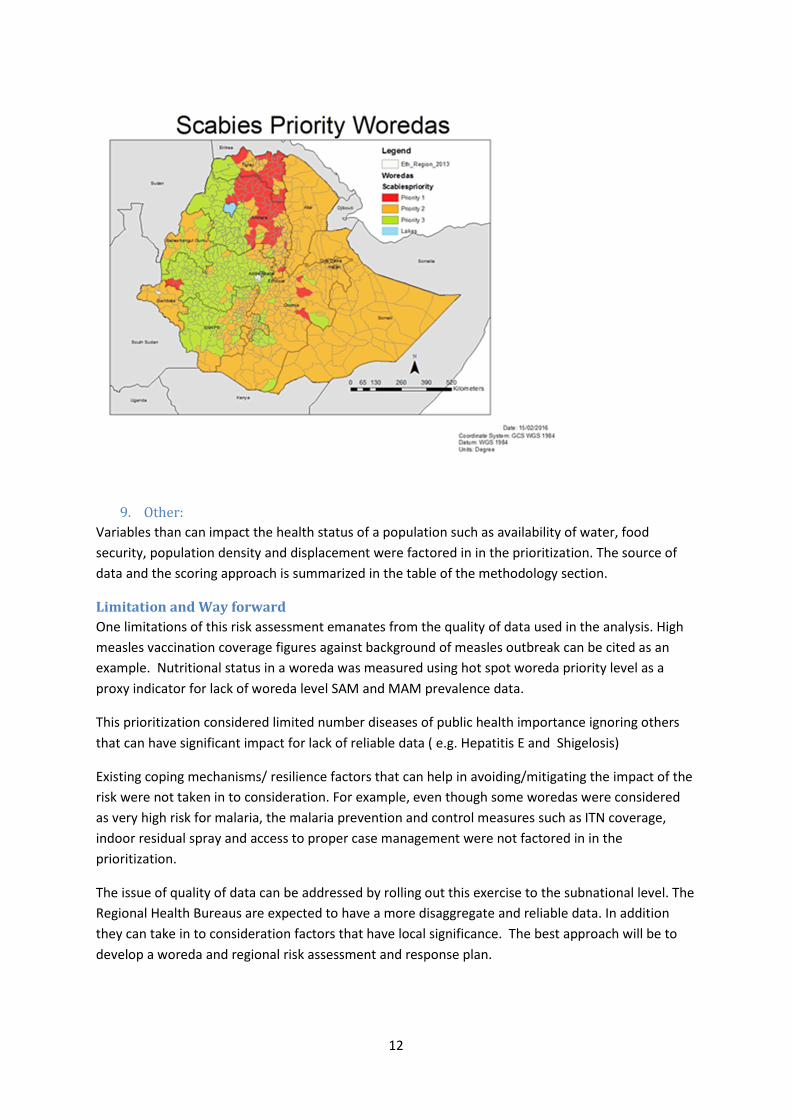
8. Scabies
Even though scabies is not associated with mortality on the long term some cases can end up with
life threatening complications. Woreda affected by the current outbreak and those identified as
priority woredas in the scabies response plan are the priority one woredas. Hotspot woredas not
affected by the current outbreak are priority two while woredas not affected by the outbreak and
non-hot spot are priority three. Most of the priority one woredas are in Amhara and Tigray regions.
Graph 7 Scabies priority
0
50
100
150
200
250
300
P2
P1
0
50
100
150
200
250
300
P3
P2
P1
12
9. Other:
Variables than can impact the health status of a population such as availability of water, food
security, population density and displacement were factored in in the prioritization. The source of
data and the scoring approach is summarized in the table of the methodology section.
Limitation and Way forward
One limitations of this risk assessment emanates from the quality of data used in the analysis. High
measles vaccination coverage figures against background of measles outbreak can be cited as an
example. Nutritional status in a woreda was measured using hot spot woreda priority level as a
proxy indicator for lack of woreda level SAM and MAM prevalence data.
This prioritization considered limited number diseases of public health importance ignoring others
that can have significant impact for lack of reliable data ( e.g. Hepatitis E and Shigelosis)
Existing coping mechanisms/ resilience factors that can help in avoiding/mitigating the impact of the
risk were not taken in to consideration. For example, even though some woredas were considered
as very high risk for malaria, the malaria prevention and control measures such as ITN coverage,
indoor residual spray and access to proper case management were not factored in in the
prioritization.
The issue of quality of data can be addressed by rolling out this exercise to the subnational level. The
Regional Health Bureaus are expected to have a more disaggregate and reliable data. In addition
they can take in to consideration factors that have local significance. The best approach will be to
develop a woreda and regional risk assessment and response plan.