prepared by: rcg/hagler, bailly, inc. arlington, …pdf.usaid.gov/pdf_docs/pnabl034.pdf · 3.1 list...
TRANSCRIPT

E m R G Y EFFICIENCY AUDIT REPORT P.V. BUDAFOKI PAPER PLANT
BUDAFOK, HUNGARY
APRXL 1992
PREPARED BY: RCG/HAGLER, BAILLY, INC. Arlington, VA
EGI CONTRACTING/ENGINEERING Budapest, Hungary
U.S. EMERGENCY ENERGY PROGRAM FOR EASTERN AND CENTRAL EUROPE
U.S. AGENCY FOR INTERNATIONAL DEVELOPMENT BUREAU FOR EUROPE WASHINGTON, D.C- 20253

ENERGY EFFICIENCY AUDIT REPORT P.V. BUDAFOKI PAPER PLANT
BUDAFQR, HUNGARY
APRIL 1992
PREPARED BY: RCG/HAGLER, BAILLY, INC. 1530 Wilson Boulevard Suite 900 Arlington, VA 22209 (703) 351-0300
and
EGI CONTRACTING/ENGINEERING H-1027 Budapest, Bern rkp. 33-34 Hungary (361) 201-6417
U.S. EMERGENCY ENERGY PROGRAM FOR EASTERN AND CENTRAL EUROPE
U.S. AGENCY FOR INTERNATIONAL DEVELOPMENT BUREAU FOR EUROPE OFFICE OF DEVELOPMENT RESOURCES ENERGY L INFRASTRUCTURE DIVISION WASHINGTON, D.C. 20253
USAID Contract EUR-0015-C-00-1007-00
The contents of this report are offered as guidance. RCG/Hagles, Bailly, Inc., EGI Contracting 6 Engineering, and the United States Agency for International Development, and all technical sources referenced in this report do not (a) make any warranty or representation, express or implied, with respect to the accuracy, completeness, or usefulness of the information contained in this report, or that the use of any information, apparatus, method, or process disclosed in this report may not infringe upon privately owned rights; (b) assume any liabilities with respect to the use of, or for damages resulting from, any information, apparatus, method or process disclosed in this report. This report does not reflect official views or policies of the above named institutions. Mention of trade names or commercial products does not constitute endorsement or recommendation for exclusive use.
The contents of this report include recommendations based on data provided by the client plant, measurements made on site, calculations, and engineering judgment. The conclusions reached were based on a limited engagement of only about one week's duration in the plant, and not an exhaustive engineering analysis. RCG/Hagler, Bailly, Inc. certifies that this report conforms to the level of best co-mmercial practice for industrial energy audits of similar level of effort, as conducted in the United States. This report has been prepared under the guidance of a registered Professional Engineer, licensed to practice in the United States.

ACKNOWLEDGEMENTS
EXECUTIVE SUMMARY
1 INTRODUCTION TO THE PLANT
1.1 Plant Activities 1.2 Management Structure 1.3 Energy and Utility Supply Systems 1.4 Energy Consumption
2 FINDINGS AND RECOMMENDATIONS
2.1 Energy Management 2.11 Findings 2.12 Recommendations Concerning Energy Management
2.2 Metering 2.21 Findings 2.22 Recommendations on Metering
2.3 Overall Plant Performance 2.31 Findings 2.32 Recommendations
2.4 Boiler Performance 2.41 Introduction 2.42 Combustion Tests 2.43 Water Tests 2.44 Boiler Heat Losses 2.45 Cost of Steam 2.46 Summary of Recommendations for the Boilerhouse
2.5 Steam Distribution and Condensate Return Systems 2.51 Findings 2.52 Recommandations Concerning Steam Distribution and
Condensate
2.6 Purchasa of, Steam from Buszesz Plant 2.61 Findings 2.62 Racommandations Regarding Steam Purchasas
2.7 Board Machines 2.71 Finding. 2.72 Recommandations Ralating to Board Hachine Performance
2.9 Steam for Spaca Heating 2.81 Finding. 2.82 Recommandations Ralating to Spaca Heating
2.9 Elactrical System 2.91 Findingv 2.92 Racommandations Ralating to Elactricity

3 SUMMARY "OF ENERGY SAVING CTPORTUNITIES
3.1 List of Recommendations 3.2 Potential Savings 3.3 Possihle Projects for USAID Support
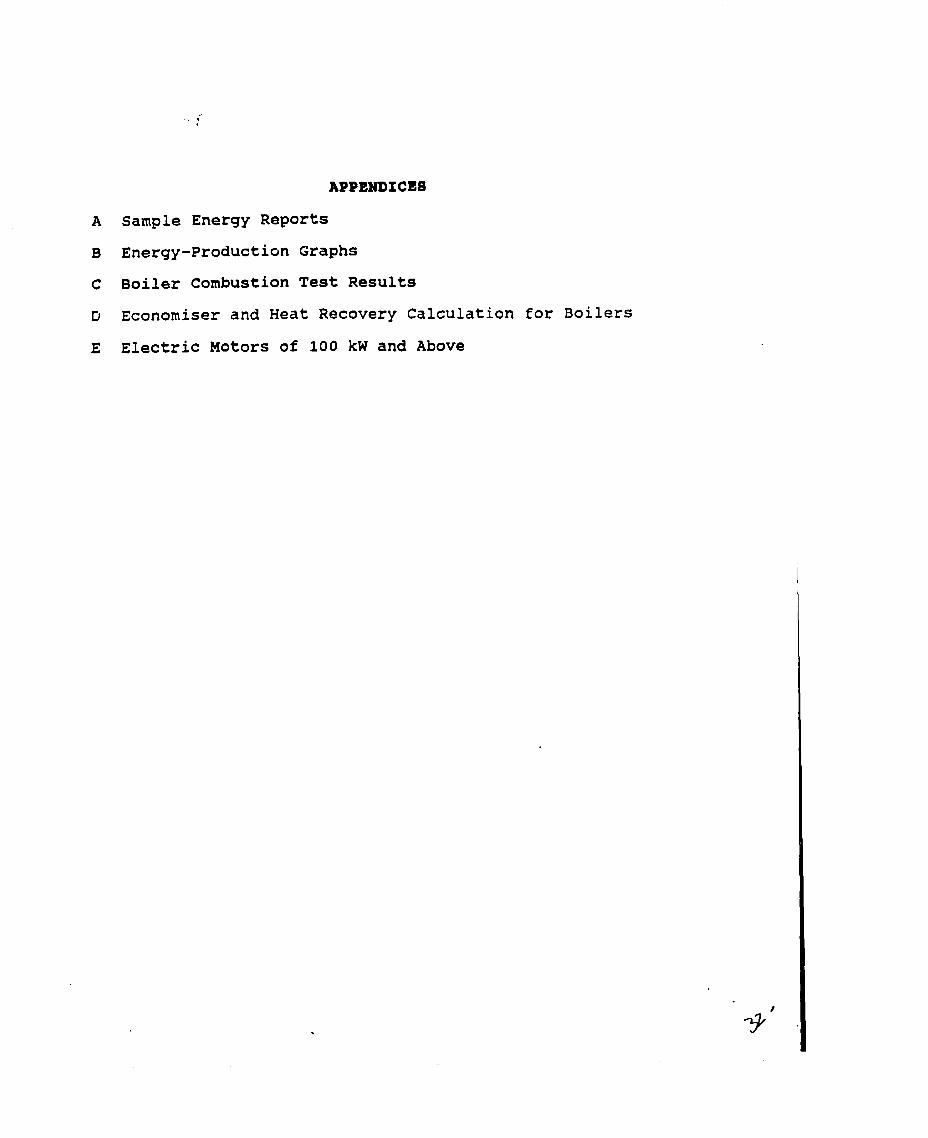
I APPENDICES
A Sample Energy Reports
B Energy - production Graphs C Boiler Combustion Test Results
D Economiser and Heat Recovery Calculations for Boilers
E Electric Motors of 100 kW and Above
ACKNOWLEDGEMENTS
The enthusiastic assistance of plant personnel in a number of departments contributed greatly to this brief energy audit of the P.V. Budafoki ~apirgyar plant. In particular, we wish to acknowledge the major participation of Messrs Pusztai and Parkas of the Energy Supply Department who provided much of the basic data, guided us around the plant and participated in test work. We also wish to express our thanks to Mrs. Lizicska (Production Manager) for information provided, and to Messrs. Moncz (boiler operations) and Ormos (electrical department) who provided information and carried out various tests themselves using the portable instruments brought to the plant.

EXECUTIVE 8UZ4KARY
ACTIVITIES
The Budafok paper plant is the only plant in Hungary which makes cardboard for boxes and packaging. There are 460 employees at the plant. At present the plant is state-owned but discussions are in progress with a view to privatisation.
Single and multilayer board are produced, with about 80 percent of raw materials being waste ?aper and 20 percent purchased pulp. Production 01' saleable board in 1990 was almost 35000 tonnes from the three conventional lines and one line for hand made board. The latter contributed only about 4 percent of 1990 production and is expected to cease operation soon.
ENERGY USAGE
Energy supplies to the plant consist of electricity purchased from the grid, steam purchased from the nearby Buszesz plant, and natural gas for raising steam in the paper plant boilers. Occasionally warm water is also purchased from Buszesz but this is expected to cease shortly. Quantities of warm water purchased in 1990 were relatively small, amounting to around 1200 M3 per day on average for the first quarter only.
Energy consumptions (excluding warm water) in 1990 were:
Basic units Energy content Cost ** of consumption GJ ~ c t 1000 Ft pct --------o--.-. 0.0-0- -.-.--- -------- ------
Electricity * 28300 Mwh 319945 48.7 133066 52.0 Natural gas 8024500 M3 272699 41.4 88350 34.5 Purchased steam 24674 tonne8 65337 9.9 34544 13.5
TOTALS 657981 100.0 255960 10C.O ~ ~ I ~ 1 ~ L I I I I I m I I I ~ I m m m ~ ~ m I ~ ~ ~ m m L m 3 0 ~ ~ ~ ~ m I ~ I ~ ~ ~ m ~ ~ ~ ~ 3 0 m s ~ ~ ~ ~ ~ ~ s ~ ~ m ~ ~ ~ ¶ ~ ~
* Conversion to GJ uses a factor of 2700 kcal/kwh, the estimated equivalence of primary fuels used for electricity generation.
** Cost figures are based on current prices (April 1991).
The total energy consumption is currently equivalent to an average of about 7500 Ft. per tonne of paper produced. Based on an average paper price of say 38000 Ft., energy thu8 represents about 20 percent of the selling price of the product.
With respect to specific anergy consumptions (the energy consumed per unit of production), tha.plant data for 1990 indicate the following:
\ '
~lectricit~ consumed by board machines 755 kwh/t paper Total electricity consumption 830 kwh/t paper Steam consumed by board machines 2.73 tonnes/t paper ---- equivalent to 6.74 GJ/t paper Total steam consumption 9.5 GJ/t paper
These figures suggest that the energy efficiency of the Budafok plant compares with typical practice for board mills using the technology of the mid to late 1970"s.
PLANT EVALUATION
A review of plant energy records and reporting systems was carried out from April 3-9, 1991, and various tests of equipment performance were conducted in the plant using data obtained from existing plant instrumentation and from portable energy audit instruments.
The main findings were as follows:
(1) Energy related data are collected daily and reports produced regularly by the Energy Supply Department. In these reports, a number of efficiency ratios are presented. However, the reports do not appear to be fully utilised for energy management purposes.
(2) Metering of major energy consumptions is adequate although some new electricity, gas and steam meters would be useful.
(3) As noted above, in terms of energy efficiency, overall plant performance is up to the standard expected for mills designed in the late 1970's.
(4) Boiler performance is generally good' with excess air maintained at acceptable low levels.
(5) The quality of water sent to the boilers and that of the water in the boilers was below the standards for Total Dissolved Solids normally expected for packago boilers producing saturated steam at 8-9 bars.
(6) Boilor heat losses from radiation and convaction are quite low.
(7) Lines to steam traps and condonsata return lines often lack adequate insulation.
(8) In general, steam traps require ropair or replacement. Of the traps tested, about 85 percent wera Found defective.
(9) In particular, it is boliovod that significant steam losses are occuring through dafoctivo traps on tha board machines. This is partly due to tho wrong typs of trap baing installed.
(10) Tha-marginal coat of stoam genoratad in tho plant is about 950 Ft/tonna, comparad with a statod total cost of 1100 Ft/t and a comt of purchased staaa of 1400 Ft/t from tho nearby Buszesz plant.

(11) The stegm heated space heating system is not efficient.
(12) Some motors are clearly oversized for their present duties but others were found properly sized.
(13) The cleaning of lighting fixtures could be improved.
Bearing in mind that the plant has little funding available for capital investment projects and that the ownership structure may change later this year, our principal recommendations are therefore the following:
(1) Improve the format and content of regular reports, and increase the efficiency of report preparation by introducing a computer. Carry out data analysis with the routine figures collected and develop the relationship of production to energy use.
(2) Operate the boilers with a higher blovdown and recover additional heat by installing more heat exchango surface.
(3) Maintain a good combustion efficiency by regular checking of excess air levels.
(4) Install a few additional gas, electricity and steam meters to improve monitoring and control of major energy users.
(5) Improve the insulation of certain steam and condensate lines.
(6) Repair or replace all defective steam traps in the plant on general steam and condensate system applications..
(7) Replace all traps on the drying cylinders of the board machines.
(8) Convert the space heating system to circulating hot water.
(9 ) Check the load on the larger motors and replaca oversized motors where economically justifiad.
(10) Modify operating procedures for the hydropulpers if possible, to reduce the amount of "idleM time.
(11) Review the contract for steam purchasas from Buazesz and renegotiate the contract to reflect more realistic steam production prices.
Tho anticipated savings, corresponding investments and calculated paybacks are summarired in Exhibit A. Tha overall energy savings a~ount to about 7 percent of current energy bills and recommanded actions have an averago payback of 6 months.

Support from U S A I D for the purchase of selected equipment and instruments is recommended as part of this project. These purchases are:
Steam traps for the board machines US $ 20,000 Computer, printer, Lotus software 5,000 Sonic steam trap tester 1,300 Electrical system survey instrument 6,000 Combustion analyser 3,000 Water quality TDS meter 300 .------
Total 35,600
No. Item Savings Ft US $
Energy Management 1.1 Reporrs, balances -- 1.2 Additional data -- 1.3 Maintenance costs -- 1.4 Monthly review -- 1.5 Computer, software 1300000 1.6 Electricity meters 650000 1.7 Elec survey inst'n~t 560000 1.8 Sas/steam meters 880030
Cost Ft US $ -------- ------
Payback months
Boilerhouse 2.1 Combustion analysor 870000 12000 220000 3000 3.0 2.2 Blowdown heat rec. 1160000 15900 790000 11100 8.4 2.3 Economiser 920000 12600 1500000 20500 19.5
Steam & condensate lines 3.1 Replace traps 365000 5000 365000 5000 3.2 Line drainage, traps -. .a -. -. 3.3 Sonic trap tester 235000 3200 95000 1300 3.4 Cond line insulat,ion Om -- .. Ow
Steam purchases 4.1 Review contract
Board machines 5.1 Replace traps 7700000 105500 1460000 20000 2.3 5.2 Flash steam rec -. .. -. .. 0..
5.3 Hood ht rec system .. .. -. .. ... 5.4 Insulate cyl. ends 1980000 27000 1980000 27000 12.0 5.6 Minimise grade changes -- .. -. ow ...
Space heating 6.1 Convart to hot water 935000 12800 -- .- ..- 6.2 Insulate lines .. .. -. -. --.
Electrical 7.2 Replaca a/c motors 112800 1550 300000 4100 31.8 7.3 Dual spd h/p motor 163600 2200 241000 3300 18.0 7.4 Improve lighting 20000 550 73000 1000 21.8 -..---.- 0-0.-. .-....- ...... 0.0-
Totals 17851400 245000 9290000 127380 6.2
Total savings equivalent to about 7 parcent of present energy expenses.

1.1 PLANT ACTIVITIEB
The pv ~udafoki Papirgyar plant is the only one in Hungary currently making board for packaging. Single and multilayer boards are produced in a wide range of qualities, thicknesses and cut sizes. The board is made in three lines of conventional board making machines, together with a small line for hand made board. Production in 1990 was about 34100 tonnes, of which only 1460 tonnes (4.3 %) were hand made. Raw materials are purchased pulp and recycled waste paper, the latter amounting to about 80 percent on average. The raw materials are broken down in a slurry of water in the materials preparation section.
In addition to the main production facilities, the plant includes various utility supply sections, such as the boilerhouse, a water treatment plant and air compressors: these are described below.
1.2 MANAC3EnCNT STRUCTURE
The management structure of the plant may be summarised as follows:
General Manager I
t"""""m.--l---------.------- I
T I
Chief Accountant Chief Engineer Mrs Ladanyi Mr Panyi
I
Computer Dept I r-.----.---.-.-------- 1 Accounts Board Plant Associated plants etc Manager (abrasives, boxes)
I
I
Energy ~aintanance prodiction :-- Quality Control Supply I
L-- Transport E 14gr Mr Pusztai Elec Eng
1 Prod Mgr I
E Eng Mr Farkas Mr Ormus Mrs Lizicska k-- Purchasing * boiler op't'ns * elec. supply * water treatm't * electricity
statistics
i '- Sales
The Energy Supply Department reports through tha Chief Engineer and is responsible for operating the boilerhousa and water treatment plants, as wall as maintaining enargy con;*imption records and preparing routine reports on energy Usen This extends to electricity statistics, although the responsibility for electricity systems lies with the Maintenance Department.

1.3 ENERGY . AND . UTILITY BOPPLY 8YBTEMB
The main energy sources for the plant are electricity, natural gas and purchased steam. The electricity is obtained entirely from the grid as the plant does not generate any of its own electricity. The supply is provided along two 10 kilovolt feeders, one of which is used w h i l ~ the other is kept as standby. The contracted maximum load is 6.2 MW, although the maximum demand rarely exceeds 5.4 MW. Power factor correction to a level of about 0.94 by distributed capacitors ensures the plant receives a premium in the monthly electricity bills.
Natural gas is purchased for use in the plant boilers to raise steam. A small amount of natural gas is also used in the process itself. The calorific value of the gas normally varies in a narrow range from 33.9 to 34.1 MJ/nM3.
Steam is supplied from the plant boilers and through purchases from the nearby Buszesz power plant. Although the Buszesz plant operates a cogeneration system, the price charged for steam is higher (at 1400 Ft/t) than the cost of self-generated steam (1100 Ft/t), and therefore the paper plant generally runs one or two of its own boilers for base load steam demand and draws on Buszesz to provide peak demands. This is of course the reverse of the situation which Buszesz would like but is a consequence of the relative pricing and of the unreliability of the Buszesz steam supply. In fact, the plant wishes to negotiate an amended contract.
The plant has four locally made, gas fired boilers installed in their boilerhouse which date from about 1972. Saturated steam at 9 bars is produced, although the steam is actually used at about 3-4 bars (the pressure reduction being performed through a simple let-down valve). The boiler capacities and minimum loads are as follows:
Boiler 1 2 3 4 .......-.I -.-.....- ...-oo-o ...--oo
Maximum capacity (t/h) 11.0 12.0 12.0 10.5 Minimum load (percent) 50 30 30 30
Each boiler has a small heat recovery system connected to the continuous boiler blowdown line and an internal system for heat recovery from tha combustion gases into the boiler feed water. There are no air preheat systems fitted. Condensate recovery is stated to be about 80 percent, soma of which is returned to Buszesz and the remainder to the boilers.
Water for various usea in the plant is obtained from wells and from the Danube River. Waste water is returned to the Danube after treatment at tha plant, which i.,rcludas filtration and clarification. Water for the boilers is treated in an ion exchange unit.
From time to tima, tha plant receivam wann water at around 40 deg.C from the Buszesz plant. During the first qua~ter of 1990, the maximum quantity was approximately 3000 M3/day and the average was 1200 M3/day.
Compressad air at 6-7 bars is providad for ganeral plant use (e.g. pressas, operation of paper guidas on tha machinas, pneumatic actuators) by two air compressors ratmd at 780 nM3/h aach. Each is ,
. 4 1

fitted with ;'a 100 kw motor. Demand is such that both compressors are normally runhing at near fuli capacity. In Pact, the compressors were originally two cylinder machines and have been modified for single cylinder operation. Oil free dry instrumend: air is provided from a separate installation with two compressors.
At present, there is haac recovery at the air comprGssor outlet but the recovered heat is discarded as warm water to drain.
Energy consumption by the plant during 1990 (excluding warm water) was as follows:
- - - - - - - - - - - - - - - - - - - - - -
Basic units Energy content Cost ** of consumption GJ PC+- 1000 Ft pct ----------"--- -.---. ------- -------- ------
Electricity * 28300 Mwh 319945 48.7 133066 52.0 Natural gas 8024500 M3 272699 41.4 88350 34.5 Purchased steam 24674 tonnes 65337 9.9 34544 13.5
TOTALS 657981 100.0 255960 100.0 ~ ~ = = = s = s ~ ~ = o ~ ~ ~ ~ ~ = = a = = a = = ~ a = = = ~ ~ ~ = s m ~ s a ~ ~ ~ = ~ ~ = ~ = ~ = = ~ = ~ = = = ~ ~ = = = = = ~ = = =
* Conversion to GJ uses a factor of 2700 kcal/kwh, the estimated equivalence of primary fuels used for electricity generation.
** Cost figures are based on current prl.c:es (April 1991) . Details of energy consumptions are given in A,ppendix A. In summary, some key parameters recorded for 1990 are:
* Board produced (net saleable) 34,129 tonnes * Average ratio, net *to gross production 0.824
* Electricity consumed by board machines 755 * Total electricity consumption 830
* Total purchased steam * Self generated etaam Total steam
* Estimated boiler efficiency (average) 82 * Equivalent to 11.5 * Equivalent to 87.3
* Steam consumed by board machine8 * Equivalent to * Total plant steam consumption * Total energy coat 7543 * Energy comt am percant of product price
(baaed on typical prica of 38000 Ft/t) 20
kwh/t product kwh/t product
tonnes tonnee tonnes
percent t steam/1000 M3 gas M3 g a s p steam
tonnes/t product GJ/t product GJ/t product
Ft/t product
percent I

The performance of the plant may be compared with. figures in published reports for the industry in other countries. For example, energy costs in the UK are typically 15 to 20 percent of overall production costs in a paper or board mill: the figure for the Budafok plant of 20 percent of typical board price is thus consistent. In terms of energy consumption, the plant appears to be close to typical European standards of the late 1970's or early 1980,s. This is to be expected due to the age of the basic plant design:
................................................................... ................................................................... Budaf ok EEC UK plant data (1) data(2) ------- -------- --..---
Thermal energy 9.5 8.3 11.2 GJ/t product Electricity 830 - 750 kwh/t product
~===z===='='==3'=====¶=I===3=====3=3=====~~~~====s===================
(1) From Energy Audit #3, "Pulp, Paper and Board Industry of the European Economic Communityu, data for 1981/2
(2) From Energy Audit Seriss # 14, The Paper and Board Industry, UK Dept. of Energy and Dept of Industry, data from 1978.
A modern design of mill would probably show an improvement of about 20 percent on the older figures.
2 PINDINOB AND RECOIQILNDATIONB
The Energy Supply Department produces routine daily, monthly, quarterly and annual reports of energy consumption. In these reports, a number of efficiency ratios are presented, such as spacific energy consumption of the board machinam in kwh par tonne of saleable product. All the reports are producad by hand calculation and this is a time consuming exercise every day. In addition, manual calculation is always prone to error (although it must be stated that very few minor discrepancies were found in our analysis of tha recordm].
It is our impression that the data collacted and presented in the regular rgports are not fully utilised for energy management purposes. Indead, we do not balieva tha daily diffarences in plant performance are analysed by production staff or managamant, or that changes in plant parameters are made with a view to improving afficiency. As is typical for many plants, tho focus is almomt antiraly gn production and tharafora tha aconomicm of production (including anargy consumption) do not racaiva high anough attantion. This is not to say that expenditures ara not checkad: rathar, the cost affactiveneas of changes in plant oparation or in changam in maintananca procaduram, for example, are not evaluatad and dacisionm ara not always basad on propar analysis of coat-affactivanasm. Trands in anargy afficiancy, aithar towards better
or worse performance, are not monitored and corrective actions, where necessary, are unlikely to be made on the basis of efficiency changes.
Our analysis of the routine data collection and reporting procedures suggests that improvements in both content and format of the reports are desirable, and that the efficiency of report preparation can be improved significantly. These actions would result in inore useful, accurate and timely reports being available to management. In addition, time currently spent by technical staff on tedious hand calculations could be utilised for more productive work, such as the analysis of plant performance and energy efficiency, and the development of practical recommendations to improve profitability. The proposed measures have been discussed with the staff involved and some of the proposed procedures demonstrated (for example, see Appendix A) . There is a high level of interest in the Energy Supply Department in making improvements in energy management procedures.
2.12 Recommendations Conaarning Cnargy I4anagament
Specific recommendations with respect to energy management are therefore as follows:
1 Organise the preparation of all routine reports, from daily to annual, through the use of Lotus spreadsheet software (or equivalent). Examples of the procedure and typical reports are given in Appendix A.
2 Change the report formats to present data for corresponding periods side by side. For example, daily reports for one entire month could be put cnto one page, with the figures for each day filling one vertical column. In this way, the data are more easily compared from one day to the next, changes 'n key parameters can be seen more easily, and management (:an focus more quickly on apparent discrepancies or adverse trends.
3 Review the current parameters reported and add key data and ratios which will assist in improving energy management. The example reports in Appendix A includa a number of parameters and ratios which ara not usually shown in the current reports. For example, gross productio~r should ba raported together with the ratio of net (or saleable) production to gross (or total) production. The level of product wastage and costly reprocessing is readily maasured by this ratio, which is apparently as low a3 0.73 on occasion (that is, about 27 percent of production is rejected as being of unsaleablo quality or is lllostll during changes of board thickness or grade, and is recycled for total reprocessing).
4 Extend the energy consumption reporting procedure to include the calculation of water/condenaate/steam balances and an electricity balance avery month. A start can be made on these balancea using tha available data, but establishing reliable balances may need the installation of some additional meters. In fact, the davalopment of the balancea can contribute to the definition of additional metering neads. I ,
5 As part ' ok the routine monthly energy report, present selected parameters in graphical format. The use of graphs to present data can make the report more interesting, more easily understood, and can show the development of trends more clearly than simple tabular information. Graphs are already kept by the Energy Supply Department but are not included in routine reports.
6 Provide the necessary hardware and software for computerising the energy reporting systems. At present, the Energy Supply Department does not have a computer and therefore it is recommended that a computer, printer and relevant software be purchased within the scope of-this project. Immediately on receipt of these items, a brief period of training and assistance to implement the new procedures 1s suggested.
By improving the energy management system and ensuring that the rslevant'data are available, it should be possible to improve the basis for costing products by grade and quality, as well as reducing the consumption of energy throughout the plant.
It is a fundamental principle of energy management that you cannot manage what you cannot measure. A number of major energy consumptions are metered already by the plant. It is thus possible to monitor the electricity and steam consumed by each board machine line. Electricity consumption by several departments j.3 known (water treatment, boilerhouse). Estimates are however necessary for providing figures for lighting and use by storage and maintenance workshops. Electricity consumed for air compression and for raw material preparation are not known independently.
With respect to natural gas consumption, this is only known as a total boilerhouse consumption and the use by each boiler is not known. Steam production by each boiler is motored and it would therefore be useful to have fuel gas matars on each boilor, enabling a rapid check of boiler efficiency to ba made by comparing steam produced against gas consumed. Figures obtained from the plant records indicate significant variations in boiler efficiency in the range 70.8 to 90.8 percent (corresponding to the rango 9.8 to 12.8 tonnos of stoam per 100 M3 of natural gas). Boiler efficiency should be monitored closely and the reasons for these apparont wid. variations should be found.
With respect to steam consumption, it is important to know the quant!.ties used for space heating and haating domestic water. It is doubtful if the steam used for thase purpomem is known with confidence.

The following recommendations are therefore made:
1 Purchase for the plant a portable instrument for conducting power consu~nption surveys and conduct a comprehensive sarvey of electricity loads and consumptions.
2 Install electricity meters for the main operating departments such as the raw material preparation section and the compressed air section. Specific metering locations should be determined using the results of the survey mentioned above.
Install natural gas meters for each boiler.
4 Install steam meters on the distribution lines to major users to ensure that reasonable steam balances can be drawn up each month. By measuring most of the steam consumptions around the plant, it should be possible to reduca the amount of steam shown each month as @tlosses@t, whose real nature is not currently known.
2.3 OVERALL PLANT ENtROY PERPORMANCR
Data given in Appendix A show the plant performance for 1990 and for . the first two months of 1991. Variations in the figures suggest further investigations of many items are justified. For example:
1 Net to gross production ratio varies from machine to machine and from month to month for any given machine. The average ratio for machine 21, which supplies almost 70 percent of production, is the lowest while energy consumption on that machine is higher than that of the other two conventional lines:
Ratio Net/Gross Elec. use, kwh/t Steam, GJ/t -----------.--- -------------.-- ---.----.-- Machine 21 0.777 805 2.73 Machine 22 0.986 486 2.23 Machine 23 0.873 723 2.29
(Note: Variations in the netlgross ratio are sometimes so large that it is suspected there ara errors in the production figures reported. )
Limitations in the use of aach machine to make specific products may well require machine 21 to operate tho most, and indeed the number of grade changar on machine 21 may be one of the causes of high energy consumption and low aaleable product ratio. However, tho difference8 in performance of tire machines should be checked and the production plans for the plant should be reviewed to ensure that the most efficient and lowest cost machines are being utilised fully.

2 Monitoring electricity consumption closely may allow the reasons for the large variations to be found. For example, the specific electricity consumption was recorded as 576 kwh/t in July 1990 and 1126 kwh/t in August. In this case, there was a two week shutdown in August and tke high eleckicity use is attributed to start up operations during which production was at a low level.
3 Boiler efficiency, which is also discussed in detail later, was calculated to be in the range 70.8 to 90.8 percent. This is a rather large variation, with the highest efficiency figures perhaps too high. The reliability o'f the figures shou?.d be checked.
Based on current energy cost data, the average cost of ena::rgy per tonne of product is seen to exceed 7500 forint, which corresponds to about 20 percent of the typical selling price of the products!, This high percentage illustrates the value of a good energy monitoring system, coupled with a routine management review procedure in which the performance figures are studied promptly at the end of each month.
Prompt analysis of results is essential to ensure that any corrective action is taken as soon as possible and adverse conditions are not allowed to continue longer than absolutely necessary. A monthly senior management review of energy consumption performance is strongly recommended.
Resulting from our analysis of overall plant performance, the following recommendations are made:
1 Management should monitor energy and corresponding production data immediately following the end of each month. Prompt action should be taken to correct deficient performance or to investigate discrepancies.
2 The Energy Supply Dapartment should davelop data relating the energy consumption of major energy users in tha plant to the production level or '@activity1@ of the equipment concerned. This should ba dona by drawing graphs of energy use against production or activity, e.g. production of comprassad air. These graphs are typically straight lina graphs, tha slop8 and y-axis intercept revealing the oxtant of anargy consumption that is truly related to production and tha amount of anargy that is "fixed@@ and indapandant of production. Tha natura of tha anargy - production graphs can assist in dafining prioritias for investigating energy inefficiencies. Examplas of graphs for the plant ara given in Appendix B.
3 In addition, develop graphs of spacific anorgy consumption against production (or activity). The88 can ba usad to monitor equipment performance at any production level and to set energy afficiancy improvamant targotr for mactions of the plant and for tho plant a8 a whola (8.8 Appandix 8).

4 AS a general recommendation, give maintenance of facilities more attention. For example, steam traps appear to receive almost no attention at all. In addition, repair of insulation should be done on many steam and condensate lines.
2.4 BOILER PERFORMANCE
2.41 Introduction
The plant boilerhouse has four boilers installed. These are locally made package boilers, constructed around 1972. The combustion air fan is mounted on top of each boiler: there is no air preheat system. Boiler feedwater is preheated in a small heat exchanger through which the hot continuous blowdown passes. The boilers are used to raise saturated steam at about 8 to 9 bars.
The performance of the plant boilers was evaluated using portable instruments for combustion gas analysis, temperature measurement and boiler water dissolved solids content. The plant itself has no equipment for regular checking of combustion efficiency, although the boilers are checked and adjusted at least once per year (see below).
The existing control system on each boiler consists of a conventional mechanical linkage between the fuel gas control and the air flow dampers. When the steam demand rises, the steam pressure drops and a signal is sent to increase the gas flow to the boiler. The air flow is increased in step with the gas Sy means of the mechanical linkage. The exact air to fuel ratio is set by tha dimensions of the linkage and the ratio can be adjusted by altering the shapa of a cam profile. Boiler performance is checked thoroughly once per year by an outside agency, at which time the cam profile is adjusted to keep the correct air to fuel ratio over the full boiler load rang.. The boiler was checked and adjusted in November 1990.
Performance checks were dona on three of the four boilers. Tests on Boiler I1 wera dona by tho audit team and the use of the combustion gas analysar was damonstratad to tha boiler oparators who conducted tests on Boilars 111 and IV. Tha tests on Boilar I1 included switching to manual control and adjusting tha air rat. downwards: in this way, it was possible to achiava a reduction in the 'excess air rate from about 30 parcant to 25 parcant (reprasanting an improvement in combustion efficiency of about 0.5 percent at full load).
Tha rasults of tho tasts ara shown in Appendix C. In aummary, we found tha axc.88 air ratas and tha lava18 of carbon monoxide to be accaptabla on all boilars. Stack gas exit tamparaturas were quite low, resulting in combustion afficiencias around 80 parcant. Some reduction in axcass air could ba mad. if tha plant wara abla to trim the boilers using a combustion gas analysar. Tho axpactad improvement would be about 1 to 2 parcantag. pointr.

2.43 Watar Tests . .
The boiler feed water includes recycled condensate. The plant stated that the condensate return rate is typically 80 percent, although not all condensate is returned to the plant boilers. It was stated that condensate equivalent to all the steam purchased from Buszesz is returned and only the balance is recycled within the planc. On this basis, the boiler feed water should comprise 60 to 70 percent condensate. Samples of conden~zte, feed water and boiler water (blowdown) were checked for total dissolved solids. Results were:
Condensate Boiler make up Boiler water
50 ppm TDS 720 ppm TDS 5500 ppm TDS
Because of the importance of good water quality on boiler and steam system performance, the plant was asked to check their records and to repeat the TDS tests over a period of several days. It appears the boiler water is normally in the range 4000 to 4200 ppm TDS and that the sample taken on our visit had an unusually high TDS.
Howe'ver, even taking the lower figures, we can see that the TDS level of the make up water is quite high, suggesting that there may be some problem in the water treatment system. The high level is a major factor in the high TDS content of the boiler water (and, in turn, in the condensate). The TDS value for the condensate is certainly rather high. In theory, the condensate should be free of dissolved solids (good quality steam being pure water vapor): a level of a few ppm would be acceptable. In any case, a condensate recovery of 80 percent overall is not consistent with the water quality observed.
The TDS level in the boiler blowdown is also considered too high. For a boiler operating at 8-9 bars, we would normally recommend a maximum of 3500 ppm, at which level there is minimum risk of boiler water foaming and carryover of water with a high level of solids into the steam system. The presence of solids in the steam system can lead to deposits on heat exchange surfaces and resulting deterioration of the heat transfer coefficient, as well as corrosion in the steam piping, valves, condensate return, heat exchangers and steam traps.
To reduce the TDS level in the boiler water, it is necessary to increase the blowdown rate. With the high TDS make up water, the blowdown rate to maintain 3500 ppm in the boiler is over 2 tonnes per hour, a rathar high figure representing almost 20 percent of the boiler feed water. This is costly, in part becauae the water consumption will rise and this is an added cost. In addition, the discarding of a large quantity of hot blowdown is an energy loss.
The blowdown outlet temperature of the existing blowdownlmake up water heat exchanger on Boiler I1 was found to be about 40 deg C for the existing boiler conditions, The continuous blowdown at that time was measured and found to be approximately 250 to 300 kg/h (under these condition& the boiler water TDS warn 5500 ppm). The blowdown was then incraared to about double tha flow and the temperature rosa to about 76 deg C. A chack of the boiler watar TDS aftar two hours showed that the TDS level had been reducod to 5000 ppm, at which time the test was discontinued.

To maintain.o lower level of TDS in the boiler, it will be necessary to 1 increase theSblowdown. To reduce energy losses, it is recommended that a larger make up water/blowdown heat exchanger be installed on each boiler. The present exchangers are small (1.2 M2 area) and unable to provide adequate heat recovery. The cost of new exchangers was estimated and compared with the value of the heat saved to ensure that the new exchangers are cost effective. A payback period of 0.7 years was estimated (Appendix D) . Another alternative would be to consider improving the quality of the boiler feed water by installing more comprehensive water treatment facilities. This could be costly but the economics should be verified by the plant. A further option may be the purchase of higher quality water from a nearby plant such as Buszesz (or the retention of condensate normally returned to Buszesz).
To assist the plant in maintaining the correct water quality in their boiler system, it is recommended that a simple conductivity meter be purchased for the boilerhouse operators to use regularly on each shift to adjust blowdown rates.
2.44 Boilar 8a.t Losaea
The heat losses from the outer surfaces of Boilers I1 and I11 were calculated from surface temperature measurements. A brief temperature survey was carried out using a contact probe and an infrared pyrometer. The heat losses are estimated to average about 0.3 percent of boiler input at full load which is fully acceptable.
Heat recovery from stack gases may be considered although the stack temperatures are rather low at 180 to 210 deg C. An economiser designed to reduce the stack temperature to say 135 deg C would give savings of 1 million Ft/year for an investment of 1.5 million Ft at each boiler. The payback would thus be about 1.5 years (see Appendix D).
The overall boiler efficiency was calculated to be 80 percent based on the lower heating value of fuel gas. This figure includes the estimated blowdown losses and losses from radiation and convection, both of which are small. Based on this efficiency, the marginal cost of steam was calculated to be 950 Ft/tonne. This compares with 1400 Ft/t for steam purchased from Buszesz and a total cost of 11')O Ft/t for plant steam, as quoted by the plant.
2.46 luuury of Raco~and.tion8 for tho boilarhouma
In summary, the following recommendations are mada:
1 Purchase a combustion gas analyser for tha boilarhouse operators to use for routina checking of performance and tune ups. Through regular use of gas analysas, the plant should be able to improve boilmr efficiency by 1 to 2 percentaga points.

2 1nstitute:a higher blowdown rate to reduce the present high level of TDS in the boiler water. This in itself will increase the energy loss in the blowdown unless additional heat recovery is achieved through installing additional heat exchange surface. The cost effectiveness of this must be checked (initial estimate of payback 0.7 years: see Appendix D).
3 As an alternative to operating with an increased blowdown rate (and with additional heat exchange surface), evaluate the economics of installing a new water treatment process. This would reduce the blowdown rate needed to maintain boiler water TDS levels around 3000-3500 ppm.
4 As another option, explore the availability of high quality water from Buszesz (including retention and reuse of condensate currently returned to Buszesz). The quantity of water required should of course be estimated in two ways, firstly under current conditions of high plant boiler loads and minimum purchases from Buszesz, and secondly with low self generation of steam and high levels of steam purchases from Buszesz.
5 Purchase a conductivity meter for the plant boilerhouse to enable water qualities to be monitored regularly.
6 Evaluate the costs and benefits of installing an economiser to recover heat from stack gases in boiler feed water (initial estimate, payback 1.6 years: see Appendix D).
7 Finally, as there was no time to check tte boiler feed water pump capacities and head, check the present situation. Many plants still have the original pumps fitted and these may not be properly sized for the current throughput and be fitted with motors that are too large. The plant should check the situation and evaluate the economics of pump/motor replacement where necessary.
In the old plant, the boilerhouss used to be in a central position. The present boilerhousa is at one side of tha plant and steam lines tend to be quite long. In fact, the plant has been considering constructing a new boilerhousa in the old central position (although the economic justification for this is somewhat unclear) . Whi la many of the steam linas are long, they seam well insulated, with much of the insulation looking now. Howevar, thera appear to be few drain points and steam traps to remove condansate from the 3inas. Water could tharafore build up in tha lines and watar hammar could result. In addition, excess water in tha system can hava an adversa effact on the heat transfer rat. in heating equipmant, resulting in slowar drying.
One staam trap was found on tho main steam lina to the board machine area. This was checkad and found to ba passing steam continuously. This trap should ba repaired or replaced as roon as possible. The steam trap on the rtaam lina from Burzesz was also amen to ba passing a large amount of staam: this too neads attantion. \(I

. . . ~t was notedsthat there was often a lack of insulation on the lines to traps and to the main condensate recovery lines. The flash steam recovery system on machine 21 for sugplying steam to the first three cylinders lacked insulation.
There is a condensate system in operation which is stated to recover around 80 percent of the available condensate. However, there is a steady plume of steam released to atmosphere from the main condensate collecting tank, in spite of cold treated water being passed into the tank. The plume is believed to amount to at least 1.5 tonnes/hour.
The problem is believed to be an excessive flow of steam into the condensate system from leaking steam traps on the outlet of steam heated cylinders (the board machines). Traps were checked on machine 21 with a sonic steam trap tester and 17 out of 20 traps were found passing steam continuously. Thus for the 105 traps on the machines, the steam passing through could easily exceed 1 t/h, much of which is immediately vented to atmosphere. In addition to the direct steam loss, the machine drying performance is adversely affected.
- The reason for the steam traps being defective is primarily the fact that an incorrect trap type is fitted. Thermodynamic traps are not suitable for use where there is a back pressure and should be replaced by inverted bucket traps (e.g. Armstrong Series 1810) which should work well provided they are installed correctly in a vertical position.
2.52 Recommendations Concerning e t e u Diatsibution and Coudensate
Recommendations relating to the steam distribution and condenste return systems are:
1 Repair or replace all traps on these systems, installing the appropriate type of trap in each case.
2 Check the drainage of all major steam lines and install traps if necessary.
3 Purchase a sonic steam trap tester and develop a routine steam trap monitoring and maintenance procedure.
4 Check all condensate return lines and ensure that adequate insulation is installed. Check the insulation on condensate collecting tanks.
The records show that only about 20 percent of the plant steam requirements were met in 1990 through purchases from Buszesz. In the '' first two months of 1991, the contribution of purchased steam has dropped to 11 percent. The relatively low level of purchases is primarily a function of the high price ,charged by ~uszesz' compared with tha cost of e l f generated steam but is also due to the unreliable nature of the BUSZ@SZ aupply, The high price of purchased steam is , - I

perhaps surprising because the steam supplied by Buszesz is produced in a cogenerat.ion system, which is normally the most efficient way to produce both electricity and steam. There appears to be an opportunity to negotiate a more favorable contract price with Buszesz which could be attractive to both parties.
If such a contract could be agreed, the operating "model1 could be revised. At present, the plant meets base load steam demand with its own steam and purchases steam from Buszesz to meet peak demands. This is of course the reverse of the situation that would help Buszesz to operate at the highest efficiency.
2.62 ~ecommendations Regarding Steam Purchases
1 Discuss a new contract with Buszesz and compare the cost of steam offered with that for self generation. It is suggested that a new contract include penalties for non delivery of steam by Buszesz.
2 Review the problems of reliability with 3uszesz and assist in any study of measures to improve reliability. EGI could assist in this study.
2.7 BOARD HACBINE8
The problem of excessive flow of steam into the condensate system from defective steam traps on the board machines has already been mentioned. On machine 21, use of a sonic steam trap tester. showed 17 out of 20 traps tested were passing steam continuously. It is suspected that most of the steam traps on the machines are in similar condition. In other words, it is probable that 85 percent of steam traps are defective. For the 105 traps on the machines, the steam passing through could easily exceed 1 t/h, much of which is immediately vented to atmosphere. In addition to the direct steam loss, the heat transfer rate in the drying cylinders is adversely affected and drying is hampered. To achieve the required product moisture content, it is thus necessary to use excessive steam.
The reason for the poor state of the steam traps was indicated above. Because there is a back pressure on the traps, the thermodynamic traps fitted ara considered not suitable. Any steam passing,through one trap will affect tha parformance of tha othars and causa them to pass steam also. The steady passing of small amounts of steam can soon cause damage to the disks in the traps and larga staam leakages are the result. Thermodynamic traps wera originally installad about 5 years ago; some of the existing traps ara baliaved to ba around 18 months old. The thermodynamic traps should ba raplaced by inverted bucket traps. Thera are suitable traps made by Armstrong (Series 1810) which could be installed between the existing flanges and should work well providad they are installed correctly in a vertical position.
During our visit to tha plant, tha flash steam recovery system for supplying low grad. staam' to the firrt thraa cylindars on the board machina was navar saon in operation. Tha system should ba used as much as possibla to raduca staam us8 in tha rest of tha machine.
. \'I '

There is a'"1arge heat recovery system installed on machine 21 (and similar ones on the other machines). A hood is fitted to collect hot wet air from the drying cylinders and this is passed through two heat exchangers (each 600 M2) to preheat dry incoming air. There is also another steam heated exchanger to further preheat the incoming air if necessary. The dry air is then distributed under the drying cylinders and a small portion is blown under the roof space to prevent condensation in that area.
It appears that the efficiency of the heat recovery system is not checked against design conditions. Thermometers are understood to be ineffective because they do not screw into the wells provided. It is recommended that the system be evaluated and the level of heat recovery determined and compared with design. The distribution of hot dry air should also be checked to ensure that e,xcessive air is not being wasted in the roof space.
The drying cylinders on all machines have bare end caps with no insulation. This is conventional practice in many mills. However, tests with insulated cylinder ends shows that savings of 3 to 5 percent of steam dnmand are readily ~btained. This should be considered by the plant. The insulation may be made in sections that clip on to the cylinders and are easily removed for maintenance access. The thickness of insulation will be limited by the size of the gap between the rotating cylinder ends and the fixed structure of the machine.
An attempt was made to check the surface temperature of several rotating cylinders. A non-contact infrared pyrometer was used for this purpose. The problem is determining the emissivity of the surfaces, which are highly polished and thus have a low emissivity. In this case, a small error in the emissivity setting will result in a large error in the temperature reading. However, the relative temperatures are a reasonable indication of any differences in surface temperature. The results of temperature scans on two cylinders on machine 21 showed thefollowing temperature profiles:
(1) Deg C -- 109 135 148 129 122 118
( 2 ) Deg C -- 75 77 79 78 78 77
(Each 3.6 meter width, readings approximately every 0.7 meters)
The extent of edge drying for the higher temperature cylinder may be worth checking. To obtain acceptable final product moisture levels, it is sometimes found that additional steam is needed to dry the edges while the centre of the roll becomes overdried, thus wasting energy. The machines in this mill have automatic moisture content measurement with automatic adjustment of the steam rat. to drying cylinders. There does not appear to be a problem of unovon drying but it may be worth the plant rechecking this. To correct uneven drying, some mills have installed small radio frequency or microwavo edge dryers to complete the drying of edgea without over use of steam.
Utilisation of the "whit. wator" romovod from the stock by the board machines was not chocked. Tho plant should recycla as much of this wator as possible to the raw material preparation section.
* @'

Finally, it was noted that the production plans for the machines often include a relatively high number of grade or quality changes. The machines are frequently required to change board thickness or even change the board material composition once per day on average over a four or five day period. Changing the thickness usually results in the loss of one roll of board (say 5 tonnes) as adjustments are made to achieve the new thickness, while a change of stock composition requires a complete machine shutdown, with corresponding heat losses as well as extra broke being lost on start up.
On the assumption that about 5 tonnes of paper are lost for every change, this suggests a waste of at least 5 percent of the energy. Based on an energy cost of 7500 Ft/tonne of product, the loss is thus around 37500 Ft per day. It is understood that the reason for frequent quality changes is to meet orders without storing product, as the company is short of working capital and storage of products obviously has a cost. The cost, in terms of interest paid at 40 percent per year on the value of 1 tonne of product (assumed to average 38000 Ft/t) is estimated to be 1270 Ft per month Cor each tonne stored. Compared with losses of 7500 Ft per day for reprocessing rejected board, it is possible that storage of products and operation of the board machines for long runs at optimum conditions could be more profitable for the plant. This matter should certainly be examined by plant management.
2.72 Racommandations Ralating to Board Machina Parformanca
The following recommendations are made:
1 Replace all thermodynamic traps on the board machines with inverted bucket traps (Armstrong Series 1810 or equivalent). Ensure the correct installation of these traps in a vertical position. The plant has provided details of the existing traps, capacities, pipe diameters and distances between flanges (see Section 3.3).
2 Check the traps and insulation on the flash steam recovery system and ensure the system is operated as much as possible.
3 Install thermometers in the hood heat recovery systems and check performance against design. Ensure minimum loss of hot dry air into the roof space.
4 Consider insulation of the end caps of cylinders on all machines. Carry out a cost benefit analysis.
5 Check the temperature profiles on cylinders and check the differences between moisture contents of the edge of board and the centre. If tzxcessive differences are found, consider the use of supplementary drying of the edges using microwave or RF drying.
6 Check the recycling of white water to the raw material preparation section.
7 Check tha comparative costs of storing products and frequent quality changes on the board machines.
- 7,' '

The quantity of steam apparently consumed for space heating amounts to almost 10 percent of the annual steam demand for the whole plant. This is a large consumption. The use of steam for space heating is often costly: a circulating hot water system would undoubtedly be much less expensive to operate. Conversion to such a system should be considered seriously by the plant. As part of the evaluation of steam traps which was done, one of the traps fitted on a branch of the space heating system was examined. We believe it is not operating correctly and the improper operation of steam traps on a steam heated system is of course a serious problem which leads immediately to a large and expensive waste of steam.
The energy consumed for any space heating system should be monitored regularly against the climate conditions, that is, against heating degree days. Discepancies in energy use per degree day can be used to identify energy waste.
The condition of insulation on lines to the locations where space heating is operated should be checked and repairs made as necessary.
Recommendations are as follows:
1 Determine the cost effectiveness of converting the present space heating systen? from steam to a circulating hot water system. It is likely thzc a closed loop hot water system will prove economically justified.
2 Ensure that all outside lines associated with the space heating system are properly insulated.
3 Monitor energy use for space heating against actual climatic conditions (heating degree days) to identify discrepalncies in energy consumption.
The maximum electrical demand is about 5.4 MW compared to the contracted maximum of 6.2 MW. The powor factor is compensated and is normally around 0.94 which resultu in the plant reccll.ving a premium each month from tho electric utility company.
Occasionally there are some minor problems in the czrbling systems. During our visit, there was a slight overheating of some wiring. It also appears that tho main transformer buss bars sometimes overheat at connections. This suggests that a regular survey of electrical wiring, tho switch rooms and transformers should ba carried out using thermal

imaging equipment: EGI has such equipment and the plant should therefore discuss the matter with them.
There are a number of large motors installed in the plant, most being for raw material preparation and board machine drives. A list of motors of 100 kW and above is given in Appendix E. The opportunity was taken to check the load on three motors using the portable Esterline electrical survey equipment, and it is recommended that this type of equipment be provided for the plant to carry out its own testing over an extended period.
One of the motors on the air compressors was checked first. Both machines are fitted with 100 kW motors, the same size as originally fitted to the compressors whzn they were two cylinder machines. Although the compressors are now single cylinder, the motors have not been changed. As might be expected, the lOOkW motor was found to be underloaded. Over a period of about two hours, we found the load reasonably steady at SO to 52 kW.
It is therefore recommended that consideration be given to switching to a smaller motor, say 60 kW, to operate consistently with a higher motor load and thus a higher efficiency. A saving of about 4 percent of the present energy consumptionis expected: for a motor replacement cost of 150,000 Ft, this gives a payback of 2.5 to 3 years, which is not particularly attractive but the prices and motor characteristics should be checked to verify this.
It was noted that th,-re appeared to be no waste heat recovery from the hot air compressor exhaust gases. The plant stated that there is a system but the recovered hot water is not used and is discarded to drain.
One of the hydropulper motors, also 100 kW, was then tested. The hydropulpers are used to prepare stock for the board machines by grinding up waste paper in a slurry of water. Depending on the product properties, part of tho raw material can be composed of new pulp which is thoroughly mixed with the waste material. The hydropulper is gradually filled with water and paper/pulp: the fibers are separated by "grindingw with blades in the base of tho equipment, one set driven by the 100 kW motor and another sot stationary. After the hydropulper has been filled with the stock (or slurry), the stock is transferred to a storage tank which is kept agitated by a stirrer (fitted with a 30 kW motor). It is then pumped to one or more of the board machines.
It appears that the hydropulpers are frequently filled up with stock and then kept agitated while the stock tanks are emptied to the machines. We were told that around 50 percent 03 the hydropulper motor running hours were "idlett, that is, the motors were keptrunning to keep the fibers suspended in the water rather than to break down the waste paper or pulp. It was thought that a variable speed motor might be fitted to reduce tha waste of electricity.
We checked the load on one hydropulper motor as the vessel was filled (our test started at the 50 percent level). The load was found to be reasonably steady at 55 to 60 kW. After filling, the stock was maintained agitated and the motor load appeared to remain constant-This suggests the 100 kW motor could be changed for a 70 to 75 kW motor to

save a little electricity. A more comprehensive check of motor loading at all stages of an operating cycle is recommended.
It is also recommended that a study be made of the operating and idle hours on all hydropulpers. It is possible that significant savings could be achieved by more accurate scheduling of the start of each machine, ensuring the minimum idle time and the maximum use of the storage capacity in which the stirrers are powered by smaller (30 kW) motors. In addition, the excessive action on the fibers would be reduced (too much cutting by the hydropulper blades shortens the fibers) . Teplacement of the 100 kW motors by dual speed motors was also zonsidered. In this case, the lower speed would be used for the simple stirring action, i.e. the idle time. The power required could be greatly reduced. Our initial estimates suggested a payback in the region of 1.5 years.
One of the largest motors was also checked. This was a 160 kW motor fitted to a "grindingtg machine and this was found to be operating with a load between 144 and 148 kW. There is little opportunity for savings for this particular motor.
The plant should use an electrical load survey instrument to check loads on all motors, starting with the largest ones. Where motors are significantly oversized, the economics of replacement with smaller motors should be determined and motors replaced where justified.It may be possible to save money by replacing oversized motors with existing smaller motors from the plant spare motor stocks or with existing motors from another machine, moving motors from one location to another and only buyin? a i ~ : . : d new motors in the smallest sizes.
It was noticed that lighting fixtures in many locations need cleaning. The level of lighting was adequate throughout the plant but clean luminaires can contribute to savings because their light output is significantly greater: it should therefore be possible to obtain the same lighting level with lower rated bulbs or tubes. In some locations, properly cleaned luminaires might allow one quarter to one half of the fittings to be switched off.
The recommendations are as follows:
1 Check the economics of replacing the two 100 kW motors on the main air compressors with 60 kW motors which are more closely matched to the actual loads. Initial estimates suggest a payback of 2.5 to 3 years for an investment of 150,000 Ft per motor.
2 Check the hydropulper operations. Recheduling machine start up times would appear to offer useful savings. If this is not possible, consider the economics of fitting dual speed motors of 75 kW each.
3 Purchase an electrical survey instrument for the plant electrical department to do their own checking of the actual service load of all notors sized over 100 KW. Where motors are significantly 4 ' oversized, evaluata the economics of replacement with new motors . L'
sized forathe current duty and change where justified.
4 Discuss with EGI the initiation of regular electrical system surveys using their Thermovision equipment to identify potential problem areas in good time.
5 Improve the standard of lighting maintenance, ensuring regular cleaning of light fittings and replacing luminaires when cleaning is not adequate.
6 Check lighting levels after cleaning the luminaires, switching off lights where and when possible. Consider installing extra switches to allow selected areas to be controlled independently and consider photoelectric controls in some areas of the plant.
3 SUMMARY OF ENERGY SAVING OPPORTUNITIt8
3.1 List of Recommend8tions
Exhibit 3.1 lists those measures that require capital investments together with estimated savings and payb3cks. The total savings listed are equivalent to about 7 percent of the present energy bills. A complete list of the recommendations made in this report is as follows:
erav Manaament and Meter=
(1.1) Organise report preparation using spreadsheet software; improve report formats; add key parameters to be monitored; develop reporting procedure to include water/condensate,steam and electricity balances.
(1.2) Develop data relating energy consumption to production levels and.monitor plant performance closely and regularly.
(1.3) Ensure energy costs of inadequate maintenance are documented
(1.4) Adopt monthly review of energy perforamnce by senior management.
(1.5) Purchase a computer, printer and Lotus software to accomplish item (1.1); provide training and implementation assistance.
(1.6) Install electricity meters for main operating departments
(1.7) Purchase portable electricity survey meter for checking motor loads and sizes.
(1.8) Install three natural gas meters on boilers and steam meters (say 5) on lines to major users.
(2.1) Purchase combustion analyser for closer combustion control.
(2.2) Operate with higher blowdown rat. and monitor TDS levels.

. . (2.3) Evaluate alternatives to high blowdown and heat exchangers,
such as a new water treatment plant or purchase of water from BusZeSZ (or other nearby plants).
(2.4) consider installation of an economiser for heating boiler feed water with stack gases.
(2.5) Check the boiler feed water pumps and motors; replace if economically justified.
(3) Steam and Condensate Systems
(3.1) Repair or replace all traps, using the appropriate type of traps for the specific service required. Outside the board machines, there are about 35 traps on various systems. Based on tests in the plant, it is likely that at least 25 will need replacing.
(3.2) Check the drainage of main steam lines and install traps if necessary.
(3.3) Purchase a sonic steam trap tester and establish a routine trap testing and maintenance program.
(3.4) Maintain or replace insulation on condensate lines.
(4.1) Study and compare the options for steam supply, including purchase from Buszesz or self generation.
(4.2) Study the problem of reliability of steam supply from Buszesz and develop recommendations for improvement.
(5.1) Replace all thermodynamic traps on the board machines with inverted bucket traps.
(5.2) Check traps and insulation on the flash steam recovery system and use this system as much as possible.
(5.3) Install thermometers on the moist air heat recovery system and monitor performance.
(5.4) Obtain cost estimates for insulation of cylinder end caps and implement project if economically justified.
(5.5) Check moisture in board edges and centre, and install supplementary RF or microwave edge drying if necessary.
(5.6) Check the cost of frequent grade changes on the board machines and comparo with tha cost of storing products.

(6.1) ~etermine the cost effectiveness of converting the present steam heated system to a circulating hot water system. If economically justified, modify the current system.
(6.2) Ensure outside lines of the space heating system are properly insulated.
(6.3) Monitor space heating energy against heating degree days.
Electricitv Svstems and Consumers
(7.1) Discuss with EGI the initiation of regular electrical systex surveys using the EGI Thermovision camera.
(7.2) Replace both 100 KW motors on the air compressors with 60 KW motors as the present motors are clearly oversized.
(7.3) Investigate options for the hydropulper system, including rescheduling of operations, additional stock storage with low HP stirrrer, and fitting of a 75 kW dual speed motor.
(7.4) Check lighting levels after luminaire cleaning and switch off where possible; install extra switches to improve ability to control lighting loads in future; set up routine lighting maintenance program.
3.2 Potantial Savings
3.3 P o m ~ i b l ~ Projoats for USAID Support
A number of the recommendations are suitable for funding support by USAID as they provide the plant with the tools for further efforts to improve energy efficiency. In addition, assisting the plant to replace inappropriate steam traps should result in short term energy savings measurable using the present energy consumption reporting system. This should therefore serve as a demonstration project and should encourage other plants in Hungary to adopt a similar measure at relatively modest cost.
The specific recommendations for USAID support are as follows:
(1) W c e steam f;yp~s on the board machines
Estimated cost for 105 traps $ 20,000 Anticipated savings $ 122,000 per year Payback period 2 months.
The above cost is for equipment only: it is assumed the plant will provide tho necassary labor for installation.

The items to be purchased are as follows:
Number Steam of steam pressure traps bars g --.--... -..-.--.
Machine 21 -predrying
3 8 3 1 3 2 8
-final drying 15 4 2 4 -.-..
58
Machine 22 25
Machine 23 19 3 --..
22
Nominal pipe Dimensions mm diameter Between Flange bolt inches mm flanges circle dia. -0.-0.0-00-0. -0-0-0- ..--.-..----
Total 105 traps
All traps to be Armstrong inverted bucket type (Series 1810) or similar.
Estimated cost Anticipated savings say $ 18,000 per year Payback undor 4 months.
The items to bo provided are:
* Desk top computer with 386 processor, IBM compatible, minimum 40 ME hard disk and 1 MB RAM, VGA color monitor, dual 3.5 and 5.25 FDD. Keyboard standard US version.
* Printer should be 24 pin dot matrix with 342 character wide carraiga.
* Computer and printer to ba supplied for us. on 220 v/SO Hz power supply.
* Lotum 123 software, US version can be supplied but manual must be suppliad in Hungarian.
The cost indicated abova does not inclubo the recommended training and implemantation assistanca.
(3) Purchas? sonic steam t r a ~ testec
~stimated cost $ 1300 ~nticipated savings say $ 6600 per year Payback period under 3 months
The equipment should be the UE Systems Ultraprobe 500C or similar.
( 4 j Purchase electrical suxvev eaui~ment
Estimated cost $ 6000 Anticipated savings at least $ 8000 per year Payback period under 9 months
The equipment should be the Esterline Angus with current transformers (or similar) . Purchase combustion analvsex
Estimated cost Anticipated savings $ 12,000 Payback period 3 months
The equipment should be the Enerac 2000 Combustion Analyser or similar, with extra printer paper.
For improved control of boiler water (Myron L meter or similar).
The total cost of the six items is $ 35,600. The items are listed in order of priority in case the budget for all six items is not available. A reduced budget can also be accomodated by modifying the first item to include only the traps on Machine 21 (58 traps) which would reduce the cost by about half.
Consideration should be given to providing spare parts and operating supplies for all equipment sent to Hungary.

E m I B I T 3.1
8-Y 08 SAVINGS OPPORTUNITIEB
No. Item Savings Cost Ft us $ Ft us $ --.-- o----.----.-------o- --.--I--- -----.-- -ow----- -----.
Energy Management 1.1 Reports, balances 1.2 Additional data 1.3 Maintenance costs 1.4 Monthly review 1.5 Computer, software 1.6 Electricity meters 1.7 Elec survey inst'mt 1.8 Gas/steam meters
Boilerhouse 2.1 Combustion analyser 870000 12000 220000 3000 2.2 Blowdown heat rec. 1160000 15900 790000 11100 2.3 Economiser 920000 12600 1500000 20500
Steam & condensate lines 3.1 Replace traps 365000 5000 365000 5000 3.2 Line drainage, traps -- -- -- -- 3.3 Sonic trap tester 235000 3200 95000 1300 3.4 Cond line insulation -- -- -- oo
Steam purchases 4.1 Review contract
Payback months --0----
Board machines I 5.1 Replace traps 7700000 105500 1460000 20090 2.3 5.2 Flash steam rec -- -- -- -. -09
5.3 Hood ht rec system -- -- -- -- -.- 5.4 Insulate cyl. ends 1980000 27000 1980000 27000 12.0 5.6 Minimise grade changes -- ow go -- ---
Space heating 6.1 Convert to hot water 935000 12800 -- ow we.
6.2 Insulate lines -- .- -- -- 0-0
Electrical 7.2 Replacr n / c matars 112800 1550 300000 4100 31.8 7.3 Dual spd h/p motor 163600 2200 241000 3300 18.0 7.4 Improve lighting 20000 550 73000 1000 21.8
-U. I I I - - 0.-00- ---9-.- ------ --go Totals 17851400 245000 9290000 127380 6.2
Total savings equivalent to about 7 porcent of present energy expenses.

Notaa -- basas fo r c8lculations
1.5 Better monitoring and quicker respons to problems. Savings 0.5 % of total energy bill (260 million Ft/yr) cost estimate includes computer, printer and Lotus software.
1.6 Better monitoring. Savings 0.5 % of electricity bill (130 million Ft/yr). Cost estimated for 8 meters.
1.7 Replacement of large motors by smaller motors. Savings say 3 % on 10 x 100 kW motors, 4000 hrslyr.
1.8 Better monitoring, reduction of steam demand. Savings say 1 % of natural gas fired by boilers (8 million Nm3/yr). Cost based on 3 turbine meters at 200,000 Ft and 5 orifice plates at 150,000 Ft.
2.1 Improved combustion control. Savings 1 % of boiler fuel.
2.2 See Appendix D. Equipment includes heat exchanger and TDS meter. Based on 2500 hrs/yr operation. Could be possible to arrange piping to allow one exchanger to serve more than one boiler and thus save on capital expense.
2.4 See Appendix D.
3.1 Assumes 25 traps replaced and payback is one year.
3.2 No data available; detailed survey needed.
3.3 Savings based on detection and replacement of at least 5 traps per month.
3.4 No data available; detailed survey needed.
5.1 Costs and savings based on 105 traps, with leakage currently say 10 kg/hr each for 7000 hr/yr.
5.2, 5.3 No data available; detailed survey needeC.
5.4 Savings say 2 t of current steam use. Payback of 1 year assumed.
5.6 No data available; detailed survey needed. Savings could be significant.
6.1 No data available; detailed survey needed. Savings assumed to be at least 25 8 of present system steam use.
6.2 No data available; detailed survey needed.
7.2 Savings say 4 t of presant 50 kW load for 6000 hr/yr operation. Nev motor cost 150000 Ft each.
7.3 Savings 4 of 60 kW load for 2000 hrs/yr, and 30 kW load saving 1000 hrs/yr. Cost of 75 kW dual speed motor 241000 Ft.installed.
7.4 Savings 10 t of current 85000 kWh per year used for lighting. Cost of improvements assumed to be around $ 1000.
tQJ .
APPENDICES
A Sample Energy Reports
B Energy-Production Graphs
C Boiler Combustion Test Results
D Economiser and Heat Recovery Calculation for Boilers
E Electric Motors of 100 kW and Above

EXAMPLE DAILY REPORT
------.--.-----.------------------------.--.--.--.--------.-----.---.---- !Average Day Month
Item ! or to !Standrd 1 2 3 Date --------------------------------------.--------------.--.--------.--------
Production net tonne~ !* 605 gross tonnes !* 7 13
ratio net/gross ! 0.849 ----.--------------------------------.---------------------------------- Steam I
own generated - tonnes!* own generated - t/hour! nat gas to boilers M3!* nat gas to boilers t ! nat gas to boilers t/h! purchased steam t ! purchased steam t/hour! total steam tonnes I
total steam t/hour I I
spec steam con t/t net ! I
II-----~--.-o---.-----.-..o-.-----------o--------------------"---.--w----
Boiler efficiency I
M3 gas/tonne steam I
tonnes steam/1000 W3 ! I
----------- ~ - -~ ~ - - - -
Electricity I
total us@ kwh ! + total usa kwh/hour !
t
for water traatmt kwh !+ for water traat. kwh/hl
1 spec alac con kwh/kg nl
t
~~oo..~~oo~~~.~o~.oo~~o...~~.o~.-o.~-.-...o--o--.--.--..-o-.------w-"-~--
Water Uaaga t
1 Raw watar n 3 !* 2 ~ u m b ~ l d n 3 !* 3 Filtered water I43 !+ 4 ~ v n urn@ n 3 !+
o m umm S !+ 5 Wall watar 143 !+ 6 Warm watar n 3 !+
1 total 1+2+5+6 n 3 l
I
spec watar con. 1 filtarad/kq nat !
! . . o ~ ~ ~ ~ o ~ ~ o ~ . ~ U I I I o ~ ~ . . ~ o ~ ~ ~ . ~ ~ o ~ ~ o ~ . ~ ~ . ~ ~ o ~ . ~ . . . ~ . . ~ . ~ o ~ ~ ~ ~ ~ ~ o ~ ~ ~ ~ ~ ~ ~ ~ ~ ~ -
+ report can includa on0 complatm month + total %onth to dataw column can & axtandod eamily to include avmraqam am well am totala
+ thin raport can k umod am input to tha corramponding monthly ,
report - 379

mii
ii
P?
??
?
mJ
IJ
WJ
o
w\
Pm
m
NW
dJ
W
W
N
OC
OI
WJ
W
WO
JL
h
)W
\PN
OI
N
r
i b
WW
NJ
I
OW
WN
O
I
I"?
??
? ',
WO
rm
r
I
C
6O
JI
-4
w
OI
m4
CI
W
NW
NW
L
. .
N
* N
W
WJ
? ?f??P??
Cn
ON
10
00
wr
o
I r
I J
CW
UN
1
Co
rn
or
I
I"??
??
I (
0r
nI
WN
1
N
I C
, I
Ir
)C
NN
O,
I
um
uw
h)
1
Y?
?
1 m
mu
wm
I
W
Ic)
LC
IW
NW
r
IL
1I
.J
m
m-
me
P?
??
?
JJ
WW
J
WW
1Q
I
IJ
WO
J
U
h'
N
ru
e
N
W
WW
W
h)
WN
J-
Jd
C)
)
L
WW
J )
hW
0-
6
we
m~
u
wr
4m
r
NJ
IW
J

- - - - - - -~=====~=~====~====~===================L=1-Y=r=. I5LD==~=====,=~~--- - - - - - - - - - - - - - - - - - - - - - - - - - - - ....................... ---cL-====z=
Parameters ! I ! 1990 1990 1991 1C1 Jan Feb nar Apr Way June Ju ly Auq sep Oct Nov Dec W A L S Jan Peb
. . . . . . . . . . . . . . . . . . . . . . . . . . . . . . . . . . . . . . . . . . . . . . . . . . . . . . . . . . . . . . . . . . . . . . . . . . . . . . . . . . . . . . . . . . . . . . . . . . . . . . . . ----------------------------I===iii-==L=A-
Natural Gas, 1000 B3 ! ! b o i l e r s ] r ] 978.9 949.7 866.8 784.4 576.0 362.1 485.8 398.9 490-4 628.0 1152.5 264.2 7937.7 8 6 5 . 6 9 7 8 . 0 process 1.1 5 . 8 6 . 6 6 . 1 5 .7 8 . 5 4 - 0 7 . 5 7 . 3 11 .0 8 . 2 14.3 1 6 86 .8 9 . 1 8 . 5 t o t a l 1000 H3 ] 1 984.8 956.3 8 7 3 . 0 ' 7 9 0 . 2 584.4 366.2 493 .2 406.1 501.5 636.2 1166.8 265.8 8024.5 874 .7 . 9 8 6 . 5
I ! G a s h e a t g . valueGJ/H31*! 34.3 34.3 34.0 33.9 4 1 3 4 - 0 3 3 - 8 3 - 7 33.8 34.0 33.9 34.0 4 0 34.0"-.34.0
I ! Natural Gas. GJ I !
boilers 1 1 33578 32573 29472 26592 19641 12312 16418 4 16577 21352 39071 8982 269750 29430 33251 process I ! 200 227 209 194 288 138 253 245 373 279 484 56 2949 310 289 total W ! ! 33778 32800 29681 26786 19929 12449 16671 13687 16950 21632 39555 9038 272699 29740 33540
I ! ...................................................................................................................................... I 1
Steam, tonne6 I purchased 1.1 2220 1209 631 1074 1733 3472 3647 1670 3202 2732 1646 1438 24674 1708 940 w n 1.1 12491 10655 9948 8428 6653 3902 5696 3906 5940 7644 12890 2813 90966 10239 10847 total 1 1 14711 11864 10579 9502 8386 7374 9343 5576 9142 10376 14536 4251 115640 11947 11787
1 1 Heatg v a l u e W / t steaml*! 2.469 2.432 2.433 2.454 2 .475 2 -420 2.494 2.597 2.455 2.488 2.457 2.466 2 .472 2 .455 2 .440
1 1 . ~
steam, GJ I 1 purchased I ! 5879 3201 1671 2844 4589 9194 9657 4422 8479 7234 4359 3808 65337 4523 2489 wn 1 30453 25977 24253 20547 16220 9513 13887 9523 14482 18636 31426 6858 221775 24963 26445 total GJ I 1 36332 29178 25924 23391 20809 18707 23544 f3945 22961 25870 35784 10666 287112 29485 29934
I I looses GJ
- - I* ! 3108 6674 5299 6064 3511 2867 2463 3965 2227 2777 7853 2167 48975 4448 6783 I ! I !
steam to u c h . . tom.! 1 ~ c h i r n 31 1.1 686) 6711 6089 5458 5204 4360 4731 3071 5808 5594 8121 149 62159 5658 6064 -chin. 22 I * ] 1346 1118 861 1118 917 1291 1157 759 834 1308 1597 0 12306 1097 395 n c h i n r 23 1.1 1382 1061 1277 1044 1007 4 2 689 449 756 902 878 152 10039 477 657 nachim 26 1.1 861 978 898 748 534 760 582 324 899 583 1148 254 8577 720 822 to-1 t011ne8 1 1 10452 9068 9 2 8368 7662 6061 7159 4603 8297 8387 11744 555 93081 7952 7938
! I S t o a r to mach., GJ I I
machine 2 1 1 1 16945 16321 14815 13394 12880 10551 11799 7975 14259 13918 19951 369 153631 13890 14793 u c h i n o 22 I ! 3323 2719 2095 2744 2270 3124 2886 1971 2047 3254 3923 0 30416 2693 964
uchinm 23 3412 2580 3107 2562 2492 1070 1718 1166 1856 2244 2157 377 24812 1171 1603 ~ c h i - 26 1 2126 2378 2185 1836 1322 1859 1452 841 2207 I451 2820 632 21200 1768 2005 total GJ 1 25806 23999 22201 20535 18963 16604 17855 11954 20369 20867 28851 1379 230058 19527 19365
I I sp Steam con. tit net i I
machine 2 1 1 1 3.34 3 .31 3.13 2.28 2.70 2 . 2 6 1 .93 2 .80 2 .45 2.77 3 .26 3.23 2 .73 2 . 3 6 3 - 1 8
machine 22 1 1 1.83 1.84 2 .33 2 .36 2 .45 2 . 1 1 .72 2 .58 3 .40 2.48 2.58 0.00 2 .23 2 . 1 0 2 - 6 5
machine 23 ! ! 2.92 2 .36 2.22 2 .36 2 . 7 0 1 .52 2 .15 2 .30 2 2.14 2 .10 2.17 2 .29 2 .05 1 -40 machine 26 1 1 5 - 9 0 6 -00 6 .15 5 .80 5 . 8 0 5 .33 4 .73 6 . 0 0 6 .20 5 .50 6 . 6 0 6 .52 5 .87 5 . 6 3 6 - 0 0
t o t a l s t . a m t / t n e t l ! 9 .07 3.04 3 .00 2 .43 2 .77 2 .31 2 .01 2 .80 2.66 2 .73 3.17 3.56 2 .73 2 . 4 3 2 - 9 8
Sp Steam Con. W / t net! I machine 21 I ! 8.26
\ -chine 22 I 1 4 .53 machine 23 I I 7 . 20 machine 26 I 1 14.56 . . ..
5.47 5 .11 3 .68
12 .91 'I 'in

Total Steam, GJ 1 I ucbin8 ! 1 25806 23999 22201 20535 18963 16604 17855 11954 spa- heat ing !*! 9060 3583 2245 1521 0 0 0 0 domestic u s e s !*! 500 500 500 500 500 500 500 500 s a l e s !*! 459 409 438 427 753 194 4276 1697 loss i n B l i n e ! * I 301 193 176 197 343 498 503 259 bo i l e r oun use !*! 457 388 363 308 242 142 209 142 t o t a l steam ! 1 36583 29072 25923 23488 20801 17938 23343 14552 t o t a l less s a l e s ! ! 36124 28663 25485 23061 ZOO48 17744 19067 12855
! ! equivalent r a t e t /h! ! 48.6 42.7 34.3 32 .0 26 .9 24.6 25.6 17.3
! ! total less space htg! 1 27064 25090 23240 21540 20048 17744 19067 12855 e q u i v a l m t r a t a t / h ! 1 36.4 37.3 31.2 29.9 26 .9 24.6 25.6 17.3
! I Sp Heat Con t o t a l W / t ! ! 10.61 8.82 8.39 6 .71 7 .25 5 -96 5 .34 7.83 Sp *at Con u/o s p htg! ! 7.95 7.72 7.65 6 .27 7.25 5.96 5.34 7 .83
W i t cet! ! B o i l e r e f f i c i e n c y % 1 1 90.7 79.7 02.3 77 .3 82 .6 77 .3 84.6 70.8
t s t u r / 1 0 0 0 H 3 g a s ! ! 12.8 11.2 11.5 10.7 11 .6 10.8 11.7 9 -e m3/t stem 1 I 71.4 8 9 87.1 93 .1 86.6 92.8 85.3
! ! - -. Purch warr water H3 !*! 35000 35000 35000 35000 35000 35000 35000 35000
! ! ! !
I I I I I Y P I D ~ I P * I I D I I I ~ ~ P ~ I ~ U I I U I I I I I ~ I - - I . I P P I I I ~ - - - - = - - - - - = - =
S-Y OF KEY DATA ! I I !
Production net t ! I 3406 3249 3039 3438 2765 1976 3569 1641 maduction g r o s s t ! ! 4249 3922 3032 3896 3647 3213 4208 2254 Ratio lIet/gKOSs I 1 0.802 0.828 0-793 0-802 0-758 0.926 0.848 0.728
! 1
APP . A 19522 19365 8336 6032
500 500 1561 3493 205 185 375 397
30499 29972 28938 26479
E l e c t r i c i t y Wh ! !2534.3 2581.0 2845.2 2622-6 2671.8 2445-5 2054.0 1847.2 2426.6 2404.1 3222.2 656.99 28311.8 1997.3 2763.1 Nat C.S 1000 H3 1 1914.78 956-28 872-97 790-16 584-44 366.16 493.23 406.14 5Ot.47 636.23 1166.8 165.83 8024.50 874.7 9a6.47 Rrtch. stom t I ! 2220 1209 631 1074 1733 3472 3647 6 7 3202 2732 1646 3 8 24674 1708 940 mrch ~ a r r u8tor H3 1 1 35000 35000 35000 35000 35000 35000 35000 35000 35000 35000 35000 35000 420000 3000 3000
1 ! h c h - o l e con kuh/tn! Tota l el- kvh/t not !
! mch. o t e u u s e t/t n! Total st- t ! Total BteAB t / h ! Steam w / o s p htq t ! st- u/o s p htq t / h ! Sp .tau con W f t net! ssc u/o s p btg ~ / t nt
! Boilor e f f i c i e n c y \ ! ! 90.7 79.7 82.3 77 .3 82 .6 77.3 84 .6 70.8 4 87.3 80.4 76.4 82.2 84.0 79 .5
! ! Elec -/kwh avg !*! 4.7 4 .7 4.7 4 .7 4 . 7 4 .7 4 . 7 4 .7 4 .7 4.7 4.7 4.7 4 .7 4.7 4 . 7 Gas PtfH3 avg 1 11.01 1 0 0 1 0 1 - 0 1 11-01 1 1 . 1 11-01 11.01 11.01 11.01 11-01 11-01 11-01 11.01 S t a m Pt / t !*! 1400 140G 1400 1400 1400 1400 1400 1400 1400 1400 1400 1400 1400 1400 1400 warm water FtlH3 !.! 3.5 3 .5 3.5 3 .5 3 . 5 3 .5 3 .5 3.5 3.5 3.5 3.5 3.5 3 . 5 3.5 3 .5
Elcc cost 1000Ft Gas cost s t e a r cost Warm water cost Total energy cost
(1000 Pt) EwKgy
(?tirut t w p e r )
Paper colt F t / t margy cost 8 8 pmrcant ot papor cost

Electricity - Production Graph
Steam - Production Graph

. . Spec. Electricity Consmptn - Production
0.4
2.4 2.6 2.8 3 3.2 3.4 3.6 3.8 4 ( r h o u d , )
Bmrd Production - bmu/wnnth
Spec. Steam Consumpticn - Production

-
ENERAC MODZL 2 8 8 B COMBUSTION RZCORD
S 3 I A L = :!O01934 ENERAC MODEL 2888
r-3x3535 7 3 7 4313:,23
-.- - .. = . "1;:. 73?%A'iiJ?E : 210 0~
!):<YGE;i : J4.5 % ,X=330h MONOX I DE : 0 PPM ~ 9 4 8 0 ~ DIOXIDE: c39.2 X Ci'"i3 U s 3 ! 3L2 CASES : 0.08 % STACK DRAm (INCHES H20): 4 00.8 EXCESS AiR: 25 V. CWBON INONOXIDE ALARM: 50 PPM
3 9 . I A L S 1!Q01934 . ENERFIC MODEL 2888 COMBUSTION Tom RECORD
FOR: W H B I - . IME: l0:98:54 3ATE: 04/05/91
FUEL NATURAL CA8:21870 BTU/LB
COMBUSTION EFFICIENCY: 80.5 X CLvlBIENT mPERATURE: 37 .C STACK TEMPERATURE : 209 'C
OXYGEN : 94.4 Y ChRWN MONOXIDE: 0 PPW CARBON DIOXIDE: 09.3 % COMEmIBLE WES: 8.88 X STAm D m (INCHES H a ) : + 88.8 MCESS AIR: 25 % CARBON MONOXIDE am: 58 PPM
.-.- .2;?!AL 3 : i3@193a - ENERAC MODEL 2888
COMBUST: CN T%y ?ZtC23
mC6REGN MOhOXIDE: .I > >\a
lZGRSON 3 iGX ! C E : .15.3 .. t,CnPa ~57' I 3LE C;SES : . :. STACK 3 W (INCHES i .20) : c jr3.3 EXCESS AIR: 22 *; CARBON MONOXIDE RLARM : 5.3 ??M
SER!AL U L!091934 < ENERAC MODEL 2888
COMBUSiiGN im F!!l2OE3
FOR: R W H B I .. TI TIME: 1 0 : 15:25
COMBUSTION EFFICIENCY: 5 2 . 3 :.. WBIENT TEVPWTURE: '? d 3 o
STXK TSMPERATURS: . ' 2 OXYGEN : 63.; . , CARSON MONOXIDE: 4 ?p CARBON DIOXIDE: 9 . !i COMBUST r BE GASES : ~ . a c :; STXK DRAFT (INCHES H20): + 0Q.a EXCESS AIR : 16 %
-I SERIAL a 11081930
FOR: RCWHBI 'h - - -
TIME: 10:t6:47 DATE: 0b05/91
FUEL WTURAL W: 21 878 BTU/LB
COMBUSTION EFFICIENCY: 82.7 %
AMBIENT mERATURE: STACK iDfPERATURE: O)(YCEN : CARBON MONOXIDE: C-H DIOXIDE: C0MBUmIBI.E GAB=: STWK D M (INCHES H20): MCESS AIR: CARBON MONOXIDE M:
OC "C
% PPM
% %
% PPM
MODE : PPM OW--TRUEX ,37 .

< SERIAL o : 1901934 ,' 1
ENERAC M O ~ L 2888 CONaUSTION TEST RECORD
FUEL NATlJRAL GAS : 21 870 BTU/U
COMBUSTION EFFICIENCY: 80.1 % WBIENT mPE?FITURE: 39 "C
STACK iZPlPEEATURZ : 230 'C OXYGEN : 95.6 % CARBON RONOX I 3E : 0 PPM CARBON DIOXIDE: 88.6 % CCMSUST I 9LE GASES : 0.85 % STACK DRAFT ( IIUCHB H20): + 88.8 EXCESS AIR: 33 X CGRBON #ONOXIDE FIUWM: 50 PPM
Y S . - & L ~ L . L L IWW. aev
ENERAC MODEL 2888 COMBUSTION TEST RECORD
FOR: RCC/HBK
T!RE: 10:38:58 DATE: 84/05/91
F U R NATURAL CCIS:21878 BTUJLB
CUMBUSTION EFFICIENCY: 79.1 X C\MB I ENT ZPIP-TURE : 40 * C STACK TEMPERATURE : 285 'C
OXYGEN : 05.4 W CARBON MONOXIDE: 3 PPM ,
CARBON DIOXIDE: 00.0 X COMBVST I BLE WE9 : 0.12 X STRCK D m (INCHES HZO): + 80.0
! MCESSAIR: 32 X / CIIRBON M O N O X I D E M : 50 PPP)
SSIAL 3 11QBL934 ENERAC MODEL 2888
COMBUSTION 7-ZZ' Z C G R D
FOR: m H B I
TiME: 18:34:57 DATE : 04/85/91
F NATURAL GS:21870 BTU/L3
COMBUSTION EFFIC:ENO(: 79.8 ;: AYBIENT TEVPERATCRE: a oc
STACK TEMPERATURE: 287 OC OXYGEN : a 5 . 3 r:
CARBON MONOXIDZ: 3 ??Y CARSGN DIOXIDE: 2 3 . .j .; COHBUSIISLE GASES: a .1 ; :. STACK DRAFT (INCHES H a ) : + G0.a EXCESS A I R : 30 t; CI?RBON MONOXIDE fiW: 5Q ?Pi'!
-
SmIfiL 8 11881934 ENERAC MODEL 21;381;3
COMBUSTION. TZwT ZSCORD
- r JE i NATURAL GAS : 2 1 978 BTU/U
AM9 I ENT TMP-TURE : 37 0~
b7ACK TEMPERATURE : 2;2 01:
OXYGEN : G2.3 !: CARJON MONOXIDE : 6 ?PM CFIRBON DIOXIDE: lr3.5 Y COMBUSTIBLE GASES: o.ao :. ST'FICK DRAFI' (INCHES H20): - 81 .? %CSSS AIR: . I t . *. ,* - -- ..-..
h
d 7 5 - i 7" SERIAL 8 11001934 ENERAC MODEL 2888
COMBUSTI ON T'j? RECORD
FOR: RCG/HBI
TIME: 07:44:26 DATE: 04/08r91
COMBUSTION EFFICIENCY: 81.4 % AMBIEm TDVmTURE: 37 .C
STACK TPIPmTURE: OXYGEN : CARBON MONOXIDE: CARBON DIOXIDE: COMBWT1BI.E CASES: Sf- D M (INCHES H20): - MCE98 AIR: m N MONOXIDE CUARn:
197 'C 82.7 X
6 PPM 10.3 X 0.85 % 01.7 13 Y 50 PPM

FOR: R W H B I -
'11 r
CC\MBUST:ON EF:C!SNCY: 81.2 % AWB I EhT TPPERATL[RE : 39 "C STACK EMEBTU2E : 187 "C
(YflGEN : CARSON MOWXIDE: lCdR90N 3 I OX I DE : COF3US?:32 GASES: STACK 3RAFT ( I XHES H20 EXCESS A I R : CARBON IWNOXIDE ALARM:
Y PPM
% .. /. Y
PPM - . i . ~oQ?/,
SRIAL 3 11981934 -
ENERAC M O D E L 2888 COMaUST ION TEST =CORD
FOR : RCC/HBI
TIME: 38:45:29 DATE : W/B0/91
CGMSUSION EFFICIENCY: 79.6 X AM0 I ENT ETYPEWTURE : 39 *C STACK ENPERATURE : 213 *C OXYGEN : 02.3 :: CARBON MONOXIDE: 11 PPM CARBON DIOXIDE: 10.5 x COMBUST ! BLE CASES : 0.15 X STACK DRAFT (INCHES H20): - Q1.7 EXCESS A I R : 11 %
S3IFIL 110Q1934 5 - "sz ENERAC MODEL 2888
COMBUSTION TEST RECORD
FOR: RCQHBI
TIME: Od:48:05 3ATE: 84/88/91
FUEL NATURAL GAS : 21 070 BTU/LB
CGMBUSfION EFFICIENCY: AMB I Ern 'IP1PrnTURE : STACK TEMPERNURE: OXYGEN : CARBON RONOXIDE: CARBON DIOXIDE: COnBusTIBLE CA8ES: Sf- DRAFT (INCHEB H20) : MCESS A I R : CARBON MONOXIDE AIARn:
MODE : PPR O X Y 4 E F - T R m
SEXfAL 0 11081934 - ENERAC MODEL 2 8 8 ~
COMBUSTION TEST RECORD
FUEL NATURAL G;\S : 21 878 BT?I/U
COMSUSTION EFIC!ENCY: 5 a . 7 7. AM0 I ENT lZRPmTURE : 39 "12 STACK TZMPERATURE: 195 * C
GXYGEN : J4.1 % CAiWON MONOXI3E: j >>H
M R ~ N D I O X I D E : a9.5 oi COMBUST I BLE GSES : 6.86 :; STACK DRAFT (INCHES H20) : + 98.a mCESS A I R : 23 :: W O N MONOXIDE ALARM : 58 PPM
. SERIAL 8 11001934 ENERAC--MODEL 2888
C0MBUST:ON TESi RECORD
FOR: W H B I
TIME: 09:13:16 DATE : 64/08/9 1
Film NATURAL a: 21 870 BTU/LB
COMBUSfION EFFICIENCY: 82.3 :; WBIENT 'TEMPERATURE: 39 *C STACK TEMPERATURE : 1?2 O C
OXYGEN : B 3 . B t; CfiRBON MONOXIDE: 6 ??Y CARBON DIOXIDE: 0 . :s
COMBUST I BLE GASES : 0.07 5; SACK DRRET (INCHES ~ 2 0 ) : + a6.0 EXCESS AIR: 16 :; CARBON MONOXIDE ALARM: -. - 5B P?M
S Z I f i L 0 11861934 ENERPIC MODEL 2888
COMB~ION TESi RECOR3
FOR: RCWhBI
CmUSIION EFFICIENCY: m I E M TB@ERATURE: S f g K TPBmTURE: OXYGEN: C m W N mRmm c m # , 1 '
ZE H20): + * -
81.8 % 36 'C
187 'C 04.2 X
3 PPM 09.4 X 0.08 X 80.8
22 % SQ PPM

. .
, SERIAL 8 1 1 Ci01934 c
ENERAC M O D E L 2888 COMamION TEST RECORD
FUEL :cGiURAL CAS : 21 870 BTLI/La
COMBUST!ON FIC!EPCY: AWE I E3T li3PmTURE : STACK E!!P,WTji?Z : OXYGEN : CARBON MONOXIDE: CARBON DIOXIDE: COMBUST I BLE CASES : STACK DRAFT (INCHES H20): + EXCESS AIR : C4RBON MONOXIDE ALARM:
81.7 % 78 "C
, - - 3 "C
r34.2 % 1 1 PPM
69.4 % 0.00 % 40.0 23 Y 50 PPM
SERIAL U 1:a01934 ' V C , ' U ( b
ENERAC M O D E L 2888 COlr3USTION E S T PSCOi7D
FOR : Rl,rJ/Ha I
COMBUST!ON ZFFICIEWY: AMB I ENT m P m i U R E : STACK TEPtPEXATUiZE: OXYGEN : CARBON RONOX I DE : CARBON DIOXIDE: COMaUST I BLE CASES : s7XK DWFf ( I NCHES H20) : + EXCESS AIR: CARION MONOXIDE ALARn:
83.1 % 33 " C
!66 'C 02.3 3:
I 1 PPM 10.5 X 0.85 X 88.0
1 1 % 58 PPM
rr- e SE2lAL 0 !i391934 %- .? s A .d / 4
ENERAC MODEL 2 1 a 8 r 3 COMBUSTION TEST .ECO?J
FOR: RCC;/HBI
FUEL NATIJRAL MS: 21 a78 9 T W U
COPSLJSTIOP ETFICIENCY: 23.e 5; AMBIENT TZYPEXATURE: 3 m c STACK TEMPEWITUE : !i? "C OXYGEN : 22.: !: CGRBON MONOXIDE: : : ??" CARBON DIOXIDE: :3.; *.; COM3USTISLE GASES:
- - - d . d . 1 '.
s7XK DRAFT (ItuC+s H20): + 33.2 EXCESS AIR: C W O N MONOXIDE ALARM:
MODE : PPM OXY,REF=TRUEi ih- 1 ' J. /C SE2IAL d 11001934 ENERAC M O D E L 2 8 B 8
COMBUST I 0 N TESf PEC0RD
FOR: R W H B I . '
TIME: 10:02:28 D4TE: 64/88/91
FUR NCITURAL GG:2::!79 a i l ~ / L 3
COMBUSTION EFFICIENCY: 33.3 7; AM0 I ENT TDIP-TURE : 39 oc
STACK TEMPEWITUPE : 166 "C OXYGEN : r32.5 :/. C4RSON MONOXIDE: I6 2?c! CCIRBON DIOXIDE: ;O.C .'.: COMBUST I BLE CASES : 8.63 Z STaK DRAFT (INCHIS H2C): + 88.d MCESS 1 R : 12 5: C4RBON MONOXIDE ALARM: 50 PPM
FOR: R W H B I
T ~ M E : 10:08:36 DATE: 84/89/91
COMBUSTION EFFICIENCY: W E I EHT TEMPDTURE : STACK m m T U R E : 0wCEw: CARBON MONOXIDE: -N DIOXIDE: COMBWTIBLE CABES: Srm D M (INCHES H20): MCESS AIR: CARBON rnNOXIDE CUARM:
Y PPM
MODE : PHI OXY-RE- ' I2 UEX
. * . - 5 4'

APPENDIX D
ECONOI(I8ER AND HEAT RECOVERY CALCULATION FOR BOILER8
Economiser
Natural gas heating value 34000 kJ/Nm3
Flue gas side Mass flow 18000 kg/h Inlet temperature 190 degC Outlet temperature 135 degC
Feed Water Side Mass flow 14300 kg/h Inlet temperature 98 degC Ou,clet temperature 114.5 deg C
Heat Rate 280 kW Heat recovered (10 % losses) 252 kW
Savings Natural gas 33.4 Nm3 Assumed boiler efficiency 80 percent Operating hours 2500 hr/yr Assumed fuel cost 11 Ft/Nm3 Value of savings 920,000 Ft/yr Investment 1,500,000 Ft Payback 1.6 years
Continuour Blowdown Eaat Reaovery
Boiler water side Mass flow Inlet temperature Enthalpy Outlet temperature Enthalpy
Make up water sida Mass flow Inlet temperature Enthalpy Outlet temperature Enthalpy
2300 kg/hr 175.4 deg C 742.6 kJ/kg 45 deg C 188.4 kJ/kg
14300 kg/hr 30 deg C
127.7 kJ/kg 51.5 deg C
214.8 kJ/kg
Heat Rate 354 kW Heat recovered (10 losses) 318 kW
Savings Natural gas 42.1 Nm3 Asaumed boiler efficiency 80 percent Oparating hours 2500 hrlyr Assumad fuel cost 11 Ft/Nm3 Value of savings 1,160,000 Ft/yr Invemtmant 790,000 Ft Payback 0.7 years

APPENDIX E
ELECTRIC MOTOR8 08 lOOkW AND ABOVE
Vacuum pump motors Mixer
Main 'machine drive
Main machine drive Paper grinding
Homogenising
Paper grinding Hydropulpers Grinding
Pump

PROJECT FORMS
APPENDIX 1. DETAILED RECOMMENDATION8 FOR ENERGY EFFICIENCY IMPROVEMENT
Recommendations by RCG/Hagler, Bailly for energy efficiency improvement have been grouped in two categories:
A. General and Enerav Manasement
These proj ects are opportunities which are recommended for immediate action, and require little or no expenditure. These projects affect management systems and techniques, rather than process equipment. These projects are the primary focus of the USAID Emergency Energy Program for Hungary.
B. Low-cost. Short-term Im~rovements
These projects are low-cost improvements to process plant and equipment which are recommended for implementation in the short-term (in 1991). Because of the low cost and quick payback (less than one year), these projects could be implemented from the company's annual maintenance budget. Some of these projects may be of interest to the USAID Emergency Energy Program for Hungary.
Following is list of the recommended projects for Budafoki Papirgya~ :
Action Improve plant energy management and accounting
Action A.2: Institute energy efficiency teams to reduce energy losses
Action B.1: Replace faulty steam traps
Each project listed above is presented in a stand-alone project form which provides all basic information to qualify the project. The data are provided at the "inventory1' level (first order of magnitude approximation), and include the following:
- Description and rationale - Calculation of savings (energy and others) - Implementation cost - Financial analysis limited to the pretax pay-back period - Planning - Technical risk and reference - Back-up data and calculations.

ACTXOM A . l - Improve Plant Energy Management and Accounting
1. PROCESS AREA
Overall plant energy management and accounting system.
2. STATEMENT OF RECOMMENDATION
Improve the monitoring and recordinq of energy consumption and production parameters throughout thk plant. Use a portable PC computer to store and analyze this data on a regular basis (intially monthly, eventually weekly or daily). Among the tasks of the computer should be included the following:
-- storage of daily and monthly data on consumption of total and submetered electricity, steam, and fuel; as well as production data by machine and total
-- relationships (graphs) of energy consumption of ma j or users relative to production (specific energy consumption)
-- relationships (graphs) of specific energy consumption against production
-- printout of monthly data and graphs in a consistent and clear format for review by technical management and overall management at the plant.
In this plant, energy accounts for nearly 20% of final product cost. With this high percentage, it is imperative that a good energy monitoring system coupled with management review be instituted. While some dat:a on consumption and production is currently gathered, there is no analysis done. With the large amount of data available, a computer is the only way to ensure that the data can be consistently entered, organized, analyzed, and presented to management in a timely manner.
With the computer, a large number of operating parameters and efficiency indices can be evaluated at the same time, providing an excellent picture of plant efficiency. Eventually, the plant will want to enter more detailed (daily) data to obtain a much more immediate evaluation of operating efficiency; the computer is the only reasonable way to achieve this.
4.1 Energy Savings
Energy savings are obtained as a result of management review of the analyzed data, and the resulting instructions to correct or improve

energy use. The very fact that the staff know this data is being monitored and analyzed regularly is already partial incentive to optimize operationd The installation of such and energy management/accounting system can be expected to bring anywhere from 0.5 to 3% reduction in energy consumption.
- Assuming 0.5% reduction in energy consumption:
5 . IMPLEMENTATION COSTS
Equipment Number US$ Cost
Desktop computer/monitor/keyboard/DOS 1 Wide carriage printer 1 Spreadsheet software 1 TOTAL
In addition to the hardware and software costs, there will be some cost to set up the computer inputs for the monitoring system, train someone to use the computer, and ensure that correct data are obtained.
6. PAYBACK
The payback period for the purchase of the computer system is approximately 3 months.
7 . SCHEDULE
Task 1 -- aomplation datat Hwi' 20, 1991
HBI prepares and addresses to Budfoki Papirgyar the specifications for the computer equipment.
T8ak 2 -- aomplation data: nay 25, 1991
HBI gets quotations from US manufacturers. EGI obtains quotations from Hungarian companies.
Taak 3 -- aorplation data: Juna 10, 1991
Budafoki reviews specifications and makes recommendations for selection of supplier.
Task 4 -- aorplation datat Juna 15, 1991
USAID gives clearance for equipment procurement based on HBI financial and economic study and evaluation of quotations.
Task 5 -- aorplation datar Juna 16, 1991
HBI sends purchase orders for equipment.

Task 6 -- aompletion data: August 10, 1991
Shipment of equipment arrives in Hungary.
Budafoki completes a workplan for the institution of a data collection, analysis, and reporting program using the computer system. All important parameters needed to be entered into the
I computer are identified. Any necessary training of staff is begun.
Task 7 -- completion data: August 32, 1991
Budafoki installs the computer system, and stores available detailed data from the last two years in the system. Preliminary analysis of this data is begun.
Task 8 -- completion data: September 10, 1991
HBI reviews Budafoki computer installation, and its use as the basis of a detailed energy management and monitoring program. Setting of monthly targets for parameters such as specific energy consumption is begun.
80 TECHNICAL RISK AND REFERENCE
There is no significant risk involved in the implementation of this pro j ect . 90 SPECIFICATION OF EQUIPMENT
aantral aomputar unit IBM PC compatibe (MS DOS 3.3 minimum) 80386 microprocessor 4 MB RAM 3 1/2" floppy disk drive (1.4 MB) 5 l/Qtl floppy disk drive (0.7 MB) serial and parallel communication ports Hungarian characters EPROM (CWI) VGA 1411. color monitor Hungarian keyboard
r printor 24 pin dot matrix wide carriage (142 col) Hungarian characters EPROM (CWI)
8preadsheet: Lotus 123 + Allways, or QUATTRO PRO, or IMPRESS in Hungarian
word processor: Wordstar or Wordperfect all user manuals to be in Hungarian

ACTION A.2 - Institute Energy Efficiency Teams to Reduce Energy Losses
1. PROCESS AREA
Portable instruments: to be used throughout the plant for 1 combustion, steam and electrical systems. 1
2. STATEMENT OF RECOMMENDATION
Set up at least 3 energy efficiency teams to test and optimize equipment operation on a regular basis. Teams should be organized for the boilers, the steam system, and the electrical systems. Following are recommendations for the activities on each of these teams :
2.1 Combustion Efficiency Testing Program
Use an electronic combustion gas analyzer to monitor the exhaust 02 content and the combustion efficiency of all four boilers on a weekly basis. Use the combustion analyzer on-line to make necessary fuel/air adjustments in order to keep 02 levels at a minimum with CO less than 100 ppm.
2.1 Steam Trap Testing Program
Inventory all steam traps. Begin a regular testing program using the ultrasonic test instrument, ensuring that every trap is tested on a regulls basis at least twice per year. Tag or otherwise identify each malfunctioning trap and schedule its repair or replacement as soon as possible.
2.2 Optimize Boiler Blowdown
Use the TDS or conductivity meter to monitor the boiler water dissolved solids content 3 times per day. Manually adjust the blowdown or change the bottom blowdown rate in order to maintain the solids concentration inside the boiler less than 3500 ppm (mg/l)
2.3 Reduce Peak Electrical Demand
Use an electric power analyzer to determine the variations in electrical demand for the bakery as a whole, and for the larger individual pieces of equipment. Analyze the results of these measurements to determine the peak demand period during the day, and to identify the equipment which most importantly contribute to this electrical demand. Develop a program for manual rescheduling of equipment operation, or shutoff of certain equipment during the peak demand period in order to reduce the peak demand.

Measurements performed during the audit showed the need for test inst~tuments and their use in the plant, for example:
(a) tests on all four boilers showed that while the combustion efficiency was adequate, an additional 1 t o 2 percentage points on the efficiency could be gained by a finer tuning based on precise measurement of exhaust gas composition
(b) steam trap tests showed that over 80% of the sample tested were leaking significantly; a regular testing program with proper testing instruments (ultrasonic) can immediately identify leaking traps; trap repair or replacement must then be scheduled as soon as possible
electrical measurements on motors showed some to be significantly underloaded, and operating at lower efficiency; operation of others could be rescheduled to reduce startup times.
Use of portable instruments will allow the testing of steam traps, boiler water, and electrical equipment to ensure that equipment is operating in optimum condition. While the operation is generally good, the use of instruments provides a basis for an optimization of operation, offering energy savings of several percent. This amount of savings will pay for the investment in instruments and staff time many times over in one year. In addition, regular testing of plant equipment improves the staff knowledge and understanding of the equipment, and can serve as a basis 'for a better preventive maintenance program.
1
4. BENEFITS
4.1 Energy Savings
Energy savings are obtainable primarily by using the ultrasonic tester to identify leaking steam traps, and by using the electric power analyzer to identify possible electrical demand reductions.
- Combustion efficiency (conservatively assuming 1% average improvement)
- Leaking steam traps identified/repaired (assuming 10/y): 10/yr x 5 kg otm/h (loss) x 6000 h/y x 1.1 F t p g stm =
330,000 Ft/y = $4700
- Possible electricity consumption reduction (assuming average 0.25% reduction):

Total possible savings: $ 22,100
Equipment
Electronic combustion gas analyzer Ultrasonic tester TDS meter Electric power ana1;yzer TOTAL
Number US$ Cost
6. PAYBACK
The payback period for. the purchase of all four instruments is approximately six months.
7 . SCHEDULE
Task 1 -- cornplation data: May 20, i 9 9 1
HBI prepares and addresses to Budafoki Papirgyarthe specifications for the instruments.
Tnsk 2 -- cornplati.oa data: May 25, 1991
HBI gets quotations from US manufacturers.
T a s k 3 -- cornplotion data: J'uno 10, 1991
Budafoki reviews specificatf.ons and makes recommendations for selection of supplier.
T a s k 4 -- c o ~ \ p l ~ t i o n data: Juno 15, 1991
USAID gives clearance for equipment procurement based on HBI financial and economic study and evaluation of quotations.
T a ~ k S -- aompl8t:ion data: Julao 16, 1991
HBI sends purchase orders for equipment.
Tank 6 -- aomplakion dates Augrst 10, 1991
Shipment of equipment arrives in Hungary.
Budafoki completes an operating procedure for the use of portable instruments, including who is responsible, where they will be stored, frequency of use for different applications, etc.
Task 7 -- aomplotion data: August 31, 1991
Budafoki preserut!~ results of initial tests using the instruments. A list of stearn traps tested and their operating condi,tion,

recommended action, and implementation plan should be included. Initial measurements of electrical equipment and their contribution to electrical demand should also be available.
Task 8 -- completion date: Beptember 10, 1991
HBI reviews Budafoki test procedures and results, and assists in making additional energy-saving recommendations based on the test results.
8. TECHNICAL RISK AND REFERENCE
Proper operation of the instruments presents no risk to the company. As part of the operating procedures mentioned in Task 6, instructions for instrument operation should be translated or adapted into Hungarian.
9. SPECIFICATION OF EQUIPMENT
9.1 Elactronia Combustion Gas Analyzer
Type : Electronic microprocessor-based Physical : Portable, self-contained with carrying case
Probe length min 12", sample line length minimum 6 ft Silica gel sample dryer and condensate trap Built-in thermal printer, with line feed button
Output LCD display, backlit, adjustable - ambient temperature: 0-60 C - stack temperature: 0-600 C - 02: 0-21%, electrochemical cell - CO: 0-1000 ppm, electrochemical cell - NOX or NO: 0-2000 ppm - S02: 0-2000 ppm - Combustibles: 0-2 .5%, semiconductor sensor - Stack draft: mmHg, peizoresistive sensor - Computed values of C02, excess air, combustion efficiency Power: 6-12V battery, rechargeable; input 220V 50Hz Accessories: memory for various fuels, with possibility to custom set or Options: diagnostic messages
autozero on startup Spares: 02 cell (1)
CO cell (1) 6 rolls printer paper 4 bottles silica gel
Type : Ultrasonic detector Physical : Pistol-type detector/stethoscope, with minimum 4"
probe, extendable to 15" Output: Analog meter on pistol and audible sound converter for
use with earphones; 10/1 sensitivity calibration dial

Power: 9 V battery, optionally rechargeable Accessories: lightweight plug-in headset, car: 'ring case; tone-
generator and rubber focusing extension optional
9.2 TDS Meter
Type : Conductivity meter Physical : Integral measuring cup Output: Analog meter, 0-5000 ppm in a minimum of 3 ranges Power: 9V battery
9.3 Electric Power Analyzer
Type : Three-channel kW, kVAr, power factor recorder Physical : Benchmount model, NEMA I1 drip-proof case
3-pen chart recorder 100% zero adjust voltage and current leads (6 ft minimum)
Input : maximum 600 V, 1000 A AC Output: power factor: 0.5 lag to 0.75 lead
kW, kVAr: 0-1200, minimum 6 ranges kWh, kVArh counter, resettable to zero max kW, kVAr demand: selectable 15, 30, 60 min periods chart drive minimum 10 speeds in cm/hr and cm/min
Power : input 220V 50Hz Accessories: 3 x 1000A:lA current transformers Spares : fuses
3 x pens/cartridges and chart paper

ACTION B.1 - Replaca Faulty Steam Traps
1. PROCESS AREA
Steam and condensate system for the paperboard machines.
2. STATEMENT OF RECOMMENDATION
Replace 105 thermodynamic-type steam traps on paperboard machines 21, 22, and 23 with inverted bucket-type traps.
During the audit, steam traps were identified as a primary cause of the large amount of steam (estimated at 1.5 t/h) lost from the condensate tank. A test of a sample of 20 traps yielded 17 faulty traps. A major reason for the defective traps is that an incorrect type of trap is being used in the system. The thermodynamic traps emptying into a line with back pressure do not perform adequately. Furthermore, as soon as one trap begins to blow steam, the back pressure in the whole line is increased, affecting the performance of the remaining traps. The only effective solution to this problem is the replacement ofthe existingthermodynamic traps with inverted bucket traps. These traps are hardy, axe not affected significantly by back pressure, and are easy to test.
4. BENEFITS
4.1 Energy Savings
Energy savings are obtained by replacement of steam traps, eliminating the st ,.am leakage through the traps. It is assumed that an average o, 10 kg/h of steam are leaking through each trap. Total savings are estimated at $99,000.
- Replacement of 105 leaking steam traps: 105 x 10 kg/h (loss) x 6000 h/y x 1.1 Ft/kg stm =
6,930,000 Ft/y = $99,00O/y
Equipment Number US$ Cost
Inverted bucket steam traps (various size4p5 21,000
6. PAYBACK
The payback period for the purchase of all four instruments is approximately 2.5 months.
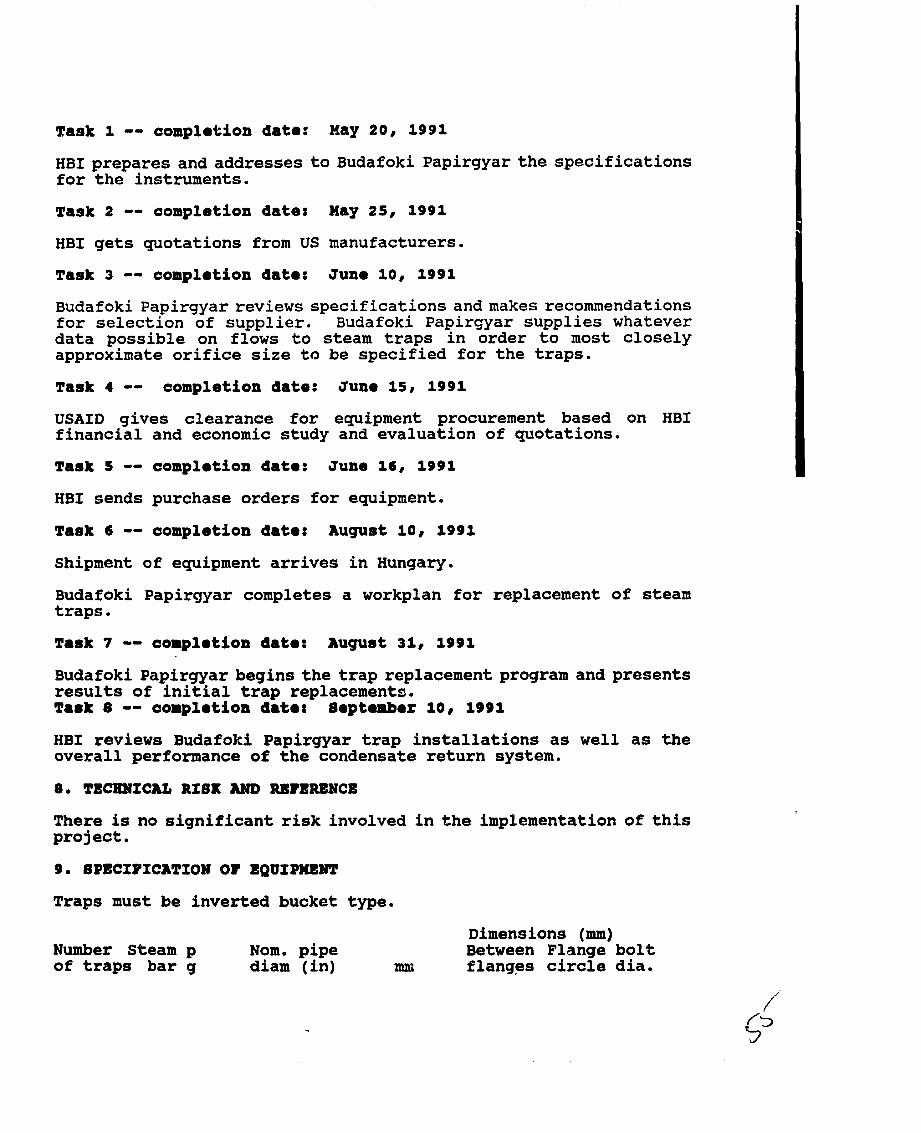
Task 1 -- cornplation data: May 20, 1991
HBI prepares and addresses to Budafoki Papirgyarthe specifications for the instruments.
Task 2 -- completion date: Hay 258 1991
HBI gets quotations from US manufacturers.
Task 3 -- cornplation data: June 10, 1991
Budafoki Papirgyar reviews specifications and makes recommendations for selection of supplier. Budafoki Papirgyar supplies whatever data possible on flows to steam traps in order to most closely approximate orifice size to be specified for the traps.
Task 4 -- completion date: Juna 158 1991
USAID gives clearance for equipment procurement based on HBI financial and economic study and evaluation of quotations.
Task 5 -- complation data: June 168 1991
HBI sends purchase orders for equipment.
Task 6 -- aomplation data: August 10, 1991
Shipment of equipment arrives Hungary.
Budafoki Papirgyar completes a workplan for replacement of steam traps.
Task 7 -- complation data: August 31, 1991
Budafoki Papirgyar begins the trap replacement program and presents results of initial trap replacements. Tark 8 -- aomplation data: saptambas lo8 1991
HBI reviews Budafoki Papirgyar trap installations as well as the overall performance of the condensate return system.
There is no significant risk involved in the implementation of this project . 9. BPBCIPICATION OF EQUIPXENT
Traps must be inverted bucket type.
Dimensions (mm) Number Steam p Nom. pipe Between Flange bolt of traps bar g diam (in) m flanges circle dia.
