final report of the working group 3 april, 2001 · final report of the working group ... 1.7...
TRANSCRIPT
Review of the Cost Allocation Model
Final Report of the
Working Group
3 April, 2001
Contents
1. Executive Summary ................................................................................................4 1.1 Introduction........................................................................................................4 1.2 Cost Allocation Principles .................................................................................4 1.3 Framework of the Cost Allocation Table...........................................................5 1.4 Space Allocation Parameter...............................................................................5 1.5 Recovery of Use Related Costs..........................................................................5 1.6 Allocation of Costs in the Cost Allocation Table ..............................................6 1.7 Allocation of Fixed Revenue .............................................................................6 1.8 Allocation of Residual Costs .............................................................................7 1.9 Road Friendly Suspensions and Large Tyres.....................................................8 1.10 Recommendations on Use of the Model........................................................9
2. Introduction ...........................................................................................................10 3. Background ...........................................................................................................11
3.1 Cost Allocation Model.....................................................................................11 3.2 History..............................................................................................................12 3.3 Development of a New Zealand Cost Allocation Model.................................13 34. Scope of the Review ........................................................................................13 3.5 Process .............................................................................................................14
4. Cost Allocation Principles.....................................................................................16 4.1 Economic theory ..............................................................................................16 4.2 Equity...............................................................................................................17 4.3 Administration and compliance costs ..............................................................17 4.4 Acceptability and the implicit contract argument............................................17 4.5 Application of Theory to Roading ...................................................................17 4.6 Summary ..........................................................................................................19
5. Framework of the Cost Allocation Table..............................................................20 5.1 Use-related Costs .............................................................................................20 5.2 Residual Costs..................................................................................................20
6. Space Allocation Parameter ..................................................................................22 6.1 Background......................................................................................................22 6.2 Impact of Space Allocation..............................................................................22 6.3 Conclusion .......................................................................................................23
7. Theoretical Recovery of Use Related Costs..........................................................24 7.1 Construction.....................................................................................................24 7.2 Road Maintenance (pavement maintenance) ...................................................25
8. Allocation of Costs in the Cost Allocation Table .................................................26 8.1 Weighting Road Charges by Road Usage (weighted incremental costs) ........26
9. Allocation of Fixed Revenue.................................................................................28 9.1 Vehicle Licence Fees .......................................................................................28 9.2 Allocation of Local Authority Expenditure and Associated Rates Revenue...29
10. Allocation of Residual Costs ...........................................................................34 10.1 Efficiency.....................................................................................................34 10.2 Equity...........................................................................................................35 10.3 Administrative/practical implications..........................................................36 10.4 Conclusion ...................................................................................................36
11. Road Friendly Suspensions and Large Tyres...................................................38 11.1 Road Friendly Suspensions..........................................................................38 11.2 Large Tyres ..................................................................................................39
THIS IS NOT APPROVED GOVERNMENT POLICY 2
12. Recommendations on use of the model ...........................................................40 13. Recommendations............................................................................................41 Appendix A: Cost Allocation Model.........................................................................44 APPENDIX B: Information Sources For Allocation of Costs.....................................46
B.1 Allocation of Pavement Maintenance and New Road Expenditure.................47 APPENDIX C: Allocation of Base Facility Costs.......................................................49
C.1 Background......................................................................................................49 C.2 Analysis of Road Construction Costs ..............................................................49 C.3 Proposed Methodology for Allocation.............................................................50
Appendix D: Proposed Cost Allocation Table.............................................................52 Appendix E: Existing Cost Allocation Table...............................................................54 Appendix F: Description of the Allocation of Road Costs ..........................................56
THIS IS NOT APPROVED GOVERNMENT POLICY 3
Review of the Cost Allocation Model 3 April 2001
1. Executive Summary
1.1 Introduction This report presents the findings and recommendations from a review of the Cost Allocation Model by a Working Group chaired by the Ministry of Transport, and including representatives from Transfund New Zealand, Transit New Zealand and The Treasury. The Cost Allocation Model allocates roading costs between vehicle classes in order to provide guidance on the required level of Road User Charges and fuel excise duty necessary to recover the Crown’s roading expenditure. The review seeks to address issues raised in a 1996 independent peer review (the Starrs Report) relating to the allocation of costs within the model. Road friendly suspension and wide tyres are also considered in this review.
1.2 Cost Allocation Principles The Working Group prioritised cost recovery as the principal objective in setting charges, with economic efficiency and equity as second and third ranked objectives respectively. The Working Group subsequently sought advice on the appropriate principles relevant to these objectives. Economic Efficiency Economically efficient pricing and cost recovery are not equivalent concepts. In general, efficient pricing occurs when price equals marginal cost. Should charges that are set equal to marginal cost not fully recover total costs, then the remaining costs should be recovered in the least distortionary manner possible. Given the nature of roading and a lack of information on how road costs vary with traffic usage, it is not possible to calculate with any precision the true marginal costs of different vehicle classes across the roading network, let alone on individual roads. The Working Group was advised by Capital Economics that average use-related costs would provide a reasonable proxy for marginal costs and that vehicle classes should be charged: • at least their incremental costs and no more than their stand alone costs; • at least their average use-related costs (ie attributable costs); and • any apparent common and joint costs which, on further examination, are in reality
long run capital costs incurred as a result of vehicle use. Remaining common and joint costs are classed as residual costs and should be allocated in the least distionary manner possible, subject to equity considerations. Equity There is a range of different interpretations to equity. However, the following three interpretations are readily apparent:
THIS IS NOT APPROVED GOVERNMENT POLICY 4
Review of the Cost Allocation Model 3 April 2001
• The concept of vertical equity ie those who use more should pay more • The concept of horizontal equity ie those with the same use/costs should pay the
same amounts • The concept of ability to pay ie those on lower incomes should pay less than those
on higher incomes for equivalent use. All three should be considered in the review.
1.3 Framework of the Cost Allocation Table The current model allocates all costs to particular vehicle characteristics even when the economic justification may be weak (e.g. the allocation of maintenance costs caused by weather damage to a vehicle characteristic). In light of the cost allocation principles identified earlier, the Working Group proposes that: • only those costs directly attributable to vehicle use should be allocated to a
particular vehicle characteristic; and • remaining costs should be classed as residual costs and recovered in the least
distortionary manner. The Working Group considers this a more intellectually robust and transparent approach. The Working Group, therefore, proposes that the allocation framework, in the Cost Allocation Model allocates all costs to either use-related costs or residual costs. Use-related Costs Use-related costs are those costs that are incurred as a result of vehicle use of the roading system. Residual Costs Residual costs are those costs that do not vary with vehicle use of the roading system.
1.4 Space Allocation Parameter The current cost allocation model excludes a space related cost vehicle characteristic and instead, proxies this by allocating space-related costs between vehicle weight (GVW) related costs and driver (PV) costs. The Working Group noted that the current approach for allocating space related costs reduces the transparency of the Cost Allocation Model and mis-allocates costs. The Working Group, therefore, recommends the inclusion of a space allocator in the model.
1.5 Recovery of Use Related Costs The application of the appropriate ‘cost allocation principles’ identified by the Working Group, results in the following treatment of maintenance and construction roading costs in the model.
THIS IS NOT APPROVED GOVERNMENT POLICY 5
Review of the Cost Allocation Model 3 April 2001
Construction Roading construction in New Zealand is prioritised according to a benefit to cost ratio. The level of future benefits is largely dependent on the expected increase in the volume of future traffic that will use the new road/improvement. Consequently, the Working Group considers all road construction costs should be treated as use-related. Road Maintenance Pavement maintenance is required primarily as a result of structural deterioration caused by vehicle loads and the weather. The load-related costs should be treated as use-related costs, given that they result directly from vehicle use. Weather-related effects, such as slips, are not related to vehicle use and, therefore, should be treated as residual costs.
1.6 Allocation of Costs in the Cost Allocation Table In applying these principles to the model the Working Group asked OPUS International Consultants and roading engineers from Transit New Zealand and local territorial authorities to: allocate roading costs caused by vehicle use to a use-related vehicle cost
characteristic; allocate costs not caused by vehicle use to residual costs; allocate road construction costs on the basis that the ‘base facility’ costs are
attributed to driver costs or space costs and the costs of additional strengthening required for heavy vehicles are allocated to heavy vehicles.
From this work, the Working Group has derived a new cost allocation table for recommended inclusion in the model.
1.7 Allocation of Fixed Revenue The current model allocates fixed revenue from vehicle licence fees and the local authorities contribution to local roads against “fixed” roading costs. This allocation was criticised in the Starrs Report. Consequently, the Working Group examined the treatment of these revenue sources in the model. Vehicle Licence Fees A total of $185 million is collected from motor vehicle licensing and vehicle registrations and related transactions. The Working Group notes, in respect to the motor vehicle registration and licence fees, that: • The fees are currently an input into, rather than an output from the cost allocation
model, which is unusual for a model that is meant to identify appropriate charges; • Use of a fee like the Motor Vehicle Licensing fee would provide another option
for recovering residual costs, however, there are also likely to be equity, safety and enforcement implications to consider; and
THIS IS NOT APPROVED GOVERNMENT POLICY 6
Review of the Cost Allocation Model 3 April 2001
• The government is currently considering possible changes to the way roads are funded and this could affect motor vehicle registration and licence fees.
The Working Group recommends, subject to any government decisions, that the motor vehicle registration and licence fees, and any dedicated expenditure, either be removed from the model or made an output of the model. Allocation of Local Authority Expenditure and Associated Rates Revenue Local authority expenditure and associated rates revenue were added to the existing model in 1984. The Starrs report argued that excluding this expenditure was more consistent with international practice and recommended that local authority expenditure either be excluded, or deducted from total costs in a manner that is neutral between vehicle types. A report prepared by Outcome Consultants argued that the inclusion of local authority expenditure was inconsistent with cost recovery principles and inconsistent with the way in which the government had clearly decided roads should be funded. An international peer review undertaken by PHB Hagler Bailly favoured including local authority use-related expenditure in the model for providing guidance on RUC and FED levels. The Working Group recommends the inclusion of local authority use-related costs in the model for calculating charges, but notes that the core problem is the use of local authority rates in road funding which is outside the scope of the review.
1.8 Allocation of Residual Costs Residual costs are estimated to account for around 40% of total roading costs. The decision as to how these costs are allocated is critical to providing guidance on appropriate charges. The three most apparent options for allocating residual costs are: (i) A per vehicle allocation: Residual costs could be allocated on a straight per-
vehicle basis (eg $100 per vehicle per year); (ii) A per vehicle kilometre allocation: Residual costs could be allocated on a per
vehicle kilometre rate built into charges for all vehicle classes (eg $0.01 per vehicle km);
(iii) A proportional mark-up allocation: Residual costs could be allocated on
aproportional mark-up basis, whereby the average use-related costs for each vehicle class would be marked up by a set percentage, say 30%, to ensure that all these residual costs were recovered.
THIS IS NOT APPROVED GOVERNMENT POLICY 7
Review of the Cost Allocation Model 3 April 2001
The Working Group considers that economic efficiency theory provides limited guidance to this decision and so consideration of equity and practical impacts may be more important. In saying this, the Working Group considers that acknowledging the likely greater impact of higher charges on the heavy vehicle sector would appear appropriate. As a minimum, the Working Group considers no increase in charges for the heavy vehicle sector could be justified based on this decision alone. Furthermore, the Working Group considers that it might be difficult to justify – from an equity perspective – requiring heavy vehicles to bear a large proportion of residual costs simply because they account for a large share of use related costs. Residual costs are, by nature, of benefit to all road users to a non-identifiable degree. The Working Group also notes the impact of allocating residual costs on a straight per-vehicle basis could be relatively severe on infrequent road users and low-income earners (an increase of between $120 and $170 per vehicle could be the result). The Working Group considers recovering residual costs on a vehicle kilometre basis is the only option that meets at least two out of the three equity criteria. This option would have a less adverse impact on heavy vehicles than a proportional allocation and a less adverse impact on light vehicles than a per-vehicle allocation, and would reflect the equity premise, that payments should increase with use. It would also be the most simple and transparent means of allocating such costs. On this basis, the Working Group recommends this approach.
1.9 Road Friendly Suspensions and Large Tyres Road Friendly Suspensions Opus Consultants advised the Working Group that vehicles with some road friendly suspensions have a 15% lower impact on road wear than vehicles without such systems. Opus recommended the development of a separate, lower RUC scale for vehicles with such systems. The overall difference in RUC charges would be in the order of 3% to 5%. The Working Group recommends that the government consider the merits of introduction a separate scale for vehicles with road friendly suspensions alongside other policy work the Government has asked the Ministry to undertake on technological alternatives to the RUC system. Large Tyres Opus Consultants also advised the Working Group that the net benefit of single large tyres were unlikely to be sufficient to justify further changes to the RUC system, as there would be little reduction in road wear. The Working Group agrees with this advice and recommends that no changes be made to the RUC system to account for large tyres.
THIS IS NOT APPROVED GOVERNMENT POLICY 8
Review of the Cost Allocation Model 3 April 2001
1.10 Recommendations on Use of the Model The Working Group notes that a few key changes recommended for the model have a significant impact on relative charge levels. These changes are: • The separation of residual costs into a separate category and their recovery off all
vehicle users • The treatment of local authority roading expenditure. The Working Group notes that the application of refined cost recovery principles as opposed to substantial new research has driven these changes. To the extent they are driven by a greater focus on economic efficiency then there is a case for change. To the extent that they are driven simply by different allocation of residual costs based on other (e.g equity) criteria, then the grounds for change are not so strong. Consequently, the case for amending charges as a result of this review alone is not necessarily absolute but the recommended changes to the model should make it a far more robust tool for providing advise on future charge levels. The Working Party recommends that the revised model be used for determining future levels of charges when the Government has completed its work on road funding levels, and at least every 3-5 years after that.
THIS IS NOT APPROVED GOVERNMENT POLICY 9
Review of the Cost Allocation Model 3 April 2001
2. Introduction The Cost Allocation Model allocates roading expenditure to various vehicle classes in order to calculate the required level of Road User Charges and fuel excise duty necessary to recover the Crown’s roading expenditure. This report presents the findings and recommendations of a review to the Cost Allocation Model by a Working Group chaired by the Ministry of Transport, and including representatives from Transfund New Zealand, Transit New Zealand and The Treasury. A second informal group of interested parties (including the Road Transport Forum New Zealand, the Automobile Association of New Zealand, and the Bus and Coach Association) were kept informed of progress and formally consulted on this review’s Terms of Reference and its draft findings. Where possible, their comments have been incorporated. This review has been carried out in order to ensure that the Cost Allocation Model can provide up-to-date guidance on the levels of Road User Charges and fuel excise duty necessary to efficiently recover all roading expenditure from the National Roading Fund. This review arose as a result of findings from a 1998 independent international peer review of the model.
THIS IS NOT APPROVED GOVERNMENT POLICY 10
Review of the Cost Allocation Model 3 April 2001
3. Background
3.1 Cost Allocation Model The Cost Allocation Model determines appropriate levels of Road User Charges (RUC) and fuel excise duty (FED) necessary to recover approximately $1.2 billion per annum of roading and road safety costs from the National Roads Fund1 (NRF). The levels of RUC and FED are determined by allocating roading costs to vehicles types, hence the name ‘Cost Allocation Model’. RUC is payable by all diesel vehicle operators and operators of all vehicles over 3.5 tonnes. Petrol, LPG and CNG vehicle users under 3.5 tonnes are charged FED when they purchase fuel at the pump. The model does not estimate motor vehicle re-licensing charges, but rather treats the proportion of licensing revenue going to the NRF as an input. The $1.2 billion costs recovered from the NRF includes expenditure on road safety programmes, traffic enforcement, revenue collection, roading maintenance and roading construction. The model assumes that the roading costs to be recovered are equivalent to the roading expenditure in that year2. The methodology used in the model to allocate costs assumes that vehicles ‘occasion’ a cost each time they use the roading system. This methodology is known as a cost ‘occasioned’ approach. The model assumes the following costs (referred to as cost characteristics) are ‘occasioned’ by vehicle use: • driver-imposed costs resulting from the need to provide resources for motorists
themselves. These include signs, road markings and landscaping; • strength imposed costs resulting from the gross weight of vehicles (GVW), such
as bridge strength; • durability costs resulting from the fourth power of the axle weights of vehicles
(measured in equivalent design axles (EDA’s)), such as pavement wear; • capacity-imposed costs resulting from the space requirements of vehicles
(measured as passenger car units (PCU)). Other costs like vehicle width could also be included, but such additional factors have been found to increase the complexity of the model for little increase in value. However, many of the costs of the roading system are common in that they are incurred by, and benefit, all users. These costs are known as common costs. These costs often bear no clear engineering relationship with identifiable users or vehicle characteristics, but they are related to road use.
1 The National Roads Fund is a notional account within the Crown Account that is dedicated towards roading and road safety expenditure. 2 Assuming expenditure equals costs is a pay-as-you-go (PAYGO) methodology.
THIS IS NOT APPROVED GOVERNMENT POLICY 11
Review of the Cost Allocation Model 3 April 2001
Finally, there are also joint costs, which result from operating a roading system but are totally unrelated to vehicle use. The damage caused to roads by weather would be an example of a joint cost. The existing model allocates all costs into either fixed or variable categories, with the fixed and variable categories determined as a fixed percentage for those costs attributed as: wear, strength and vehicle driver related costs. Despite the lack of clear linkages, all common and joint costs are allocated on the assumption that the vehicles responsible for these costs can be identified. The cost characteristics and model structure were obtained from an OECD (1983) report, which was based on EEC Guidelines.
3.2 History The Cost Allocation Model was developed in 1978 to coincide with the introduction of the RUC system in the same year. A Working Party was set up to develop a model that would determine the appropriate levels of RUC rates in light of the Crown’s roading expenditure at the time. In order to limit the impact on the transport industry, the new RUC rates were phased in over a number of years. The “final” RUC rates were set in 1980/81 at the level calculated by the model. The model was extensively reviewed in 1984 based on a report from the OECD. RUC rates were recalculated following the review and, despite the annualised nature of the model3, the model was not used again for determining road charges until 1998. The methodology and cost allocations developed in the 1984 review form the basis of the current model. In 1993/94, Transit revised the model as part of the Land Transport Pricing Study so as to provide greater flexibility for testing the assumptions on which it was based. However, the primary allocations and methodology of the model were not changed from that developed in 1984. The government’s decision to increase funding for new roading projects in 1995 meant an increase in road charges was inevitable4 within a matter of years. This initiated Transit to commission an international consultant to peer review the model in 1996. The subsequent report in February 1998 raised a series of questions about the model. In 1998 the 1993/94 version of the model was used to provide guidance on an increase in light RUC and FED rates in the 1998 Budget. There was no time to consider the more substantive issues raised by the international peer review. The model indicated that light vehicles were not paying a sufficient share of roading costs. Consequently, increases of 15% for all 1 and 2 tonne RUC licences, and 9% for all 3 tonne licences were announced, along with an increase of 4.2 cents a litre to 13.6 3 The model was designed to determine charge levels based on actual expenditure in each financial year. 4 An immediate increase in road charges was not required as the NRF had a balance of $120 million that was drawn-down.
THIS IS NOT APPROVED GOVERNMENT POLICY 12
Review of the Cost Allocation Model 3 April 2001
cents a litre in the fuel excise duty collected on petrol dedicated to roading, and an equivalent increase in the excise duty on LPG. These increases were considered to provide sufficient funding up until 2001. This review seeks to respond to the issues raised by the 1996/98 international peer review and a number of other matters, so that when charges need to be altered again, the model can provide up-to-date, robust guidance.
3.3 Development of a New Zealand Cost Allocation Model A specific road cost allocation model had to be designed for New Zealand, because: • The RUC charging mechanism is world leading and differs from most other
countries in the OECD which predominately rely on a diesel tax to recover both heavy vehicle road charges and light vehicle road charges. The current model is designed to calculate road charges by vehicle weight and classes of vehicle axle configuration for the RUC system.
• New Zealand roads are primarily unbound granular basecourse (compacted
gravel) pavements. This type of road is weaker than typical OECD roads, with axle loads regulated to not exceed 8.2 tonnes. Other countries allow axle load limits of 10 tonnes or even 13 tonnes, with pavements of asphaltic concrete or cement concrete. The weaker road structure results in different wear characteristics and requires costs to be allocated differently.
• New Zealand highways are predominately two lane highways with lots of curves
and gradients, as opposed to predominately four lane highways in other OECD countries. This results in a high percentage of New Zealand’s state highway roading construction expenditure being spent on passing lanes and road straightening, unlike other countries.
• New Zealand bridges have to meet earthquake standards, unlike many other
countries, such as Australia and Britain. Earthquake standards not only increase total bridge costs but also increase the percentage of costs allocated to vehicle weight (i.e. heavy vehicles).
34. Scope of the Review In 1996, Transit commissioned Margaret Starrs, an Australian consultant with significant experience in roading cost allocation issues in Australia, to undertake an independent peer review of the model. This review is focused on answering the key questions raised by M Starrs report and more recent research. These issues include: • the fixed/variable structure used to allocate costs. The model currently allocates
all costs to vehicle cost characteristics as either fixed or variable;
THIS IS NOT APPROVED GOVERNMENT POLICY 13
Review of the Cost Allocation Model 3 April 2001
• the cost categories and cost subcategory breakdowns within the model. Continuous changes to the National Roading Programme5 (NRP) cost categories necessitate continued updating of the cost categories within the model;
• the allocation of net vehicle licensing revenue. In the existing model, vehicle
licensing revenue is netted-off all fixed costs on the proportion of the fixed cost percentage of total fixed costs;
• the allocation of rates expenditure and revenue. The existing model includes all
local roading expenditure that attracted Transfund New Zealand funding. The local authority contribution (rates) to this expenditure was subsequently netted-off over all fixed costs on the proportion of the fixed cost percentage to total fixed costs;
• the benefits and feasibility of including wide tyres and road friendly suspension
into the model. Some overseas countries acknowledge the reduction of road damage from the use of road friendly suspension and wide tyres in their road charging regimes.
Issues which were outside the scope of this review included: • The road charging mechanisms of RUC and FED on petrol, LPG and CNG. The
future use of these mechanisms is being reviewed as part of the Government’s road policy work;
• The vehicle axle and wheel configurations used in the model, the RUC licence
options of distance, time and supplements; and technical road engineering issues such as the fourth power rule. These issues did not appear to justify the substantial amount of research that changes to their treatment in the model would have required.
3.5 Process The identified issues were divided into either economic or ‘engineering issues’6. The Working Group prepared two papers on the economic issues that were subsequently peer reviewed by Outcome Ltd7. The Working Group commissioned Opus Consultants International8 to analyse ‘engineering issues’. Capital Economics9 undertook additional work on the economic principles to guide the cost allocation process, following a request from the Working Group. Finally, PHB Hagler Bailly conducted an international peer review. The work carried out by the various consultancy firms was limited to providing guidance to the Working Group’s in its review of the Cost Allocation Model. The 5 The roading expenditure categories within the model are based on the NRP. 6 The engineering issues also contained a number of fundamental economic issues regarding the allocation of costs to achieve efficiency. 7 See appendix 2. 8 See appendix 3. 9 See appendix 4.
THIS IS NOT APPROVED GOVERNMENT POLICY 14
Review of the Cost Allocation Model 3 April 2001
Working Group undertook a substantial amount of work in developing the cost allocation structure, the rationale for allocating costs and the final allocation of roading expenditures. An informal group of interested parties (including the Road Transport Forum – New Zealand, the Automobile Association of New Zealand, and the Bus and Coach Association) were kept informed of progress and formally consulted on this review’s Terms of Reference and its draft findings. Where possible, their comments have been incorporated.
THIS IS NOT APPROVED GOVERNMENT POLICY 15
Review of the Cost Allocation Model 3 April 2001
4. Cost Allocation Principles The Cost Allocation Model is designed to provide guidance on RUC and FED rates in order to recover expenditure from the NRF. Guidelines set by the New Zealand Treasury for cost recovery in the public sector provide a framework for the recovery of such costs. The guidelines are not designed to be definitive. According to these guidelines, changes should be set to, among other things10: • encourage decisions on the volume and standard of services demanded that are
consistent with the efficient allocation of resources generally; and • deal equitably with the taxpayer, those who benefit from the output, and/or those
actions give rise to it. The guidelines, however, are not necessarily compatible, with different outcomes likely depending on the primary guideline chosen. Therefore, the Working Group prioritised cost recovery as the principle objective with the model and efficiency and equity being secondary guidelines. In applying these guidelines to the cost allocation model, the Working Group sought further advice on the economic theory underlying cost recovery issues. The following summarises the resulting Working Group’s views on these issues.
4.1 Economic theory Economically efficient pricing and cost recovery are not equivalent concepts. The former typically requires consideration of a far wider range of factors than the latter, including an assessment of likely future costs, the reaction of competitors, and other potential sources of revenue. Depending on the situation it could more than recover costs, under recover costs, or exactly recover costs. In contrast, full cost recovery is, by its very nature, restricted to the recovery of total costs off a set class of users. Given the nature of the expenditure and revenue decision making in the New Zealand roading system, the cost allocation model remains a tool for guiding the recovery of costs incurred through expenditure on the roading system that are not recovered elsewhere. However, economic theory does provide some guidance as to how such costs can be recovered in the most economically efficient manner. Efficient pricing occurs when price equals marginal cost, unless particular conditions to the contrary apply. In this base case, road charges should be set as close as possible to true marginal costs. These marginal costs will differ according to the vehicle, location, construction, and congestion being experienced on individual roads. Of course, if such prices did not allow a road operator to recover all costs, including the cost of capital, they would not be viable. Economic efficiency would dictate a different pricing structure. Should charges that are set equal to marginal cost not fully recover total costs, then the remaining costs should be recovered in the least distortionary manner possible. In 10 Guidelines for Setting Charges in the Public Sector, December 1998.
THIS IS NOT APPROVED GOVERNMENT POLICY 16
Review of the Cost Allocation Model 3 April 2001
this instance, Ramsey pricing, ie loading these extra costs on to those with the most inelastic demand, would provide an efficient outcome.
4.2 Equity Although interpretations of equity can differ, three interpretations are readily apparent: (i) The concept of vertical equity ie the more you use the more you should pay (ii) The concept of horizontal equity ie those with the same use/costs should pay the same amounts (iii) The concept of ability to pay ie those on lower incomes should pay less than those on higher incomes for equivalent use. Ideally, any cost recovery system should meet as many of these criteria as possible.
4.3 Administration and compliance costs Any cost recovery system should be seeking to minimise the costs of its administration and the costs of complying with it. Ideally, it should also be seeking to minimise its complexity and maximise its transparency.
4.4 Acceptability and the implicit contract argument Any cost recovery system needs to be acceptable to those paying the charges. Any cost recovery system operating for some time could also have taken on the form of an implicit contract between those paying and those receiving the service as to how the costs will be allocated. This would tend to imply that those allocations should only be changed for good reason.
4.5 Application of Theory to Roading Unfortunately, given the nature of roading and a lack of information on how road costs vary with traffic usage, it is not possible to calculate with any precision the true marginal costs of different vehicle classes across the roading network, let alone on individual roads. In general, economic theory tends to suggest that vehicle classes should be charged at least their incremental costs (ie the costs of providing those vehicles the additional services they require) and no more than their stand alone costs (the costs of providing those vehicles with the basic service). Average use-related costs are likely to under-estimate marginal costs if capital expenses understate future capital costs that are use-related. Hence, average use-related costs might be best interpreted as setting a lower limit on the level that any vehicle class should be charged. Average long-run incremental cost might provide a better estimate of marginal cost because it explicitly takes the timing of pending capital costs into account. As the charging of marginal cost should also include any
THIS IS NOT APPROVED GOVERNMENT POLICY 17
Review of the Cost Allocation Model 3 April 2001
capital costs that have to be brought forward because of use, such costs should also be recovered off their respective vehicle classes. Any remaining costs should be recovered through the least distortionary means. However, using Ramsey-based pricing with precision to allocate remaining costs would encounter difficulties, given the lack of information about demand elasticities. It would also have equity implications that could contrast starkly with the original intention of the cost allocation model. Consequently, a more practical application of this approach is required. There would appear to be three simple options for allocating these common and joint costs and numerous other variations: • Marking up the total (long run) use-related cost applicable to each vehicle class by
a uniform dollar amount; • Marking up the total (long run) use-related cost according to the same per vehicle
kilometre rate; or • Marking up such total charges by the same proportion/percentage. In essence, the latter might assume that the elasticities of the various vehicle classes were the same and that it is equitable to charge each vehicle class the same proportion of these costs as they incur use-related costs. The former options would assume that these elasticities increase with higher use-related costs (ie weight) and that it is fair for all vehicle classes to pay an equal dollar share of these costs. Intuitively, the Working Group considers that it will be important to consider the economic and equity implications of all three options. However, as such an allocation is still ad hoc, it would appear advisable to assess the sensitivity of the final charge levels to changes in this allocation method. Testing of a lesser uniform rate would demonstrate the sensitivity of such a change to the charge levels. Further, given that the cost allocation model has been in existence since 1977 and used periodically since that time, any recommended changes in RUC or petrol excise levels resulting from a change in this allocation should be clearly justifiable. For example, it could be argued that the current cost allocation model includes a method of allocating these costs and unless there is any research that can “prove” a more robust way of allocating these costs, then there may not be sufficient justification to change. More explicitly, such changes should not lead to any obviously unintended consequences without very good cause. By testing the three options, this approach would demonstrate the sensitivity of the results to these scenarios and therefore provide guidance as to whether changes in charge levels were justified in comparison with the current (largely engineering-based) model. If it is apparent that the use of such different scenarios are the primary cause behind any significant shift in the cost allocation model results, then there may be little justification to actually alter charge levels.
THIS IS NOT APPROVED GOVERNMENT POLICY 18
Review of the Cost Allocation Model 3 April 2001
4.6 Summary The above would tend to imply that all vehicle classes should be charged: • At least their incremental costs and no more than their stand alone costs as a
general principle • At least their average use-related costs (ie attributable costs) • Any apparent common and joint costs which, on further examination, are in reality
long run capital costs incurred as a result of vehicle use • The remaining common and joint costs one of three options – a per vehicle rate, a
per vehicle kilometre rate or a proportional rate – based on their respective economic and equity implications. The sensitivity of the results and accounting for any possible adverse consequences should determine whether there is sufficient justification to change charges for this reason alone.
THIS IS NOT APPROVED GOVERNMENT POLICY 19
Review of the Cost Allocation Model 3 April 2001
5. Framework of the Cost Allocation Table The cost allocation model allocates where possible roading costs to the relevant vehicle characteristics. The key vehicle characteristics are as follows: • Gross Vehicle Weight (GVW) which measures vehicle strength imposed road
costs, such as bridge strength; • Equivalent Standard Axles (ESA’s) which measures vehicle road wear costs
resulting from the fourth power of the axle weights of vehicles; • Passenger Car Equivalent (PCE) which measures the vehicles space related road
costs, such as the additional road space (ie construction of additional traffic lanes) required to alleviate traffic congestion; and
• Power Vehicle (PV) which measures the drivers imposed costs resulting from the need to provide resources for motorists themselves. These include signs, road markings and landscaping;
The cost allocation table, within the model, shows the percentage of road costs that are allocated to these vehicle characteristics. However, as was detailed earlier, not all road expenditure is directly caused by a vehicle characteristic and, historically, assumptions have been made as to how they would have been caused. The cost allocation table framework should allocate road costs in a manner designed to achieve efficient road charges, given the requirements for full cost recovery and use of the RUC and FED options. The proposed framework would allocate all costs to either use-related costs or residual costs. This approach differs from the current model which allocates all roading costs to vehicle characteristics.
5.1 Use-related Costs Use-related costs are those costs that can be attributed to vehicles (more correctly vehicle characteristics) and can vary with a significant increase in volume. By this definition, use-related costs reflect a long-run incremental costing approach. Within use related costs, two separate cost types can be identified: • costs that are incurred directly through vehicle use. These are predominantly
maintenance costs caused by vehicles damaging the road; and • costs brought forward through vehicle use. This includes road rehabilitation and
new roading construction required to alleviate congestion caused by increased vehicle use.
5.2 Residual Costs Residual costs are those costs that can not be attributed to a vehicle cost characteristic. Residual costs are either: • costs not related to vehicle use of the roading system, such as weather-related
damage; or
THIS IS NOT APPROVED GOVERNMENT POLICY 20
Review of the Cost Allocation Model 3 April 2001
• costs that are not related to the amount of vehicle use of the roading system. These costs include government-determined expenditure on transport safety programmes (i.e. Land Transport Safety Authority).
Residual costs include most common and joint costs. The theory, and Working Group proposals, for the recovery of residual costs is provided in Chapter 10.
THIS IS NOT APPROVED GOVERNMENT POLICY 21
Review of the Cost Allocation Model 3 April 2001
6. Space Allocation Parameter The Working Group has reviewed the need to include a space allocation parameter in the model.
6.1 Background Consumption of road space is one of the four types of cost “occasioned” by vehicles using the road network. The current cost allocation model excludes a space-related cost characteristic and uses the parameters PV and GVW to allocate space-related costs. This approach was adopted in 1984 when space related costs were allocated 70:30 to PV and GVW respectively, in order to approximate a space allocator. The Starrs report suggested that the effect of the 70:30 split was to transfer a greater share of the space related costs to heavy vehicles than was justified. For example, a three-axle truck weighing 20 tonnes was equivalent to 3.7 passenger car equivalents (PCEs) in the pre-1984 model, but with the 70:30 split, its share of space related costs became equivalent to 6.7 PCEs11. The Starrs report recommended that: • a space-related allocator should be used in the model • the allocator should give an average of 2.5 PCEs for a heavy vehicle.
6.2 Impact of Space Allocation The Working Group considers the exclusion of the space allocator reduces the transparency of the Cost Allocation Model. The allocation of the space related costs to PV and GVW means that it is subsequently unclear as to whether the costs are allocated on the basis of space, strength or driver related costs. The current model’s treatment of “space” costs also appears to disadvantage heavy vehicles. Sensitivity analysis using 1999 data into the impact of including a PCE parameter in the existing model indicated that the use of the current proxy for allocating space costs increased heavy vehicle charges by approximately 4%. The Working Group also notes that: • The space-related parameter captures the increased road space incurred by heavy
vehicles slowing traffic on steep roads; and • The continued increase in engine performances has resulted in heavy vehicles
being able to travel faster on steep grades. This would justify lowering the existing proxy PCE value for heavy vehicles.
11 70% × 1 powered vehicle + 30% × 20 tonnes (GVW) = 6.7 PCEs
THIS IS NOT APPROVED GOVERNMENT POLICY 22
Review of the Cost Allocation Model 3 April 2001
6.3 Conclusion The Working Group recommends the inclusion of a space allocator into the model. This would allow better allocation of the road costs and provide more transparency as to how the costs have been allocated. The Working Group would also recommend that the following formula be used for calculating PCEs:
For powered vehicles PCE = 0.875 + GVW / 8 For unpowered vehicles PCE = GVW / 8 This formula is derived from international research and the formula used in the 1977 Cost Allocation Model.
THIS IS NOT APPROVED GOVERNMENT POLICY 23
Review of the Cost Allocation Model 3 April 2001
7. Theoretical Recovery of Use Related Costs The following explains how the ‘cost allocation principles’ (set out in chapter 4) would relate to roading construction and maintenance.
7.1 Construction Road construction is driven by the need to reduce congestion, reduce road accidents and provide a more direct route. But it is unclear whether these factors result directly from increased vehicle use, as although road construction aimed at reducing congestion is clearly a use related cost, safety related construction costs are not clearly use related as they can be brought forward by a spate of random accidents. However, the government currently funds road construction in New Zealand if the benefits are at least four times the costs. The benefits relate to vehicle operating cost reductions, accident cost reductions, timesavings and other benefits. These benefits are determined not only by current but also future benefits. The level of future benefits is, in turn, determined by the level of traffic growth. Therefore, given the way current construction projects are brought forward, the Working Group considers all road construction costs (including safety related construction costs) should be treated as use-related costs. The two main construction categories are new roads and new bridges. 7.1.1 New Roading Costs arising from new roads designed to reduce congestion should be treated as use-related for the reasons given above.
New roading consists of a number of expenditure items including earthworks, land purchases, drainage, footpaths and pavement construction. Within pavement construction, costs can be further categorised as either ‘base facility’ or ‘strength-related’. The base facility is the amount of common pavement construction required for the use of all vehicles. This equates to the surfacing and foundations necessary for ‘light’ vehicle use. Strength-related costs are the costs required to take the projected loading for the road. The projected loading is based on the number of ESA’s12 that will be travelled on the road. Therefore, the additional strength-related costs could be directly attributed to the heavy vehicle (vehicles over 3.5 tonnes) ESA vehicle characteristic13 (i.e. none of the additional strengthening costs are attributed to light vehicles). The Working Group considers all other new road costs, including the base facility pavement costs, are incurred primarily as a result of light vehicle traffic growth. Therefore, these costs can be attributed to either space requirements of vehicles (PCE) or vehicle driver costs (PV).
12 Equivalent Design Axles – see definition in Chapter 5. 13 This is a version of the “runway” method with only two classes, light and heavy vehicles.
THIS IS NOT APPROVED GOVERNMENT POLICY 24
Review of the Cost Allocation Model 3 April 2001
7.1.2 New Bridge Construction There are two main cost components to be considered: • The factors causing the bridge construction to be brought forward; and • The need to strengthen the bridge in order to be used by heavy vehicles. Thus:
• Costs arising from the need to build the bridge should be termed the base facility
costs and allocated to vehicle space characteristic (PCE) or vehicle driver costs (PV); and
• Costs arising from the need to strengthen the bridge to carry heavy vehicles should be attributed to the heavy vehicle weight characteristics (GVW)14 (i.e. none of the additional strengthening costs should be attributed to light vehicles).
7.2 Road Maintenance (pavement maintenance) Pavement maintenance15 is required primarily as a result of structural deformation caused by vehicle loads and the weather. Load-related costs should be use-related as they are “occasioned” each time a vehicle uses the road. Weather-related effects, such as slips, are not related to vehicle use and, therefore, should be treated as a residual cost. Secondary pavement maintenance not due to structural deformation, such as surface road wear, is a minor use-related cost. Load related structural deformation is primarily caused by the continued stress of axle loads on the roading structure. This proportion of maintenance costs should be allocated to the vehicle axle-loading characteristic (ESA). The non-deformation pavement maintenance costs should be allocated to vehicle weight (GVW). The drainage component of pavement maintenance is weather-related and should be, therefore, treated as a non vehicle-related i.e. residual cost. However, a proportion of drainage costs should be allocated to heavy vehicles as the level of drainage on the road could be reduced if heavy vehicles were not using the roading system. The shoulder maintenance component relates to unsealed shoulders on sealed roads. This cost component should be split between vehicle use-related and non vehicle related ie residual costs.
14 This is a version of the “runway” method with only two classes, light and heavy vehicles. 15 Pavement maintenance also includes the sub-categories drainage and shoulder maintenance.
THIS IS NOT APPROVED GOVERNMENT POLICY 25
Review of the Cost Allocation Model 3 April 2001
8. Allocation of Costs in the Cost Allocation Table Allocating costs within the cost allocation table is hindered by the variation in road expenditure around New Zealand. Variations in road types, geography, and vehicle usage patterns results in significantly different expenditure patterns. In addition, there is limited research available giving guidance on allocating road costs. The Working Group commissioned OPUS International Consultants (a road engineering consultancy firm) to review the 1984 allocation table. OPUS used best judgement and a Delphi session with local government and Transit New Zealand engineers to allocate costs. Unfortunately, the Working Group was not completely comfortable with the underlying economic theory OPUS had used in the process. In order to review the OPUS figures, and re-allocate those costs that were not directly transferable into the proposed Working Group framework, roading engineers from Transit New Zealand and local authorities in both the North and South Island reviewed, and where necessary re-allocated, the costs into the Working Group framework following further work on the underlying economic theory. These roading engineers were asked to: allocate those roading costs caused through vehicle use to a use-related vehicle
cost characteristic; allocate those costs not caused through vehicle use to residual costs;
allocate road construction costs on the basis that the ‘base facility’ costs are
attributed to driver costs or capacity costs and any additional strengthening costs required for heavy vehicles should be allocated to heavy vehicles (i.e. ESA for pavement strengthening and GVW for bridge strengthening).
The Working Group subsequently reviewed the allocation of the ‘base facility’ costs as discussed in section 7.1.1 and 7.1.2.
8.1 Weighting Road Charges by Road Usage (weighted incremental costs) The Cost Allocation Model could be improved by weighting road charges for the average road type used by different vehicle classes. This would ensure that vehicle types that, on average, use higher cost roads would face a higher charge than those that, on average, use lower cost roads. This is equivalent to obtaining use-related charges that are closer to the average marginal cost of the road type used for the different vehicle types. However, because there is a lack of reliable information on vehicle type usage on the different road types, it is not possible to calculate the RUC charges in this manner. Furthermore, the value of weighting the charges by road type is diminished by the fact that RUC can only distinguish vehicle types by the axle configuration and not by
THIS IS NOT APPROVED GOVERNMENT POLICY 26
Review of the Cost Allocation Model 3 April 2001
vehicle purpose (i.e. logging, dairy etc) as road usage patterns are likely to differ more by vehicle purpose than by axle configuration.
THIS IS NOT APPROVED GOVERNMENT POLICY 27
Review of the Cost Allocation Model 3 April 2001
9. Allocation of Fixed Revenue The cost allocation model is designed to allocate costs to vehicle classes in order to provide guidance on appropriate rates for RUC and FED. However, RUC and FED are not the only sources of revenue for the NRF. Motor Vehicle Registration and licensing provides around $160 million16 in revenue to the NRF and is not dedicated to any particular expenditure category. The Motor Vehicle Registration (MVR) fees are described as “fixed” revenue because they do not vary with road use. The way monies are expended from the NRF also impacts on another “fixed” revenue source. All local authority roading expenditure paid for by NRF monies must be matched by contributions from local authorities themselves. In 1998/99 local authorities contributed approximately $270 million17 of their own primarily rates revenue to projects part-funded from the NRF. The model accounts for these revenues sources in the following manner.
9.1 Vehicle Licence Fees 9.1.1 Revenue Source A total of $185 million is collected in revenue from motor vehicle licensing, vehicle registrations, ACC collection fees and revenue earned by the Transport Registry Centre (TRC) through associated MVR fees. The MVR revenue can be attributed to the following sources: • $137 million (76%) from vehicle licensing (MR1); • $27 million (15%) from vehicle registrations (MR2); • $6 million (3%) change of ownership; • $6 million (3%) from ACC collection fees; and • $5 million (3%) trading revenue by the TRC Vehicle licensing, registration, ACC collection and change of ownership revenues can be allocated directly to vehicle types. TRC trading revenue was proportioned on the basis of the licensing revenue. On this basis, the Working Group estimates that light vehicles provide 95% of motor vehicle registration and licensing revenue and heavy vehicles, the remaining 5%, as detailed below: Forecast MVR Revenue Gross and Net by Source ($ million), 1998/99 MR1 MR2 Other* Gross Costs Net Percent Light 130.2 25.9 16.2 172.2 19.0 153.2 95% Heavy 6.9 1.1 0.9 8.8 1.0 7.8 5% Total 137.0 27.0 17.0 181.0 20.0 161.0 100% *Other includes change of ownership, ACC collection fees and TRC trading revenue.
16 Net revenue is calculated as gross revenue less the cost of collecting the revenue. In 1998/99 total gross licence fee revenue was $185 million and the cost of collecting the fees was $23 million. 17 The local authority contribution is for that roading expenditure that attracts the Transfund subsidy. Additional local council rates on roading expenditure that does not include the subsidy is not included as part of the analysis.
THIS IS NOT APPROVED GOVERNMENT POLICY 28
Review of the Cost Allocation Model 3 April 2001
9.1.2 Allocation of the Revenue Licensing revenue is not use-related, as vehicles that travel greater distances pay the same amounts. Consequently, the Working Group considers that the licensing revenue should be used to offset residual costs. 9.1.3 Future Use of the Motor Vehicle Registration and Licensing Fees The Working Group has not considered the appropriateness of the current means by which roading revenue is collected. These issues tie into much broader issues that are being considered by the Government separately in relation to road management, road safety and road charging. However, the Working Group notes that the Motor Vehicle Registration and Licensing fees are currently an input into – rather than an output from - the cost allocation model. This is highly unusual for a model that is meant to identify appropriate charges. Subject to any decisions the government takes on these broader matters outlined above as they impact on the Motor Vehicle Registration and Licensing fees, the Working Group recommends that these fees – and any dedicated expenditure – either be removed from the model or made an output from the model. The Working Group further notes that use of a fee like the Motor Vehicle Licensing fee would provide another option for recovering residual costs. In effect, it would allow the direct recovery of costs via a per-vehicle fee (Option 1 discussed in Chapter 10). The Working Group notes there may be strong economic arguments for the use of such a fee, but there are also likely to be equity, safety and enforcement implications to consider which may counter-balance the economic arguments.
9.2 Allocation of Local Authority Expenditure and Associated Rates Revenue In the 1983/84 version of the cost allocation model, local authority roading expenditure was included for the first time and the resulting rates revenue was deducted prior to the charge levels being calculated. The 1996 Starrs independent review criticised the proposed allocation of this expenditure in the model. The Starrs report argued that excluding this expenditure was more in line with international practice. The report recommended that local authority expenditure be excluded, or rate revenue deducted from total costs in a manner that is neutral between vehicle types. A report prepared by Outcome Consultants in late 1999 for the Working Group reached a similar conclusion. Outcome argued that the inclusion of local authority expenditure was inconsistent with cost recovery principles and inconsistent with the way in which the Government had clearly decided roads should be funded.
THIS IS NOT APPROVED GOVERNMENT POLICY 29
Review of the Cost Allocation Model 3 April 2001
The inclusion of this expenditure/revenue in the model has the effect of shifting more of the burden of charges onto heavier vehicles and away from light vehicles. Recent modelling indicates the inclusion or non inclusion of this expenditure and revenue could have a significant impact on light versus heavy vehicle charges. 9.2.1 Comment The Working Group agrees that it is inconsistent to include third party expenditure in a cost recovery model, only to net it out again. Consequently, it recommends that local authority expenditure be excluded from the model. However, in determining the efficient and equitable allocation of costs to different vehicle classes, the question is whether account should be taken of the use-related costs incurred by different vehicle classes across the public roading network. Public roading costs are recovered through four primary mechanisms: two use-related charges (i.e. fuel excise duty and Road User Charges) and two non-use-related charges (i.e. motor vehicle registration and licensing fees and local authority rates). The Crown funds all State Highway costs and on average 50% of local authority roading costs, through the first three mechanisms. Local authorities use rates to fund their share of the remainder. Crown and local authority roading expenditure is, therefore, heavily interlinked. The cost allocation model is set up to recover the Crown’s roading costs through RUC and fuel excise duty. Motor vehicle registration and licensing fees are treated as an input to the model. Economic theory indicates that road users should be charged the marginal cost of their use. Exact marginal cost pricing is not possible given informational gaps and practical constraints. But advice from Capital Economics to the Working Group indicates that different vehicle classes should be charged at least their average use-related costs through use-related charges. Further, no vehicle class should be charged less than their incremental costs. The difficulty with excluding local authority expenditure is the uncertainty it exacerbates regarding the above. Removing local authority expenditure and revenue from the model arguably increases the risk that some vehicle classes may be charged less than their average use-related costs and possibly, their incremental costs via use-related charges. In contrast, the relative burden being borne by road users in relation to the share of costs they are bearing through these “fixed” means, ie rates is largely unknown. Efficient pricing requires that all users pay their marginal cost. The Working Group received advice that average use related costs can be used as a proxy for marginal costs although they may result in an underestimate. Therefore, the Working Group explored two possible refined options: (i) In this first option the total expenditure in each work category, including the
local funded share, is used to determine average use related costs as a proxy for marginal costs. The model calculates the total revenue from charging
THIS IS NOT APPROVED GOVERNMENT POLICY 30
Review of the Cost Allocation Model 3 April 2001
prices based on these costs. This leaves a shortfall in the total amount required to be recovered to fund the NRF. The balance would be obtained by programming the model to mark up the marginal cost based prices in a way that has the least effect on road users’ trip making decisions (See section 10).
(ii) In this second option, average use related costs and residual costs for local
roads could be based on the NRF funded portion of the local road expenditure. Charges are calculated to recover these costs. These charges are compared with the full average use related costs calculated in option (i). Any vehicle classes with charges lower than the full average use related costs would then have their charge levels increased to these levels and the residual allocation on remaining vehicle classes would be reduced.
Both options would ensure that all vehicle classes were paying at least their use-related costs through use related charges. Option (i) could be seen as introducing local authority expenditure indirectly into the model through RUC or FED. Option (ii) would only use local authority expenditure to develop a form of check on charge levels. Option (ii) could be seen as resulting in some vehicle classes possibly not paying any of the residual costs (their indirect payment of these costs through rates remain unclear). Option (i) would ensure that all vehicle classes pay a share of residual costs through RUC and FED (in addition to what they might be paying indirectly through rates). Advice from the international peer reviewers, PHB Hagler Bailly, indicated that a decision relating to this issue is governed by two factors: • the implication of a cost recovery regime. • the implications for economic efficiency. If a strict cost recovery approach was adopted then neither option (i) or (ii) would be acceptable as both potentially increased the risk of double/over charging of individual users. While PHB Hagler Bailly did not favour this approach, it acknowledged that if this were a substantial risk then removing such expenditure altogether would be the only acceptable option. If greater account was taken of economic efficiency principles, PHB Hagler Bailly recommended that RUC and FED should be used to recover all use-related costs. Option (i) was PHB’s strongly favoured option. Consequently the Working Group has now received three external sets of advice on this issue, two opposing any exclusion of rates funded local authority expenditure and one favouring an option that would include rates funded local authority use-related expenditure for setting RUC and FED. On further reflection, the Working Group considers that there are two options for dealing with local authority rates expenditure:
THIS IS NOT APPROVED GOVERNMENT POLICY 31
Review of the Cost Allocation Model 3 April 2001
(i) The local authority use-related expenditure funded by rates could be included in the model for the purpose of calculating average use-related costs. The over-recovery of total costs would be avoided by netting off an equivalent amount off residual costs. The model would consequently recommend levels for RUC and FED based on average use-related costs across the publicly funded roading network and the remaining residual costs (Option (i) as described previously).
(ii) The local authority use-related expenditure funded by rates could also be
excluded entirely from the model. The model would consequently recommend levels for RUC and FED based on the average use related and residual costs for the State Highway system and half of the average use-related and residual costs for the local roading system.
Working Group members are concerned that option (ii) would result in some vehicle classes (notably heavy vehicles) paying significantly less than their average use-related costs across the roading network. All vehicle classes should be charged at least their use-related costs across the public roading network via use-related mechanisms. If reflected in RUC charges, option (ii) could result in over-use of local roads – and higher costs – by heavy vehicles than would be justified. Option (i) also requires less of a change to the current model. The current model – as a result of a change in 1984 - includes rates expenditure, albeit in a much blunter manner. On this basis, the Working Group recommends option (i). However, the Working Group notes that option (i) while recovering the same quantum of costs as option (ii) would result in the Crown recovering a different set of costs (ie some costs actually incurred by local authorities) than the costs it is actually incurring, as the existing model has done since 1984. In essence, option (i) results in roads being charged in a manner different to the way the revenues are being spent. The Working Group notes that previous legal advice indicates that the Road User Charges Act 1977 is drafted as a taxation statute and Parliament can ultimately determine appropriate levels of RUC as it deems fit. Therefore, there would appear to be no legal barrier to option (i). The Working Group notes that more recent legislation imposes a more rigorous obligation on the Crown to justify what is charging in many other areas (of which the sale of fishing quotas is one). Were such legislation to be applied to the RUC system at some time in the future, then option (i) would be difficult to justify unless it was matched by equivalent changes to the way roads are funded. In addition, the Working Group notes that option (i) assumes that the use-related costs incurred by local authorities are determined solely by vehicle use as opposed to local authorities’ own decision-making. This is not likely to be completely true. To the extent it is not, option (i) raises the risk of road users being charged for costs which should ideally be borne by local authorities. Option (i) raises these risks because it tries to deal with the results of the problem - the under charging of heavy vehicles on local roads - rather than the cause of the
THIS IS NOT APPROVED GOVERNMENT POLICY 32
Review of the Cost Allocation Model 3 April 2001
problem - the use of rates to fund 50% of local roading costs - which is external to the model. While outside the scope of the review, the Working Group, the use of rates to fund half of local roading costs results in: • a different charging regime for local roads as opposed to State Highways that
cannot be fully explained by governance or economic factors • the use of local authority rates to fund use-related costs imposed by vehicles
which is almost certainly inefficient • a significant policy barrier to charging heavy vehicles for the roads they actually
travel on, if this is ever desired at some point in the future. In conclusion, while the Working Group recommends option (i) as it is likely to lead to a more efficient outcome than option (ii), the Working Group notes that: (i) Although this option would appear closer to an economically efficient
outcome, it is not ideal as it cannot deal with the cause of the problem, ie the use of rates funding to fund local authority roading costs. This problem can only be dealt with by significant changes to the ways in which public roads are funded, which is outside the scope of this review;
(ii) As this option does not match actual Crown expenditure with
recommendations on actual charges set by the Crown, this option (i) would almost certainly require reconsideration should stricter cost recovery principles ever be adopted for the collection of RUC, unless it was matched by equivalent changes to the way roads were funded.
THIS IS NOT APPROVED GOVERNMENT POLICY 33
Review of the Cost Allocation Model 3 April 2001
10. Allocation of Residual Costs The separation of residual costs from those costs that can be directly related to vehicle use appears strongly justifiable from a theoretical and public policy perspective. Costs that cannot be attributed directly to use should be transparently identified and allocated via separate means. But modelling by the Working Group indicates the means of allocating such costs could impact significantly on road charge levels, given that residual costs are estimated to account for around 40% of total roading costs in the recommended new model. Consequently, the decision as to how these costs are allocated will be critical in determining appropriate charges. There is a range of options for allocating residual costs with varying efficiency, equity and administrative implications, with the following three the most apparent: (i) A per vehicle allocation Residual costs could be allocated on a straight per-vehicle basis (eg $100 per vehicle). This approach would assume that heavier vehicles had higher responsiveness to changes in prices (ie higher price elasticities of demand) than lighter vehicles and that it is equitable for users to be charged these costs based on their registered ownership of a vehicle used on public roads. (ii) A per vehicle kilometre allocation Residual costs could be allocated on a per vehicle kilometre rate added to all vehicle classes (eg $0.10 per vehicle km). This approach would assume that heavier vehicles had higher responsiveness to changes in prices than lighter vehicles but not to the same extent as the option (i) above and that it was equitable for users to be charged their share of these costs according to their amount of road travel. (iii) A proportional mark-up allocation Residual costs could be allocated on an equivalent proportional mark-up basis, whereby each vehicle class’ total average use-related costs would be marked up by a set percentage, say 30%, to ensure that all these residual costs were recovered. This approach would assume that all vehicle classes had the same responsiveness to changes in prices and that it was equitable for users to be charged residual costs based on their share of use-related costs.
10.1 Efficiency The economic principles outlined earlier advocate the allocation of residual costs in the manner least distortionary to use. As was discussed previously, economists have long argued that Ramsey pricing – ie application of the “inverse elasticity rule” – is a way of achieving this.
THIS IS NOT APPROVED GOVERNMENT POLICY 34
Review of the Cost Allocation Model 3 April 2001
Applying the inverse elasticity rule to the application of residual costs would involve calculating/researching the price elasticities of demand for different vehicle classes and allocating residual costs via an inverse proportion of these elasticities. Vehicle classes with higher elasticities (ie a greater responsiveness to price changes) would bear a lower proportion of residual costs than vehicle classes with lower elasticities. In practice, the Working Group understands that while some estimates tend to show higher elasticities for heavier vehicles they are subject to wide ranges of error. Recent estimates provided to the World Bank vary from 0.1 to 1.1 for a car, 0.1 to 1.3 for a bus and 0.7 to 1.1 for a truck. Nevertheless, some economists have argued that given the nature of the heavy vehicle industry, much of it revolving around the movement of freight, it was appropriate to assume higher elasticities for heavy vehicles in light of the “intermediate good” nature of freight. On this basis, there may be justification for adopting an allocation approach that assumes this. However, recent economic work provided to the Working Group has cast some doubt on the relative efficiency impacts of inverse elasticity pricing. While such Ramsey-based pricing appears to be an excellent way of maximising revenue, its efficiency impacts are less clear. Small changes in elasticities can cause large shifts in the allocation of residual costs and therefore total charge levels, but may have an ambiguous impact on efficiency. In essence, such changes can create big winners and losers but with limited changes in total economic welfare.
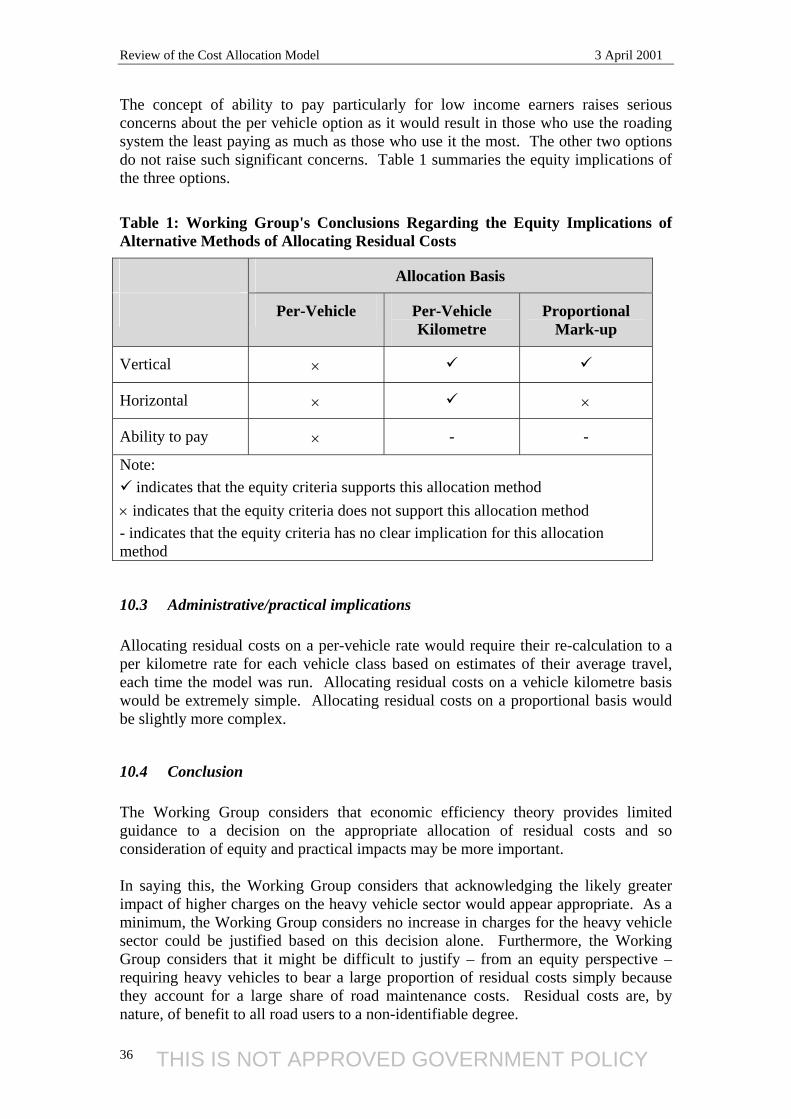
10.2 Equity Although interpretations of equity can differ, three interpretations are readily apparent: (i) The concept of vertical equity ie the more you use the more you should pay (ii) The concept of horizontal equity ie those with the same use/costs should pay the same amounts (iii) The concept of ability to pay ie those on lower incomes should pay less than those on higher incomes for equivalent use. As is evident, these interpretations can conflict but collectively they can assist in analysing the options. The concept of vertical equity appears to favour allocating residual costs on a per vehicle kilometre or proportional basis over allocating them on a per vehicle basis as the former two would result in those who use roads more paying more, whereas the latter would not. However, the question arises as to whether it is equitable for those vehicles who cause more damage, but use roads only as much as others, should pay a share of residual costs according to their use and damage or just their use of the road system. The concept of horizontal equity appears to favour allocating residual costs on a per vehicle kilometre basis over the other two methods as this option would result in those who use the roads the same amount paying the same share, whereas the other options would not.
THIS IS NOT APPROVED GOVERNMENT POLICY 35
Review of the Cost Allocation Model 3 April 2001
The concept of ability to pay particularly for low income earners raises serious concerns about the per vehicle option as it would result in those who use the roading system the least paying as much as those who use it the most. The other two options do not raise such significant concerns. Table 1 summaries the equity implications of the three options.
Table 1: Working Group's Conclusions Regarding the Equity Implications of Alternative Methods of Allocating Residual Costs
Allocation Basis
Per-Vehicle Per-Vehicle Kilometre
Proportional Mark-up
Vertical ×
Horizontal × ×
Ability to pay × - -
Note: indicates that the equity criteria supports this allocation method
× indicates that the equity criteria does not support this allocation method - indicates that the equity criteria has no clear implication for this allocation method
10.3 Administrative/practical implications Allocating residual costs on a per-vehicle rate would require their re-calculation to a per kilometre rate for each vehicle class based on estimates of their average travel, each time the model was run. Allocating residual costs on a vehicle kilometre basis would be extremely simple. Allocating residual costs on a proportional basis would be slightly more complex.
10.4 Conclusion The Working Group considers that economic efficiency theory provides limited guidance to a decision on the appropriate allocation of residual costs and so consideration of equity and practical impacts may be more important. In saying this, the Working Group considers that acknowledging the likely greater impact of higher charges on the heavy vehicle sector would appear appropriate. As a minimum, the Working Group considers no increase in charges for the heavy vehicle sector could be justified based on this decision alone. Furthermore, the Working Group considers that it might be difficult to justify – from an equity perspective – requiring heavy vehicles to bear a large proportion of residual costs simply because they account for a large share of road maintenance costs. Residual costs are, by nature, of benefit to all road users to a non-identifiable degree.
THIS IS NOT APPROVED GOVERNMENT POLICY 36
Review of the Cost Allocation Model 3 April 2001
The Working Group notes the impact of allocating residual costs on a straight per-vehicle basis could be relatively severe on infrequent road users and low income earners (an increase of between $120 and $170 per vehicle could be the result). The Working Group considers recovering residual costs on a vehicle kilometre basis is the only option that meets at least two out of the three equity criteria. This option would have less adverse impact on heavy vehicles than a proportional allocation and less impact on light vehicles than a per-vehicle allocation, and reflect the vehicle equity principle, that payments should relate directly to use. It would also be the most simple and transparent means of allocating such costs. On this basis, the Working Group recommends the per-vehicle-kilometre approach. Allocating residual costs on a per vehicle kilometre rate would be the simplest, most transparent means of allocating such costs in the way that largely avoids the adverse impacts of the other options.
THIS IS NOT APPROVED GOVERNMENT POLICY 37
Review of the Cost Allocation Model 3 April 2001
11. Road Friendly Suspensions and Large Tyres
11.1 Road Friendly Suspensions A significant proportion of the New Zealand heavy vehicle fleet is equipped with air suspension systems. International research has found that properly designed and maintained air suspensions reduce the magnitude of dynamic loads the vehicle applies to the road. This results in less road wear, hence the term “road friendly suspension”. The Working Group asked Opus Consultants to determine what adjustments should be made to the cost allocation model, or its inputs, in order to calculate a special scale of RUC charges for vehicles equipped with road friendly suspensions. Opus Consultants concluded that for the pavement structural damage relationship, where road wear is proportional to the fourth power of applied load, a reduction in road wear of 15% can be used for road friendly suspensions with reasonable confidence. However, simply reducing the RUC rates for vehicles with road friendly suspensions would result in a shortfall of revenue. RUC rates for vehicles with conventional suspension systems would need to increase at the same time to be revenue neutral. The amount by which RUC rates would increase for conventional suspensions and decrease for road-friendly suspensions depends on the relative proportions they make up in the existing heavy vehicle fleet. The final RUC rate for vehicles with road-friendly suspensions will be less than 15% below the rate for conventional suspensions because other components of the RUC charge are not related to pavement wear. Based on the proportion of wear related costs to total costs, the overall difference in RUC charges is likely to be 3% – 5%. The percentage difference in RUC rate will be different for each vehicle type and for each GVW. This means that separate schedules of RUC rates will be required for vehicles with and without road-friendly suspensions, ie it will not be possible to simply have a uniform discount on the standard RUC rate. Opus Consultants recommended that only vehicles with road-friendly suspensions that meet an OECD standard should be eligible for the lower RUC rate and noted that road-friendly suspensions require on-going monitoring. The Working Group notes that the establishment of a separate RUC scale for vehicles with road friendly suspensions would require legislation. The introduction of such an additional element to the RUC system would also incur additional administration and enforcement costs, which were not investigated or quantified by the Working Group. The Working Group recommends that the government consider the merits and costs of introducing a separate RUC scale for vehicles with road friendly suspensions. The Working Group is aware that the government has asked the Ministry to investigate technological alternatives to the RUC system and the merits and costs of a separate RUC scale for road-friendly suspensions could be included in that work.
THIS IS NOT APPROVED GOVERNMENT POLICY 38
Review of the Cost Allocation Model 3 April 2001
11.2 Large Tyres Opus Consultants also provided advice to the Working Group on the possible creation of separate RUC rates for vehicles with single large tyres. After considering the relevant research, Opus found that reflecting the benefits of single large tyres versus ordinary single tyres (or the disbenefits of single tyres versus dual tyres), would have little impact on most RUC rates and therefore recommended that no changes be made to the RUC system to accommodate them. The Working Group agrees with this Opus advice and so recommends that no changes be made to the RUC system for this purpose.
THIS IS NOT APPROVED GOVERNMENT POLICY 39
Review of the Cost Allocation Model 3 April 2001
12. Recommendations on use of the model In light of the principles outlined in Chapter 3, the question is raised as to whether the results of all this work would justify a change in charges. The Working Group notes that this is the government’s decision. The Working Group further notes that the government is undertaking policy work in relation to road safety, passenger transport and road charging and management. In particular, any government decisions on matters such as the appropriate role of local authority rates for funding roads and future levels of funding for the National Roads Fund could have a significant impact on charge levels. The Working Group also notes that a few key changes recommended for the model have a significant impact on relative charge levels. These changes are: • The separation of residual costs into a separate category and their recovery off all
vehicle users • The treatment of local authority roading expenditure. The Working Group notes that application of refined cost recovery principles as opposed to substantial new research has driven these changes. To the extent they are driven by a greater focus on economic efficiency then there is a case for change. To the extent they are driven simply by different allocation of residual costs based on other criteria (e.g equity), then the grounds for change are not so strong. The Working Group concludes that the case for amending charges immediately as a result of this review alone is not necessarily absolute but the changes recommended for the model should make it a far more robust tool for providing advice on future charge levels. The Working Group also notes that the model is reliant on up-to-date roading expenditure data for providing up-to-date guidance on RUC and petrol excise levels. This is increasingly important given the changing nature of roading investment and changing vehicle technologies. For example, a greater proportion of funding is being directed at new investment resulting from congestion and away from maintenance, in light of savings made. The fuel efficiency of modern vehicles has also vastly improved in recent years and continue to improve such that fuel excise tax revenues are barely increasing on an annual basis despite traffic growth. The changes in RUC and FED announced in the 1998 Budget arose from a 3 year estimate – out until 2000/01 – of likely roading expenditure levels and traffic growth forecasts. Contrasting this are the administration and compliance costs associated with changing fuel excise duty and RUC. Changes to the latter in the 1998 Budget were criticised for this reason. On this basis, the Working Party notes the importance of ensuring the currency of the RUC and FED charge levels in relation to expenditure. The Working Party recommends that the revised model be used for determining future levels of charges when the government has completed its work on funding levels as outlined above, and at least every 3-5 years after that.
THIS IS NOT APPROVED GOVERNMENT POLICY 40
Review of the Cost Allocation Model 3 April 2001
13. Recommendations 1. In reviewing the cost allocation model, the Working Group assumed cost recovery
was the primary objective and efficiency and equity were secondary objectives. Use-related and Residual Costs 2. The Working Group recommends the allocation of all roading expenditure as
either:
i) Use-related costs: Those costs that can be attributed to vehicles (more correctly, vehicle characteristics) as a result of their use the roading system; or
ii) Residual costs: Those costs that can not be attributed to a vehicle cost characteristic.
Space Allocation Parameter 3. The Working Group recommends the inclusion of a space allocator (measured as
passenger car equivalents (PCE)) in the model 4. The Working Group recommends that the following formula be used for
calculating the PCE:
For powered vehicles PCE = 0.875 + GVW / 8 For unpowered vehicles PCE = GVW / 8 Capital Costs 5. The Working Group recommends that:
i) Capital costs should be split into the base facility costs and additional costs for road strengthening;
ii) Base facility costs should be allocated to the vehicle characteristics causing the construction to be brought forward; and
iii) The additional strengthening costs should be allocated to the vehicle characteristic that best reflects the need for the extra strength.
Motor Vehicle Registration and Licence Fees 6. The Working Group recommends that the revenue from the motor vehicle
registration and licence fees should be used to offset residual costs while it remains an input into the model.
7. The Working Group notes, in respect to the motor vehicle registration and licence
fees, that:
i) The fees are currently an input into, rather than an output from the cost allocation model, which is unusual for a model that is meant to identify appropriate charges;
THIS IS NOT APPROVED GOVERNMENT POLICY 41
Review of the Cost Allocation Model 3 April 2001
ii) Use of a fee like the Motor Vehicle Licensing fee would provide another option for recovering residual costs, however, there are also likely to be equity, safety and enforcement implications to consider; and
iii) The government is considering the future funding of roading which could affect motor vehicle registration and licence fees.
8. The Working Group recommends, subject to any government decisions, that the
motor vehicle registration and licence fees, and any dedicated expenditure, either be removed from the model or made an input into the model.
Local Authority Rates 9. The Working Group recommends the inclusion of local authority use-related costs
in the model as recommended by the international peer reviewers, PHB Hagler Bailly. In making this recommendation, the Working Group notes that the core problem is the use of local authority rates funding in funding roading which is outside the scope of the review.
10. The Working Group recommends that local authority residual roading expenditure
and associated rates revenue should be excluded from the model by subtracting this expenditure from the model residual costs.
Residual Costs 11. The Working Group recommends that the residual costs should be recovered on a
per vehicle-kilometre basis. The Working Group notes that this would have less adverse impact on heavy vehicles than a proportional allocation and less impact on light vehicles than a per-vehicle allocation, and reflect the vertical equity principle, that payments should be related directly to use.
Road Friendly Suspension and Large Tyres 12. The Working Group recommends that the government consider the merits of
introducing a separate scale for vehicles with road friendly suspensions alongside other policy work the government has asked the Ministry to undertake on technological alternatives to the RUC system.
13. The Working Group recommends that no changes be made to the RUC system to
account for large tyres. Cost Allocation Table 14. The Working Group recommends the adoption of the revised allocation table on
page 52, in light of work undertaken by the Working Group, Transit New Zealand engineers and local authority engineers.
Future Charges 15. The Working Group notes that a few key changes recommended for the model
have a significant impact on relative charge levels. These changes are:
THIS IS NOT APPROVED GOVERNMENT POLICY 42
Review of the Cost Allocation Model 3 April 2001
i) The separation of residual costs into a separate category and their recovery off all vehicle users
ii) The treatment of local authority roading expenditure. 16. The Working Group notes that the application of refined cost recovery principles
as opposed to substantial new research has driven these changes. Consequently, the case for amending charges as a result of this review alone is not necessarily absolute but the recommended changes to the model should make it a far more robust tool for providing advice on charge levels.
17. The Working Party recommends that the revised model be used for determining
future levels of charges when the government has completed its work on funding levels, and at least every 3-5 years after that.
THIS IS NOT APPROVED GOVERNMENT POLICY 43
Review of the Cost Allocation Model 3 April 2001
Appendix A: Cost Allocation Model The cost allocation model works in three parts as shown in figure 1. The three parts function as follows: • Part One allocates the expenditure in the National Roading Programme and Road
Safety Programme to vehicle characteristics (cost allocation parameters) and deducts fixed revenue.
• Part Two forecasts the total units of costs responsibility (i.e. the vehicle
characteristics of the entire fleet) that are driving the expenditure in Part One. • Part Three takes the cost allocation totals from Part One and divides them by the
total units of cost responsibility (calculated in Part Two) to obtain unit costs. Part One In order for the Cost Allocation Model to assign all costs to vehicle types, the vehicle characteristics (Chapter 5) that cause the road costs to be incurred are calculated (in Part Two). The current review used the following four vehicle characteristics: • Gross Vehicle Weight (GVW) to measure the strength imposed costs, such as
bridge strength; • Equivalent Standard Axle (ESA) to measure durability costs resulting from the
fourth power of the axle weights of vehicles, such as pavement wear • Passenger Car Equivalent (PCE) to measure the costs arising from the space
requirements of vehicles. • Power Vehicles (PV) to measure the driver imposed costs resulting from the need
to provide resources for motorists themselves (whether they be car or truck drivers). These include signs, road markings and landscaping;
Part Two For each cost component, the estimated annual total costs imposed by all vehicles on New Zealand roads are calculated in the model from information on vehicle types weights and kilometres travelled. The forecast roading expenditure, or part of the roading expenditure, is then assigned to the cost components. Some of the forecast roading expenditure can be easily assigned to roading costs. For example, annual pavement wear expenditure can be assigned to durability costs. Part Three Once all the costs are assigned to the four cost components, the roading expenditure per unit of cost component can be calculated (i.e. $/EDA, $/GVW etc). The costs can then be assigned to each vehicle type, by distance and weight, by multiplying the total number of cost components the vehicle imposes on the road by the per unit costs.
THIS IS NOT APPROVED GOVERNMENT POLICY 44
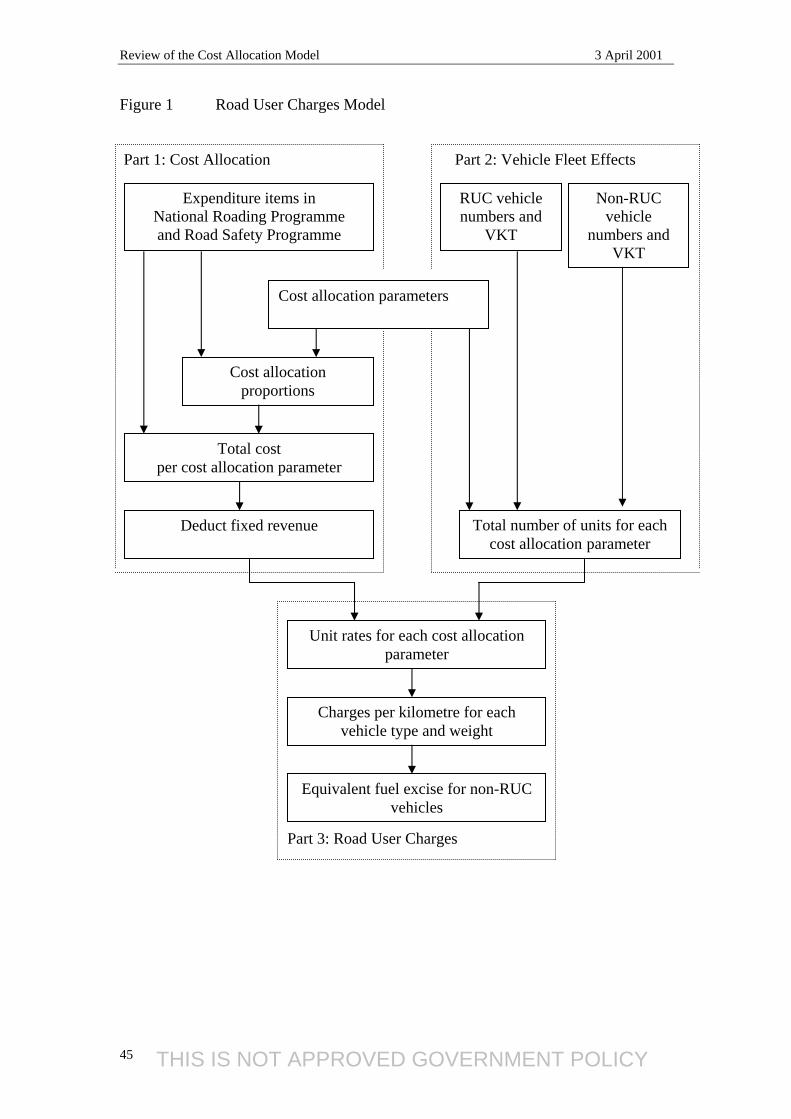
Review of the Cost Allocation Model 3 April 2001
Figure 1 Road User Charges Model Part 1: Cost Allocation Part 2: Vehicle Fleet Effects
Expenditure items in National Roading Programme and Road Safety Programme
Cost allocation parameters
Cost allocation proportions
Total cost per cost allocation parameter
Deduct fixed revenue Total number of units for each cost allocation parameter
RUC vehicle numbers and
VKT
Non-RUC vehicle
numbers and VKT
Part 3: Road User Charges
Unit rates for each cost allocation parameter
Charges per kilometre for each vehicle type and weight
Equivalent fuel excise for non-RUC vehicles
THIS IS NOT APPROVED GOVERNMENT POLICY 45
Review of the Cost Allocation Model 3 April 2001
APPENDIX B: Information Sources For Allocation of Costs B.0.1 New Zealand’s Roading Cost Allocation Model The Opus report provided an allocation of costs based on a split between use-related, fixed vehicle related and fixed non-vehicle related costs. The Working Group then re-allocated these costs into just use-related and residual categories. Differences between the approaches include: The Working Group use-related category includes capital costs brought forward
through vehicle use. Opus categorised fixed capital expenditure as fixed vehicle-related expenditure.
The Working Group classifies capital costs not brought forward through vehicle use (such as capital expenditure to reduce road accident costs) as residual, whereas, Opus classified such expenditure as fixed vehicle-related expenditure;
Opus classified a proportion of maintenance costs as fixed vehicle-related. The Working Group eliminated this latter category and so these maintenance costs were allocated to either the use related or residual categories.
B.0.2 Other Information Sources Information sources used to allocate these costs included: Roading Pricing and Cost Recovery: An Economic Point of View, Transport
Systems Centre, University of South Australia. This report presented the latest findings on the percentage of pavement costs that are attributable to heavy vehicle road wear in Australia. In particular, the report showed that:
There is not a liner relationship between road use and road wear, with
attributable road maintenance costs rising quickly from low levels of road use; Attributable road wear accounts for approximately 60% of pavement
maintenance costs and is attributable to ESA’s.
1997 Federal Highway Cost Allocation Study, U.S. Department of Transport Federal Highway Administration.
This Federal Highway study provided guidance as to the allocation of capital expenditure on roading and bridges;
Transit New Zealand Computer Modelling
Transit New Zealand undertook computer analysis (CIRCLY) of typical state highway designs of pavement costs with and without cars (as part of the review) to estimate the additional cost of pavement strengthening required for new roads
THIS IS NOT APPROVED GOVERNMENT POLICY 46
Review of the Cost Allocation Model 3 April 2001
to take heavy vehicles. This analysis showed that there was an 84% increase in pavement costs to strengthen roads for average truck movements18.
B.1 Allocation of Pavement Maintenance and New Road Expenditure A description of the allocation of two major costs items, pavement maintenance expenditure and new and reconstructed roads, is given below. Due to the large number of expenditure items, a description of the costs for all the remaining road expenditure items is given in Appendix F. B.1.1 Allocation of Pavement Maintenance Expenditure Pavement maintenance is the most significant road maintenance expenditure item at just over 15%19 of total road costs. To correctly allocate pavement maintenance expenditure, the category was broken down into 9 sub-categories for state highways and 10 sub-categories for local roads. The subcategories are: drainage, shoulders, sealed urban, sealed rural, unsealed rural, and, for local roads, unsealed urban. The urban and rural sealed components were further broken down into the following three subcategories based on the average daily traffic volume: less than 500 vehicles, between 500 and 2000 vehicles, and greater than 2000 vehicles. The proposed basis for the allocation of costs within these categories is as follows: Urban sealed: Maintenance on urban sealed roads is caused by two major factors:
weather damage and vehicle wear. On low volume roads, costs tend to be dominated by weather damage and, in particular, ultra-violet damage to the roading surface. In high traffic volume roads, the costs are dominated by road wear damage due to vehicle axle loads.
Rural sealed: Road maintenance on sealed rural roads is similar to that of urban
sealed roads except that the roads tend to carry a higher percentage of heavier vehicles and, therefore, have a higher percentage of costs allocated to ESA’s.
Unsealed urban and rural: A high percentage of maintenance costs is incurred on
unsealed roads as a result of weather damage. Therefore, the associated expenditure is classified as residual. The other main factor incurring maintenance expenditure is the movement of gravel from general vehicle use. The associated expenditure is therefore allocated to all vehicles through the powered vehicle cost characteristic.
Drainage: Maintenance of the drainage system is caused by the need to clear away
debris. However, providing additional strengthening to roads for heavier vehicles results in a higher level of on-going drainage maintenance costs. Therefore, 80% of drainage maintenance costs are classified as residual and the remaining 20% allocated to ESA’s.
18 This equates to 46% of new road pavement costs being incurred to strengthen the pavement for heavy vehicle use. 19 State highway pavement maintenance is 4.9% and local roads at 11.3% of total costs.
THIS IS NOT APPROVED GOVERNMENT POLICY 47
Review of the Cost Allocation Model 3 April 2001
Shoulders: The build-up of debris from the environment was identified as
contributing to 50% of the shoulder maintenance cost, and, therefore, was classified as a residual cost. Debris from general vehicle use accounted for 25% of costs and is, therefore, attributed to the powered vehicle cost characteristic. The remaining 25% of the cost is assigned to ESA on the basis of heavy vehicle damage to road shoulders.
The local and state highway allocations of pavement maintenance differ because: Different mixes of vehicles use the two roading systems. In particular, low
volume local roads are believed to have a higher percentage of light vehicle traffic compared with low volume state highways.
Urban local roads are subjected to a higher level of utility disturbance (i.e.
telephone cable, water and sewage pipe installation). The impact of this disturbance is believed to shorten the useful life of the roading surface and structure. Therefore, a higher percentage of pavement maintenance costs in urban areas is classified as residual.
B.1.2 New Roads and Road Reconstruction New roading and roading reconstruction costs represent 13.3% of total roading costs. Road reconstruction covers road realignments, regrading and widening. In order to allocate these costs, the causes behind the roading construction need to be identified (i.e. what is causing the need for the new road to be built). The cost of the roading infrastructure is then broken down into that required to accommodate light vehicles and the additional cost of accommodating heavy vehicles (Chapter 5 covers the theory for the allocation of the road costs and Chapter 7 covers the allocation of the base facility cost). Both new road and road reconstruction costs are broken down into the following three subcategories: Bridges: Transit New Zealand modelling indicates that the base facility cost of
new bridges on average, is 55% of the total cost. The remaining 45% is the additional strengthening required to allow heavy vehicles to use the bridge, and is allocated to GVW’s.
Pavement: Transit New Zealand modelling indicates that the base facility
pavement cost is 40% of the total cost. The remaining 60% of the pavement cost is attributable to EDA’s, as the cost is incurred to strengthening the road for heavy vehicles.
Land, formation, etc: All land and formation costs are attributed to the base
facility category, as these costs are incurred irrespective of heavy vehicle use.
THIS IS NOT APPROVED GOVERNMENT POLICY 48
Review of the Cost Allocation Model 3 April 2001
APPENDIX C: Allocation of Base Facility Costs An important issue in the allocation of roading construction costs is the allocation of base facility costs. For a new road or a road improvement the base facility costs would include property purchases, land formation and part of the pavement and bridge construction costs.
C.1 Background The Working Group proposes to allocate road construction costs on the basis of whether vehicle use brought the roading construction forward. Therefore, it has been agreed by the Working Group that: • The costs of projects that are built to ease congestion should be attributed to the
vehicle space characteristic - passenger car equivalent unit (PCE); • The costs of construction to improve safety should also be attributed to vehicle
use. This is because in project evaluations, the benefit/cost ratio depends on traffic volume and predicted traffic growth. Therefore, despite accidents being caused by random accidents, the benefit/cost ratio assumes future accidents increase in line with traffic so a higher traffic growth rate will bring forward the safety improvement project. Therefore, road safety construction costs should be allocated on a per vehicle (PV) basis; and
• The costs of road improvements which provide a more direct route, or a high-
speed bypass, should also be allocated on a per vehicle (PV) basis. The project benefits are proportional to the traffic volume. If predicted traffic growth increases, the project will be brought forward as the project’s benefit/cost ratio will reach the qualifying level sooner.
C.2 Analysis of Road Construction Costs Disaggregating construction costs according to whether they are addressing congestion, road safety problems and/or other causes is not currently possible, given the way roads are funded currently. Analysis of the benefits of roading construction (on which data is available), however, can help determine the underlying causes behind the construction, although such analysis is not necessarily straight forward20.
20 New road improvement projects are decided on the basis of a benefit/cost ratio with the benefits normally coming from more than one factor. This means that there is often no one reason for the roading construction. Congestion reduction is not a directly measured benefit. Instead, congestion benefits are measured in time savings and vehicle operating costs. Other construction projects that are not designed to reduce congestion also have benefits derived in the form of time savings and vehicle operating cost reductions. Realignments which create a more direct route, or high-speed bypasses of towns are examples of this. Therefore, it is difficult to separate out those projects designed to reduce congestion and those that are not.
THIS IS NOT APPROVED GOVERNMENT POLICY 49
Review of the Cost Allocation Model 3 April 2001
C.3 Proposed Methodology for Allocation The roading construction benefits currently evaluated by Transfund include: • Time benefits: time savings to the vehicle occupants in travelling over the new
roading facility; • Accident benefits: reduction in accidents as a result of the new roading facility; • Vehicle Operating Cost (VOC) benefits: the reductions in fuel and vehicle wear
costs; and • Other Benefits: there are primarily two types of other benefits: increased comfort
from sealing unsealed roads, and reduced frustration from provision of passing lanes.
In order to use the above to provide guidance as to how road construction costs should be allocated, these benefits need to be linked to the specific vehicle characteristics used in the model. In doing this the Working Group made the following assumptions: • All base facility costs relating to safety improvements should be allocated on a per
vehicle basis of PV as explained earlier. • Increased vehicle use increases the total time saving benefits from a project.
Therefore, the Working Group has assumed the associated construction costs are a use-related cost (i.e. the costs are brought forward through vehicle use). However: Roading construction projects creating a more direct route are assumed to be
brought forward through vehicle use on a per vehicle basis and, therefore, the cost should be allocated on a per vehicle basis (PV).
Roading construction projects relating to time savings through reduced congestion are assumed to be brought forward through vehicle use taking up physical space on the road. Therefore, roading related costs for these time saving benefits should be allocated on a PCE basis.
• VOC savings relate to vehicle use, as increased vehicle use directly increases
VOC. Therefore, the associated construction costs are assumed to be a use-related cost. In the same way as time savings, however, some VOC savings arise from projects providing a more direct route (most rural realignments), and others arise from projects relieving congestion (vehicles spend less time idling, stopping and starting). Therefore base facility VOC costs should also be split between PV and PCE depending on the primary purpose of the project.
• Other benefits are primarily of two types: increased comfort from sealing unsealed roads, and reduced frustration from the provision of passing lanes. There are almost no unsealed state highways. Therefore it is proposed that state highway base facility costs relating to other benefits be allocated on the basis of PCE as they are more likely to relate to the provision of passing opportunities, which are
THIS IS NOT APPROVED GOVERNMENT POLICY 50
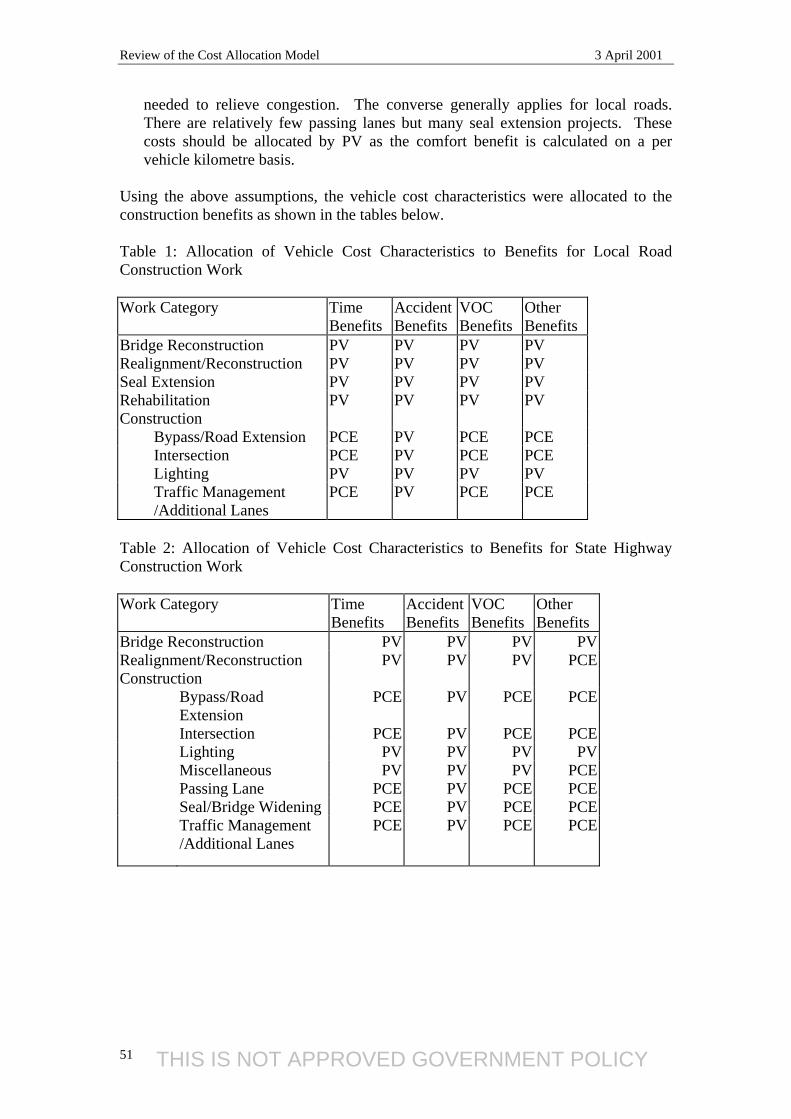
Review of the Cost Allocation Model 3 April 2001
needed to relieve congestion. The converse generally applies for local roads. There are relatively few passing lanes but many seal extension projects. These costs should be allocated by PV as the comfort benefit is calculated on a per vehicle kilometre basis.
Using the above assumptions, the vehicle cost characteristics were allocated to the construction benefits as shown in the tables below. Table 1: Allocation of Vehicle Cost Characteristics to Benefits for Local Road Construction Work Work Category Time
Benefits Accident Benefits
VOC Benefits
Other Benefits
Bridge Reconstruction PV PV PV PV Realignment/Reconstruction PV PV PV PV Seal Extension PV PV PV PV Rehabilitation PV PV PV PV Construction
Bypass/Road Extension PCE PV PCE PCE Intersection PCE PV PCE PCE Lighting PV PV PV PV Traffic Management /Additional Lanes
PCE PV PCE PCE
Table 2: Allocation of Vehicle Cost Characteristics to Benefits for State Highway Construction Work Work Category Time
Benefits Accident Benefits
VOC Benefits
Other Benefits
Bridge Reconstruction PV PV PV PV Realignment/Reconstruction PV PV PV PCE Construction
Bypass/Road Extension
PCE PV PCE PCE
Intersection PCE PV PCE PCE Lighting PV PV PV PV Miscellaneous PV PV PV PCE Passing Lane PCE PV PCE PCE Seal/Bridge Widening PCE PV PCE PCE Traffic Management /Additional Lanes
PCE PV PCE PCE
THIS IS NOT APPROVED GOVERNMENT POLICY 51
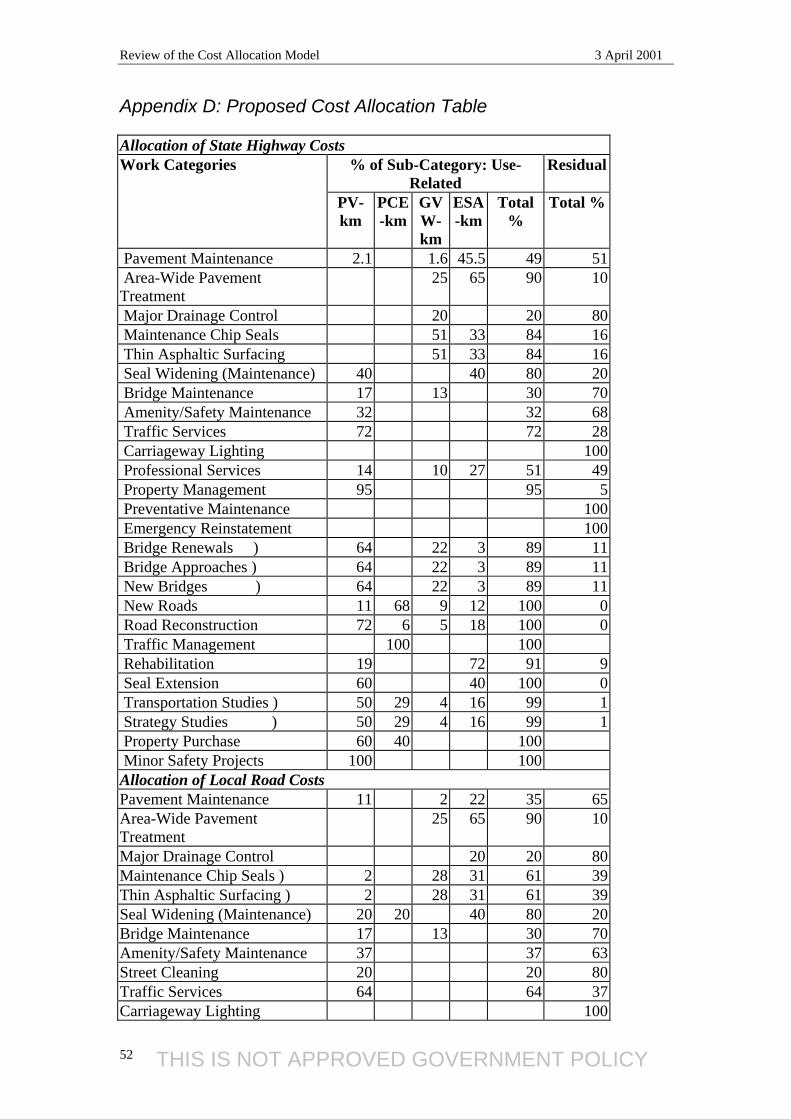
Review of the Cost Allocation Model 3 April 2001
Appendix D: Proposed Cost Allocation Table Allocation of State Highway Costs Work Categories % of Sub-Category: Use-
Related Residual
PV-km
PCE-km
GVW-km
ESA-km
Total %
Total %
Pavement Maintenance 2.1 1.6 45.5 49 51 Area-Wide Pavement Treatment
25 65 90 10
Major Drainage Control 20 20 80 Maintenance Chip Seals 51 33 84 16 Thin Asphaltic Surfacing 51 33 84 16 Seal Widening (Maintenance) 40 40 80 20 Bridge Maintenance 17 13 30 70 Amenity/Safety Maintenance 32 32 68 Traffic Services 72 72 28 Carriageway Lighting 100 Professional Services 14 10 27 51 49 Property Management 95 95 5 Preventative Maintenance 100 Emergency Reinstatement 100 Bridge Renewals ) 64 22 3 89 11 Bridge Approaches ) 64 22 3 89 11 New Bridges ) 64 22 3 89 11 New Roads 11 68 9 12 100 0 Road Reconstruction 72 6 5 18 100 0 Traffic Management 100 100 Rehabilitation 19 72 91 9 Seal Extension 60 40 100 0 Transportation Studies ) 50 29 4 16 99 1 Strategy Studies ) 50 29 4 16 99 1 Property Purchase 60 40 100 Minor Safety Projects 100 100 Allocation of Local Road Costs Pavement Maintenance 11 2 22 35 65 Area-Wide Pavement Treatment
25 65 90 10
Major Drainage Control 20 20 80 Maintenance Chip Seals ) 2 28 31 61 39 Thin Asphaltic Surfacing ) 2 28 31 61 39 Seal Widening (Maintenance) 20 20 40 80 20 Bridge Maintenance 17 13 30 70 Amenity/Safety Maintenance 37 37 63 Street Cleaning 20 20 80 Traffic Services 64 64 37 Carriageway Lighting 100
THIS IS NOT APPROVED GOVERNMENT POLICY 52
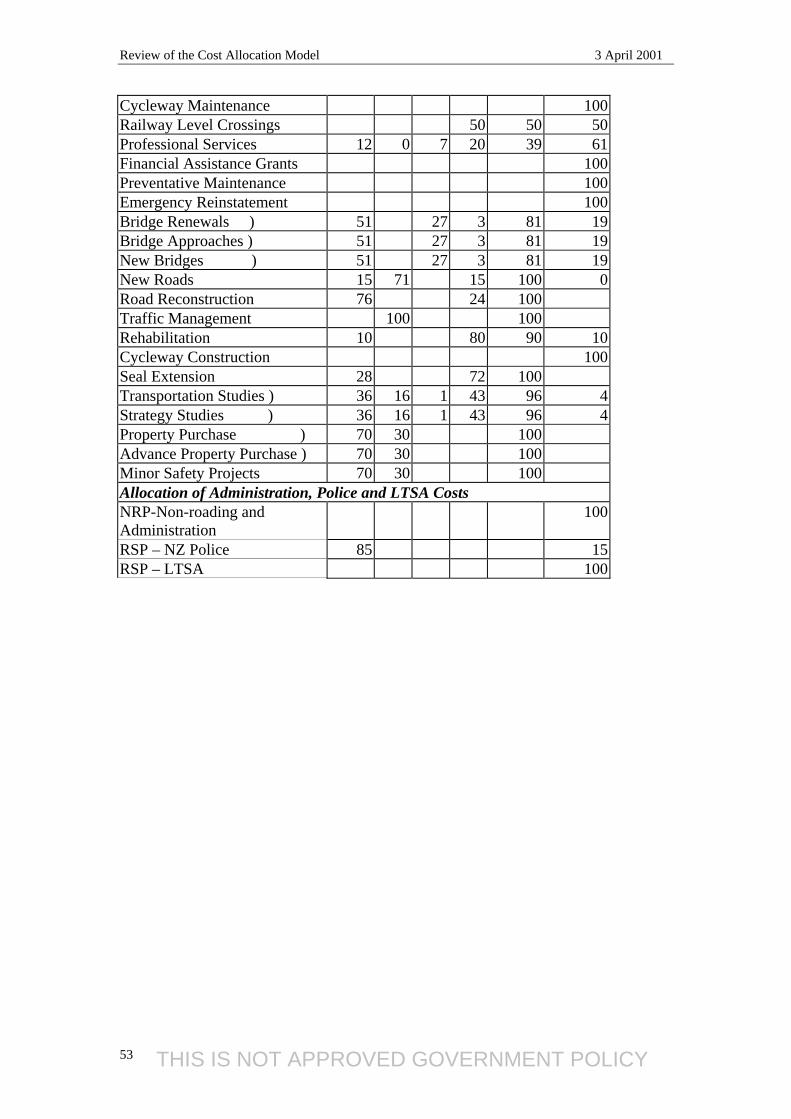
Review of the Cost Allocation Model 3 April 2001
Cycleway Maintenance 100 Railway Level Crossings 50 50 50 Professional Services 12 0 7 20 39 61 Financial Assistance Grants 100 Preventative Maintenance 100 Emergency Reinstatement 100 Bridge Renewals ) 51 27 3 81 19 Bridge Approaches ) 51 27 3 81 19 New Bridges ) 51 27 3 81 19 New Roads 15 71 15 100 0 Road Reconstruction 76 24 100 Traffic Management 100 100 Rehabilitation 10 80 90 10 Cycleway Construction 100 Seal Extension 28 72 100 Transportation Studies ) 36 16 1 43 96 4 Strategy Studies ) 36 16 1 43 96 4 Property Purchase ) 70 30 100 Advance Property Purchase ) 70 30 100 Minor Safety Projects 70 30 100 Allocation of Administration, Police and LTSA Costs NRP-Non-roading and Administration
100
RSP – NZ Police 85 15 RSP – LTSA 100
THIS IS NOT APPROVED GOVERNMENT POLICY 53
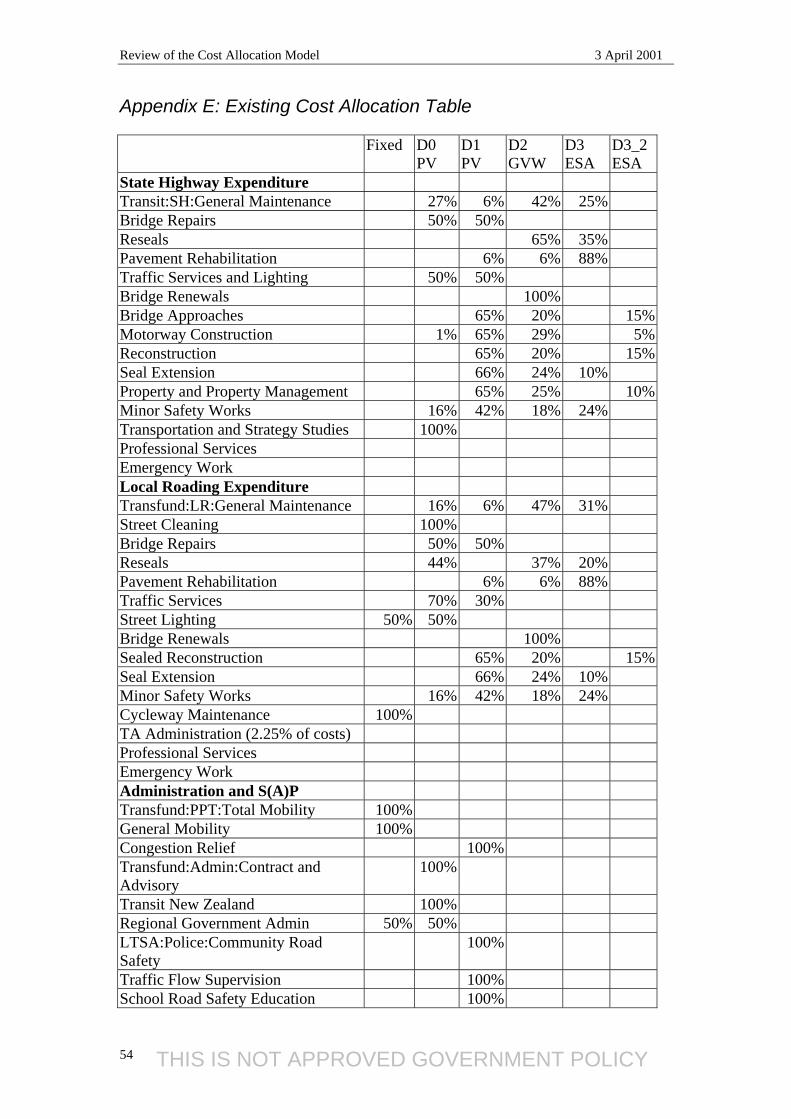
Review of the Cost Allocation Model 3 April 2001
Appendix E: Existing Cost Allocation Table
Fixed D0 PV
D1 PV
D2 GVW
D3 ESA
D3_2 ESA
State Highway Expenditure Transit:SH:General Maintenance 27% 6% 42% 25% Bridge Repairs 50% 50% Reseals 65% 35% Pavement Rehabilitation 6% 6% 88% Traffic Services and Lighting 50% 50% Bridge Renewals 100% Bridge Approaches 65% 20% 15%Motorway Construction 1% 65% 29% 5%Reconstruction 65% 20% 15%Seal Extension 66% 24% 10% Property and Property Management 65% 25% 10%Minor Safety Works 16% 42% 18% 24% Transportation and Strategy Studies 100% Professional Services Emergency Work Local Roading Expenditure Transfund:LR:General Maintenance 16% 6% 47% 31% Street Cleaning 100% Bridge Repairs 50% 50% Reseals 44% 37% 20% Pavement Rehabilitation 6% 6% 88% Traffic Services 70% 30% Street Lighting 50% 50% Bridge Renewals 100% Sealed Reconstruction 65% 20% 15%Seal Extension 66% 24% 10% Minor Safety Works 16% 42% 18% 24% Cycleway Maintenance 100% TA Administration (2.25% of costs) Professional Services Emergency Work Administration and S(A)P Transfund:PPT:Total Mobility 100% General Mobility 100% Congestion Relief 100% Transfund:Admin:Contract and Advisory
100%
Transit New Zealand 100% Regional Government Admin 50% 50% LTSA:Police:Community Road Safety
100%
Traffic Flow Supervision 100% School Road Safety Education 100%
THIS IS NOT APPROVED GOVERNMENT POLICY 54
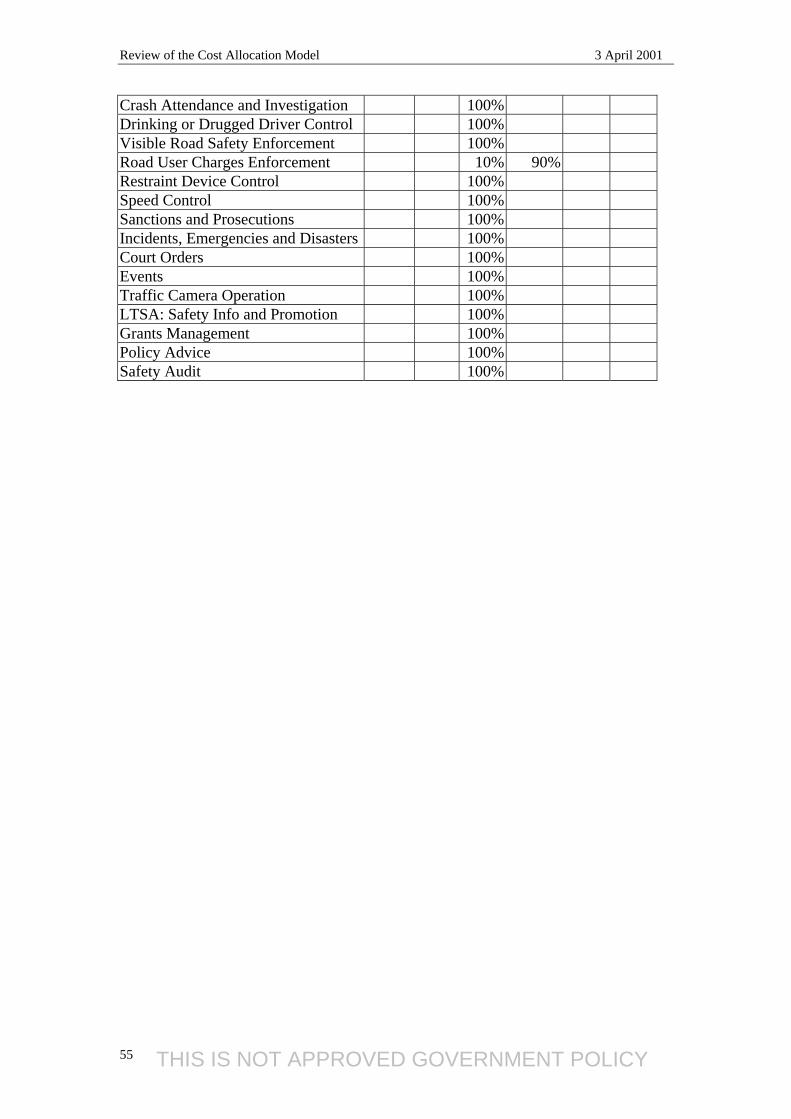
Review of the Cost Allocation Model 3 April 2001
THIS IS NOT APPROVED GOVERNMENT POLICY 55
Crash Attendance and Investigation 100% Drinking or Drugged Driver Control 100% Visible Road Safety Enforcement 100% Road User Charges Enforcement 10% 90% Restraint Device Control 100% Speed Control 100% Sanctions and Prosecutions 100% Incidents, Emergencies and Disasters 100% Court Orders 100% Events 100% Traffic Camera Operation 100% LTSA: Safety Info and Promotion 100% Grants Management 100% Policy Advice 100% Safety Audit 100%
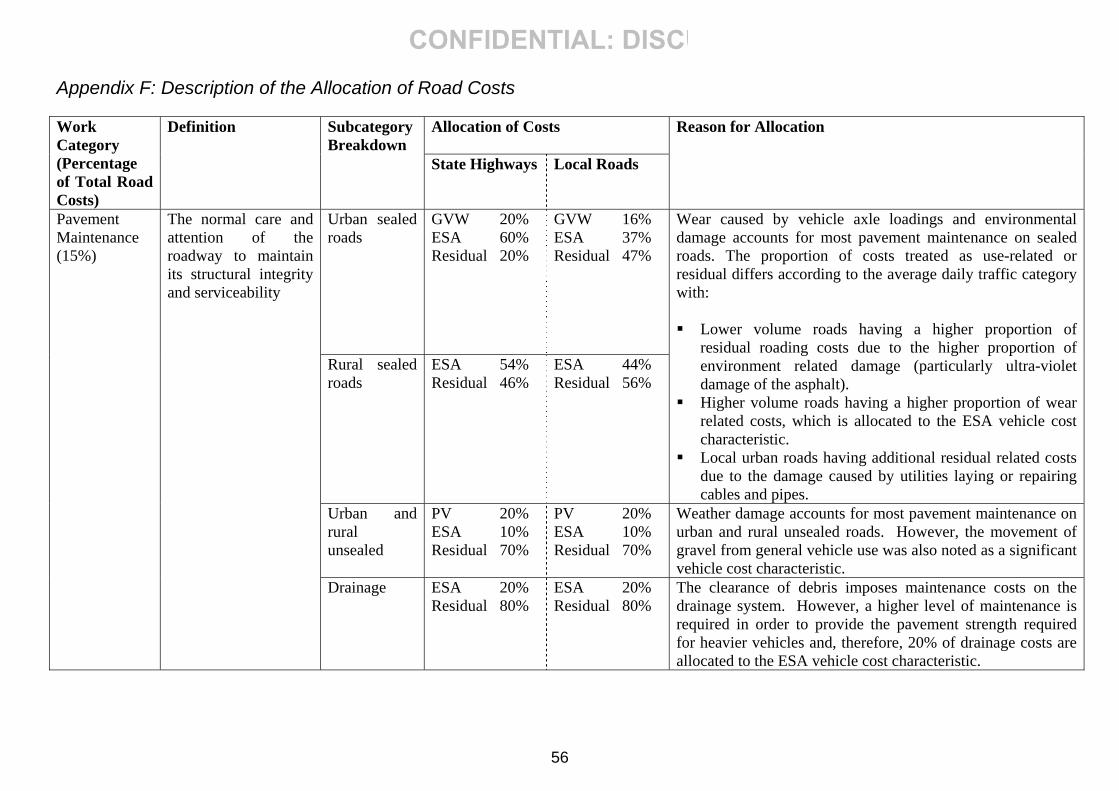
Appendix F: Description of the Allocation of Road Costs
Allocation of Costs
Work Category (Percentage of Total Road Costs)
Definition Subcategory Breakdown
State Highways Local Roads
Reason for Allocation
Urban sealed ads ro
GVW 20% ESA 60% Residual 20%
GVW 16% ESA 37% Residual 47%
Rural sealed roads
ESA 54% Residual 46%
ESA 44% Residual 56%
Wear caused by vehicle axle loadings and environmental damage accounts for most pavement maintenance on sealed roads. The proportion of costs treated as use-related or residual differs according to the average daily traffic category with: Lower volume roads having a higher proportion of
residual roading costs due to the higher proportion of environment related damage (particularly ultra-violet damage of the asphalt).
Higher volume roads having a higher proportion of wear related costs, which is allocated to the ESA vehicle cost characteristic.
Local urban roads having additional residual related costs due to the damage caused by utilities laying or repairing cables and pipes.
Urban and rural unsealed
PV 20% ESA 10% Residual 70%
PV 20% ESA 10% Residual 70%
Weather damage accounts for most pavement maintenance on urban and rural unsealed roads. However, the movement of gravel from general vehicle use was also noted as a significant vehicle cost characteristic.
Pavement Maintenance (15%)
The normal care and attention of the roadway to maintain its structural integrity and serviceability
Drainage ESA 20% Residual 80%
ESA 20% Residual 80%
The clearance of debris imposes maintenance costs on the drainage system. However, a higher level of maintenance is required in order to provide the pavement strength required for heavier vehicles and, therefore, 20% of drainage costs are allocated to the ESA vehicle cost characteristic.
56
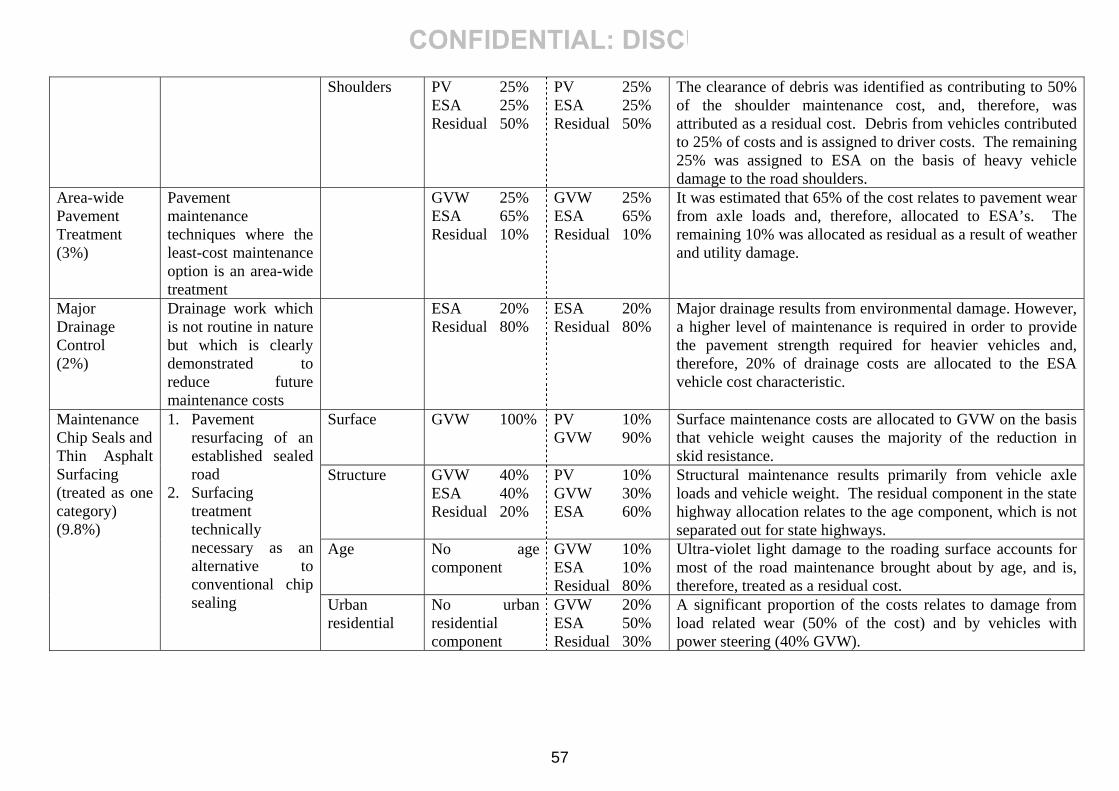
Shoulders PV 25% ESA 25% Residual 50%
PV 25% ESA 25% Residual 50%
The clearance of debris was identified as contributing to 50% of the shoulder maintenance cost, and, therefore, was attributed as a residual cost. Debris from vehicles contributed to 25% of costs and is assigned to driver costs. The remaining 25% was assigned to ESA on the basis of heavy vehicle damage to the road shoulders.
Area-wide Pavement Treatment (3%)
Pavement maintenance techniques where the least-cost maintenance option is an area-wide treatment
GVW 25% ESA 65% Residual 10%
GVW 25% ESA 65% Residual 10%
It was estimated that 65% of the cost relates to pavement wear from axle loads and, therefore, allocated to ESA’s. The remaining 10% was allocated as residual as a result of weather and utility damage.
Major Drainage Control (2%)
Drainage work which is not routine in nature but which is clearly demonstrated to reduce future maintenance costs
ESA 20% Residual 80%
ESA 20% Residual 80%
Major drainage results from environmental damage. However, a higher level of maintenance is required in order to provide the pavement strength required for heavier vehicles and, therefore, 20% of drainage costs are allocated to the ESA vehicle cost characteristic.
Surface GVW 100%
PV 10% GVW 90%
Surface maintenance costs are allocated to GVW on the basis that vehicle weight causes the majority of the reduction in skid resistance.
Structure GVW 40% ESA 40% Residual 20%
PV 10% GVW 30% ESA 60%
Structural maintenance results primarily from vehicle axle loads and vehicle weight. The residual component in the state highway allocation relates to the age component, which is not separated out for state highways.
Age No age component
GVW 10% ESA 10% Residual 80%
Ultra-violet light damage to the roading surface accounts for most of the road maintenance brought about by age, and is, therefore, treated as a residual cost.
Maintenance Chip Seals and Thin Asphalt Surfacing (treated as one category) (9.8%)
1. Pavement resurfacing of an established sealed road
2. Surfacing treatment technically necessary as an alternative to conventional chip sealing Urban
residential No urban residential component
GVW 20% ESA 50% Residual 30%
A significant proportion of the costs relates to damage from load related wear (50% of the cost) and by vehicles with power steering (40% GVW).
57
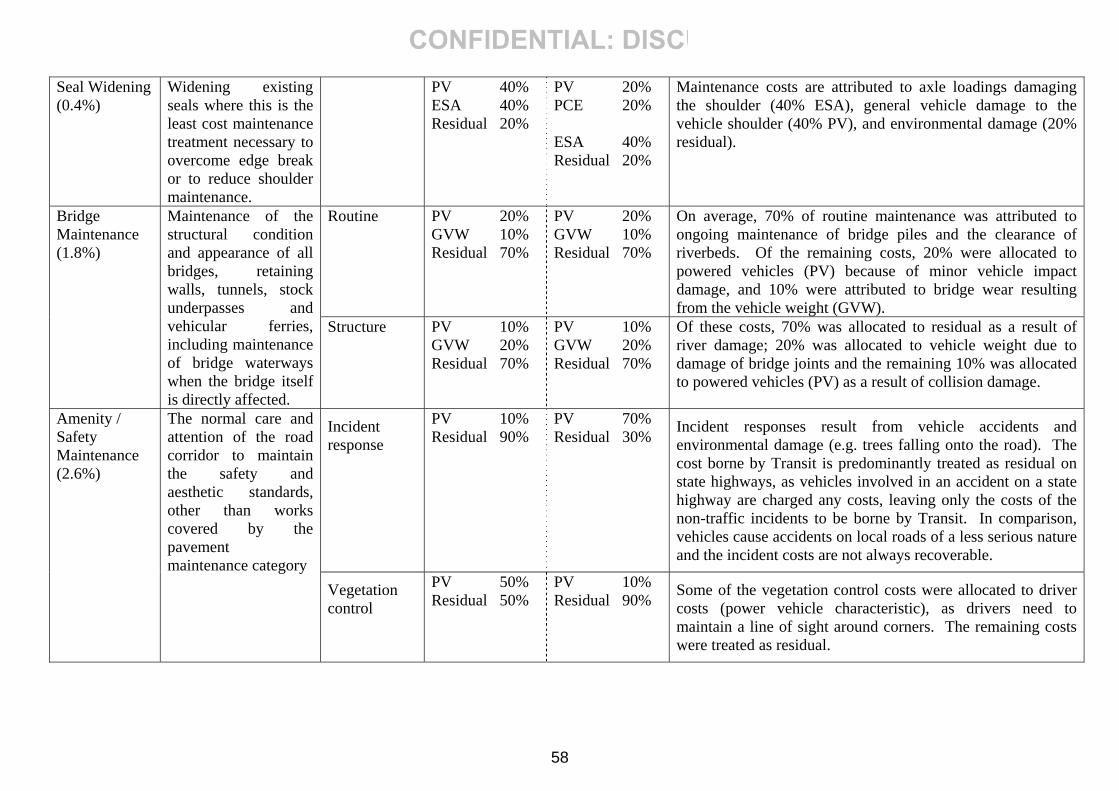
Seal Widening (0.4%)
Widening existing seals where this is the least cost maintenance treatment necessary to overcome edge break or to reduce shoulder maintenance.
PV 40% ESA 40% Residual 20%
PV 20% PCE 20% ESA 40% Residual 20%
Maintenance costs are attributed to axle loadings damaging the shoulder (40% ESA), general vehicle damage to the vehicle shoulder (40% PV), and environmental damage (20% residual).
Routine PV 20% GVW 10% Residual 70%
PV 20% GVW 10% Residual 70%
On average, 70% of routine maintenance was attributed to ongoing maintenance of bridge piles and the clearance of riverbeds. Of the remaining costs, 20% were allocated to powered vehicles (PV) because of minor vehicle impact damage, and 10% were attributed to bridge wear resulting from the vehicle weight (GVW).
Bridge Maintenance (1.8%)
Maintenance of the structural condition and appearance of all bridges, retaining walls, tunnels, stock underpasses and vehicular ferries, including maintenance of bridge waterways when the bridge itself is directly affected.
Structure PV 10% GVW 20% Residual 70%
PV 10% GVW 20% Residual 70%
Of these costs, 70% was allocated to residual as a result of river damage; 20% was allocated to vehicle weight due to damage of bridge joints and the remaining 10% was allocated to powered vehicles (PV) as a result of collision damage.
Incident response
PV 10% Residual 90%
PV 70% Residual 30% Incident responses result from vehicle accidents and
environmental damage (e.g. trees falling onto the road). The cost borne by Transit is predominantly treated as residual on state highways, as vehicles involved in an accident on a state highway are charged any costs, leaving only the costs of the non-traffic incidents to be borne by Transit. In comparison, vehicles cause accidents on local roads of a less serious nature and the incident costs are not always recoverable.
Amenity / Safety Maintenance (2.6%)
The normal care and attention of the road corridor to maintain the safety and aesthetic standards, other than works covered by the pavement maintenance category
Vegetation control
PV 50% Residual 50%
PV 10% Residual 90% Some of the vegetation control costs were allocated to driver
costs (power vehicle characteristic), as drivers need to maintain a line of sight around corners. The remaining costs were treated as residual.
58
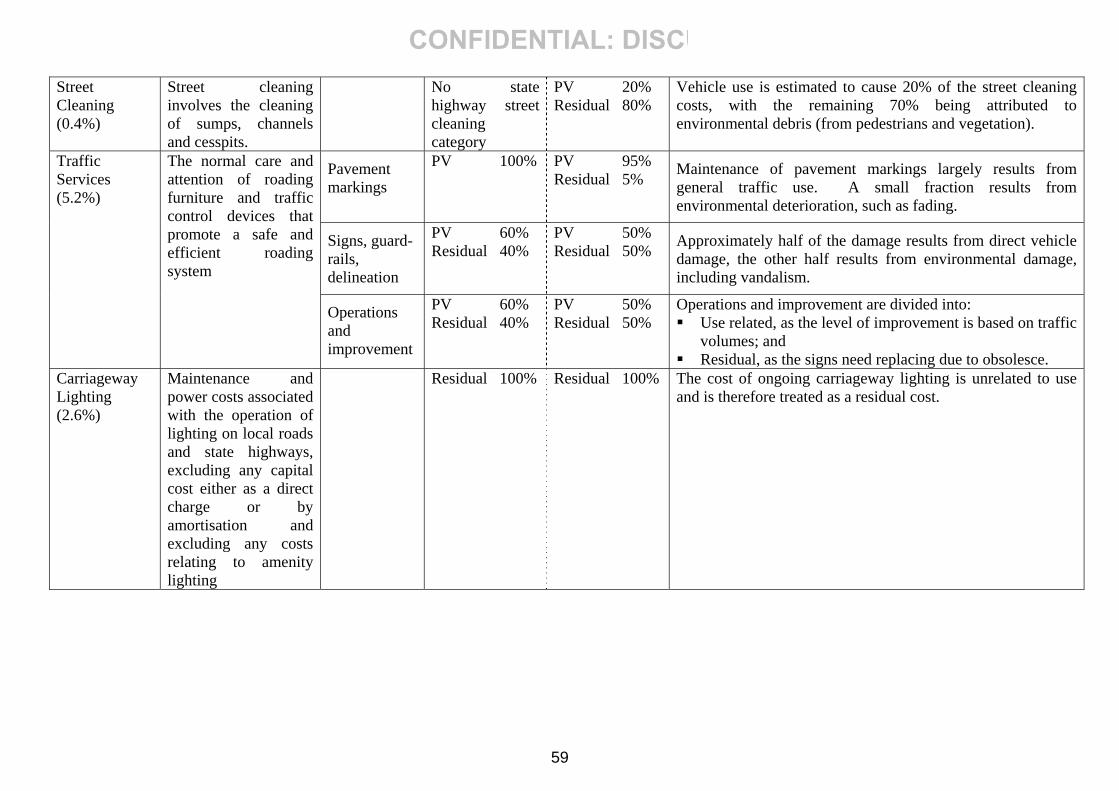
Street Cleaning (0.4%)
Street cleaning involves the cleaning of sumps, channels and cesspits.
No state highway street cleaning category
PV 20% Residual 80%
Vehicle use is estimated to cause 20% of the street cleaning costs, with the remaining 70% being attributed to environmental debris (from pedestrians and vegetation).
Pavement markings
PV 100%
PV 95% Residual 5% Maintenance of pavement markings largely results from
general traffic use. A small fraction results from environmental deterioration, such as fading.
Signs, guard-
delineation rails,
PV 60% Residual 40%
PV 50% Residual 50% Approximately half of the damage results from direct vehicle
damage, the other half results from environmental damage, including vandalism.
Traffic Services (5.2%)
The normal care and attention of roading furniture and traffic control devices that promote a safe and efficient roading system
Operations and improvement
PV 60% Residual 40%
PV 50% Residual 50%
Operations and improvement are divided into: Use related, as the level of improvement is based on traffic
volumes; and Residual, as the signs need replacing due to obsolesce.
Carriageway Lighting (2.6%)
Maintenance and power costs associated with the operation of lighting on local roads and state highways, excluding any capital cost either as a direct charge or by amortisation and excluding any costs relating to amenity lighting
Residual 100% Residual 100% The cost of ongoing carriageway lighting is unrelated to use and is therefore treated as a residual cost.
59
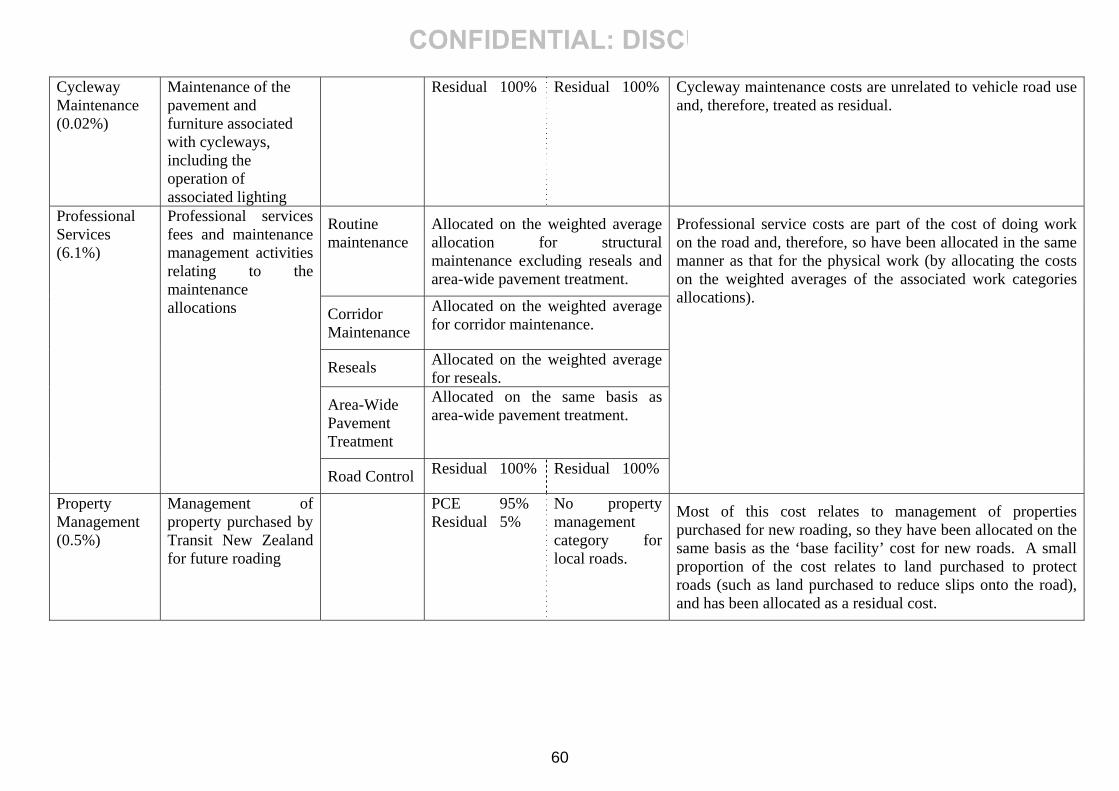
Cycleway Maintenance (0.02%)
Maintenance of the pavement and furniture associated with cycleways, including the operation of associated lighting
Residual 100% Residual 100% Cycleway maintenance costs are unrelated to vehicle road use and, therefore, treated as residual.
Routine maintenance
Allocated on the weighted average allocation for structural maintenance excluding reseals and area-wide pavement treatment.
Allocated on the weighted average for corridor maintenance. Corridor
Maintenance
Reseals Allocated on the weighted average for reseals.
Area-Wide Pavement Treatment
Allocated on the same basis as area-wide pavement treatment.
Professional Services (6.1%)
Professional services fees and maintenance management activities relating to the maintenance allocations
Road Control Residual 100% Residual 100%
Professional service costs are part of the cost of doing work on the road and, therefore, so have been allocated in the same manner as that for the physical work (by allocating the costs on the weighted averages of the associated work categories allocations).
Property Management (0.5%)
Management of property purchased by Transit New Zealand for future roading
PCE 95% Residual 5%
No property management category for local roads.
Most of this cost relates to management of properties purchased for new roading, so they have been allocated on the same basis as the ‘base facility’ cost for new roads. A small proportion of the cost relates to land purchased to protect roads (such as land purchased to reduce slips onto the road), and has been allocated as a residual cost.
60
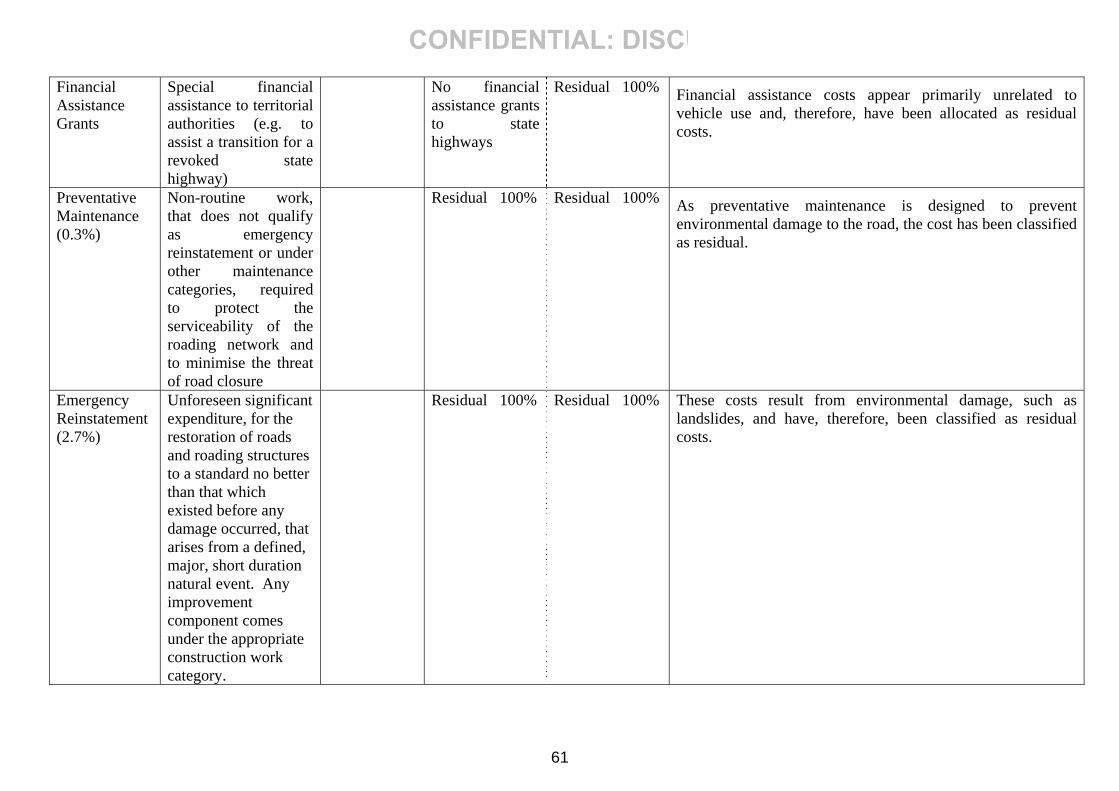
Financial Assistance Grants
Special financial assistance to territorial authorities (e.g. to assist a transition for a revoked state highway)
No financial assistance grants to state highways
Residual 100% Financial assistance costs appear primarily unrelated to vehicle use and, therefore, have been allocated as residual costs.
Preventative Maintenance (0.3%)
Non-routine work, that does not qualify as emergency reinstatement or under other maintenance categories, required to protect the serviceability of the roading network and to minimise the threat of road closure
Residual 100% Residual 100% As preventative maintenance is designed to prevent environmental damage to the road, the cost has been classified as residual.
Emergency Reinstatement (2.7%)
Unforeseen significant expenditure, for the restoration of roads and roading structures to a standard no better than that which existed before any damage occurred, that arises from a defined, major, short duration natural event. Any improvement component comes under the appropriate construction work category.
Residual 100% Residual 100% These costs result from environmental damage, such as landslides, and have, therefore, been classified as residual costs.
61
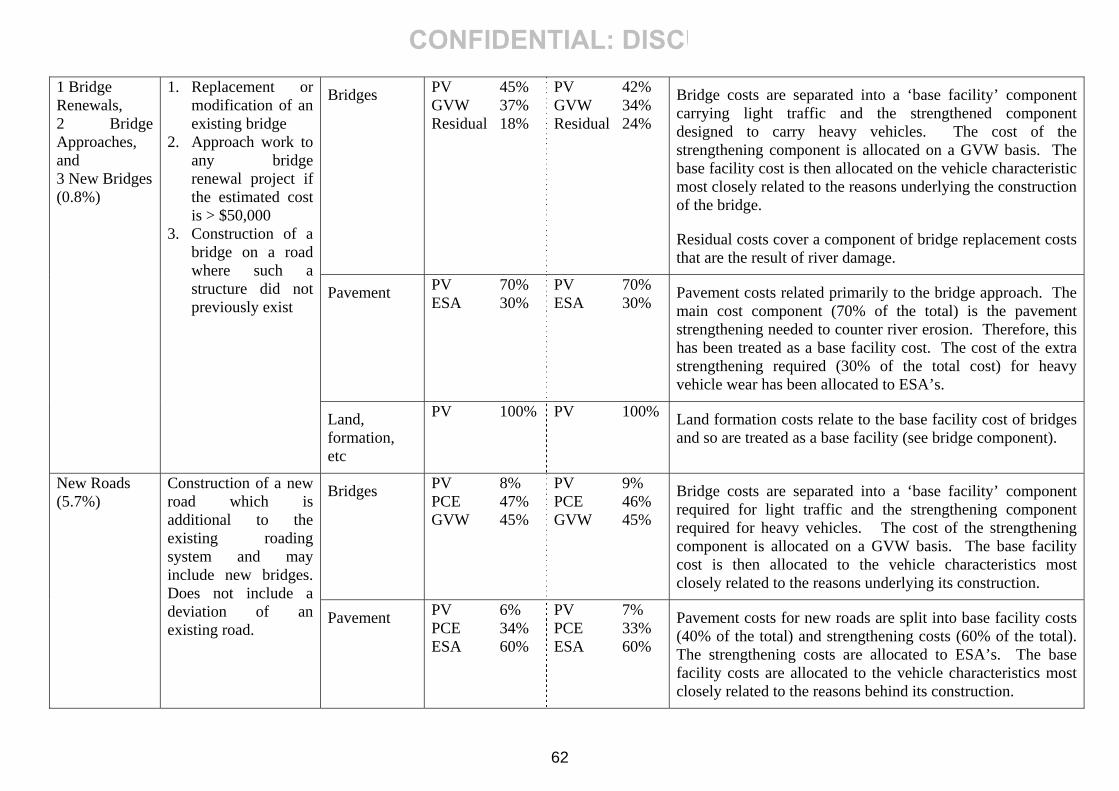
Bridges PV 45% GVW 37% Residual 18%
PV 42% GVW 34% Residual 24%
Bridge costs are separated into a ‘base facility’ component carrying light traffic and the strengthened component designed to carry heavy vehicles. The cost of the strengthening component is allocated on a GVW basis. The base facility cost is then allocated on the vehicle characteristic most closely related to the reasons underlying the construction of the bridge.
Residual costs cover a component of bridge replacement costs that are the result of river damage.
Pavement PV 70% ESA 30%
PV 70% ESA 30% Pavement costs related primarily to the bridge approach. The
main cost component (70% of the total) is the pavement strengthening needed to counter river erosion. Therefore, this has been treated as a base facility cost. The cost of the extra strengthening required (30% of the total cost) for heavy vehicle wear has been allocated to ESA’s.
1 Bridge Renewals, 2 Bridge Approaches, and 3 New Bridges (0.8%)
1. Replacement or modification of an existing bridge
2. Approach work to any bridge renewal project if the estimated cost is > $50,000
3. Construction of a bridge on a road where such a structure did not previously exist
Land, formation, etc
PV 100% PV 100% Land formation costs relate to the base facility cost of bridges and so are treated as a base facility (see bridge component).
Bridges PV 8% PCE 47% GVW 45%
PV 9% PCE 46% GVW 45%
Bridge costs are separated into a ‘base facility’ component required for light traffic and the strengthening component required for heavy vehicles. The cost of the strengthening component is allocated on a GVW basis. The base facility cost is then allocated to the vehicle characteristics most closely related to the reasons underlying its construction.
New Roads (5.7%)
Construction of a new road which is additional to the existing roading system and may include new bridges. Does not include a deviation of an existing road.
Pavement PV 6% PCE 34% ESA 60%
PV 7% PCE 33% ESA 60%
Pavement costs for new roads are split into base facility costs (40% of the total) and strengthening costs (60% of the total). The strengthening costs are allocated to ESA’s. The base facility costs are allocated to the vehicle characteristics most closely related to the reasons behind its construction.
62
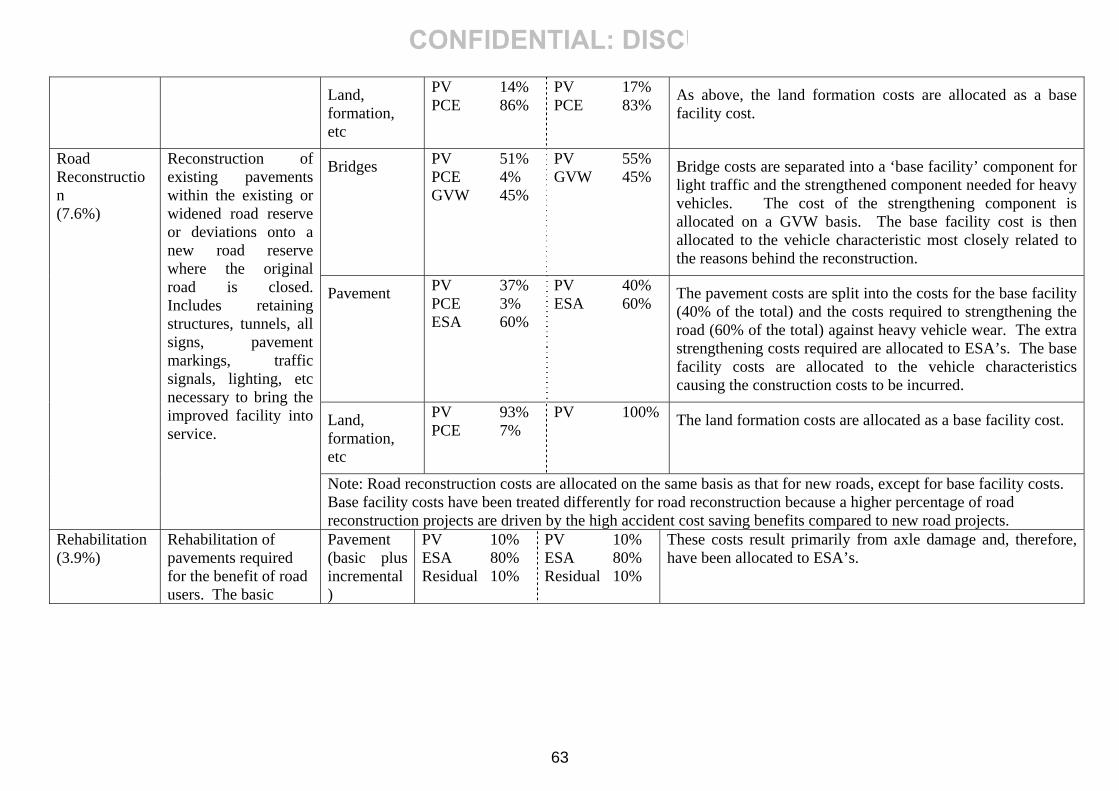
Land, formation, etc
PV 14% PCE 86%
PV 17% PCE 83%
As above, the land formation costs are allocated as a base facility cost.
Bridges PV 51% PCE 4% GVW 45%
PV 55% GVW 45% Bridge costs are separated into a ‘base facility’ component for
light traffic and the strengthened component needed for heavy vehicles. The cost of the strengthening component is allocated on a GVW basis. The base facility cost is then allocated to the vehicle characteristic most closely related to the reasons behind the reconstruction.
Pavement PV 37% PCE 3% ESA 60%
PV 40% ESA 60% The pavement costs are split into the costs for the base facility
(40% of the total) and the costs required to strengthening the road (60% of the total) against heavy vehicle wear. The extra strengthening costs required are allocated to ESA’s. The base facility costs are allocated to the vehicle characteristics causing the construction costs to be incurred.
Land, formation, etc
PV 93% PCE 7%
PV 100% The land formation costs are allocated as a base facility cost.
Road Reconstruction (7.6%)
Reconstruction of existing pavements within the existing or widened road reserve or deviations onto a new road reserve where the original road is closed. Includes retaining structures, tunnels, all signs, pavement markings, traffic signals, lighting, etc necessary to bring the improved facility into service.
Note: Road reconstruction costs are allocated on the same basis as that for new roads, except for base facility costs. Base facility costs have been treated differently for road reconstruction because a higher percentage of road reconstruction projects are driven by the high accident cost saving benefits compared to new road projects.
Rehabilitation (3.9%)
Rehabilitation of pavements required for the benefit of road users. The basic
Pavement (basic plus incremental)
PV 10% ESA 80% Residual 10%
PV 10% ESA 80% Residual 10%
These costs result primarily from axle damage and, therefore, have been allocated to ESA’s.
63
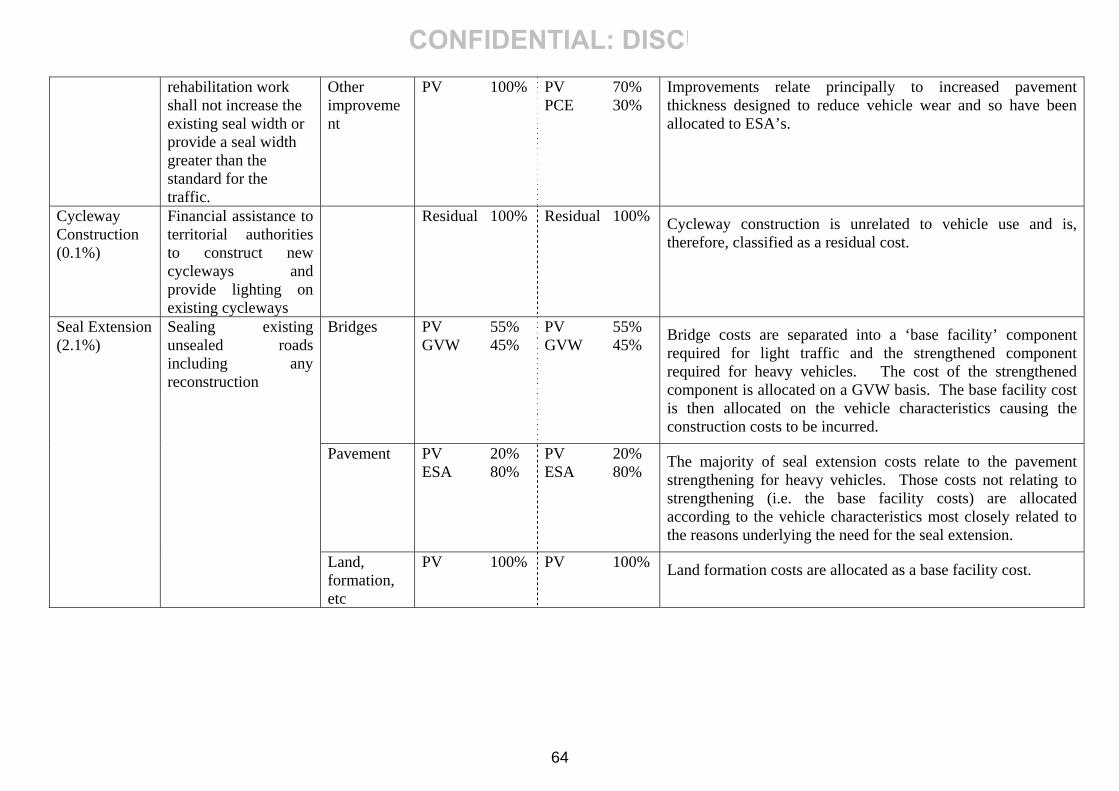
rehabilitation work shall not increase the existing seal width or provide a seal width greater than the standard for the traffic.
Other improvement
PV 100%
PV 70% PCE 30%
Improvements relate principally to increased pavement thickness designed to reduce vehicle wear and so have been allocated to ESA’s.
Cycleway Construction (0.1%)
Financial assistance to territorial authorities to construct new cycleways and provide lighting on existing cycleways
Residual 100% Residual 100% Cycleway construction is unrelated to vehicle use and is, therefore, classified as a residual cost.
Bridges PV 55% GVW 45%
PV 55% GVW 45% Bridge costs are separated into a ‘base facility’ component
required for light traffic and the strengthened component required for heavy vehicles. The cost of the strengthened component is allocated on a GVW basis. The base facility cost is then allocated on the vehicle characteristics causing the construction costs to be incurred.
Pavement PV 20% ESA 80%
PV 20% ESA 80%
Seal Extension
The majority of seal extension costs relate to the pavement strengthening for heavy vehicles. Those costs not relating to strengthening (i.e. the base facility costs) are allocated according to the vehicle characteristics most closely related to the reasons underlying the need for the seal extension.
(2.1%) Sealing existing unsealed roads including any reconstruction
Land, formation, etc
PV 100% PV 100% Land formation costs are allocated as a base facility cost.
64
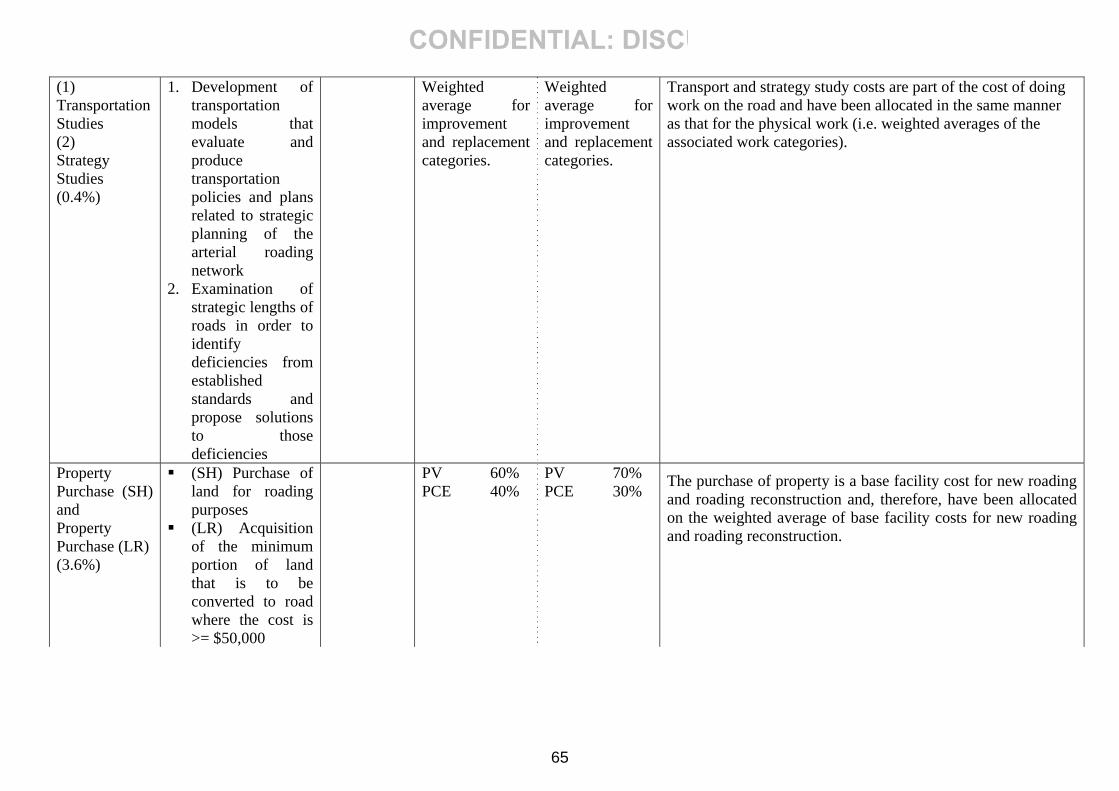
(1) Transportation Studies (2) Strategy Studies (0.4%)
1. Development of transportation models that evaluate and produce transportation policies and plans related to strategic planning of the arterial roading network
2. Examination of strategic lengths of roads in order to identify deficiencies from established standards and propose solutions to those deficiencies
Weighted average for improvement and replacement categories.
Weighted average for improvement and replacement categories.
Transport and strategy study costs are part of the cost of doing work on the road and have been allocated in the same manner as that for the physical work (i.e. weighted averages of the associated work categories).
Property Purchase (SH) and Property Purchase (LR) (3.6%)
(SH) Purchase of land for roading purposes
(LR) Acquisition of the minimum portion of land that is to be converted to road where the cost is >= $50,000
PV 60% PCE 40%
PV 70% PCE 30%
The purchase of property is a base facility cost for new roading and roading reconstruction and, therefore, have been allocated on the weighted average of base facility costs for new roading and roading reconstruction.
65
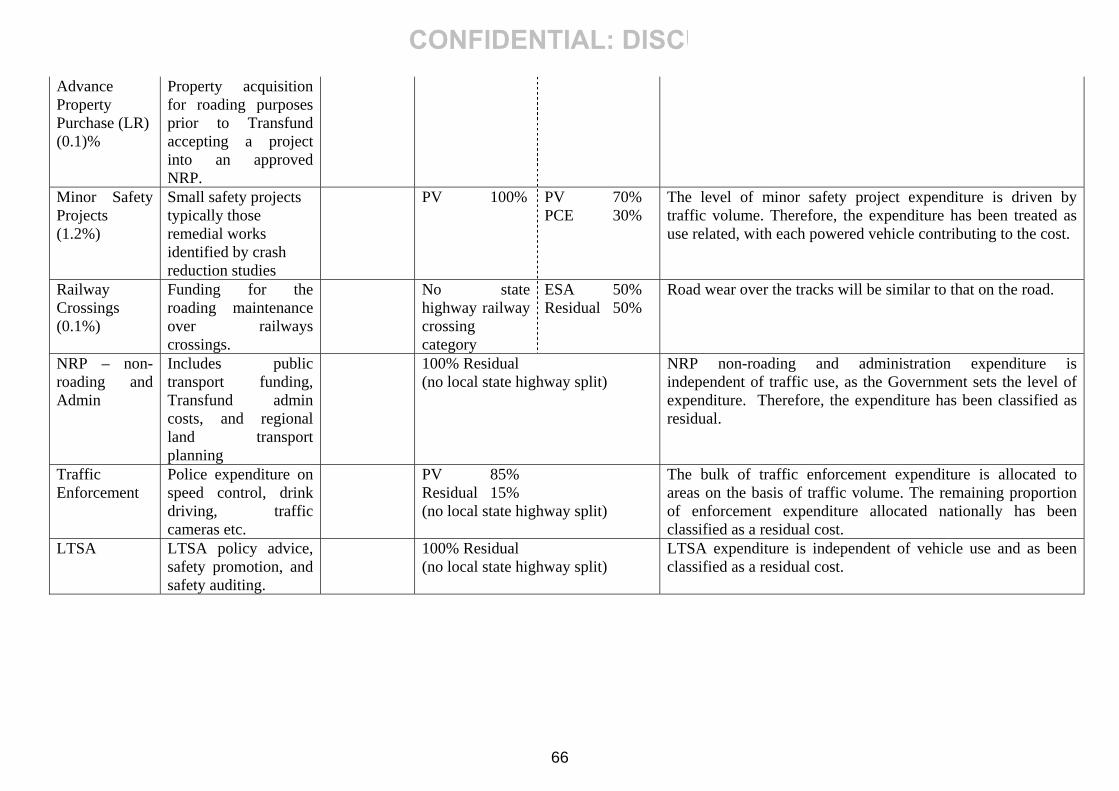
Advance Property Purchase (LR) (0.1)%
Property acquisition for roading purposes prior to Transfund accepting a project into an approved NRP.
Minor Safety Projects (1.2%)
Small safety projects typically those remedial works identified by crash reduction studies
PV 100%
PV 70% PCE 30%
The level of minor safety project expenditure is driven by traffic volume. Therefore, the expenditure has been treated as use related, with each powered vehicle contributing to the cost.
Railway Crossings (0.1%)
Funding for the roading maintenance over railways crossings.
No state highway railway crossing category
ESA 50% Residual 50%
Road wear over the tracks will be similar to that on the road.
NRP – non-roading and Admin
Includes public transport funding, Transfund admin costs, and regional land transport planning
100% Residual (no local state highway split)
NRP non-roading and administration expenditure is independent of traffic use, as the Government sets the level of expenditure. Therefore, the expenditure has been classified as residual.
Traffic Enforcement
Police expenditure on speed control, drink driving, traffic cameras etc.
PV 85% Residual 15%
The bulk of traffic enforcement expenditure is allocated to areas on the basis of traffic volume. The remaining proportion of enforcement expenditure allocated nationally has been classified as a residual cost.
(no local state highway split)
LTSA LTSA policy advice, safety promotion, and safety auditing.
100% Residual LTSA expenditure is independent of vehicle use and as been classified as a residual cost. (no local state highway split)
66