modeling renewable energy resources in integrated · pdf filemodeling renewable energy...
TRANSCRIPT

NREL/TP-462-6436
Modeling Renewable Energy Resources in Integrated Resource Planning
D. Logan, C. Neil, and A. Taylor RCG/Hagler, Bailly, Inc. Boulder, Colorado
National Renewable Energy Laboratory 1617 Cole Boulevard Golden, Colorado 80401-3393 A national laboratory of the U.S. Department of Energy Managed by Midwest Research Institute for the U.S. Department of Energy under contract No. DE-AC36-83CH10093
Prepared under Task No. AAE-3-13371-01
June 1994

NOTICE
This report was prepared as an account of work sponsored by an agency of the United States government. Neither the United States government nor any agency thereof, nor any of their employees, makes any warranty, express or implied, or assumes any legal liability or responsibility for the accuracy, completeness, or usefulness of any information, apparatus, product, or process disclosed, or represents that its use would not infringe privately owned rights. Reference herein to any specific commercial product, process, or service by trade name, trademark, manufacturer, or otherwise does not necessarily constitute or imply its endorsement, recommendation, or favoring by the United States government or any agency thereof. The views and opinions of authors expressed herein do not necessarily state or reflect those of the United States government or any agency thereof.

Foreword
One of the obstacles to a wider use of renewable energy lies in the reliance of utilities on planning modelsthat were not designed to account for the particular attributes of renewables. This report reviews theimportant attributes of renewabies and describes modeling methodologies that capture the impact of theseattributes on the value of renewables to utilities. Since no single model captures all of the impacts, thereport presents a framework for using multiple models within an integrated resource planning process.The report also describes further methodological development that is necessary to improve therepresentation of renewabies.
ReG/Hagler, Bailly, Inc. produced this report under subcontract from the Analytic Studies Division ofthe National Renewable Energy Laboratory with funding from the Integrated Planning Program at theu. S. Department of Energy.
iii

Acknowledgments
The authors are grateful to Joe Iannucci of Distributed Utility Associates and Connie Smyser and LewRubin of the Electric Power Research Institute for thoughtful comments on an earlier draft of this report.We also acknowledge the benefit we received from stimulating discussions with Peter Lilienthal and BlairSwezey of the National Renewable Energy Laboratory and Jill Baylor of RCGlHagler Bailly throughoutthe course of this project. We remain responsible, however, for any errors and omissions. This work wasperformed under Subcontract No. AAE-3-13371-01 to the National Renewable Energy Laboratory.
lV

1.0
Contents
Introduction . . . . . . . . . . . . . . . . . . . . . . . . . . . . . . . . . . . . . . . . . . . . . . . . . . . . . 1-1
1.11.2
Review Methodology , , , " .Overview of the Report . . . . . . . . . . . . . . . . . . . . . . . . . . . . . . . . . . . . . . .
1-11-1
2.0 Resource Attributes . 2-1
2.12.2
Overview of Resource Attributes . . . . . . . , . . . . . . . . . . . . . . . . . . . . . . . ..Key Attributes of Renewable Resources . . . . . . . . . . . . . . . . . . . . . . . . . . ..
2-12-8
3.0 Utility Planning Processes and Models . 3-1
3.1 The Logic of Utility Planning ' 3-13.2 Utility Planning Models . . . . . . . . . . . . . . . . . . . . . . . . . . . . . . . . . . . . . . . 3-63.3 Resource Attributes in the Planning Process . . . . . . . . . . . . . . . . . . . . . . . . . 3-8
4.0 Modeling of Resource Attributes . 4-1
4.1
4.2
4.3
4.4
4.5
Capability and Availability . . . . . . . . . . . . . . . . . . . . . . . . . . . . . .4.1.1 Concept..................................... .4.1.2 Modeling Techniques . . . . . . . . . . . . . . . . . . . . . . . . . . . . . . . . . ..4.1.3 Issues .4.1.4 Summary .Location .4.2.1 Concept .4.2.2 Modeling Techniques .4.2.3 Issues .4.2.4 Summary .Modularity . . . . . . . . . . . . . . . . . . . . . . . . . . . . . . .4.3.1 Concept .4.3.2 Modeling Techniques .4.3.3 Issues .4.3.4. Summary .Risk Diversity . . . . . . . . . . . . . . . . . . . . . . . . . . . . . . . . . . . . . . . . . .4.4.1 Concept....................................... .4.4.2 Modeling Techniques . . . . . . . . . . . . . . . . . . . . . . . . . . . . . . . .4.4.3 Issues .4.4.4 Summary .Conclusion . . . . . . . . . . . . . . . . . . . . . . . . . . . . . . . . . . . . . . . . . . . . . . . .
4-24-24-54-8
4-144-154-154-164-204-224-224-224-244-264-274-284-284-304-324-344-34
5.0 A Framework for Evaluating Renewable Resources Using Current Models . 5-1
5.1 Integrated Strategy 5-15.2 Integrated Strategy Development Process. . . . . . . . . . . . . . . . . . . . . . . . . . . 5-25.3 Tasks in the Integrated Strategy Development Process. . . . . . . . . . . . . . . . . . 5-25.4 Discussion. . . . . . . . . . . . . . . . . . . . . . . . . . . . . . . . . . . . . . . . . . . . . . .. 5-105.5 Summary. . . . . . . . . . . . . . . . . . . . . . . . . . . . . . . . . . . . . . . . . . . . . . . .. 5-12
v

6.0
Contents (Concluded)
Conclusions 6-1
6.1
6.2
6.3
Current Modeling Capabilities .
Model Integration .. , . . , . . . . . . . . , . . . . . . . . . . . . . . . . . . . . . . " . " . . .
Recommendations for Methodology Development " . " " . . . . . . . . . . . " " .6.3.1 Data Requirements .6.3.2 Uncertainty .6.3.3 Distributed Utility Planning .6.3.4 Case Studies , .6.3.5 Workshops .
6-1
6-4
6-56-56-56-66-66-6
7.0 References . . . . . . . . . . . . . . . . . . . . . . . . . . . . . . . . . . . . . . . . . . . . . . . . . " . . . . 7-1
Appendix A: Selection of Models for Review A-I
Appendix B: Technical Analysis of Risk Preference Functions . . . . . . . . . . . . . . . . . . . . . . . B-1
Appendix C: Descriptions of Models Reviewed . . . . . . . . . . . . . . . . . . . . . . . . . . . . . . . . . C-l
Appendix D: Models Considered for Review . . . . . . . . . . . . . . . . . . . . . . . . . . . . . . . . . . . D-l
vi

List of Figures
3-1 Utility planning process , , . . . . . . . . . . . . . . . . . . . . . . . . . . . . . 3-2
4-1 Renewable resource power delivery profile .. ,............................ 4-7
4-2 Multiple-scenario power delivery profiles 4-10
4-3 The distributed utility planning process. . . . . . . . . . . . . . . . . . . . . . . . . . . . . . . . .. 4-19
4-4 Calculation of diversity premium . . . . . . . . .. 4-31
5-1 Integrated strategy development process--conceptual approach 5-3
5-2 Integrated strategy development process-key tasks . . . . . . . . . . . . . . . . . . . . . . . . . 5-4
5-3 Triggering mechanism . . . . . . . . . . . . . . . . . . . . . . . . . . . . . . . . . . . . . . . . . . . . . . 5-9
5-4 Probabilistic cost-effectiveness analysis . . . . . . . . . . . . . . . . . . . . . . . . . . . . . . . . .. 5-11
B-1 Risk preference function for annual electric bill . . . . . . . . . . . . . . . . . . . . . . . . . . . . B-2
vii

1-1 List of Resource Attributes
List of Tables
1-1
1-2 Models Reviewed " . , , . . . . . . . . . . . . . . . . . . . . . . . . . . . . . . . . . 1-2
2-1 Resource Attributes ..... ", .. , ..... 0 • 0' • • • • • • • • • • • • • • • • • • • • • • • • • • • • 2-2
3-1 Description of Model Types 0 ••••••••••••••• , • • • • • • • • • • 3-7
3-2 Representation of Resource Attributes within Utility Planning Models 3-9
4-1 Time Dependence . . . . . . . . . . . . . . . . . . . . . . . . . . . . . . . . . . . . . . . . . . . . . . . . . 4- 3
4-2 Comparison of the Impact on Commitment Decisions of Modeling RenewableResources as Generating Units or Load Modifiers 4-14
4- 3 Location. . . . . . . . . . . . . . . . . . . . . . . . . . . . . . . . . . . . . . . . . . . . . . . . . . . . . .. 4-16
6-1
D-l
Summary of Model Capabilities
Models Considered for Review
6-7
D-l
viii

1.0 Introduction
Including renewable energy resources in integrated resource planning (IRP) requires that utility planningmodels properly consider the relevant attributes of the different renewable resources in addition toconventional supply-side and demand-side options. Otherwise, a utility's resource plan is unlikely to havean appropriate balance of the various resource options. The current trend toward regulatory set-asides forrenewable resources is motivated in part by the perception that the capabilities of current utility planningmodels are inadequate with regard to renewable resources. Adequate modeling capabilities and utilityplanning practices are a necessary prerequisite to the long-term penetration of renewable resources intothe electric utility industry's resource mix.
This report presents a review of utility planning models conducted for the National Renewable EnergyLaboratory (NREL). The review examines the capabilities of utility planning models to address key issuesin the choice between renewable resources and other options. The purpose of this review is to providea basis for identifying high priority areas for advancing the state of the art.
1.1 Review Methodology
This review focuses on methodology and issues related to modeling several key attributes that are mostsignificant in the comparison of renewable resources and other resource options. Our review started byidentifying and defining the comprehensive list of resource attributes in Table 1-1. These attributes aredefined in Section 2. The list was shortened to focus on the key attributes for renewable resourcesidentified by asterisks in Table 1-1. We also identified a long list of models that have a role in IRP andthe primary functions of these models. The short list of models to review was derived from this long listin two stages. We first identified the types of models that address the key attributes, then selected 11models that either are advanced in their treatment of these attributes, used by utilities, or are generallyavailable. These models are listed in Table 1-2, with their sources, primary functions, and pertinentattributes and issues. Models sponsored by the Electric Power Research Institute (EPRI) are identified inTable 1-2. The process of selecting these models is described in greater detail in Appendix A.
1.2 Overview of the Report
The report is organized as follows. Section 2 describes and categorizes the attributes of various kinds ofresources and identifies the key attributes for renewables that are the focus of the remainder of the report.Section 3 presents an overview of utility planning processes and models. Section 4 is the heart of the
Table 1~1
List of Resource Attributes
Capability*Availability*Efficiency
DispatchabilityLocation*
Modularity*Costs
IncentivesRisk-Diversity*External Costs
*Key attributes for renewable resources
1-1

report. It defines the key attributes in greater detail, describes modeling concepts, and discusses the stateof the art in modeling these attributes. Section 5 presents a framework for integrating a comprehensiveevaluation of renewable resources into IRP using existing models with their current capabilities. Section 6concludes the report with a summary of our findings and recommendations.
Appendix A describes the process by which we selected the models to be reviewed. Appendix B presentssome mathematical details on modeling the diversity attribute. Appendix C provides brief descriptionsof the selected models and consolidates the observations pertaining to each model that appear elsewherein the report. Appendix D contains the list of models considered.
Table 1-2. Models Reviewed
Model Developer (Sponsor) Primary Functions Key Attributes
Delta Pacific Gas & Electric Location benefits CapabilityLocation
DYNAMICS Decision Focus, Inc. Chronological production Capability(EPRI) simulation
EGEAS/IRP Stone & Webster Production simulation CapabilityWorkstation Engineering Corporation Resource planning Modularity
(EPRI) Generation reliability
Elfin Environmental Defense Production simulation CapabilityFund Resource planning Modularity
IRP-Manager Electric Power Software Production simulation Capability(EPRI) Resource planning
Uncertainty analysis
ISAAC Bonneville Power Production simulation CapabilityAdministration Modularity
Risk diversity
MABS Pacific Gas & Electric Project economic analysis CapabilityProbabilistic analysis Location
ModularityRisk diversity
MIDAS M.S. Gerber & Uncertainty analysis CapabilityAssociates (EPRI) Production simulation Modularity
Resource planning Risk diversity
PROMOD III Energy Management Production simulation CapabilityAssociates Generation reliability Availability
PROSCREEN III Energy Management Production simulation CapabilityPROVIEW Associates Resource planning Availability
Capital expenditures ModularityFinanciaVrates
UPLAN III LeG Consulting Chronological production CapabilitySimulation AvailabilityResource planningFinanciaVrates
1-2

2.0 Resource Attributes
The range of technologies currently available to utilities for consideration as resource options to balancefuture supply and demand is vast. Utilities must consider the important differences between thesetechnologies. This section identifies and categorizes the resource attributes that are relevant to utilitydecisions among three broad options and the attributes that are particularly significant to renewableresources.
2.1 Overview of Resource Attributes
Table 2-1 lists the attributes that are relevant to comparing and ranking resource options. The broadcategories of resource options in Table 2-1 are defined as follows:
1. Conventional generation and storage-combustion turbine (CT), combined cycle (CC), fossil-firedsteam turbine, nuclear, fossil-fired cogeneration, diesel, fuel cell, pumped hydro, battery ~ andcompressed air energy storage
2. Renewable-wind, solar, geothermal, hydro, biomass, municipal solid waste (MSW), and end-userenewable
3. Demand-side management (DSM)-efficiency improvements and direct load control.
These categories are defined in this way simply to facilitate the discussion in this report. The lists ofresources in each category are intended to be illustrative rather than exhaustive.
Ten general attributes and the characteristics or subattributes that define them are presented in Table 2-1.The table also summarizes the relevance of these attributes for the three resource categories and forspecific options within the categories. The remainder of this subsection briefly discusses the 10 generalattributes.1
Capability refers to limits on the ability of an option to supply power or to reduce demand in a givenperiod under normal conditions. These limits include:
The capacity rating
Any limit on the total amount of energy that can be generated in the period owing, for example,to fuel supply constraints for a fossil station or to water constraints for a hydro station
Contractual limits on the number of operations of a direct load control program.
The capability of an option may vary between time periods because of parameters such as seasonalvariations in ambient temperatures that affect the capacity of a thermal unit.
The attributes of renewable resources are also described in Hamrin and Rader (1993) and in Wan and Parsons (1993).
2-1

NI
N
Table 2-1. Resource Attributes
Conventional Supply-Side Renewable Energy Demand-Side ManagementAttribute and Storage Options Technologies Options
CAPABILITYPeak capability May have mild seasonal profiles. Hydro, solar, and wind options Pronounced seasonal and hourlyEnergy capability typically have pronounced profiles.Seasonal profile seasonal profiles. Solar and windHourly profile options also have pronounced
hourly profiles.
AVAILABILITYIntermittence No intermittence. Hydro capability is dependent on Demand impacts are correlatedForced outages Maintenance requirements may hydrological conditions. Plants on with both the weather-sensitiveMaintenance requirements be coordinated with other plants. the same river system are tightly component of system demand
correlated. and long-term demand growth.Correlation with:
Weather Wind and solar are intermittent.Hydrological conditions Units in the same area areSystem demand correlated with each other and
may be correlated with theweather-sensitive component ofsystem demand.
EFFICIENCYHeat rate Efficiency is a major determinant Efficiency is generally not an Not applicable.
of total cost, particularly for issue for renewables becausetechnologies that use higher cost they typically rely on zero- or low-fuels. cost energy sources.

Table 2-1. Resource Attributes (cont'd)
NI
W
Attribute
DISPATCHABILITYFully dispatchableCurtailableBase-loaded
Constraints:Ramp rateMinimum outputMinimum up timeMinimum downtime
LOCATIONDelivery point: substation!feeder
Conventional Supply-Sideand Storage Options
Fossil-fired noncogenerationoptions are typically fullydispatchable, subject to minimumload, minimum downtime, andramp rate constraints.
Nuclear generation is base-loadedbut may be curtailable.
Cogeneration may be buiIt toaccommodate any level ofdispatchability.
Connected at transmission level.
Renewable EnergyTechnologies
Run-of-river hydro isnondispatchable. Pondage hydrois dispatchable, subject to energyand flow constraints.
Wind is nondispatchable.
Solar thermal with thermalstorage is dispatchable. Othersolar options are nondispatchable.
Biomass, landfill methane, andMSW options are typicallynondispatchable.
Geothermal is typicallynondispatchable.
Connected at transmission ordistribution level. Can betargeted to defer transmission ordistribution upgrades.
Demand-Side ManagementOptions
Direct load control andinterruptible load are fullydispatchable, subject tocontractual constraints onmaximum number and durationof operations. All other DSMoptions are nondispatchable.
Connected at transmission (forlarge industrial customers) ordistribution level (for othercustomers). Can be targeted todefer transmission or distributionupgrades.

Table 2-1. Resource Attributes (cont'd)
Conventional Supply-Side Renewable Energy Demand-Side ManagementAttribute and Storage Options Technologies Options
MODULARITYIncremental size Incremental sizes of fossil-fired Incremental sizes and lead times DSM options have no minimumPre-eonstruction lead time options vary between 15 MW (for of RETs, except for MSW, are incremental size, but theConstruction lead time small CTs) to 1000 MW (for large typically smaller and shorter than maximum size of a DSM option
coal-fired steam units). for conventional options. is limited. DSM programs mayIncremental sizes of nuclear units be implemented with a lead timevary between 300 MW (for future Pre-construction lead times for of only 1 year. However, theadvanced design units) and 1200 MSW are 3 to 4 years. demand impacts of DSMMW (for current technology). programs may take 10 years to
build up.Pre-construction lead times offossil-fired options vary between 1year (for CTs) and 4 years (forcoal-fired units). Pre-constructionlead times of nuclear units are 6years. 1
Construction lead times of fossil-fired options vary between 1 year(for CTs) and 6 years (for largecoal-fired units). Constructionlead times of nuclear units varybetween 4 years (for advanceddesign units) and 6 rears (forcurrent technology).

tvI
VI.
Table 2-1. Resource Attributes (cont'd)
Conventional Supply-Side Renewable Energy Demand-Side ManagementAttribute and Storage Options Technologies Options
COSTSConstruction Correlation of fuel costs is Typically no fuel costs. These DSM options often involveOperating and maintenance significant. tech-nologies provide participants bearing some costs.Fuel diversification of the fuel supplyDecommissioning portfolio.
Correlation with othersystem costs
INCENTIVESTax credits2 None. The 1992 National Energy Policy Some jurisdictions haveShareholder incentives2 Act provides a 1.5 cents/kWh tax established shareholderEmission allowance credit for renewable energy incentives for utility DSMincentives producers. The 1990 Clean Air accomplishments"
Act Amendments provide bonusemission credits for renewableenergy production.
RISKStart-up delay Fossil fuel costs have been Less mature technologies may Persistence of DSM impacts isConstruction cost overrun volatile over the past two have greater construction and an open issue.Fuel costs decades. operating risks than conventionalO&M costs technologies.Reliability problems Environmental requirements mayPremature retirement become more stringent and
thereby increase operating costs.

NI
0"1
Table 2-1. Resource Attributes (cont'd)
Conventional Supply-Side Renewable Energy Demand-Bide ManagementAttribute and Storage Options Technologies Options
RISK (cont.)Diversity Contribution to diversity depends Renewable resources generally DSM options add diversity,
on fuel and technology mix of enhance diversity, except for because they are generallyentire system. hydro additions to a independent of generation
predominantly hydro system" options.Correlation of fossil fuel prices ismajor issue.
EXTERNAL COSTS3,4
Air/water emissions Air emissions are a significant Land use and fish habitats are Air emissions are created inLand use issue for fossil-fired generation. significant issues for hydro manufacturing insulation.Waste disposal generation. Noise and visualPublic safety Waste disposal is a significant impacts are issues for wind Chlorinated fluorocarbons may
issue for coal and nuclear energy resources. be released by disposal of oldgeneration. refrigerators and air conditioners.
Public safety is an issue fornuclear generation.
Notes:1. There is no current experience to validate the lead times for nuclear units.2. Applicable only to investor-owned utilities.3. External costs are defined to exclude impacts that are mitigated or accounted for in other cost categories.4. Cost-benefit framework must account for avoided externalities from existing generation.

Availability is defined as the opposite of unavailability, which is any reduction in the capability of aresource to generate electric power from what it is under normal conditions. This heading includes anyreductions resulting from maintenance requirements or random outages.
Generation from some renewable options, primarily wind and solar, is intermittent. The definition of"intermittence" has not been standardized in the industry, and the variation in hourly output from theseoptions creates some ambiguity between capability and availability. We use intermittence in this reportto refer to random fluctuations in the energy source, distinct from whatever predictable patternscharacterize the energy source. We account for intermittence under the heading of availability, and weaccount for predictability under capability, although capability and availability are discussed together inSection 4. Consider, for example, the hourly profile of photovoltaic generation at a specific location.There is a predictable hourly profile of generation on a typical day since the sun shines during the daybut not at night. On any given day, insolation may follow the predictable profile of what we are looselycalling a typical day, or it may be reduced by clouds. This cloud effect is what we are callingintermittence. The predictable profile is an important characteristic of the capability of the photovoltaicplant. Its intermittence is a key component of its availability.
Intermittence is sometimes defined to encompass every aspect of variability in output from a renewableresource, including the predictable profile as well as random departures from the predictable profile. Ourdefinition includes only the random departures. Yet another definition of intermittence applies the termto variations of output within an hour resulting, for example, from clouds scudding across the sky overa photovoltaic plant. We discuss this in Section 4 under the heading of short-term fluctuation.
Efficiency. The heat rate, a standard measure of efficiency, is an important parameter in the economicsof most resources because the cost of fuel is a major component of the total cost of power for theseoptions.
Dispatchability refers to the degree of control that the utility has over the hour-by-hour and minute-byminute output of a resource. A fully dispatchable resource is one over which the utility has completecontrol throughout the range from zero to maximum capacity. Full dispatchability is preferable becauseit provides the utility the greatest operating flexibility. A nondispatchable resource is one over which theutility has no control. The utility must take the output from such a resource whenever it is generated.A schedulable resource is one for which the utility can specify the hourly output in advance. Dependingon contractual terms and physical limitations, the utility may specify the scheduled output 1, 8, or 24hours in advance, for example. A curtailable resource is one over which the utility has no control exceptunder specified minimum load conditions, when the utility has the right to curtail output from the resourceor receive the output at zero energy cost.
Dispatchable resources can be used to respond to fluctuations in load in real time. A resource under directdigital control can be operated with a portion of its capacity held as spinning reserve to cover suddenoutages of other resources. However, full dispatchability is less important for a resource with low or zeroincremental cost, as long as this resource can be curtailed under minimum load conditions. Also,dispatchability is less important for resources with an hourly capability profile that is significantlycorrelated with system loads, such as photovoltaics, whose generation is strongly correlated with airconditioning loads in the summer. The value of a resource to the system is greater if its hourly outputis sufficiently predictable to allow the utility to reduce the total amount of load-following capacitycommitted and on line in any given hour.
Location determines the effect of an option on the total cost of future transmission and distributionreinforcements, on costs associated with losses, and on the overall reliability of service to a local area.In general, integrating a large central station into the system, particularly at a new site, requires significant
2-7

transmission additions. Smaller options that can be installed at a substation can reduce transmission costsby deferring transmission reinforcements. Generating options that can be installed at customers' premisesand DSM options can defer distribution as well as transmission reinforcements. Options installed at asubstation or at customers' premises can improve local reliability even if they do not defer reinforcements.
Modularity is the opposite of "lumpiness, II or the large unit sizes of some technologies. Modular optionscome in relatively small blocks of incremental capacity with short lead times. This provides advantagesto utilities by avoiding the temporary overcapacity that results when a large unit is commissioned and byminimizing both the risks of individual projects and the systemwide risks resulting from demanduncertainty.
Costs. Various resources have unique cost elements. It is important to account fully for all costs in orderto make a fair comparison between the options. Whether or not the costs of one resource are correlatedwith those of other resources determines the cost diversification the resource provides to the total portfolioof resources.
Incentives to promote particular options have been established by legislation and regulation to tip thebalance of resource decision making toward these options. It is important to understand who benefits fromthese incentives-ratepayers, shareholders, or someone else-and to account properly for the allocationof the benefits in ranking the options.
Risk. There is some degree of risk involved in all the attributes. There is also substantial uncertainty invarious planning assumptions such as demand growth and the prices of fuel burned in existing units thatdetermine the benefits of resource options. Obviously, these risks must be accounted for in ranking theoptions.
A subattribute of risk is the diversification that an option may provide to the utility's resource portfolio.This subattribute is different from others in that it is not entirely inherent in the candidate option itself,but depends on the mix of technologies and fuels in the rest of the utility's system. Risks involving asingle option that are independent of the risks affecting other options are diversified away when combinedin a portfolio with other resources. An option can provide diversity benefits if it is independent of therisks affecting other options that make up a significant share of the utility's resource mix. But risks thatare positively correlated with other options will increase the risk of the total portfolio.
External costs refer to costs (or benefits) borne by others as a consequence of decisions made by the utilityfor which the others receive no compensation (or make no payment). These "externalities" includeenvironmental impacts (as a cost) and may include regional economic impacts (as a benefit). A properevaluation of resource options from a societal perspective must include consideration of external costs.But care must be taken to avoid double-counting externalities that may actually already be accounted forin the utility's cost structure, such as sulfur dioxide emissions.
2.2 Key Attributes of Renewable Resources
The following five attributes are particularly important for renewable resources:
• CapabilityAvailability
• Modularity• Location• Risk diversity.
2-8

Capability-which refers to the typical or normal pattern of generation from a resource-andavailability-which refers to departures from normal-are both important because some renewableresources such as solar and wind are markedly different from conventional generation resources in thesecategories. These differences pose special challenges in system operation and in modeling these resourcesin the planning process. For conventional resources and some renewable resources, capability is the ratedoutput of a unit. There may be a slight adjustment for seasonal weather effects. But the output of somerenewable resources is determined primarily by weather conditions. Although listed separately above,capability and availability are combined in Section 4 because of their close relationship in the context ofrenewable resources.
Modularity is potentially a key advantage for some renewable resources because of their small incrementalsizes and short lead times. However, the state of the art in modeling modularity for conventional as wellas renewable resources is not well developed.
Location is a key attribute for renewable resources in considering both integration cost and systembenefits. For some renewable resources, the energy source is remote from loads; therefore, additionalcosts must be incurred to integrate the resource into the system and deliver the output of these resourcesto the load center. Other renewable resources are suitable for dispersed deployment and can therefore begiven credit for system benefits, which include both avoiding or deferring transmission and distributionreinforcements that would otherwise be required and improving local reliability. A key practical issue isthe large number of locations for which benefits must be calculated for a complete evaluation of thelocation attribute.
Risk diversity is a potential benefit of renewable resources, particularly for systems that are predominatelyfossil fired. Diversity cuts across several attributes in Table 2-1, including availability and costs.Diversity includes both fuel diversity and technology diversity. It represents the mitigation of risks thatcan be realized by having a large number of types of resources, each having only a small share of the totalresource mix.
The other attributes listed in Table 2-1 do not present particular challenges for evaluating renewableresources. Dispatchability of renewable resources can be evaluated within the degrees of dispatchabilityafforded by conventional generation options. A more critical issue is properly modeling the impact of thecapability and availability of renewable resources on the dispatch of conventional resources. This will beaddressed under capability and availability.
The costs of renewable resources are covered by the various cost components already recognized forconventional resources. The key issue for renewables is making sure that none of the relevant costcomponents for either renewable or conventional resources is overlooked and that cost estimates for bothtypes of resources are developed on a consistent basis. Incentives also can be accommodated withinconventional cost and financial analyses.
The risks inherent in renewable resources can be addressed similarly to conventional resource risks.Again, the key concern for renewable resources is that these risks are evaluated in a symmetrical fashionfor renewable and conventional resources. The simplest decision analysis techniques are adequate for mostof the risks involved in the analysis of individual resource options? Exceptions are risks having a broadimpact on the entire system, such as demand growth and fuel prices. We address these risks undermodularity and diversity.
2 Logan (1990); Temple, Barker & Sloane, Inc. (1987).
2-9

Although the evaluation of external costs is a topic of vigorous debate, analytical devices for incorporatingthese values into the planning process are well established. The issue for renewable resources is to assurethat no relevant component is overlooked.
2-10

3.0 Utility Planning Processes and Models
Utility planning is a multifaceted activity. In this review, planning is defined to include more than whathas traditionally been regarded as generation planning, and even resource planning, because the potentialfor distributed applications of renewable generation and demand-side technologies requires incorporationof transmission and distribution planning into the IRP framework as well. This section provides anoverview of utility planning processes and models. It also identifies the points at which the variousattributes of renewable and other types of resources enter the planning process.
3.1 The Logic of Utility Planning
The IRP process consists of five kinds of activities:
1. Forecasting2. Assessing options3. Constructing a plan4. Evaluating a plan5. Reviewing the plan.
These activities are linked by a logic that is shown in Figure 3-1. The quality of IRP depends on howwell these logical linkages are observed as well as on the quality of the data and analysis used within eachactivity.'
Forecasting includes forecasting the prices of fuels, labor, equipment, and capital, as well as demand, orthe levels of energy services that.the homes, businesses, institutions, and industries in the utility's servicearea will demand in the future. These forecasts affect the utility's resource commitments in several ways.First, demand forecasts determine the overall need for new resources. Second, price forecasts determinethe relative competitiveness of the various resource options. Third, price forecasts also determine thecompetitiveness of the various resource options relative to the resources that make up the existing system.
Assessing options is a wide-ranging set of activities that includes identifying options, assessing theirtechnical feasibility, estimating the costs and potential quantities of various options, screening the options,and developing the specific information for the options required in subsequent stages of the planningprocess, such as hourly generation or demand impact profiles and outage rates. For DSM options, theseactivities also include assessing technical, economic, and market potential. For conventional supply-sidetechnologies, these activities may include identifying specific sites. For renewable resources, theseactivities will include reviewing available data on resource quality and timing.
These assessments rely heavily on price forecasts. For some options, the assessments may also bedependent on demand forecasts. Potential demand impacts from DSM options depend on the startinglevels of demand. The feasibility of generation options located on customer premises-both renewableand conventional-depends on levels of demand in specific customer sectors. Transmission anddistribution options depend on area-specific levels of demand. The screening of options and the economicpotential assessment of DSM options depend on forecasts of system marginal costs.
3 Other procedural and technical requirements are described by Hirst (1992).
3-1

RegulatoryConstraintsl
Planning Criteria
Evaluate Risk
EvaluateMarginal Costs
Scenarios
EvaluateReliability
EvaluateOperating
Costs
EvaluateEnvironmental
Impacts
---------------,I II, Evaluate I
Capital II Expenditures II Evaluate
Financial IPerformancel I
Electricity Prices II
IIIIIL _
Constraints
Assess Sales!PurchaseOptions
~------,
II
IAssess Utility IGeneration I
I Options
I II I
AssessI, Non-Utility
GenerationI Options
II
Assess T&D II Options II I
I1 .....
WI
N
Figure 3-1. Utility planning process

Constructing a plan entails selecting options and setting their implementation dates to balance supply anddemand and to minimize costs, while satisfying various technical, environmental, financial, and regulatoryconstraints. There is a wide range of variation between utilities in their technical approaches to thisactivity and the types of resource planning or expansion planning models used.
Some utilities use a model that explicitly optimizes the demand- and supply-side resources in the plan tominimize some measure of total cost. Many other utilities construct their demand- and supply-side plansseparately and call the combination of the two plans their "integrated" plan. The validity of this approachdepends on whether there is any coordination, in a mathematical sense, between the demand- and supplyside processes. A one-pass sequential approach is commonly used. This approach consists of thefollowing steps:
1. Construct the DSM plan by taking all DSM options that are cost effective for a given set ofmarginal costs.
2. Calculate the net demand after deducting DSM impacts.
3. Optimize the generation plan to minimize the cost of meeting the net demand.
This one-pass approach can, in many cases, yield a combined plan that is suboptimal relative to the planthat would have been constructed by a simultaneous optimization process. The same is true for a one-passsequential process in which the generation plan is optimized first. However, an iterative process, in whichthe marginal costs resulting from the supply-side plan are fed back to the demand-side planning processand the sequential process is repeated until the marginal costs converge, is equivalent to a simultaneousoptimization process. The marginal costs "coordinate" the separate supply-side and demand-sideoptimization processes.
An intermediate approach is one that evaluates demand- and supply-side options simultaneously and buildsup an integrated plan iteratively according to prescribed cost-effectiveness tests. Two examples of thisapproach are the iterative cost-effectiveness methodology (ICEM) and the iterative test for resourceevaluation (ITRE). The framework described in Section 5 follows this general approach. If the costeffectiveness tests are derived from optimal conditions, as in the case of ITRE and the framework inSection 5, and if the iterative process has been implemented to eliminate manual intervention, thisapproach can be regarded as optimization.
The staff of the California Energy Commission (CEC) reviewed alternative generation expansion planningmethods and concluded that the ICEM approach tends to be biased against high-capital-cost, low-fuel-costresources such as wind and geothermal. The CEC ran Elfin for each of the three investor-owned utilitiesin California and concluded that using ICEM with the standard criteria ranking by benefit cost ratio, andrequiring a first-year test result of 1.0, can bias the results against high-capital-cost, low-fuel-costresources. It examined other decision criteria for use with ICEM. In the example of modeling theSouthern California Edison system, the standard ICEM decision criteria resulted in selecting 200 MW ofrenewable resources, while alternative decision criteria selected 2300 MW of renewables and decreasedthe total cost by $212 million.
The CEC did not find a simple fix to the problem, however. No set of alternative decision criteria hasconsistently yielded the least-cost expansion plan. The study concluded that the ICEM approach did not
3-3

tend to identify the least-cost resource plan. The preferred solution was to use a different capacityexpansion methodology, such as the ITRE approach being introduced by Elfin in early 1994.4
Methods for integrating transmission and distribution (T&D) planning with supply- and demand-sideplanning are not well established. There is no model that simultaneously optimizes generation andtransmission investments, much less DSM and distribution as well, with sufficient detail to be useful ina realistic utility setting. There have been only isolated instances of coordination of separate systemplanning and resource planning functions using marginal costs.
Utilities typically perform T&D planning in sequence after supply- and demand-side planning arecompleted. Marginal T&D capacity costs, on a service area average basis, are included in evaluating thecost-effectiveness of DSM options. This approach has been adequate when the DSM options were to beoffered uniformly over the service area rather than targeted to specific local areas. But with greaterinterest in targeting DSM programs and using distributed generation options to defer transmission ordistribution reinforcements, closer coordination between resource planning and system planning isnecessary. A few utilities have recently attempted to integrate DSM or renewable resources and T&Dplanning, as discussed in Section 4.
Evaluating a plan involves confirming the feasibility of the plan that has been constructed and derivinginformation that can help improve the plan further. Several different kinds of analysis are required here.These include:
Reliability analysis. Reliability at three levels-generation, transmission, and distribution-mustbe confirmed. Although some utilities rely on deterministic reserve margin criteria specified bythe pool or the North American Electric Reliability Council (NERC) region to which they belong,generation reliability is most commonly tested using a probabilistic generation reliability modelto calculate indices such as loss-of-load probability, expected unserved energy, or marginal outagecost.
Transmission reliability is generally determined on a one- or two-contingency basis, that is,whether the system can operate within the emergency ratings of the elements (transmission linesor transformers), with one or two elements out of service. Probabilistic methods for transmissionreliability are under development but are not yet widely used.
Distribution reliability is generally evaluated on the basis of deterministic planning criteria similarto that for transmission. When forecast demand exceeds the ratings of specific transformers orcircuits, reliability is inadequate and reinforcements are required.
• Operating costs. Operating costs are evaluated using a production simulation model, which alsoestimates generation and emissions from each unit or plant.
• Environmental impacts. Environmental impacts include air emissions, thermal discharges, wastes,land use, and wildlife impacts. Thermal discharges and wastes are estimated on the basis ofgeneration levels calculated by a production simulation modeL Air emissions are frequentlycalculated directly by a production simulation model. The emission estimates must be checked
4 Belostotsky, Albert, Joel Klein, Pat McAuliffe, Angela Tangbetti, Evaluation of Alternative CapacityExpansion Planning Methodologies, Phase III-Final Report, California Energy Commission, June 29, 1993,pp.6-10.
3-4

against systemwide or unit-specific emissions limits or allowances. Land use and wildlife impactsmust be evaluated on a site-specific basis, outside of a production simulation model.
Capital expenditures. The capital requirements of the plan must be evaluated and compared tothe capital available to the utility as part of evaluating the financial feasibility of the plan.
Financial performance and electricity prices. Operating costs and capital expenditures arecombined to estimate future revenue requirements, cash flows, financial statements, and electricityprices. The financial statements include income statements, balance sheets, and financial ratios.The relative financial health of the utility indicated by this information is the other part ofevaluating the financial feasibility of the plan.
The electricity prices calculated at this point must be checked against the electricity pricesassumed in forecasting demand to confirm their consistency.
• Marginal costs. Marginal costs include marginal energy costs and marginal capacity costs.Marginal energy costs are estimated using a production simulation model. Marginal capacity costsinclude generation, transmission, and distribution components. All three components can becalculated on the basis of deferred capital expenditures, although marginal generation capacitycosts can alternatively be calculated on the basis of marginal customer outage costs using ageneration reliability model. Marginal environmental costs mayor may not be included.
To identify whether there are any significant problems in the assessments resulting frominconsistencies, the marginal costs calculated at this point should be checked against the marginalcosts assumed in assessing the options.
Because assumptions underlying the analysis are uncertain, it is necessary to conduct scenario orsensitivity analyses with some, if not all, of the models used. The key issue is whether different plansor resources are preferable under different scenarios. As is often the case, the planner must weigh theadvantages and disadvantages of resources in different scenarios against one another. Trade-off evaluationand decision analysis are two formal methodologies applicable here.
Reviewing the plan at various levels of management is an essential part of the planning process. Planningresults must be understood and believed to be acted on. Management review considers the results of theanalyses performed in evaluating the plan in light of regulatory constraints, corporate goals, and planningcriteria. The review either establishes management's acceptance of the feasibility and performance of theplan or identifies directions for its modification. If the plan is accepted, implementation begins. If not,management's directives for changing the plan may be expressed as changes to the objectives orconstraints that define the optimization problem to be solved.
Utility planning is necessarily an iterative process. Figure 3-1 has three iterative loops. Two of the loopsinvolve checking for consistency between assumptions made early in the process and results obtained laterin the process. Planners always face a chicken-and-egg problem: the first step requires the answer fromthe last step. The practical solution is to make an assumption that is close to the answer expected fromthe last step to get the first step started, then allow time to revise the analysis if inconsistencies are foundlater. The third loop follows management review.
There are two additional types of iteration: the revisions made necessary by (1) the receipt of newinformation into the planning process and by (2) a new understanding of the problem on the part of thepeople doing the analysis. The mechanical iteration that goes on within the process of solving for theintegrated plan, such as within an automatic optimization model or within ICEM, is yet another type of
3-5

iteration, but it is at a lower level of detail within the activity labeled "Construct Integrated Supply-IDemand-Side Plan" in Figure 3-1.
The important point is that, although a clear logic must always link assumptions and conclusions, theremay not necessarily be a straight path through the planning process from the first step to the last step.The formal planning cycle within a utility and the periodic filing requirements of the regulatory processmerely provide snapshots of a constantly changing situation.
3.2 Utility Planning Models
Many different types of models are used in the IRP process shown in Figure 3-1. Table 3-1 lists the typesof models and their functions. The functions in the right-hand column relate to the activities inFigure 3-1. Some types of models serve more than one function. Some functions require more than onetype of model.
The introduction of a new model or modeling practice must take into account the market for utilityplanning models. Utility planning models come from a number of sources, including:
Utility internal model development activity
Model development sponsored by the Electric Power Research Institute (EPRI)
Vendors
• Custom model development or model customization by a model vendor or consultant
• Public domain.
Utilities that are on the forefront of a new area in utility planning frequently develop their own modelsinternally. Examples include early models to perform probabilistic generation reliability analysis and,more recently, the Delta model developed by Pacific Gas & Electric for integrated DSM and T&Dplanning. Many utilities develop their own models to correspond to their own planning or accountingconventions when the technical requirements are modest. This is frequently the case for project economicanalysis or financial/rates models.
In the past, utilities often developed their own models even when the technical requirements werechallenging, such as when developing production simulation models. Such efforts were justified by theargument that a utility's system is unique and could not be adequately modeled by any commerciallyavailable model. However. utilities have more recently been driven to seek lower cost sources of modelsas a result of competition in electricity markets and the need to reduce costs.
EPRI is an important source of models, particularly in new or developing areas. Even utilities that arenot EPRI members use EPRI models through special licensing arrangements.
Vendors are the dominant source of some types of models, such as production simulation models.
Where the available models are inadequate from the utility's perspective, but internal resources are notsufficient to undertake model development, the utility may hire an outside consultant to develop a newmodel or customize an existing model.
3-6
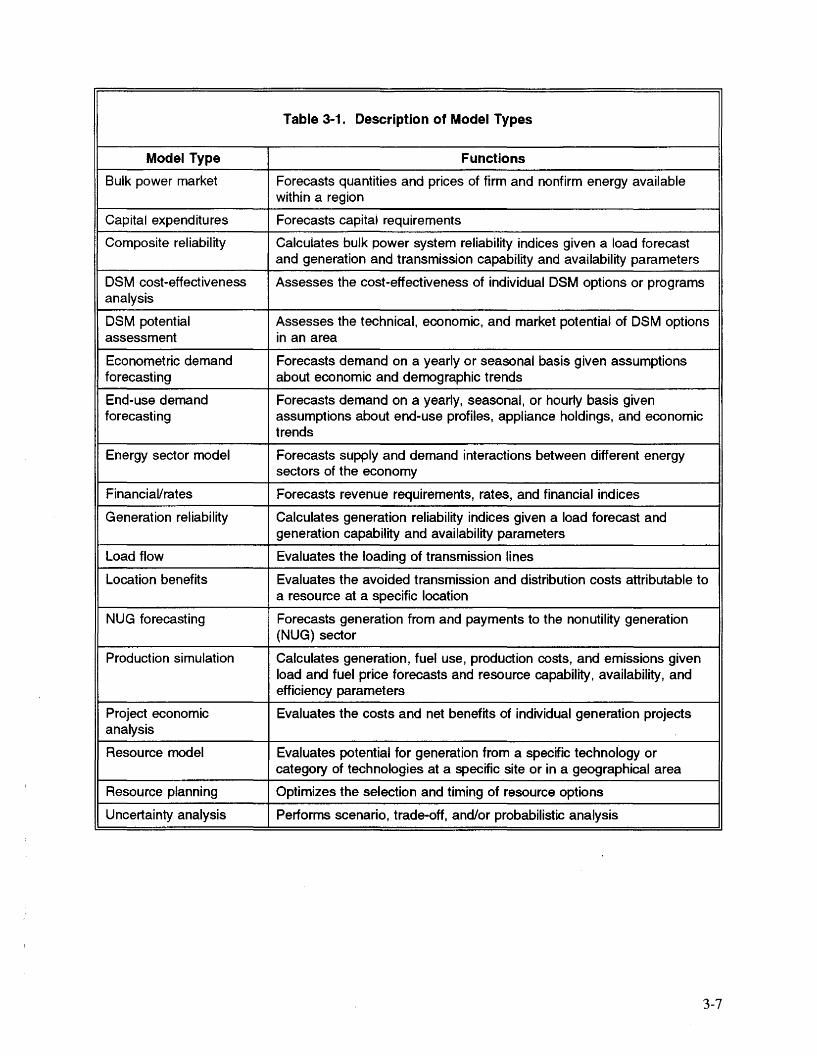
Table 3-1. Description of Model Types
Model Type Functions
Bulk power market Forecasts quantities and prices of firm and nonfirm energy availablewithin a region
Capital expenditures Forecasts capital requirements
Composite reliability Calculates bulk power system reliability indices given a load forecastand generation and transmission capability and availability parameters
DSM cost-effectiveness Assesses the cost-effectiveness of individual DSM options or programsanalysis
DSM potential Assesses the technical, economic, and market potential of DSM optionsassessment in an area
Econometric demand Forecasts demand on a yearly or seasonal basis given assumptionsforecasting about economic and demographic trends
End-use demand Forecasts demand on a yearly, seasonal, or hourly basis givenforecasting assumptions about end-use profiles, appliance holdings, and economic
trends
Energy sector model Forecasts supply and demand interactions between different energysectors of the economy
FinanciaVrates Forecasts revenue requirements, rates, and financial indices
Generation reliability Calculates generation reliability indices given a load forecast andgeneration capability and availability parameters
Load flow Evaluates the loading of transmission lines
Location benefits Evaluates the avoided transmission and distribution costs attributable toa resource at a specific location
NUG forecasting Forecasts generation from and payments to the nonutility generation(NUG) sector
Production simulation Calculates generation, fuel use, production costs, and emissions givenload and fuel price forecasts and resource capability, availability, andefficiency parameters
Project economic Evaluates the costs and net benefits of individual generation projectsanalysis
Resource model Evaluates potential for generation from a specific technology orcategory of technologies at a specific site or in a geographical area
Resource planning Optimizes the selection and timing of resource options
Uncertainty analysis Performs scenario, trade-off, and/or probabilistic analysis
3-7

The public domain is not a major source of utility planning models and is included here only for the sakeof completeness. There are only a few public domain utility planning models available. In many cases,vendors are offering proprietary versions of the same model with additional features and software support.
A new model must compete against other models available from these various sources. Further, the modelmust offer benefits that outweigh the full costs to a utility of adopting a new model. The costs ofadopting a new model are much more than the model license and support fees. Substantial effort may berequired to obtain and format the data required by the model. Substantial staff and supervisory time maybe required to perform, review, debug, and interpret the first runs of a new model. Additional effort maybe required to integrate the model and its results into the utility's established planning practices.
In view of all this, our recommendations in the following sections focus on enhancing established modelsand practices rather than creating entire new modeling systems.
3.3 Resource Attributes in the Planning Process
Table 3-2 shows the types of models in which each of the attributes is modeled. These are the points atwhich the attributes enter the planning process. Each of the models listed for an attribute deals with oneor more of the subattributes. But Table 3-2 does not necessarily imply any correspondence betweenmodels and subattributes. The types of models to focus on in this review were determined by identifyingthose in the table associated with the key attributes in Section 2.2.
3-8

Table 3-2. Representation of Resource Attributes within Utility Planning Models
Attribute
CAPABILITY
Peak capabilityEnergy capabilitySeasonal profileHourly profile
AVAILABILITY
IntermittenceForced outagesMaintenance requirements
Correlation with:Weather
. Hydrological conditions
. System demand
EFFICIENCY
Heat rate
DISPATCHABILITY
Fully dispatchableCurtailableBase loaded
Constraints:Ramp rateMinimum outputMinimum up timeMinimum downtime
LOCATION
Delivery point: substation/feeder
MODULARITY
Incremental sizePre-construction lead timeConstruction lead time
Model Type
Bulk power marketComposite reliabilityGeneration reliabilityLoad flowProduction simulationProject economic analysisResource planning
Bulk power marketComposite reliabilityGeneration reliabilityProduction simulationProject economic analysisResource planning
Bulk power marketProduction simulationProject economic analysisResource planning
Production simulationProject economic analysis
Bulk power marketComposite reliabilityDSM cost-effectiveness analysisLoad flowProduction simulation
Expansion planningUncertainty analysis
3-9

Table 3-2. Representation of Resource Attributes within Utility Planning Models (cont'd)
Attribute
COSTS
ConstructionO&MFuelDecommissioningCorrelation with other system costs
INCENTIVES
Tax creditsShareholder incentivesEmission allowance incentives
RiSK
Start-up delay/cost overrunConstruction cost overrunFuel costsO&M costsReliability problemsPremature retirement/diversity
EXTERNAL COSTS
Air/water emissionsLand useWaste disposalPublic safety
Model Type
Bulk power marketCapital expendituresDSM cost-effectiveness analysisDSMp~e~~a~e~me~
FinanciaVratesNUG forecastingProduction simulationProject economic analysisResource planning
Capital expendituresDSM cost-effectiveness analysisFinanciaVratesProject economic analysis
FinanciaVratesGeneration reliabilityProject economic analysisUncertainty analysis
DSM cost-effectiveness analysisProject economic analysisProduction simulation
3-10

4.0 Modeling of Resource Attributes
Five attributes were identified in Section 2.2 as particularly important in evaluating renewable resources.These attributes are
CapabilityAvailabilityModularityLocationDiversity.
'This section reviews the state of the art in modeling these five attributes. Capability and availability arediscussed in the same section since many issues relate to both attributes. The five attributes need to beaccounted for in two types of analyses: systemwide and incremental. We address the modeling ofrenewable resources in both types of analyses.
The aggregate effect of all of the renewable resources in the plan on the output and operating costs ofother generation needs to be accounted for in systemwide analyses, whereas the incremental effect of arenewable resource project on system reliability and costs needs to be accounted for in incrementalanalyses of individual projects. Incremental analysis provides the basis for accepting or rejectingindividual options in the resource plan; systemwide analysis is a key component of revenue requirementsand financial forecasting and provides the baseline for incremental analysis.
Incremental analysis can sometimes be done with the same production simulation, reliability, and financialmodels that are used for systemwide analysis. The incremental effect of an individual resource iscalculated as the difference between the results from detailed model runs with and without the candidateresource. However, some renewable options are so small relative to the rest of the system that thesedifferences are discernable only in the least significant digits. Because of numerical approximations andthe behavior of unit commitment algorithms in production simulation, there may be no significantdifferences at all.
Therefore, for small projects, a marginal approach may be preferable for incremental analysis. A marginalapproach relies on system marginal costs calculated using detailed models at a level of temporal detailcorresponding to the resource option data available. This approach will be described further in thissection.
Whether a marginal approach or "with/without" runs of a detailed model are used for incremental analysis,the incremental analysis will depend on systemwide analysis. Therefore, it is important to modelaccurately the aggregate impact of renewables to the extent that the share of renewables in the resourcemix is sufficient to affect system marginal costs.
The fundamental issue underlying the relevance and importance of each attribute in IRP is cost. Theobjective of IRP is to select a combination of resource options that minimizes total costs. Our discussionof each attribute considers the potential impact that the attribute may have on total costs and how theattribute should be modeled to capture this cost impact.
For each attribute, we discuss the concepts underlying the attribute, methods for quantifying, ways theattribute is handled in current models, and utility practices in using the capabilities of the models. Inexamining the ways attributes are handled in current models, we focused on the selected 11 modelsdescribed in Section 1 and Appendix A.
4-1

4.1 Capability and Availability
4. 1.1 Concept
Two generating resource attributes--capability and availability-represent important characteristics thatmust be appropriately modeled to reasonably simulate both the operation of a candidate resource and itseffect on the operation of other system resources. The capability of a generating resource in a given timeperiod is its maximum capacity and energy output under normal conditions. The term availability refersto departures from normal conditions such as forced outages, maintenance, and unavailability of theunderlying fuel or energy source.
Some renewable resources operate as conventional resources. For example, a MSW plant operates muchlike a fossil-fired plant. Its dispatchability is determined by fuel supply and contractual constraints.However, wind and solar resources without storage or backup generation are very different fromconventional utility generating resources in several respects, particularly in regard to their
Time dependence• Short-term fluctuation of generation• Multiplicity of generating units.
Time Dependence. A utility cannot call on some renewable resources such as wind and solar to generateelectricity the way it can call on most of its conventional resources. Generally, a utility takes energywhenever it is available, given that the resources' variable operating costs are negligible. However, if thewind is not blowing or the sun is not shining, a wind or solar project without dedicated storage will notgenerate electricity, even though the generating equipment may be in perfect operating condition. Thus,the distinction between the resource's capability and its availability is somewhat blurred. Therefore, thisdiscussion merges the two resource attributes in the context of renewables.
The hour-to-hour delivery of power from wind and solar resources is difficult to forecast, particularly ona long-term basis. Short-term (daily) forecasts may be somewhat predictable, but the precision of suchforecasts will depend on the utility's degree of certainty about short-term weather conditions and thegeographic concentration of a utility's renewable resources. The more geographically concentrated autility's renewable resources are, the more dependent the utility's renewable generation will be onlocalized weather conditions, which are usually more difficult to predict than for larger regions.
Although the timing of power delivery from solar and wind resources may be difficult to predict, thistiming may be correlated with the utility system's peak demand in some circumstances. In some partsof the country, wind speeds commonly pick up in the afternoon, the time of day when utilities oftenexperience daily peak demands in the summer. Insolation also is likely to be near its high at the time ofdaily peak demand, at least in the summer. Careful identification of the sites within a utility's territorywhere peak wind speed or insolation coincide with peak demands is a critical first step for the appropriateevaluation of renewable resource potential. On the other hand, some utilities may find that their renewablegeneration opportunities are generally uncorrelated with their peak load periods. Therefore, carefulconsideration is required when modeling renewables in order to accurately reflect their contribution to theutility system. .
Table 4-1 compares the time dependence of several categories of renewable resources. An "X" under acolumn indicates that the characteristic can be found in the resource in the corresponding row. Thecolumns represent the time scale on which variations in output can occur outside of utility control,
4-2

Table 4-1. Time Dependence
Weather-DependentPredictable Variation Random Variation
Constant Seasonal Hourly Annual Seasonal Hourly Subhourly Correlation
Biomass X1,2 X3
End-Use Renewable X X X X
Geothermal X1
Hydro X4 X5 X X
MSW X1
Solar PV X X X X X
Solar Thermal X X X X X6
Wind X X X X X7
Notes:1. Thermal plant.2. Constant except under the conditions of note 3.3. If fuel availability varies seasonally and plant has no backup fuel.4. Pondage hydro.5. Run-of-river hydro with output dependent on daily flow or subject to regulatory stream flow restrictions.6. Except with thermal storage.7. Depends on location.

including both predictable and weather-related random variations. The column labeled "subhourly" relatesto short-term fluctuations, described in the next subsection, whereas the column labeled "correlation"indicates whether random variations can potentially be correlated with variations in demand.
Short-Term Fluctuation. Renewable resources may exhibit considerable fluctuations in power deliverythat must be balanced with the customer loads and accommodated through reliance on flexible,dispatchable, load-following generating units (such as intermediate-duty coal-fired facilities, combustionturbines, or diesel generators).' These fluctuations can occur in very short time periods. If the windvelocity at a site is erratic or the sun keeps moving in and out of patchy clouds, the power delivery fromrenewables at the site will fluctuate from one minute to the next. Obviously, the weather conditions ata specific site and the degree of geographic concentration of the renewables at the site will be majorfactors in the intermittence of power delivery. Short-term fluctuations may have different impacts on thegeneration system than on the T&D systems.
To the extent that utilities geographically diversify their renewable resources-that is, locate them farenough apart that erratic local weather conditions are averaged out-they may be able to reduce thefluctuations on the generation system. Otherwise, intermittent generation can complicate the operation ofa utility system.
From a system dispatcher's perspective, there is a difference between a resource that will operateconsistently at a certain capacity during an hour and one that may deliver the same average capacity overthe hour but may fluctuate by 10% or 20% above or below that value minute by minute. The fluctuatingresource will require the commitment of more capacity for load following and spinning reserverequirements. Spinning reserve refers to the amount of unloaded capacity available to a system dispatcherthat is currently synchronized with the power system. Since it can take some time to bring certain unitson line, units already on line but not operating at their full capacity represent a valuable resource that adispatcher can draw on if additional power is needed quickly. "Ramping up" these units can be donemuch faster than starting up similar units that are off line. An operating unit's contribution to spinningreserve is merely the difference between its maximum capacity and the operating point at which it iscurrently dispatched. A utility's spinning reserve requirement is a targeted amount of capacity (or percentof system load) that must be met or exceeded by the sum of all of the operating units' spinning reserves.If the system's spinning reserve drops below this requirement, additional units must be brought on lineto shore up the reserves.
However, the impact of an intermittent resource on system operations will depend on two issues: (1) thesize of fluctuations in resource output relative to the customer load fluctuations that are alreadyaccommodated and (2) the degree of correlation between the resource's fluctuations and the loadfluctuations. Regarding the first issue, the total amount of renewable resources subject to short-termfluctuation is likely to be small within the planning horizon of a utility. The renewable resource with thelargest capacity and energy share is generally hydro, which is not subject to short-term fluctuations.
On the second issue, it is likely that these minute-to-minute fluctuations will be largely uncorrelated.Although renewable generation and system loads can be highly correlated in some systems on an hourlyor daily basis, minute-to-minute fluctuations are different. Although loads certainly are broadly affectedby hourly and daily weather conditions, minute-to-minute load fluctuations are driven more by randombehavior patterns than by localized, temporary weather fluctuations. Overall, the impact of short-termfluctuation on the generation system is negligible if the range of fluctuations is small enough relative to
5Bose and Anderson (1984).
4-4

the rest of the system so that the rest of the system can absorb the fluctuations. In such cases, dedicatedstorage or backup generation offers little value.
However, short-term fluctuation may have a much bigger impact on the T&D systems because the rangeof fluctuations is not so small relative to the loads on the transmission or distribution circuit. Storagecapacity to accommodate short-term fluctuation or time-dependent generation that does not match loadmay be more beneficial on the scale of the T&D systems.
Multiplicity of Units. Wind and solar resources tend to be built as aggregated projects of many small,independent generating sources. This has reliability ramifications. One large unit has a higher varianceof available capacity than several smaller units of the same aggregated capacity, given the same forcedoutage rate and assuming that outages of individual units are independent of others. One might concludethat renewable units inherently provide reliability benefits because of their multiple-unit nature(notwithstanding the obvious drawback of being nondispatchable). However, the practical value of thisbenefit depends on the aggregate size of the renewable resources relative to the rest of the system. If theaggregate size of the renewable resources is much smaller than the rest of the system, then the differencein reliability impact between a single unit and several smaller units is negligible.
Further, the conclusion that several smaller units are more reliable is based on the assumption that eachof the smaller units has independent availability. With renewables, this may not be the case. As far asphysical availability (i.e., the equipment is in operating condition), it is likely that the routine equipmentfailure of individual units has little or no dependence on that of the other units." However, the energyavailability of a collection of renewable units at the same site is likely to be dependent. The weatherconditions at that site will be the driving factor in determining whether or not any units that are physicallyavailable will actually produce any power.
Given this interdependence, it is difficult to say whether the multiple-unit nature of a renewable projectprovides any additional reliability benefits. It is likely that renewable projects must be geographicallydiversified across a utility's territory to achieve any substantial availability independence. Even then, thedistances between facilities, or more specifically the differences in the area weather patterns, must be greatenough to allow for varying generating conditions. Thus, the fact that a renewable project usuallyinvolves many small units probably does not in and of itself provide reliability benefits. In the contextof utility modeling practices, this means that it is probably appropriate to model a cluster of renewableunits at one site as one resource.
4.1.2 Modeling Techniques
There are two general types of production simulation or dispatch models, chronological models and loadduration curve (LDC) models. Chronological models simulate the operation of the generation system fora sequence of points in time, often hourly, but sometimes on 2-hour, IS-minute, or other intervals. Somehourly chronological models simulate 8760 hours per year, others only 168 hours per week for selectedrepresentative weeks or 24 hours per day for representative days.
LDC models start by converting an hourly load profile into a LDC, which represents a probabilitydistribution of load within the simulation period. It then combines the LDC with probability distributionsrepresenting the availability of each of the generating units to create a sequence of equivalent load durationcurves representing the probability distribution of the demand on each unit. This approach provides some
6 Obviously, a widespread calamity such as a hurricane or flood could render an entire renewable facilityinoperable, but a single conventional resource could be equally vulnerable to such circumstances.
4-5

computational efficiencies but sacrifices the ability to deal with ramping rate constraints and otherchronological issues because the chronological pattern of load levels is lost. However, some chronologicalissues can be addressed by dividing the simulation period into subperiods and performing LDCcalculations separately for each subperiod.
The characteristics of renewable resources that are described above have presented utility planners withmodeling challenges that mayor may not be appropriately addressed in current modeling practices witheither type of model. With these renewable resource characteristics in mind, we examined currentmodeling practices and formulated conclusions discussed in greater detail below.
Utilities usually model renewables either as generating units or as load modifiers. These representationsare described in detail below. Either approach can be used to adequately assess the operationalcontribution of renewables to a utility system. However, biases can be introduced if the modeler is notcareful.
Generating Unit Modeling. As a generating unit, a renewable resource may be specified as being eitherdispatchable or nondispatchable. Dispatchability may be appropriate for some renewables such as MSWor time-dependent resources with storage, but it is not an accurate characterization of a wind or solarresource. Modeling a nondispatchable resource as dispatchable would allow generation to be dispatchedunrealistically into the hours of highest economic value and could understate any minimum load problemsthat might exist.
If time-of-day power delivery information is not available, modeling a time-dependent resource as agenerating unit with constant capability and an appropriate forced outage rate may yield a reasonableapproximation. The benefit of modeling the resource as a generating unit is that many utility planningmodels have probabilistic algorithms for addressing generating unit unavailability attributable to randomequipment failures. This feature could be used to reflect the uncertainty associated with renewable powerdelivery. In some models, unit unavailability is specified by a forced outage rate - the percentage oftime that a unit is expected to be unavailable. Other models (notably those of a chronological nature)allow a user to model a unit's availability by specifying probability distributions for the time betweenoutages and the time it may take to restore the unit to service. In renewable resource modeling, any ofthese availability features could be used to represent the renewable generation that would be curtailedbecause of equipment failure (usually a minor factor) or lack of wind or sunshine (the major factor thatlimits wind and solar resource generation).
Some models allow the user to modify a generating unit's capability on an hourly basis, thereby capturingthe hour-by-hour delivery characteristics that otherwise can only be captured by load modifier modeling.
Load Modifier Modeling. Utility planners often model time-dependent resources as loadmodifiers-hourly modifications to the system's loads. Most planning models provide a means of definingsuch hour-by-hour profiles that are subtracted from the loads in a manner similar to a system powerpurchase. However, most of the models that werereviewed do not seem to provide a convenient way ofrepresenting the uncertainty associated with renewable power delivery when modeling such resources asload modifiers. Nonetheless, such profiles allow planners to capture expected changes in resources on anhour-to-hour basis. Typically, utility planners develop an hourly profile that is representative of averageconditions and use that profile in a single simulation. Such a profile may be based on average weatherconditions at a site that is being contemplated for renewable resources. Figure 4-1 displays an exampleof a renewable resource power delivery profile and its impact on net system loads.
4-6

5000 ........,....------------------------,
4000
...-....CJ)
~~ 3000c'-"
c0~
(\j~
Q)2000c
Q)
CJ-......"0(\j0
....J
1000
2 4 6 8 1 a 1 2 1 4 1 6 1 8 20 22 24
Hours
- Original Loads
-+- Renewable Resource Generation
""* Modified Loads
Figure 4-1. Renewable resource power delivery profile
4-7
At least one model, EGEAS, provides a means of modeling load modifiers with forced outage rates toreflect the uncertainty associated with availability. The procedure is known as orthogonalization.r Unlikethe standard process of first subtracting load modifiers from the load profile and then dispatchinggenerating units, EGEAS sets these special load modifiers aside and dispatches them in a manner similarto generating units. EGEAS is a load duration curve model and uses a convolution technique forincorporating unit operational uncertainties into the dispatch process.
NREL has analyzed actual utility systems using Elfin. NREL found that different approaches for modelingrenewable resources result in significantly different costs. Modeling renewable resources as load modifiersin Elfin gives maximum credit to renewable resources. If the renewable resources are modeled asgenerating units, there is the possibility that they will be curtailed and there tend to be more start-ups andshutdowns for renewable resources with moderate or low capacity factors. Also, forced outage rates andmaintenance outage rates on generating units may reduce the capacity and energy credits of renewableresources.f
Another approach is modeling resources as energy-limited units. In this approach, the maximum andminimum capacities at which the resource can be operated and its maximum energy generation in thesimulation period must be specified. The model then determines the optimal profile of generation fromthe resource within the specified constraints. However, this approach is not appropriate for resourceswhose dispatch profile is not subject to control of the utility.
4. 1.3 Issues
Multiplicity of Units. Utilities usually do not try to model individual renewable power sources at aspecific site as small, discrete units. Instead, they combine the separate sources combined into one singlesource. This greatly simplifies the task of modeling a complete renewable facility and probably does notintroduce any significant modeling distortions.
Weather- versus Equipment-Related Unavailability. A large number of small units subject only toindependent equipment-related outages can be modeled as a single unit having a capability equal to theexpected total output of the units and an outage rate of zero. If these units are all subject to a commonweather-related uncertainty, they can be represented as a single unit having a capability equal to the totaloutput of the units under reasonable high-output conditions and a forced outage rate that yields theexpected output. Then the weather-related unavailability of this project can be convolved with the outagesof other units.
As an example of the case without weather-related uncertainty, consider a facility with 100 MW ofinstalled capacity and an expected capacity factor of 30%. This plant could be modeled as a 30-MWfacility. This will yield different results for both production simulation and generation reliability analysisthan modeling the facility as a lOO-MW resource with a 70% forced outage rate.
Uncertainty in the Time-Dependent Profile. During execution, most models process load modifiers byfirst making the adjustments depicted in Figure 4-1, then dispatching the generating units to meet theremaining loads. In most probabilistic models, only the generating units have availability probabilitiesassociated with them, such as forced outage rates or time-between-failure statistics.' There is implicitly100% certainty about the impact of resources modeled as load modifiers.
7 Caramanis et al. (1982); Caramanis (1983).
8 Milligan and Miller (1993).
4-8

Given such modeling conventions, a user may want to capture the uncertainty of renewable power deliveryby running multiple scenarios based on different assumptions about the hourly capability and availabilityof a resource. For example, a planner might develop profiles for low-energy, medium-energy, and highenergy scenarios for a renewable resource. As another example, partial correlation between renewableresource generation and peak loads could be modeled by developing more than one hourly profile ofgeneration. In either case, each of the profiles will have a probability of occurrence associated with it.A utility planner could then make several runs to simulate the utility system under the various assumedprofiles for the renewable resource. The results (e.g., total system costs or reliability indices) could beeither examined as separate scenarios to identify the range of possible outcomes or combined into expectedresults by weighting them with their associated probabilities. Figure 4-2 presents a schematic display ofthis multiple-scenario process.
Another approach is Monte Carlo analysis, in which the output of one or more renewable resourceinstallations is determined for a large number of conditions selected in a pseudo-random manner fromunderlying probability distributions. Whatever correlation exists between the installations can beaccounted for by appropriate structuring of the underlying distributions?
There are two approaches for representing weather uncertainty. One uses the forced outage rate. Theother incorporates different weather conditions into the typical days included in a load modifier. An8760-hour load modifier constructed of multiple typical days that represent a variety of weather conditionsand also capture whatever correlation exists between output and system load can yield results equivalentto Monte Carlo analysis. The forced outage rate approach requires partial outage rates to model somethingother than all-or-nothing availability.
Short-Term Fluctuation. Because the smallest time increment considered in most utility planning modelsis a single hour, the complicating effects of short-term fluctuations may not be captured. However, as wasnoted in the previous discussion on intermittence, the extent to which fluctuations cause problems for thesystem dispatcher depends on the magnitude of the fluctuations relative to the short-term load fluctuationsand their degree of correlation. Consequently, fluctuations on a subhourly time scale may not be verydisruptive, and ignoring them may be justifiable in modeling the generation system for long-term resourceplanning. A means of assessing whether or not this is the case for any specific resource is discussedbelow.
Assume that the minute-to-minute customer load fluctuations that a utility might experience in a particularhour were normally distributed with a standard deviation of 10 MW. In other words, there would be a68% probability that the load could fluctuate up or down from its current value by as much as 10 MWwithin a I-minute period.!" If the dispatcher used two standard deviations as a reference for committingload-following capacity, this would correspond to a targeted capacity of 20 MW, which would have a 95%probability of being sufficient (i.e., there would be less than a 5% chance that the fluctuations wouldexceed 20 MW). Now assume that a renewable project was added to the system that had an intermittentgeneration characteristic in which generation might fluctuate in a normally distributed fashion with astandard deviation of 2 MW. Of critical concern is the extent to which the addition of this resource willrequire the commitment of more than 20 MW of load-following capacity. Assuming that the dispatcherwanted to maintain the two-standard-deviation requirement, the new level of capacity would be determined
9 Yamayee (1984).
10 This is a property of a normal distribution - namely, that approximately 68% of the probability densityfunction lies within one standard deviation of the mean and that more than 95% lies within two standard deviations ofthe mean.
4-9

Figure 4-2. Multiple-scenario power delivery profiles
4-10

by calculating the standard deviation of the new system's fluctuations (i.e., the combined distributions ofboth the existing load fluctuations and the renewable resource fluctuations):
where:
Std DevL+R = J Std Deve + Std Dev~ + 2 ·Cov(L,R) (1)
Std DevL+R
Std Dev.
Std DevR
Cov(L,R)
=
=
=
standard deviation of the combined load and renewable fluctuations
standard deviation of the load fluctuations
standard deviation of the renewable fluctuations
covariance of the load and renewable fluctuations.
It was argued earlier that the load and renewable fluctuations are likely to be independent (i.e., they maynot be correlated in any way). Under this assumption, the covariance term in equation 1 would be zero.Thus, the standard deviation of the combined distributions would be 10.2 MW. ll Abiding by the twostandard deviation rule, the dispatcher would have to commit 2004 MW of load-following capacity insteadof 20 MW. Thus, the addition of a renewable resource with a two-standard-deviation probability of 4-MWpower fluctuations would not require an additional commitment of 4 MW of load-following capacity butonly 0.4 MW.
If additional renewable projects were added to the system and these projects were geographicallydiversified, it is likely that their short-term fluctuations would be uncorrelated. Thus, the addition of morerenewable projects to the system could stabilize the renewable "portfolio" and potentially result indiminished capacity commitment requirements for accommodating renewable generation fluctuations. Itis likely then that the costs associated with accommodating intermittent renewable generation may not bevery high. If current planning models do not capture this cost, they probably are not missing anythingsignificant.
Penetration Effects. The impacts of a particular type of renewable resource depends on the penetrationof that type of resource into the utility's overall resource mix. The impacts may change qualitatively asthe penetration increases. At low penetrations, potential negative impacts on the system are generallynegligible. But with high penetrations, negative impacts may become more significant. A number ofstudies of the impacts at different penetrations have been done and are reviewed by Wan and Parsons(1993).
Commitment Modeling. Many types of generating units have limitations on how quickly or howfrequently they can be brought on line or taken offline. Consequently, the utility dispatcher's job is moredifficult than simply turning different generating resources on or off as customer loads change.Commitment scheduling is the task undertaken by the dispatcher to identify which generating units shouldbe brought on line at the start of a day or week in order to ensure that the system can respond in a reliableand efficient manner to the peak loads and generation outages that may occur. Some background incommitment decisions is needed to understand how renewable technologies may affect these decisions.
11 10.2 =~ = JI02 + 22
4-11

Unit commitment decisions are based primarily on the following issues:
• Loss-of-unit contingency considerationsLoad-following requirementsUnit-specific operational constraintsThe need for spinning reserves versus quick start units.
If a unit suffers an operational problem and drops off line, the dispatcher must accommodate the loss ofthat capacity immediately. Likewise, if a transmission line fails, generating patterns across a utility'sterritory may have to change quickly. For these reasons, utility dispatchers usually commit more unitsthan they actually need. Committing a unit refers to bringing it on line to generate electricity.
Most generating units have a minimum capacity below which they cannot be operated; thus, when a unitis committed, it is dispatched at least to its minimum capacity. As mentioned previously in the discussionabout spinning reserve, the portion of a unit's total capacity that is above and beyond the currentlydispatched level represents capacity that can be utilized fairly quickly if necessary. Whereas it may takehours to start up some units, units that are already on line often can be ramped up to higher operatingcapacities in a matter of minutes. The speed at which this can be accomplished is referred to as the ramprate, in megawatts per minute. In addition to the ramping flexibility of committed units, a utility systemusually has "quick start" units, such as hydro units, combustion turbines, or diesel generators, that can startgenerating electricity in a matter of seconds.
The committed units and quick start units serve as the major supply of short-term capacity that can beused to follow the customer loads or respond to system emergencies (e.g., sudden loss of a generating unitor transmission line). Some units have operating constraints that make it difficult to take them off linefor short periods of time. In other words, if they are shut down, they must stay off line for a minimumperiod before they can be restarted. Therefore, utilities may be forced to keep such units on line throughlow-load periods (e.g., nights and weekends) even though they are not really needed. This generallyhappens when a unit is expected to be needed during the next day but will require too much time beforeit can be restarted if it is shut down.
Many planning models attempt to simulate a utility dispatcher's commitment decisions based on theoperational constraints described above. Generally speaking, the models focus on specific capacity targetsfor initial commitment decisions for each hour or for groups of hours and focus on ongoing requirementsfor spinning reserve decisions. In many models, individual generating units can be designated as eligibleto contribute these capacity targets or not.
For modeling a renewable resource, this poses some complications. Given the uncertainty associated withdaily renewable power delivery, one needs to ask what amount of credit toward spinning reserves arenewable resource provides. In reality, during days when the short-term weather outlook is favorable,a dispatcher may give a renewable project a reasonable amount of capacity credit in the commitmentscheduling process. On other days, when unfavorable weather looks likely, he or she may not count onany capacity from the project. However, the more variable the output of a renewable resource, especiallyduring the system peak hour, the less likely the system dispatcher is to view the resource's capacity assufficiently dependable to include in commitment decisions-even on what appear to be favorable daysfor the resource. For example, if the short-term weather forecasts are not sufficiently dependable, thedispatcher may err on the conservative side and decide against giving the resource full credit for itsexpected output. A model's ability to evaluate the effect of a renewable resource on unit commitmentdepends in large part on whether it adequately captures the effect of the resource on spinning reserverequirements.
4-12

Models differ in the degree of flexibility they offer for reflecting a renewable resource's contribution tothe commitment target and spinning reserves. Some models allow any value between 0% and 100%;others only allow the user to specify the resource as contributing either 100% firm capacity or no firmcapacity at all. Designating the renewable resource as 100% firm may be appropriate if it has beenmodeled with a maximum capacity that is comparable to the project's expected value of output during thesystem peak hour. However, if the dispatch policy is conservative, even the expected output may overstatethe capacity commitment benefits of the renewable project. If the project is modeled as a generating unitwith a capacity equal to total installed capacity, this could significantly overstate the resource'scommitment scheduling benefits because the average output of the project may be well below the installedcapacity. Even if the user has designated a large forced outage rate to reflect the daily availability realitiesof the project, this may not be included in a model's commitment calculations.
If the user models a renewable project as a load modifier, the system loads will be reduced during thespecific hours that generation is expected from the project. Some models use the net system loads (i.e.,after load modifiers have been subtracted from them) as the basis for establishing commitment targets.For example, capacity targets might be specified as a percentage of the net peak load or as a level thatwould cover the net system loads for some percentage of the day. If this is the case, the model wouldconsider only a portion of the renewable generation impacts as finn contributions to the commitmenttargets. Not all of the capacity would be given credit-only a portion that would be comparable to theload target percentage specified by the user.
A simplistic example illustrating this issue is provided by a hypothetical utility with a 1000-MW peak anda commitment target of 90% of the net peak. If there were no load modifiers modeled, this would meanthat 900 MW of slow-start capacity would need to be committed, with each committed unit operating atits minimum capacity rating before any units could be dispatched at higher operating levels. Assume thatthe utility had a renewable resource that had a maximum output of 100 MW that tended to be very closelycorrelated with the system peak. Assume that the utility also had 'conventional resources that included one500-MW generating unit and half a dozen or so loo-MW generating units. Table 4-2 compares theimpacts on commitment decisions if the renewable resource were modeled as a generating unit or as a loadmodifier.
When the renewable resource is modeled as a generating unit, the net peak is 1000 MW and thecommitment target is established at 900 MW (90% of the net peak). The commitment target is satisfiedby the commitment of five generating units: the 100-MW renewable unit, the 500-MW conventional unit,and three loo-MW conventional units. In the load modifier case, the net peak is reduced by the 100-MWrenewable resource; however, this only results in a reduction of the commitment target by 90 MW (from900 MW to 810 MW). Effectively, the renewable resource's contribution to the commitment target isreduced from 100 MW to 90 MW. This results in the ultimate commitment of more conventional unitsthan in the previous case because an additional l00-MW conventional generating unit is required to reachthe commitment target The commitment of the additional resource will translate into higher simulatedsystem costs.
This is not to say that modeling renewable resources as load modifiers is incorrect. However, a utilityplanner must be aware of the algorithms employed in his or her planning model and determine whetheror not data adjustments may be necessary to overcome inadvertent biases. In the case of commitmentalgorithms, modeling renewables as generating units or load modifiers may not make much of a differencein simulation results unless the renewables become a sizable portion of a utility's generation mix.
4-13

Table 4-2. Comparison of the Impact on Commitment Decisions of ModelingRenewable Resources as Generating Units or Load Modifiers
Generating Unit Load Modifier
Total peak 1000 MW 1000 MW
Load modifier OMW 100 MW
Net peak 1000 MW 900 MW
Commitment target (90%) 900 MW 810 MW
Units needed to meet target 100-MW renewable unit 100-MW renewable unit1
500-MW conventional unit 500-MW conventional unitThree 1OO-MW conventional Four 100-MW conventionalunits units
1Note: The renewable unit is already "committed" because it was subtracted from the loads; however, itdoes not get included in the capacity calculations for meeting the 810-MW commitment target.
4.1.4 Summary
There are several modeling considerations that utility planners should keep in mind when modeling thecapability and availability attributes of renewable resources. First is the availability of site-specific datathat provide time-of-day generating information. If such data are available, it may be beneficial to modelthe resource as a load modifier if the planning model allows for hourly definition of such modifiers (asmost models do). The load modifier can be constructed to represent the uncertainty associated with thetiming and quantity of the resource's generation. Merely taking an hour-by-hour average to collapseseveral years of data into a generation profile for a planning model will result in a profile that is likelyto understate both the resource's maximum capability and the variability of its output. Instead, a plannermay want to examine different years of data and develop several different profiles to use as scenarioswithin a multiple-scenario process.
A planner should examine the degree to which the capability and availability of a renewable resource maybe correlated with the system peak load. If the resource is not correlated with the peak, modeling it asa generating unit in a probabilistic model is likely to overstate its value to the system. If the resource isonly partially correlated with the peak, a planner may use a multiple-scenario process to capture theuncertainty of the correlation. This would probably entail the use of the load modifier modelingtechnique. In the simplest case, two scenarios could be developed and assigned probabilities: one inwhich the resource produced its maximum output during the system peak, and the other in which themaximum output was achieved in some other nonpeak hour.
If a planner is examining several different renewable projects, some thought should be given to the degreeof correlation between the projects. Those resources that are located in close proximity (and are of thesame renewable category, such as wind) are likely to be more correlated than a geographically diverse setof resources. Even if resources are far apart, the weather patterns of the different regions may becorrelated, thereby resulting in similar patterns of generation between the projects. In most planningmodels, the availability of a generating unit is assumed to be independent of the availability of other units.
4-14

Therefore, if the generation from different renewable projects is expected to be correlated, the projectsprobably should not be modeled as generating units.
With regard to the simulation of renewable resource capability and availability, it is difficult to generalizeabout any biases either for or against renewables that may be present in a particular planning model orthat may be inherent in generating unit or load modifier modeling techniques. The data constructs of aspecific utility in a specific model would have to be examined and tested to determine whether or not arenewable project was being appropriately represented. Therefore, this discussion has focused more ongeneral issues that cut across most planning models. Planners should examine these issues closely toensure that they are appropriately modeling renewable resources.
4.2 Location
4.2. 1 Concept
In four general ways, the location of a resource option can affect the utility's rest-of-system costs and thecosts borne by customers:"
1. Integration cost. Unless the option is located at a site that is already served by adequate T&Dto handle the output from the option, additional capital investment will be required to integratethe option with the system.
2. Losses. If the option is distant from customer loads, then a portion of the output from the optionwill be consumed by T&D losses. If the option is close to customer loads, then a much smallerportion of the output will be consumed by losses. In fact, if the option displaces more distantgeneration, then the losses associated with the displaced generation also will be avoided.
3. Avoided reinforcement costs. Resources sited in particular areas can serve local loads andpotentially defer investments in T&D reinforcements that would otherwise be required.
4. Reliability. Whether or not an option defers T&D reinforcements, it can affect the reliability ofservice to the local area. Reliability may be affected either by changing the probability that circuitflows will exceed ratings or by providing a backup supply to maintain the continuity of servicein contingencies that would otherwise result in curtailments.
Table 4-3 shows the levels at which various renewable resources are typically connected and whether theyare typically located remote from or close to loads. Of course, resources are occasionally connected atlevels other than those indicated in this table. End-use renewable applications may not be connecteddirectly to the utility system but displace loads at the primary or secondary distribution level.
In traditional utility planning, the three functional levels-generation, transmission, and distribution-areplanned separately. The distribution system is planned to meet local customer needs. The generationsystem is planned to meet total systemwide customer demand at the lowest cost. The transmission systemis planned to connect generation to the distribution system and has some degree of redundancy for networkreliability and flexibility. .
12 This review addresses only grid applications of renewable resources. There is an additional wide range ofnongrid applications.
4-15

Table 4-3. location
Remote Interconnection levelfrom
versus Bulk Area Primary SecondaryClose to Transmission Transmission Distribution DistributionLoads (Generation) (Substation) (Feeder) (Small Customer)
Biomass Either X X
End-UseRenewable Close X X
Geothermal Remote X X
Hydro Remote X X X
MSW Close X X
Solar PV Either X X X
Solar Remote X XThermal
Wind Remote X X X
Transmission is considered in generation planning primarily in two ways:
1. In screening level analyses of generation options, preference is sometimes given to options thatcan be sited close to load centers or easily connected to the existing network.
2. In detailed analyses for decision making, the costs of connecting an option to the existing networkare included as a component of the total cost of the option.
But the relationship between the planning processes at the three functional levels is, at best, "arms length."
In recent years, the location of resource options has been getting increased attention with the emergenceof the concept of the distributed utility (DU), also known as dispersed system or distributed resourceplanning.i ' The fundamental idea of DU is that some types of resource options-for example,photovoltaics, diesel generators (gen sets), and DSM-are particularly suited to distributed or disperseddeployment (at numerous locations close to customers) and provide unique benefits relative to centralstation options.
This section addresses issues related to location for both central station and distributed options.
4.2.2 Modeling Techniques
Central Station Options. In evaluating central station options, the following types of studies are done toevaluate transmission system requirements and impacts:
13 Lamarre (l993)~ Quantitative Solutions (1993).
4-16

1. Power flow-to determine the impact of an option on line and transformer loadings, voltagelevels, reactive power requirements, losses, and required system reinforcements. Power flowstudies are performed for multiple scenarios representing various levels of system load andcontingencies, or combinations of generating units and transmission circuit elements out of service.If overloads or voltage limit violations are found for particular scenarios, then reinforcements arerequired to avoid those conditions.
2. Fault analysis-to determine whether an option impairs the ability of the system to handle a faulton the transmission system.
3. Dynamic stability-to determine whether an option has a significant impact on the ability of thesystem to withstand disturbances on the system. Dynamic stability refers to maintaining withinacceptable bounds the excursions of power flows, voltages, and frequency that result from adisturbance and the ability of a system to settle down to a new steady state.
If required reinforcements are identified in the power flow studies, then cost estimates for thesereinforcements are developed. If dynamic stability problems are identified, then changes in operatingpolicies to avoid those problems, such as limits on simultaneous transfer over a set of circuits orimprovements to the system to mitigate such problems, are identified and their costs are estimated.
Distribution system impacts are not relevant in evaluating central station options.
Approximate Analysis for Medium and Small Options. The analysis described above for central stationoptions requires substantial computational effort and personnel time to set up and evaluate the computersimulations. Approximate methods have been developed for medium and small generation options. Thesemethods use automatic sensitivity analysis of an optimal power flow model to identify the effects ofresource additions at various locations on losses and on the need for reinforcements. They assume thatthe stability impacts of these options are negligible.
An example of this approach is the LOCATION model developed by the Pacific Gas and ElectricCompany (pG&E) as part of the MABS effort.!" It derives incremental loss factors and marginaltransmission capacity costs at various locations on the system. These values are input to the MABS modelto do a marginal analysis of resource options.
Distributed Utility Options. DU options include both generation technologies that can be located closeto customers and DSM options. DU planning includes T&D with generation and DSM options in theoverall integrated optimization framework. Three possible locations for DU options and the benefits theyyield are:15
• At the substation
- Relieve transformer loading and defer investments in new transformer capacity
- Improve reliability by reducing the probability of transformer overloads and by allowing continuityof service to customers connected to the substation.
14 Shirrnohammadi and Thomas (1990).
15 El-Gassier et al. (1991); Energy and Environmental Economics and Pacific Gas and Electric Company(1992); Ma and Isaksen (1979).
4-17
• On the feeder
- Defer conductor and line equipment replacements by reducing line loading
- Improve voltage profile along the feeder
- Improve reliability by reducing the probability of circuit overloads and by allowing continuity ofservice to customers along the feeder as an "island" when supply to the feeder is interrupted or byproviding voltage support to enable a larger portion of the load on a faulted feeder to be served byback-feeding from another feeder
- Reduce line losses.
• On the customer's premises
- Provide backup generation for customer service reliability.
These benefits are cumulative. For example, a DU option located on a feeder would provide benefits atthe central generation, transmission, substation, and feeder levels. At customer sites, it is possible torealize benefits at all levels.
Approaches for evaluating each of these benefits have been developed in recent years and are describedbelow.
PG&E developed an approach for evaluating the benefits from deferring investments in new transformercapacity and conductor and line equipment replacements. This approach was demonstrated in a pilotproject to target DSM in a local area to defer T&D reinforcements, known as the Delta project.16 Theapproach develops an integrated T&D and DSM plan that minimizes the cost of serving a local subarea.
It is applicable to renewable resources and other DU options as well as DSM.The key steps in this approach, shown in Figure 4-3, are the following:
Step 1. Develop a base case T&0 investment plan for the local subarea. This plan establishes thereference point for determining marginal T&D costs.
Step 2. Calculate marginal T&D costs. Alternative approaches are discussed in the next subsection.
Step 3. Determine the impact on feeder and substation load profiles of the candidate DU options.
Step 4. Perform cost-effectiveness evaluation of the DU options. This requires the marginal T&D costsand load profile impacts, as well as the option costs and marginal generation energy and capacitycosts.
Step 5. Select DU options and T&D deferrals.
Step 6. Iterate. Recalculate the marginal costs. Redo steps 4 and 5 if the change in marginal costs maybe sufficient to change the cost-effectiveness of the DU options relative to each other andrelative to going ahead with the T&D projects.
16 Energy and Environmental Economics and Pacific Gas and Electric Company (1992).
4-18

Step 1.Develop Base Case
T&D Plan
Step 2.Calculate Marginal
T&D Costs
Step 3.Evaluate DULoad Impacts
Step 4.Evaluate
Cost-Effectivenessof DU Options
StepS.Select DU Optionsand T&D Deferrals
Done
No
Figura 4-3. The distributed utility planning process
4-19

The benefits of improving a feeder voltage profile can be evaluated using this approach by deterntiningthe extent to which investments required for an acceptable voltage profile are deferred by a DU option.
Value-based resource analysis (VBRA) provides a method to evaluate the reliability benefits of a DUoption. In VBRA, alternative configurations of an electrical system are compared on the basis of totalcosts, which are defined as the sum of capital costs, operating costs, and unserved energy costs. 17
Unserved energy costs represent the economic costs to customers of the outages that would occur giventhe reliability of a particular configuration.
Unserved energy cost is typically calculated as the product of expected unserved energy and a customeroutage cost. The expected unserved energy is calculated by a failure mode and affect reliabilityanalysis. IS At the distribution level, the calculations can be done by hand. The customer outage costrepresents the cost per kilowatt hour of energy not served as a result of an interruption. The customeroutage cost is often determined from customer surveys. A project that improves reliability will reduceexpected unserved energy and unserved energy costs.
In a pilot project to demonstrate the local benefits of a photovoltaic installation, known as the KermanProject, PG&E found that the photovoltaic plant, located between the Kerman and Biola substations, couldoffer continuity of service to a portion of the customers who would otherwise be interrupted if eithersubstation experienced an outage. 19
4.2.3 Issues
Hourly Profiles. Whether a particular OU option can defer a transmission or distribution reinforcementdepends on the impact that option has on the hourly profile of demand on the circuit elements to bereinforced. The impact on peak demand is not necessarily the maximum demand impact of the option,unless the maximum impact of the option is coincident with the peak demand on the circuit. Even if thepeaks of the two variables are coincident, consideration of the original feeder peak hour only is inadequateif the hour of the net peak demand shifts as a result of the DU option. Therefore, it is in general essentialto consider the full hourly profiles of original demand and DU option capability.
Marginal Costs Differentiated by Time and Location. The economic value of a DU option depends onwhere the option is installed and on the hourly profile of its capability. The system marginal costs usedin evaluating benefits must account for variations in marginal costs between different locations andvariations over time. This issue is most important for marginal T&D costs. System average marginalT&0 costs are inappropriate because they do not reflect geographical variations, they do not reflectdifferences in demand reductions between peak hours and other hours, and they do not reflect year-to-yearvariations that determine the timing of reinforcements.
Determination of Marginal T&D Costs. There are a number of different ways to determine marginalT&0 costs. Three alternative approaches are
17 RCGlHagler Bailly (1994).
18 Billinton et al. (1993).
19 El-Gassier et al. (1991).
4-20

1. Incremental present value2. Power-flow sensitivity3. Value-based.
The incremental present-value approach is used as the basis for marginal T&D costs in the Delta model.It first constructs a hypothetical load reduction, then constructs a modified T&D investment plancorresponding to the additional load reduction. The difference between the present value of investmentcosts for the two plans is estimated. This difference is then divided by the load reduction to get themarginal T&D cost.20
The power-flow sensitivity approach is used by the LOCATION model to calculate marginal transmissioncosts, as mentioned above. This approach starts with the generic cost for reinforcing various types offacilities. The marginal transmission cost attributable to a change in generation or demand at a particularlocation is calculated by multiplying the costs of reinforcing the facilities required to serve that locationby factors representing how close these facilities are to being overloaded. These factors are calculated onthe basis of sensitivity analysis with an optimal power flow mode1.21
The value-based approach starts with the principle that in an optimal capacity plan the marginal cost ofan increment of capacity is equal to the marginal benefit. The marginal benefit of an increment oftransmission or distribution capacity is related to the operating cost savings and reliability impacts itprovides.22 Operating cost savings include reduced losses and fuel cost savings resulting fromeliminating transmission bottlenecks. The reliability impacts are reduced interruptions of service tocustomers. The economic value of the reliability benefits from an increment of capacity is calculated bydetermining the reduction in unserved energy and multiplying this reduction by an outage cost representingthe cost to customers of unserved energy.
Both the incremental present value and value-based approaches require a base-case T&D plan for eachsubarea under consideration. The incremental present value approach requires this plan as a basis fordetermining the cost reduction resulting from deferring the plan in response to a reduction in demand.The value-based approach requires this plan as a basis for determining the reliability of service tocustomers and the effect on reliability of incremental capacity.
The incremental present value and value-based approaches will yield equivalent results if the utility plansT&D additions to minimize the sum of capital, operating, and unserved energy costs. However, thisapproach to T&D planning is not widespread. Traditional T&D planning criteria may result in eitherhigher or lower overall levels of capital expenditures in T&D reinforcements. If a utility's planningapproach yields higher T&D investments than a value-based approach, then the marginal benefits ofcapacity will be lower than the marginal costs. Value-based approaches to T&D planning are likely tobe used more widely in the future as utilities seek to control T&D investments more closely.
Reliability Benefits. The reliability impact of distributed generation options depends on how they areoperated under emergency conditions. As mentioned above, distributed generation can conceptuallyimprove reliability by allowing continuity of service to customers along the feeder as an "island" whensupply to the feeder is interrupted. However, typical utility practice is to separate distributed generation
20 Energy and Environmental Economics and Pacific Gas and Electric Company (1992).
21 Shirmohammadi and Thomas (1990).
22 RCGlHagler Bailly (1994).
4-21

from the system in any abnormality. One reason for this practice is to reduce the risk of electrocution toemergency crews dispatched to clear faults. A consequence, however, is that certain potential reliabilitybenefits of renewable options are not realized.
Level ofEffort. A drawback of considering location is the increased level of effort and data requirements.Detailed T&D investment plans are required. Analysis must be repeated for different locations.Additional complexity is introduced into the IRP process, as well. T&D planning involves severalcomplex models that are not part of an IRP process without T&D. These include load flow, transientstability, and fault analysis models. Some practitioners recommend that analysis should focus on a 3-5year planning horizon and on first-order impacts to manage the overall level of effort and complexity."
4.2.4 Summary
Location has long been recognized as an important attribute of major central station generation options.Techniques for fully incorporating location in the evaluation of central station options have beenthoroughly developed and are well entrenched in planning processes.
However, because these methods require running large computer programs for each individual option, theyare not suited to the evaluation of numerous options at numerous locations, as is required for DU planning.DU planning has been accomplished in relatively small local areas on a pilot testing basis, but has not yetbeen applied on a systemwide basis at the distribution level. Systemwide evaluation of the locationattribute has been done only at the transmission level using an approximate approach in the LOCATIONmodel.
A critical need for systemwide DU planning is the ability to automatically generate optimal T&D plansfor each local subarea. For a large utility like PG&E, with more than 200 distribution planning areas, thisis a substantial requirement.
Location benefits can be a substantial fraction of the total benefits of an option. For example, PG&E'sKerman study shows that the location benefits, including transmission capacity, substation and distributionsystem value, reactive power value, and reliability benefits are more than one-third of the total benefitsprovided by a photovoltaic station at the Kerman Substation."
4.3 Modularity
4.3. 1 Concept
Modularity is an advantage that some renewable resources have over many conventional resources.Modularity is defined by the incremental size of resources and the lead time required for adding them.Some of the benefits of modularity show up only in uncertainty analyses, while others show up in singlescenario analyses as well. Modularity concepts are discussed in this section, as well as the modeling ofmodularity in planning studies.
23 Barakat & Chamberlin, Inc. (1993).
24 El-Gassier et al. (1991).
4-22

Incremental Size of Renewable Resources. Some renewable resources, such as wind or photovoltaics,can be built in small increments. They may be constructed from individual units of a few kilowatts each.On a utility scale, when the analysis is often concerned with units of at least 50 MW, it takes manyindividual units of renewable resources to achieve the size of units normally considered in modelingstudies using the models examined here. For example, Northern States Power recently received bids for25 MW of renewable resources that consisted of 50 to 100 individual wind turbines.
The small incremental size of renewable resources allows utilities to more closely match capacity to loadwith renewable resources than with "lumpy" resources. Utilities can avoid the temporary overcapacity thattypically results from adding a large, new conventional resource. Utilities can add only enough modularrenewable resources each year to exactly match load growth requirements; this should help reduce autility's costs and make the cost of renewable resources more competitive with conventional resources.
Not all utility modeling takes advantage of the modularity of renewable resources. Generation expansionmodels are often designed to handle power plants that are added in discrete increments of capacity, eventhough this approach is computationally more difficult than dealing with plants with variable capacitysizes. Studies typically consider, for example, units of 50, 80, or 120 MW, and not a plant of any sizefrom 30 to 140 MW. Using models that add plants with variable sizes may be useful for analyzingmodular renewable resources. This variable size approach would allow the utility to analyze the benefitsof adding only the capacity required to match its planning criteria.
The modularity of renewable resources means that a large number of units may still add up to a smallaggregate amount. Modeling small units may be a concern, however, because the units may be too smallto see in the modeling. A production costing model analysis of a utility with several thousand megawattsof capacity may not provide sufficient resolution for an incremental analysis of a renewable resource ofonly a few kilowatts or even up to a few megawatts. In some cases, the number of significant digits inthe model may not be enough to analyze the renewable unit. It may be necessary to analyze smallrenewable projects on a marginal basis or with approaches like those used for analyzing DSM, rather thantrying to include them in generation planning models. Some of the integrated resource planning modelsthat could model a renewable alternative as either similar to a DSM option or as a generation option maybe preferable to models that have only a generation planning option.
Short Lead Times. Another aspect of modularity is that it generally requires only short lead times forpermitting and constructing renewable facilities. Short lead times are valuable to utilities because of theuncertainty in future demand levels and fuel prices. Short lead times mean that utilities can delay makingdecisions on adding resources until additional information about uncertain factors is known.
Short lead times also are important to utilities and shareholders as a means of reducing the potential forregulatory disallowances. Modular resources minimize the risk of disallowances from excess capacitybecause short lead times reduce the likelihood of constructing plants that result in excess capacity. Shortlead times also reduce the amount of capital that is at risk if a plant is cancelled. With short-lead-timeplants, a greater proportion of expenditures are concentrated close to the completion date and are,therefore, eliminated if a plant is cancelled.
Short lead times have the further advantage of reducing construction financing costs relative to directconstruction costs. Construction financing costs under traditional utility rate making are accumulated inan account called allowance for funds used during construction (AFUDC), which is added to the directcosts to determine the total capital cost of the project to be recovered through rates after the project comeson line. Financing costs compound over the construction period The longer the construction period, thegreater the compounding of financing costs. Conversely, a shorter construction period results in a lowerrelative share of financing costs.
4-23

Renewable resources often have shorter lead times for permitting and construction than conventionalgenerating units. A coal-fired generating unit may require 3 years to permit and license; a renewablefacility may require 1 to 2 years. According to EPRI's Technical Assessment Guide (TAG). it may take1 year to construct a photovoltaic or wind facility, whereas conventional facilities could take I year(combustion turbines), 2 years (combined cycle facilities). or 3 or more years (pulverized coal). Leadtimes for permitting and construction of an advanced light-water reactor unit are 4 and 5 years inTAG.25
The modularity and flexibility of renewable resources are important because many factors affectingcapacity requirements are uncertain. Growth in demand, in particular. is uncertain. Many utilities in the1970s and 1980s discovered this when they started construction of coal and nuclear power plants inresponse to high growth rates and then had excess capacity when growth slowed. Because of continuinguncertainty in load growth and regulatory disallowances due to excess capacity. many utilities now eschewlong-lead-time options.
Planners in the Pacific Northwest also concluded that the standard modeling approach did not show thebenefits of short-lead-time options. They concluded:
Traditional planning models typically are designed to schedule or evaluate a set offuture resources under one specific load condition or forecast. Loads are treateddeterministically, and resource plans are formulated as if a utility has perfectknowledge of future loads where demand and supply are in close balance over theplanning horizon. This type of study structure reflects none of the benefits inherentin short lead time resources. A study that assumes perfect information on load willshow no economic difference between two resources that have the same total cost,regardless of any differences in lead time.26
4.3.2 Modeling Techniques
Multiple Scenarios. The benefits of modularity are exhibited most when there turn out to be differencesor changes from the forecast. Utilities and utility models often do not include analyzing changes invarious factors once a decision has been made. Utilities often look at high, medium, and low demandgrowth, but not at growth rates that change over time. It is this last case where the value of renewableresources is more apparent This case includes both the situation when demand growth is low or mediumin the first few years and then suddenly accelerates and when high or medium initial growth is followedby low growth. Even the models such as MIDAS and IRP-Manager that include a decision analysisframework often do not account for the benefit of short lead times. Branches for high growth and lowgrowth are included, but the branch has high or low growth for the whole forecast period and not highgrowth changing to low growth or vice versa. Many utility models also do not provide a way to combinethe results of different sensitivity cases. Most utilities and models examine only the current set ofassumptions other than providing the option of waiting 1, 2, or 3 years to determine the impact ofuncertain factors. The models do not provide an indication of the value of "perfect information, II to usethe decision analysis term.
25 Electric Power Research Institute (1989).
26 Northwest Power Planning Council (1991), Volume Il-Part Il, p. 940.
4-24

Flexible Start-up Dale. Another approach was used in the Multi-Attribute Bidding System (MABS).MABS performs an incremental evaluation of specific resource options and incorporates a feature toevaluate the benefits of start-date flexibility. A resource with a short lead time can provide greater startdate flexibility than one with a long lead time, MABS calculates the net benefits of a project for eachof three different demand scenarios. If the project offers start-date flexibility, then maximum accelerationand deferral are assumed in the high and low demand scenarios, respectively.
In the high-demand scenario, MABS assumes that the project is accelerated to the maximum extentpossible given its lead time. The net benefits in the high-demand scenario are higher than they would bewithout the acceleration because of benefits obtained in the years between the accelerated start date andthe base-case start date. Similarly, in the low-demand scenario, the net benefits are higher, or the absolutevalue of negative net benefits is smaller, because net losses in the years between the base-case start dateand the deferred start date are avoided. MABS explicitly displays the gain that results from accelerationin the high scenario and the reduction in loss that results from deferral in the low scenario.
Probabilistic Simulation. Recognizing the importance of explicitly capturing the benefits associated withincreased flexibility in a resource portfolio, planners in the Pacific Northwest developed the IntegratedSystem for Ana.}Ysis of Acquisitions (ISAAC) model, which incorporates more analysis of uncertainty thanmany models? ISAAC performs Monte Carlo simulations of uncertain factors such as load growth,fuel prices, hydro resources, resource costs and completion times, and out-of-region markets and supplies.For example, probability distributions are created for each of these variables. For each year in the future,a random draw is taken based on the probability distribution. In addition, trend growth rates may bemodified because of random shocks, resulting in more volatility in the variable. The model makesdecisions to add resources in future years based on the existing load levels and the expected load growth,but actual load may turn out to be significantly different. The changes in growth rates during thepermitting and construction periods for specific resources can show the benefits of options like renewableresources that have shorter lead times.
A probabilistic approach is also used in the Over/Under mode1.28 The Over/Under model simulates theevolution of the resource plan through a decision tree and determines the optimal reserve margin tominimize total costs. Options with short lead times allow the minimum cost to be achieved at a lowerreserve margin.
Expansion Planning Methods. The analysis of modular resources involves considering the approach usedby planners to determine the addition of resources. There are several approaches used in utility modelingfor adding new resources, including:
• Manual insertion of new resources• Adjustment of timing of a fixed set of resources• Single-scenario optimization• Decision-tree optimization.
The simplest approach for system expansion planning is the manual approach. The utility planners insertnew resources at specific times and in specific sizes. The model is then run with the specified expansionplan. To consider alternatives, the planners can specify alternative expansion plans'or assumptions andrerun the complete model. The results under different alternatives are then compared and the least-cost
27 Northwest Power Planning Council (1991).
28 Decision Focus, Inc. (1978).
4-25
alternative identified is generally selected as the plan to be constructed. This is the approach that mustbe used with pure production costing models such as PROMOD and the original version of Elfin.
One constraint with the manual method is that there may be fewer alternatives that can be considered thanwith automatic models. The physical ability to run sufficient alternatives may be a limiting factor.
In the second expansion planning method, a fixed order of generating alternatives is supplied to the model,and the model adjusts the in-service date of these alternatives to match capacity requirements. Forexample, the model may be told to add a coal unit first, then a combustion turbine, and then a confinedcycle. The model selects the base-case in-service date for each unit; as the load forecast is changed, theunits are installed in the same order as for the base case, but the model changes the in-service date of theunits.
The third alternative is single-scenario optimization. The model is supplied with a list of alternatives andselects the least-cost set of alternatives for a given set of input assumptions on, for example, growth, fuelcosts, and capital costs. In essence, the models and their optimization routines assume that the future isdetermined by the assumptions used in the single scenario. This is the approach used by generationexpansion models such as EGEAS and the ICEM version of Elfin and IRP- Manager. Dynamicprogramming packages in EGEAS and PROSCREEN also optimize the plant selection under theassumptions of a single scenario.
We refer to this as single-scenario optimization because only one set of assumptions is used in each run.The cost of an option must be considered in the context of the scenario studied. Because the calculatedcost is based on the assumptions made and because there is considerable uncertainty in those assumptions,many utilities perform, and many utility commissions require, sensitivity studies using differentassumptions. High, medium, and low scenarios for load growth and fuel prices are usually the minimumset of alternatives run. Scenarios with changing growth rates also are desirable. Some integrated resourceplans report the results of nearly 100 sensitivity studies.
The fourth approach to modeling capacity expansion is decision-tree optimization. The approach explicitlyconsiders multiple alternatives for factors such as load growth and fuel costs, although some models onlycalculate results for a given expansion plan rather than optimize the plan. Rather than a single costestimate for an expansion plan, therefore, the model returns an expected cost that reflects the probabilityof occurrence of various scenarios.
4.3.3 Issues
It is potentially important to separate the lead time required to construct resources into the permittingphase and the construction phase, each of which is initiated by a utility decision. The first decision is tostart pre-construction activities on a unit, including permitting, licensing, and engineering design. If thepermitting phase for a resource option is successfully completed, the option can go into an inventory ofpotential projects. Resources can be held in inventory for several years, but they may also "fail" whilethey are in inventory. The second decision is to start construction of a resource from the inventory ofavailable projects. A strategy of adding resources in two separate phases would significantly reduce therisk of adding resources, because the failure of projects is often associated with the permitting phase andnot the construction phase. Pursuing the pre-construction activities prior to need would enable the riskinherent in this step to be addressed. Then the risk of construction is reduced because the lead time forthe construction decision alone is much shorter.
4-26

Adding resources in two steps is a potential benefit to renewable resources because of the combinationof the short lead time and small capacity increments relative to conventional resources. If a renewablesite is permitted and licensed, additional increments of capacity could be constructed each year on an asneeded basis. Permitting a whole wind farm or solar field would separate the pre-construction lead timefrom the construction lead time. Once permitting, licensing, and engineering design are complete for theentire field, the utility would have only a very short forecast period to determine the need for additionalresources and to construct them.
This approach would provide a utility with much more flexibility than building large, central station powerplants. The utility could wait until it is confident that it needs more capacity, and then build only as muchcapacity as it needs. Excess capacity should be minimized with this approach-both the large excesscapacity resulting from changes in demand growth during construction of projects with long constructionperiods and the "lumpiness" associated with adding large increments of capacity.
However, separating lead times is not a widespread practice. The Pacific Northwest is one of the fewareas that is beginning to pursue the idea of permitting options and placing them in inventory forconstruction when needed. Planners there note that the cost of design, siting, and licensing is typicallysmall compared to the total costs of constructing a resource.r'' New England Electric System (NEES)also recently applied this concept in developing NEESPLAN 4.30
Also, most utility planning models do not separate permitting and construction. Modeling new resourcesusually includes only one construction lead time rather than separate decision points and lead times forpermitting and construction of resource options.
4.3.4 Summary
Most system planning models and utility implementation of these models do not fully account for thebenefit of short-lead-time resources. The future is modeled in an essentially deterministic manner. Thebenefits of being able to wait longer before deciding to proceed with a specific resource are not exhibitedin this type of modeling. The ISAAC model is the principal exception among the models reviewed. Mostutility planning models and utility planning approaches, therefore, fail to capture the benefits ofmodularity.
One possible way in which utilities could address this issue would be to add scenarios that change theassumed growth rates partway through the planning horizon. Instead of only high and low scenarios, theanalysis would include scenarios with unanticipated changes in growth rates during the forecast horizon.The demand forecast, for example, would start off at the base growth rate, but then slow. The costs oflong-lead-time resource alternatives selected before the slowing of growth would be compared with thecost of alternatives with shorter lead times that have more flexibility for changing after the slowing ingrowth is apparent. Decision-tree studies would also need to include branches with changes in demandgrowth rates, not just high and low rates for the entire forecast horizon, and a range of fuel pricescenarios.
29 Northwest Power Planning Council (1991), Volume Il-Part II, p. 49.
30 New England Electric System (1993).
4-27

lead time plants. From the year of this decision point, however, there would again be branches fordifferent growth rates in demand. This would allow for different rates of growth over the entire forecasthorizon, similar to the changes in growth scenarios suggested above. The insertion of an additionaldecision point with uncertain demand growth beyond that point would allow the planners to compareshort-lead-time plants with long-lead-time plants, while crediting the long-lead-time plants with the benefitof being able to be cancelled.
Some expansion planning models are designed to handle only a finite set of candidate resources with prespecified capacity increments, while others allow the capacity added for a particular technology to be anyvalue within a range. Using models that add plants with continuous rather than discrete sizes may beuseful for analyzing modular renewable resources. This would allow the utility to add only the capacityrequired to match its planning criteria and would indicate the benefit of modular resources.
Utilities do not typically place potential resources in inventory for addition when required. They do notobtain permits for a wind farm or a group of CTs, for example, and then add units as demand grows.Some utilities in the Pacific Northwest are beginning to take this approach, but it is the exception ratherthan the rule. Advance permitting and inventorying and incrementally adding units to match load wouldencourage the development of renewable resources.
4.4 Risk Diversity
4.4.1 Concept
Resource diversity, achieved using new types of generation resources, can provide value to a utility byreducing its exposure to risks from political, regulatory, and fuel price changes that may accompany overreliance on anyone fuel type or technology. Diversity is an attribute of a portfolio of resources ratherthan of a specific resource. But a specific resource can contribute to the diversity of a portfolio if it issufficiently different from other resources in the portfolio.
Renewable resources, in particular, can provide diversity benefits. Non-fuel-based resources can reducea utility's reliance on and sensitivity to fossil fuel cost changes. Because the costs of these resources areindependent of fuel costs for conventional resources, adding renewable resources can result in a systemthat is less sensitive to the uncertainty in specific fuel costs.
The concept of diversity incorporates the consideration of the riskiness of the alternatives and the fact thatthe future is uncertain. The focus is generally on fuel prices. Diversity often compares portfolios ofresources that use similar fuel types to portfolios of resources with fuel costs that are at least somewhatindependent of the principal fuel type. For example, a utility system that is highly reliant on natural gasfired generators would not receive any diversity benefits from additional gas-fired generation, whereasadding wind power would reduce the risks to the utility system arising from increases in gas prices.
Although the focus of diversity typically is on fuel risk, a portfolio may also be technologically diverseif it contains a mix of technologies. Technology diversity encompasses any non-fuel risk that could becorrelated between generating units. .
Environmental benefits are sometimes cited as an advantage of diversifying the resource portfolio. Weare defining the term diversification more narrowly here to focus on financial risks, although these mayinclude costs related to further environmental regulations, such as CO2 limits. Environmental benefitscould be considered through the inclusion of monetized environmental externalities as a complement tothe financial risk issues captured by portfolio diversity analysis.
4-28

The key concept underlying diversification in electric resource planning is independence of the cost oravailability of one resource from events affecting the cost or availability of other resources. Thisdefinition implies that there are two dimensions of independence:
1. Cost. A resource contributes to cost diversity if the cost of power from that resource is independentof the cost of other resources that represent a large portion of the utility's costs.
2. Availability. A resource contributes to availability diversity if its availability is independent ofconditions that could limit the output of large blocks of other resources.
Two examples illustrate the concepts of fuel and technology diversity. Fuel diversity would be providedby the addition of a biomass project in a utility system that is made up primarily of gas-fired generation.The biomass project provides cost diversity because its cost of power is not subject to the samefluctuations in natural gas prices that affect the cost of the gas-fired generation. Fuel supply to thebiomass project is not subject to the same curtailments affecting natural gas, so the biomass project alsoprovides availability diversity to the system. Diversity also mitigates risk by allowing the dispatch ofvarious units and the generation from different fuels to be adjusted to minimize costs in different fuel-priceregimes.
Technology diversity would be provided by the addition of any technology other than nuclear to a systemthat consists of a high proportion of nuclear generation. The non-nuclear technology provides costdiversity because it would not be subject to, for example, increased maintenance requirements that wouldaffect the nuclear units as a class. The non-nuclear technology would also provide availability diversitybecause it would still be able to operate if generation from nuclear units were restricted by regulatoryaction.
There is no minimum resource size for realizing diversity benefits in the same way that there is nominimum size for realizing benefits from a DSM option. Even if an option replaces only 1 kWh of oilfired generation in a high-oil-price scenario with generation at a stable price, it will provide measurable,although small, benefits to ratepayers.
The concept of diversity in resource planning is parallel to diversity in a financial portfolio. The risks in,say, common stocks of individual companies are divided into two components-systematic risks anddiversifiable risks. Systematic risks are those that affect the return of all of the stocks together, resultingfrom overall economic conditions and trends in broad industry categories. Diversifiable risks are thosethat affect the performance of an individual company independently of other companies. These are calleddiversifiable risks because they can be "diversified away" by including only a small fraction of stock inanyone company in a portfolio of stocks of many companies.
The variance of return from the portfolio is much narrower than it would be if it consisted entirely of thestock of only one company. With a large number of companies represented in a portfolio, the contributionof the diversifiable risk of individual companies can be very small even if some or all of them areindividually quite risky, because each company makes up only a small fraction of the overall portfolio andtheir returns are substantially uncorrelated.
There are two aspects to reviewing diversity in utility modeling. The first is whether it is considered atall since many models and modeling studies do not include diversity. The second aspect is how to includeit in the analysis.
Diversity considers, at its simplest, both the expected outcome and the range of expected outcomes. Aresource plan that focuses on natural gas-fired options may have a low cost under the base-case scenario,

but a wide range of costs because of the uncertainty associated with future gas prices. A second resourceplan that includes significant amounts of renewable resources may have a higher cost under the base-casescenario but could have a much smaller range of outcomes because it is not as sensitive to uncertain gasprices.
Diversity, therefore, considers both the base cost and the range, or variance, in the costs for alternativeresource options. Both the costs and the range in costs would be considered in the selection of a resourceplan. Utility planning studies that consider renewable resources should report both the base-case resultsand the range in results from the uncertainty analysis.
A more sophisticated method uses portfolio theory to combine the base costs and the range in costs byusing probabilities and risk preferences, as described in the following section.32 This involves assessingthe risk preference function and using it to determine whether a plan with a low price but a wide rangeof outcomes is preferred over a plan with a slightly higher price but a narrower range of outcomes. Thetheoretical development of risk preferences is presented in Appendix B.
4.4.2 Modeling Techniques
Scenario Analysis. One approach to evaluating diversity is to perform production simulation for a numberof alternative plans under several fuel-price scenarios. MIDAS and other system models that have thecapability to run multiple scenarios automatically can do almost all the computational work to calculatethe diversity benefit. Two approaches can be used with these models. Both require separate multiplescenario model runs with and without the candidate project. It may be possible to use the same multiplescenario runs as one of the runs for all projects. as either the "with" run or the "without" run. dependingon whether the project is or is not in the current iteration of the resource plan. One approach simplycalculates the variance of total costs with and without the project and determines the diversity benefit fromthe difference in variances. The other approach calculates the incremental net benefit of the project ineach scenario, calculates the covariance between net benefit and total production costs. and determines thediversity benefit from the covariance as described in the procedure above.
Portfolio Analysis. The following procedure, shown in Figure 4-4. outlines an approach for usingportfolio theory to evaluate the fuel diversity benefits provided by each project in a set of candidateprojects, assuming that each project is not large relative to the overall system.
Step 1. Construct a set of fuel-price scenarios. In many cases. three scenarios will be adequate-a basecase, and high and low natural gas or world oil price scenarios. In constructing the high andlow scenarios. care should be taken to adequately account for any significant linkages betweenfuel prices and energy purchase prices. including economy energy prices.
Step 2. For each fuel-price scenario, run the model to calculate the total production costs for each yearover the planning horizon and take the present worth.
Step 3. For each candidate project:
a. Calculate the present worth of net benefits over the life of the project for each scenario.
32 Jacobs and Huntley (1992).
4-30

Step 2.Calculate ScenarioProduction Costs
Step 1.Construct FuelPrice Scenarios
Step 3b.Calculate
Covariance
Step 3c.Divide by Risk
Tolerance
Step 3a.Calculate Scenario
Net Benefits
-......
Figure 4-4. Calculation of diversity premium
4-31

b. Use the probabilities of the fuel-price scenarios to calculate expected net benefits. Use thetotal production costs for each scenario to calculate the covariance between net benefitsand total costs. The covariance is defined mathematically as the expected value of theproduct of the deviation of net benefits in a scenario from expected net benefits and thedeviation of total costs from expected total costs. The covariance indicates the correlationbetween net benefits and total costs:
(2)
where x., yj' and Pi are the values of net benefits, total production costs, and probabilityof scenario i.
c. Use the aggregate customer risk tolerance to calculate the diversity benefit. The aggregatecustomer risk tolerance is inversely related to risk aversion. It represents the trade-offbetween risk and expected value. as described in Appendix B.
Only one set of production cost runs in Step 2 is required to evaluate any number of projects in Step 3.
Some types of models could run the required scenarios automatically, while it would be necessary tomanually perform the scenarios using other types of models. Various models use different approaches:
• Pure production costing models do not internally consider more than one scenario. The only way toanalyze diversity is by manually performing a scenario analysis and combining the results of severalruns.
• Decision-tree models can automatically run the alternative scenarios needed to analyze diversity, aswell as other sensitivity cases. This can be an important improvement.
• Monte Carlo models also can simulate scenarios to provide data on diversity benefits.
MABS uses the portfolio approach to evaluate diversity benefits. MABS models three scenarios,representing high, medium, and low marginal costs. Each scenario is defined as a combination of ademand scenario and a natural gas price scenario. For example, the high marginal cost scenario is definedas a combination of high demand and high natural gas prices. MABS requires that a risk tolerance factorand the total production costs for the three scenarios be supplied when it is initially set up. When MABSis run for an individual project, the project fuel price is automatically adjusted as appropriate for eachscenario. The diversity benefit is automatically calculated and displayed as a component of project netbenefits.
4.4.3 Issues
Definition ofthe Portfolio. Three alternative definitions of the portfolio and the corresponding definitionsof total system costs are:
1. The utility system-revenue requirements
2. The energy system-total cost of energy to customers (including outage costs and non-electricenergy)
4-32

3. The regional economy-regional gross domestic product.
The first definition is the simplest to evaluate. Calculating scenario revenue requirements is a routineexercise in utility planning. However, this narrow definition of the portfolio ignores the fact that thereare likely other things affecting customers' economic well-being that are correlated with the prices theypay for electricity. These other things include the prices they pay for other fuels, such as gasoline andnatural gas. Variations in fuel costs that consumers pay for indirectly, such as increased air fares resultingfrom higher jet fuel prices, are also relevant. The second definition encompasses these.
Energy costs are only a fraction of the overall economy. Variations in fuel costs may be swamped byother fluctuations in the economy resulting from abnormal weather, shifts in international trade balances,business cycle effects, or other factors. The third definition takes the perspective of the regional economy.To the extent that fluctuations in electricity prices are correlated negatively with fluctuations in grossdomestic product (GDP), electricity price portfolio effects could be substantial and the diversity premiumfor non-fuel resources large. If electricity prices are uncorrelated with fluctuations in GDP, then thediversity premium is likely smaller.
Determination of the Risk Aversion Coefficient. The risk aversion coefficient represents the trade-offbetween expected value and variance. The concept implies a decision maker, either individual oraggregate. The following three perspectives may imply different levels of risk aversion:
1. Utility executives2. Customers3. Utility shareholders4. Society.
The perspective selected must be consistent with the definition of the portfolio. The greatest risk aversionis likely to be found from the personal perspective of utility executives. However, evaluation of any ofthe three definitions of the portfolio above is inconsistent with the utility executives' personal perspective.An aggregate customers' perspective could be consistent with any of the three portfolio definitions. Asocietal perspective, to the extent that it is different from an aggregate customers' perspective, could beconsistent with either the energy system or economy definition of the portfolio.
Assessment of the Risk Aversion Coefficient. The following are two approaches for assessing the riskaversion coefficient:
1. Customer surveys2. Analysis of security market prices.
Customer surveys could be conducted in a manner similar to value-of-service reliability surveys."Questions and results obtained from surveys of business decision makers are described by MacCrimmonand Wehrung (1986). Statistical analysis of security market prices has been used to derive risk aversioncoefficients for models of capital markets." Either approach could yield valid results.
33 RCGlHagler Bailly (1990).
34 Pindyck (1988).
4-33

Risk-Adjusted Discount Rates. Risk-adjusted discount rates are sometimes used in capital budgeting forevaluation of competitive projects. Projects with different levels of risk are assigned different discountrates." Determining the proper discount rates is an issue.
The most comprehensive approach to determining risk-adjusted discount rates is by use of a decision tree.The decision tree is constructed to include all of the critical uncertainties. The utility's cost of capital isused for the discount rate throughout the decision-tree analysis. The expected value calculated from thedecision tree is compared with the result from a single-scenario, base case analysis. The discount rate forthe base-case analysis is adjusted to yield the same result as the expected value from the decision-treeanalysis.
The decision analysis approach and risk-adjusted discount rates have been shown to be equivalent."Therefore, a multi-scenario approach weighted by probabilities as in MABS can capture the issuesaddressed by risk-adjusted discount rates. The direct decision analysis approach has the advantage ofavoiding the intermediate step of determining risk-adjusted discount rates.
4.4.4 Summary
The first step in analyzing diversity is to recognize and analyze uncertainty. If planning is performedwithout significant consideration of uncertainty, many of the benefits of renewables are missed.
Although utility planning models are increasingly designed to analyze uncertainty, many are not explicitlydesigned to consider the benefits of diversity. Standard production costing models can only considerdiversity benefits by performing manual sensitivity runs with further analysis by the modeler. Decisiontree models and Monte Carlo models can provide the necessary runs, but often are not designed to performthe calculations necessary to arrive at the diversity benefits.
In addition, most utility modeling studies do not consider diversity. Uncertainty may be considered in thestudies, but the diversity benefits of renewables are not often tabulated and evaluated. We conclude,therefore, that utility planning models and studies may be deficient if diversity provides a significantbenefit to customers.
The benefits of diversity depend on the magnitude of the risks. Under current assumptions about stablefuture prices, however, diversity appears to provide little additional benefit to customers. If fuel price oravailability becomes more of a concern, the potential diversity benefits from renewable technologies willbecome more valuable and more important for inclusion in the analysis.
4.5 Conclusion
Various techniques exist for modeling the attributes of renewable resources. However, the state of the artis such that significant effort on the part of the analysis is required to evaluate any of the five keyattributes considered in this section. Judgment, approximation, and, in some cases, manual effort to runmultiple scenarios are all required for an adequate analysis. Further, no one model addresses all five ofthese attributes simultaneously. Therefore, the following section outlines a framework for integrating theresults of several models to perform a comprehensive evaluation of renewable resources.
35 Weston and Brigham (1981)~ Awerbuch (1993).
36 Applied Decision Analysis, Inc. and Charles River Associates Inc. (1987).
4-34

5.0 A Framework for Evaluating Renewable ResourcesUsing Current Models
Section 4 reviewed the state of the art in modeling several attributes of resource options that areparticularly relevant to the comparison of renewable resources and other options. Models exist that canaccount for each of these attributes. However, there is no one model or modeling system that adequatelyaddresses all of these attributes together. Instead, the models must be combined to account for all of thepotential benefits of renewable resources.
This section describes a framework for incorporating a rigorous analysis of all the relevant attributes intothe IRP process using existing models with their current capabilities. This framework is flexible in thatany of several available models may be used for various functions. In many cases, a utility canincorporate the model it currently uses for a particular function rather than adopt a new model inimplementing this framework. Different models are used for different functions. Results from thedifferent models are then integrated using a probabilistic cost-effectiveness model, which is describedbelow.
5.1 Integrated Strategy
The product of the framework is an integrated strategy consisting of the following:
• A list of options that are included in the strategy
A "script" or set of criteria that specifies the conditions under which each option wilI be developedand when.
The scope of candidate options is broad and includes:
• Generation, both utility- and non-utility-owned• DSM• Transmission• Distribution.
A strategy is distinguished from a plan in that a plan specifies the resources and the dates when theseresources will be developed under a single scenario, whereas a strategy covers a range of scenarios. Thescript spelIs out how resource commitments will be adjusted to respond to future evolution of the planningassumptions.
Options are differentiated by location. For example, separate options may be defined for photovoltaicsin each of several different local subareas. Defining separate options in this way facilitates:
• Accounting for differences in resource potential and hourly profiles between subareas
• Evaluating the cost effectiveness of options separately in different subareas, thereby accounting fordifferences in both the resource and marginal costs between subareas
Constructing a resource strategy consisting of resource options in the subareas in which they providethe greatest net benefits.
5-1

5.2 Integrated Strategy Development Process
Figure 5-1 presents a broad conceptual overview of the framework. The process starts by identifying andscreening options. It then performs system studies for a set of scenarios and develops a trial integratedstrategy. Finally, it iterates through a sequence of incremental analyses of individual options to refine thetrial strategy and obtain the final integrated strategy.
The framework uses both system-level studies and incremental analyses. The system-level studies evaluatethe performance of the overall system at various levels of penetration of the candidate resources. Thesestudies capture whatever saturation effects might exist, that is, the extent to which the benefits of aparticular category of resources depend on the relative share that option holds in the utility's resource mix.The incremental analyses determine the incremental benefits of individual options or discrete blocks ofresources. The results indicate whether a particular option belongs in the integrated strategy.
Figure 5-2 presents a more detailed view of the framework. On the far left are four tasks for identifyingand screening the options in the four categories. These tasks produce sets of options in each of the fourcategories for possible inclusion in the integrated strategy. The options in each category are screened toavoid wasting effort in subsequent tasks on options that are clearly inapplicable, unfeasible, oruneconomic. The options are fully characterized in terms of capability and availability, costs, and otherattributes. All costs are estimated and any constraints are identified. The screening is followed byseparate tasks for performing detailed studies in each of the four categories for several scenarios. Separatetasks are shown for the four categories because different models are used for each category and the workis most likely performed by separate departments within a utility. On the basis of these studies, financialanalyses are performed and marginal costs are evaluated. Response surface models, which are relativelysimple algebraic models that approximate the behavior of more detailed models, are developed tosummarize the results of the detailed studies, financial analyses, and marginal cost calculations.
An iterative process is initiated by developing a trial integrated strategy. A probabilistic cost-effectivenessanalysis is performed for each option in the context of the trial integrated strategy. All options, includingoptions that are in the current trial strategy and those that are not, are ranked according to the results ofthe probabilistic cost-effectiveness analysis. If there are significant inconsistencies between the rankingsand the trial strategy, then the trial strategy is modified. If not, the process has converged and the trialstrategy becomes the final integrated strategy.
5.3 Tasks in the Integrated Strategy Development Process
This subsection provides a more detailed discussion of the tasks in the integrated strategy developmentprocess shown in Figure 5-2.
Screen Demand-Side Options. This task involves assessing DSM potential and constructing candidateDSM programs. The primary models for this task are end-use demand forecasting, DSM potentialassessment, and DSM cost-effectiveness models. To properly account for the location impacts of DSMoptions, DSM potential and hourly demand impacts should be assessed on a local subarea basis.
Screen Supply-Side Options. The primary models for this task are resource models that estimate thepotential for generation from specific technologies in various areas. Other tools such as screening curvesand engineering cost estimation methods may be used. To properly account for location impacts, renewable resource potential and hourly generation profiles should be evaluated on a local subarea basis.
5-2

UtI
W
Perform Develop TrialPerform
FinalScreen Iterative.. Scenario ... Integrated ... ... IntegratedOptions
, ~ ~
Incremental,
System Studies Strategy StrategyAnalysis
Figure 5·1. Integrated strategy development process-conceptual approach

DevelopProbability
Distributions
Perform
r+ Scenario I-
FinancialDevelop
Screen Perform Analyses ~Demand-Side ... Scenario Response
,.Demand-Side
~ Surface~Options
[Studies Models
f---
Screen PerformEvaluate
GenerationSupply-Side Scenario ...
TL, , Marginal
Options -. Supply·Side CostsStudies 10-
,,,."
PerformI ... Construct
Probabi listie FinalI I : Initial Trial --. Cost Convergence? IntegratedDefine I I:' Integrated
Scenarios Effectiveness Yes StrategyI I : Strategy, Analysis
'I'No
Screen --.. Perform - Evaluate
Transmission ... Scenario ... Transmission r--
Options
lTransmission , Marginal Modify Trial
Studies Costs IntegratedStrategy
ScreenPerform
EvaluateScenario -Distrjbution -. I ... Distribution,.. Distribution - -
Options Studies Marginal Costs
Figure 5-2. Integrated strategy development process-key tasks

Screen Transmission Options. The set of candidate transmission projects is selected from a long list ofcandidate reinforcements identified in previous detailed studies.
Screen Distribution Options. As with transmission options, the set of candidate distribution projects isselected from a long list of previously identified options.
Define Scenarios. The result of this task is a set of scenarios representing the major uncertainties in theplanning process. These major uncertainties usually include uncertainty in the demand forecast andgeneral fuel price levels. They may also include uncertainties in the differential between the prices ofdifferent fuels and in the geographic distribution of demand growth, which may be particularly importantfor T&D planning. Other key uncertainties may be the generation from particular resources such as hydro,and construction delays or cost overruns for major projects.
To maintain the feasibility of the process, it is important to minimize the number of scenarios defined atthis point. At a later point in the process, it may be important for probabilistic analysis to have a largernumber of scenarios. However, in this framework, the results for a larger number of scenarios areapproximated using response surface models calibrated to a smaller number of scenarios. The smallernumber of scenarios must be carefully selected to cover the uncertainties that have the most significantimpact on the need for new resources or reinforcements and on the relative economics of various options.
Perform Scenario Demand-Side Studies. This task produces a DSM plan for each scenario, togetherwith estimated costs. The DSM plan for a scenario is constructed by assembling the candidate demandside options that are cost effective on the basis of estimated marginal costs. The marginal costs areestimated from previous detailed studies. Marginal costs need not be particularly accurate at this stage.Rather, what is needed is an approximate level of DSM that will be economic in each scenario. This levelwill be deducted from pre-DSM demand to yield a level of net demand to be met by generation options.Feedback between DSM and generation will be incorporated later, in the iterative incremental analysis.
Perform Scenario Supply-Side Studies. This task yields a generation plan, evaluates generationreliability, and determines production costs for each scenario. The primary models for this task aredetailed production simulation and generation reliability models. An expansion planning model also maybe used in this task. However, it is not critical to have an optimal generation plan for each scenario atthis point in the process; approximate plans are adequate. In fact, optimal resource plans may beunrealistic in some scenarios such as high or low demand. Scenario resource plans will eventually bemerged into a trial integrated strategy, and the trial strategy will be optimized in the iterative incrementalanalysis.
There are two primary objectives for this task:
1. To test feasibility and develop intuitive understanding. The detailed production simulation andreliability analyses evaluate whether a given resource plan is actually feasible in a particularscenario. These analyses can identify situations in which there are unacceptable levels of unservedenergy, or dump energy. Examination of capacity factors may identify resources that areunderutilized or overutilized relative to a more optimal mix of resources. Examination of monthlyor seasonal results may indicate that there are "problem" periods, which mayor may not be helpedby renewable resources or DSM options with their characteristic time profiles. It is hard tooverstate the importance to the overall IRP process of the intuitive understanding gained indetailed analysis of multiple scenarios.
2. To establish a basis for the iterative incremental analysis process that will be used to develop theintegrated strategy. The incremental analyses will use marginal costs and incremental financial
5-5

measures that are derived in intermediate tasks from the production costs and reliability indicesobtained in this task.
Perform Scenario Transmission Studies. This task produces a transmission plan for each scenario,together with costs. The primary models for this task are area demand forecasting and load flow models.Transient stability and transmission or composite reliability models might also be used here. The purposesof this task are to test feasibility and develop intuitive understanding and to establish a basis forsubsequent incremental analyses.
This task may pose a significant analytical challenge. A high level of effort is required to develop atransmission plan for a single scenario using conventional transmission planning practices, hence theimportance of keeping the set of scenarios small. However, it is important to consider multiple scenariosto address the impact of uncertainty on transmission needs. As with the scenario DSM and generationplans, it is not critical that the scenario transmission plans be optimal.
Perform Scenario Distribution Studies. This task produces a distribution plan for each scenario, togetherwith costs. The purpose of this task is to establish a basis for subsequent incremental analysis. This taskmay go beyond the boundaries of traditional distribution planning in two ways:
1. Planning horizon. Traditional distribution planning typically has a shorter planning horizon thanDSM, generation, or transmission planning. To evaluate all four categories of options on aconsistent basis, the planning horizon of distribution planning must be extended.
2. Multiple scenarios. Traditional distribution planning considers only a base-case demand forecastfor each local planning area. Some utilities may also consider a high-demand scenario. But todetermine the impact of uncertainty on the need for distribution reinforcements, it is necessary toconsider both high- and low-demand scenarios as well as base-case demand.
The primary models for this task are local area demand and feeder models.
Perform Scenario Financial Analyses. This task produces financial indices for the combined DSM,generation, transmission, and distribution plans constructed for each scenario. The objectives of this taskare to test the financial feasibility of the combined plans and to develop intermediate results required forsubsequent incremental analyses.
The primary model for this task is a financial/rates model. The key financial indicators to be obtainedinclude:
• Electricity rates, both on a system average basis and by major customer class
• Interest coverage ratio.
Electricity rates are needed for several purposes:
• To check for substantial inconsistency with the rates assumptions used in creatingthe demand forecast
• To check whether any of the scenarios yield increases in rates that would be "unacceptable" in someway and might result in adverse regulatory action
• To provide a basis for evaluating lost revenues, if this component is to be included in the incrementalanalysis of DSM options.
5-6

The interest coverage ratio is one indicator of the financial feasibility of a plan. Other indicators may alsobe examined.
Evaluate Marginal Generation Costs. This task produces marginal generation capacity and energy costsfor each scenario. Marginal generation energy costs are calculated using a production simulation model.
Marginal generation capacity costs may be evaluated on the basis of either the incremental cost of capacityadditions or the marginal economic benefit to customers of reducing unserved energy. The twoapproaches will yield the same result if the underlying resource plan is optimal. Most utilities use theincremental capacity cost approach, assuming that the resource plan is optimal. But the marginal unservedenergy cost approach provides both a way to check the optimality of capacity additions and a way todetermine marginal capacity costs when capacity additions are not optimal or when there are no capacityadditions.
Both marginal generation capacity and energy costs are calculated using the results of model runsperformed in the scenario supply-side studies, according to the utility's established practices. Someadditional, but minor, post-processing may be required.
Evaluate Marginal Transmission Costs. This task produces marginal transmission capacity costs andlosses for each scenario. These values are used in subsequent incremental analyses. Losses may beevaluated using an optimal power flow model. Marginal transmission capacity costs may be evaluatedusing either an optimal power flow model or the incremental savings of deferring the transmission planin a scenario.
Evaluate Marginal Distribution Costs. This task produces marginal distribution capacity costs for eachscenario. These values are used in subsequent incremental analyses. Marginal distribution capacity costsfor a local area may be evaluated as the incremental savings of deferring the distribution plan for that areain a scenario. To properly account for location benefits, marginal T&0 costs must be evaluated on a localsubarea basis, rather than on a system-wide average basis.
Develop Response Surface Models. This task produces a mechanism for adjusting the marginal coststo cover different scenarios and to account for changes in the integrated strategy as the iterative processproceeds. Here, response surface models are constructed to approximate the sensitivity of marginalgeneration capacity costs. marginal generation energy costs, marginal transmission capacity costs. andmarginal distribution costs to changes in several independent variables." Two types of independentvariables are included:
1. Planning uncertainties. The scenarios representing planning uncertainties are characterized bya small number of variables that capture the differences between the scenarios.
2. Plan capacity. The total capacity of the options in each category included in the integratedstrategy for each scenario can be summarized by total capacity in various subcategories. Someof the scenarios for which detailed analysis was done will have different amounts of capacity inone or more of these subcategories.
The response surface models are constructed to approximate the sensitivity of marginal costs to all of theindependent variables simultaneously. Inclusion of the independent variables for planning uncertaintiesenables the response surface models to be used to estimate marginal costs for any value or combination
37 Merrill and Schweppe (1984).
5-7

of values of the planning uncertainties within the span of the scenarios for which detailed analysis wasdone. Inclusion of the independent variables for plan capacity enables the response surface models to beused to adjust marginal costs for changes in any of the options in the integrated strategy.
Response surface models also are constructed for rates if needed to calculate lost revenues and for totalrevenue requirements to capture portfolio effects.
An alternative to using response surface models is to re-evaluate marginal costs, rates, and revenuerequirements using the detailed models at each pass through the iterative loop. However, this approachrequires substantially more effort.
Construct Trial Integrated Strategy. The results of this task include an initial trial integrated strategyto begin the iterative process of developing the integrated strategy. The process for constructing the initialstrategy is informal and heuristic rather than formal and algorithmic. It relies on simple rules of thumb,reserve margin targets, target resource mixes, and the like. The process is "informed" by the detailedanalyses that have been performed up to this point, but there is not necessarily any formal connection.The objective of this task is to construct an initial strategy that is close to the final strategy to minimizethe number of iterations required.
An important subtask is to define the generic structure of the script or the rules that trigger theconstruction of specific options. The simplest structure is based on the year-by-year values of demand.Either peak or energy demand can be used. The construction of an option is triggered when demandcrosses over a specified threshold. The threshold is different for different options. The on-line date ofan option is earlier in a scenario with more rapid demand growth because demand crosses over thethreshold earlier. This approach is illustrated in Figure 5-3. A more complicated structure utilizes bothpeak and energy demand values, triggering base-loaded resources on the basis of energy demand andpeaking resources on the basis of peak demand. Yet more complicated structures can be created byspecifying different sets of thresholds for different fuel price regimes.
Once the generic structure is specified, the initial strategy is filled in. The initial strategy is constructedby considering several scenarios. These scenarios may be the same ones used for detailed analyses, asubset of those scenarios, or an entirely new set. For each scenario, a plan is created that includes optionsin all four categories and the dates at which they are to come on-line. The date at which constructionmust be triggered is obtained by working backward from the on-line date through the construction leadtime. Given the various start-of-construction dates for a single option in different scenarios and the levelsof the triggering variable, e.g., demand, at those dates, a threshold value is selected that is more or lessconsistent with these dates. Absolute consistency is not likely given the informality of the process to thispoint, but will be enforced in subsequent steps.
Develop Probability Distributions. The output of this task is probability distributions on each keyplanning uncertainty. Distributions can be constructed for other uncertainties such as costs or performanceof specific options in addition to the uncertainties included as independent variables to the response surfacemodels. In some cases, such as hydrological conditions, probability distributions can be constructed fromhistorical data. In other cases, such as demand and fuel prices, probability distributions can be constructedsimultaneously with the scenario specifications for detailed analysis. Direct assessment of expert judgmentor Monte Carlo analysis can be used.
Perform Probabilistic Cost-Effectiveness Analysis. The result of this task is an incremental analysisof each candidate option in all four categories in order to rank the options. The incremental analysis usesthe marginal generation, transmission, and distribution costs determined by detailed analyses to evaluatethe incremental contribution to the current trial strategy. If an option is included in the current trial
5-8

- Electric Demand (MW)
Project jDemand
Threshold
lligh
Medium
Low
Year
UtI
\,Q
Start-up Date: High Scenario
Figure 5-3. Triggering mechanism
Med. Scenario

strategy, then the incremental analysis represents the amount by which total system costs would increaseif that option were deleted from the strategy. If the option is not included in the current trial strategy, thenthe incremental analysis represents the amount by which total system costs would decrease if that optionwere added to the strategy. The results of probabilistic cost-effectiveness analysis indicate the directionin which the trial strategy should be modified in the iterative loop in Figure 5-2.
The primary model for this task is a probabilistic cost-effectiveness model such as MABS. Figure 5-4illustrates the major components of such a model. The utility may create a custom spreadsheet model forthis purpose or may use a probabilistic adaptation of another model such as the Delta model.
For each option, the incremental analysis is repeated for several scenarios representing the entire rangeof values and combinations of values of the planning uncertainties. The on-line date of an option isdetermined for each scenario on the basis of the script. If the option does not come on-line in a givenscenario, then it does not provide any benefits. The net benefits for all scenarios are weighted by theprobabilities to calculate expected net benefits. Also, the covariance between net benefits and total systemcosts is calculated to obtain the diversity premium.
The present value of net benefits in dollars may be normalized by lifetime capacity in kilowatt-years toobtain net benefits in dollars per kilowatt-year. The resulting value is used to rank the various options.Other ranking approaches could be used; the final integrated strategy will not substantially depend on theranking approach, but the speed of convergence may depend on it.
Test Convergence. In this task, the results of the probabilistic cost-effectiveness analysis are comparedwith the current trial integrated strategy to determine whether the iterative process has converged. If allthe options in the current strategy have positive net benefits, and if all the options that are not in thecurrent strategy have negative or marginal net benefits, then the iterative process has converged. If thereis an option in the current strategy that has negative net benefits, then the strategy can be improved bydeleting it. If there is an option that is not in the current strategy that positive net benefits, then thestrategy can potentially be improved by adding it.
There may be options that yield positive net benefits when evaluated against a trial strategy that does notinclude them, but negative net benefits when the current strategy includes them. These options aremarginal. An argument could be made for excluding them from the integrated strategy. Further detailedanalysis would be required before including them.
Modify Trial Integrated Strategy. This task produces a modified trial integrated strategy for evaluationin the next iteration. The trial strategy is modified according to the results of the probabilistic costeffectiveness analysis. If there are options that are not in the current trial strategy but would yieldsignificant net benefits, they are added, starting with the ones with the highest value of net benefits perkilowatt-year. Likewise, options with significant negative net benefits are deleted. To minimizeoscillation of the iterative process, a limit may be imposed on the maximum total capacity added ordeleted in anyone iteration.
Obtain Final Integrated Strategy. If the process has converged, then the current trial strategy becomesthe final integrated strategy. This strategy minimizes expected total costs.
5.4 Discussion
The integration approach is applicable both to selecting the optimum combination of renewable resourcesand other options without set-asides and to selecting the renewable options that yield lowest total cost tomeet a set-aside requirement.
5-10

,-------------------------------1I II Scenario Economic Calculations II II II II Location II Benefits II V II
Scenario IDecision Tree I
Start-UpEmissions I
Specifications I DateCalculations I
I II It
~~I
I IProject I I
Selection of I "- Scenario -- Dispatch ... Net I .. Decision-TreeParameters, r. Scenarios I ' Availability ,.
Calculations,.
Benefits - CalculationsPrices
II JI'
tI
Demand, I Scenario Avoided CostFuel Price I Fuel Price CalculationsScenarios I Response
I Surface
I Model
IParameters
UlI.......... Figure 5-4. Probabilistic cost-effectiveness analysis

The integration approach is applicable to both large and small utilities. The level of effort requireddepends primarily on the amount of resource and location data to be developed, which is driven by thenumber of options and geographical areas considered. Smaller utilities will have fewer options andgeographical areas to consider. Therefore, the level of effort required depends on the size of the utility,with a lesser level of effort required for smaller utilities.
5.5 Summary
The integrated strategy development process is a practical approach for incorporating a comprehensiveanalysis of renewable resources in IRP. It makes use of a utility's established models and planningpractices to a large extent.
The approach uses both system studies to capture the cumulative effects of the penetration of variousresource types into a utility's resource mix and incremental analyses to evaluate the incrementalcontribution of a specific option to the resource strategy. An iterative process with an embeddedprobabilistic cost-effectiveness analysis is used to optimize the integrated strategy.
The approach accounts for the key attributes of renewables, as described below.
Capability and Availability. The capability and availability of renewable and other resource options arefully accounted for in both the system studies and the incremental analyses. Care must be taken inconducting the detailed production simulations and reliability analyses to account for the intermittence anddependable profiles properly using the current capabilities of the models. The probabilistic costeffectiveness model must be constructed with sufficient temporal detail to capture the relevant timevariations in the incremental analyses.
Location. The location benefits of various resources are captured by including marginal T&D capacitycosts in the calculation of net benefits in probabilistic cost-effectiveness analysis.
Modularity. Modularity is fully captured by using scenario-dependent, on-line dates in probabilistic costeffectiveness analysis, according to the script.
Diversity. Diversity benefits are fully accounted for in probabilistic cost-effectiveness by calculating thecovariance between the net benefits from a project and total system costs.
Thus, the integrated strategy development process provides a comprehensive evaluation of the keyattributes of renewable resources.
5-12

6.0 Conclusions
The objective of IRP is to select a combination of utility investments to meet future demand for energyservices at the lowest total cost within regulatory constraints. The types of investments to be consideredinclude conventional generation options, renewable resources, and DSM options. Total costs include allutility costs that are passed on to the customer through rates and all other costs borne directly by thecustomer, such as conservation or renewable energy costs that are not covered by incentives paid by theutility. Total costs may include other societal costs as well. Comprehensive and consistent analysis ofthe various options, at an appropriate level of accuracy, is essential to obtain a resource plan that trulyminimizes total costs. Otherwise, it is impossible to assure that the relative advantages and disadvantagesof the options are weighed properly.
The introduction of renewable options into the planning process brings new issues and additionalcomplexity. Utilities in some jurisdictions are including renewable resources in their resource plans onthe basis of set-aside requirements mandated by their regulatory commissions. Set-asides are motivatedin part by the perception that the full benefits of renewable resources are not adequately captured bycurrent utility planning models and practices. The imposition of set-aside requirements short-circuits theutility planning process and whatever shortcomings it has that prevent it from properly accounting for theattributes of renewable resources. But this is only a short-term solution. In the future, finding the properlevel of renewable resources will depend on developing planning methods that do capture these benefits.
This study reviews utility planning models with regard to their ability to account for the attributes ofrenewable resources. It makes recommendations about how utilities should use the current capabilitiesof models and about the direction of future work to advance the state of the art. The renewable resourceattributes that currently present the greatest modeling challenges are:
• Capability• Availability• Location
ModularityRisk diversity.
This study has focused on these five attributes, on their potential impacts on total costs, and on how theyare modeled. In assessing the current state of the art, we looked at eleven models that meet one or moreof the following criteria:
1. They are widely used by utilities.2. They are generally available.3. They are advanced in their treatment of these key attributes.
Section 6.1 summarizes our findings with regard to these key attributes. Section 6.2 describes a processfor integrating the results of multiple models to perform a comprehensive analysis of renewable resourceoptions in IRP. Section 6.3 contains our recommendations for future work in advancing the state of theart in modeling.
6.1 Current Modeling Capabilities
The attributes of renewable resource options need to be accounted for in both systemwide and incrementalanalyses. The aggregate effect of all of the renewable resources in the plan on the output and operatingcosts of other generation must be accounted for in systemwide analyses, while the incremental effect of
6-1

a renewable resource project on system reliability and costs needs to be accounted for in incrementalanalyses of individual projects. Incremental analysis provides the basis for accepting or rejectingindividual options in the resource plan, while systemwide analysis is a key component of revenuerequirements and financial forecasting and provides the baseline for incremental analysis. Table 6-1, atthe end of Section 6.3, summarizes our findings regarding the capabilities of the twelve models reviewedto accommodate the key attributes of renewable resources for both systemwide and incremental analyses.
Capability and Availability. Some renewable resources, such as geothermal and biomass, are quite likeconventional options in their operation and effect on the rest of the system. But the capability andavailability of other renewable options such as wind and solar are subject to both predictable variationsand intermittence of the underlying energy source. The time-dependent nature of these resources mustbe properly accounted for in production simulation to capture their effect on the dispatch of other systemgeneration and on overall production costs. These costs determine the direct value of renewable resourceoptions and other options on the system.
Time-dependent resources can be modeled either as generation units or as load modifiers. Whengeneration unit modeling is used in a load duration curve model, only a very limited level of detail isavailable for representing the predictable profile. This may be adequate for resources whose output ismaximum during the hours of peak demand; otherwise, it is inadequate. Greater hourly detail may bepossible with a chronological model. When resources are modeled as load modifiers, hourly profiles canbe specified that account for both the predictable and random components.
Although none of the models that were examined here allow a user to easily represent the uncertaintyassociated with renewable power generation, the most complete treatment of capability and dispatchabilityis provided by EGEAS. The orthogonalization process in EGEAS permits a user to define an hour-byhour profile of energy delivery and associate a single forced outage rate with that profile. Unfortunately,the uncertainty in the peak hours is more critical than in other hours, and the best modeling approach maybe simply to develop multiple profiles that reflect different assumptions about the timing of renewablegeneration and the degree of correlation with the system peak. These profiles would then serve as thebasis of multiple scenarios that ultimately could be combined into expected results. Such a brute forcemethod also would allow a planner to model the degree of correlation between separate renewable projectsif the sites are affected by the same general weather patterns.
Other aspects of the capability and availability attributes include short-term fluctuation and multiplicity.Most planning models do not simulate short enough time periods to capture the issues or costs resultingfrom short-term fluctuation. However, short-term fluctuation of renewable generation is not likely to posemuch of a problem for any utility unless resources with this characteristic become a significant portionof the utility's generating mix.
Multiplicity refers to the fact that many small power sources are likely to constitute a renewable project.Although multiplicity can result in greater generation reliability when only independent equipment-relatedoutages are considered, it provides no such advantage when there is significant weather-related correlationof output from renewable resources at the same site.
Both the predictable and random components can be fully accounted for in incremental analysis ofindividual projects. The spreadsheet or other model used for incremental analysis should incorporatesufficient temporal detail to capture significant differences in seasonal or hourly profiles between theoptions under consideration. If there is significant correlation between separate options and if theaggregate number of these options is sufficient to cause non-negligible variation in system marginal costs,then it is important to account for this correlation. It can be accounted for by incorporating scenarios
6-2

representing variation in the aggregate amount and making the output of the candidate option dependenton these scenarios.
In many cases, it is adequate to use the hourly expected output of an option for a set of representativedays to account for uncertainty in the output. But the conservative approach of derating the output to zeroor any value less than the expected output will generally result in ignoring a major portion of the benefitsof the option.
Location. The location of resources can affect total costs in several ways. First, location determineswhether any additional costs are required for interconnecting the resource to the system. Second, locationdetermines the impact of a resource on total system losses. Third, distributed applications of renewableand other resources can defer T&D reinforcements and thereby decrease overall T&D costs. This effectmust be accounted for in a full cost-benefit analysis. The most complete treatment of location is providedby the Delta model, which includes both marginal transmission and distribution capacity costs inevaluating the cost-effectiveness of options. These marginal costs are differentiated by time and locationat the level of detail required to properly account for the location benefits provided by various resourceoptions. MABS includes marginal transmission capacity costs, but not marginal distribution capacity costs.Therefore, MABS cannot capture any distribution benefits. Other models can account for transmissionconstraints in generation dispatch, and most models can account for losses.
Incorporation of location benefits requires marginal costs for T&D differentiated by time and location.Established methods for determining marginal costs for T&D on the basis of systemwide averages are notadequate. Emerging methods for determining marginal costs for T&D require the development of longterm T&D plans. This may require extension of the planning horizon for distribution, and perhapstransmission as well, at many utilities.
Modularity. The modularity of some renewable options, characterized by small size and short lead timerelative to particular conventional options, provides advantages in tracking load growth and managingdemand uncertainty. Modularity can help reduce total system costs in several ways, including reducingthe amount of over-capacity that results when large resources are added, reducing the risk that a resourcecommitted in advance of the need date will actually turn out not to be needed, and reducing AFUDCcosts.
The economic benefits of modularity can be quantified using a multi-scenario analysis that capturesdifferences in the way a utility adjusts its resource commitments over time in response to changes fromthe base-case demand forecast.
The most complete treatment of modularity is provided by the ISAAC model. The ISAAC model isexplicitly designed to include the benefits of short lead times and can also handle multiple, small units.Most utility expansion analyses use what amounts to a deterministic forecast of the future, which will notprovide any benefits to short-lead-time options. In ISAAC, short-lead-time benefits are examined inmultiple expansion scenarios under a Monte Carlo growth framework. Lead times are also separated intopre-construction (permitting, licensing, and engineering) and construction times to more explicitly considerthe two activities.
Diversity. Renewable options can diversify a utility's portfolio of energy sources. Diversification resultsin a narrower bandwidth of uncertainty in total system costs. An option provides diversification benefitsif it is independent of the risks that are inherent in other types of resources that represent a large shareof the total system cost. For example, diversification benefits can be provided to a system that has a largeshare of oil- or gas-fired generation by any option that does not burn oil or gas. Diversification benefits
6-3

can also be provided by an option with zero fuel cost, whose risk is entirely related to capital and non-fueloperating costs.
An option's diversification benefits can be quantified using a combination of portfolio analysis and energyreliability analysis. Several of the models provide a partial analysis of diversity. Any of the productionsimulation models can be used to evaluate total production costs for a number of fuel price scenarios,which then can be weighted by scenario probabilities to calculate the expected value and variance of totalproduction costs. Models that combine multiple scenario production simulation and probabilisticcalculations, such as MIDAS and ISAAC, can do this automatically. The benefits of diversity can bedetermined by comparing the expected value and variance of total costs for alternative plans.
MABS is the only model that evaluates the diversity benefits of an individual resource option directly.But this capability could easily be added to any model that does an incremental analysis, such as Delta.
Some of these five attributes are relevant to options other than renewable resources. For example, locationis important for conventional options as well as renewable options. DSM and smaller conventionalgeneration options such as CTs and gen sets can be installed to provide location benefits similar torenewable DU options. T&D costs should be accounted for in selecting large, medium, and smallconventional options. Proper modeling of location benefits is important in evaluating all of these options.
Modularity benefits also can be provided by conventional options such as CTs and even CCs orcogeneration units for which pre-construction work is separated from construction work and is performedprior to a final decision on the project. In this way, the lead time between the final decision to go aheadwith the project and its start-up date can be minimized. Proper modeling of modularity benefits isimportant in evaluating these conventional options relative to other conventional options that are largeror have longer lead times.
Diversity benefits may also be provided by some conventional options. For example, although coal is afossil fuel, its fuel price is not subject to the same degree of volatility as oil and gas. Therefore, acandidate coal-fired unit can provide fuel diversity benefits to a system that is dominated by oil- or gasfired generation. Proper modeling of diversity benefits is important in evaluating the relative cost stabilityof non-oil, non-gas resources.
6.2 Model Integration
As summarized in Section 6.1, various methods have been implemented for incorporating the keyattributes in different models. However, no one model completely addresses all of the key attributessimultaneously. In order to do a comprehensive evaluation of all the key attributes, it is necessary to usea combination of models.
A process for incorporating renewables in IRP using a combination of models was described in Section 5.This process uses a marginal approach to perform an incremental analysis of each of the candidate options.Marginal analysis accounting for all of the most important uncertainties is performed using a probabilisticcost-effectiveness model. The probabilistic cost-effectiveness model uses marginal costs derived usingdetailed models.
Using this approach, the capability and availability of renewable and other resource options are accountedfor in both the systemwide and incremental analyses. The location benefits of various resources arecaptured by including marginal T&D capacity costs in the calculation of net benefits in probabilistic costeffectiveness analysis. Modularity is captured by the use of scenario-dependent start-up dates. Diversity
6-4

benefits are accounted for by calculating the covariance between the net benefits from a project and totalsystem costs.
The integration approach is applicable both to selecting the optimum combination of renewable resourcesand other options without set-asides and to selecting the renewable options that yield lowest total cost tomeet a set-aside requirement.
6.3 Recommendations for Methodology Development
This section presents our recommendations for high-priority work to enhance the capability of utilities toperform comprehensive evaluations of the benefits of renewable resources as part of their IRP processes.These recommendations are categorized by data requirements, uncertainty, DU planning, case studies, andworkshops.
6.3. 1 Data Requirements
A key requirement for incorporating renewable resources into IRP is data. Data are required on renewableresource potential and profiles, T&D plans and costs, and subarea demand profiles. The followingrecommendations regard reducing the level of effort required to develop these data.
1. Develop simplified procedures to construct capacity and availability data for time-dependentresources in a way that takes full advantage of the current capabilities of models and adequatelycaptures both the predictable and random components of these resources.
2. Develop guidelines for utilities to determine the appropriate level of effort for refining capacityand availability input data. These guidelines would indicate when further efforts are or are notcost-effective, based on value of information concepts.
6.3.2 Uncertainty
uncertainty underlies three of the key attributes-availability, modularity, and risk diversity. Therefore,incorporating uncertainty into the analysis is critical for a complete evaluation of the costs and benefitsof renewable resources. However, incorporating uncertainty into IRP is currently one of the greatestchallenges for practitioners. The following recommendations regard enhancements for both extending andsimplifying uncertainty analysis of renewable resources.
3. Add multiple-scenario capability or enhance existing multiple-scenario capabilities of productionsimulation models to include a start-up date decision rule for scenario-dependent start-up dates.This will enable these models to calculate modularity benefits.
4. Extend Delta to perform multiple-scenario analysis with the following features:
a. Response surface models for marginal costs, for both multiple scenarios and "dynamic"marginal costs
b. Start-up date decision rule for scenario-dependent start-up dates
c. Probability calculations to obtain expected values and variances
d. Calculation of the diversity premium.
6-5

This will enable Delta to evaluate the effect of uncertainty on net benefits and to calculate modularity anddiversity benefits. Although the incremental approach underlying Delta already enables it to evaluate eventhe smallest options. incorporation of uncertainty into the model is necessary to evaluate modularity anddiversity benefits under uncertainty. The objective is not to transform Delta into a general purpose modelthat includes production simulation and other detailed modeling capabilities, but rather to make Delta amodel that can integrate the results of other models.
6.3.3 Distributed Utility Planning
The location benefits of renewable resources can be evaluated using the methods of DU planning. Thefollowing recommendations regard enhancements to DU planning methodology. Recommendation (4)under uncertainty is also relevant here.
5. Develop simplified approaches to construct transmission and distribution plans. This will enableutilities to consider a larger number of local planning subareas and evaluate multiple scenarios toaccount for the effect of uncertainty on T&D investments.
6. Investigate the application of value-based approaches to distribution planning. This will enabledistribution plans to achieve an economically optimal level of reliability and ensure that themarginal distribution capacity costs derived from the distribution plans provide economicallyefficient signals.
6.3.4 Case Studies
Broader application of methodological innovations is stimulated by the dissemination of utility case studiesthat can be studied and followed by other utilities. The following recommendations regard case studiesto demonstrate the concepts and techniques described in this report.
7. Conduct utility case studies to demonstrate and refine the framework for combining the results ofexisting models. outlined in Section 5.
8. Perform case studies evaluating the relative importance of various attributes and examiningimproved approaches for considering renewable resources using standard utility planning modelsof two general types, single scenario models and models with decision analysis capabilities. Thestudies would examine alternative means of considering the benefits of modularity (short leadtime) and diversity. The approaches developed in these studies could then be disseminated toutilities for inclusion in their planning studies. These case studies should cover various types ofrenewables and applications.
6.3.5 Workshops
Workshops are an effective means for promoting planning models and practices throughout the industry.
9. Conduct a workshop on utility planning for renewables. Invite utilities of all sizes and levels ofsophistication. Include problems, issues, solutions, and industry needs in the workshop agenda.Publish a volume of workshop proceedings.
10. Organize an on-going forum of leading IRP practitioners from utilities, government, consulting.and universities to meet periodically and discuss theoretical and practical issues in IRP•particularly with regard to renewable resources.
6-6

Table 6-1. Summary of Model Capabilities
Model Capability and Availability Location
Delta Monthly and hourly profile of capacity. Forced outage rate. Full hourly load and marginal T&D cost detail.
DYNAMICS Hourly profile of capacity. None.
EGEAS/IRP Explicit probability distribution combination of load and load modifier Version 7 includes subarea impacts.Workstation nondispatchable resource using orthogonalization algorithm. Then
LDC model for up to 39 segments. Chronological modelforthcomi,ng.
Elfin Chronological pre-processing of loads and load modifier units, then None explicitly, though losses related to location can beLOC model with up to 8 segments. Can model renewables as included.supply-side load modifier or generating unit.
IRP-Manager Chronologie dispatch and load modification. Renewables can None explicitly, though losses related to location can bealternatively be modeled as generating units. included.
ISAAC Somewhat simplified production costing, energy only. Renewables None explicitly, though losses related to location can betypically modeled as generating units. included.
MASS Monthly and hourly profile of capacity. Forced outage rate. Annual marginal transmission costs No distribution level.
MIDAS Somewhat simplified production costing. Renewables can be None explicitly, though losses related to location can bemodeled as load modifiers or as generating units. included.
PROMOD III Monthly and hourly profile of capacity. Forced outage rate. Multi-area capability captures transmission constraints.
PROSCREEN III Seasonal and hourly profile of capacity. Forced outage rates. None.PROVIEW :
UPLAN III Chronological modeling using typical weeks. Renewables can be None explicitly, though losses related to location can beincluded as load modifiers or as generating units. included.

Table 6-1. Summary of Model Capabilities (cont'd)
Model Modularity Diversity
Delta None. None.
DYNAMICS None. None.
EGEAS/IRP Four expansion analysis alternatives. Decision analysis capability. Interface to EPRI RISKMINWorkstation model.
Elfin ICEM and, soon, ITRE expansion optimization, but may None.be computational limits on including many small units.Single scenario optimization. Nothing that explicitlyhandles short-lead-time units.
IRP-Manager ICEM and ITRE (forthcoming) expansion optimization, Decision analysis capability.but may be computational limits on including manysmall units. Single scenario optimization. Nothing thatexplicitly handles short-lead-time units.
I-AAC Modular resources can be included as multiple units in Decision analysis framework and Monte Carlo simulationblocks. Explicitly designed to consider benefits of short to incorporate the effect of alternative scenarios.lead times. In addition, lead time split into permittingtime and construction time. Examines multiplescenarios, rather than single-scenario optimization.
MABS Calculates value of start-up date flexibility, but not small Calculates price diversity premium.size.
MIDAS Backwards decision-tree optimization. Computational Decision-tree analysis can include fuel priceconsiderations may mean that many small units cannot uncertainties. Provides probabilistic results.be considered.
PROMOD III None. None.
PROSCREEN III None. Interface to EMA STRATEGEM system.PROVIEW
UPLAN III Multiple optimization alternatives. Potential Allows Monte Carlo simulation of uncertain factors.consideration of short-lead-time benefits if modeledappropriately.

7.0 References
American Public Power Association. "Utility Resource Planning Software: A Compendium."Washington, DC: American Public Power Association, c. 1992.
Applied Decision Analysis, Inc. and Charles River Associates Inc. "Evaluating the Effects of Time andRisk on Investment Choices: A Comparison of Finance Theory and Decision Analysis." EPRI P-5028.Palo Alto, CA: EPRI, January 1987.
Awerbuch, Shimon. "The Surprising Role of Risk in Utility Integrated Resource Planning." ElectricityJournal, Vol. 6, No.3, April 1993, pp. 20-33.
Barakat & Chamberlin, Inc. '''Best Current Practices' in Integrating DSM Into T&D Planning.Proceedings From the Second Annual Workshop." EPRI TR-I02955. Palo Alto, CA: EPRI, December1993.
Belostotsky, Albert, Joel Klein, Pat McAuliffe, and Angela Tanghetti. Evaluation ofAlternative CapacityExpansion Planning Methodologies, Phase III-Final Report, California Energy Commission, June 29,1993, pp. 6-10.
Billinton, R., J. Satish, and J. Aweya. "Reliability Worth Evaluation in Electric Power DistributionSystems." The Third International Symposium on Electricity Distribution and Energy Management,Singapore, October 1993.
Bose, Anjan, and Paul M. Anderson. "Impact of New Energy Technologies on Generation Scheduling."IEEE Transactions on Power Apparatus and Systems, Vol. PAS-103, No.1, January 1984, pp. 66-71.
Caramanis, Michael. "Analysis of Non-Dispatchable Options in the Generation Expansion Plan." IEEETransactions on Power Apparatus and Systems, Vol. PAS-102, No.7, July 1983, pp. 2098-2103.
Caramanis. Michael C., Richard D. Tabors, and Kumar S. Nochur. "The Introduction of Non-DispatchableTechnologies as Decision Variables in Long-Term Generation Expansion Models." IEEE Transactionson Power Apparatus and Systems, Vol. PAS-101, No.8, August 1982, pp. 2658-2667.
Decision Focus, Inc. "Cost and Benefits of OverlUnder Capacity in Electric Power System Planning."EPRI EA-927. Palo Alto, CA: EPRI, October 1978.
Decision Focus, Inc. "Load Management Strategy Testing Model." EPRI EA-2396. Palo Alto, CA:EPRI, May 1982.
Electric Power Research Institute. "TAG. Technical Assessment Guide. Volume 1: ElectricitySupply-1989 (Revision 6)." EPRI P-6587-L, Volume 1, Revision 6. Palo Alto, CA: EPRI, November1989.
Electric Power Software. "LMSTM Reference Guide." Minneapolis: Electric Power Software, Inc..February 1991.
El-Gassier, Mohamed, Allen Jones, Ren Orans, Daniel Shugar, and Alexandra Suchard. "Benefits ofDistributed Generation in PG&E's T&D System: A Case Study of Photovoltaics Serving KermanSubstation." San Ramon, CA: Pacific Gas and Electric Company, August 1991.
7-1

Energy and Envirorunental Economics and Pacific Gas and Electric Company. "Targeting DSM forTransmission and Distribution Benefits: A Case Study of PG&E's Delta District." EPRI TR-100487.Palo Alto, CA: EPRI, May 1992.
Hamrin, Jan, and Nancy Rader. "Investing in the Future: A Regulator's Guide to Renewables."ORNL/Sub/95-X-SH985C. Washington, DC: National Association of Regulatory Utility Commissioners,February 1993.
Hirst, Eric. "A Good Integrated Resource Plan: Guidelines for Electric Utilities and Regulators."ORNL/CON-354. Oak Ridge, TN: Oak Ridge National Laboratory, December 1992.
Hobbs, Benjamin E, and Pravin Maheshwari. "A Decision Analysis of the Effect of Uncertainty uponElectric Utility Planning, Energy, Vol. 15, No.9, 1990, pp. 785-801.
Jacobs, Jonathan M., and Thomas E. Huntley. "Valuation of Fuel Diversity." Testimony in CaliforniaEnergy Commission 1992 Electricity Report Proceeding, Docket No. 90-ER-92, prepared January 27,1992.
Lamarre, Leslie. "The Vision of Distributed Generation." EPRI Journal, AprillMay 1993, pp. 6-17.
Logan, Douglas M. "Decision Analysis in Engineering-Economic Modeling." Energy, The InternationalJournal, Vol. 15. No. 7-8. July-August 1990, pp. 677-696.
Ma, Fred S.• and Leif Isaksen. "Impact of Dispersed Supply Management on Electric DistributionPlanning and Operations." IEEE Transactions on Power Apparatus and Systems. Vol. PAS-98, No.5,September-October 1979, pp. 1531-1539.
MacCrimmon, Kenneth R., and Donald A. Wehrung. Taking Risks. The Management of Uncertainty.New York: Free Press, 1986.
Marbek Resources Consultants Ltd. and Energy Systems Research GrouplTellus Institute. "Assessmentof Existing DSM Models and Their Use and Applicability in Canadian Utilities." 819 U 706. Montreal,PQ: Canadian Electrical Association, October 1990.
Merrill. H.M., and EC. Schweppe. "Strategic Planning for Electric Utilities: Problems and AnalyticMethods." Interfaces. Vol. 14, No.1. January-February 1984, pp. 72-83.
Milligan, Michael R., and Alan H. Miller. "The Value of Windpower: An Investigation Using a QualifiedProduction Cost Model." WindPower '93 Conference, San Francisco, CA, July 1993.
New England Electric System. "NEESPLAN 4." Westborough, MA: New England Electric System,November 1993.
Northwest Power Planning Council. "1991 Northwest Conservation and Electric Power Plan. Volumes Iand II." 91-04 and 91-05. Portland, OR: Northwest Power Planning Council, April 1991.
Pefia, Anna Karina. "PG&E's Investigation of an Alternative to ICEM as a Resource Planning Method."Testimony in California Energy Commission 1992 Electricity Report Proceeding, Docket No. 90-ER-92,prepared January 27, 1992.
7-2

Pindyck, Robert S. "Risk Aversion and Determinants of Stock Market Behavior." Review of Economicsand Statistics, Vol. 70, No.2, May 1988, pp. 183-190.
Quantitative Solutions. "Distributed Utility Valuation Project Monograph." EPRI TR-I02807. Palo Alto,CA: EPRI, August 1993.
RCG/Hagler Bailly. "Cost-Benefit Analysis of Power System Reliability: Determination of InterruptionCosts - Volume 1: Measurement Methods and Potential Applications in Reliability Cost-BenefitAnalysis." Palo Alto, CA: EPRI, April 1990.
RCG/Hagler Bailly. "Value-Based Transmission Resource Analysis." EPRI TR-I03587, Volumes I andII. Palo Alto, CA: EPRI, February 1994.
Shirmohammadi, Dariush, and Chifong L. Thomas. "Valuation of the Transmission Impact in a ResourceBidding Process." Paper No. 90WM252-7 PWRS. IEEE 1990 Winter Power Meeting.
Staschus, Konstantin, James Davidson, George Gross, Douglas Logan, Stella Perone, DariushShirmohammadi, and Alireza Vojdani. "A Multi-Attribute Evaluation Framework for Electric ResourceAcquisition in California." Electric Power & Energy Systems, Vol. 13, No.2, April 1991, pp. 73-80.
Stone & Webster Engineering Corp. "Electric Generation Expansion Analysis System. Volume 1:Solution Techniques, Computing Methods, and Results; Volume 2: Details of Solution Techniques, Dataof Test Systems, and Glossary of Tenus; Volume 3: Computer Program User's Manual; Volume 4:Programmer's Manual; Volume 5: Validation Manuar; Volume 6: Installation." EPRI EL-2561,Volumes 1-6. Palo Alto, CA: EPR!, August 1982-March 1984.
Temple, Barker & Sloane, Inc. "Project Risk Analysis: A Case Study of Plant Life Extension." EPRIP-5087. Palo Alto, CA: EPRI, March 1987.
Temple, Barker & Sloan, Inc. and M.S. Gerber & Associates, Inc. "Multiobjective Integrated DecisionAnalysis System (MIDAS). Volumes 1 and 2." EPRI P-5402s-CCM, Volumes 1 and 2. Palo Alto, CA:EPRI, 1988.
Wan, Yih-huei, and Brian K. Parsons. "Factors Relevant to Utility Integration of Intermittent RenewableTechnologies." NRELffP-463-4953. Golden, CO: NREL, August 1993.
Western Area Power Administrtaion. "Western RPG Development Process Reviews 47 IRP ComputerSoftware Models." Customer C&RE Management Updated, 1992.
Weston, J. Fred, and Eugene F. Brigham. Managerial Finance. 7th ed. Hinsdale, IL: Dryden Press,1981.
Yamayee, Zia A. "Modeling Intermittent Generation (IG) in a Monte-Carlo Regional System AnalysisModel." IEEE Transactions on Power Apparatus and Systems, Vol. PAS-I03, No.1, January 1984,pp. 174-181.
7-3

Appendix A: Selection of Models for Review
This appendix describes how the project team selected the models to review. These models are listed inTable 1-1.
First, we identified and contrasted the resource attributes associated with conventional supply-sideresources, renewable energy technologies, and demand-side management options. These attributes arelisted in Table 2-1 along with the types of models in which these attributes playa direct and significantrole.
The twelve models were selected from among 110 planning models. The complete list of models wasdeveloped by examining results from several general model reviews and by drawing on the industryknowledge of both NREL and RCG/Hagler Bailly project participants. The following primary modelreviews were used:
• American Public Power Association, Utility Resource Planning Software: A Compendium, 1992.
• Marbek Resources Consultants, Assessment ofExisting DSM Models and Their Use and Applicabilityin Canadian Utilities, 1990.
Western Area Power Administration, Model Review, 1991.
The process of selecting the short list involved the following:
• Determining which of the attributes in Table 2-1 currently present the greatest technical challengesfor the appropriate comparison of renewable, conventional, and DSM options
Determining the key model types associated with these attributes
Segmenting the compiled list of models into these key model types
Selecting one or more models from each of these segmented categories that are available, used byutilities, or judged to be among the most advanced models within the category.
In consultation with NREL, the project team identified fi ve of the ten attributes displayed in Table 2-1as presenting the greatest technical challenges for utility modeling:
Capability-predictable profilesAvailability-intermittence and availability diversi tyLocationModularityDiversity.
The other five attributes (efficiency, dispatchability, incentives. risks, and external costs) were deemed tobe suitably addressed in current utility modeling methodologies or were covered in several of the selectedattributes. 1
IFor example, the attribute category of risk in Table 2-) was associated with start-up delays and prematureshutdowns. These risks can be suitably evaluated with exisung uulity models; however, the risks associated withproject capabilities, availabilities, and costs will be addressed within each of those selected attribute categories.
A-I

An issue of particular interest related to capability and availability is the effect of renewables on thecommitment and dispatch of other resources and the modeling of this relationship.
The project team identified 19 different types of modeling capabilities that could be used to categorize themodels. Those 19 capabilities are defined in Table 3-1. The relationship between attributes and modeltypes is displayed in Table 3-2.
After reviewing Table 3-2, the project team concluded that the five selected key attributes playa directand significant role in the following six key model types:
Project economic analysis• Resource planning• Production simulation
Generation reliability• Location benefi ts
Uncertainty analysis.
Several of the key attributes also playa role in bulk power market models. However, the function of thesemodels is to forecast bulk power market prices and quantities rather than to evaluate renewable options.Renewable resources playa role only to the extent that their aggregate quantity is sufficient to influencebulk power markets. However, this is not likely to be substantial (except in the case of hydro in someregions), given the overwhelming quantity of existing resources relative to even high penetrations ofrenewables into the mix of resource additions over typical utility planning horizons.
A number of other model types are also identified with the location attribute in Table 3-2. However, therelevant issues for renewables are captured in location benefits models.
In several cases, there were a number of similar models that were equally qualified for inclusion on theshort list. However, because of these models' similarity, there was no additional benefit to including allof them on the short list. Therefore, the project team has selected representative models from these groupsof similar models.
A-2

Appendix B: Technical Analysis of Risk Preference Functions
The application of portfolio concepts to diversity in electric resource planning starts with the concept ofrisk preference from decision analysis. A decision maker's attitude toward risk is modeled by a riskpreference function, which expresses the relative value of different values of monetary outcomes.Figure B-1 is a risk preference function representing a hypothetical customer's attitude toward variouslevels of his annual electricity bill. The horizontal axis is the dollar amount, vc' of the customer'selectricity bill; the vertical axis, u(vc), is the utility of the dollar amount, in the decision-theoretic meaningof utility. The function slopes to the right to reflect that increasing electricity costs are undesirable. Thecurvature of the function reflects the notion of decreasing marginal utility of wealth.
The value of vc for a future year is uncertain. Let this uncertainty be represented by a probabilitydistribution p(vc). Let E[vc] and Var[vc] denote the expected value and variance of vc. The expectedvalue of the utility of vc is called the expected utility of vc and is calculated as:
(1)
The certain equivalent of vc is a dollar value vc* that has the same expected utility as the random outcomerepresented by the probability distribution p(vc); that is:
u(vc*) = Ju(vc) p(vc) dvc . (2)
Intuitively, the customer is indifferent between the uncertain outcome of his portfolio and the certain valuevc*. The value of vc* can be calculated approximately by:
where r is the risk tolerance of the customer. The value of r is defined as:
u lr == IT'u
(3)
(4)
where u" and u" are the first and second derivatives of u at vc=E[vc]' The certain equivalent isapproximately the expected value less a term that is proportional to the variance. The risk tolerance rexpresses the trade-off between the expected value and variance from the perspective of the customer.The customer would favor an action by the utility that would decrease the variance by an amount~ Var[vc] so long as it does not increase the expected value by more than:
1- . ~Var[vc]2 r
(5)
So far, we have been examining the issue from the perspective of an individual customer. The sameconcepts apply to total system costs v, with expected value E[v] and variance Var[v]. Given amechanism for allocating total costs between the customers and a risk preference function for eachcustomer, an aggregate customer risk preference function u(v) can be constructed from which the overallcertain equivalent v* can be calculated.
B-1

40 r------------------------------~
OL---------------..::::.~--------------___j
20
-20
>.--::J-40
-60
-80
100908070605040302010
-100 L- -----'
o
Annual Electricity Bill (K$)
t:CI
N Figure B-1. Risk preference function for annual electric bill

Now let us consider an individual project and the effect it has on the overall portfolio. Let s denote thenet benefits of the project, Els] the expected net benefits, Var[s] the variance of net benefits, and Cov[s,v]the covariance between the net benefits from the project and the cost of the total portfolio. Thecontribution of s to the expected value and variance of the whole portfolio is:
L1E[v] E[s] ,L1 Var[v] = Var[s] + 2Cov[s,v] .
(6)
But if s is small relative to the rest of the portfolio, the second term will dominate L1Var[v]. Thus, theeffect of the project on the certain equivalent of the portfolio is:
1L1 v* = E[s] + _ Cov[s,v]r
The second term represents the diversity benefit of the project.
(7)
B-3

Appendix C: Descriptions of Models Reviewed
The following discussion describes each model reviewed, provides a justification for its inclusion on theshort list, and summarizes the comments that appear in various places in the report.
Delta
PG&E and EPRI developed the Delta model to evaluate DSM options targeted to a specific local area.'The model has subsequently been extended to renewable resources, and further efforts sponsored byPG&E, EPRI, and NREL are currently under way to overcome particular shortcomings of the earlier work.
The Delta model consists of three principal sections, which are invoked in an iterative cycle:
1. Marginal costs2. Evaluation3. Ranking and implementation.
The marginal cost section calculates annual marginal T&D costs given a T&D investment plan using thepresent worth (PW) method. The PW method determines marginal T&D costs on the basis of theincremental savings in the present worth of total T&D costs over the planning horizon, resulting from areduction in net demand in the local planning area. The annual marginal T&D costs are then allocatedto some number, say 100, of the highest peak hours in proportion to load.
Marginal T&D costs are sensitive to the level of DSM and other DU options in two ways. First, the levelof DSM and other DU options determines the number of years that T&D reinforcements can be deferred.If any T&D reinforcements are deferred, the base T&D investment plan is changed on which annualmarginal T&D costs are based. Second, the allocation of annual marginal T&D costs between hourschanges if the ratios of the hourly net loads change.
Marginal generation energy and capacity costs are taken as an input. Conceptually, marginal generationcosts are also sensitive to the level of DU options. But if only one local planning is under considerationand if the local planning area is small relative to the rest of the system, then the range of net load resultingfrom implementing DU options is likely to be too small to cause significant variation in marginalgeneration costs.
The evaluation section performs cost-effectiveness evaluation of the individual DU options. The benefitsof each option are calculated on the basis of the marginal generation (energy and capacity), transmission,and distribution costs passed from the marginal cost section. For each option, this section requires thehourly profile of capacity (for a generation option) or demand reduction (for a DSM option). The modeldetermines the hourly dispatch of a dispatchable generation or load management option on the basis ofincremental hourly operating cost and marginal energy and capacity cost. The net present value ofbenefits from an option can be calculated using any of the California Standard Practice cost-effectivenesstests.
The implementation section selects the DU options to include in the plan. The options are ranked on thebasis of either net present value of benefits, benefit/cost ratio, or net benefits divided by a measure of peakload reduction. Increments of the highest ranked options are added to the plan in an iterative manner.First, an increment of the most cost-effective program is added. An increment may be either a portion
'Energy and Environmental Economics and Pacific Gas and Electric Company (1992).
C-I

or the entire amount of the total potential of the program. Increments smaller than the entire amount areconsidered if it is possible that a saturation effect may cause the cost-effectiveness of the option to switchfrom positive to negative as a larger portion of the total potential is implemented.
Second, the net area load is adjusted to account for the impact of the option added. Third, the hourlyspread of local T&D costs is recalculated. Fourth, the options are re-ranked and the iterative processreturns to the first step to add the next most cost-effective option.
Further discussion of the treatment of the key attributes in the Delta model follows.
Capacity/Availability. The Delta model takes 8,760-hour profiles. A· forced outage rate can be used torepresent any uncertainty in the output or load impact of a DU option. However, as described inSection 4.1, uncertainty can also be accounted for by constructing the 8,760-hour profile from typical daysrepresenting the profile of the option under different conditions. A shortcoming of the model is that itcalculates the dispatch of dispatchable DU options only for the current year, then applies the same dispatchprofile to every subsequent year throughout the life of that option. While subsequent DU devices mayhave different dispatch patterns, changes from year to year in dispatch for a particular device resultingfrom changes in the hourly profile of marginal costs are ignored.
Location. The location attribute is the reason for existence of this model. Location benefits are explicitlyevaluated by the use of geographically differentiated marginal costs. A shortcoming of the model is thatis does not currently handle more than one local planning area at a time. Local area marginal T&D costsare derived on the basis of the local area T&D investment plan. Annual marginal costs are allocatedamong the hours in a year on the basis of the hourly profile of local area demand.
Modularity. As an incremental model that uses marginal costs, the Delta model can handle even thesmallest options. As described above, the Delta model can evaluate increments of a DU option that areonly a portion of total potential. In this was the model can account for the benefit of small incrementalsize options in tracking load growth more closely. However, the Delta model has no capability foruncertainty analysis and therefore cannot evaluate the benefits of modularity under uncertainty.
Diversity. The Delta model does not have the capability for directly evaluating diversity benefits.
DYNAMICS
DYNAMICS is an EPRI model that was created to evaluate the benefits of energy storage systems andthe impact of non-traditional energy sources on a utility system's operations. It is a short-termcommitment model intended for use by utility dispatchers in determining appropriate commitmentschedules, concluding cost-effective spot power transactions, and utilizing energy storage systems in anoptimal manner. It can model a utility system from one hour up to five weeks. DYNAMICS providesfor a detailed representation of dispatch constraints such as unit ramping limitations, hot start and coldstart considerations, and spinning reserve requirements.
Capability/Availability. DYNAMICS allows a user to specify the same type of hourly load modifiers ascan be defined in many of the other models. DYNAMICS does not currently have any capabilities thatwould represent potential uncertainty in getting energy from these load-modifier resources; however, someprobabilistic features have been slated as future enhancements.
Location. Although DYNAMICS can evaluate transmission losses, it has no specific capabilities thataddress the location benefits of new resources.
C-2

Modularity. In a very short-term sense, DYNAMICS is able to evaluate the reliability benefits associatedwith small, multiple units and can quantify this benefit in terms of operating cost savings due to smoothercommitment scheduling. However, modularity in this project refers primarily to the longer-term issue ofmatching variable load growth conditions with the construction of small, modular units, and DYNAMICSis too short term of a model to contribute on this front.
Diversity. Given the very short time frame of the model, there is no probabilistic assessment of fuel pricesor availability. All such parameters are assumed to be known with certainty.
Electric Generation Expansion Analysis System (EGEAS) and IRP Workstation
The Electric Generation Expansion Analysis System (EGEAS) was originally developed for EPRI in 1982by Stone & Webster Engineering Corporation and the Massachusetts Institute of Technology.r EGEASis a generation expansion optimization model that evaluates DSM and supply-side resources to determineoptimal least-cost expansion plans. The model provides a ranked list of suboptimal plans that the usercan examine to identify expansion plans that have better qualitative characteristics than the least-cost plan.EGEAS can also be used for reliability analysis: it can evaluate probabilistic reliability indices andestimate a utility's marginal cost of meeting reliability targets. One of the original features of EGEASwas its capability to model non-dispatchable technologies (NDTs) such as DSM and renewable resources.
EGEAS is at the heart of a broader system that Stone & Webster Management Consultants, Inc. developedcalled IRP Workstation. IRP Workstation is a recent development that allows EGEAS to interact withother models, including the DSManager screening model, the RISKMIN risk analysis model, andFINANCE+, a financial planning and rate analysis module. This new system includes additionalcapabilities to assist utilities in performing integrated resource planning.
Capability/Availability. EGEAS/IRP Workstation is designed to handle renewable resources and DSMas NDTs. NDTs are modeled as load modifiers, though they could obviously be included as generatingunits. An advanced feature of EGEAS is to analyze NDTs that are interrelated with system demand.EGEAS uses the ELDC method for dispatch simulation. A chronological option is forthcoming. NDTsare assumed to have two availability inputs, energy related and equipment related. Energy-relatedavailability is due to insolation or wind energy. The key feature of energy-related availability is that itcan be interdependent with system load. EGEAS will accept, for example, insolation data to determinethe interdependence of load and solar generation. Equipment-related availability is equivalent to standardgenerating unit forced outages and is independent of load. EGEAS uses an orthogonalization method thatconsiders the probabilistic interdependence of load and availability of NDTs prior to developing its loadduration curve.
NDTs and DSM impacts can be input to EGEAS/IRP Workstation with a full 8,760-hour load shape. ForDSM programs, EPRI's DSManager program can be used to supply the impact estimates as well as forcost-benefit analyses. DSM data can also be fed to EGEAS from Synergic Resource Corporation'sCOMPASS model or from the utility's in-house data.
Location. Version 7 of the model considers locational impacts of new resources. The utility system canbe subdivided, and resources can be assigned to the subdivisions for future analyses. Price elasticityimpacts are measured, as well as T&D impacts.
2Stone & Webster Engineering Corp. (1982-1984).
C-3

Modularity. EGEAS has four options for IRP: pre-specified pathway, screening curves, generalizedbenders (GB) decomposition, and dynamic programming. GB optimization uses continuous plant sizes,which may be useful in analyzing modular units, but can result in only an approximation of the optimalsolution for most types of units. Dynamic programming retains the integer nature of units, but takeslonger to run.
EGEAS includes decision analysis capabilities that would be useful in examining the impact of short leadtimes.
Diversity. EGEAS was designed to include consideration of uncertainty, and this capability has beenenhanced in the IRP Workstation implementation. Multiple scenarios can be specified and automaticallyrun. The results can be combined using scenario probabilities. Results can also be passed directly toEPRI's RISKMIN model. RISKMIN can be run to identify robust expansion plans and robust options andto calculate measures of riskiness.
Elfin
Developed by the Environmental Defense Fund, Elfin is a production simulation tool that has beenpromoted as the standard model for California utilities by that state's Public Utilities Commission(CPUC).3 Elfin uses the equivalent load duration curve method for dispatch simulation. The modelincorporates two capacity expansion algorithms: the Iterative Cost-Effectiveness Methodology (ICEM)and the Iterative Test for Resource Evaluation (ITRE). Through the use of this methodology, an Elfin usercan develop a capacity expansion plan from a set of potential DSM or supply-side resources. ELFIN alsoincludes a financial model.
Capability/Availability. Elfin started as a load duration curve model that was slightly simpler and muchless expensive than other available models. The model has, over the years, been significantly upgraded.An important upgrade was to include time-of-day considerations that can significantly improve themodeling of renewable resources and DSM. Another upgrade was adding the capacity to model energylimited units such as storage and hydro. Elfin can model up to 54 typical weeks per year.
Renewable resources can be modeled in Elfin as load modifiers or as generating units. When DSM orgenerating units are modeled as load modifiers, Elfin first adjusts the chronological load data and thendevelops the load duration curves. Elfin has separate load modifiers for demand-side resources andsupply-side resources. Demand-side load modifiers are treated as direct reductions in load, beforecommitment and spinning reserve targets are calculated or annualized maintenance is scheduled. Supplyside load modifiers are included with other supply-side resources in calculations related to meetingcommitment and spinning reserve targets and annual maintenance requirements. In addition, if userspecified transmission and distribution losses are modelled. energy requirements will be reduced more bydemand-side load modifiers than by supply-side load modifiers. because supply-side resources must meetloads including T&D losses.
When renewable resources are modeled as generating units. the units can be defined by time of day, butElfin uses only the average capability within each simulation subperiod. If separate subperiods aredefined, a separate load duration curve is developed for each subperiod. Elfin can use up to eightsubperiods, but run time is directly proportional to the number of subperiods.
3Pefia (1992); Belostosky et al. (1992).
C-4

One weakness of Elfin is that it does not consider ramp rates in the model. The full effect ofintermittence may therefore, be difficult to model explicitly using Elfin. Elfin does have spinning reserveand commitment capability, which could be adjusted to partially account for intermittence.
Location. The model does not have any capability to internally calculate effects related to location. Themodel can be provided, however, with loss factors related to location and with costs for location-relatedupgrades to the T&D systems.
Modularity. The model in either its ICEM or ITRE version can be run to consider adding units of smallsize. However, ITRE has several features which give it flexibility not found in ICEM. They include:1) resources once added to an expansion plan can be deleted later if they are found not to be costeffective, 2) ITRE always analyzes the whole planning period in each iteration where ICEM builds a planyear by year, starting from the beginning of the planning period, 3) ITRE's marginal cost basedimplementation can evaluate large numbers of options in a short time frame.
There may be a practical limitation on the Elfin/ICEM model's ability to evaluate modular alternatives,however, because evaluating each alternative requires running the production costing submodel a numberof times. Thus, the evaluation of a number of small alternatives could require many hours of run-time.Including sufficient alternatives to allow Elfin/ICEM to select small-sized units to match load more closelycould require many more hours to run than if only larger units were considered.
ITRE is capable of adding several resources based on marginal cost estimates before having to do anothersimulation. Elfin/ITRE has many user-specified options for specifying level of detail in varioussimulations in order to be able to run capacity expansion optimization in a reasonable period of time.
The model performs single scenario analysis; the ICEM and ITRE approaches select a plan for one setof assumptions. Analyzing alternative scenarios and uncertainties requires manual specification of multipleruns of the model.
Diversity. The model will not automatically combine the results of different scenarios, but it is designedto easily run different scenarios. Every input category includes a scenario identifier and the scenario tobe run is specified in the command file. Running high, medium, and low assumptions for demand andfuel price forecasts is a standard procedure for the California utilities, for example.
An enhancement to the model would be the ability to automatically run multiple scenarios withprobabilities assigned to the scenarios, and have the results combined to arrive at an expected cost.
IRP-Manager
IRP-Manager is a relatively new integrated resource planning and strategic analysis model developed byEPRI and supported by E1ectricPower Software, Inc." IRP-Manager includes a graphical user interface,a relational database management system, a decision analv... is (DA) module, and a module that performsiterative resource selection. The DA module supports interactive decision tree definition, automaticallyconstructs data components into scenarios, and present" J wide range of results. The entire model,including the iterative resource selection module. is de"igned for analyzing multiple objectives andperspectives.
4Decision Focus, Inc. (1982); Electric Power Software (1991).
C-5

At the core of IRP-Manager is an enhanced, faster version of the former LMSTM production simulationengine, which conducts a chronological demand-supply simulation and fully integrates customer and utilitydata across demand, supply, finance, and rates modules. IRP-Manager's centralized database designprovides direct data linkages with several EPR! and non-EPRI models, including EPRI DSManager, EPRIHELM, and EPRI EGEAS. Planned near-term enhancements include an expanded iterative resourceselection technique, similar to ITRE or CAPEX.
Capability/Availability. The chronological dispatch methodology applied by IRP-Manager provides a moredetailed and explainable analysis of renewable resources than possible with pure load duration curvemodels. True hourly marginal costs and dispatch of supply and load control resources can be viewedinteractively and analyzed in detail if desired.
IRP-Manager applies either three, four, or seven "typical daytypes" each month (seven daytypesrepresenting a typical week). Monthly results are determined by the number of individual days in themonth represented by each typical day. The daytypes could be applied to account for variation inproduction from renewables, where that is a focus of the analysis.
Because of the chronological nature of the model, renewable resources can be modeled in detail on anhourly basis if desired, and tracked through all results reports. The user has the option of modelingrenewables as load modifiers, energy-limited generating units, or interchanges. Most generating unitparameters can be altered monthly if desired; load and interchange data can be altered hourly if desired.
Location. IRP-Manager adjusts the impact of each resource for T&D losses. This is useful for DSM andrenewable projects that are located at the load center or that avoid transformation losses, and is useful foraccounting for remote generation. Percent losses are input to the model on an annual, monthly, or hourlybasis, as desired. Asset and operating expense accounts can be applied to model T&D costs; it is plannedthat the automated calculation of T&D costs as a function of load level will be added in 1994.
Modularity. The chronological simulation employed by IRP-Manager accurately represents even smallincrements of capacity such as renewable resources and DSM. Small increments of capacity cannot"getlost in the noise" of a large system, as is often the case with load duration curve modeling techniques.
Although iterative resource selection techniques support the modeling of more unique resource optionsthan does dynamic programming, these simulations may take a considerable amount of time if anespecially large pool of unique resources is considered. Various modeling techniques are available in IRPManager to reduce run-time requirements, including grouping of resources and simplified generating unitcapacity and availability modeling. As of this writing, the vendor is implementing end-effects logic andother techniques to further reduce run-time in these situations.
Diversity. IRP-Manager includes a decision analysis ability. The decision analysis framework can bespecified to run different scenarios for load growth and fuel costs, for example, and combine the results.TIlls is one of the new features included in the model and indicates a growing concern and interest in thistype of analysis.
ISAAC
The Bonneville Power Administration (BPA), the Northwest Power Planning Council, and the Northwestutilities developed the Integrated System for Analysis of Acquisitions (ISAAC).5 It is a decision
5Northwest Power Planning Council (1991), Volume II, Part II, pp. 939-953.
C-6

analysismodel that examines the benefits of acquiring different types of resources in meeting uncertaindemand. A Monte Carlo process is used to generate and analyze the effects of different load levels andhydro conditions that may occur in each year of the study. The model is used by BPA and the NorthwestPower Planning Council.
The model features an automatic algorithm for updating the resource plan in response to changes in loadas the simulation steps through time. This algorithm could be useful in evaluating the benefits ofmodularity. However, this algorithm may be regarded as an approximation of a decision analysisapproach.
ISAAC is a rather aggregated model because it is designed to model the entire Pacific Northwest. Threeor four groups of utilities or planning parties are modeled, typically investor-owned utilities, governmentutilities, and BPA. Resources are aggregated into one of six categories: nuclear, low-operating-cost coal,high-operating-cost coal, simple-cycle combustion turbines, combined-cycle combustion turbines, and loadreducing resources.
The model, as implemented in the Pacific Northwest where hydro and fish are important considerations,includes four seasons: September through December, January through April, May, and June throughAugust.
Capability/Availability. Currently, only energy loads are represented (i.e., there is no peak informationin the model). Non-dispatchable resources such as renewables and conservation are typically modeled asload reduction resources with seasonally shaped energy contributions. Hydro resources are simulated asone aggregate unit with hydro conditions randomly selected based on probabilities associated with the 102year water record.
Location. The model does not explicitly analyze locational impacts of new resources.
Modularity. The model can handle modular resources. Even though it is designed to deal withaggregated blocks of resources, it selects individual units from within these blocks. Supply curves aredefined by specifying the number of units available, and the model selects the appropriate number ofblocks to add.
Another feature of the ISAAC model that appears unique is that resource addition decisions are made intwo steps: permitting and construction. The first decision is to start the pre-construction activities on aunit-permitting, licensing, and engineering design. If this phase is successfully completed in the model,the option moves to an inventory account. Units can be held in inventory for several years, but may alsofallout of the inventory account if construction is not started within a specified time period. The seconddecision is to start construction of a project from the inventory of available projects. This approach furtherdemonstrates the benefits of short lead time projects and, in some respects, is a more sophisticatedapproach than the one actually used by most utilities.
Diversity. The model includes a decision analysis framework and Monte Carlo simulation to incorporatethe effect of alternative scenarios. Many considerations are explicitly modeled in a probabilisticframework. The factors that are modeled using probabilistic considerations include:
Load growth (excluding the aluminum industry)• Aluminum industry load
Fuel price (both fixed and variable)Successful completion of resource permitting
C-7

Loss of resources in inventoryExpected and actual amount of a particular type of resource available.
The most important of these is load growth, but fuel prices are also modeled with a detailed uncertaintyanalysis. Note that the model has probabilities for successful completion of the permitting phase of aproject and for failure once a project is in inventory, but not for successful construction. The assumptionis that all the potential for failure occurs in the permitting and inventory phases. Once a project hassuccessfully negotiated these hurdles, it is assumed with certainty that it will complete the constructionphase.
There are interdependencies among some of the fuel costs, so that fuel costs for gas-fired combustionturbines, combined cycle facilities, and cogeneration units all move in a related manner.
MASS
The Multi-Attribute Bidding System (MABS) is a spreadsheet model for evaluating the net benefits ofcandidate projects; it was developed by PG&E, SDG&E, and SCE as part of a broader effort to reformthe resource bidding procedure imposed by the California Public Utilities Commission," Some of theprinciples guiding the development of MABS were:
Consideration of attributes other than price. The bid evaluation framework must accommodate otherattributes and convert them to dollar values for comparison to price.
• Price signals. The relative values and weights assigned to various attributes should be able to beinterpreted as price signals reflecting the economic value of various options to the utility.
• Flexibility. Both the price structure and the evaluation framework should be sufficiently flexible toaccommodate a broad range of resource options, operating characteristics, and financial requirements.
Self-scoring. A project developer must be able to use the bid evaluation framework to optimize hisbid before submitting it.
MABS was implemented as a Lotus 1-2-3 spreadsheet for distribution to prospective bidders with asolicitation.
MABS is unique among the 11 models reviewed in that it performs an incremental analysis based onmarginal costs to determine the net benefits of an individual project. All of the other models aresystemwide models. Incremental analysis can be performed with the other models only by taking thedifferences between multiple model runs.
MABS evaluates the following seven components:
• Capability benefitsEnergy and controllability benefitsLocation
• Price diversity• Start date flexibility
'Staschus, et al. (1991).
C-8

Project viabilityEnvironmental impact.
Although many of these components have been quantified using a simple point-scoring system in otherutilities' bidding processes, they nevertheless have a real economic impact on the utility. MABS attemptsto estimate the economic value of each of the components to allow them to be traded off consistentlyagainst price.
Capability/Availability. Capability and availability are modeled in the course of evaluating capacity andenergy benefits. Capacity benefits are calculated on the basis of marginal generation capacity costsaccounting for forced outages, maintenance requirements, and the hourly and seasonal profile of capacity.In evaluating energy benefits, the model accounts for different levels of dispatchability. Generation froma base-loaded resource is limited only by capacity and availability. Energy limited resources are assignedto the hours with highest marginal energy cost. The capacity factor of a fully dispatchable resource isestimated on the basis of a marginal cost duration curve to determine the fraction of hours that marginalcosts are higher than the variable energy cost of the resource. Curtailable resources is modeled as shutdown for up to the maximum number of curtailable hours if it is economic to do so. The value of thegeneration from a resource is determined from system marginal energy costs.
Location. The location of a resource is accounted for in two ways:
• Losses. The effect of a resource on total system losses depends on location.
System reinforcement adjustment costs. The effect of a resource on requirements for transmissionreinforcements depends on location. A resource may either accelerate or defer a reinforcement.
Both components are determined on the basis of marginal values estimated from optimal power flowsensitivity analysis using the LOCATION model?
Diversity. MABS calculates the net benefits of a project for each of three different natural gas pricescenarios, then estimates the covariance between net benefits and total system production costs todetermine the price diversity benefit. MABS follows the procedure described in Section 4.4.
Modularity. MABS evaluates the benefits of short lead times and start date flexibility. MABS calculatesthe net benefits of a project for each of three different demand scenarios. If the project offers start dateflexibility, then maximum acceleration and deferral are assumed in the high and low demand scenarios,respectively. MABS explicitly displays the gain in net benefits that results from acceleration in the highscenario and the reduction in negative net benefits that results from deferral in the low scenario.Generally, a resource with shorter lead time can offer great start date acceleration. MABS can evaluateprojects of any size, except projects so large that the validity of system marginal costs may be a concern.But MABS does not explicitly evaluate any modularity benefits resulting from small unit size.
MIDAS
The original Multi-objective Integrated Decision Analysis Model (MIDAS) was developed by M.S.Gerber & Associates for EPRI. 8 Subsequent updates to the user interface and simulation system comprise
7Shirmohammadi and Thomas (1990).
8Temple, Barker & Sloane, Inc. and M.S. Gerber & Associates, Inc. (1988).
C-9

a newer model called MIDAS Gold. This tool allows a user to formulate resource planning problems ina decision tree where different nodes in the tree represent either planning uncertainties (e.g., high/lowloads, high/low fuel prices) or planning decisions. MIDAS Gold simulates the utility system's loads,resources (thermal, energy limited, DSM, contract purchases, economy interchange), emissions, finances,and rate impacts for each path or scenario, of the decision tree. Users define objectives (revenuerequirements, total resource test, average rates, societal test, etc.) which are created after the simulation.MIDAS Gold then calculates the expected value of alternative resource strategies based upon futureuncertainty,
Capability/Availability. MIDAS Gold has a load modifier capability. Thus, renewable resources can hemodeled as generating units or as reductions from load. MIDAS Gold can also reflect uncertaintyassociated with cost, technical versus actual performance, demand, or any other input variable as part ofthe analysis.
The model also includes energy limited units, which are often used to model hydroelectric units. Smallunits can be included through the multiple unit specification. MIDAS Gold allows for mutually exclusiveresources such as those built in phases, or with evolving technical characteristics, and capital replacementpatterns associated with technologies such as fuel cells.
The production costing method within MIDAS Gold is aggregated and fast rather than detailed. It doesinclude tracking of five emission types, fuel inventorying, and fuel use of up to three fuel sources pergenerating unit.
Location. MIDAS does not explicitly develop or consider locational factors.
Modularity. MIDAS explicitly models sequential decision making, which is particularly useful inevaluating the benefits of modularity.
Diversity. MIDAS Gold combines the results of multiple scenarios within a decision analysis frameworkto develop resource strategies according to user defined objectives. MIDAS Gold performs one simulationyear in between 1-2 seconds, which permits the evaluation of hundreds of scenarios in an overnight run.Results from the model may be viewed, customized, exported in a general presentation tool called aResults Matrix. Then, alternative objectives may be compared to determine the optimal choice at eachdecision node without having to re-simulate the model.
MIDAS also provides information on the riskiness of decisions. It provides information on risk exposureso that utilities can manage their risk. The model develops risk profiles in addition to the most likely orexpected outcome. MIDAS Gold also calculates the expected value of perfect information (EVPI) andvalue of control. EVPI examines the value of obtaining better, or perfect, information about planninguncertainties; while, value of control quantifies the benefit of resolving an uncertainty in a resource plan.
PROMOD IV
EDSfEnergy Management Associates (EMA) first developed PROMOD in the 1970s and the model hascome to be widely used throughout much of the utility industry. PROMOD IV is a production simulationmodel with three dispatch options for assessing the effects of unit availabilities on utility systemoperations: 1) a Booth-Baleriaux probabilistic convolution technique, 2) an hourly chronological MonteCarlo dispatch technique, and 3) an hourly chronological Monte Carlo technique with transmission
C-IO

constraints." There is both a single-area and a multi-area version of the program. The single-area versionfocuses on the dispatch of an individual utility without any transmission constraints. The multi-areaversion allows one to model an entire interconnected power pool and account for inter-utility economypower interchange and area-to-area transmission limitations.
Capability/Availability. The most commonly selected time period for PROMOD IV's simulation is atypical week - a 168-hour representation that is meant to approximate a utility system's operations foreach month. Thus, system loads are developed that contain 168 hourly values for each month; each hourlyvalue represents the average system demand over that particular hour. However, the model also has aweekly dispatch option that allows the user to model all 8,760 hours in a year.
As is the case with most production simulation models, PROMOD IV allows the user to define renewableresources as either load modifiers or generating units. Load modifiers can be defined on an hourly basisand are added to (in a system sale) or subtracted from (in a power purchase or a renewable project) thesystem loads before dispatching the utility's generating resources. In the case of the convolution dispatchoption, PROMOD IV segments the week into three subperiods, based on the user's designation: weekday,weeknight, and weekend. After the hourly loads have been modified, they are segregated into threesubperiods and sorted into three load duration curves. Generating units are dispatched against the loadduration curves by piece-wise linear convolution. Units are modeled in terms of blocks of capacity thatrepresent the different operating levels at which a unit can generate power. A unit can have up to sevenblocks, and each block can have a different availability designated for it.
The commitment of units in the dispatch process involves a look-ahead scheduling mechanism thatdetermines the probability that the unit will be needed during high-load periods. In combination withuser-specified commitment targets, this scheduling results in the initial commitment of resources.Subsequently, additional units may be committed during the dispatch process to maintain adequatespinning reserves. In the multi-area version of PROMOD IV, commitment constraints can be specifiedfor each area, for a cluster of areas, and for the entire power pool.
Each resource (whether a load modifier or a generating unit) can be designated as contributing toward thesystem's commitment target in one of three ways: 1) it is non-firm and does not contribute any capacityto the target, 2) it contributes the amount of capacity that is available during the system peak hour, or 3)it contributes its maximum capacity (regardless of what hour that occurs in). There currently is no wayto weight a resource with a partial commitment percentage that would reflect a dispatcher's level ofconfidence in relying on the resource. This all-or-nothing process forces the user to consider a renewableresource as either entirely dependable or entirely undependable in its impact on the commitment process.
Dispatch is modeled separately for each of three different subperiods for each month. A user can deratea generating unit or make it entirely unavailable in any subperiod. This could allow a user to specify, forexample, a renewable unit that was only available during the daytime. The probabilistic dispatch processaddresses generating unit forced outages only; there is no analogous availability factor that can bespecified for load modifiers.
Location. PROMOD IV's multi-area version allows a user to analyze and assess the benefits of locatingnew generating resources (such as renewables) in geographic areas that are bumping their transmission
9The majority of this section's discussion applies to PROMOD IV's probabilistic convolutiondispatch technique. The model's hourly chronological Monte Carlo dispatch techniques involvesimilar issues to those discussed in the UPLAN and IRP-Manager sections.
C-ll

import limits. However, a user cannot use PROMOD directly to model the deferral of T&D investmentsassociated with new generation in such areas.
Modularity. PROMOD IV is a single-scenario simulation tool. Therefore, it does not provide the userwith an easy means of assessing the benefits of modularity. Instead, the analysis would have to be donewith several runs and would rely on outside financial and rate analysis. PROMOD IV could be used tocompare the operational ramifications of having excess capacity (e.g., because the construction of a largeunit was followed by lower-than-expected load growth). Another simulation could examine theconstruction of several smaller units that more closely matched the new load growth pattern. However,the modularity benefits of the smaller resources would depend on the probability of a down-turn inprojected loads and the financial and regulatory ramifications of surplus capacity. These issues cannotbe analyzed with PROMOD IV.
Diversity. PROMOD IV does not have any explicit scenario development and analysis capabilities. Issueslike diversity would have to be examined through multiple runs of the model and subsequent tabulationand analysis of the results.
PROSCREEN IVPROVIEW
PROSCREENIPROVIEW, also an EMA product, is a comprehensive, modular, integrated resourceplanning tool that is used by over 80 utilities. As a screening model, it uses a simpler and faster dispatchsimulation methodology (the cumulant technique) than the more-detailed method used in PROMOD III.PROSCREEN also has modules for end-use load forecasting and price elasticity impacts, capitalaccounting, and financial/rate analysis. In addition, it includes PROVIEW, a dynamic programming-basedresource optimization tool. Dynamic programming is an efficient optimization technique that effectivelyexamines all feasible generation expansion plans over a specific time period and selects the least-costplanes). However, the size of the optimization problem increases exponentially with the number ofavailable resources, so one must be careful to limit the pool of resources to a manageable number.
Capability/Availability. PROSCREEN provides the user with many of the same capabilities as werediscussed in the PROMOD section. PROSCREEN load representations are also based on a 168-hourtypical week. This typical week can be specified for up to 12 seasons per year. Therefore, thePROSCREEN user has the flexibility to define monthly or quarterly dispatch periods or just a singleannual dispatch period. In running PROVIEW, some users may be inclined to consolidate their seasonsinto an annual period to speed up the optimization. Unfortunately, this compromises seasonally significantinformation such as the seasonal profiles of demand or of renewable generation, as it would in any model.Whereas conventional generating unit availability may not be substantially affected by seasonal issues(annual maintenance requirements notwithstanding), renewable resources often exhibit seasonal fluctuationsin generation.
A PROSCREEN user can segment a typical week into two or more subperiods. This feature allows a userto model renewables as generating units and control the time of day when the resource's generation mightbe available. Units are defined in at most two blocks. This may reduce the value of modeling renewablesas generating units since one cannot designate different availabilities for more than two different levelsof resource generation.
What PROSCREEN loses in less detailed production simulation, it gains in the fact that it is a full IRPmodel with comprehensive financial and rate analysis modules. The system has a scenario storing andcomparison capability that can be linked to either Supertree or DPL, two decision analysis programs. Thislinkage allows a user to evaluate the impacts of renewable generation uncertainty.
C-12

Location. The model does not explicitly model locational impacts of new resources. There is no multiarea feature in the PROSCREEN system. However, one can represent T&D investments in the capitalexpenditure module. The user can manually delay or delete these investments when selecting specificresources.
Modularity. Because PROVIEW bases its optimization on a single, exogenous load forecast, the modelcannot be easily used to evaluate the benefits of resource modularity. The PROSCREEN financial andrate modules, however, could be run under different load forecasts with different resource additions toassess the potential financial and regulatory consequences of building too much capacity versus meetingerratic and variable load growth with smaller, modular resources. Nonetheless, there is no automaticprocess that performs this analysis. The separate runs would have to be set up and executed by the user.
Also, PROVIEW runs can become unmanageably time-consuming if one models too many small resourceadditions. Such additions can result in a massive proliferation of feasible dynamic programming states.If the user is not careful, PROVIEW will be forced to trim feasible states from the optimization problem(or take an inordinate amount of time) in attempting to evaluate all of these states.
Diversity. As noted earlier, the system has a scenario storage and comparison capability that can be linkedwith Supertree or DPL. This linkage allows a user to automatically assess renewable resource diversitybenefits.
UPLAN III
UPLAN is an integrated utility planning tool that includes production simulation, capacity expansion,financial/rate analysis, and uncertainty analysis capabilities. upLAN was developed by LCG Consulting.Unlike some of the industry's older resource planning models, UPLAN was designed from the start to runon a PC. Its user-friendly interface makes it a popular planning system.
The model uses either ELDC or hourly chronological dispatch simulation, allowing a user to accuratelymodel utility system operating constraints such as resource ramp rates and minimum downtimes. Althoughthere are several hourly chronological dispatch models used throughout the utility industry (e.g.,POWERSYM, ENPRO, POLARIS), UPLAN is one of the most widely used of the chronological models.UPLAN can use either typical weeks for its chronological simulation or the entire year (8,760 hours).Typical weeks can be used to shorten the run time if many years or scenarios are to be analyzed.
Capability/Availability. Chronological models such as UPLAN may have advantages over load durationcurve models in modeling the commitment and dispatch of renewable resources. Chronological modelsmay be able to more accurately model the time-of-day related capacity and energy of renewable resourcessuch as solar and wind. They can also directly model the effect of changes in natural demand as well asrequirements on other resources due to intermittence of renewable resources. These effects may bemasked somewhat in load duration curve models.
Renewable resources could be modeled as either load modifiers or as generating units. Modeling themas generating units in UPLAN is appropriate if the resource has some capability to be dispatched. Theload modifier approach requires detailed data on the load shape of the renewable resource. If the loadmodifier alternative is selected, it is possible in UPLAN to directly include uncertainty levels on the loadmodifier. UPLAN allows the capacity to vary monthly and by time of day, which is a potentially usefulfeature for modeling renewables as either generating units or load modifiers.
As a PC-based system, UPLAN has convenient graphics capabilities to examine and modify loads.
C-13

Location. The model does not explicitly model locational impacts of new resources.
Modularity. UPLAN includes a dynamic system optimization module to determine the selection of plantadditions that result in the minimum cost system. Alternative expansion scenarios can be interactivelyevaluated. The UPLAN approach can examine alternatives with fixed capacity sizes, variable capacity,or a mix of fixed and variable alternatives. The variable size approach used in UPLAN could be used,for example, to determine the number of modular units required to match the planning criteria of the utilityfor each year in the future. This feature is an advantage for considering renewable resources, comparedto many planning models.
UPLAN also considers lead time in its planning analysis. Because its uncertainty analysis operates yearby year, UPLAN results can provide an indication of the benefits of short lead time options.
Diversity. UPLAN includes an uncertainty analysis capability of critical variables such as system demand,impact of load modifier alternatives, unit in-service dates, and fuel costs. It is designed to perform MonteCarlo simulations based on input high, medium, and low values of selected input variables such as demandgrowth rates. It reports the expected results as well as the range of results. These results can be analyzedto determine the variance of the results and the change in the variance due to changing certainassumptions.
In UPLAN, the Monte Carlo simulations for factors like system demand operate annually, so that changesin load growth over the forecast horizon are possible. The use of annual growth rates allows the benefitsof short lead time options to be examined. Rather than only following a high, medium, or low path forthe entire forecast horizon, the growth rates can vary from high to low each year. Generation expansionplans that appear good under a high growth case, for example, may not be as good under conditions ofvarying growth. This type of uncertainty analysis allows UPLAN users to examine the benefit of shortlead-time options like renewables.
C-14

Appendix D. Models Considered for Review
Table D-l presents a comprehensive list of the models that were considered for evaluation in thisproject. Each model's vendor and its primary capabilities are displayed.
Table 0-1. Models Considered for Review
Model Name Vendor Primary Capabilities
ADM-2 Version 4.1 ADM Associates, Inc. End-Use Demand ForecastingDSM Potential Assessment
ADMDOE ADM Associates, Inc. End-Use Demand ForecastingDSM Potential Assessment
AGEND Quantum Consulting End-Use Demand ForecastingDSM Potential Assessment(Agriculture)
A-LESP U.S. Naval Civil Engin. Lab DSM Potential Assessment
ARCH Lawrence Berkeley Lab DSM Potential Assessment
ARGUS Argonne National Lab Energy Sector Model
ASSESS2 TechPlan Associates DSM Potential Assessment
BENCHMARK EPRI Production Simulation
BEST Profiler Quantum Consulting DSM Potential Assessment
CEDMS Jerry Jackson & Associates End-Use Demand Forecasting
CIRTOU Christensen Associates DSM Potential AssessmentFinanciaVRates
CMAFS Synergic Resource Corp. End-Use Demand ForecastingDSM Potential Assessment
COMET Quantum Consulting End-Use Demand ForecastingDSM Potential Assessment
COMMEND 3.2 Regional Economic Research End-Use Demand ForecastingDSM Potential Assessment
COMPASS Synergic Resource Corp DSM Cost-EffectivenessAnalysis
COMPLEAT American Public Power DSM Cost-EffectivenessAssociation Analysis
Resource PlanningProduction SimulationFinanciaVRatesUncertainty Analysis
COMTECH Regional Economic Research DSM Potential AssessmentDSM Cost-EffectivenessAnalysis
COOLAID Regional Economic Research DSM Potential AssessmentDSM Cost-EffectivenessAnalysis
D-l

Table 0-1. Models Considered for Review (Cont'd)
Model Name Vendor Primary Capabilities
CoPlan Burns & McDonnell Production SimulationFinanciaVRates
CPAM University of Southern California DSM Cost-EffectivenessAnalysis
CRFM TechPlan Associates NUG Forecasting
DARS ADM Associates DSM Potential Assessment
Design ASSYST Xenergy, Inc. DSM Cost-EffectivenessAnalysis
Distributed Utility Valuation Pacific Gas & Electric Location BenefitsModel DSM Potential Assessment
Capital ExpendituresDistribution Planning
DOE-2 Lawrence Berkeley Lab DSM Potential AssessmentDSM Cost-EffectivenessAnalysis
DSM ASSYST Xenergy, Inc. DSM Potential Assessment
DSManager Electric Power Software DSM Cost-EffectivenessAnalysis
DSMPRO Battelle-Columbus Division DSM Cost-EffectivenessAnalysis
DSMRANK Battelle-Columbus Division DSM Cost-EffectivenessAnalysis
DSStrategist Barakat & Chamberlain DSM Cost-EffectivenessAnalysis
DSVIEW Energy Management Associates DSM Cost-EffectivenessAnalysis
DVDCAL Southern Engineering Distribution Planning
DYNAMICS EPRI Production Simulation
DYNASTOR EPRI Production Simulation
EGEAS Stone & Webster Resource PlanningProduction SimulationGeneration Reliability
Electric Cost-of-Service Barakat & Chamberlain FinanciaVRates
Elfin Environmental Defense Fund Production SimulationFinanciaVRates
Energy 2020 Systematic Solutions, Inc. Energy Sector Model
ENPRO-III Entec Consulting Production Simulation
EPRI Tariff Advisor EPRI FinanciaVRates
ESP QED Production SimulationFinanciaVRates
D-2

Table 0-1. Models Considered for Review (Cont'd)
Model Name Vendor Primary Capabilities
ETEMPS McDaniels Research Ltd. DSM Potential Assessment
EUTAP TechPlan Associates DSM Cost-EffectivenessAnalysis
FA$T 123 Polydyne, Inc. Project Economic Analysis
FIN M.S. Gerber & Associates FinanciaVRates
FORTEll EPRI Econometric DemandForecasting
FUELMIX / CONTRACTMIX EPRI Project Economic AnalysisUncertainty Analysis
FUTURE Pacific Gas & Electric Project Economic AnalysisUncertainty Analysis
GEMS Decision Focus, Inc. Production SimulationFinanciaVRates
HELM ICF, Inc. End-Use Demand Forecasting
HELP Quantum Consulting End-Use Demand Forecasting
INDEPTH EPRI Econometric DemandForecasting
INFORM 1.0 EPRI End-Use Demand Forecasting
IPEP Wisconsin Power & Light DSM Cost-EffectivenessAnalysisProject Economic Analysis
IPM (ICF) ICF, Inc. Production SimulationResource Planning
IPM (Quantum Consultinq) Quantum Consulting DSM Potential Assessment
IRP-Manager/LMSTM Electric Power Software Production SimulationDSM Cost-EffectivenessAnalysis
ISAAC Bonneville Power Administration Production Simulation
ISTUM Simon Fraser University End-Use Demand ForecastingDSM Potential Assessment
LCPM Applied Energy Services End-Use Demand ForecastingNUG ForecastingProduction SimulationFinanciaVRates
Load Planner Xenergy, Inc. End-Use Demand Forecasting
LoadShaper Morgan Systems Corporation DSM Potential Assessment
loadView Quantum Consulting End-Use Demand Forecasting
LPV ADM Associates End-Use Demand Forecasting
D-3

Table 0-1. Models Considered for Review (Cont'd)
Model Name Vendor Primary Capabilities
MASS (Multi-Attribute Pacific Gas & Electric Project Economic AnalysisBidding System) Uncertainty Analysis
MAPS (Multi-Area General Electric Production SimulationProduction Simulation) Bulk Power Market
MAPS (Marketing Activity National Rural Electric DSM Potential AssessmentPlanners) Cooperative Association
Market Manager SRC Systems DSM Cost-EttectivenessAnalysis
MIDAS EPRI Uncertainty Analysis(M.S. Gerber & Associates) Production Simulation
Financial/Rates
MostValue Case Western Reserve University DSM Cost-EffectivenessAnalysis
OPTIONS Iowa Association of Municipal DSM Cost-EffectivenessUtilities Analysis
Over/Under EPRI Generation ReliabilityUncertainty Analysis
P+ P Plus Corporation DSM Cost-EffectivenessAnalysisProduction Simulation
PM-DAM Bonneville Power Administration Bulk Power MarketResource PlanningUncertainty Analysis
POLARIS Decision Focus, Inc. Production Simulation
PowerCoach Strategic Decisions Group Project Economic AnalysisUncertainty Analysis
PowerPlan/ Burns & McDonnell Production SimulationPOWRPLAN
POWERSYM-Plus Energy and Control Consultants Production SimulationGeneration Reliability
PowerWatch 1.0 Demand Side Software, Inc. Energy Use Monitoring
POWRPRO Black & Veatch Production Simulation
PROMOD III Energy Management Associates Production SimulationGeneration Reliability
PROSCREEN III Energy Management Associates Resource PlanningPROVIEW Production Simulation
Capital ExpendituresFinancial/Rates
PROSIM Henwood Energy Services, Inc. Production SimulationGeneration Reliability
PSS/E Power Technologies, Inc. Load Flow Analysis
D-4

Table 0-1. Models Considered for Review (Cont'd)
Model Name Vendor Primary Capabilities
RE-SHAPE Battelle-Columbus Division DSM Potential Assessment
RECAP Xenergy, Inc. End-Use Demand Forecasting
RECONDA V2.0 Christensen Associates End-Use Demand Forecasting
REDMS Jerry Jackson & Associates End-Use Demand ForecastingDSM Cost-EffectivenessAnalysis
REEPS 2.1 EPRI End-Use Demand ForecastingEconometric DemandForecasting
RELIEF Christensen Associates DSM Potential Assessment
RELOAD 2.1 Synergic Resource Corp. End-Use Demand Forecasting
RETOU-PC Christensen Associates DSM Potential Assessment
RISKMIN EPRI Uncertainty Analysis
RPSM Washington State University DSM Cost-EffectivenessAnalysis
SAGE Decision Focus, Inc. Production Simulation
SAM Decision Focus, Inc. Production Simulation
SHAPES-PC Battelle-Columbus Division End-Use Demand Forecasting
STARRSS RCG/Hagler Bailly Uncertainty Analysis
Stone & Webster Screening Stone & Webster DSM Cost-EffectivenessModel Analysis
SYSREL Argonne National Lab Production SimulationFinanciaVRates
TELPLAN EPRI Production SimulationFinanciaVRates
Thermo-Stor 100 Demand Side Software. Inc. DSM Potential Assessment
TIGER Florida Power Corporation Generation ReliabilityProduction SimulationFinanciaVRates
TrakLoad SRC Systems DSM Potential Assessment
TRNSYS 12.2 Solar Energy Lab DSM Potential AssessmentUniversity of Wisconsin
TRELSS EPRI Composite Reliability
UPLAN III LCG Consulting (Lotus) Resource PlanningProduction SimulationFinanciaVRates
UPM EPRI Production SimulationProject Economic AnalysisFinanciaVRates
D-5

Table 0-1. Models Considered for Review (Cont'd)
Model Name Vendor Primary Capabilities
WASP Tennessee Valley Authority Production SimulationResource Planning
WESCOUGER / ABS/Advance Systems Production SimulationWESPRIDE / Automatic Technology Resource PlanningGeneration Planning (AGP)
XenCAP Xenergy, Inc. DSM Potential Assessment
D-6

REPORT DOCUMENTATION PAGEForm Approved
OMS NO. 0704-0188
Public reporting burden for this collection of infonnation is estimated to average 1 hour per response, including the time for reviewing instructicns. searching existingdata sources, gathering and maintaining the data needed, and completing and reviewing the collection of infonnation. Send comments regarding this burden estimate orany other aspect of this collection of infonnation, including suggestions for reducing this burden, to Washington Headquarters Services, Directorate for InfonnationOperations and Reports, 1215 Jefferson Davis Highway, Suite 1204, Arlington, VA 22202-4302, and to the Office of Management and Budget. Paperwork ReductionProject 10704-01881. Washington, DC 20503.
1. AGENCY USE ONLY (Leave blank) 2. REPORT DATE.
June 19943. REPORT TYPE AND DATES COVERED
Subcontractor report
4. TITLE AND SUBTITLE
Modeling Renewable Energy Resources in Integrated Resource Planning
6. AUTHOR(S)
D. Logan, C. Neil, and A. Taylor
7. PERFORMING ORGANIZATION NAME(S) AND ADDRESS(ES)
RCG/Hagler, Bailly, Inc.P.O. Drawer 0Boulder, CO 80306-1906
9. SPONSORING/MONITORING AGENCY NAME(S) AND ADDRESS(ES)
National Renewable Energy Laboratory161 7 Cole BoulevardGolden, CO 80401-3393
, , . SUPPLEMENTARY NOTES
, 2a. DISTRIBUTION/AVAILABILITY STATEMENT
National Technical Information ServiceU.S. Department of Commerce5285 Port Royal RoadSpringfield, VA 22161
5. FUNDING NUMBERS
AS115440
8. PERFORMING ORGANIZATIONREPORT NUMBER
10. SPONSORING/MONITORINGAGENCY REPORT NUMBER
TP-462-6436
Subcontract No.AAE-3-13371-o1
, 2b. DISTRIBUTION CODE
UC 233
, 3. ABSTRACT {Maximum 200 words}
This subcontract report examines the capabilities of utility planning models to address key issues in choosing betweenrenewable resources and other options. Including renewable energy resources in integrated resource planning requires thatutility planning models properly consider the relevant attributes of various renewable resources in addition to the conventionalsupply-side and demand-side options. The current trend toward regulatory set-asides is motivated in part by the perceptionthat the capabilities of current utility planning models do not address renewable resources adequately. Finding the proper levelof renewable resources in a utility's resource mix will depend on developing planning methods that capture the benefitsrenewables offer. The study recommends how utilities should use the current capabilities of some models and suggests thedirection of future work.
SUBJECT TERMSutility planning models; integrated resource planning; renewable energy resources
15. NUMBER OF PAGES
114
16. PRICE CODE
A06
17. SECURITY CLASSIFICATIONOF REPORT
unclassified
NSN 7540-01-280-5500
, 8. SECURITY CLASSIFICATIONOF THIS PAGE
unclassified
19, SECURITY CLASSIFICATIONOF ABSTRACT
unclassified
20. LIMITATION OF ABSTRACT
UL
Standard Form 298 (Rev 2-89)Preec:ribed by ANSI Std 239-18
29B- 102